 Raisha Lovindeer
 Lawrence Abbott1
 Katherine R. M. Mackey
- 1Department of Earth System Science, University of California, Irvine, Irvine, CA, United States
- 2Department of Ecology & Evolutionary Biology, University of California, Irvine, Irvine, CA, United States
Benefits and trade-offs of blue/green chromatic acclimation (CA4) have received limited study. We investigated the energetic costs associated with executing chromatic acclimation using a fluorescence-based calculation of light use efficiency. Using laboratory cultures and artificial light environments, we show that the delayed response to acclimation known to occur in marine Synechococcus acclimating strains (generalists) in green light do not reduce light use efficiency in green light, but that only one generalist, RCC307, with a much smaller range of acclimation, had higher light use efficiency than blue and green light specialist strains. Generalists with a wider acclimation range either had the same or >30% lower light use efficiencies in blue and green light environments. From this work, we propose that advantages from CA4 may not be geared at direct competition with other Synechococcus specialists with fixed pigment types, but may serve to expand the ecological range of Synechococcus in spectral competition with other genera. As all eight Synechococcus strains tested had higher light use efficiency in green light, regardless of a fixed or flexible light harvesting strategy, we add evidence to the suitability of the Synechococcus genus to greener ocean niches, whether stable, or variable.
Introduction
Phenotypic plasticity is the ability of an organism to change in response to environmental cues, presumably to better adapt to the environment. A plastic strategy inherently involves benefits as well as trade-offs (DeWitt et al., 1998). In strains of the marine cyanobacterium, Synechococcus, a plethora of light-harvesting strategies have emerged through competition for light (Six et al., 2007b) including a plastic response to blue/green wavelength harvesting called type IV chromatic acclimation or CA4 (Palenik, 2001) abundant in open ocean waters (Grébert et al., 2018). Other types of chromatic acclimation exist in coastal and estuarine waters, and are triggered by combinations of other light colors that include red, and far-red (Montgomery, 2017; Sanfilippo et al., 2019a and references therein). The fitness implication of chromatic acclimation that result from changes in the composition of phycobiliproteins in light-harvesting phycobilisome rods (phycocyanin versus phycoerythrin, for example) have been explored elsewhere (Campbell, 1996; Agostoni et al., 2016; Montgomery, 2016), but the mechanism for CA4 differs from other types of chromatic acclimation in that the overall phycobiliprotein composition does not change. Strains capable of performing CA4 flexibly absorb light maximally at either 495 or 545 nm depending on the dominant chromophores attached to phycoerythrin, without changing the ratio of phycoerythrin to other phycobiliproteins, as explained below. Costs or limitations associated with this type of flexibility in light absorption due to chromophore tuning have not been explored.
Marine Synechococcus strains that perform CA4 all have phycobilisome rods that contain the phycobiliproteins phycocyanin, and two types of phycoerythrin—phycoerythrin I and phycoerythrin II—categorized as pigment type 3 (PT3) strains (Six et al., 2007b). Pigment types 1 and 2 have rods dominated by phycocyanin and phycoerythrin I, respectively, and no strains within these PTs perform CA4. CA4 strains acclimate by changing the ratio of the chromophores phycoerythrobilin (PEB) to phycourobilin (PUB) attached to both types of phycoerythrin in light dominated by blue or green (Palenik, 2001; Everroad et al., 2006). The ratio of PUB:PEB goes up in blue light and down in green light. Only some Synechococcus PT3 strains perform CA4. Others have fixed PUB:PEB ratios that are low (∼0.4, PT3a), medium (∼0.8, PT3b), or high (>1.7, PT3c) (Six et al., 2007b). We herein refer to these fixed PUB:PEB strains as specialists. Strains capable of performing CA4 have either a wide acclimation range (PUB:PEB of ∼0.6 in green light to >1.4 in blue light: PT3d) or a very narrow acclimation range (PUB:PEB of 0.6 in green light to 0.8 in blue light: PT3e, Humily et al., 2013), herein collectively referred to as generalists. Specialists are often found in overlapping niche space with generalists (Humily et al., 2013; Xia et al., 2017, 2018; Grébert et al., 2018), and their coexistence raises the question of whether the cost of CA4 acclimation may outweigh the benefit, or vice versa.
Two genetic variations of CA4 exist (CA4-A and CA4-B) and some of the associated genes responsible for CA4 regulation have been discovered (Shukla et al., 2012; Humily et al., 2013; Sanfilippo et al., 2016, 2019b; Mahmoud et al., 2017; Grébert et al., 2021). None of the CA4 regulatory genes have thus far been shown to negatively interact with other regulatory genes (for example those responsible for photosynthesis or nutrient acquisition) though such interactions have not been tested explicitly. Sensory mechanisms for detecting light color in marine CA4 Synechococcus strains have not yet been identified, but signal transduction pathways for light sensing in other plastic cyanobacteria strains can be energy intensive and could serve as a cost to CA4 strains (Grossman and Kehoe, 1997; Terauchi et al., 2004; Gutu et al., 2013; Wiltbank and Kehoe, 2016, 2019; Nagae et al., 2021). Limitations associated with matching the external environment to acclimaters’ phenotypes are also possible (Stomp et al., 2008), especially since some CA4 strains undergo lag times before initiation of acclimation to green light (Everroad et al., 2006; Humily et al., 2013).
Here, we explore energetic costs of CA4 by comparing Synechococcus specialists (PT3a and3c) with generalists (PT3d and 3e). Specifically, we compare the light-use efficiency of the two strategies before, during, and after acclimation.
Materials and Methods
Strains and Culture Conditions
Eight Synechococcus strains isolated from the North Atlantic Ocean, Eastern Pacific Ocean, Red Sea, and Mediterranean Sea, were acquired from the Roscoff Culture Collection (Table 1). Strains included a low PUB:PEB PT3a strain WH7803 (green-specialist); a high PUB:PEB PT3c strain WH8102 (blue-specialist); and six variable PUB:PEB PT3d & 3e strains (generalists):RS9915, RS9916, WH8020, CC9902, RCC307, and WH8109 which changed PUB:PEB in screening experiments despite fixed PUB:PEB reported in other studies (Six et al., 2007b; Humily et al., 2014).
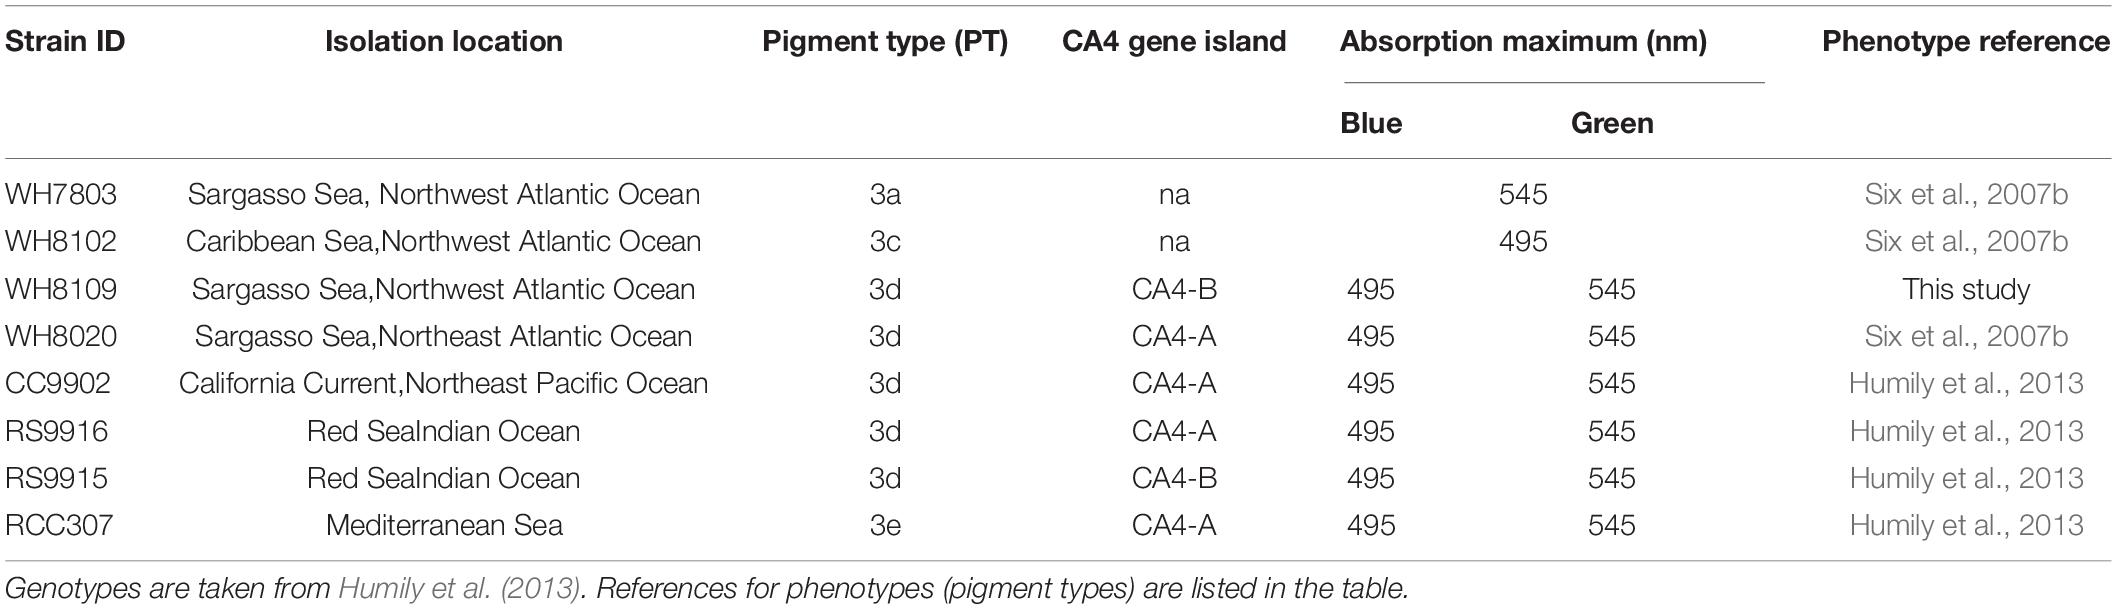
Table 1. Isolation location, and light-harvesting characteristics of Synechococcus strains used in this study.
Strains were maintained in semi-continuous batch culture in 250 mL acid-cleaned polycarbonate bottles in nutrient replete modified SN media made from 0.2 μM filtered seawater diluted (25%) with MilliQ and the following nutrients added: 2 mM NaNO3, 0.15 μM ZnSO4, 0.2 mM NH4Cl, 0.17 μM CoCl2∗6H2O, 140 μM K2HPO4, 6.5 μM Citric Acid, 100 μM Na2CO3, 11.7 μM FeCl3, 10 μM Na2(EDTA)∗2H2O, 296 nM Thiamine HCl, 1.42 μM MnCl2, 2.05 nM Biotin, 0.32 μM NaMoO4, 0.369 nM cyanocobalamin. Growth temperature was maintained at 22°C by a controlled-environment incubator (Darwin Chambers Co.). Cultures were diluted with fresh media every 1–2 days.
Light Conditions
All experiments were conducted in continuous light. Green light was provided by two 5W LED bulbs (Illuminati) and blue and white light were provided by 15W LED grow light (PAR source) with neutral density shading to achieve the desired light intensity. PAR-integrated light intensity was measured using an LI-250A light meter (LI-COR) with a PAR quantum sensor attachment. Emission spectra of the LED light sources were acquired from an LI-180 spectrometer (LI-COR) and are displayed in Figure 1.
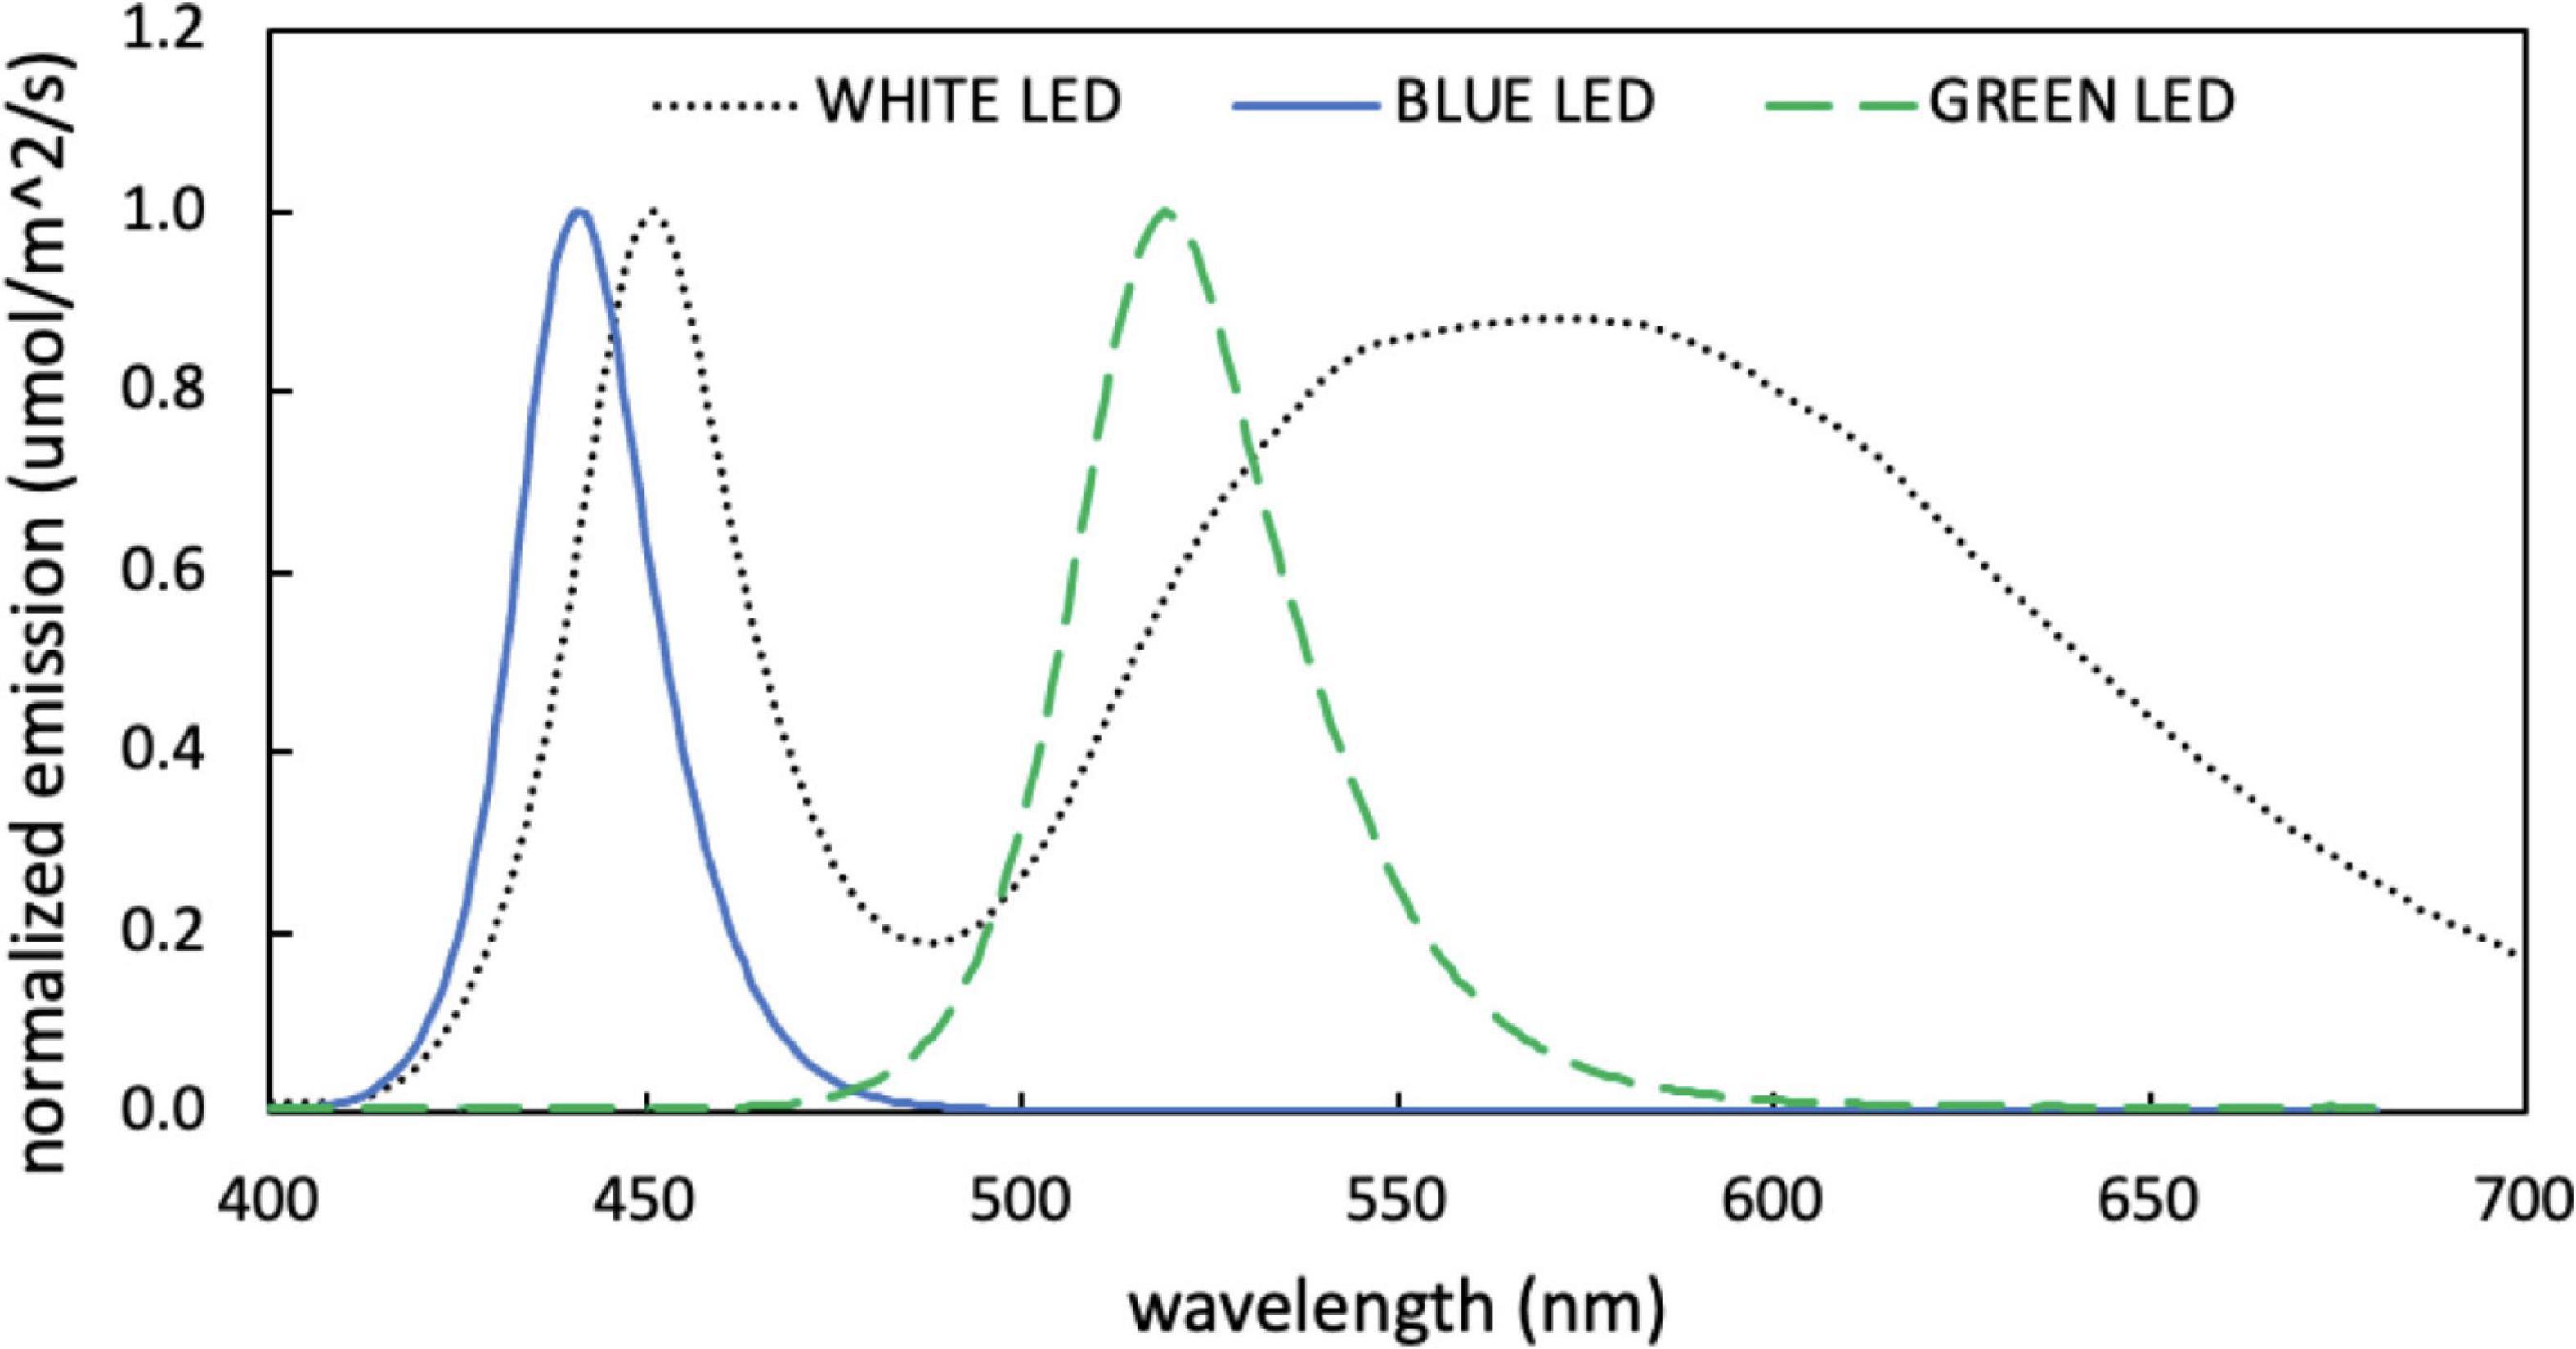
Figure 1. Normalized emission spectra measured for blue, green, and white light-emitting diodes (LEDs) used for growth experiments.
Blue-Green Light Exchange
All eight strains were grown in triplicate in blue light and green light at 20 μmol photons m–2 s–1 and exchanged between light colors after acclimation to the new light was completed (a minimum of 4 generations). Acclimation was determined to be complete when no further change in PUB:PEB per day for CA4 strains was observed (ΔPUB:PEB = 0, see determination of PUB:PEB below). Specialist strains WH7803 and WH8102 remained in each spectral environment for the same duration as CA4 strains to maintain experimental conditions.
Blue-White High Irradiance Gradient and Exchange
Three strains: CA4 strains CC9902 and WH8020, both shown to decrease PUB:PEB in high irradiance blue light in previous studies (Humily et al., 2013); and the high PUB:PEB blue-specialist WH8102, were grown in triplicate in white and blue light at 10 μmol photons m–2 s–1. Strains were incrementally grown at higher intensities in steps of 20 μmol photons m–2 s–1 up to a maximum of 150 μmol photons m–2 s–1 over several months. Strains were acclimated to each new irradiance level for a minimum of 5 generations before measurements at that intensity were acquired. At 150 μmol photons m–2 s–1, cultures in white light were exchanged to blue light, and vice versa, following the procedure in section “Blue-green light exchange.”
Determination of PUB:PEB
Room temperature in vivo fluorescence excitation scans were acquired from 440 to 560 nm with emission set at 570 nm using a spectrofluorometer (Duetta, Thermo Scientific) on aliquots of culture collected daily. PUB:PEB was estimated as the ratio of fluorescence emission maxima in the range of 495 nm and 545 nm excitation. Acclimation time in cell generations (gca) for PT3d (CA4 acclimater) strains was calculated as the number of days during which the change in PUB:PEB was greater than zero (△PUB:PEB/day > 0) divided by the doubling time of the strain.
Growth Rates and Pigment Fluorescence
In vivo chlorophyll-a (Chl-a) and phycoerythrin (PE) fluorescence were measured daily at room temperature on a fluorometer (Trilogy, Turner Designs) with blue (460 nm) and green (530 nm) excitation cartridges, respectively. Growth rate (μ, day–1) for each strain was calculated from the slope of exponential increase in Chl-a fluorescence over time. For light intensity experiments, growth rates were calculated after acclimation to the new intensity to reduce errors due to pigment adjustment within the cells. For exchange experiments, a low-density inoculum was used at the start of the experiment in the initial light color to establish growth rates before a culture was diluted with fresh media (as described above).
Photo-Physiology and Light Use Efficiency
Non-destructive rapid rate fluorescence measurements were taken daily on live cultures in the dark using a custom-build miniature Fluorescence Induction and Relaxation System (mini-FIRe, Maxim Gorbunov) with blue (460 nm) excitation. Apparent quantum yield of photosystem II (Fv/Fm) and functional absorption cross section of photosystem II at 460 nm (σ460) were determined on cells dark-adapted for 3 min and using a saturating blue light pulse of 0.2 ms (Schreiber et al., 1995). Note that Fv/Fm and σ460 are not absolute values, and are lower than absolute values as no 3-(3,4-dichlorophenyl)-1,1-dimethylurea (DCMU) was added to the treatments to decipher minimal fluorescence (Fo). Parameters were monitored for the same sample over time, and used to compute a relative value of light use efficiency as described below.
We calculated light-use efficiency (LUE, φ) using a simplified model of light-dependent growth based on photo-physiological parameters from PSII blue light excitation. We assumed that the rate of exponential growth was proportional to light captured for photosynthesis, where that light capture was a function of 3 parameters: the proportion of open reaction centers available for light capture (Fv/Fm); the PSII cross section over which that light was captured (σ460); and the amount of light available for growth (growth light intensity, Iμ; Eqn 1). Growth rates were converted to cell numbers assuming two cells are produced per cell division. The constant of proportionality, φ in cells (μmol photons)–1, was the measure of light-use efficiency for growth (Eqn 2).
Calculation of φ using the connection of μ to Fv/Fm and σ460 in blue light excitation is highly simplified because it mostly captures Chl-a-excited PSII reaction centers and Chl-a-specific cross sections of PSII which are much smaller in PBS-rich Synechococcus than for other taxa (Suggett et al., 2009). For example, σ460 of WH8020 and CC9902 determined by blue excitation at 460 nm was 2–3 times smaller than that determined by green excitation at 530 nm (σ530), which excited the PBS. However, the relationships between σ460 and σ530 for strains grouped by light-harvesting strategy are mostly linear (Figure 2), especially for cells grown in green light, with higher sensitivity of σ460 to cells grown in blue light than σ530. Preliminary calculations of LUE and relative comparisons of LUE between strains did not reveal major differences between use of the two parameters. Thus, to avoid having different excitation wavelengths during daily measurements, 460 nm excitation was used for all strains, normalizing to Chl-a and focusing on the relative change in LUE among strains. This method allows for comparison among Synechococcus strains across light environments using easily acquired daily fluorescence measurements. Light energy available but not used for growth was not calculated directly, but was accounted for by changes in Fv/Fmwhich is reduced when excitation energy is lost as heat during non-photochemical quenching. Similarly, energy lost by respiration is not used for growth and does not contribute to the growth rate.
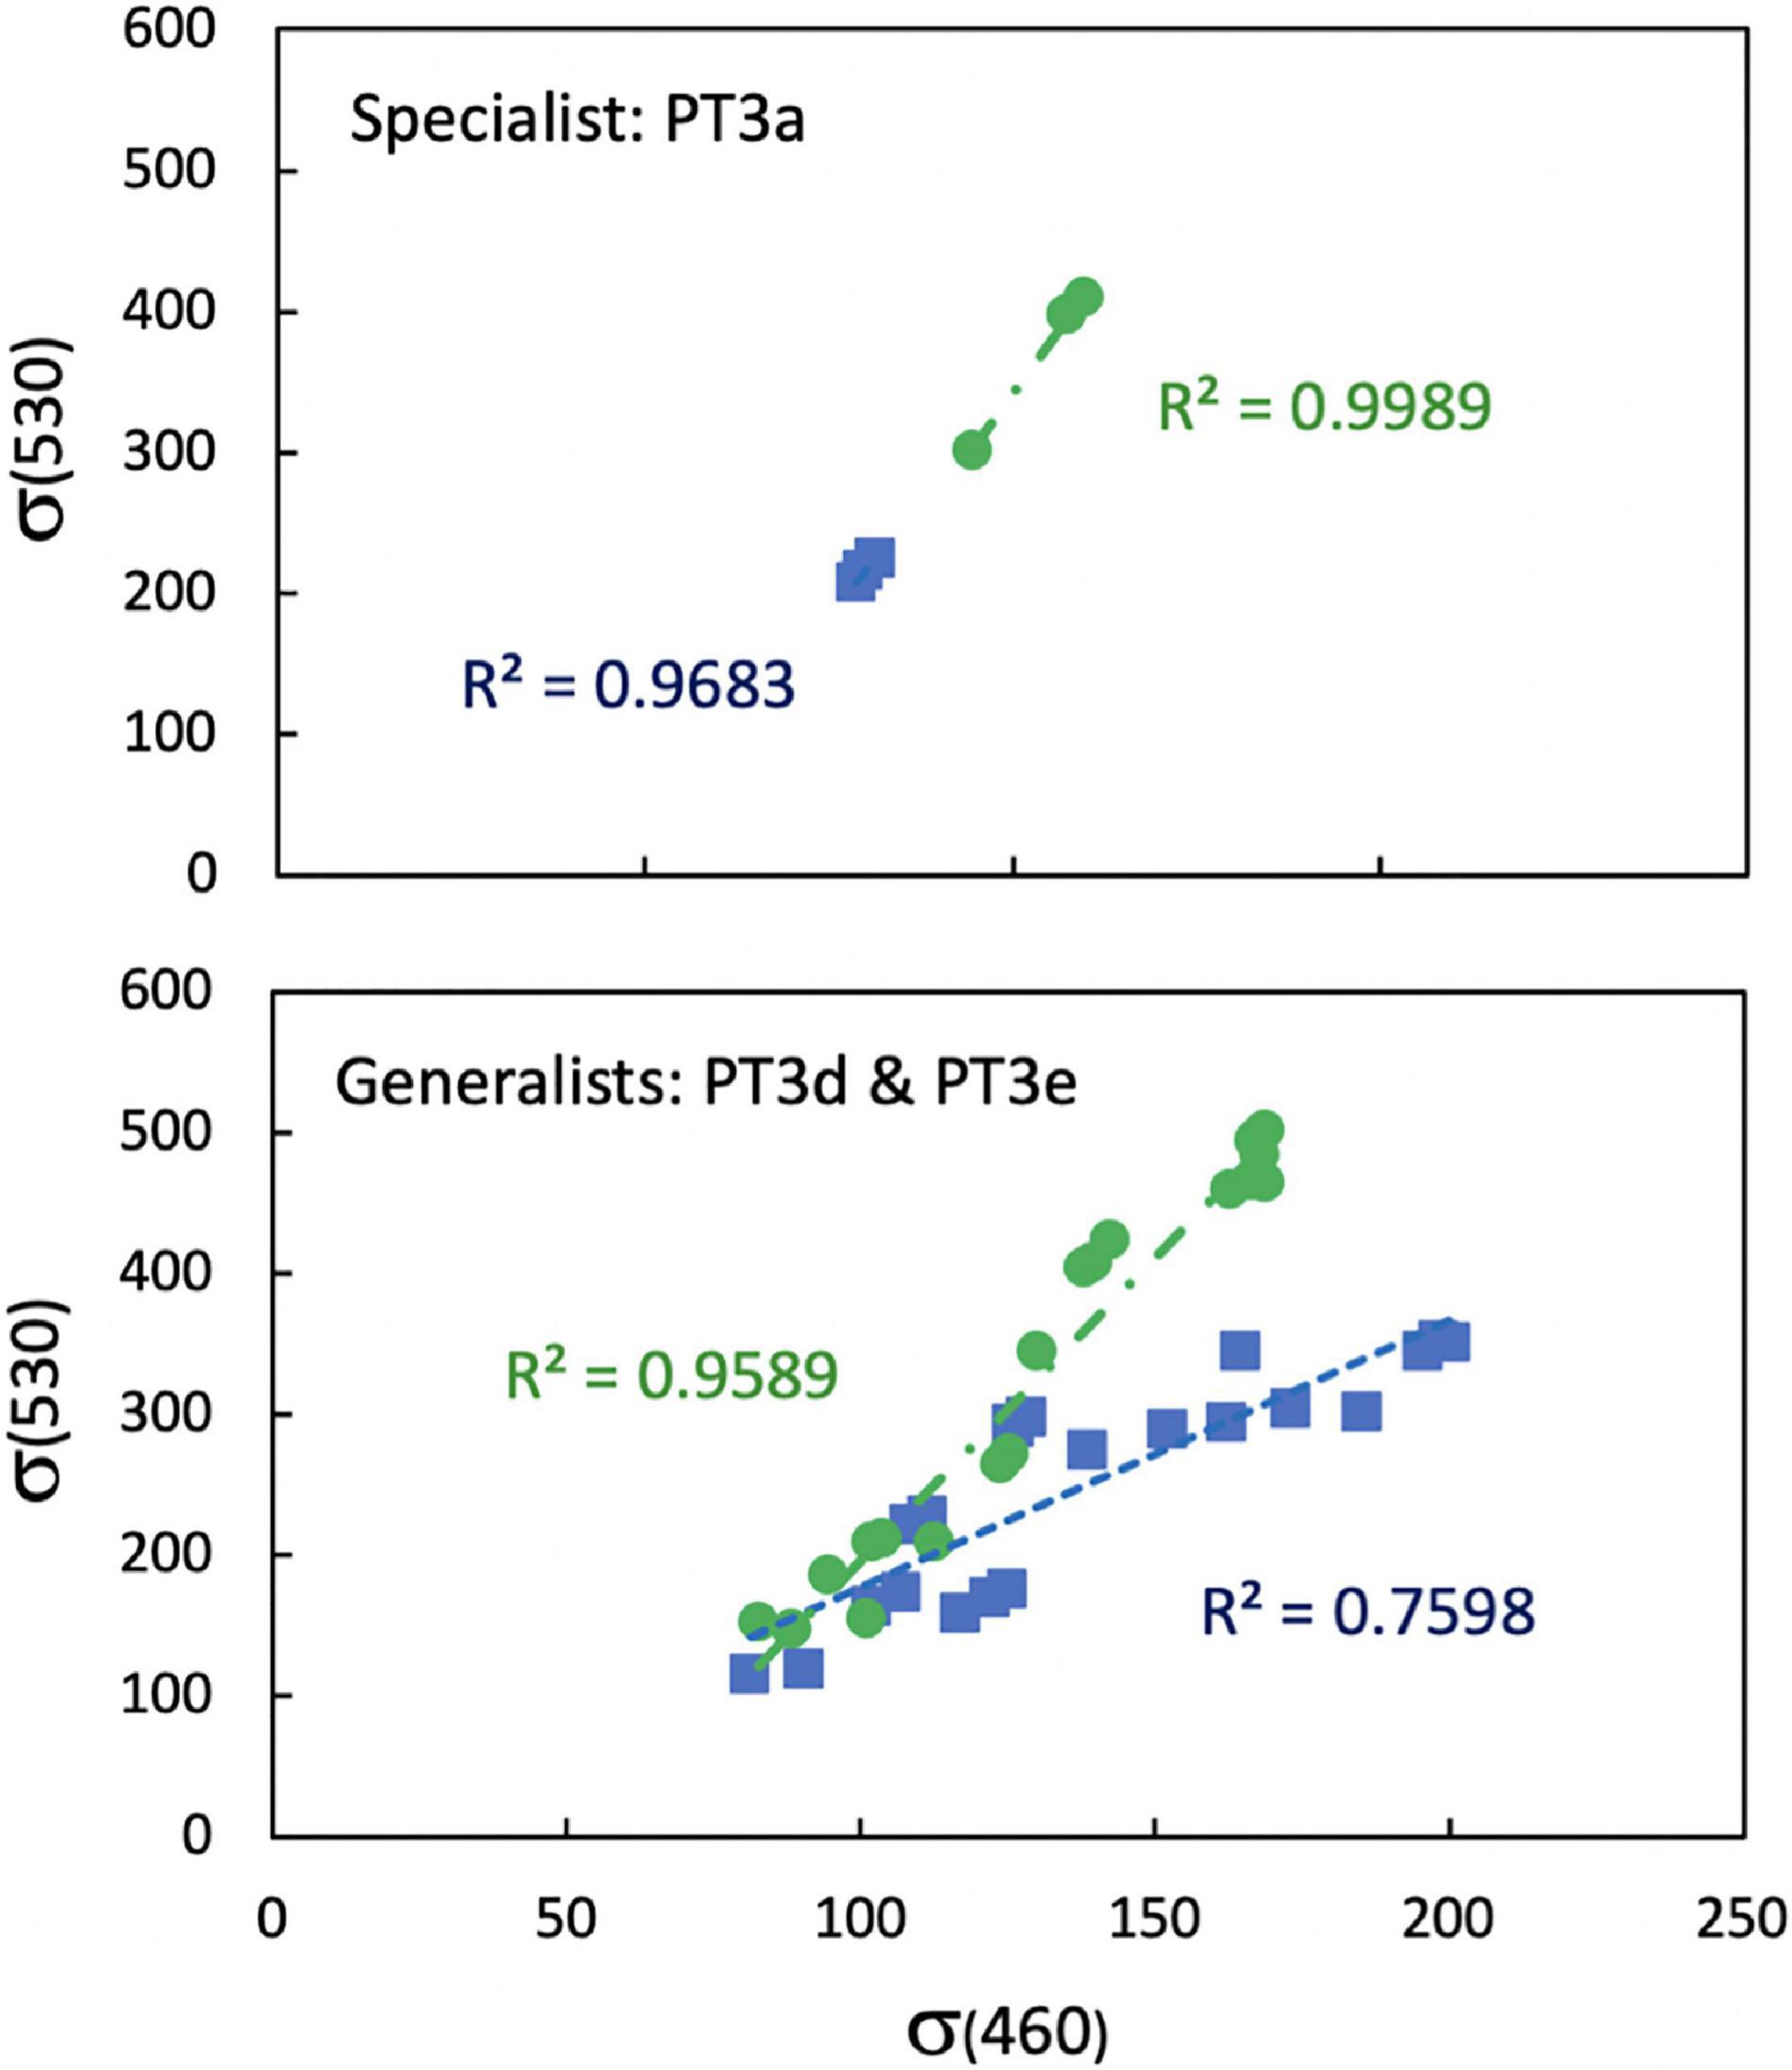
Figure 2. Linear relationships between functional absorption cross section of photosystem II measured with blue excitation at 460 nm (σ460) and green excitation at 530 nm (σ530) on the same sample for Synechococcus strains WH7803 (PT3a) and WH8020, CC9902, RS9915, RS9916, and RCC307 (PT3d and 3e) grown blue (blue squares) and green (green circles) light at 10 μmol photons m–2 s–1.
Statistical Analyses
One-way analyses of variance (ANOVA) were performed on the results for blue-green exchange experiments, while two-way ANOVAs were performed on blue-white experiments across varying light intensities. Tukey-Kramer post hoc tests were performed on ANOVA results that indicated significant differences between sample means. Results were displayed using letters to indicate means that were not significantly different (same letters) and statistically significantly different (different letters) with a 95% confidence limit. Statistical analyses were performed in MATLAB (Version R2019b, Mathworks, United States). Error bars on graphs represent one standard deviation. Error bars for calculated LUE values are compounded standard deviations from Fv/Fm,460, and μ.
Results
Blue-Green Simulations
Figure 3 shows the results of exchanges between blue and green light and corresponding changes in PUB:PEB for all generalists (PT3d strains RS9915, RS9916, CC9902, WH8020, WH8109, and PT3e strain RCC307), green-specialist (PT3a strain WH7803), and blue-specialist (PT3c strain WH8102). PUB:PEB measured by the ratio of excitation maxima at 495 nm and 545 nm was low in green light (0.7) and high in blue light (1.9) for PT3d strains. The PUB:PEB range for PT3e strain RCC307 was much reduced, and varied from 0.6 ± 0.04 in green light to 0.8 ± 0.04 in blue light, as in other studies (Humily et al., 2013). WH7803 maintained low PUB:PEB at 0.4 ± 0.03 in both light colors, and WH8102 maintained high PUB:PEB that ranged from 1.7–1.9 (Table 2).
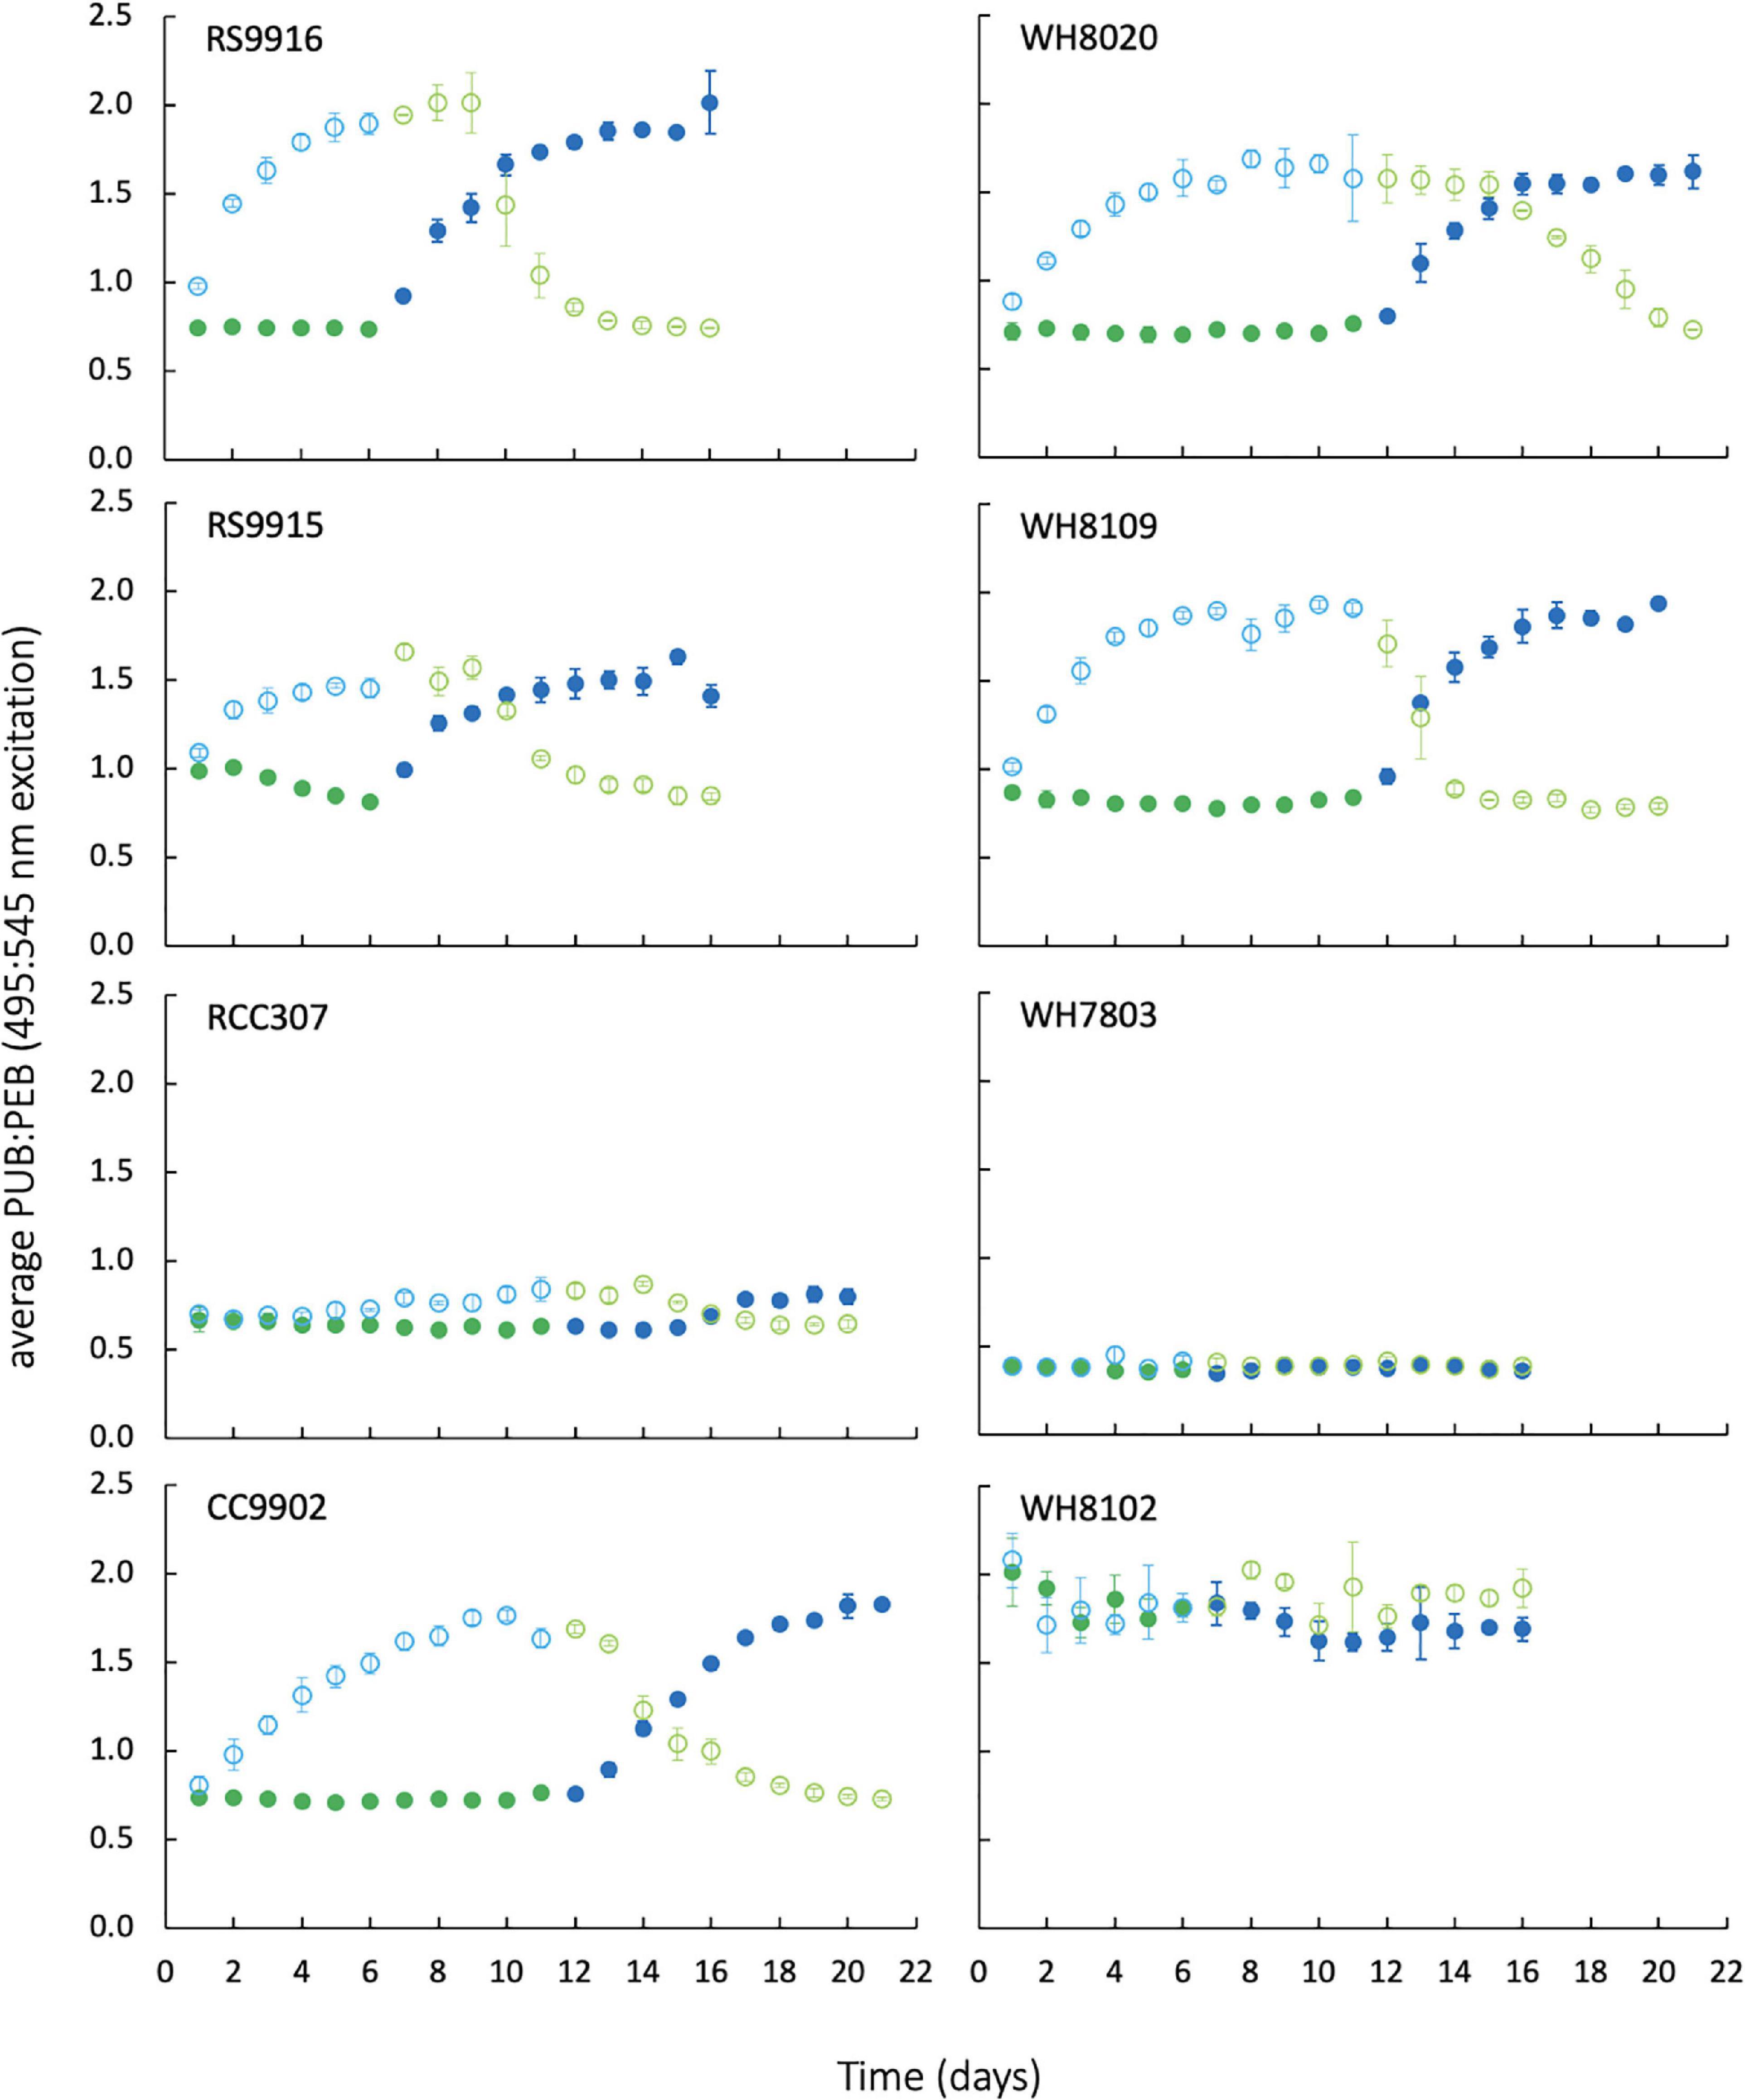
Figure 3. Daily PUB:PEB measured by in vivo fluorescence excitation ratios of Synechococcus strains during growth and exchange from blue light to green light (open circles), and green light to blue light (closed circles). Blue colors indicate blue light, green colors indicate green light. Error bars represent 1 standard deviation (SD) of triplicate cultures, which are smaller than the data marker where bars are not visible.
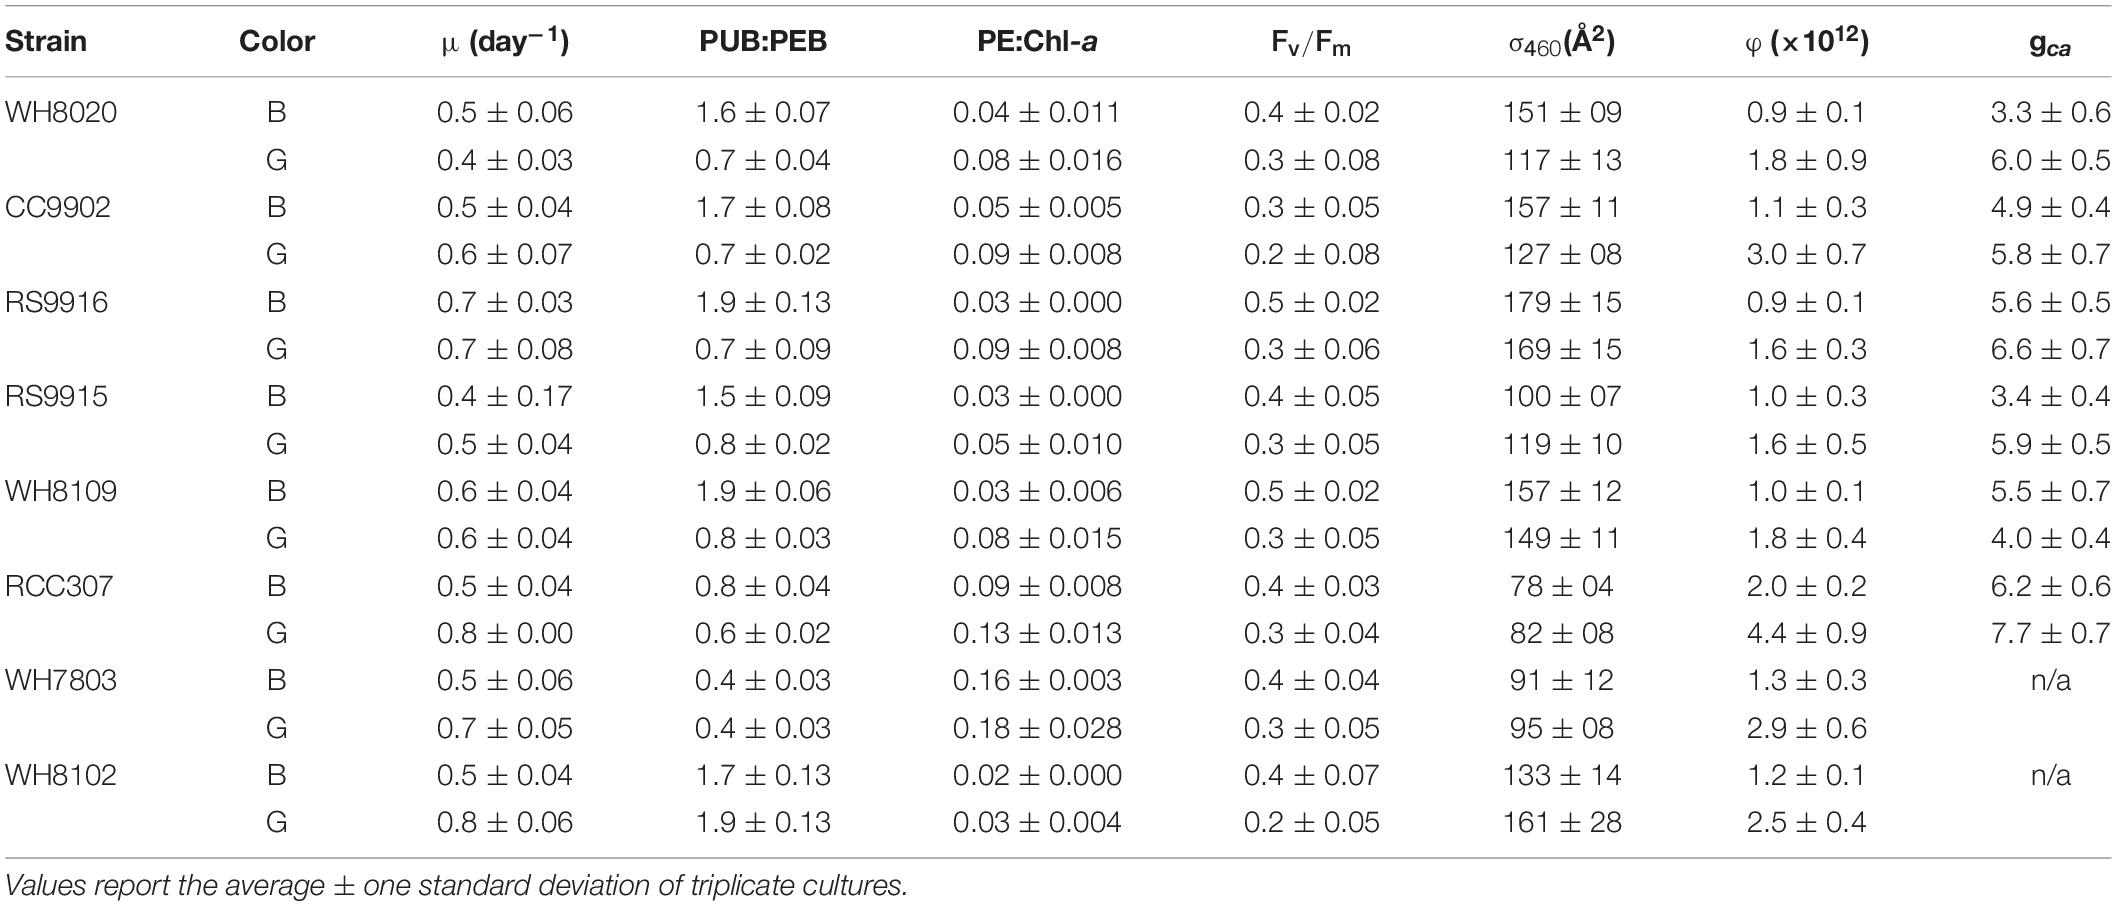
Table 2. Growth rate, fluorescence parameters and acclimation time (gca) from Synechococcus strains exchanged between blue (B) and green (G) light at 20 μmol photons m–2 s–1.
There was no significant difference in light use efficiency (LUE) between specialists and PT3d generalists integrated across exchange between blue and green light [one-way ANOVA F(7,88) = 9.8, p = 6.0E-9; Figure 4A]. These strains had similar LUE across blue light. In contrast, under green light, specialist strains and PT3d strain CC9902 had 1.7 times higher LUE than the other PT3d generalist strains [one-way ANOVA F(15,80) = 86, p = 6.0E-43, Figure 4B].
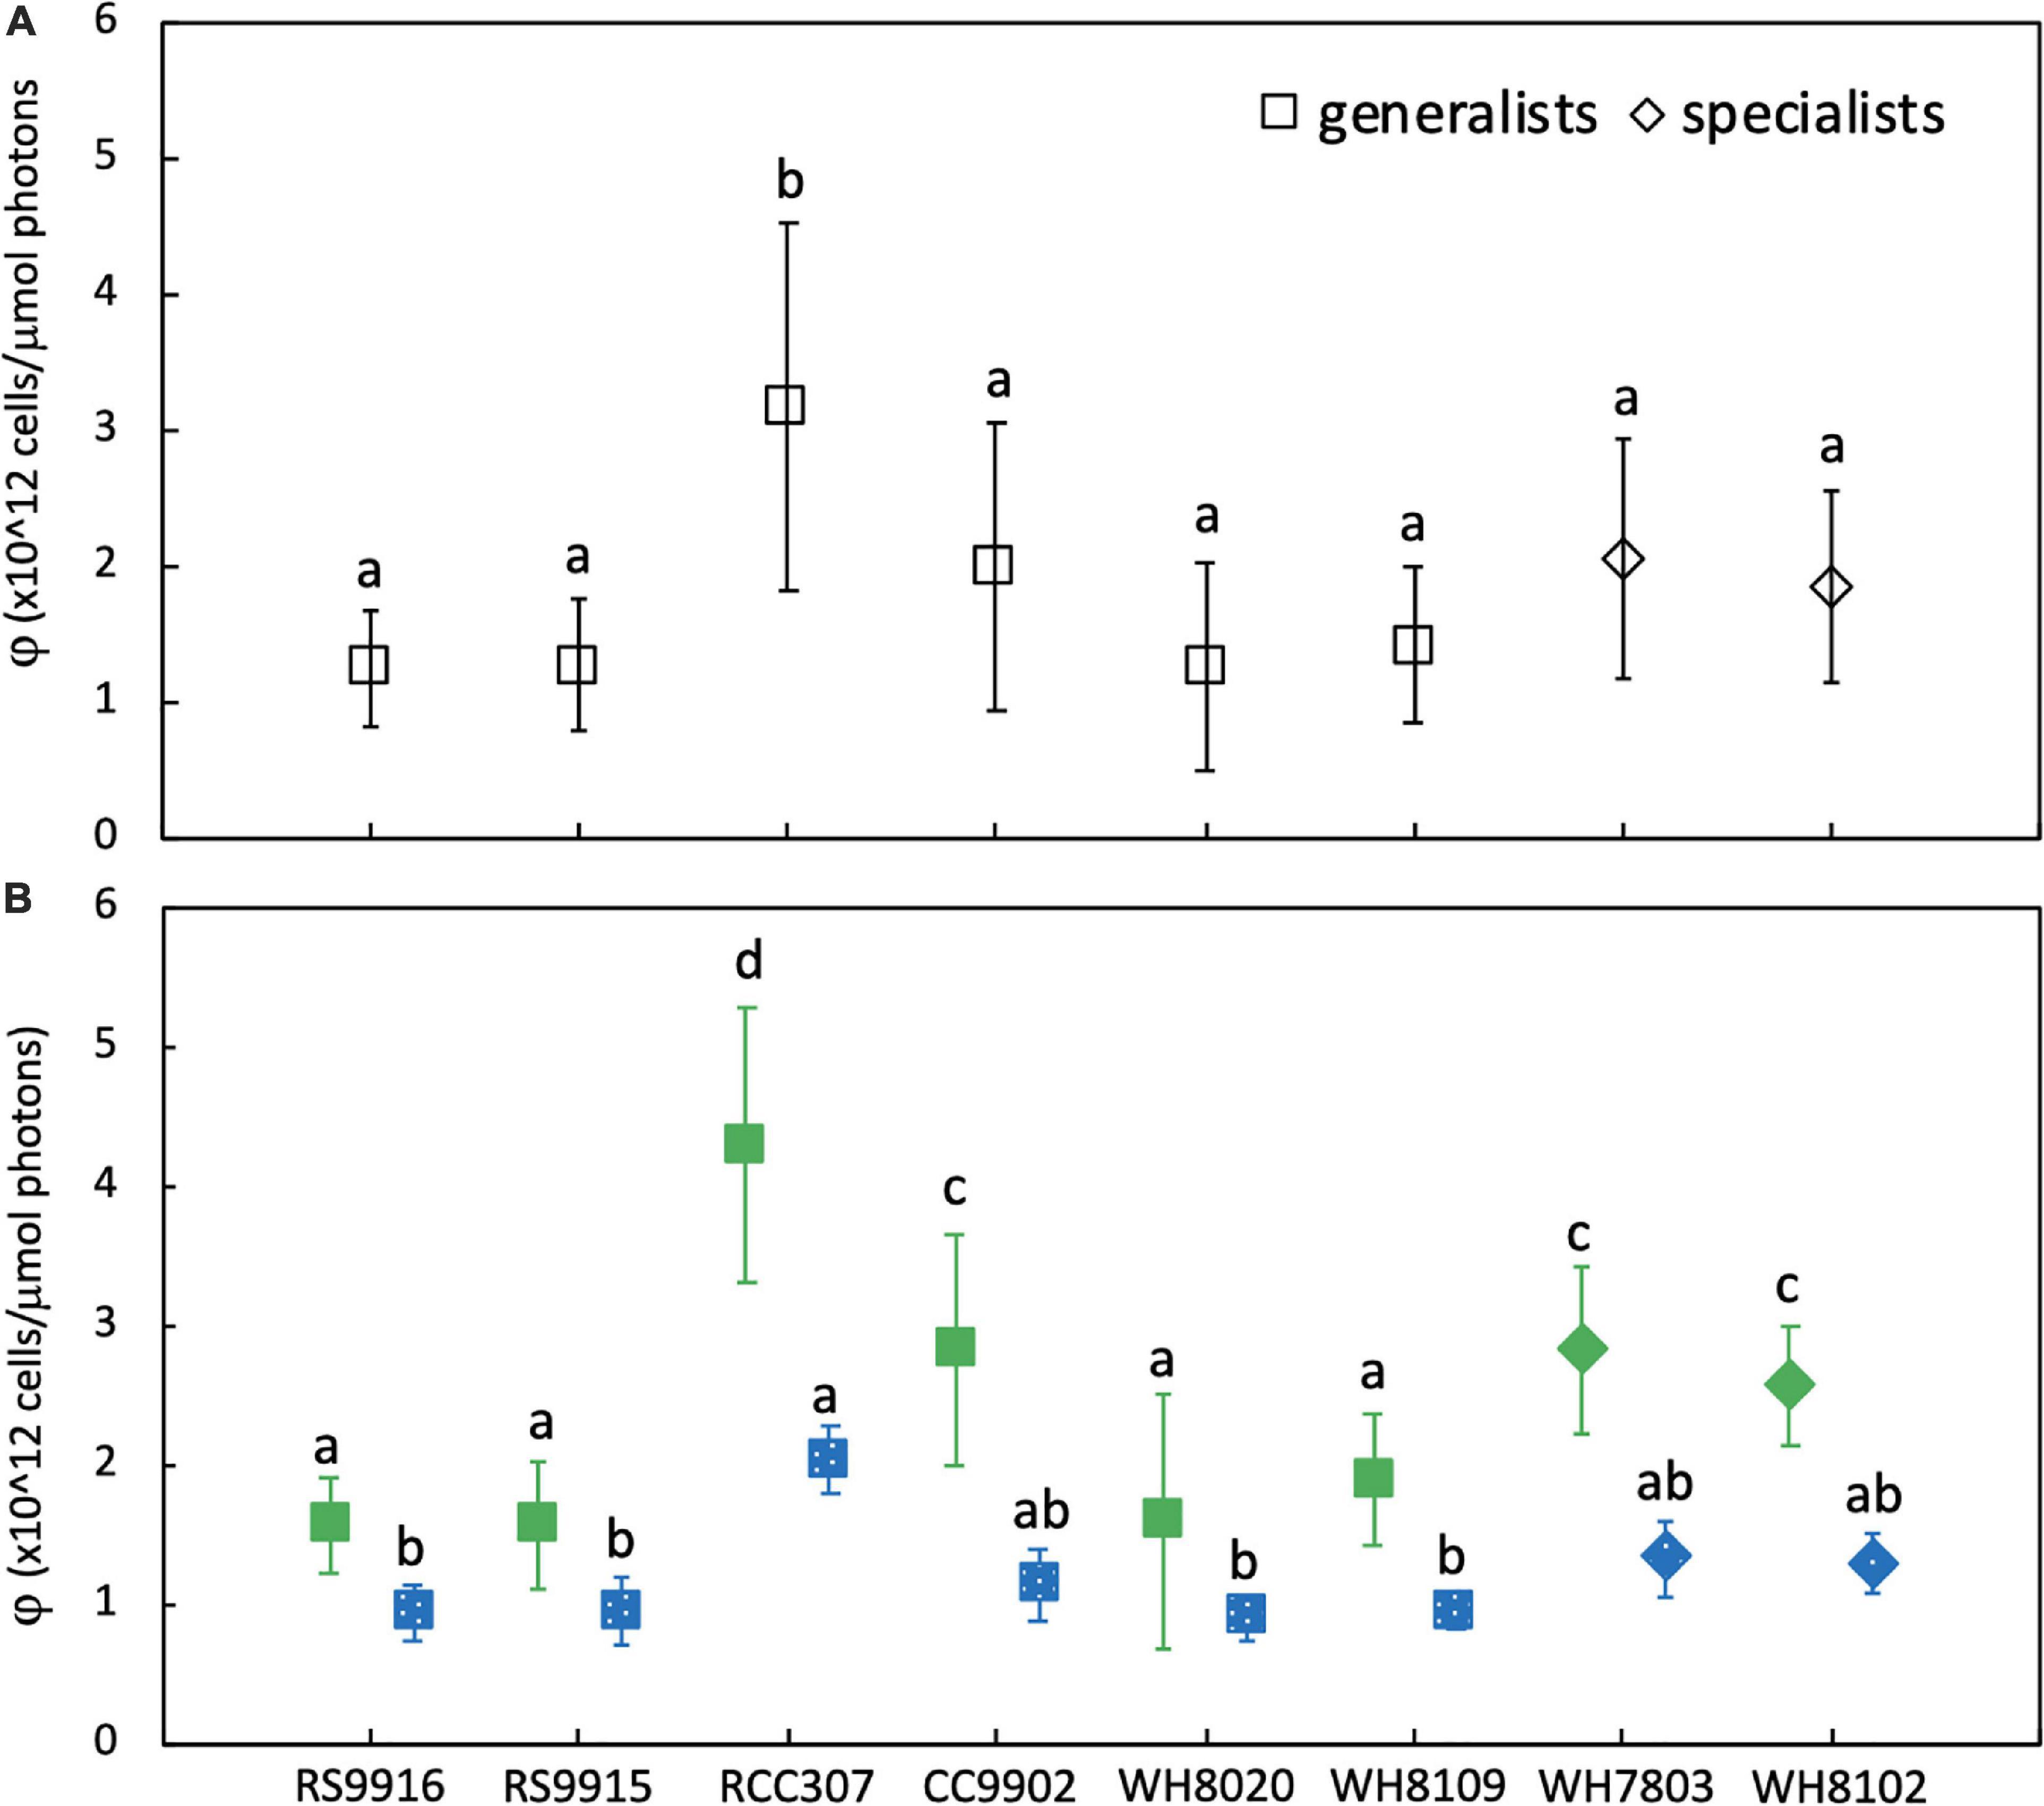
Figure 4. Average daily light-use efficiency (φ) for Synechococcus CA4 acclimating strains (squares) and non-acclimating strains (diamonds) grown at 20 μmol photons m–2 s–1 (A) averaged over the entire experiment, and (B) during growth in green light (green, solid) and blue light (blue, speckled). Letters within each panel indicate means that are not statistically different (same letters) or are statistically significantly different from each other (different letters, p < 0.05) after one-way ANOVA and Tukey-Kramer test. Error bars represent standard deviation (SD) of six cultures in each light color.
The PT3e generalist RCC307 had the highest LUE, which was 1.6 times higher than for specialist strains, and 2.3 – 2.1 times higher than PT3d acclimaters. Significantly higher LUE was observed in both blue and green light, as well as integrated across acclimation time and across exchange between the two light colors (Figure 3).
All strains, regardless of phenotype, had higher LUE in green light than blue light (Figure 4B), and generally higher growth rates in green light (Table 2). We note that the growth rate of WH8020 in green light varied during this experiment and showed different characteristics from screening experiments for which the average growth rate was 0.8 day–1 in green light as opposed to <0.4 day–1 observed in green light during experimentation (Table 2).
Lag times of 2–3 days in PUB:PEB adjustment in green light were observed for nearly all CA4 strains (Figure 3), but when compared to daily calculated values of LUE (Figure 5), no corresponding lags in LUE were observed. In particular, the lag time for RCC307, which was most pronounced with a 3-day lag before acclimation in green light and a unique 4-day lag before acclimation in blue light, also showed no corresponding lags in LUE. The gradual increase in LUE when some acclimater strains were exchanged from blue to green light (as observed for RCC307, CC9902, WH8020) was also observed for the blue-specialist strain WH8102, and did not correspond to PUB:PEB lags in green light in acclimater strains.
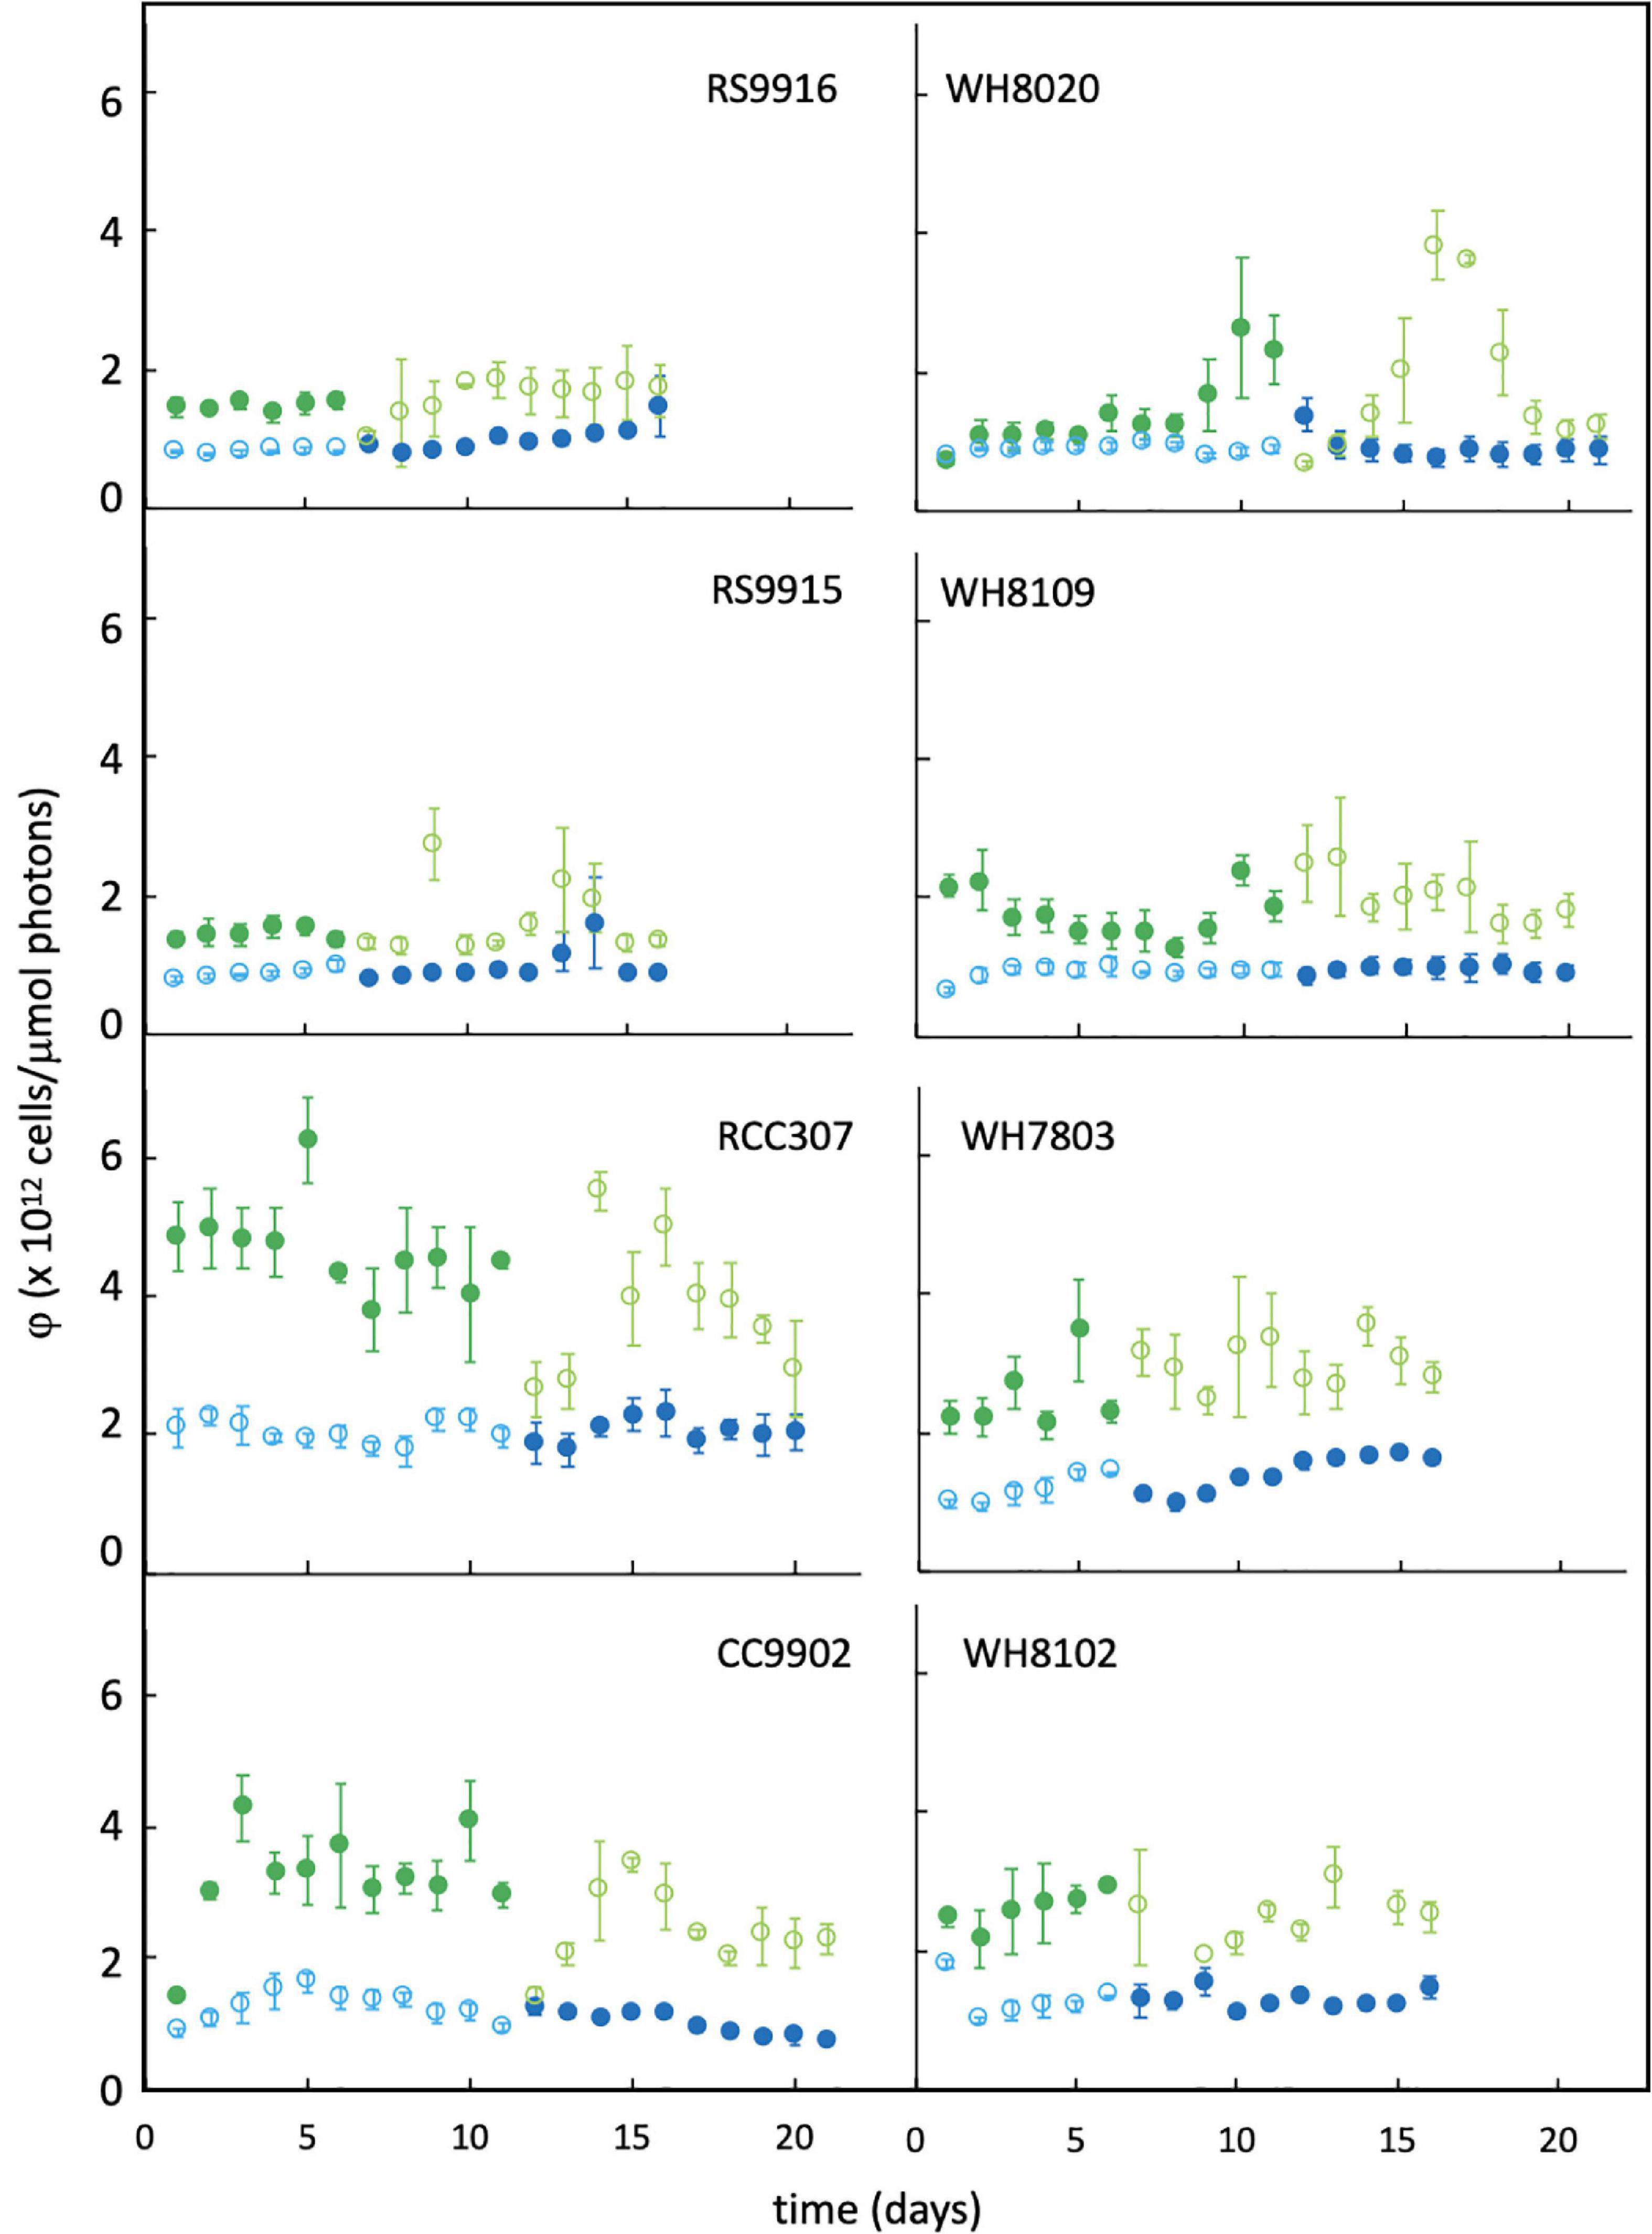
Figure 5. Daily change in light-use efficiency (φ) for Synechococcus strains grown in green light and blue light. Colors are as described in the Figure 3 legend. Error bars represent 1SD of triplicate cultures.
Blue-White Light Intensity Gradient
To test interaction between light intensity and CA4, three strains were used for growth experiments in blue light and white light at different irradiances. PT3d generalist strains CC9902 and WH8020 had previously shown reduced PUB:PEB in blue light (Humily et al., 2013) and these strains were compared to the PT3c strain (high PUB:PEB, blue-specialist) WH8102. Our study did not result in decreased PUB:PEB in blue light for CC9902 or WH8020. Rather, there was a significant increase in PUB:PEB in white light at high irradiance for CC9902 [two-way ANOVA F(7,96) = 3, p = 0.004] from 0.4 ± 0.02 to 0.7 ± 0.00 (Table 3), and the ratio of PE:Chl-a decreased as light intensity increased in white light (Table 3). This indicated that the changes in PUB:PEB may be the result of an interaction between photo-acclimation and chromatic acclimation, as reduction of the PEB-rich rods in high intensity white light might increase the ratio of PUB to PEB. No increase in PUB:PEB at high irradiance was observed for WH8020.
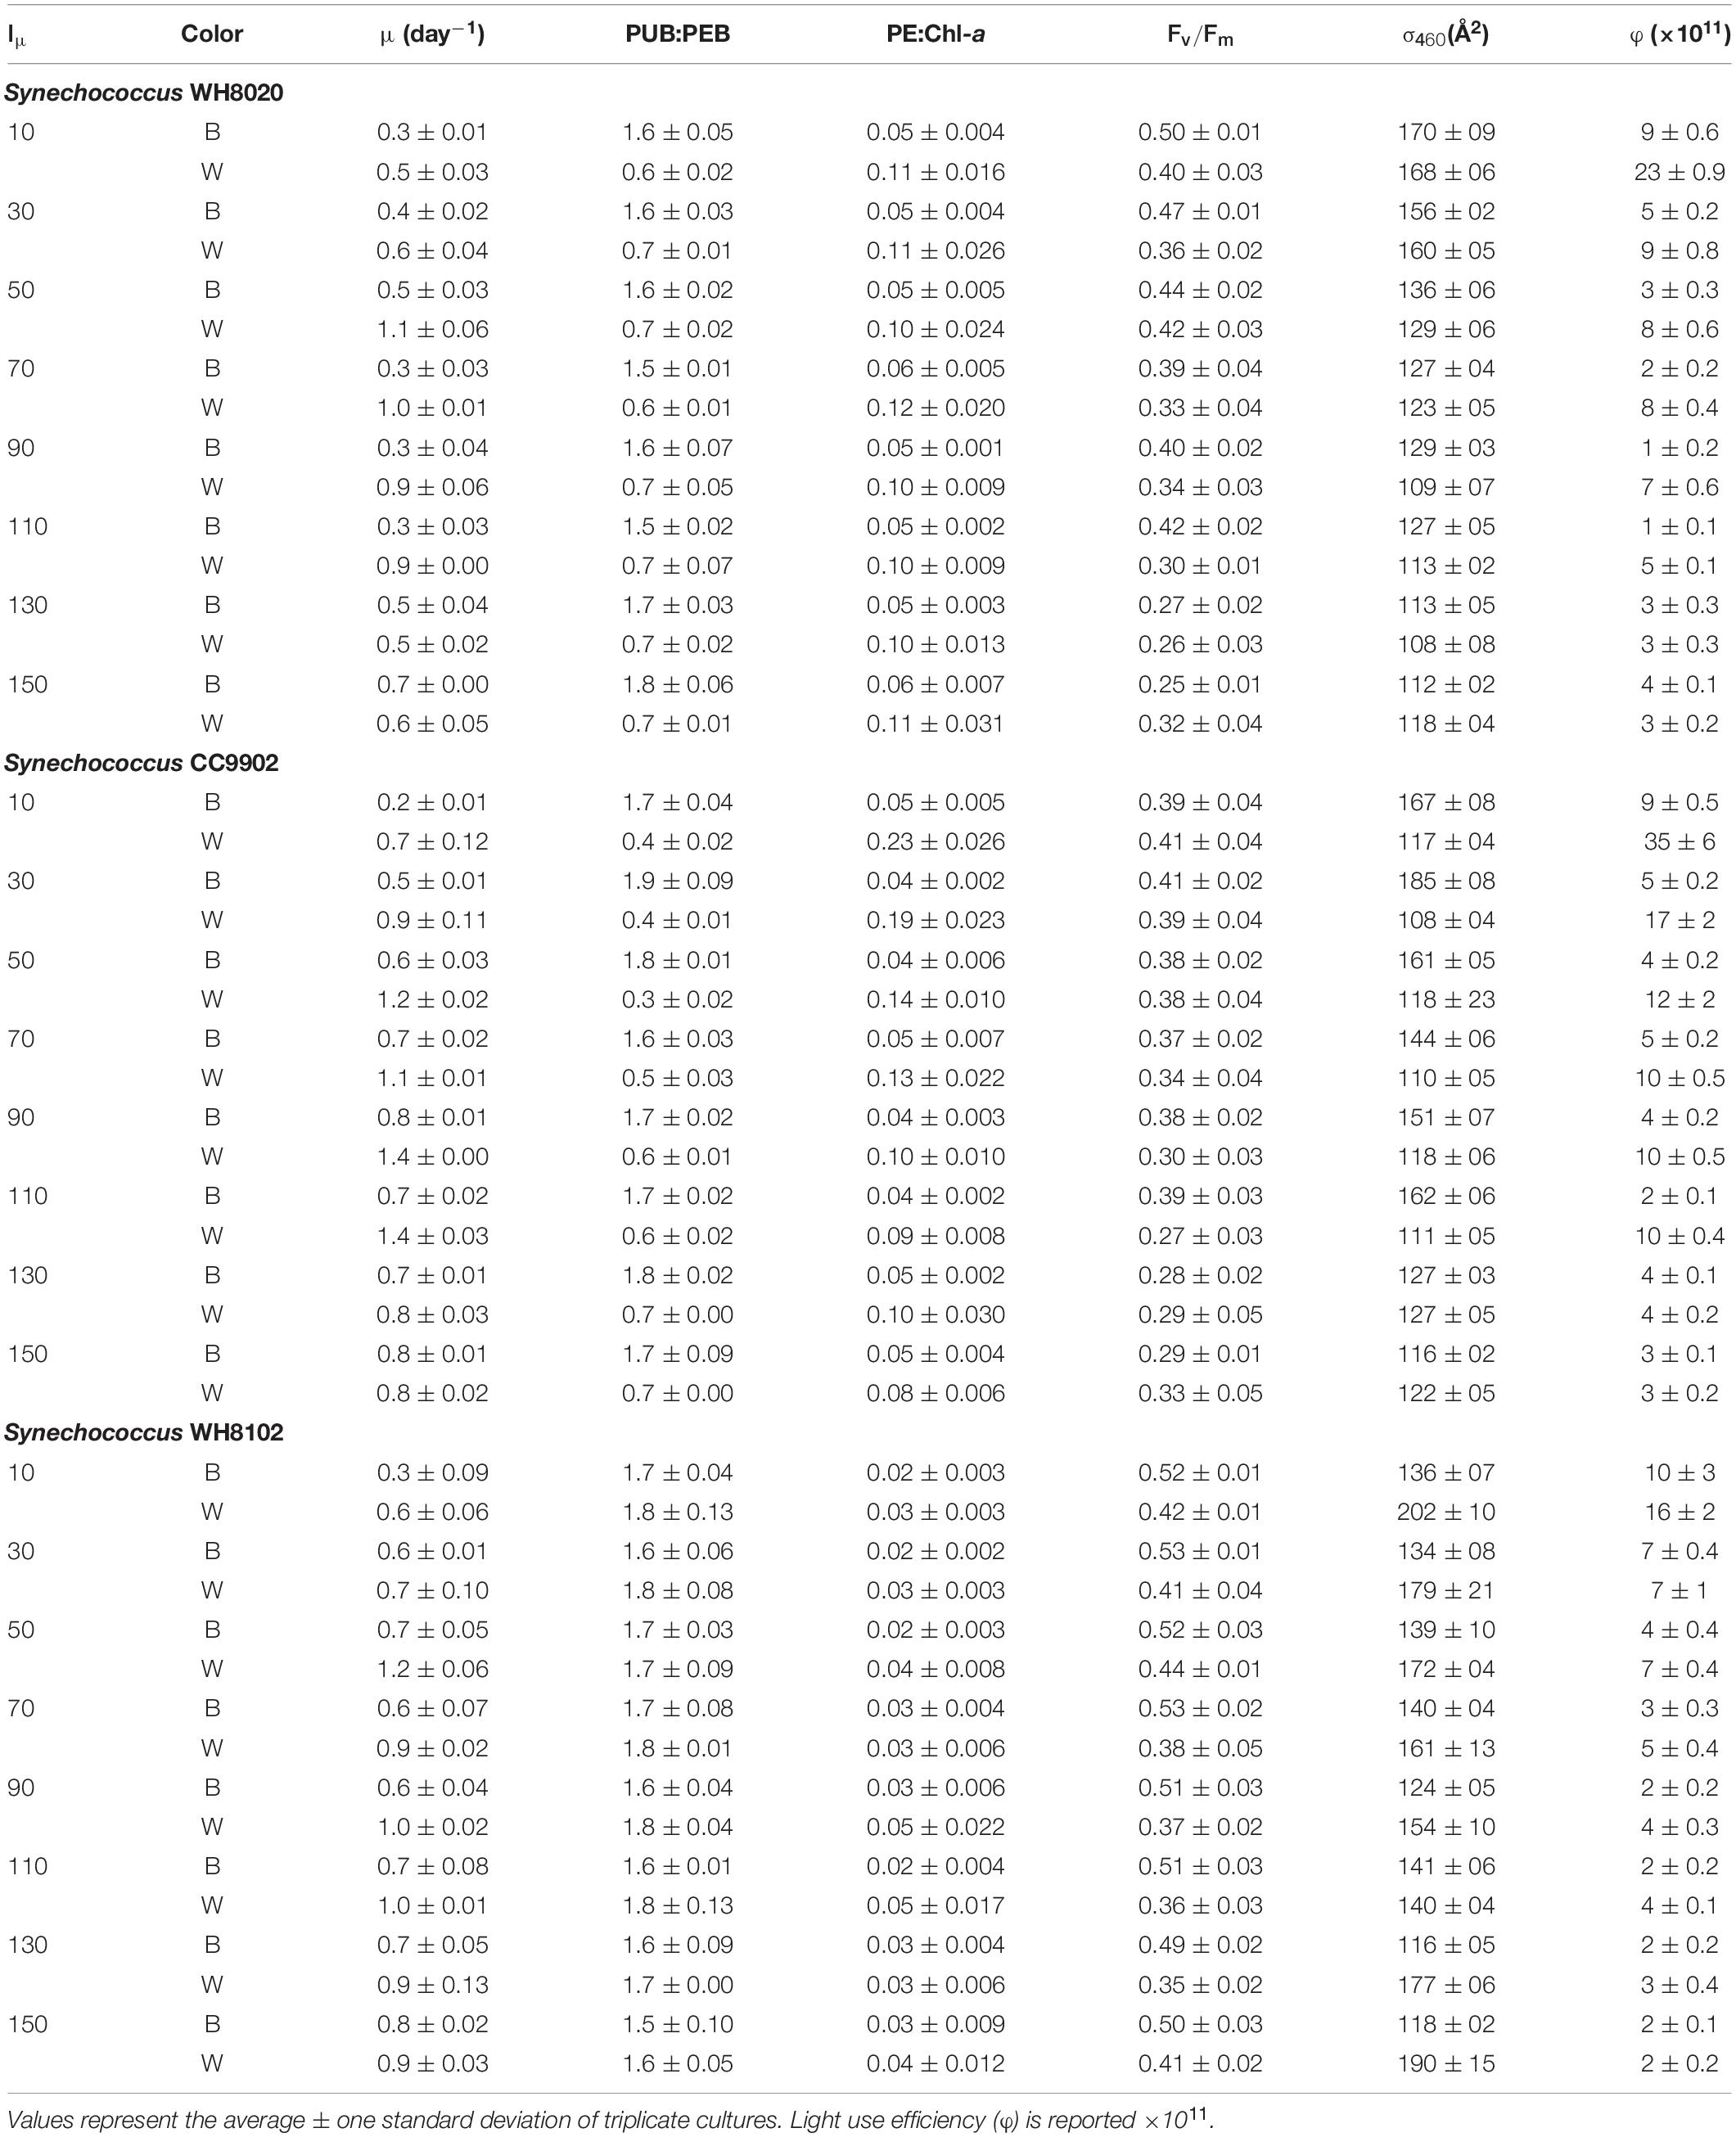
Table 3. Growth and apparent fluorescence parameters for Synechococcus WH8020, CC9902, and WH8102 in continuous blue (B) and white (W) LED light across growth irradiances (Iμ in μmol photons m–2 s–1).
While growth rates were higher in white light than blue light at lower irradiances, growth rates were more equal between the two light colors at higher irradiances (Table 3). Light use efficiency for all strains was also significantly higher in white light over blue light, and was highest at the lowest light intensities for each strain [two-way ANOVA F(7,96) = 291, p = 9.9E-62; Figure 6]. Light use efficiency decreased by an order of magnitude at the highest light intensities (Table 3). There were no differences between strains across light intensities in blue light [two-way ANOVA F(5,96) = 221, p = 4.8E-51; Figure 6]. In contrast, LUE for WH8020 and WH8102 were 34% and 54% lower than that for CC9902, respectively, at 10 μmol photons m–2 s–1 white light (Figure 6). At the highest irradiance, LUE of CC9902 was comparable to that of WH8020.
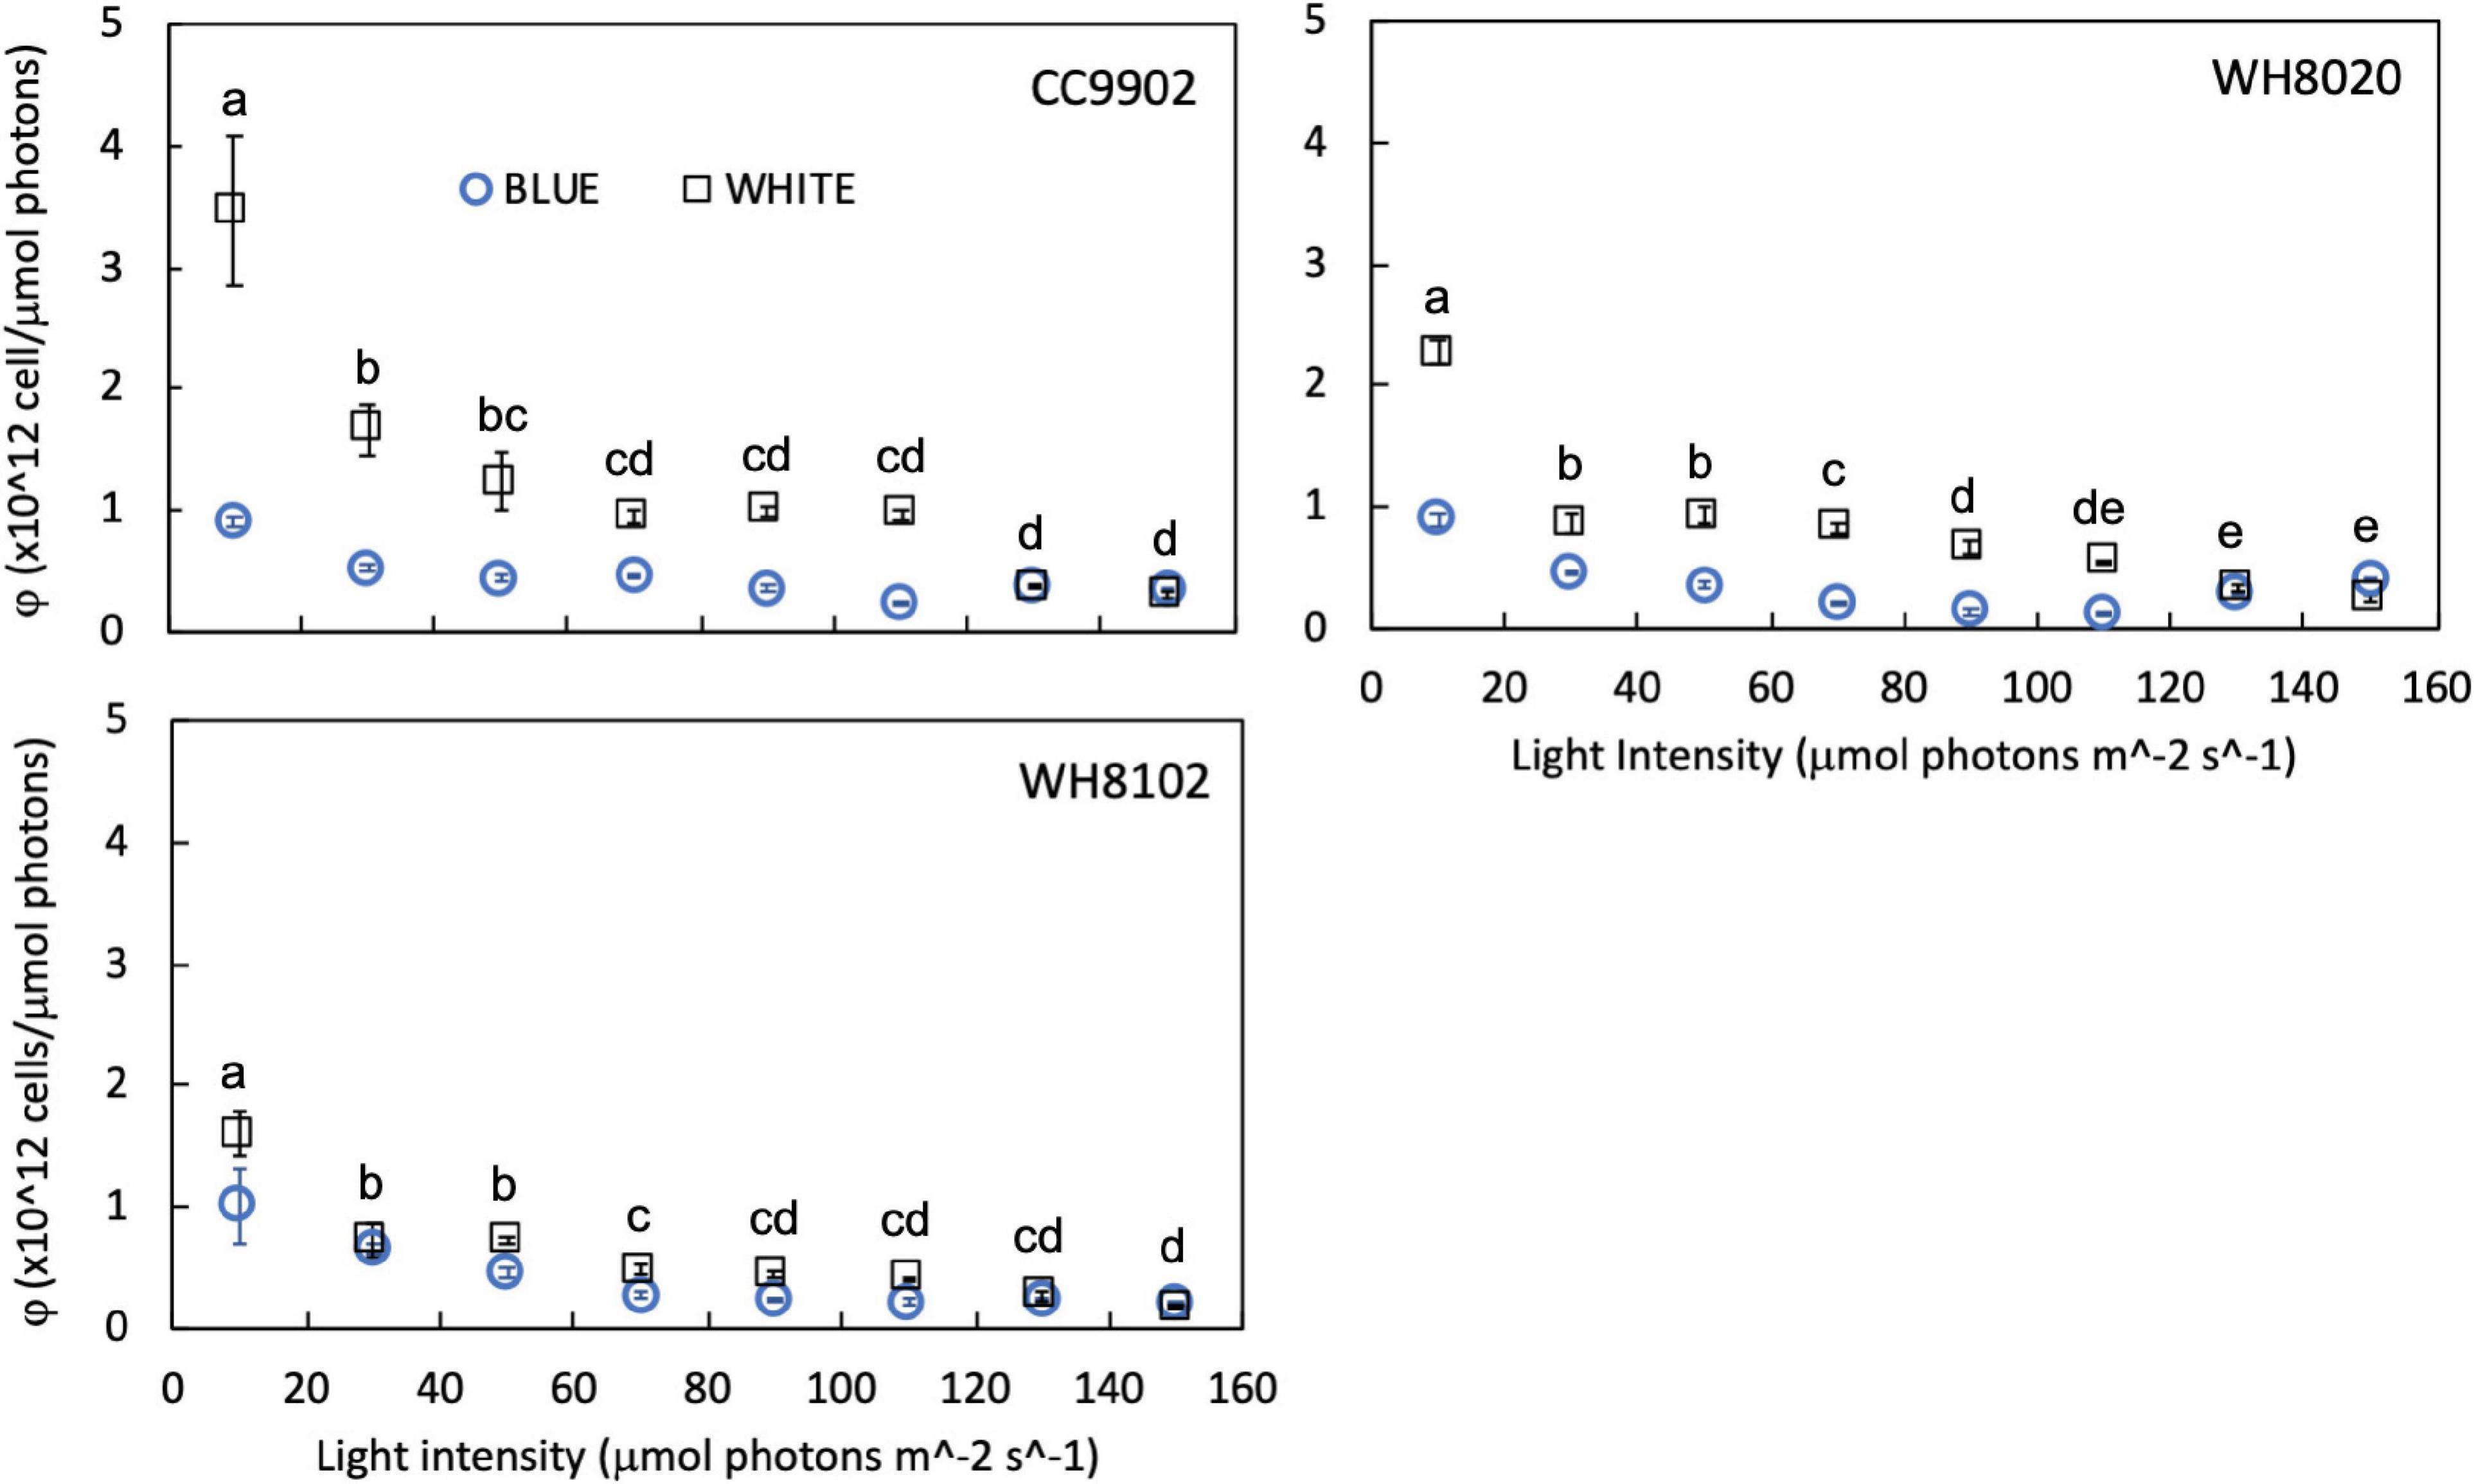
Figure 6. Light use efficiency (φ) for CA4 strains CC9902 and WH8020, and specialist strain WH8102 grown in white light (squares) and blue light (circles) from 10 to 150 μmol photons m–2 s–1. Error bars represent 1SD of triplicate cultures. Letters indicate means at each light intensity that are not statistically different (same letters) or are significantly different from each other (different letters, p < 0.05).
During exchange between blue and white light colors at 150 μmol photons m–2 s–1, WH8020 showed similar variation in PUB:PEB change as when grown continuously in the respective light colors, from 0.7 ± 0.01 in white light to 1.8 ± 0.13 in blue light. In contrast, PUB:PEB for CC9902 during exchange to white light at this irradiance was 0.9 ± 0.17 (Table 4) compared to growth in constant white light (PUB:PEB = 0.7 ± 0.00; Table 3), while PUB:PEB during exchange to blue light remained at 1.7 ± 0.12 (Table 4). There was no difference in LUE between white and blue light for the blue-specialist WH8102 or CC9902, while one generalist, WH8020, had higher average LUE in blue light than white light [one-way ANOVA F(5,30) = 21, p = 4.4E-9]. Across light color exchange at 150 μmol photons m–2 s–1, both generalists CC9902 and WH8020 had significantly higher overall LUE than the blue-specialist WH8102 (Figure 7).
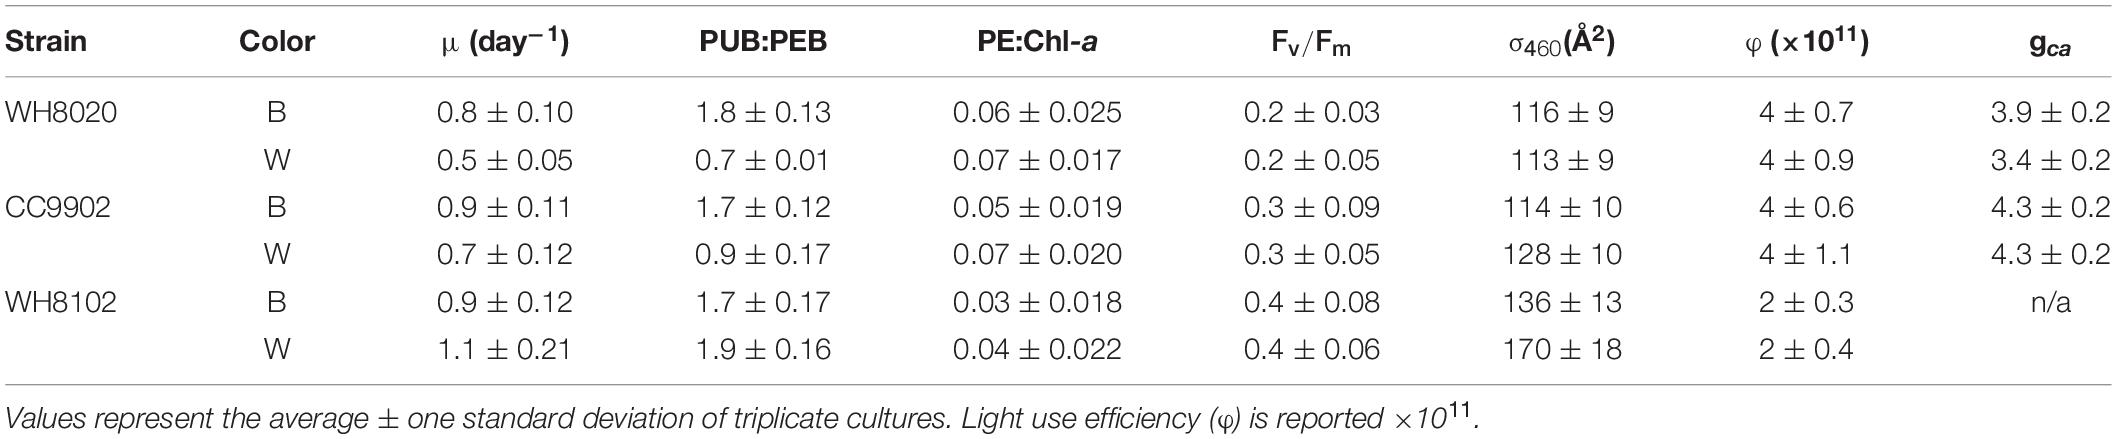
Table 4. Growth rate, apparent fluorescence parameters and acclimation time (gca) from Synechococcus strains exchanged between blue (B) and white (W) light at 150 μmol photons m–2 s–1.
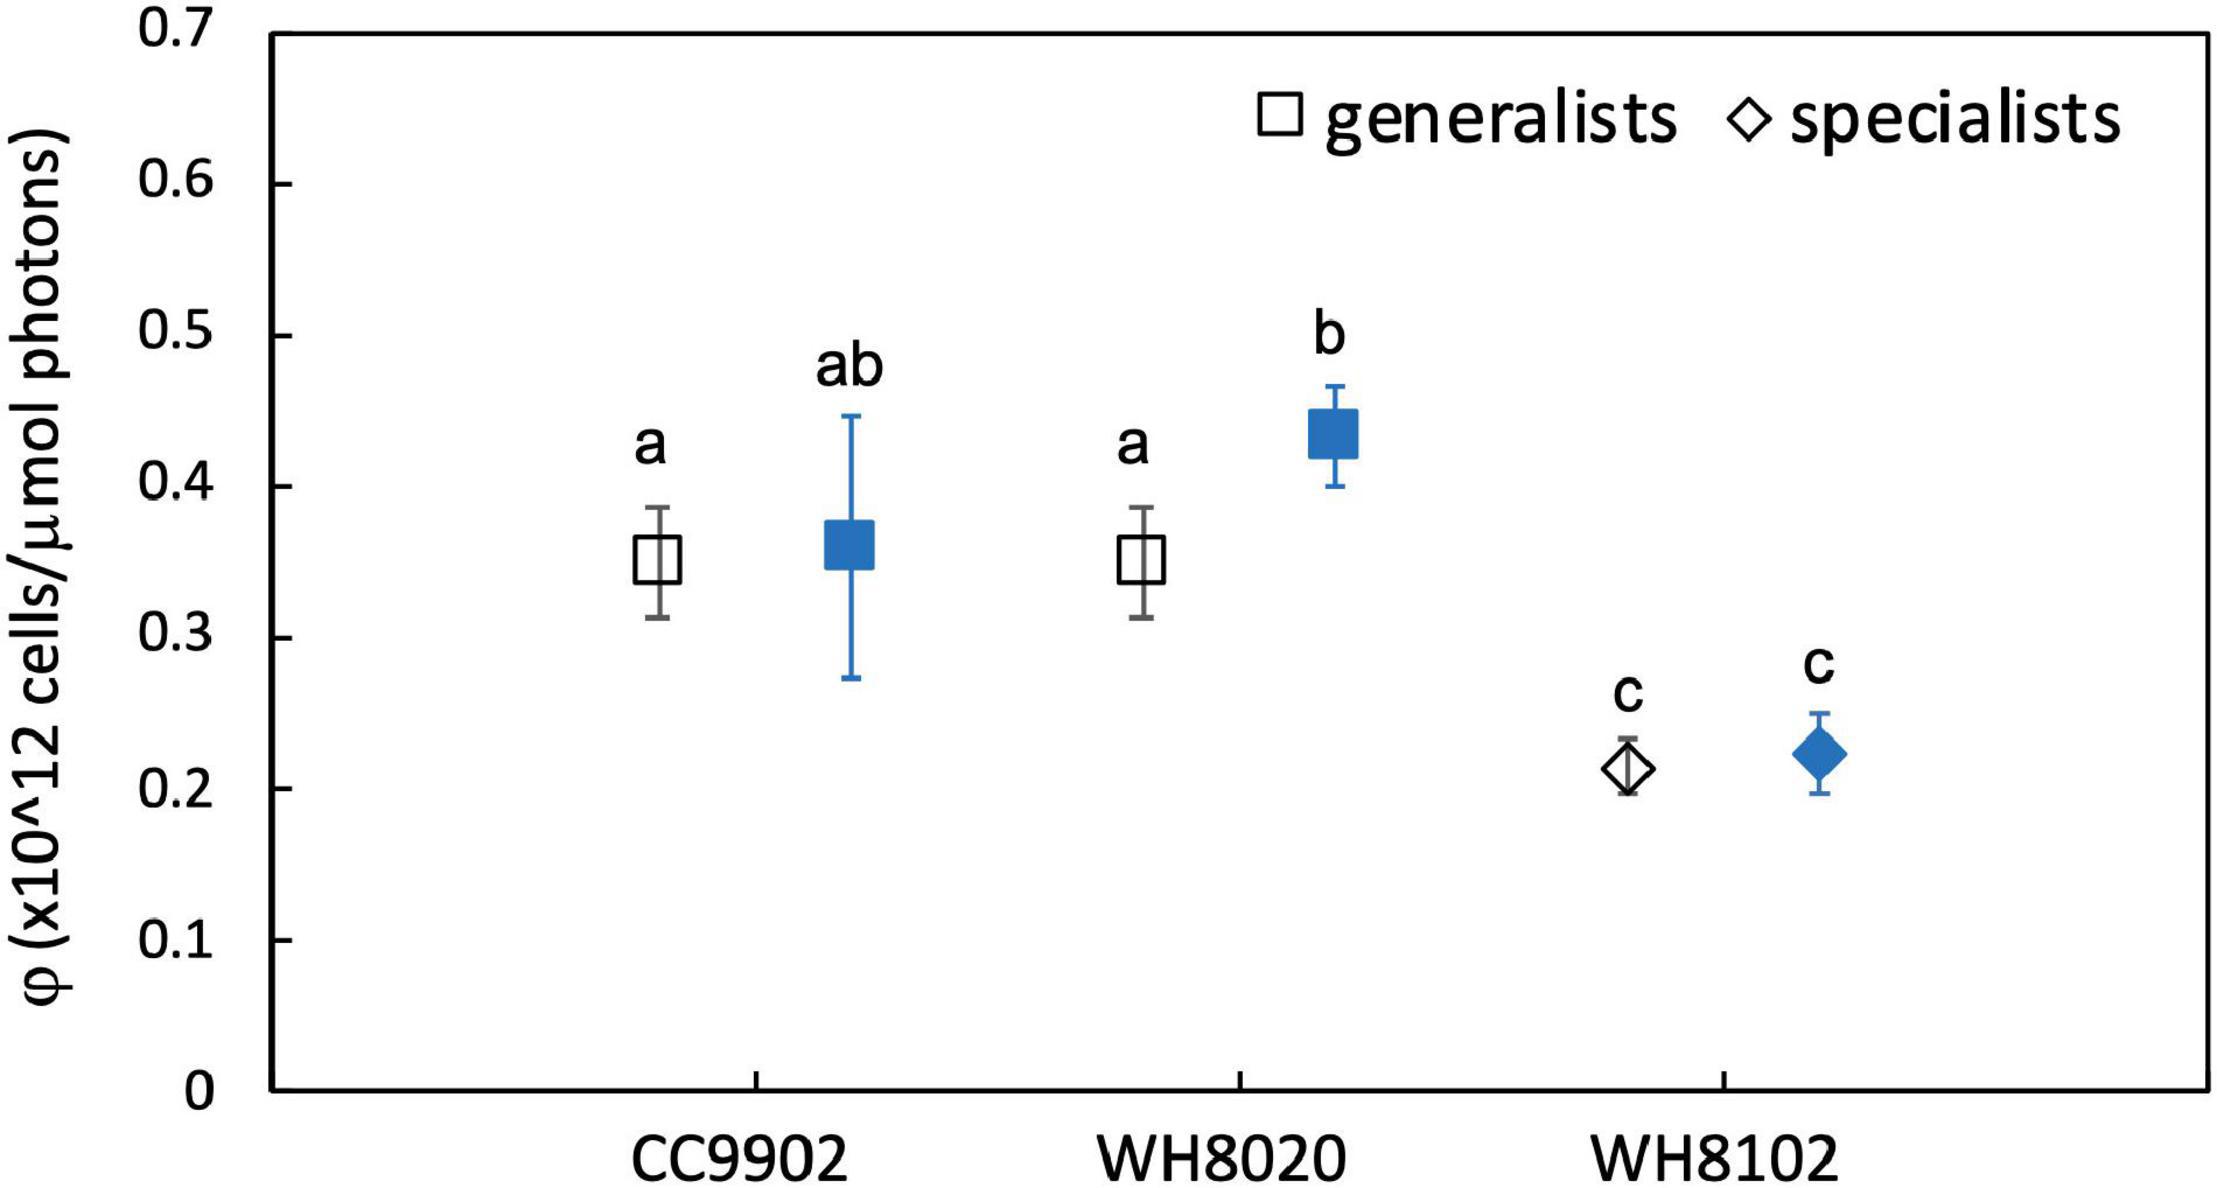
Figure 7. Average light use efficiency (LUE, φ) for CC9902, WH8020, WH8102 exchanged between white light (open) and blue light (filled) at 150 μmol photons m–2 s–1. Error bars represent 1SD of six cultures. Letters indicate means that are not statistically different (same letters) or are significantly different (different letters, p < 0.05).
Note that higher LUE of both generalists over WH8102 at high irradiance was not a function of the light intensity adaptation of this strain. The literature reports contrasting finding for the adaptation of WH8102 to high irradiance white light, from a low light obligate strain with maximum growth at 40 μmol photons m–2 s–1 (Mackey et al., 2017) to wide tolerances for high irradiances >200 μmol photons m–2 s–1 (Six et al., 2004, 2007a). In this study, WH8102 had maximum growth rate (1.2 ± 0.06 day–1) at 50 μmol photons m–2 s–1 and maintained growth rates >0.9 day–1 up to 150 μmol photons m–2 s–1 indicating a high light ability for this strain that facilitates our comparisons.
Discussion
Energetic Costs of Chromatic Acclimaters in Blue and Green Light
The widespread distribution of chromatic acclimating marine Synechococcus strains in the ocean (Grébert et al., 2018) is a good indication that costs associated with this generalist trait are smaller than the benefits conferred. Quantifying these costs can help us contextualize the magnitude of the benefit, and we make a start by examining LUE of acclimating strains compared to non-acclimating strains (specialists) in this study. We observed eight Synechococcus strains in nutrient replete conditions with different light harvesting strategies, and found that four of six chromatic acclimating generalists (RS9915, RS9916, WH8020, and WH8109) had an average 34% lower LUE in green light environments than PT3a or 3c strains. This result stands in contrast to an 11% higher LUE for generalist WH8020 than the blue-specialist WH8102 when grown in constant white light at 10 μmol photons m–2 s–1, indicating the possible effect of variable light to reduce LUE. This lower LUE in green light could represent a trade-off in light use efficiency for tolerance of variable environments in acclimating strains. For example, RS9915 and RS9916 were isolated from deeply mixed oligotrophic waters in the Gulf of Aqaba, with concentrations of Chl-a that range from low at 0.03 μg/L to higher at 0.36 μg/L spatially during winter, and measured spectral shifts of blue-dominant wavelengths deeper in the water column, to green-dominant wavelengths at maximum transparency (Stambler, 2005). Thus, both horizontal advection and deep mixing of strains in this system would lead to spectral shifts that may encourage CA4 and be beneficial despite a slight trade-off in light use efficiency.
While the energetic cost experienced by CA4 acclimaters observed in this study is similar in magnitude to the 40% decrease in light use efficiency measured by oxygen evolution in the CA3 strain Fremyella diplosiphon between red and green light (Campbell, 1996), there are some important differences. F. diplosiphon decreased efficiency immediately upon exchange to a new light color, with no difference in light use efficiency when fully acclimated to either red or green light. Thus, reduced light use efficiency for that strain was observed during acclimation, reported in relation to itself under fully acclimated conditions, and can be classed as an initial operational cost. In our study, there were significant differences in LUE between blue and green light environments for all strains, with no difference between when a strain was acclimating and after it had fully acclimated. Rather, the reduction in LUE reported here is in relation to specialist strains that do not acclimate. It therefore reflects the integrated energetic cost of maintaining and operating the CA4 machinery, rather than the initial operating cost. The balance in excitation energy between photosystems for F. diplosiphon reported as lower quantum yield but higher electron transport in green light was similarly observed in Synechococcus strains, which had lower Fv/Fmin green light over blue light, but higher LUE. Since all Synechococcus strains experienced adjustments in Fv/Fm and LUE upon illumination with a new light colorregardless of their light-harvesting strategy (Figure 5), such adjustments represented photo-acclimation responses unrelated to CA4 energetic costs. These photo-acclimation responses for all strains in green light is a baseline cost for all strains, and likely serves to balance excitation energy between photosystems, similar to the response for F. diplosiphon.
With no obvious initial operating cost, it seems the energy requirements for expressing the regulatory proteins for CA4 [for example FciA and FciB (Humily et al., 2013; Sanfilippo et al., 2016] are low enough to be adequately met by the strains at low light intensity. Low energy requirements are underscored by the lack of differences between CA4-A strains illuminated with blue light and CA4-B strains illuminated with green light, during which proteins are upregulated at different magnitudes (Sanfilippo et al., 2016, 2019b; Grébert et al., 2021). Since no differences were observed at the onset of acclimation, the initial operating cost associated with these differential gene and protein expressions appear to be negligible in terms of their effect on the overall LUE of the strains. This is supported by preliminary studies that found no obvious compensations for a high operating cost, with no differences in growth rates or cell size for strains acclimating to blue light (Everroad et al., 2006). In addition to protein regulation, energy requirements for de novo synthesis of the PBS rods to the new light environment (Everroad et al., 2006) also do not appear to impose an additional production cost beyond that experienced by all strains growing in a new light environment, which may indicate either that the replacement of phycobilins for CA4 strains occurs in time with dividing cells such that additional energy is not required, or that CA4 phycobilin replacement only requires moderate to no de novo synthesis of the PBS rods.
In contrast to acclimating strains with a high magnitude of PUB:PEB variation (∼1; PT3d generalists), the PT3e generalist with the lowest magnitude of PUB:PEB variation (0.2) exhibited the highest LUE of all the strains, an average 69% more than specialists, and >100% more than PT3d strains. Thus, lower magnitudes of variation between the two end-member phenotypes during plasticity can potentially reduce energetic costs as well as yield a net benefit over specialists and even other generalists with more extreme end-member phenotypes. Additional studies with other PT3e strains may be useful to confirm these findings. An increased advantage of a reduced acclimation range compared to a wide acclimation range may indicate a balance between energetic cost and LUE, but possibly sacrificing a competitive advantage. As our experiments were conducted in monoculture, it remains to be determined if RCC307 or other PT3e generalists would be able to successfully outcompete a PT3d generalist under similar conditions.
Longer delays in acclimation times of RCC307 (Figure 3) provided a good examination of the impact of the acclimation response time. Despite delays before acclimation that would lead to short periods of mismatch between the environment and the phenotype, no delays in adjustment to LUE between light colors were observed for this strain, or any other, indicating that the response time did not pose an energetic limitation on chromatic acclimating strains.
Interaction Between Chromatic Acclimation and Photo-Acclimation
Lower LUE observed in this study at 440 nm blue light—absorption maximum of chlorophyll-a—is similar to that observed in other cyanobacteria studies, associated with the need to balance excitation energy between photosystem II dominated by the phycobilisome and photosystem I dominated by Chl-a (Luimstra et al., 2018, 2019). The requirement to balance excitation energy is not specific to CA4, but could be exacerbated for all strains under our experimental conditions due to the perceived intensity of the blue LED. The narrow spectral band allows for a higher number of PAR-integrated photons in the blue region compared to white light of the same irradiance. For example, at equal PAR-integrated intensities of 10 μmol photons m–2 s–1, the intensity at 440 nm would be much higher in blue light than in white light. This difference may induce a high light response in lab-grown PE-dominant Synechococcus whose photosystem I Chl-a may become quickly saturated.
Even with a potentially saturating blue light at low irradiance, a decrease in PUB:PEB in high irradiance blue light was not observed in acclimating strains in this study. However, the increase in PUB:PEB in high irradiance white light for CC9902 observed in this study may indicate a similarity to the decreased PUB:PEB observed in blue light in other studies (Humily et al., 2013). Both results are consistent with reductions in the phycobilisome rod length at high irradiance, which is a photo-acclimation response that preferentially reduces PEII (Kana and Glibert, 1987; Six et al., 2005). In blue light, generalists have more PUB bound to PEII than PEB (Everroad et al., 2006), leading to a decrease in PUB:PEB when PEII is lost, as was observed by Humily et al. (2013). Conversely, there is more PEB bound to PEII in white light, increasing PUB:PEB when PEII is lost, as was observed in our study. Such changes cannot be determined from whole pigment fluorescence alone, but accompanying reductions in PE:Chl-a as white light increased for CC9902 (Table 3) may indicate rod length reduction. Procedures to identify the phycobilins in the PBS and measure the length of the PBS rods were not conducted in this study, but would be useful to determine the exact mechanism of PUB:PEB fluorescence change. Equal LUE between light color exchanges in white light and blue light at high irradiance for CC9902, and higher LUE for CC9902 than the blue-specialist WH8102 indicates no associated sensing cost accompanied the reduction in PUB:PEB for this strain.
Adaptability of Synechococcus to Green Ocean Niches
While we might have expected the green-specialist to have higher LUE in green light and the blue-specialist to have higher LUE in blue light, this was not observed. Instead, LUE was two times higher in green light than blue light across all strains, indicating the suitability of PE-dominant Synechococcus to green ocean niches. We note, however, that none of the lights used in our experiments had peak emission at the absorption maximum of PUB at 495 nm, leaving the question open about whether such an environment may see equally high light use efficiencies. In the ocean, chromatic acclimaters were found to dominate in waters in the North Atlantic with measured spectra that peaked in the blue and green spectral regions closer to PUB and PEB absorption (Holtrop et al., 2020), and could indicate that the 440 – 450 nm blue light range used in this and other studies (Palenik, 2001; Everroad et al., 2006; Shukla et al., 2012), may not adequately represent the realized niche of these strains. The dominance of Synechococcus during spring blooms in the Bermuda Atlantic Time series dataset at the same time as the highest coccolithophore concentrations (DuRand et al., 2001) supports this idea, as coccolithophore blooms have peak reflectance in the range of 490 nm (Moore et al., 2012) and could represent another realized niche for high PUB adapted and acclimating Synechococcus strains.
Since two-thirds of the acclimaters tested here had no advantage in LUE over specialists across changing light environments, this may indicate that CA4 is not a strategy geared at direct competition between Synechococcus strains. Rather, the trait could have evolved for optimizing the distribution of the genus in areas not well suited for specialists. Lower efficiencies may indicate a trade-off to allow expansion into waters with blue-green variability in the spectra not readily occupied by other strains (Holtrop et al., 2020). A flexible strategy allows strains to fill dynamic niches, enabling the ubiquity of the genus. Absorption of Synechococcus in the blue-green region, with higher efficiencies in green light, notably compliments the light absorption of Prochlorococcus, the most abundant cyanobacteria, that does not absorb in the green region of the spectrum. Thus, the pigment strategies of Synechococcus may allow the two genera to survive in tandem, with overlapping distributions and phylogeographies (Kent et al., 2019). Given the nutrient and temperature requirements and delineations of strains within the ocean environment, whether these factors impose their own limitations on chromatic acclimating strains remain to be explored.
Data Availability Statement
The original contributions presented in the study are included in the article/supplementary material, further inquiries can be directed to the corresponding authors.
Author Contributions
RL, LA, and HM conducted the experiments. KM supervised the experiments. RL drafted the manuscript. RL, LA, and KM reviewed and edited the final manuscript. All authors conceived of the research and discussed preliminary results.
Funding
This work was supported by the Ridge to Reef NSF Research Traineeship, award DGE-1735040 to RL, Undergraduate Research Opportunities Program (UROP) to LA and HM, and a Simons Early Career Award in Marine Microbial Ecology and Evolution and a Clare Boothe Luce Fellowship from the Henry Luce Foundation to KM.
Conflict of Interest
The authors declare that the research was conducted in the absence of any commercial or financial relationships that could be construed as a potential conflict of interest.
Publisher’s Note
All claims expressed in this article are solely those of the authors and do not necessarily represent those of their affiliated organizations, or those of the publisher, the editors and the reviewers. Any product that may be evaluated in this article, or claim that may be made by its manufacturer, is not guaranteed or endorsed by the publisher.
Acknowledgments
Synechococcus strains for this study were provided by Laurence Garczarek and Frédéric Partensky. We thank Jade Barrilleaux for assistance with experimental set-up and data collection for Figure 2, as well as the Laser Spectroscopy Lab at UC Irvine for assistance with fluorometry, and Maxim Gorbunov for helpful discussion on rapid rate fluorometry.
References
Agostoni, M., Lucker, B. F., Smith, M. A. Y., Kanazawa, A., Blanchard, G. J., Kramer, D. M., et al. (2016). Competition-based phenotyping reveals a fitness cost for maintaining phycobilisomes under fluctuating light in the cyanobacterium Fremyella diplosiphon. Algal Res. 15, 110–119. doi: 10.1016/j.algal.2016.02.005
Campbell, D. (1996). Complementary chromatic adaptation alters photosynthetic strategies in the cyanobacterium Calothrix. Microbiology 142, 1255–1263. doi: 10.1099/13500872-142-5-1255
DeWitt, T. J., Sih, A., and Wilson, D. S. (1998). Costs and limits of phenotypic plasticity. Trends Ecol. Evolu. 13, 77–81. doi: 10.1016/S0169-5347(97)01274-3
DuRand, M. D., Olson, R. J., and Chisholm, S. W. (2001). Phytoplankton population dynamics at the bermuda atlantic time-series station in the Sargasso Sea. Deep Sea Res. Part II Top. Stud. Oceanogr. 48, 1983–2003. doi: 10.1016/S0967-0645(00)00166-1
Everroad, R. C., Six, C., Partensky, F., Thomas, J.-C., Holtzendorff, J., and Wood, A. M. (2006). Biochemical bases of type IV chromatic adaptation in marine Synechococcus spp. J. Bacteriol. 188, 3345–3356. doi: 10.1128/JB.188.9.3345-3356.2006
Grébert, T., Doré, H., Partensky, F., Farrant, G. K., Boss, E. S., Picheral, M., et al. (2018). Light color acclimation is a key process in the global ocean distribution of Synechococcus cyanobacteria. Proc. Natl. Acad. Sci. U.S.A. 115, E2010–E2019. doi: 10.1073/pnas.1717069115
Grébert, T., Nguyen, A. A., Pokhrel, S., Joseph, K. L., Ratin, M., Dufour, L., et al. (2021). Molecular bases of an alternative dual-enzyme system for light color acclimation of marine Synechococcus cyanobacteria. Proc. Natl. Acad. Sci. U.S.A. 118:e2019715118. doi: 10.1073/pnas.2019715118
Grossman, A. R., and Kehoe, D. M. (1997). Phosphorelay control of phycobilisome biogenesis during complementary chromatic adaptation. Photosy. Res. 53, 95–108.
Gutu, A., Nesbit, A. D., Alverson, A. J., Palmer, J. D., and Kehoe, D. M. (2013). Unique role for translation initiation factor 3 in the light color regulation of photosynthetic gene expression. Proc. Natl. Acad. Sci. U.S.A. 110, 16253–16258. doi: 10.1073/pnas.1306332110
Holtrop, T., Huisman, J., Stomp, M., Biersteker, L., Aerts, J., Grébert, T., et al. (2020). Vibrational modes of water predict spectral niches for photosynthesis in lakes and oceans. Nat. Ecol. Evolu. 5, 55–66. doi: 10.1038/s41559-020-01330-x
Humily, F., Farrant, G. K., Marie, D., Partensky, F., Mazard, S., Perennou, M., et al. (2014). Development of a targeted metagenomic approach to study a genomic region involved in light harvesting in marine Synechococcus. FEMS Microbiol. Ecol. 88, 231–249. doi: 10.1111/1574-6941.12285
Humily, F., Partensky, F., Six, C., Farrant, G. K., Ratin, M., Marie, D., et al. (2013). a gene island with two possible configurations is involved in chromatic acclimation in marine Synechococcus. PLoS One 8:e84459. doi: 10.1371/journal.pone.0084459
Kana, T. M., and Glibert, P. M. (1987). Effect of irradiances up to 2000 uE m-2 s-l on marine Synechococcus WH7803I. growth, pigmentation, and cell composition. Deep Sea Res. 34, 479–495.
Kent, A. G., Baer, S. E., Mouginot, C., Huang, J. S., Larkin, A. A., Lomas, M. W., et al. (2019). Parallel phylogeography of Prochlorococcus and Synechococcus. ISME J. 13, 430–441. doi: 10.1038/s41396-018-0287-6
Luimstra, V. M., Schuurmans, J. M., de Carvalho, C. F. M., Matthijs, H. C. P., Hellingwerf, K. J., and Huisman, J. (2019). Exploring the low photosynthetic efficiency of cyanobacteria in blue light using a mutant lacking phycobilisomes. Photosy. Res. 141, 291–301. doi: 10.1007/s11120-019-00630-z
Luimstra, V. M., Schuurmans, J. M., Verschoor, A. M., Hellingwerf, K. J., Huisman, J., and Matthijs, H. C. P. (2018). Blue light reduces photosynthetic efficiency of cyanobacteria through an imbalance between photosystems I and II. Photosy. Res. 138, 177–189. doi: 10.1007/s11120-018-0561-5
Mackey, K. R. M., Post, A. F., McIlvin, M. R., and Saito, M. A. (2017). Physiological and proteomic characterization of light adaptations in marine Synechococcus: light adaptations in marine Synechococcus. Environ. Microbiol. 19, 2348–2365. doi: 10.1111/1462-2920.13744
Mahmoud, R. M., Sanfilippo, J. E., Nguyen, A. A., Strnat, J. A., Partensky, F., Garczarek, L., et al. (2017). Adaptation to blue light in marine Synechococcus requires MpeU, an enzyme with similarity to Phycoerythrobilin lyase isomerases. Front. Microbiol. 8:243. doi: 10.3389/fmicb.2017.00243
Montgomery, B. L. (2016). Mechanisms and fitness implications of photomorphogenesis during chromatic acclimation in cyanobacteria. J. Exp. Bot. 67, 4079–4090. doi: 10.1093/jxb/erw206
Montgomery, B. L. (2017). Seeing new light: recent insights into the occurrence and regulation of chromatic acclimation in cyanobacteria. Curr. Opin. Plant Biol. 37, 18–23. doi: 10.1016/j.pbi.2017.03.009
Moore, T. S., Dowell, M. D., and Franz, B. A. (2012). Detection of coccolithophore blooms in ocean color satellite imagery: a generalized approach for use with multiple sensors. Remote Sensing Environ. 117, 249–263. doi: 10.1016/j.rse.2011.10.001
Nagae, T., Unno, M., Koizumi, T., Miyanoiri, Y., Fujisawa, T., Masui, K., et al. (2021). Structural basis of the protochromic green/red photocycle of the chromatic acclimation sensor RcaE. Proc. Natl. Acad. Sci. U.S.A. 118:e2024583118. doi: 10.1073/pnas.2024583118
Palenik, B. (2001). Chromatic adaptation in marine Synechococcus strains. Appl. Environ. Microbiol. 67, 991–994. doi: 10.1128/AEM.67.2.991-994.2001
Sanfilippo, J. E., Garczarek, L., Partensky, F., and Kehoe, D. M. (2019a). Chromatic acclimation in cyanobacteria: a diverse and widespread process for optimizing photosynthesis. Ann. Rev. Microbiol. 73, 407–433. doi: 10.1146/annurev-micro-020518-115738
Sanfilippo, J. E., Nguyen, A. A., Garczarek, L., Karty, J. A., Pokhrel, S., Strnat, J. A., et al. (2019b). Interplay between differentially expressed enzymes contributes to light color acclimation in marine Synechococcus. Proc. Natl. Acad. Sci. U.S.A. 116, 6457–6462. doi: 10.1073/pnas.1810491116
Sanfilippo, J. E., Nguyen, A. A., Karty, J. A., Shukla, A., Schluchter, W. M., Garczarek, L., et al. (2016). Self-regulating genomic island encoding tandem regulators confers chromatic acclimation to marine Synechococcus. Proc. Natl. Acad. Sci. U.S.A. 113, 6077–6082. doi: 10.1073/pnas.1600625113
Schreiber, U., Endo, T., Mi, H., and Asada, K. (1995). Quenching analysis of chlorophyll fluorescence by the saturation pulse method: particular aspects relating to the study of eukaryotic algae and cyanobacteria. Plant Cell Physiol. 36, 873–882. doi: 10.1093/oxfordjournals.pcp.a078833
Shukla, A., Biswas, A., Blot, N., Partensky, F., Karty, J. A., Hammad, L. A., et al. (2012). Phycoerythrin-specific bilin lyase-isomerase controls blue-green chromatic acclimation in marine Synechococcus. Proc. Natl. Acad. Sci. U.S.A. 109, 20136–20141. doi: 10.1073/pnas.1211777109
Six, C., Finkel, Z. V., Irwin, A. J., and Campbell, D. A. (2007a). Light variability illuminates niche-partitioning among marine Picocyanobacteria. PLoS One 2:e1341. doi: 10.1371/journal.pone.0001341
Six, C., Thomas, J.-C., Brahamsha, B., Lemoine, Y., and Partensky, F. (2004). Photophysiology of the marine cyanobacterium Synechococcus sp. WH8102, a new model organism. Aquatic Microbial. Ecol. 35, 17–29. doi: 10.3354/ame035017
Six, C., Thomas, J.-C., Garczarek, L., Ostrowski, M., Dufresne, A., Blot, N., et al. (2007b). Diversity and evolution of phycobilisomes in marine Synechococcus spp.: a comparative genomics study. Genome Biol. 8:R259. doi: 10.1186/gb-2007-8-12-r259
Six, C., Thomas, J.-C., Thion, L., Lemoine, Y., Zal, F., and Partensky, F. (2005). Two novel phycoerythrin-associated linker proteins in the marine Cyanobacterium Synechococcus sp. strain WH8102. J. Bacteriol. 187, 1685–1694. doi: 10.1128/JB.187.5.1685-1694.2005
Stambler, N. (2005). Bio-optical properties of the northern red sea and the gulf of eilat (Aqaba) during winter 1999. J. Sea Res. 54, 186–203. doi: 10.1016/j.seares.2005.04.006
Stomp, M., van Dijk, M. A., van Overzee, H. M. J., Wortel, M. T., Sigon, C. A. M., Egas, M., et al. (2008). The timescale of phenotypic plasticity and its impact on competition in fluctuating environments. Am. Nat. 172, E169–E185. doi: 10.1086/591680
Suggett, D. J., Moore, C. M., Hickman, A. E., and Geider, R. J. (2009). Interpretation of fast repetition rate (FRR) fluorescence: signatures of phytoplankton community structure versus physiological state. Mar. Ecol. Prog. Series 376, 1–19. doi: 10.3354/meps07830
Terauchi, K., Montgomery, B. L., Grossman, A. R., Lagarias, J. C., and Kehoe, D. M. (2004). RcaE is a complementary chromatic adaptation photoreceptor required for green and red light responsiveness. Mol. Microbiol. 51, 567–577. doi: 10.1046/j.1365-2958.2003.03853.x
Wiltbank, L. B., and Kehoe, D. M. (2016). Two Cyanobacterial Photoreceptors regulate photosynthetic light harvesting by sensing teal, green, yellow, and red light. MBio 7:e02130-15. doi: 10.1128/mBio.02130-15 ∗e02130-15,
Wiltbank, L. B., and Kehoe, D. M. (2019). Diverse light responses of cyanobacteria mediated by phytochrome superfamily photoreceptors. Nat. Rev. Microbiol. 17, 37–50. doi: 10.1038/s41579-018-0110-4
Xia, X., Guo, W., Tan, S., and Liu, H. (2017). Synechococcus assemblages across the salinity gradient in a salt wedge estuary. Front. Microbiol. 8:1254. doi: 10.3389/fmicb.2017.01254
Keywords: chromatic acclimation, phycoerythrin, Synechococcus, trade-offs, plasticity
Citation: Lovindeer R, Abbott L, Medina H and Mackey KRM (2021) Costs and Limitations of Marine Synechococcus Blue-Green Chromatic Acclimation. Front. Mar. Sci. 8:689998. doi: 10.3389/fmars.2021.689998
Received: 01 April 2021; Accepted: 03 August 2021;
Published: 03 September 2021.
Edited by:
Hongbin Liu, Hong Kong University of Science and Technology, Hong Kong, SAR ChinaReviewed by:
Christophe Six, Université Pierre et Marie Curie, FranceAnthony William Larkum, University of Technology Sydney, Australia
Copyright © 2021 Lovindeer, Abbott, Medina and Mackey. This is an open-access article distributed under the terms of the Creative Commons Attribution License (CC BY). The use, distribution or reproduction in other forums is permitted, provided the original author(s) and the copyright owner(s) are credited and that the original publication in this journal is cited, in accordance with accepted academic practice. No use, distribution or reproduction is permitted which does not comply with these terms.
*Correspondence: Raisha Lovindeer, cmFpc2hhLmxvdmluZGVlckB1Y2kuZWR1; Katherine R. M. Mackey, a21hY2tleUB1Y2kuZWR1