 Weifeng Yang1,2*
 Xiufeng Zhao1,2
 Laodong Guo3
 Bangqin Huang1,4
 Min Chen2
 Ziming Fang5
 Xiao Zhang2
 Yusheng Qiu2
- 1State Key Laboratory of Marine Environmental Science, Xiamen, China
- 2College of Ocean and Earth Sciences, Xiamen University, Xiamen, China
- 3School of Freshwater Sciences, University of Wisconsin-Milwaukee, Milwaukee, WI, United States
- 4College of the Environment and Ecology, Xiamen University, Xiamen, China
- 5Department of Ocean Science, The Hong Kong University of Science and Technology, Kowloon, Hong Kong SAR, China
Black carbon (BC) is believed to be refractory and thus affects the timescale of organic carbon conversion into CO2 and the magnitude of the sink of CO2. However, the fate of BC in the oceans remains poorly understood. Here, 210Po and 210Pb were measured to examine the export of soot in the northeastern South China Sea (SCS). Concentrations of soot decreased from 0.141 ± 0.021 μmol-C L–1 (mean ± SD) in the mixed layer (0–30 m) to 0.087 μmol-C L–1 at the euphotic base (150 m) due to potential photodegradation within the euphotic zone. In the twilight zone, however, the soot showed an increasing pattern along with the total particulate matter and total particulate organic carbon (POC) contents, corresponding to additions from the shelf/slope sediment resuspension through lateral transport. Using the deficits of 210Po, the export flux of soot from the euphotic zone was calculated to be 0.172 ± 0.016 mmol-C m–2 d–1 and increased with depth. Assuming that the soot is entirely refractory below the euphotic zone, the sediment-derived soot fluxes were estimated based on the increase in soot fluxes relative to the base of the euphotic zone, with values varying from 0.149 ± 0.030 to 0.96 ± 0.10 μmol-C L–1. This indicates that sediment resuspension is an important source of soot to the ocean interior in the SCS. Coupling the sediment-derived soot and 210Po-derived POC fluxes gave rise to a Martin Curve-like flux attenuation of local euphotic zone-derived POC in the twilight zone with b value of 0.70 ± 0.01. These results suggest that soot could be useful for constraining in situ POC fluxes and their transport.
Introduction
Black carbon (BC) is the product of incomplete combustion of biomass and fossil fuels (Goldberg, 1985). In the atmosphere, BC has a strong ability to absorb solar radiation (Jacobson, 2001), and thus it has been listed as the second forcing factor in driving the global change following CO2 (Ramanathan and Carmichael, 2008). Owing to its chemical- (except photolysis) and bio-resistant nature, BC represents the refractory carbon pool on the earth. Previous studies have shown that most of the BC can persist for hundreds to thousands of years either in the soil (Goldberg, 1985; Singh et al., 2012) or in seawater (Ziolkowski and Druffel, 2010; Coppola and Druffel, 2016). Thus, BC is a long-term CO2 sink (Coppola et al., 2014). Understanding the fate of BC would increase our knowledge about the role of BC in the global carbon cycle and climate change.
Over the past years, a line of studies indicated that a large amount of BC gets into the oceans via atmospheric deposition (Bao et al., 2017) and river discharge (Wang et al., 2016; Jones et al., 2020). For example, the annual particulate BC (PBC) input from the river discharge was 17–37 Tg (Coppola et al., 2018). Around 34 ± 26% of biomass-generated BC (40–215 Tg yr–1, including dissolved BC, i.e., DBC and PBC) gets into the oceans via river discharge (Jones et al., 2020). These reports indicate that the ocean is an important reservoir of BC (Masiello and Druffel, 1998; Fang et al., 2018). With an increase in BC emissions from the increase in both fossil fuel combustion and fires emissions, the riverine BC is expected to increase the refractory carbon pool in abyssal oceans (Cheng et al., 2008; Dittmar et al., 2012). However, the cycling of BC in marine environments remains enigmatic with available data.
Based on radiocarbon measurements, BC in deep oceans has a 14C-age ranging from thousands to tens of thousands of years (Ziolkowski and Druffel, 2010; Coppola et al., 2014; Coppola and Druffel, 2016). However, the global riverine discharge could renew the oceanic BC pool within hundreds of years (Wagner et al., 2018). These results indicate that there must be a large amount of BC being removed after getting into the marine environment. Three recent reports suggested that δ13C signal, 14C age, and DBC spatial pattern support a significant removal of riverine BC in coastal seas (Wagner et al., 2019; Qi et al., 2020; Fang et al., 2021). Available studies have shown that two pathways are responsible for the removal of BC in the ocean. One is photochemical degradation, especially for the condensed aromatic molecular structures (Ziolkowski and Druffel, 2010). This process is proved by in situ seawater incubation experiments on DBC (Stubbins et al., 2012; Ward et al., 2014) and the decrease in DBC with depth in the euphotic zone (Fang et al., 2017). The other removal mechanism is the sinking of PBC, which has been reported in different marine environments, such as the Gulf of Maine (Flores-Cervantes et al., 2009), the western Arctic, and Subarctic Ocean (Fang et al., 2016), and Jiaozhou Bay (Feng et al., 2021). Yet, future research is needed to better understand the fate of BC in the ocean, especially regarding the quantification of the magnitude of the removal of BC from the water column.
Since the riverine BC is first discharged into the marginal seas, it is crucial to assess the fate and transport pathways of BC in the marginal seas and thus the cycling of BC in the ocean (Yang and Guo, 2014; Fang et al., 2017). As an important removal process of BC, knowledge about the sinking of PBC would provide insights into the role of BC in transporting carbon from the surface ocean to the deep ocean. As a refractory and photolabile fraction of BC (Stubbins et al., 2012; Fang et al., 2017), the soot was found to distribute widely in shelf sediments (Lohmann et al., 2009; Yang and Guo, 2018). Thus, it is probable that shelf/slope might be of importance for assessing the removal of soot in marine environments. Additionally, soot has been reported as a fraction of particulate organic carbon (POC; Flores-Cervantes et al., 2009; Yang and Guo, 2014; Fang et al., 2016). Investigations on soot, including its abundance and export, should improve our understanding of POC dynamics in the oceans.
The South China Sea (SCS) is the largest marginal sea in the western Pacific Ocean (Chen et al., 2001), which is surrounded by the BC emission hotspots of the world in Southeast Asia countries (Hu et al., 2016). Asia emits more than 1/3 of the global BC (Jurado et al., 2008; Bond et al., 2013). With the prevailing of the Asian monsoons (Wang et al., 2014; Zhang et al., 2016), the SCS is expected to be an important BC reservoir. In this study, the soot was measured along with 210Po and 210Pb in the northeastern SCS. Our objectives are to (i) examine the abundance and vertical distribution of soot on the slope of the northeastern SCS; (ii) evaluate the export of soot from the euphotic zone to the mesopelagic water and the fate of soot in the SCS; and (iii) explore the potential application of soot to constrain the POC flux in the marginal sea.
Materials and Methods
Study Area
The main current on the northern SCS shelf flows northeastward and the surface current flows southwestward in the northern basin during summer. Internal solitary waves often introduce the bottom nepheloid layer (BNL) on the northern shelf (Zhang et al., 2014) and the intermediate nepheloid layer (INL) on the slope (Jia et al., 2019). Both the BNLs and INLs result in higher particulate matter concentrations in the mesopelagic layer than the euphotic zone in the SCS (Ma et al., 2017; Zhang et al., 2019) and a large amount of shelf-derived sedimentary matter to the basin (Shih et al., 2019). Particles in the widely extended nepheloid layer over the shelf-slope area of the northern SCS are mainly from sediment resuspension (Zhang et al., 2014; Jia et al., 2019). Owing to the variability in the hydrodynamic conditions, the nepheloid layer also showed significant spatiotemporal variability as observed at different depths during different cruises (Zhang et al., 2019). The C9 station is located on the northeastern SCS slope with a depth of 1,369 m (Figure 1). Salinity distributions show complex variability in the upper 100 m (Figure 1). The mixed layer of about 30 m (Figure 1) is consistent with previous observations during summer in the north SCS (Cai et al., 2015), corresponding to the shallow stratification in summer.
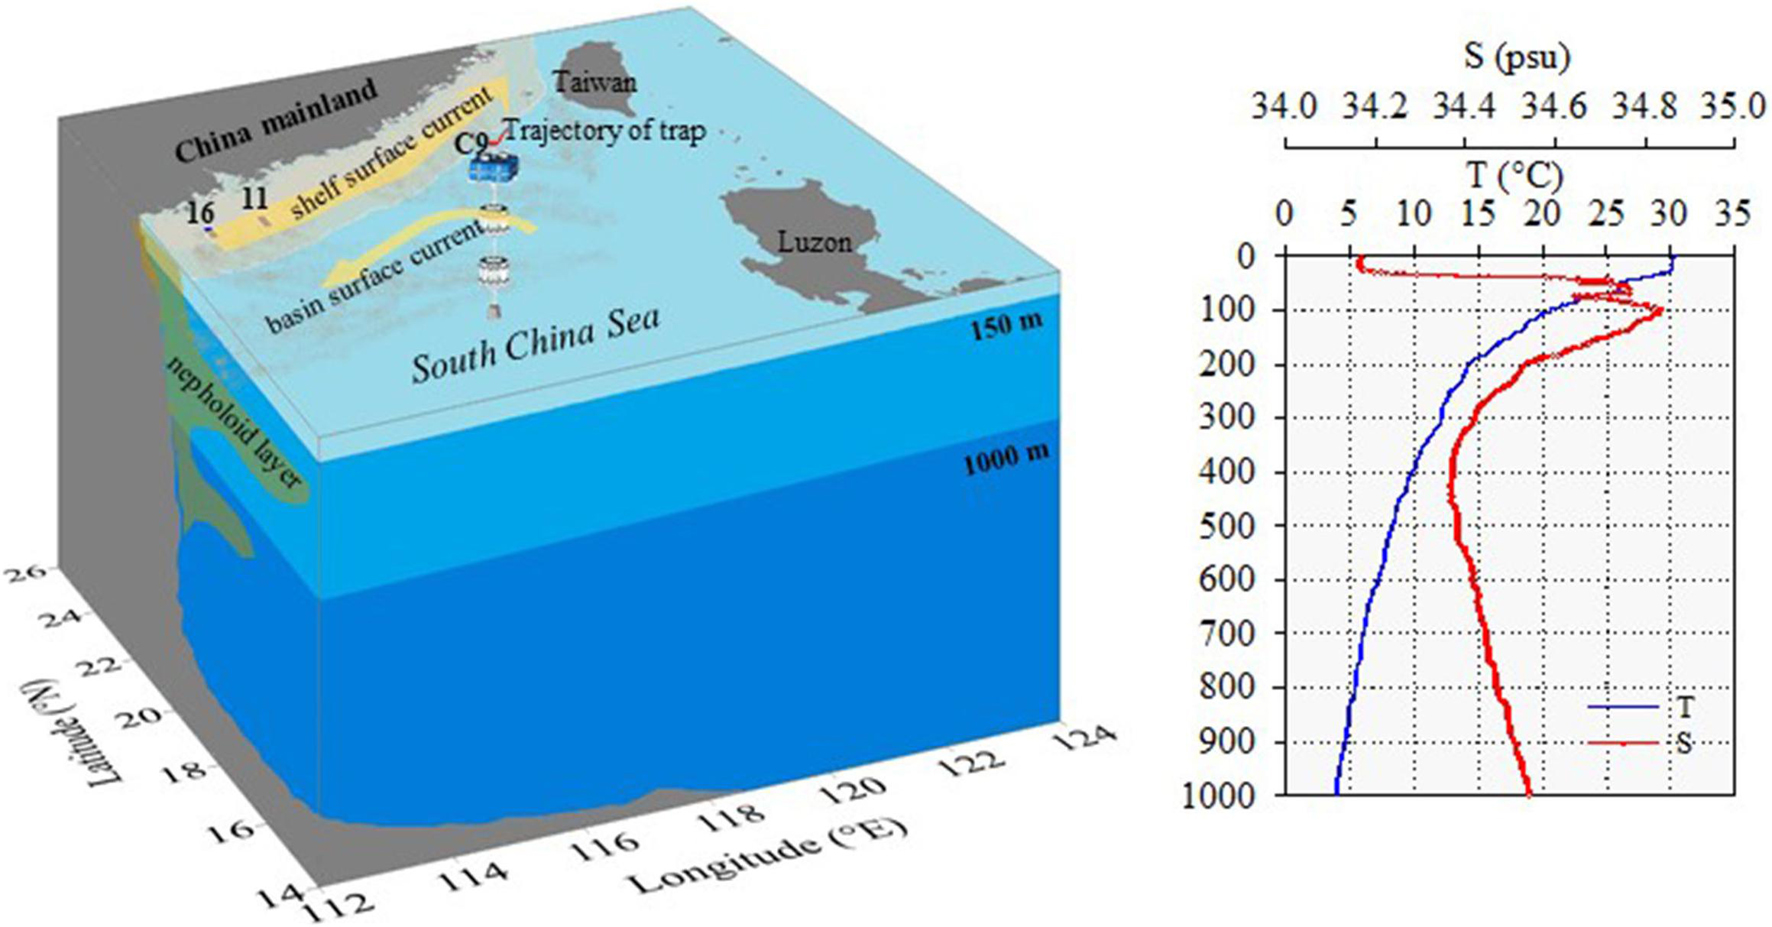
Figure 1. Sampling locations for seawater samples (C9), sediment trap samples (C9), and surface sediments (Stations 11 and 16) in the northeastern South China Sea (left) and the distributions of temperature and salinity at station C9 (right). The green shade represents the dispersion of resuspended sediment along the slope below the euphotic zone. The yellow arrows highlight the surface currents in the northern SCS during sampling.
Sampling
Seawater samples at different depths were collected at station C9 (Figure 1) using Niskin bottles attached to a conductivity, temperature and depth (CTD)-rosette system aboard the R/V Yanping for the measurements of 210Po, 210Pb, soot, and POC on August 8, 2016. In addition, a floating sediment trap having a cylindrical cup with an internal diameter of 95 mm was deployed for 72 h (August 9–12, 2016) to collect sinking particles at 50 and 200 m for 210Po and POC measurements. The cup was filled with brine with a salinity of 52 psu, prepared by freezing filtered SCS surface water (0.2 μm pore size). Mercury bichloride was added as a biocide. Owing to limited particles from the sediment trap, the soot was not measured. Surface sediments were sampled using a box core sampler at two stations (Stations 11 and 16) on the northern SCS shelf on March 28, 2014 (Figure 1) for the measurements of soot and sedimentary organic carbon (SOC).
210Po and 210Pb Analyses
For the measurements of 210Po and 210Pb, 10 L of seawater from each depth was filtered through a polycarbonate membrane (IsoporeTM) with 0.4 μm pore size to separate >0.4 μm particulate matter from dissolved phases. Analyses of 210Po and 210Pb in the <0.4 μm filtrate and >0.4 μm particulate samples were based on the widely used protocols (Church et al., 2012; Rigaud et al., 2013) and elaborated in our previous works (Yang et al., 2013; Ma et al., 2017), which would enable our results to compare with most of the published data. In brief, filtrate samples, after adding accurately known amounts of 209Po and stable Pb (PbNO3) as the chemical yields of 210Po and 210Pb isotopes, respectively, were kept for 24 h to reach the isotopic distribution equilibrium. Then, the samples were adjusted to pH = 8.0 with ammonium hydroxide to form Fe(OH)3 precipitate. The precipitate was allowed to settle overnight and collected via centrifugation and decanting the overlying water. Then, the precipitate was redissolved in 0.5 mol L–1 HCl solution. After adding ascorbic acid, hydroxylamine hydrochloride, and sodium citrate, Po isotopes including 209Po and 210Po were plated on a silver disk at 90°C for 4 h under stirring. The air-dried silver disk was counted using alpha-spectrometry (ORTEC). Particulate samples were digested with mixed HNO3-HClO4-HF after adding 209Po and stable Pb, evaporated and redissolved in 0.5 mol L–1 HCl solution. The plating of Po on the silver disk was the same as that for dissolved samples. 210Pb was determined via 210Po more than 1.5 years later after the first plating.
The sediment trap collected particles were filtered through a mesh with 1,000 μm pore size to remove swimmers and zooplankton. Then, one aliquot of the small particles was collected on a polycarbonate membrane for 210Po and 210Pb measurements, and the treatment was the same as the particulate fractions. The other aliquot was collected on a quartz microfiber filter (QMA) filter for POC measurements. The recoveries of 209Po and stable Pb for dissolved samples varied from 84 to 94% and from 85 to 93%, respectively. They were more than 95% for particulate samples including trap samples. The counting errors were always <±8%. The uncertainties for all data presented in the study were propagated from the counting errors by incorporating detector backgrounds, reagent blanks, and membrane blanks. The activities of 210Po and 210Pb were corrected back to the sampling time.
Total Particulate Matter Analysis
For the measurements of total particulate matter (i.e., TPM), along with soot, and POC, 30–48 L of seawater were collected from each depth except the 500 and 1,000 m depths, where only 5 L of seawater were available and were used for POC measurements. Particles were filtered onto a pre-combusted (at 450°C) QMA filter (WhatmanTM) and de-salted with Milli-Q water. Particulate samples were stored at −18°C. In the land laboratory, these filter samples were dried at 60°C to a constant weight to determine the TPM contents based on the difference in weight between blank filters and filters with TPM.
Particulate Organic Carbon and Soot Analyses
For the measurements of POC, the samples were fumigated using concentrated HCl to remove inorganic carbon. The total POC content (including soot and autochthonous POC) was measured on an aliquot of the filter sample using an elemental analyzer (Thermo Fisher Scientific, 1112). An aliquot of the filter samples was used to determine soot using the chemoThermal oxidation (CTO)-375 method (Gustafsson et al., 1997, 2001). This method has been proved to effectively quantify soot in sediment (Elmquist et al., 2004; Lohmann et al., 2009) and TPM samples (Yang and Guo, 2014; Fang et al., 2016). In brief, decarbonate filters were combusted at 375°C in the presence of air for 24 h to remove organic carbon except for soot. Then, the soot left on the filters was measured using the same elemental analyzer, as described for POC. The standard material used for POC and soot was international atomic energy agency (IAEA)-C8. The soot and SOC in sediments were measured using procedures described elsewhere (Yang and Guo, 2018). Briefly, the sediment was treated with HCl solution to eliminate carbonate and dried at 60°C. Then, an aliquot of samples was used to measure SOC. The other aliquot of sample was combusted using the same procedures as particulate samples to remove non-soot SOC in sediments. The soot was measured in a manner similar to particulate samples. The National Institute of Standards and Technology (NIST) standard 1941b was measured as samples to ensure data quality. The obtained soot and SOC contents in the standards agree well with previous reports on 1941b (e.g., Gustafsson et al., 2001; Louchouarn et al., 2007; Yang and Guo, 2014).
Results
The soot concentrations measured along the water column varied from 0.064 to 0.165 μmol-C L–1 (Table 1) with an average of 0.110 ± 0.036 μmol-C L–1 (mean ± SD). Overall, the soot concentrations did not show an increase or decrease trend within the upper euphotic zone (0–75 m), though they had a fluctuation. From 75 m to the euphotic base (150 m), the soot contents showed a quick decline (Figure 2A). However, an increasing trend with depth in the soot contents was observed below 200 m, increasing from 0.064 μmol-C L–1 at 200 m to 0.090 μmol-C L–1 at 800 m (Table 1). The soot contents were 0.25 mg g–1 and 0.17 mg g–1 at Stations 11 and 16, respectively.
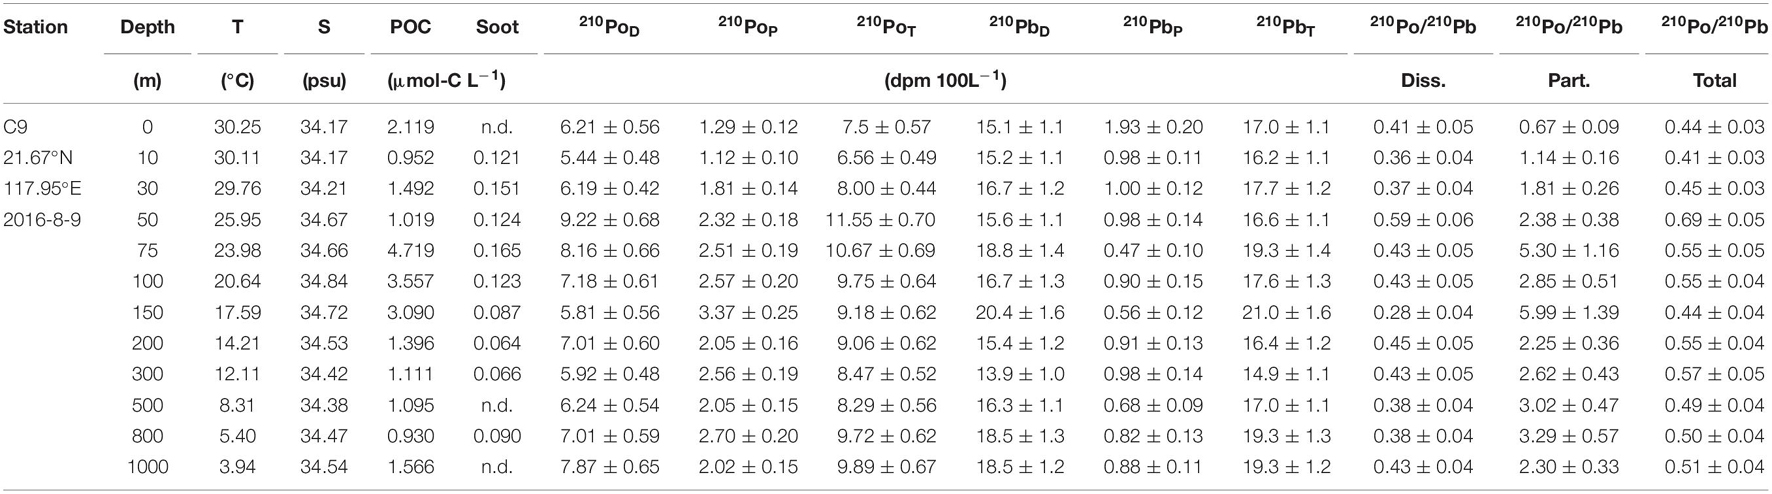
Table 1. Temperature, salinity, concentrations of soot and the total particulate organic carbon (POC), activity concentrations of dissolved 210Po, 210Pb, and particulate 210Po, 210Pb.
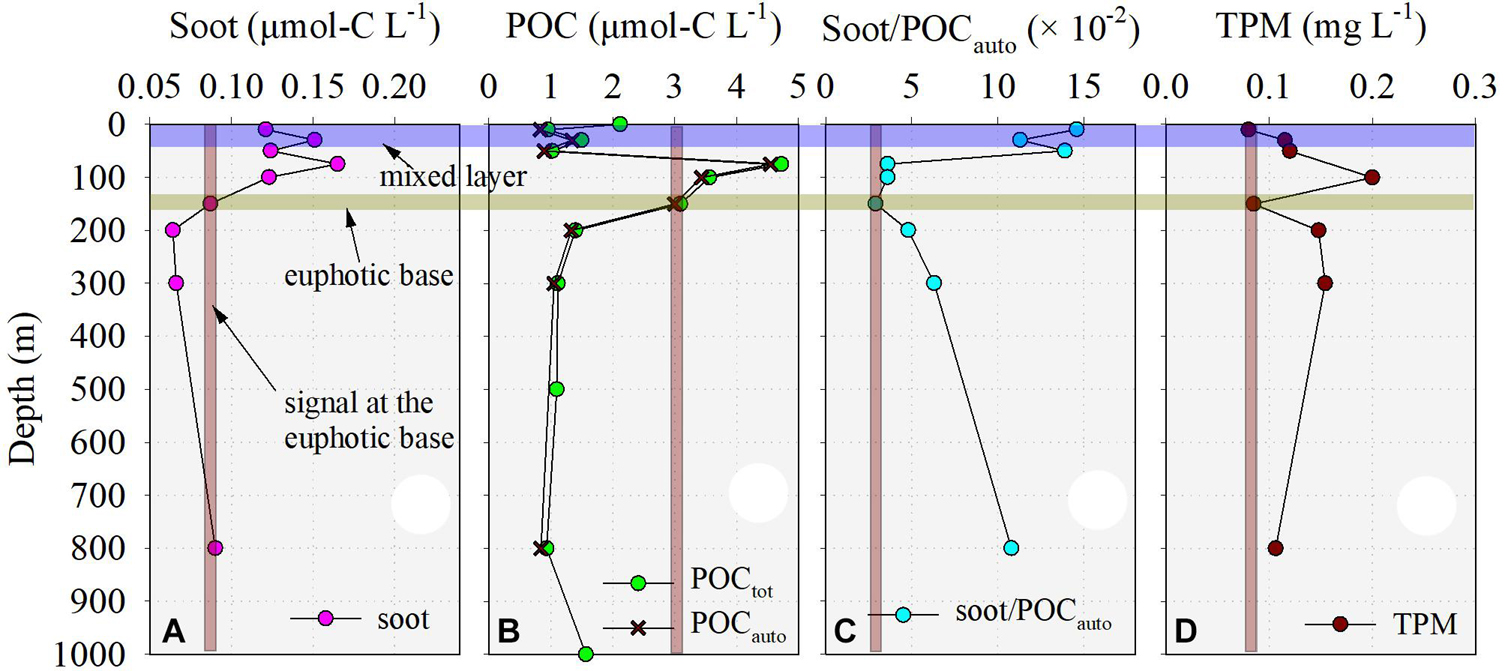
Figure 2. Vertical distributions of soot (A), total particulate organic carbon (POC) (i.e., POCtot), autochthonous POC excluding soot (i.e., POCauto) (B), soot/POCauto ratio (C), and total particulate matter (TPM) (D) at station C9 on the slope of the northeastern South China Sea.
The total POC (POCtot) concentrations in seawater samples varied from 0.93 to 4.72 μmol-C L–1, averaging 1.92 ± 1.22 μmol-C L–1 (Table 1). Similar to soot, POCtot showed little variation in the surface mixing layer (Figure 2B). The maximum of POCtot concentration occurred at 75 m, corresponding to summer Chl-a maximum in the northern SCS (Cai et al., 2015). Within the lower euphotic zone, POCtot showed a rapid decrease from 4.72 to 3.09 μmol-C L–1 (Figure 2B). Between 200 and 800 m, nearly constant POCtot concentrations were observed, followed by an increase from 0.930 μmol-C L–1 at 800 m to 1.566 μmol-C L–1 at 1,000 m. The POCtot contents on the trap-collected particulate matter were 9.12 μmol-C mg–1 and 3.66 μmol-C mg–1 at 50 and 200 m, respectively. The SOC contents in surface sediment were 2.54 mg g–1 and 1.66 mg g–1 at Stations 11 and 16, respectively.
The TPM concentrations varied from 0.08 to 0.20 mg L–1 with an average of 0.13 ± 0.04 mg L–1 (Figure 2D). In general, the vertical distribution of TPM followed that of POC in the euphotic zone, showing a dominant biological source of particulate matter. Notably, TPM and soot, both showed increases below the euphotic base (Figure 2D), with a TPM concentration of about 50% higher than the average at 150 m (0.09 mg L–1).
The total 210Po and 210Pb activity concentrations varied from 6.56 to 11.55 dpm 100L–1 and from 14.89 to 21.00 dpm 100L–1, respectively (Table 1), averaging 9.05 ± 1.39 dpm 100L–1 and 17.70 ± 1.72 dpm 100L–1. The total 210Po/210Pb ratio ranged from 0.40 to 0.69, pointing to obvious deficits of 210Po with respect to 210Pb in the study area. Our results are consistent with those previously reported deficits of 210Po for both the euphotic zone (Yang et al., 2009; Wei et al., 2011) and the mesopelagic water in the SCS (Wei et al., 2014; Ma et al., 2017). Although the Fe(OH)3 coprecipitation method may lead to artificially low 210Po concentrations, hence overestimating 210Po deficits relative to 210Pb (i.e., overestimating 210Po fluxes) (Roca-Martí et al., 2021), the increases with the depth of soot, TPM, and POCtot concentrations (Figure 2) indicate that the 210Po deficits in the study site are clearly impacted by sediment-derived particulate matter in the mesopelagic waters. The 210Po activities on trap-collected particles were 0.160 dpm mg–1 and 0.056 dpm mg–1 at 50 and 200 m, respectively. The 210Pb activities were somewhat lower than 210Po with the values of 0.035 dpm mg–1 and 0.045 dpm mg–1, respectively, corresponding to their difference in particle reactivity between 210Po and 210Pb.
Discussion
Abundance and Distribution of Soot in the Northeastern South China Sea
To date, only limited soot data are available for seawater. As reported in previous studies, the soot concentrations varied from 0.004 to 0.233 μmol-C L–1 in the upper 60 m water column in the northern Gulf of Mexico (Yang and Guo, 2014), and from 0.008 to 0.080 μmol-C L–1 in surface waters of the Bering Shelf and Chukchi Sea (Fang et al., 2016). On average, the soot concentration in the euphotic zone of the SCS (avg. 0.129 ± 0.027 μmol-C L–1, Table 1) was higher than both the Gulf of Mexico (avg. 0.050 ± 0.070 μmol-C L–1, n = 14) (Yang and Guo, 2014) and the western Arctic and Subarctic Oceans (avg. 0.027 ± 0.020 μmol-C L–1, n = 18) (Fang et al., 2016). High soot concentration average of 0.39 ± 0.31 μmol-C L–1 (n = 38) was also reported on the shelf of the Gulf of Maine (Flores-Cervantes et al., 2009). These limited studies reflect the significant influence of nearby anthropogenic emissions on the abundance of soot in surface waters. Two studies indicate that soot concentration significantly decreases from the shore within a distance of 100 km (Flores-Cervantes et al., 2009; Yang and Guo, 2014). Thus, fluvial discharged soot would mostly settle into sediments close to the shore. In open water, the atmospheric deposition probably determines the abundance of soot in surface oceans. The soot concentrations varied from 0.064 to 0.090 μmol-C L–1 below 200 m in the SCS (Table 1), which were much higher than 0.005–0.008 μmol-C L–1 observed in the mesopelagic water of the northern Gulf of Mexico (Yang and Guo, 2014). Thus, the northern SCS could be characterized as a region with more abundant soot compared with other open marine environments. The hotspots of BC emissions are expected to be responsible for the higher soot in the SCS. Indeed, the countries rounding the SCS contributed more than one third of the global BC emissions (Bond et al., 2013). Wet precipitation delivers large amounts of BC to the SCS (Mari et al., 2019). In addition, previous studies have shown that the higher DBC concentrations in the upper 100 m of the SCS (avg. 0.97 ± 0.22 μmol-C L–1, n = 79) (Fang et al., 2017) compared to those observed in Prydz Bay, Antarctica (0.75 ± 0.26 μmol-C L–1, n = 17, Fang et al., 2018) should largely result from the enhanced emissions around the SCS.
The vertical distribution of soot, to a certain degree, revealed geochemical processes influencing the cycling of soot in the SCS (Figure 2A). In the upper water column, fluctuations in the soot concentration were mainly confined in the upper 50 m (Figure 2), probably due to water mixing processes mainly within the mixed layer. This view is further supported by the small variations in the POCtot concentration, TSM concentration, and the soot to POCtot ratio (Figure 2). By contrast, the soot exhibited a rapid decrease from 75 to 200 m (Figure 2A), potentially due to quick removal via photochemical degradation and/or sinking (Stubbins et al., 2012; Feng et al., 2021). This layer, characterized by the steep temperature and salinity gradients as shown in Figure 1, largely prevented the vertical mixing of seawater with different soot concentrations. Below the euphotic base, soot concentrations increased with depth like the case of TPM (Figures 2A,D). An increase in POC concentration was also observed between 800 and 1,000 m (Figure 2B). These results implied additional particulate matter sources in addition to those from the overlying water column. Coppola et al. (2014) suggested that resuspended old sediment BC may contribute to the sinking POC in the North Pacific as supported by the 14C age of BC, highlighting the redistribution mechanism of BC after sedimentation in the ocean. Our recent study indicated that shelf/slope sediments account for 0.22–9.0 g m–2 d–1 particle fluxes out of the 700–1,000 m in the SCS (Ma et al., 2017). The occurrence of clay minerals in sediment traps and higher diatom flux in the deeper sediment traps also provided evidence for the dispersion of resuspended sediments into the SCS basin (Ran et al., 2015; Schroeder et al., 2015). Mechanistically, internal solitary waves result in the resuspension of the shelf and slope sediments (Zhang et al., 2014; Jia et al., 2019). Then, the resuspended particles lead to higher TPM content in the water column (Zhang et al., 2014) and extra flux below the euphotic zone in the SCS (Lahajnar et al., 2007; Gaye et al., 2009; Liu et al., 2014; Shih et al., 2019). Thus, shelf/slope sediments are also a source of soot in the mesopelagic waters of the northern SCS.
210Po-Derived Export Flux of Soot
Sinking is an important removal pathway of soot from the water column (Flores-Cervantes et al., 2009; Fang et al., 2016). In this study, the disequilibrium between 210Po and 210Pb was used to quantify the sinking flux of soot. The widely used mass-balance model for 210Po (Bacon et al., 1976) was adopted by incorporating advection and diffusion processes. In general, except for upwelling and mesoscale eddy, vertical advection and horizontal diffusion terms are far smaller than vertical diffusion and horizontal advection (Liang et al., 2014). Thus, we only considered the horizontal advection and vertical diffusion. Briefly, the variation of 210Po with time can be expressed as:
where IPoT and IPbT are the inventories of the total 210Po and 210Pb from surface to the export depth (in dpm m–2). λPo is the decay constant of 210Po (0.0050 d–1). U and kz denote the horizontal advection velocity in cm s–1 and vertical diffusive coefficient in cm2 s–1. ∂IPoT/∂x and ∂APoT/∂z represent the gradient of inventory and activity of 210Po, respectively. FPo is the export flux of 210Po (in dpm m–2 d–1). At a steady state, the export flux of 210Po becomes:
Due to the lack of horizontal gradient of 210Po in our study, we could not specifically assess the advection flux at the sampling station. However, we used available data collected during August in the north SCS (Ma et al., 2017) to estimate the influence of advection because these data exhibit a similar deficit of 210Po in the mesopelagic SCS. The mean velocities are 15 cm/s in the upper 200 m and 10 cm/s at 500 m during summer in the study area (Gan et al., 2006), where 210Po data have been reported (Ma et al., 2017). The calculated advection fluxes of 210Po account for 17 ± 21% and 23 ± 11% of the fluxes at the euphotic base and the mesopelagic bottom, respectively. The estimates indicate that our results ignoring the advection term would, to a certain extent, lead to higher 210Po fluxes at both the euphotic and mesopelagic bases. This overestimate is also propagated to soot flux calculation. In the future, the current-oriented sampling strategy should refine the advection influence. Neglecting advection fluxes will have less of an influence on the application of the soot-210Po coupling to constrain the contribution of soot and POC from the sediments. On the one hand, 210Po fluxes were overestimated by comparable magnitude at the euphotic and mesopelagic bases. Subtracting the advection term largely eliminates the overestimates. On the other hand, the 210Po flux in the mesopelagic water was much higher than 117% (i.e., flux including the influence of advection of 17%) of its flux at the euphotic base. Thus, neglecting advection fluxes will not influence our conclusions. In our study, the vertical gradients of 210Po activity were 0.241 dpm m–4 at the euphotic base and 0.009 dpm m–4 at the mesopelagic bottom. In the upper SCS, the diffusive coefficient ranges from 10–4 to 10–5 m2 s–1 even though it could reach 10–3 m2 s–1 in the mid-deep water (Wang et al., 2019). Overall, the estimated diffusive fluxes of 210Po account for <3.1% of the results obtained when neglecting advection and diffusion processes. Thus, the diffusivity of 210Po should not significantly influence our results.
Using the same export model Eq. (2) and also neglecting the advection and diffusion terms, Wei et al. (2014) found that 210Po-derived POC fluxes were comparable to those derived from the floating trap during July–October at the South-East Asian Time-series Study (SEATS) station. The same observations were also applied to carbonate and particulate nitrogen fluxes (Wei et al., 2014). This comparability lent support to the validity of the 210Po/210Pb model in the study area between July and October. In addition, a previous study conducted in our study area that used 234Th/238U tracer showed that when considering vertical and horizontal transport in a 3-D model, the results were unreasonable due to poorly constrained model parameters, whereas when using the 1-D Steady State model, such as the one used in this study, they obtained better results (Cai et al., 2015). Thus, we consider that the 1-D 210Po/210Pb model is currently the best option to constrain particle dynamics in our study.
The export flux of soot (F_soot) was calculated using FPo multiplied by the soot to 210PoP ratio (in mmol-C dpm–1), i.e.,
where PoP is the activity concentration of particulate 210Po.
Since 210Po showed deficits with respect to 210Pb from surface to 1,000 m, particles sinking out of the shallow layer are assumed to be responsible for the deficits in deeper layers. Accordingly, the inventories are calculated using trapezoidal integration, with surface and export depths as the upper and lower boundaries. The export flux of soot out of the euphotic zone (at 150 m) was 0.172 ± 0.016 mmol-C m–2 d–1 (Table 2), which is much lower than that of 2.28 mmol-C m–2 d–1 reported on the shelf of the Gulf of Maine (Flores-Cervantes et al., 2009) and much higher than 0.041–0.097 mmol-C m–2 d–1 observed on the Chukchi-Bering Shelf (Fang et al., 2016). Due to the contribution of resuspended sediment from the shelf/slope region to the depth below the euphotic zone, the soot export fluxes were indeed higher than that measured within the euphotic zone, varying from 0.282 ± 0.026 mmol-C m–2 d–1 to 1.13 ± 0.10 mmol-C m–2 d–1 (Figure 3A).
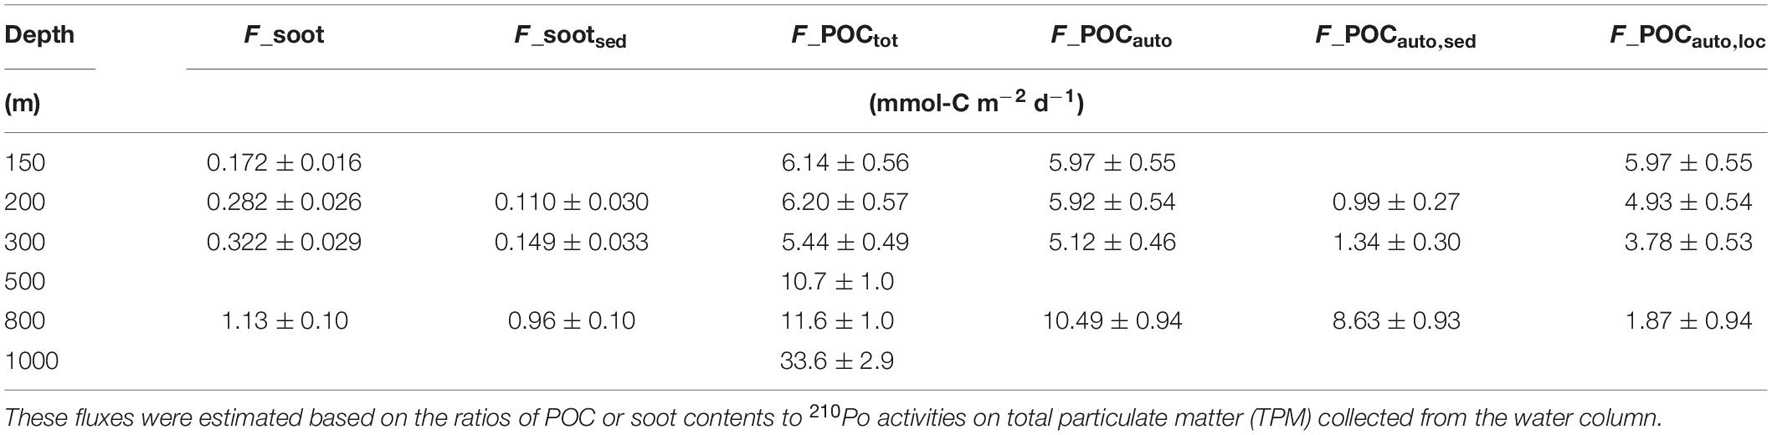
Table 2. The export fluxes of total POC (F_POCtot) and soot (F-soot), autochthonous POC (i.e., soot-excluded POC, F_POCauto), sediment contributed soot flux (F_sootsed) and autochthonous POC (F_POCauto,sed), and autochthonous POC contributed by local ecosystems in the euphotic zone (F_POCauto,loc).
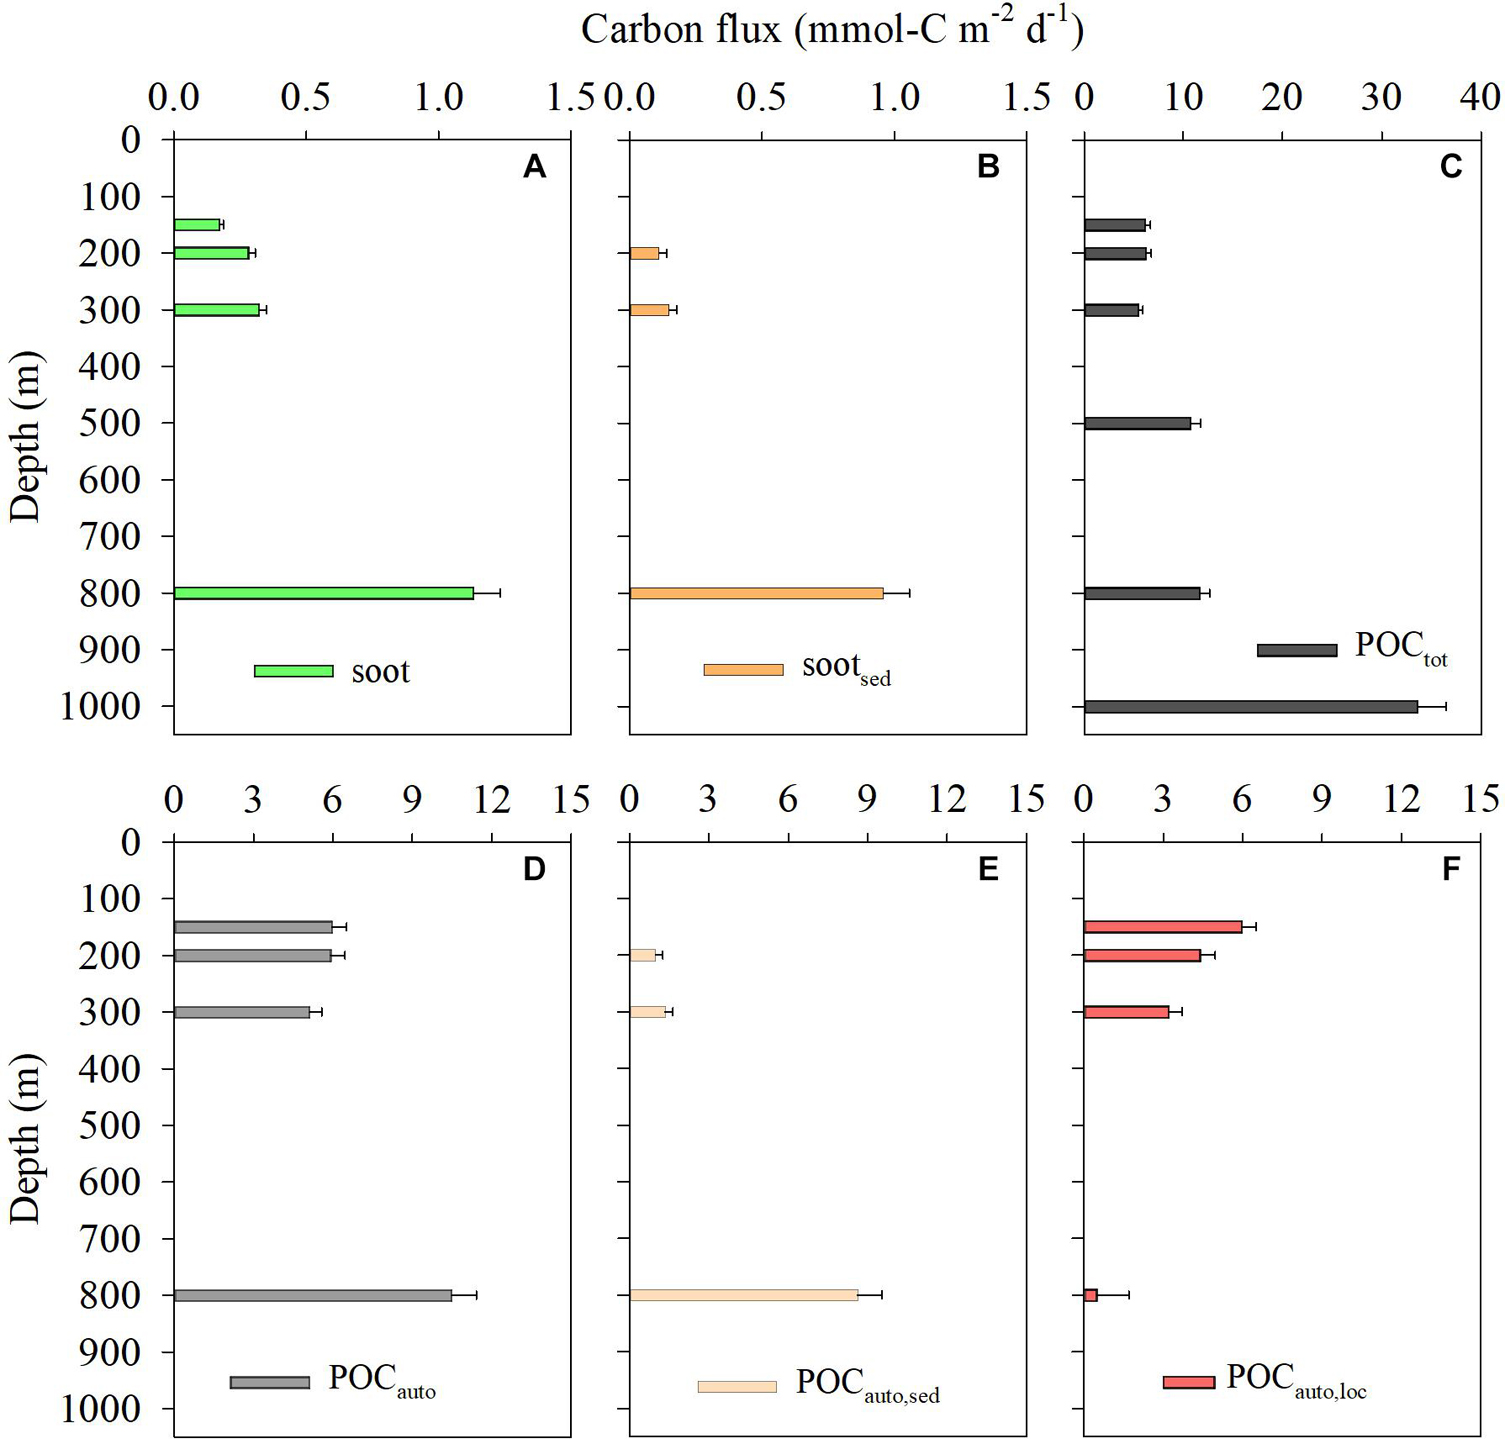
Figure 3. Variations of POC and soot fluxes contributed by POC and soot from various pathways: (A) 210Po-derived total soot fluxes, (B) sediment-contributed soot fluxes (sootsed), (C) POCtot fluxes, (D) marine biogenic POC (autochthonous POC) (i.e., soot-excluding POC) (POCauto), (E) sediment-contributed POCauto fluxes (POCauto,sed), and (F) POC fluxes from local euphotic zone (POCauto,loc).
Below the euphotic zone or in the twilight zone, the soot might experience little photolysis, as was supported by the conservative behavior of DBC in the mesopelagic layer of the SCS (Fang et al., 2017). Thus, soot flux would remain constant in the twilight zone if there is no sediment-derived soot or the sinking velocity of soot is constant. The increase in the concentration of both TPM and soot (Figure 2) directly supports the contribution of sediment to the elevated soot flux in the mesopelagic zone at the study site. There is no available sinking velocity of particles in the SCS for assessing its influence on soot flux. The increased sinking velocity of particles with depth was observed in several areas (Villa-Alfageme et al., 2016). If this is true in the study area, the flux of soot (estimated using the velocity multiplied by the concentration) would increase even if the soot concentration does not vary. Thus, the increased soot fluxes in this study may include the effect of the sinking velocity, representing the upper limit of the sediment-contributed soot (i.e., F_sootsed,i), which can be estimated by:
where F_sooti denotes the total soot flux at a specific depth below 150 m, and F-soot150 is the flux at 150 m, i.e., the euphotic base.
The sediment-derived soot fluxes were estimated to be 0.110 ± 0.030 mmol-C m–2 d–1 at 200 m, 0.149 ± 0.033 mmol-C m–2 d–1 at 300 m, and 0.96 ± 0.10 mmol-C m–2 d–1 at 800 m (Table 2). Owing to the sediment addition at different depths (Liu et al., 2014; Jia et al., 2019) and the refractory nature of the soot (Yang and Guo, 2018), the soot flux showed an accumulated effect from the euphotic base to the mesopelagic bottom (Figure 3B). In the upper twilight zone (200 and 300 m), sediment contribution accounted for 39–46% of the total soot flux, indicating a significant process for the total soot pool in the SCS interior. Near the mesopelagic bottom at 800 m, sediment-sourced soot accounted for as high as 85% of the total flux. It is obvious that, besides the atmospheric deposition, shelf/slope sediment resuspension is the most relevant process influencing the soot budget in the mesopelagic SCS.
Application of 210Po-Soot Coupling to Constrain Particulate Organic Carbon Export Flux
Particulate organic carbon flux attenuation in the ocean interior is used to constrain the biological pump efficiency at a depth, i.e., the ratio of POC flux at each specific depth in the mesopelagic zone to that at the euphotic zone base (Martin et al., 1987; Buesseler et al., 2007; Chen et al., 2018). In this study, flux attenuation was used to express the variability of local biogenic POC (excluding soot and sediment-derived autochthonous POC) flux with depth in the study area. Appling Eq. (3) using the POC/PoP ratios measured on bottle-sampled TPM, the export fluxes of POCtot were estimated (Figure 3C). The POCtot/210PoP ratio for bottle-sampled TPM was comparable to that of the sediment-trap sample below the euphotic zone (i.e., 200 m), though a little difference was observed at 50 m (Figure 4). Due to the lack of trap sample at most depths, the POC/PoP ratios on bottle-sampled TPM were thus used to calculate the fluxes of POC to facilitate the comparison of POC fluxes at different depths. The POCtot varied from 5.44 ± 0.49 mmol-C m–2 d–1 to 33.6 ± 2.9 mmol-C m–2 d–1 (Table 2), averaging 12.3 mmol-C m–2 d–1. Notably, the POCtot flux at 200 m was about four times that at 50 m (Figure 4), corresponding to the higher primary productivity in the lower euphotic zone than the upper euphotic zone (Cai et al., 2015).
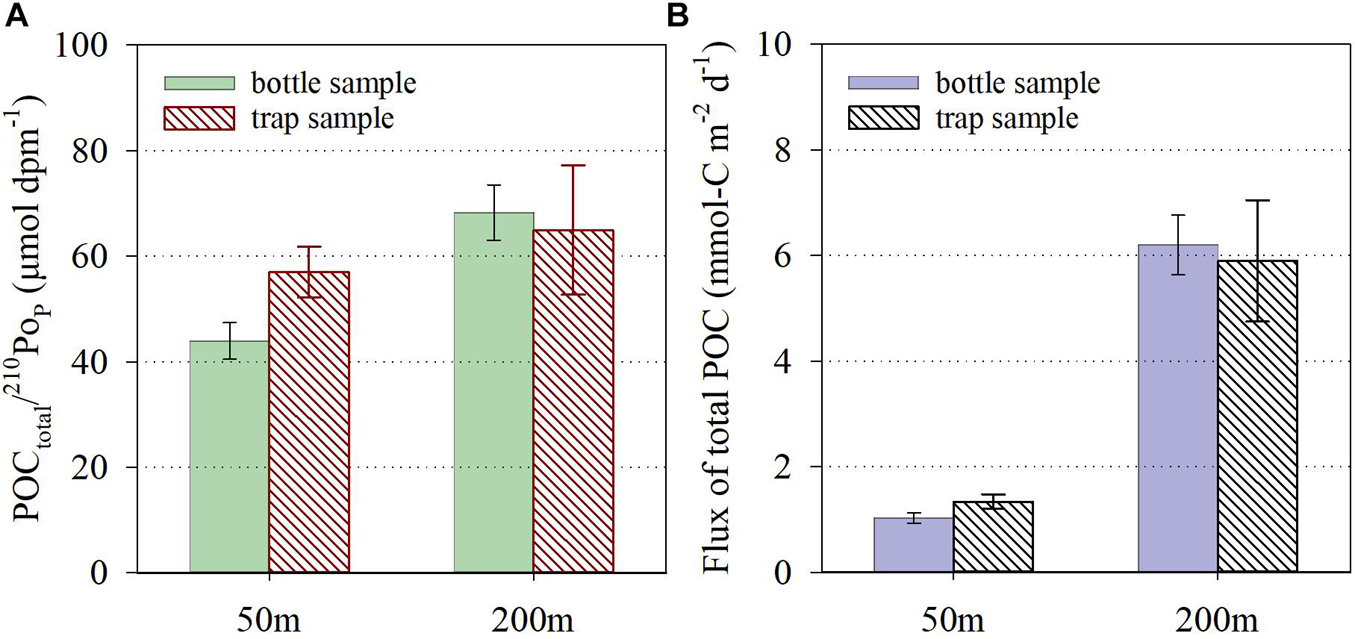
Figure 4. Comparisons in the POC/210Po ratio (A) and estimated total POC flux using 210Po (B) between bottle-sampling TPM and sediment trap-collected particles at 50 and 200 m.
Since the soot is mostly of terrestrial origin (Gustafsson et al., 2001; Yang and Guo, 2018), the autochthonous POC (POCauto) includes POCauto,loc from the local euphotic zone and POCauto,sed from the sediment, but excludes the soot. The calculated POCauto fluxes ranged from 5.12 ± 0.46 mmol-C m–2 d–1 to 10.49 ± 0.94 mmol-C m–2 d–1 (Table 2). In addition, the POCauto,loc flux out of the euphotic zone (5.97 ± 0.55 mmol-C m–2 d–1) was comparable to 4.0 ± 1.6 mmol-C m–2 d–1 (n = 10) previously reported for the adjacent region in the same season (Cai et al., 2015), also supporting the validity of the 210Po/210Pb model.
Below the euphotic base, the POCauto flux showed an increasing trend as observed for the flux of soot (Figure 3D). Obviously, the shelf/slope sediment contributed POCauto to the mesopelagic SCS. Based on the fact that POCauto,sed and soot were concurrently resuspended, the 210Po-derived F_sootsed and the SOC/soot ratio in surface sediments were used to estimate the POCauto,sed contribution to POCauto flux, i.e.,
where F_POCauto,sed,i and F_sootsed,i denote the fluxes of F_POCauto,sed and F_sootsed at the specific i depth, respectively. SOC/soot is the ratio of the content of SOC to that of soot in surface sediments. At the two locations where sediment samples were collected (Figure 1), the SOC/soot ratio in surface sediments varied from 9.8 to 10.3%. Here, 10% was adopted for estimating the POCauto,sed contribution. It should be noted that the SOC/soot ratio may be different at different shelf/slope sites, and further measurements are needed to confirm this ratio in other regions.
Based on Eq. (5), the POCauto,sed fluxes were estimated to be 0.99 ± 0.27 mmol-C m–2 d–1 at 200 m, 1.34 ± 0.30 mmol-C m–2 d–1 at 300 m, and 8.63 ± 0.93 mmol-C m–2 d–1 at 800 m (Table 2 and Figure 3E). Thus, the POCauto,loc fluxes in the mesopelagic waters can be calculated by subtracting the POCauto,sed fluxes from the POCauto fluxes. The POCauto,loc flux decreased from 4.93 ± 0.54 mmol-C m–2 d–1 at 200 m to 1.87 ± 0.94 mmol-C m–2 d–1 at 800 m, showing an attenuation from the euphotic base to 800 m like observations in open oceans (Figure 3F).
With the separation of POCauto,loc from POCauto,sed, the first vertical distribution of F_POCauto,loc in the SCS was used to compare the biological pump efficiency between the SCS and other oceanic settings. In the open ocean, the downward flux attenuation of POC is commonly described by the Martin Curve, i.e., Fz/Fz0 = (z/z0)–b (Martin et al., 1987), where b describes the flux attenuation rate. The Martin Curve simulates the profiles of POC flux in the water column, and it has been widely used to evaluate the variability of POC fluxes from the euphotic zone to the deep ocean. By normalizing our 210Po-soot-based F_POCauto,loc to that at 150 m, b is 0.70 ± 0.01 (R2 = 0.9996, p < 0.001) (Figure 5). Martin et al. (1987) first reported b values ranging from 0.64 to 0.97 in the Pacific. Later, 1.33 ± 0.15 and 0.51 ± 0.05 were reported for ALOHA and K2 stations (from the VERTIGO project) (Figure 5; Buesseler et al., 2007). At station BATS (online data and Lutz et al., 2002), b was 0.83 ± 0.04 (Figure 5) and the global mean value was 0.9–1.0 (Kwon et al., 2009). Our result observed in the oligotrophic SCS is comparable to that at station BATS. Globally, the SCS showed a low-moderate attenuation coefficient. Previous studies suggested that particle sinking velocity and temperature mainly influence the transport of POC to mesopelagic water (Buesseler et al., 2007; Henson et al., 2015; Le Moigne et al., 2016). Villa-Alfageme et al. (2016) reported valuable average sinking velocities (ASVs) of TPM at station BATS, showing an increase with depth. Considering the similar oligotrophic environments between the SCS and BATS, it is probable that high temperatures in the euphotic zone in the SCS (e.g., >20°C in the upper 100 m, Figure 1) benefits the fast remineralization of slow-sinking particles in shallow water, allowing faster-sinking particles to reach the mesopelagic zone, as observed at BATS (Villa-Alfageme et al., 2016). Owing to limited studies on POC transport in the mesopelagic water in the SCS, extensive studies are needed to elucidate the mechanism controlling the biological pump in the mesopelagic zone of the SCS. Overall, our study indicated that 210Po-soot coupling could provide insights into the POC flux in the mesopelagic zone.
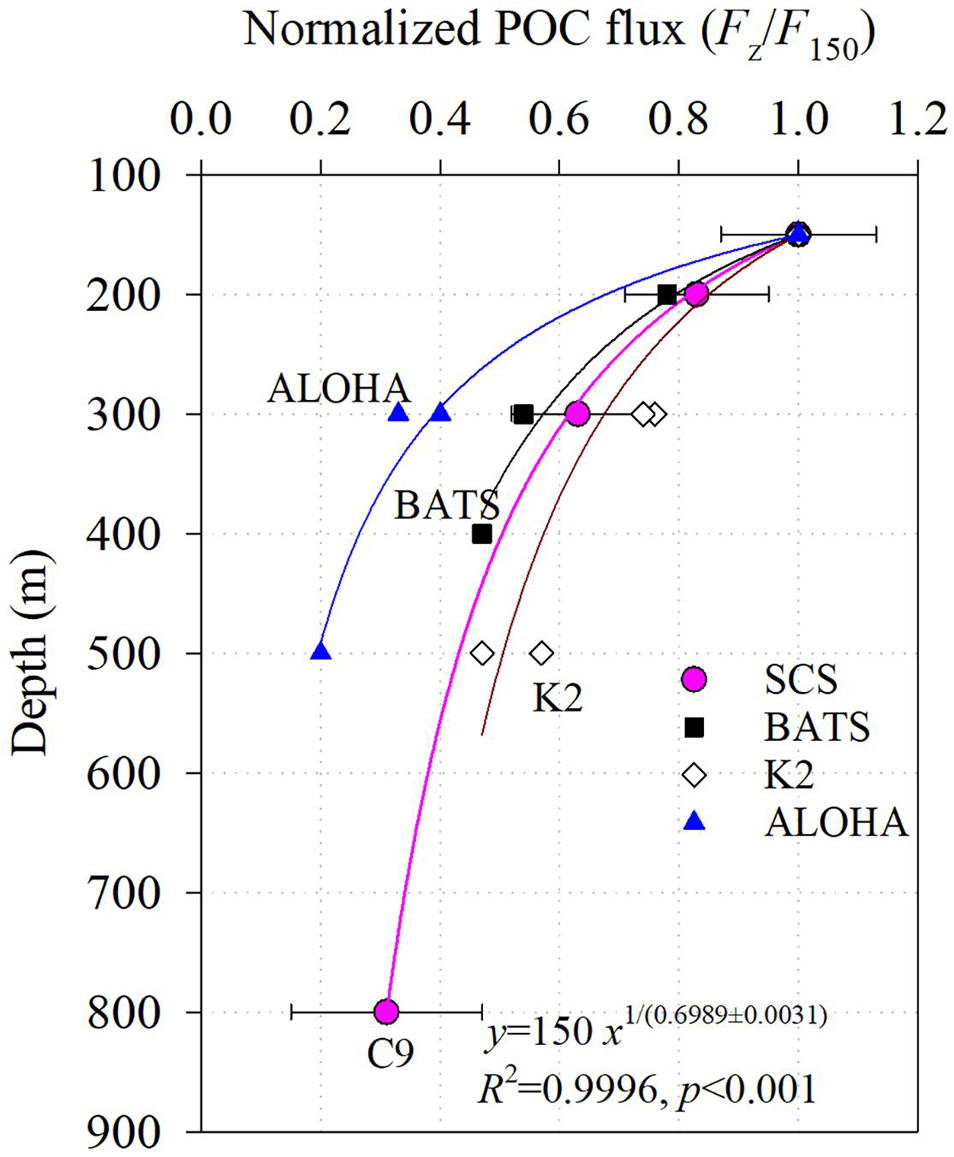
Figure 5. Normalized POC flux to 150 m in the northeastern SCS and comparisons with ALOHA, K2 (Buesseler et al., 2007), and BATS (Lutz et al., 2002). Fittings used the Martin Curve, i.e., F/F150 = (z/150)– b (Martin et al., 1987), F is the flux of autochthonous and local POC (i.e., POCauto,loc) at a depth of z horizon deeper than 150 m, F150 is the flux at 150 m, z is the depth of POC flux below 150 m, and b denotes the constant of flux attenuation.
Concluding Remarks
The abundance and export of soot were first evaluated in the northeastern SCS. The results indicated that several processes affected the geochemical cycling of soot in the marine environment. In the surface mixed layer, water mixing played a predominant role in determining the vertical distribution of soot, showing a homogenized soot concentration. In the lower euphotic zone with steep temperature and salinity gradients, photodegradation processes dominated, resulting in a decrease in soot concentrations with depth until the base of the euphotic zone. Below the euphotic zone, sediment resuspension in the shelf/slope region and lateral transport contributed to the increase in soot abundance and fluxes in the mesopelagic layer. The refractory nature of soot lends support for distinguishing the local soot sinking-flux from the sediment-derived soot flux in the twilight zone. By utilizing soot (terrestrial and bio-resistant in nature) and 210Po-derived POC flux, the local sinking POC flux from the overlying euphotic zone can be separated from the sediment-derived POC. These results revealed the potential application of 210Po-soot coupling to constrain POC fluxes in marginal seas.
Data Availability Statement
The original contributions presented in the study are included in the article/supplementary material, further inquiries can be directed to the corresponding author.
Author Contributions
XZhao, ZF, XZhang, and YQ collected and analyzed the samples. WY conceived and wrote the draft of the manuscript. LG, BH, and MC reviewed and edited the draft of the manuscript. All authors approved the submitted version.
Funding
This study was financially supported by the National Key Research and Development Program of China (2016YFA0601201 to BH) and National Natural Science Foundation of China (42076030 and 41476061 to WY).
Conflict of Interest
The authors declare that the research was conducted in the absence of any commercial or financial relationships that could be construed as a potential conflict of interest.
Publisher’s Note
All claims expressed in this article are solely those of the authors and do not necessarily represent those of their affiliated organizations, or those of the publisher, the editors and the reviewers. Any product that may be evaluated in this article, or claim that may be made by its manufacturer, is not guaranteed or endorsed by the publisher.
Acknowledgments
We thank YQ for his technical assistance during field trap sampling, crew members of the R/V Yanping for their help during sample collection, and three reviewers for their constructive comments that improved the manuscript.
References
Bacon, M. P., Spencer, D. W., and Brewer, P. G. (1976). 210Pb/226Ra and 210Po/210Pb disequilibria in seawater and suspended particulate matter. Earth Planet. Sci. Lett. 32, 277–296. doi: 10.1016/0012-821X(76)90068-6
Bao, H., Niggemann, J., Luo, L., Dittmar, T., and Kao, S.-J. (2017). Aerosols as a source of dissolved black carbon to the ocean. Nat. Commun. 8:510. doi: 10.1038/s41467-017-00437-3
Bond, T. C., Doherty, S. J., Fahey, D. W., Forster, P. M., Berntsen, T., DeAngelo, B. J., et al. (2013). Bounding the role of black carbon in the climate system: a scientific assessment. J. Geophys. Res. Atmos. 118, 5380–5552. doi: 10.1002/jgrd.50171
Buesseler, K. O., Lamborg, C. H., Boyd, P. W., Lam, P. J., Trull, T. W., Bidigare, R. R., et al. (2007). Revisiting carbon flux through the ocean’s twilight zone. Science 316, 567–570. doi: 10.1126/science.1137959
Cai, P., Zhao, D., Wang, L., Huang, B., and Dai, M. (2015). Role of particle stock and phytoplankton community structure in regulating particulate organic carbon export in a large marginal sea. J. Geophys. Res. Oceans 120, 2063–2095. doi: 10.1002/2014JC010432
Chen, C.-T. A., Wang, S.-L., Wang, B.-J., and Pai, S.-C. (2001). Nutrient budgets for the South China Sea basin. Mar. Chem. 75, 281–300. doi: 10.1016/S0304-4203(01)00041-X
Chen, Y., Wu, Z., and Li, Q. (2018). Temporal change of export production at Xisha of the Northern South China Sea. J. Geophys. Res. Oceans 123, 9305–9319. doi: 10.1029/2017JC013619
Cheng, C.-H., Lehmann, J., and Engelhard, M. H. (2008). Natural oxidation of black carbon in soils: changes in molecular form and surface charge along a climosequence. Geochim. Cosmochim. Acta 72, 1598–1610. doi: 10.1016/j.gca.2008.01.010
Church, T. M., Rigaud, S., Baskaran, M., Kumar, A., Friedrich, J., Masqué, P., et al. (2012). Intercalibration studies of 210Po and 210Pb in dissolved and particulate seawater samples. Limnol. Oceanogr. Methods 10, 776–789. doi: 10.4319/lom.2012.10.776
Coppola, A. I., and Druffel, E. R. M. (2016). Cycling of black carbon in the ocean. Geophys. Res. Lett. 43, 4477–4482. doi: 10.1002/2016GL068574
Coppola, A. I., Wiedemeier, D. B., Galy, V., Haghipour, N., Hanke, U. M., Nascimento, G. S., et al. (2018). Global-scale evidence for the refractory nature of riverine black carbon. Nat. Geosci. 11, 584–588. doi: 10.1038/s41561-018-0159-8
Coppola, A. I., Ziolkowski, L. A., Masiello, C. A., and Druffel, E. R. M. (2014). Aged black carbon in marine sediments and sinking particles. Geophys. Res. Lett. 41, 2427–2433. doi: 10.1002/2013GL059068
Dittmar, T., Eduardo de Rezende, C., Manecki, M., Niggemann, J., Ovalle, A. R. C., Stubbins, A., et al. (2012). Continuous flux of dissolved black carbon from a vanished tropical forest biome. Nat. Geosci. 5, 618–622. doi: 10.1038/ngeo1541
Elmquist, M., Gustafsson, Ö, and Andersson, P. (2004). Quantification of sedimentary black carbon using the chemothermal oxidation method: an evaluation of ex situ pre-treatments and standard additions approaches. Limnol. Oceanogr. Methods 2, 417–427. doi: 10.4319/lom.2004.2.417
Fang, Z., Yang, W., Chen, M., and Ma, H. (2017). Source and fate of dissolved black carbon in the western South China Sea during the Southwest Monsoon prevailing season. J. Geophys. Res. Biogeosci. 122, 2817–2830. doi: 10.1002/2017JG004014
Fang, Z., Yang, W., Chen, M., Stubbins, A., Ma, H., and Jia, R. (2018). Transport of dissolved black carbon from the Prydz Bay Shelf, Antarctica to the deep Southern Ocean. Limnol. Oceanogr. 63, 2179–2190. doi: 10.1002/lno.10932
Fang, Z., Yang, W., Chen, M., Zheng, M., and Hu, W. (2016). Abundance and sinking of particulate black carbon in the western Arctic and Subarctic Oceans. Sci. Rep. 6:29959. doi: 10.1038/srep29959
Fang, Z., Yang, W., Stubbins, A., Chen, M., Li, J., Jia, R., et al. (2021). Spatial characteristics and removal of dissolved black carbon in the western Arctic Ocean and Bering Sea. Geochim. Cosmochim. Acta 304, 178–190. doi: 10.1016/j.gca.2021.04.024
Feng, N., Yang, W., Zhao, X., Chen, M., Qiu, Y., and Zheng, M. (2021). Semi-enclosed bays server as hotspots for black carbon burial: a case study in Jiaozhou Bay, western Yellow Sea. Sci. Total Environ. 797:149100. doi: 10.1016/j.scitotenv.2021.149100
Flores-Cervantes, D. X., Plata, D. L., MacFarlane, J. K., Reddy, C. M., and Gschwend, P. M. (2009). Black carbon in marine particulate organic carbon: inputs and cycling of highly recalcitrant organic carbon in the Gulf of Maine. Mar. Chem. 113, 172–181. doi: 10.1016/j.marchem.2009.01.012
Gan, J., Li, H., Curchitser, E. N., and Haidvogel, D. B. (2006). Modeling South China Sea circulation: response to seasonal forcing regimes. J. Geophys. Res. 111:C06034. doi: 10.1029/2005JC003298
Gaye, B., Wiesner, M. G., and Lahajnar, N. (2009). Nitrogen sources in the South China Sea, as discerned from stable nitrogen isotopic ratios in rivers, sinking particles, and sediments. Mar. Chem. 114, 72–85. doi: 10.1016/j.marchem.2009.04.003
Gustafsson, Ö, Bucheli, T. D., Kukulska, Z., Andersson, M., Largeau, C., Rouzaud, J.-N., et al. (2001). Evaluation of a protocol for the quantification of black carbon in sediments. Glob. Biogeochem. Cycles 15, 881–890. doi: 10.1029/2000GB001380
Gustafsson, Ö, Haghseta, F., Chan, C., Macfarlane, J., and Gschwend, P. M. (1997). Quantification of the dilute sedimentary soot phase: implications for PAH speciation and bioavailability. Environ. Sci. Technol. 31, 203–209. doi: 10.1021/es960317s
Henson, S. A., Yool, A., and Sanders, R. J. (2015). Variability in efficiency of particulate organic carbon export: a model study. Glob. Biogeochem. Cycles 29, 33–45. doi: 10.1002/2014GB004965
Hu, L., Shi, X., Bai, Y., Fang, Y., Chen, Y., Qiao, S., et al. (2016). Distribution, input pathway and mass inventory of black carbon in sediments of the Gulf of Thailand, SE Asia. Estuar. Cost. Shlef Sci. 170, 10–19. doi: 10.1016/j.ecss.2015.12.019
Jacobson, M. Z. (2001). Strong radiative heating due to the mixing state of black carbon in atmospheric aerosols. Nature 409, 695–697. doi: 10.1038/35055518
Jia, Y., Tian, Z., Shi, X., Liu, J. P., Chen, J., and Liu, X. (2019). Deep-sea sediment resuspension by internal solitary waves in the Northern South China Sea. Sci. Rep. 9:12137. doi: 10.1038/s41598-019-47886-y
Jones, M. W., Coppola, A. I., Santín, C., Dittmar, T., Jaffé, R., Doerr, S. H., et al. (2020). Fires prime terrestrial organic carbon for riverine export to the global oceans. Nat. Commun. 11:2791. doi: 10.1038/s41467-020-16576-z
Jurado, E., Dashs, J., Duarte, C. M., and Simó, R. (2008). Atmospheric deposition of organic and black carbon. Atmos. Environ. 42, 7931–7939. doi: 10.1016/j.atmosenv.2008.07.029
Kwon, E. Y., Primeau, F., and Sarmiento, J. L. (2009). The impact of remineralization depth on the air-sea carbon balance. Nat. Geosci. 2, 630–635. doi: 10.1038/ngeo612
Lahajnar, N., Wiesner, M. G., and Gaye, B. (2007). Fluxes of amino acids and hexosamines to the deep South China Sea. Deep Sea Res. I 54, 2120–2144. doi: 10.1016/j.dsr.2007.08.009
Le Moigne, F. A. C., Henson, S. A., Cavan, E., Georges, C., Pabortsava, K., Achterberg, E. P., et al. (2016). What causes the inverse relationship between primary production and export efficiency in the Southern Ocean? Geophys. Res. Lett. 43, 4457–4466. doi: 10.1002/2016GL068480
Liang, H., Zhao, W., Dai, D., and Zhang, J. (2014). Estimation of vertical diffusion coefficient based on a onedimensional temperature diffusion equation with an inverse method. Acta Oceanol. Sin. 33, 28–36. doi: 10.1007/s13131-014-0472-z
Liu, J., Clift, P. D., Yan, W., Chen, Z., Chen, H., Xiang, R., et al. (2014). Modern transport and deposition of settling particles in the northern South China Sea: sediment trap evidence adjacent to Xisha Trough. Deep Sea Res. I 93, 145–155. doi: 10.1016/j.dsr.2014.08.005
Lohmann, R., Bollinger, K., Cantwell, M., Feichter, J., Fischer-Bruns, I., and Zabel, M. (2009). Fluxes of soot black carbon to South Atlantic sediments. Glob. Biogeochem. Cycles 23:GB1015. doi: 10.1029/2008GB003253
Louchouarn, P., Chillrud, R. N., Houel, S., Yan, B., Chaky, D., Rumpel, C., et al. (2007). Elemental and molecular evidence of soot-and char-derived black carbon inputs to New York City’s atmosphere during the 20th century. Environ. Sci. Technol. 41, 82–87. doi: 10.1021/es061304+
Lutz, M., Dunbar, R., and Caldeira, K. (2002). Regional variability in the vertical flux of particulate organic carbon in the ocean interior. Glob. Biogeochem. Cycles 16:1037. doi: 10.1029/2000GB001383
Ma, H., Yang, W., Zhang, L., Zhang, R., Chen, M., Qiu, Y., et al. (2017). Utilizing 210Po deficit to constrain particle dynamics in mesopelagic water, western South China Sea. Geochem. Geophys. Geosys. 18, 1594–1607. doi: 10.1002/2017GC006899
Mari, X., Guinot, B., Thuoc, C. V., Brune, J., Lefebvre, J.-P., Sriram, P. R. A., et al. (2019). Biogeochemical impacts of a black carbon wet deposition event in Halong Bay, Vietnam. Front. Mar. Sci. 6:185. doi: 10.3389/fmars.2019.00185
Martin, J. H., Knauer, G. A., Karl, D. M., and Broenkow, W. W. (1987). VERTEX: carbon cycling in the northeast Pacific. Deep Sea Res. A 34, 267–285. doi: 10.1016/0198-0149(87)90086-0
Masiello, C. A., and Druffel, E. R. M. (1998). Black carbon in deep-sea sediments. Science 280, 1911–1913. doi: 10.1126/science.280.5371.1911
Qi, Y., Fu, W., Tian, J., Luo, C., Shan, S., and Sun, S. (2020). Dissolved black carbon is not likely a significant refractory organic carbon pool in rivers and oceans. Nat. Commun. 11:5051. doi: 10.1038/s41467-020-18808-8
Ramanathan, V., and Carmichael, G. (2008). Global and regional climate changes due to black carbon. Nat. Geosci. 1, 221–227. doi: 10.1038/ngeo156
Ran, L., Chen, J., Wiesner, M. G., Ling, Z., Lahajnar, N., Yang, Z., et al. (2015). Variability in the abundance and species composition of diatoms in sinking particles in the northern South China Sea: results from time-series moored sediment traps. Deep Sea Res. II 122, 15–24. doi: 10.1016/j.dsr2.2015.07.004
Rigaud, S., Puigorbé, V., Camara-Mor, P., Casacuberta, N., Roca-Martí, M., Garcia-Orellana, J., et al. (2013). A methods assessment and recommendations for improving calculations and reducing uncertainties in the determination of 210Po and 210Pb activities in seawater. Limnol. Oceanogr. Methods 11, 561–571. doi: 10.4319/lom.2013.11.561
Roca-Martí, M., Puigcorbé, V., Castrillejo, M., Casacuberta, N., Garcia-Orellana, J., Cochran, J. K., et al. (2021). Quantifying 210Po/210Pb disequilibrium in seawater: a comparison of two precipitation methods with differing results. Front. Mar. Sci. 8:684484. doi: 10.3389/fmars.2021.684484
Schroeder, A., Wiesner, M. G., and Liu, Z. (2015). Fluxes of clay minerals in the South China Sea. Earth Planet. Sci. Lett. 430, 30–42. doi: 10.1016/j.epsl.2015.08.001
Shih, Y.-Y., Lin, H.-H., Li, D., Hsieh, H.-H., Hung, C.-C., and Chen, C.-T. A. (2019). Elevated carbon flux in deep waters of the South China Sea. Sci. Rep. 9:1496. doi: 10.1038/s41598-018-37726-w
Singh, N., Abiven, S., Torn, M. S., and Schmidt, M. W. I. (2012). Fire-derived organic carbon in soil turns over on a centennial scale. Biogeosciences 9, 2847–2857. doi: 10.5194/bg-9-2847-2012
Stubbins, A., Niggemann, J., and Dittmar, T. (2012). Photo-lability of deep ocean dissolved black carbon. Biogeosciences 9, 1661–1670. doi: 10.5194/bg-9-1661-2012
Villa-Alfageme, M., de Soto, F. C., Ceballos, E., Giering, S. L. C., Le Moigne, F. A. C., Henson, S., et al. (2016). Geographical, seasonal, and depth variation in sinking particle speeds in the North Atlantic. Geophys. Res. Lett. 43, 8609–8616. doi: 10.1002/2016GL069233
Wagner, S., Brandes, J., Spencer, R. G. M., Ma, K., Rosengard, S. Z., Moura, J. M. S., et al. (2019). Isotopic composition of oceanic dissolved black carbon reveals non-riverine source. Nat. Commun. 10:5064. doi: 10.1038/s41467-019-13111-7
Wagner, S., Jaffé, R., and Stubbins, A. (2018). Dissolved black carbon in aquatic ecosystems. Limnol. Oceanogr. Lett. 3, 168–185. doi: 10.1002/lol2.10076
Wang, D., Wang, Q., Cai, S., Shang, X., Peng, S., Shu, Y., et al. (2019). Advances in research of the mid-deep South China Sea circulation. Sci. China Earth Sci. 62, 1992–2004. doi: 10.1007/s11430-019-9546-3
Wang, X., Xu, C., Druffel, E. M., Xue, Y., and Qi, Y. (2016). Two black carbon pools transported by the Changjiang and Huanghe Rivers in China. Glob. Biogeochem. Cycles 30, 1778–1790. doi: 10.1002/2016GB005509
Wang, Z., Yang, W., Chen, M., Lin, P., and Qiu, Y. (2014). Intra-annual deposition of atmospheric 210Pb, 210Po and the residence times of aerosol in Xiamen, China. Aerosol Air Qual. Res. 14, 1402–1410. doi: 10.4209/aaqr.2013.05.0170
Ward, C. P., Sleighter, R. L., Hatcher, P. G., and Cory, R. M. (2014). Insights into the complete and partial photooxidation of black carbon in surface waters. Environ. Sci. Process. Impacts 16, 721–731. doi: 10.1039/c3em00597f
Wei, C.-L., Lin, S.-Y., Sheu, D. D., Chou, W.-C., Yi, M.-C., Santschi, P. H., et al. (2011). Particle-reactive radionuclides (234Th, 210Pb, 210Po) as tracers for the estimation of export production in the South China Sea. Biogeosciences 8, 3793–3808. doi: 10.5194/bg-8-3793-2011
Wei, C.-L., Yi, M.-C., Lin, S.-Y., Wen, L.-S., and Lee, W.-H. (2014). Seasonal distributions and fluxes of 210Pb and 210Po in the northern South China Sea. Biogeosciences 11:6813v6826. doi: 10.5194/bg-11-6813-2014
Yang, W., and Guo, L. (2014). Abundance, distribution and isotopic composition of particulate black carbon in the northern Gulf of Mexico. Geophys. Res. Lett. 41, 7619–7625. doi: 10.1002/2014GL061912
Yang, W., and Guo, L. (2018). Sources and burial fluxes of soot black carbon in sediments on the Mackenzie, Chukchi, and Bering Shelves. Cont. Shelf Res. 155, 1–10. doi: 10.1016/j.csr.2018.01.008
Yang, W., Guo, L., Chuang, C. Y., Schumann, D., Ayranov, M., and Santschi, P. H. (2013). Adsorption characteristics of 210Pb, 210Po and 7Be onto micro-particle surfaces and the effects of macromolecular organic compounds. Geochim. Cosmochim. Acta 107, 47–64. doi: 10.1016/j.gca.2012.12.039
Yang, W., Huang, Y., Chen, M., Qiu, Y., Peng, A., and Zhang, L. (2009). Export and remineralization of POM in the Southern Ocean and the South China Sea estimated from 210Po/210Pb disequilibria. Chin. Sci. Bull. 54, 2118–2123. doi: 10.1007/s11434-009-0043-4
Zhang, J., Li, H., Xuan, J., Wu, Z., Yang, Z., Wiesner, M. G., et al. (2019). Enhancement of mesopelagic sinking particle fluxes due to upwelling, aerosol deposition, and monsoonal influences in the northwestern South China Sea. J. Geophys. Res. Oceans 124, 99–112. doi: 10.1029/2018JC014704
Zhang, L., Yang, W., Chen, M., Wang, Z., Lin, P., Fang, Z., et al. (2016). Atmospheric deposition of 7Be in the southeast of China: a case study in Xiamen. Aerosol Air Qual. Res. 16, 105–113. doi: 10.4209/aaqr.2015.03.0182
Zhang, X., Chen, J., Xiang, L., Fang, J., Li, Y., Zhu, Y., et al. (2014). A preliminary study on the characteristics of marine nepheloid layers in the northern South China Sea and their influential factors. Acta Oceanol. Sin. 36, 51–65.
Keywords: soot, polonium, South China Sea, twilight zone, black carbon, biological pump efficiency
Citation: Yang W, Zhao X, Guo L, Huang B, Chen M, Fang Z, Zhang X and Qiu Y (2021) Utilization of Soot and 210 Po-210 Pb Disequilibria to Constrain Particulate Organic Carbon Fluxes in the Northeastern South China Sea. Front. Mar. Sci. 8:694428. doi: 10.3389/fmars.2021.694428
Received: 13 April 2021; Accepted: 04 October 2021;
Published: 10 November 2021.
Edited by:
Pere Masque, International Atomic Energy Agency (IAEA), MonacoReviewed by:
Frédéric André Corentin Le Moigne, UMR 7294 Institut Méditerranéen d’Océanographie (MIO), FrancePeng Lin, Texas A&M University at Galveston, United States
Viena Puigcorbé, Edith Cowan University, Australia
Copyright © 2021 Yang, Zhao, Guo, Huang, Chen, Fang, Zhang and Qiu. This is an open-access article distributed under the terms of the Creative Commons Attribution License (CC BY). The use, distribution or reproduction in other forums is permitted, provided the original author(s) and the copyright owner(s) are credited and that the original publication in this journal is cited, in accordance with accepted academic practice. No use, distribution or reproduction is permitted which does not comply with these terms.
*Correspondence: Weifeng Yang, d3lhbmdAeG11LmVkdS5jbg==