Abstract
This paper examines the character of phytoplankton blooms in a restricted sub-tropical lagoon along the Atlantic coast of central Florida. The results of the 23-year study (1997–2020) provide evidence for multiple types of variability in bloom activity, including cyclical patterns, stochastic events, and most prominently a regime shift in composition and intensity. Cyclical patterns (e.g., El Niño/La Niña periods) and stochastic events (e.g., tropical storms) influenced rainfall levels, which in turn impacted nutrient concentrations in the water column and the timing and intensity of blooms. In 2011, a major change occurred in the character of blooms, with a dramatic increase in peak biomass levels of blooms and the appearance of new dominant taxa, including the brown tide species Aureoumbra lagunensis and other nanoplanktonic species. Results of quantitative analyses reveal system behavior indicative of a regime shift. The shift coincided with widespread losses of seagrass community and reduced drift algae biomass. A combination of exceptionally low water temperatures in the winters of 2009/2010 and 2010/2011, hypersaline conditions associated with drought conditions, and high light attenuation caused by blooms appear to have contributed to the widespread and protracted decline in seagrass and drift macroalgal communities in the lagoon, leading to shifts in distribution of internal and external nutrient sources toward phytoplankton.
Introduction
One of the challenges in defining changes in phytoplankton bloom intensity and composition is accounting for different forms of variability, including cyclical patterns, linear trends, and regime shifts. The growing availability of long-term data for aquatic ecosystems has increased opportunities to examine temporal patterns in phytoplankton biomass and composition (Cloern and Jassby, 2010; Zingone et al., 2010). Cyclical patterns can occur on several temporal scales. Perhaps the most widely studied is seasonality, such as spring blooms in temperate latitudes, which can in part be related to increases in temperature and incident irradiance (Siegel et al., 2002; Winder and Cloern, 2010; Chiswell et al., 2015). By contrast, sub-tropical and tropical regions experience less seasonal variation in irradiance and temperature, increasing the focus on other drivers of temporal patterns of phytoplankton biomass and composition, such as wet versus dry periods, or tropical storm activity (Bienfang et al., 1984; Phlips et al., 2015, 2020). The difficulty of defining temporal patterns of variation in phytoplankton biomass is illustrated by the results of a study of 126 marine ecosystems around the world that showed only half exhibited clearly definable seasonal patterns of phytoplankton biomass (Winder and Cloern, 2010). The same study also pointed out the need for more representation of studies involving ecosystems in subtropical and tropical latitudes. Temporal patterns in bloom dynamics also can be linked to recurring changes in key environmental conditions at multi-year intervals, such as El Niño/La Niña cycles that affect rainfall levels and in turn alter external nutrient loads, water residence times and a range of other water quality conditions, including plankton dynamics (Lipp et al., 2001; Zhu et al., 2017; Zhao et al., 2018; Jiménez-Quiroz et al., 2019). For example, peaks in the abundance of the globally distributed toxic dinoflagellate Pyrodinium bahamense have been correlated to high rainfall associated with El Niño periods in Florida and the Indo-Pacific (Phlips et al., 2006, 2020; Usup et al., 2012).
In addition to cyclical patterns, there can be progressive trends or sudden shifts in the intensity and composition of phytoplankton blooms. One of the drivers of progressive increases in bloom activity is elevated nutrient loads associated with both natural and anthropogenic eutrophication (Nixon, 1995; Cloern, 2001; Anderson et al., 2008; Heisler et al., 2008; O’Neil et al., 2012; Glibert, 2020). There is also evidence that changes in ecosystem structure and function are not always gradual and progressive, but can be sudden, dramatic, and persistent. Such changes often are referred to as regime shifts, state changes; or alternative stable states (Beisner et al., 2003). A number of examples of regime shifts have been reported for freshwater and marine ecosystems (Spencer et al., 2011; MacNally et al., 2014; Capon et al., 2015; Beaugrand, 2015; Möllmann et al., 2015). One of the commonly referenced examples of regime shift is the change from macrophyte to phytoplankton domination in shallow lakes associated with advanced stages of eutrophication (Scheffer et al., 1993; Janssen et al., 2014). Confirmed cases of regime shifts in marine ecosystems are less numerous than for freshwater environments, particularly in sub-tropical and tropical regions (Viaroli et al., 2008; Spencer et al., 2011; MacNally et al., 2014). For estuarine and nearshore marine systems, MacNally et al. (2014) emphasized that the term regime shift should be limited to a “stark change” in the biology of an ecosystem inferred from long-term empirical data. However, recent reviews of a wide range of reported regime shifts suggest that many do not necessarily meet these criteria (Spencer et al., 2011; MacNally et al., 2014; Capon et al., 2015). In addition, it has been suggested that quantitative modeling approaches should be used to supplement empirical observations in verifying the designation of stark changes in ecosystems as regime shifts (Scheffer and Carpenter, 2003; Spencer et al., 2011).
This paper examines the character of phytoplankton blooms in a restricted sub-tropical ecosystem along the east coast of Florida, the northern Indian River Lagoon (NIRL), which is comprised of three inter-connected sub-regions; the NIRL proper, Mosquito Lagoon, and Banana River Lagoon (Phlips et al., 2011, 2015). The results of this 23-year study (1997–2020) provide evidence for multiple types of variability in phytoplankton bloom activity, including cyclical patterns and a regime shift in the composition, duration, seasonality, and intensity of blooms from 2011 onward, characterized by higher biomass peaks and altered dominant species in blooms. The shift in bloom characteristics coincided with a period of widespread and persistent losses of seagrass communities and declines in drift algae biomass throughout NIRL (Phlips et al., 2015). The results of this study suggest that the changes in the benthic primary producer and phytoplankton communities in 2010–2011 were not only temporally coincident but likely causally linked. A series of quantitative data-intensive analyses were used to evaluate whether the data provide evidence that the shift in bloom activity fit the criteria for a regime shift. The potential drivers for the shift are discussed within the context of changes in climatic conditions, water column characteristics and nutrient levels.
Materials and Methods
Site Description
The study focused on three sub-regions of the NIRL ecosystem, i.e., the southern Mosquito Lagoon; the NIRL proper and the Banana River Lagoon (Figure 1). The three primary sampling sites were Site 1 in the southern Mosquito Lagoon, Site 2 in the Indian River Lagoon near Titusville, and Site 3 in the central Banana River lagoon (Figure 1). For broader comparisons of Top-200 biomass peaks of individual taxonomic groups in the three sub-regions, data for an additional site in each sub-region were included, i.e., Site 1b in the central Mosquito Lagoon, Site 2b in the Indian River Lagoon at Cocoa and Site 3b in the northern Banana River near Cocoa Beach (Figure 1).
FIGURE 1
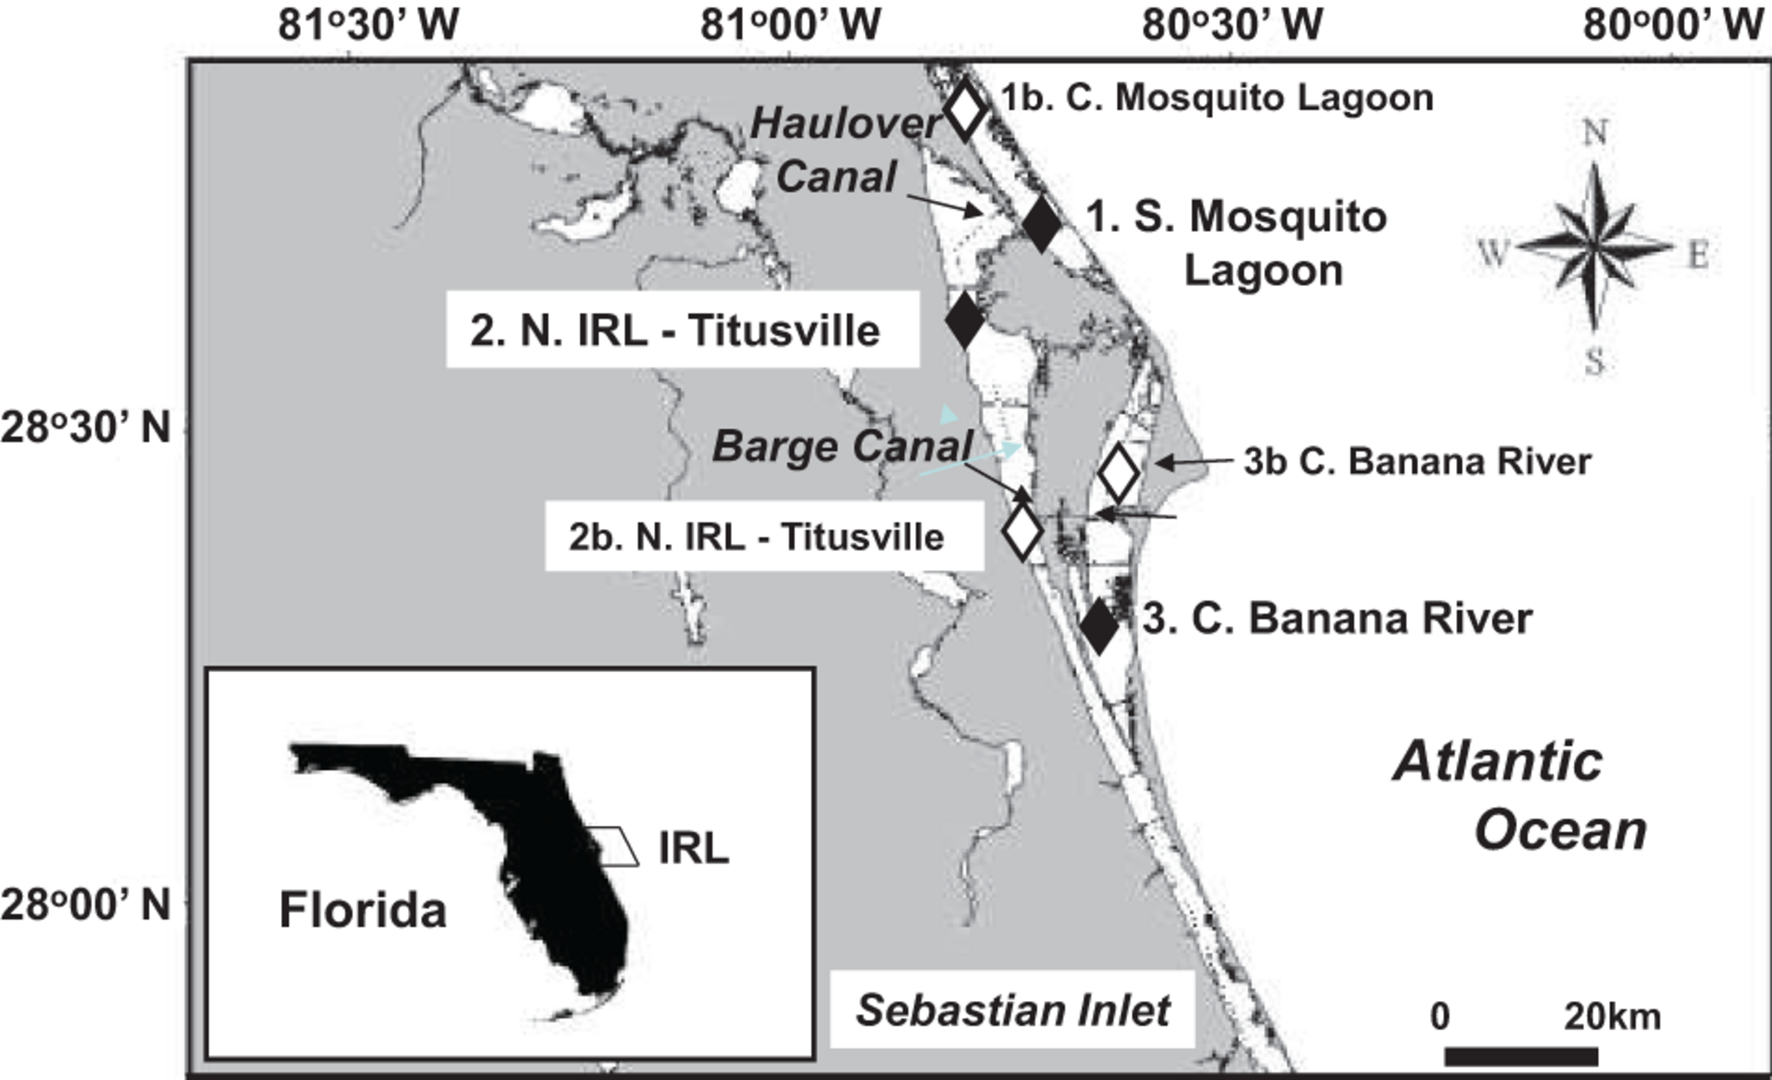
Locations of the three primary sampling sites (1, 2, and 3), and supplemental sites (1b, 2b, and 3b).
The three sub-regions of the NIRL are connected by navigational canals (i.e., Haulover and Barge canals) and natural gaps in land barriers. All three sub-regions are microtidal and have long water residence times, with estimated mean water half-lives (i.e., E50—50% exchange) of 75 days in the southern Mosquito Lagoon, 107 days in the NIRL, and 156 days in the Banana River Lagoon (Sheng and Davis, 2003; Steward et al., 2005). All three sub-regions included in the study are characterized by small watersheds relative to the size of the receiving basins, but vary in terms of land-use (Sigua and Tweedale, 2003; Adkins et al., 2004; Steward et al., 2005; Gao, 2009). The Banana River Lagoon watersheds have significant urban/residential areas, along with some agricultural uses and undeveloped lands. The watersheds of the southern Mosquito Lagoon and NIRL near Titusville are characterized by higher percentages of natural upland and wetland preserves (mostly associated with the Canaveral National Seashore and Merritt Island National Wildlife Refuge) than the Banana River Lagoon. The southern Mosquito Lagoon does experience some tidal and wind–driven water exchange with the northern Mosquito Lagoon, which is characterized by moderate urban and residential development.
Field and Laboratory Procedures
Sampling locations and frequencies varied over the study period (i.e., September 1997 through December 2020). Site 1 was sampled twice per month from May 2006 through December 2020. Sites 2, and 3 were sampled approximately monthly from September 1997 through April 2006, then twice per month from May of 2006 through December 2020.
Salinity (practical salinity units, psu) was measured on site with YSI or Hach/Hydrolab environmental multi-probes. Water temperatures described in this paper were based on the USGS continuous monitoring site in the Haulover Canal near Titusville1 through September 20202, after which temperature values are from a continuous monitoring YSI sonde platform located near sampling Site 2 in the NIRL near Titusville (St. Johns River Water Management District, Palatka, FL, United States). Light transmission through the water column was measured using a Secchi disk (meters).
Water was collected using a vertically integrating sample tube that captures water evenly from the surface to within 0.2 m of the bottom. Split phytoplankton samples were preserved on site, one with Lugol’s solution and the other with glutaraldehyde in 0.1 M sodium cacodylate buffer. Aliquots of water were kept on ice and processed upon return to the laboratory for analysis of picocyanobacteria densities.
Data for total phosphorus (TP) and total nitrogen (TN = total Kjeldahl nitrogen + NOx) were obtained from the St. Johns River Water Management District, Palatka, Florida,3 which carries out contemporaneous monthly analyses of water chemistry on samples collected during this project. Data from May 1997 through April 2020 were selected.
Climate Data
Rainfall data for the Titusville Meteorological Station, located near the NIRL sampling Site 2, was obtained from the NOAA Climatological Data for Florida web site.4 Rainfall totals at Titusville over the study period are shown for 12 month groupings from fall through summer (September–August). The time interval was selected to allow for the incorporation of fall seasonal rain, which can affect nutrient loads, which in turn influence the potential for winter/spring blooms because of very long water residence times in NIRL.
Plankton Analysis
General phytoplankton composition was determined using the Utermöhl method (Utermöhl, 1958). Samples preserved in Lugol’s were settled in 19-mm diameter cylindrical chambers. Phytoplankton cells were identified and counted at 400× and 100× with a Leica phase contrast inverted microscope. At 400×, a minimum of 100 cells of a single taxon and 30 grids were counted. If 100 cells of a single taxon were not counted by 30 grids, up to a maximum of 100 grids were counted until 100 cells of a single taxon were reached. At 100×, a total bottom count was completed for taxa >30 μm in size. Light microscopy was aided by other techniques for proper identification, such as the squash technique and scanning electron microscopy (Badylak et al., 2004). Scanning and transmission electron microscopy and fluorescence microscopy was used to confirm the taxonomic composition of several blooms dominated by pico-nanoplanktonic species, particularly in the post-2010 period. For example, the identity of Aureoumbra lagunensis as the dominant species in the 2012 and 2013 was further confirmed using SEM/TEM (Phlips and Badylak, 2012). Fluorescence microscopy was used to enumerate picoplanktonic cyanobacteria (e.g., Synechococcus spp. and spherical picocyanobacteria spp.) at 1000x magnification (Phlips et al., 1999). Subsamples of seawater were filtered onto 0.2-μm Nucleopore filters and mounted between a microscope slide and cover slip with immersion oil.
Cell biovolumes (μm–3 cell–1) were estimated by assigning combinations of geometric shapes to fit the characteristics of individual taxa (Smayda, 1978; Sun and Liu, 2003). Specific phytoplankton dimensions were measured for at least 30 randomly selected cells. Species which vary substantially in size, such as many diatom species, were placed into size categories. Phytoplankton biomass as carbon values (μg carbon ml–1) was estimated by using conversion factors for different taxonomic groups applied to biovolume estimates, i.e., 0.065 × biovolume (μm–3 ml–1 × 10⁻⁶) of diatoms, 0.16 × biovolume of dinoflagellates and 0.22 × biovolume of cyanobacteria and other phytoplankton taxa (Strathmann, 1967; Ahlgren, 1983; Sicko-Goad et al., 1984; Verity et al., 1992; Work et al., 2005).
For the purpose of description and discussion, “blooms” were defined as phytoplankton carbon values which fell within the top 20% of total phytoplankton carbon values in all samples from the three main sites in NIRL examined over the study period, i.e., >2 μg carbon ml–1.
Statistical and Modeling Methods
Data Summaries
Basic statistical procedures [i.e., determination of mean values, standard deviations, and Tukey-Kramer comparison of means (using log-transformed data)] were carried out using SAS v9.2 (SAS Institute, Cary, NC, United States). The remaining analyses, including some data visualizations, were performed in R (R Core Team, 2020). To enable assessment of water column conditions prior and subsequent to the regime shift, total phytoplankton biomass, TN, and TP observations were divided into “pre” and “post” shift subsets, based on the results of changepoint analyses (see below). The pre-shift subset includes all observations made prior to 2011 (i.e., 1997–2010), and the post-shift period includes observations made from 2011 onward (i.e., 2011–2020).
Changepoint Analysis
To assess when major statistically significant changes occurred in the total phytoplankton biomass time series (averaged monthly across sites), we applied four changepoint detection algorithms, specifically the cpt.meanvar, cpt.mean, and cpt.var functions in the changepoint package version 2.2.2 (Killick and Eckley, 2014), and the breakpoints function in the Strucchange Package version 1.5-2 (Zeilis et al., 2002). The changepoint analysis methods from the changepoint package were applied with a normal test statistic and constrained to detect at most one changepoint. The cpt.meanvar, cpt.mean, and cpt.var functions tested for changes in the mean and variance, mean only, and variance only of the average total phytoplankton biomass time series, respectively. The breakpoints function from the Strucchange Package applies a regression-based approach to identify locations in the time series that optimize the fit of a segmented regression, and this method can identify multiple changepoints. The regression-based approach allows for confidence intervals to be calculated around the changepoints, while the tests for changes in mean and variance do not. Multiple changepoint algorithms were tested in order to assess variation in changepoints identified through different methods.
Results
Phytoplankton Biomass and Composition
All three sub-regions of NIRL showed similar trends in biomass peaks over the study period, with more intense (i.e., biomass peaks) and prolonged blooms in the 2011–2020 time period than from 1997 to 2010 (Figure 2). Changepoints were identified in the mean and variance of the total phytoplankton biomass time series for the average three main sites combined (Sites 1, 2, and 3) in March 2011 and October 2015 using the regression-based changepoint detection approach (Figure 3A), and in April 2011, June 2012, and September 2015, using the tests for change in mean and variance, mean only, and variance only, respectively (Figure 3B). These results highlight a major shift in bloom biomass beginning in 2011, with further intensification in subsequent years. The major trends in blooms characteristics at the three principal sampling sites include;
FIGURE 2
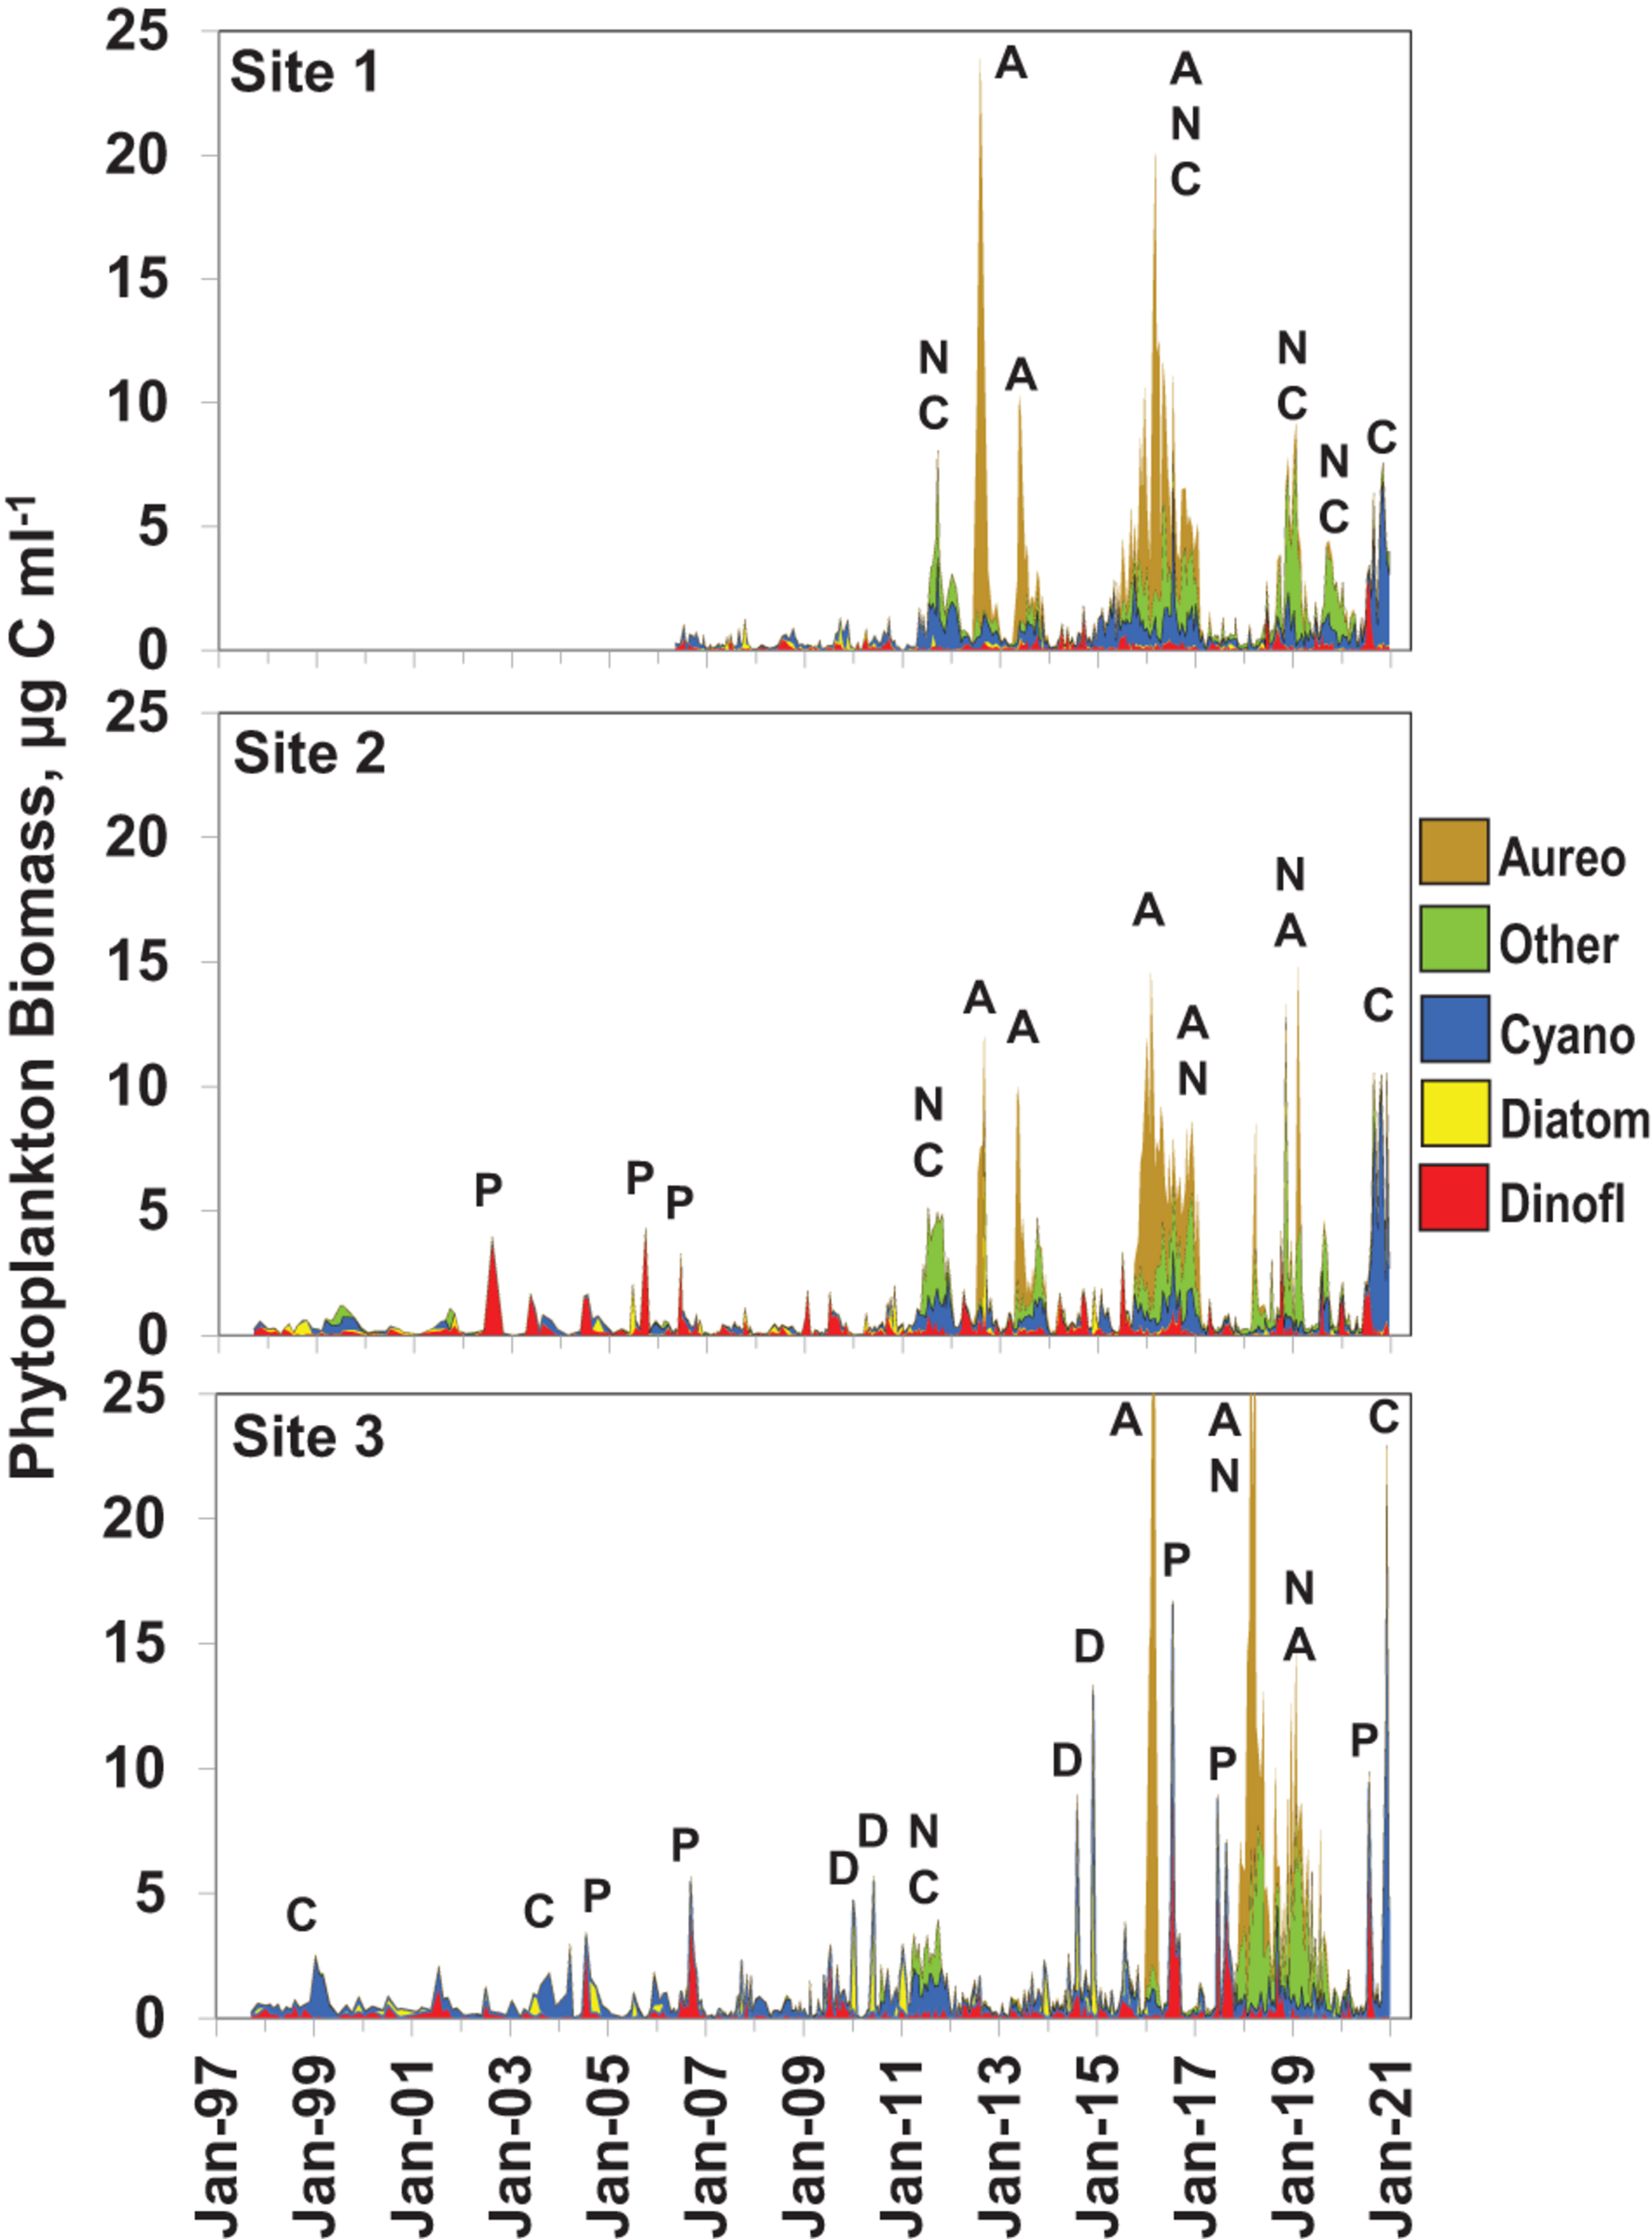
Phytoplankton biomass (μg carbon ml–1) at the three sampling sites, i.e., Site 1 in the southern Mosquito Lagoon, Site 2 in the northern Indian River Lagoon at Titusville, and Site 3 in the central Banana River. Biomass values are subdivided into five categories, i.e., dinoflagellates (red), diatoms (yellow), cyanobacteria (blue), Aureoumbra lagunensis (orange), and all other taxa (green). Letters above major peaks in biomass show the dominant taxa in the major bloom peaks, i.e., A—A. lagunensis, C—picoplanktonic cyanobacteria, D—diatoms, N—nanoplanktonic eukaryotes (undefined taxa), P—Pyrodinium bahamense.
FIGURE 3
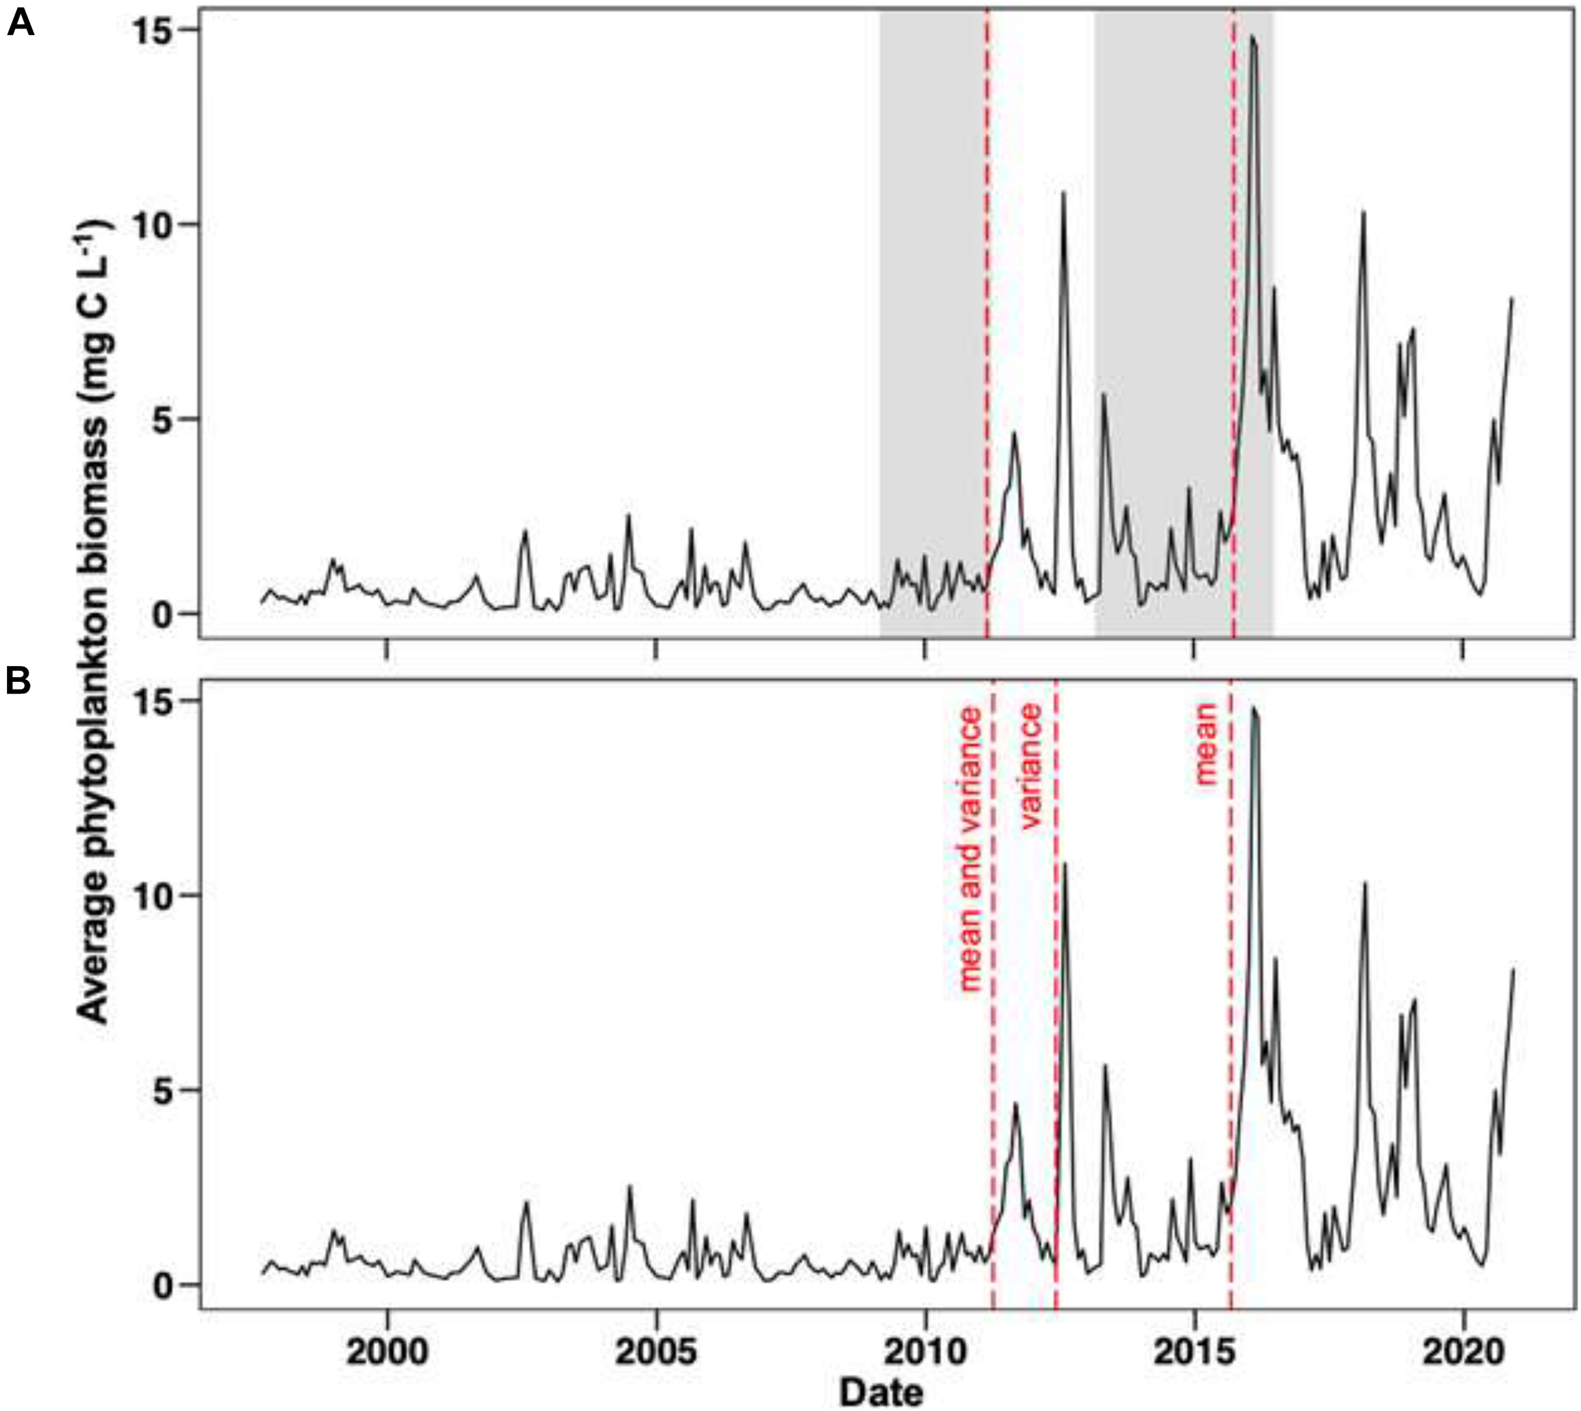
Changepoints detected using a regression-based approach (A) and by testing for differences in the mean and variance, mean only, and variance only (B) in total phytoplankton biomass for NIRL, i.e. Sites 1-3 combined. Changepoints are shown as dotted red lines. In panel (A), the shaded gray background corresponds to the 95% confidence interval for the two changepoints; confidence intervals could not be calculated for the changepoints shown in panel (B) due to constraints of the underlying methodological approach.
Southern Mosquito Lagoon
During the first five years of the time series at Site 1 (2006–2010) phytoplankton biomass did not exceed the bloom threshold of 2 μg carbon ml–1 (Figure 2). In 2011, a major bloom of picocyanobacteria and nanoplanktonic eukaryotes (most prominently chlorophytes) reached a biomass of 10 μg carbon ml–1 and bloom levels of biomass were maintained from May through October. In 2012, the first in a series of brown tide events dominated by the pelagophyte A. lagunensis began in June and persisted through August, with peak biomass levels reaching 24 μg carbon ml–1. Subsequently, intense brown tides, in conjunction with other nanoplanktonic taxa, were observed in 2013 and 2015–2016. After 2016, a major bloom of nanoplankton was observed from fall 2018 through winter of 2019, and an intense nanoplanktonic cyanobacterium was observed from the late summer through winter of 2020.
Northern IRL at Titusville
The first 13 years of the time series at Site 2 (1997–2010) was characterized by a period of summer blooms of the toxic dinoflagellate P. bahamense from 2002 to 2006 (Figure 2). In 2011, a bloom of picocyanobacteria and nanoplanktonic eukaryotes reached 5 μg carbon ml–1 and bloom levels of biomass were maintained from May through October. In 2012, an intense brown tide event dominated by the pelagophyte A. lagunensis began in June and persisted through August, with peak biomass levels reaching 8 μg carbon ml–1. In 2013, a similar brown tide event was observed with peak biomass of 9 μg carbon ml–1 beginning in April and persisting for 3 months, before transitioning into a less intense bloom of picocyanobacteria and nanoplanktonic eukaryotes. Another major brown tide event developed in the winter of 2015/2016, reaching a biomass peak of 14 μg carbon ml–1 in the spring, dominated by A. lagunensis and other nanoplanktonic phytoplankton. Major blooms of nanoplanktonic species (including A. lagunensis) returned in 2018 and a major bloom of nanoplanktonic cyanobacteria was observed in the Fall and Winter of 2020.
Central Banana River
During the first 13 years of the biomass time series at Site 3 (1997–2010) two minor picoplanktonic cyanobacteria blooms, two P. bahamense blooms and two blooms of the cosmopolitan centric diatom species Dactyliosolen fragilissimus and Cerataulina pelagica were observed (Figure 2). Maximum biomass levels of the P. bahamense and diatom blooms reached 5.5 μg carbon ml–1. In 2011, a bloom of picocyanobacteria and a nanoplanktonic eukaryotes reached a biomass peak of 5 μg carbon ml–1 and bloom levels of biomass were maintained from March through October. In 2014, two intense centric diatom blooms were observed, with biomass peaks up to 12.7 μg carbon ml–1. In 2016, a major brown tide bloom occurred in the winter and spring, reaching a peak biomass of 27 μg carbon ml–1, dominated by A. lagunensis. After the dissipation of the brown tide in April, an intense summer bloom of P. bahamense was observed in July and August, reaching a biomass level of the toxic HAB species never before observed, i.e., 16 μg carbon ml–1. Major blooms of P. bahamense recurred in the summer of 2017, followed by a major bloom event extending from the winter of 2018 through the summer of 2019, dominated by A. lagunensis and other nanoplanktonic phytoplankton. In 2020, another major P. bahamense was observed in the summer, followed by a fall bloom of a nanoplanktonic cyanobacteria.
Changes in Composition
The most dramatic change in species composition from the 1997–2010 to 2011–2020 time period was the large increase in mean biomass of pico- and nanoplanktonic (<20 μm) species at all three sites (Table 1). By contrast, changes between time periods of mean microplankton biomass levels remained comparatively small. The shift in composition is further reflected in the list of Top-200 biomass observations in NIRL for the pre-2011 and post-2010 time periods (Table 2). In the 1997–2010 time period, Top-200 peaks in biomass of individual taxonomic groups in NIRL included a diverse mixture of diatoms, dinoflagellates, and cyanobacteria. The toxic dinoflagellate P. bahamense was the predominate species on the list in terms of frequency and biomass range. Picoplanktonic cyanobacteria (i.e., spherical spp. and Synechococcus spp.) were also major elements of the list, as well as the cosmopolitan diatom species D. fragilissimus and C. pelagica. In terms of other HAB species, the diatom Pseudo-nitzschia calliantha, and dinoflagellates Peridinium quinquecorne, Prorocentrum rhathymum, and Akashiwo sanguinea were noteworthy taxa on the Top-200 list.
TABLE 1
| Mean Biomass (μg carbon ml–1) | |||
|
|
|||
| Site | Period | Pico/Nano | Micro |
| 1 | 2006–2010 | 0.21 B | 0.16 A |
| (−0.19) | (−0.19) | ||
| 2011–2020 | 2.66 A | 0.17 A | |
| (−3.40) | (−0.33) | ||
| 2 | 1997–2005 | 0.16 B | 0.39 A |
| (−0.18) | (−0.76) | ||
| 2006–2010 | 0.15 B | 0.27 A | |
| (−0.12) | (−0.44) | ||
| 2011–2020 | 2.30 A | 0.28 A | |
| (−3.07) | (−0.51) | ||
| 3 | 1997–2005 | 0.33 B | 0.31 B |
| (−0.55) | (−0.47) | ||
| 2006–2010 | 0.26 B | 0.64 A | |
| (−0.28) | (−1.15) | ||
| 2011–2020 | 2.40 A | 0.77 A | |
| (−5.01) | (−1.84) | ||
Comparison of mean biomass (as μg carbon ml–1) of pico-nanoplanktonic phytoplankton (i.e., ≤20 μm), and microplanktonic phytoplankton (>20) at the three primary sampling sites: 1. southern Mosquito Lagoon, 2. northern IRL at Titusville, and 3. central Banana River Lagoon. (i.e., 1,2, and 3) over three time periods.
Standard deviations are shown in parentheses. The results of statistical multiple range tests using log-transformed data (p, 0.05) are shown as letter values next to mean values. Time-period mean values for each site with the same letter designation are not significantly different.
TABLE 2

Top-200 biomass peaks of individual taxonomic groups in NIRL during the 1997–2010 and 2011–2020 time periods.
Taxa shown in red are listed by the IOC as Harmful Algal Bloom (HAB) species (Moestrup et al., 2009).
The Top-200 list of peaks in biomass in the post-2010 period was primarily dominated by nanoplanktonic taxa, such as A. lagunensis, pedinophytes and nanoplanktonic cyanobacteria (Table 2). However, the toxic dinoflagellate P. bahamense remained a major component of the Top-200 list. The HAB species A. sanguinea and P. calliantha were also noteworthy elements of the list in terms of biomass levels. The highest peak biomass values in the post-2010 period were up to 5-fold higher than during the pre-2011 period (Table 2).
Climatic Factors
Surface water temperatures in NIRL typically ranged from winter lows between 10 and 15°C to summer highs between 30 and 32°C (Figure 4). However, during the winters of 2009/2010 and 2010/2011, minimum water temperatures were exceptionally low, i.e., 3.7 and 7.0°C, respectively.
FIGURE 4
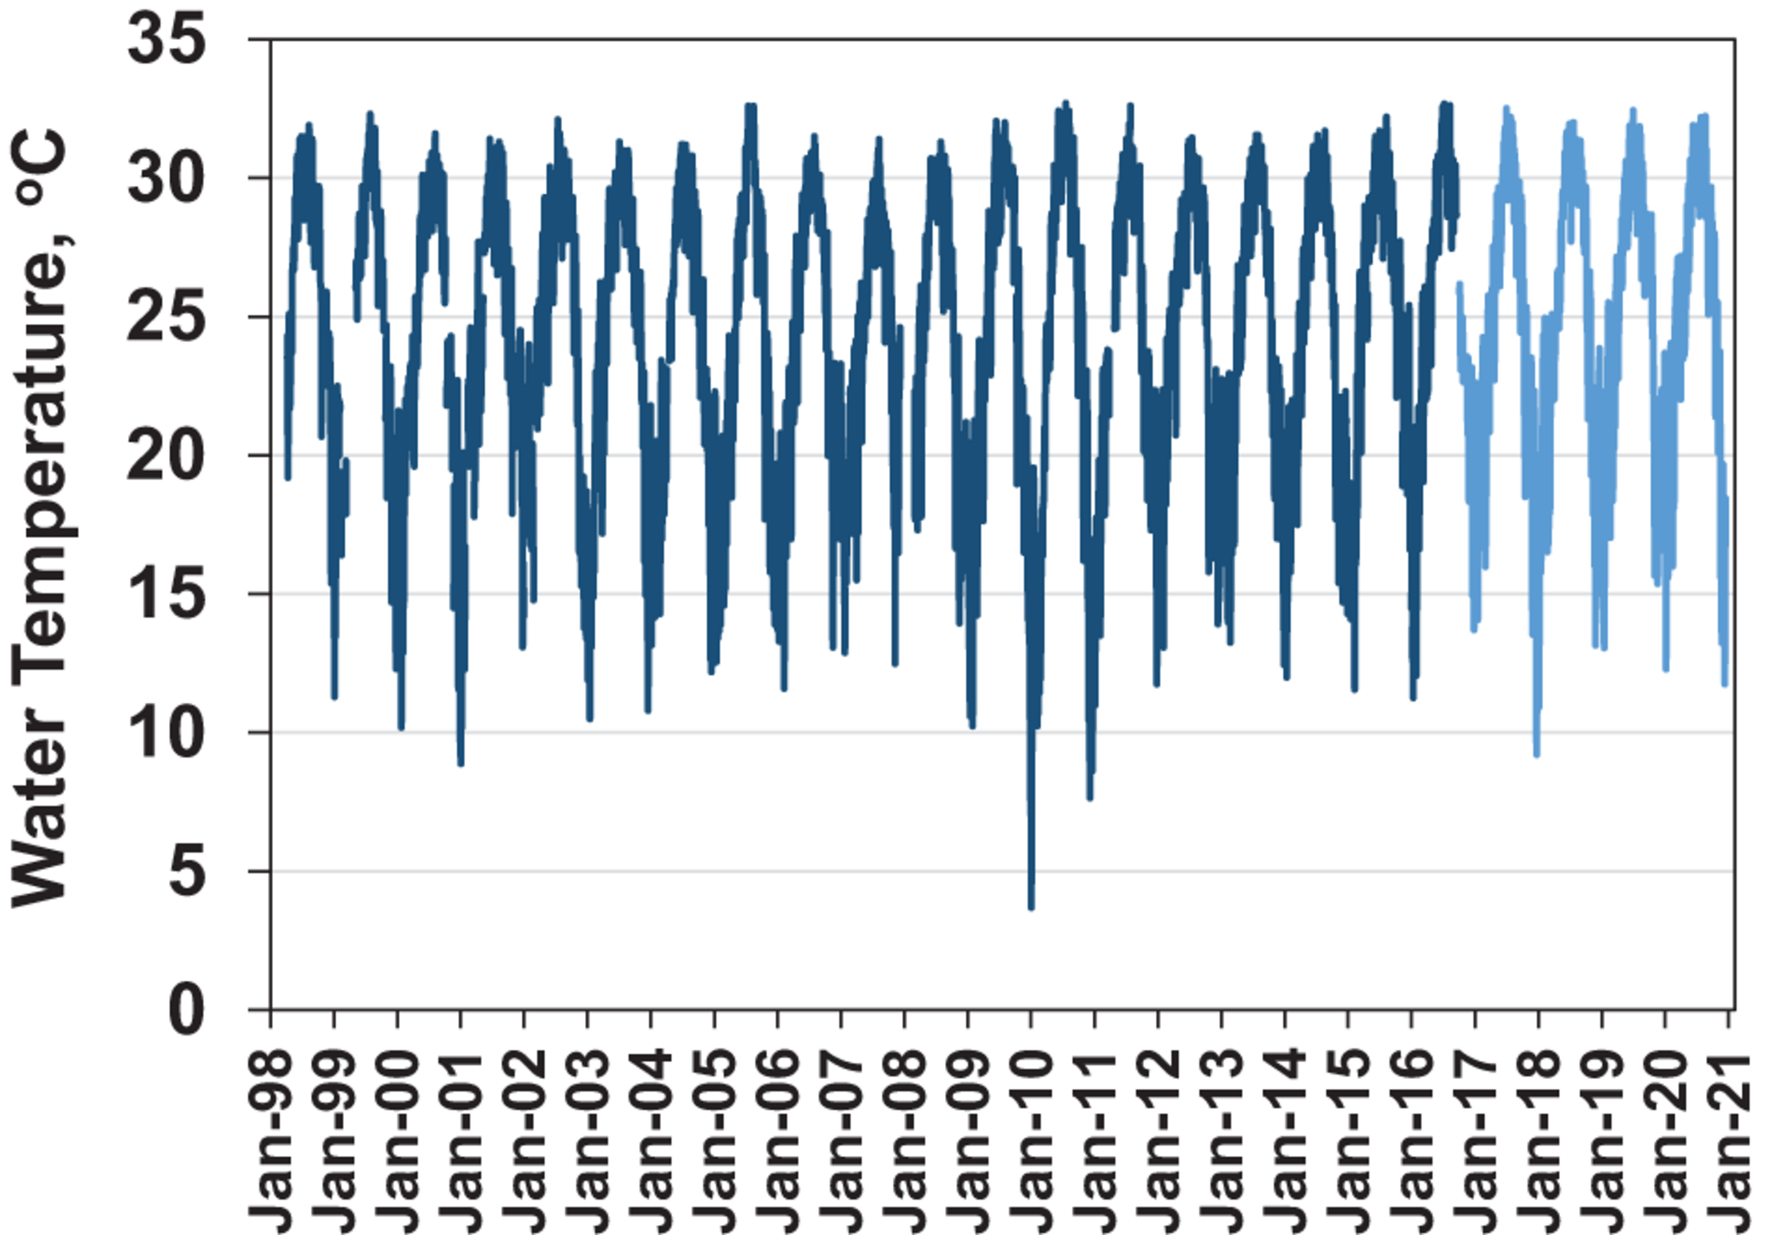
Surface water temperature at Haulover Canal USGS station Dark blue line is the daily average water temperature. After September 2016 temperature readings were from a nearby continuous monitoring sonde of the St. Johns River Water Management District (light blue line).
Rainfall totals ranged from 100 to 180 cm (Figure 5). Totals were generally lower during periods dominated by La Niña conditions, such as 1998–2001 and 2007–2011, than during periods dominated by El Niño conditions, such as 2002–2006, 2014–2016, and 2018–2019 (Figure 6). Another notable feature of the rainfall trends is the influence of hurricanes on total rainfall (Figure 5). Certain storm events had a strong contribution to rainfall totals in the study region, including the active tropical storm periods of 2004 (Charley, August; Francis, September; Ivan, September; Jeanne, September), 2005 (Wilma, October), 2008 (Fay, August), 2012 (Beryl, May; Sandy, October), 2014 (Arthur, July), 2015 (Erika, September; Joaquin, October), 2016 (Colin, June; Julia, September; Mathew, October), 2017 (Emily, August; Irma, September), 2018 (Gordon, September), 2019 (Dorian, September), 2020 (Isaias, August)
FIGURE 5
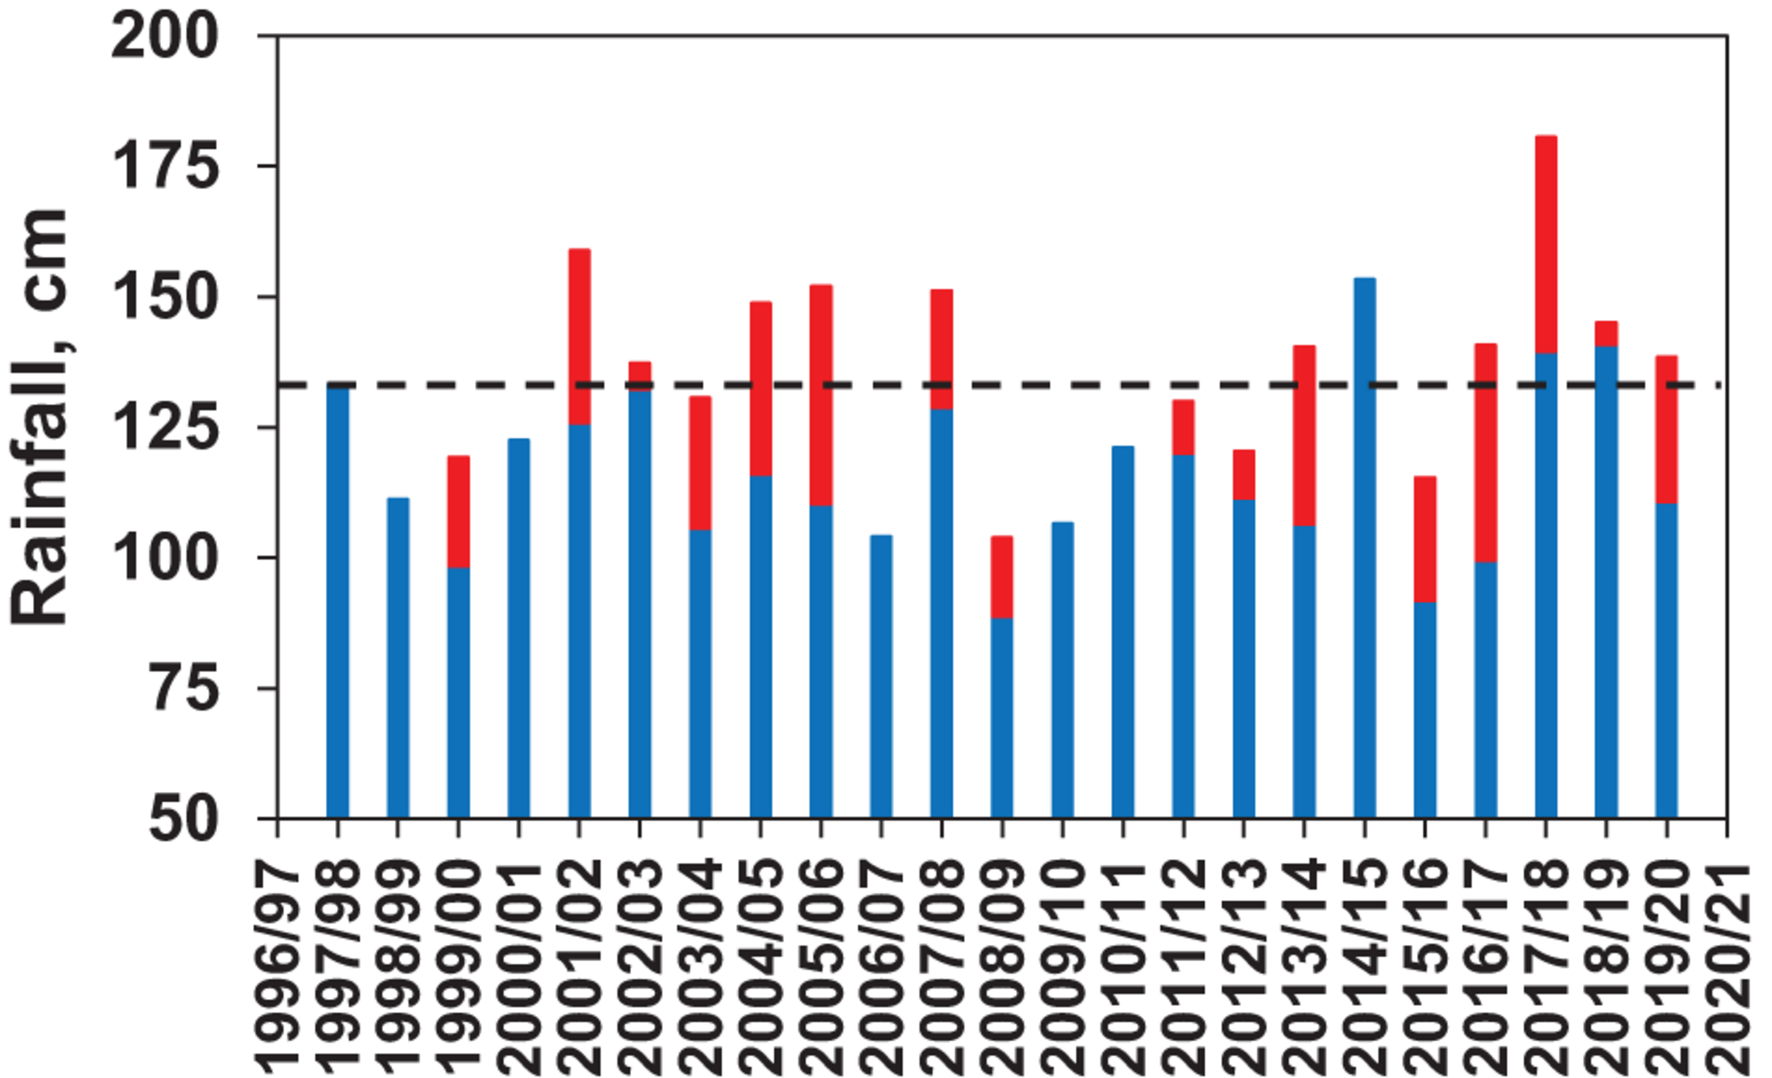
Rainfall totals (cm) at the Titusville, Florida meteorological station for 12 month periods from the fall (September) through summer (August) of the subsequent year. Grand mean for the period is shown as the dotted line. Red portion of the bar indicates the contribution of major storm events (e.g., hurricanes) during the 12 month periods.
FIGURE 6
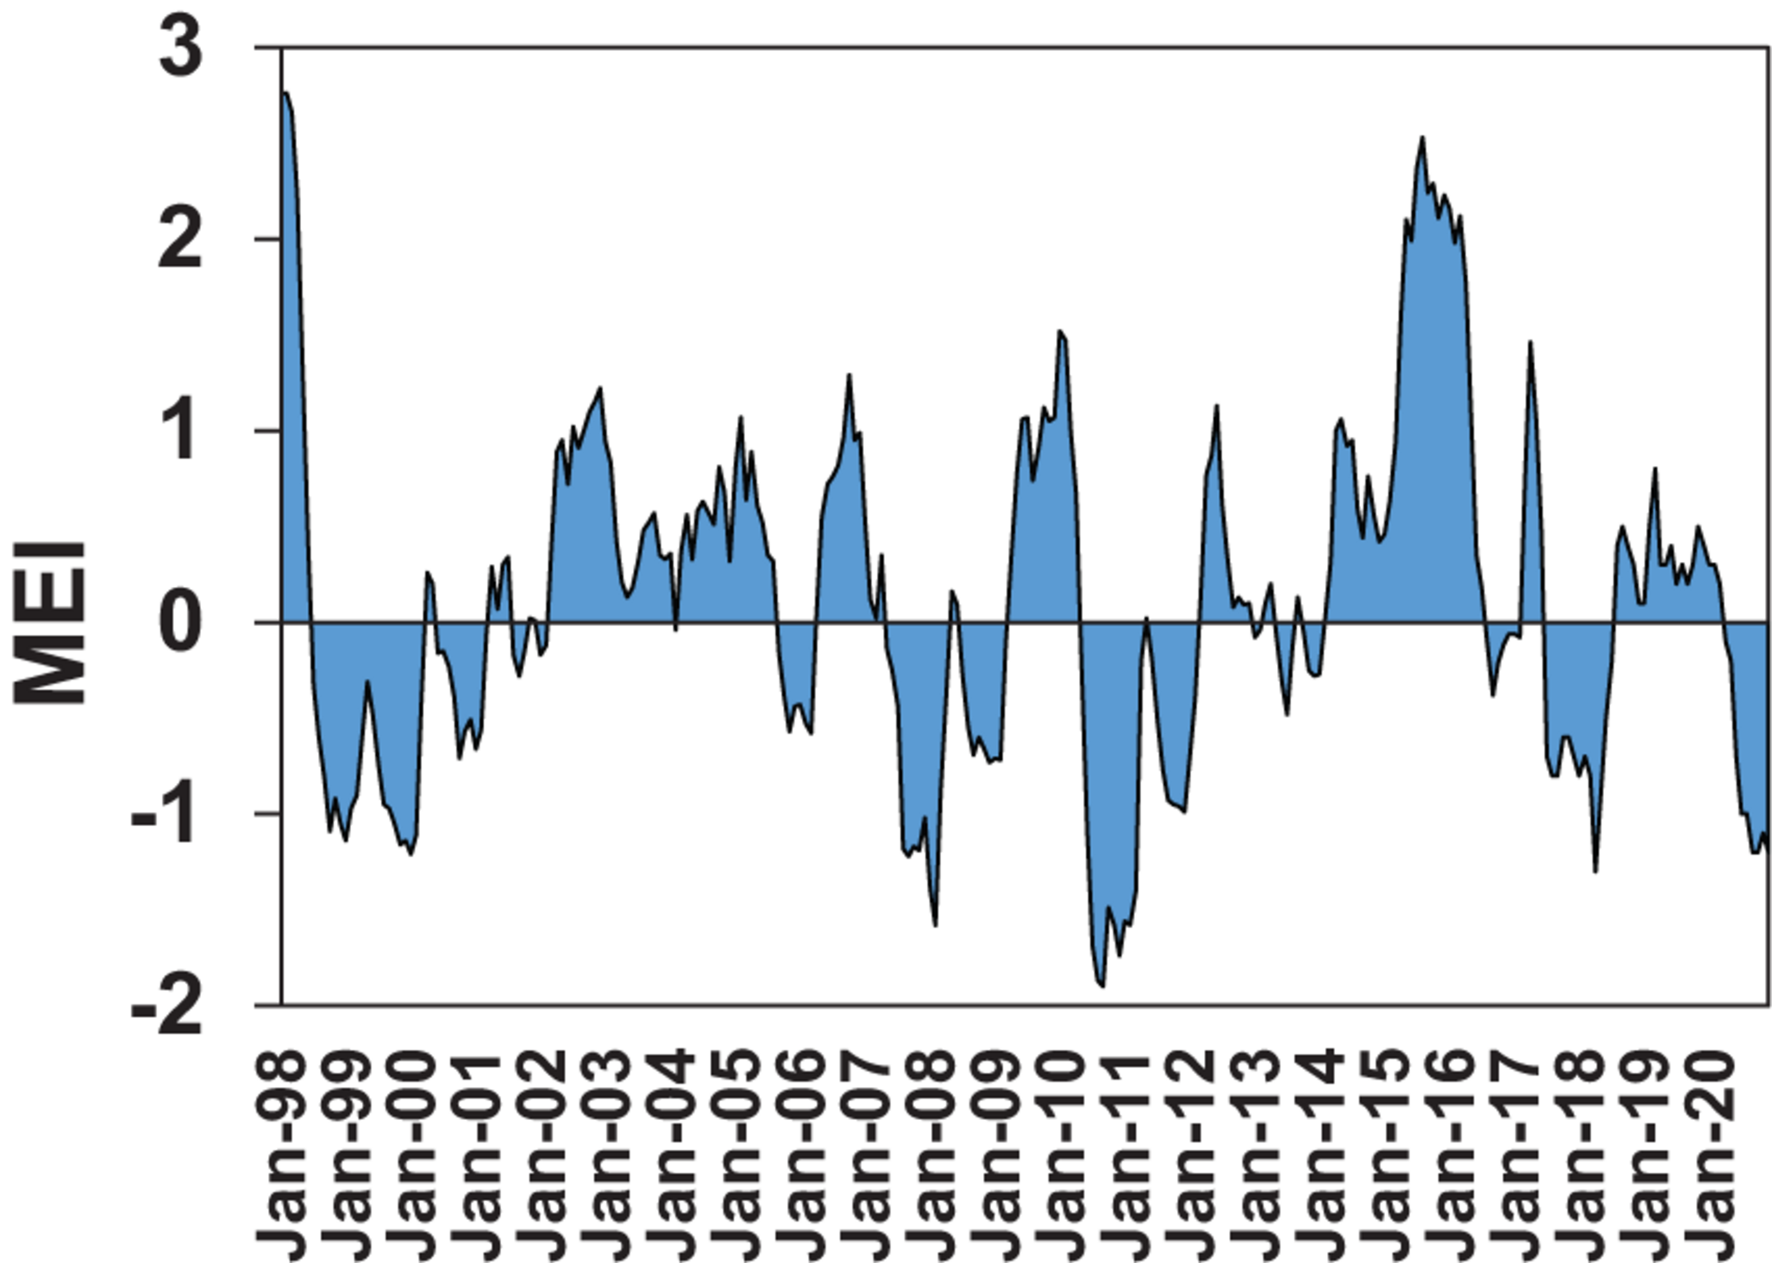
Multivariate ENSO Index (MEI) from 1998 to 2020. Positive values indicate El Niño periods and negative values La Niña periods.
Physical-Chemical Factors
The 23-year study period was characterized by two broad trends in salinity related to multi-year shifts in rainfall, i.e., (1) increasing salinities during generally below average rainfall periods, including 1998 through the summer of 2001, 2006 through the summer of 2008, 2010 through the summer of 2014, and 2016 and (2) declining salinities during generally above average rainfall periods, including fall 2001 through 2005, 2008–2009, fall of 2014 through 2015, 2017, and 2020 (Figure 7). The trends were subject to episodic departures related to shorter-term rainfall events, e.g., the strong Tropical Storm Fay in the late summer of 2008, which resulted in a dip in salinity during a period of generally increasing values. Salinity ranges and amplitudes of variability also varied between sites. Salinities were highest at Site 1, with peaks up to 46 psu, followed by Site 2, and lowest at Site 3 (Figure 7). Differences in salinity patterns between the three sub-regions of NIRL reflect differences in hydrologic characteristics (e.g., mean depths, water residence times, and watershed characteristics) and fine spatial scale variability in rainfall patterns.
FIGURE 7
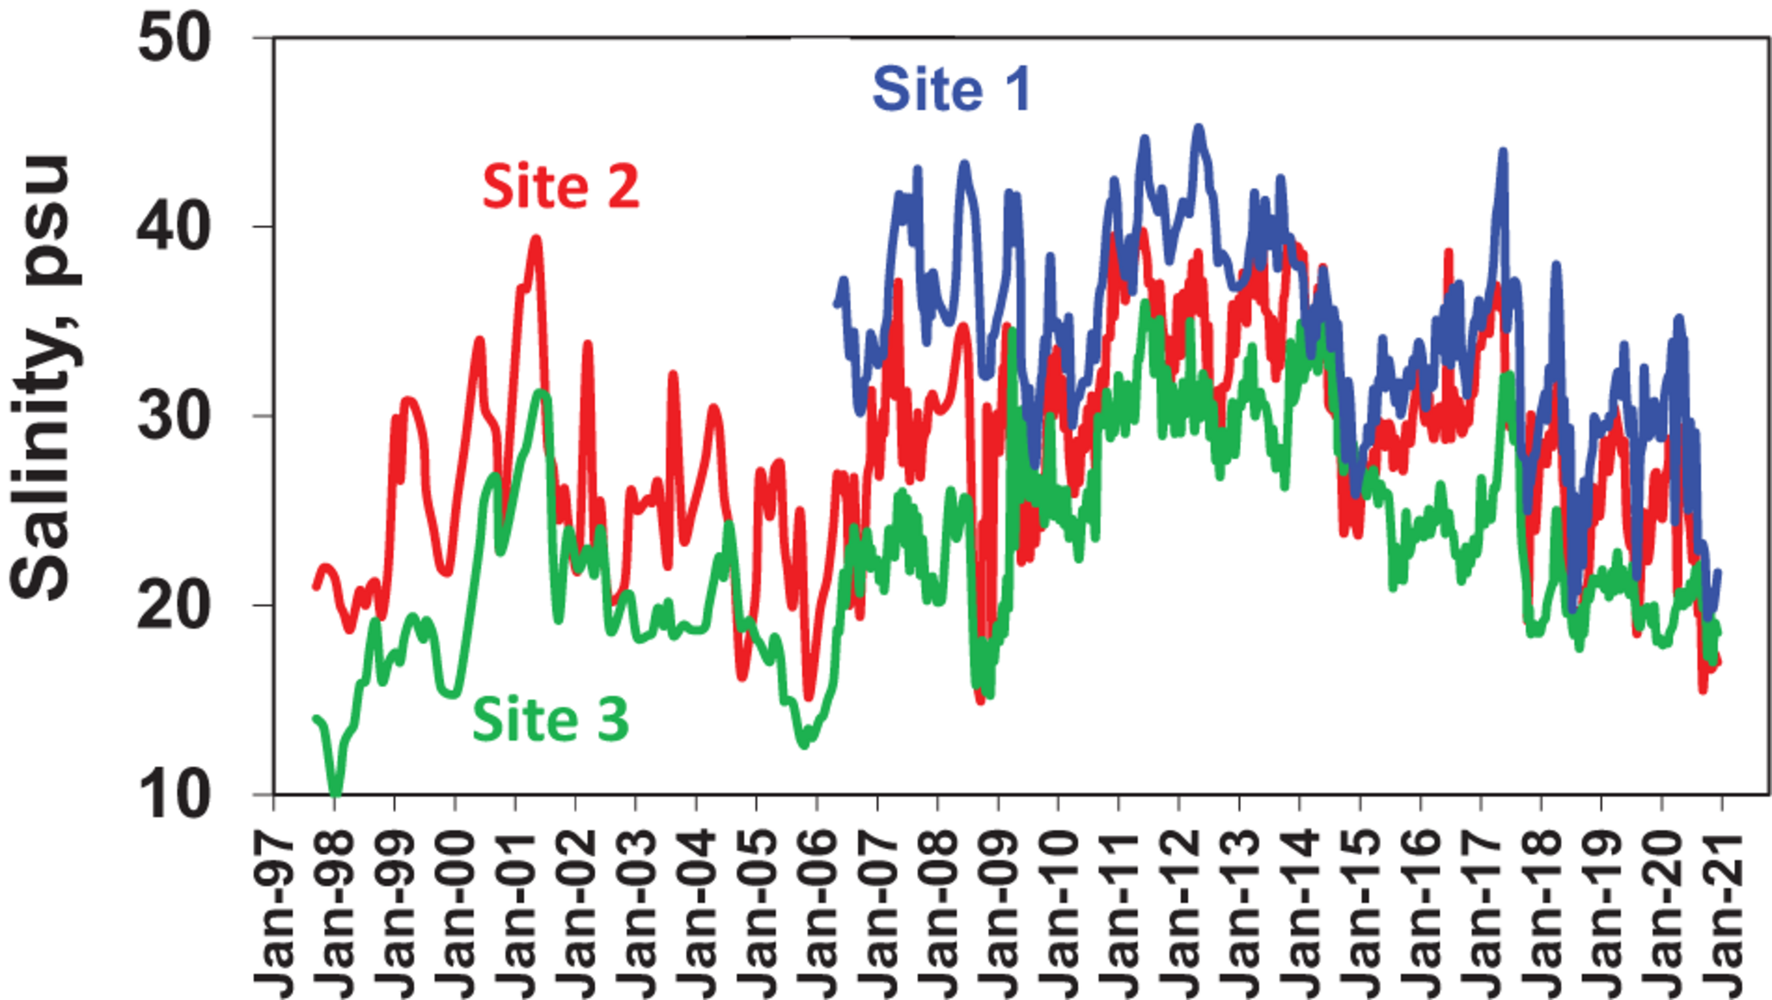
Surface water salinities at the three primary sampling sites, i.e., Site 1 in the southern Mosquito Lagoon (blue line), Site 2 in the northern Indian River Lagoon at Titusville (red line), and Site 3 in the central Banana River (green line).
Secchi disk depths varied between 0.5 and 2.5 m in all three sub-regions of NIRL over the first 13 years of the study (Figure 8). After 2010, extended periods of Secchi depths below 0.5 m were observed in all three sub-regions in association with major phytoplankton bloom events, with values as low as 0.1 m.
FIGURE 8
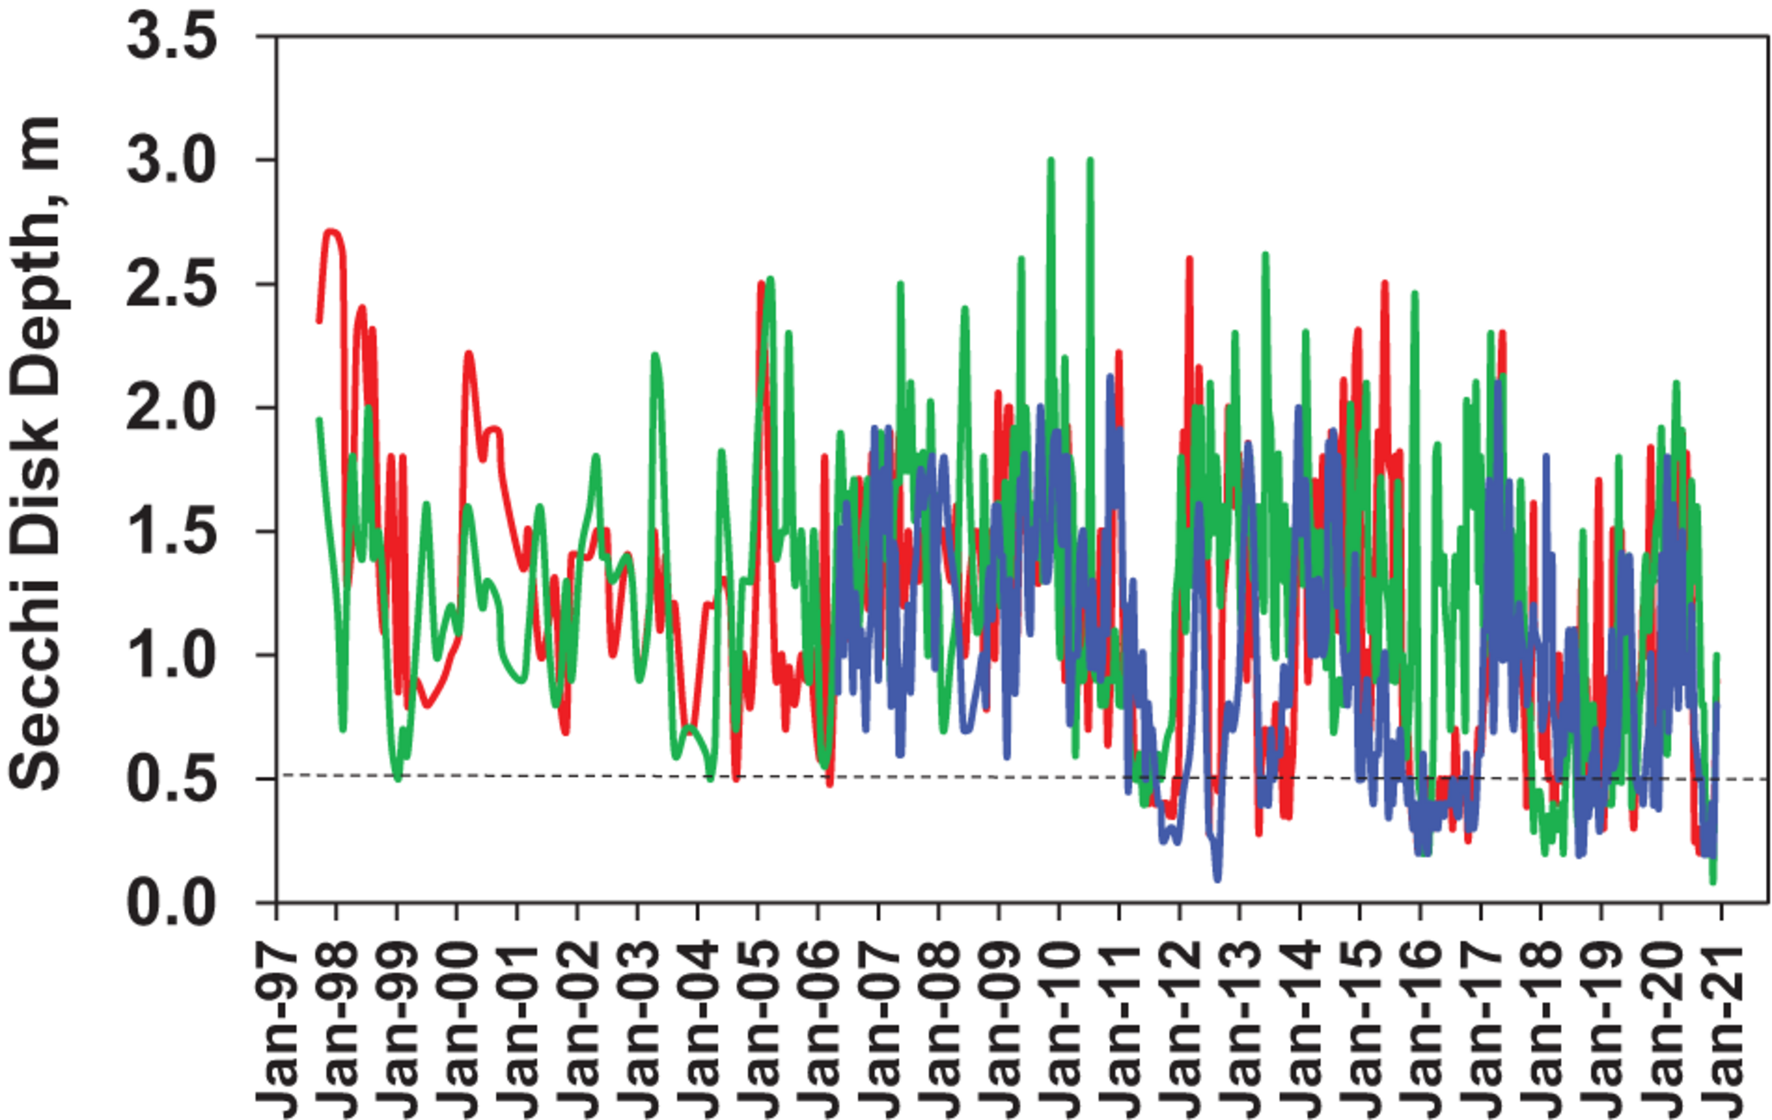
Secchi disk depths at the three primary sampling sites, Site 1 in the southern Mosquito Lagoon (blue line), Site 2 in the northern IRL near Titusville (red line) and Site 3 in the central Banana River lagoon (green line).
Overall patterns of TP concentrations were similar among sub-regions, with a strong rise in 2010–2013, followed by multiple major peaks in subsequent years (Figure 9). From 1997 to 2010, TP concentrations ranged from 0.004 to 0.076 mg L–1 at Site 1 in southern Mosquito Lagoon, 0.006 to 0.105 mg L–1 at Site 2 in the northern IRL near Titusville, and 0.008 to 0.125 mg L–1 at Site 3 in the central Banana River Lagoon. Mean values for 1997 to 2010 were 0.031, 0.036, and 0.051 mg L–1, for Sites 1, 2 and 3, respectively (Table 3). From 2011 to 2020, TP concentrations ranged from 0.010 to 0.205 mg L–1 at Site 1 in southern Mosquito Lagoon, 0.007 to 0.185 mg L–1 at Site 2 in the northern IRL near Titusville, and 0.011 to 0.227 mg L–1 at Site 3 in the central Banana River (Figure 9). Mean values for 2011 to 2020 were 0.073, 0.081, and 0.084 mg L–1, for Sites 1, 2, and 3, respectively (Table 3). Mean values for the 2011–2020 period were higher than the 1997–2010 period by 2.35-times at Site 1, 2.25-times at Site 2, and 1.65-times at Site 3.
FIGURE 9
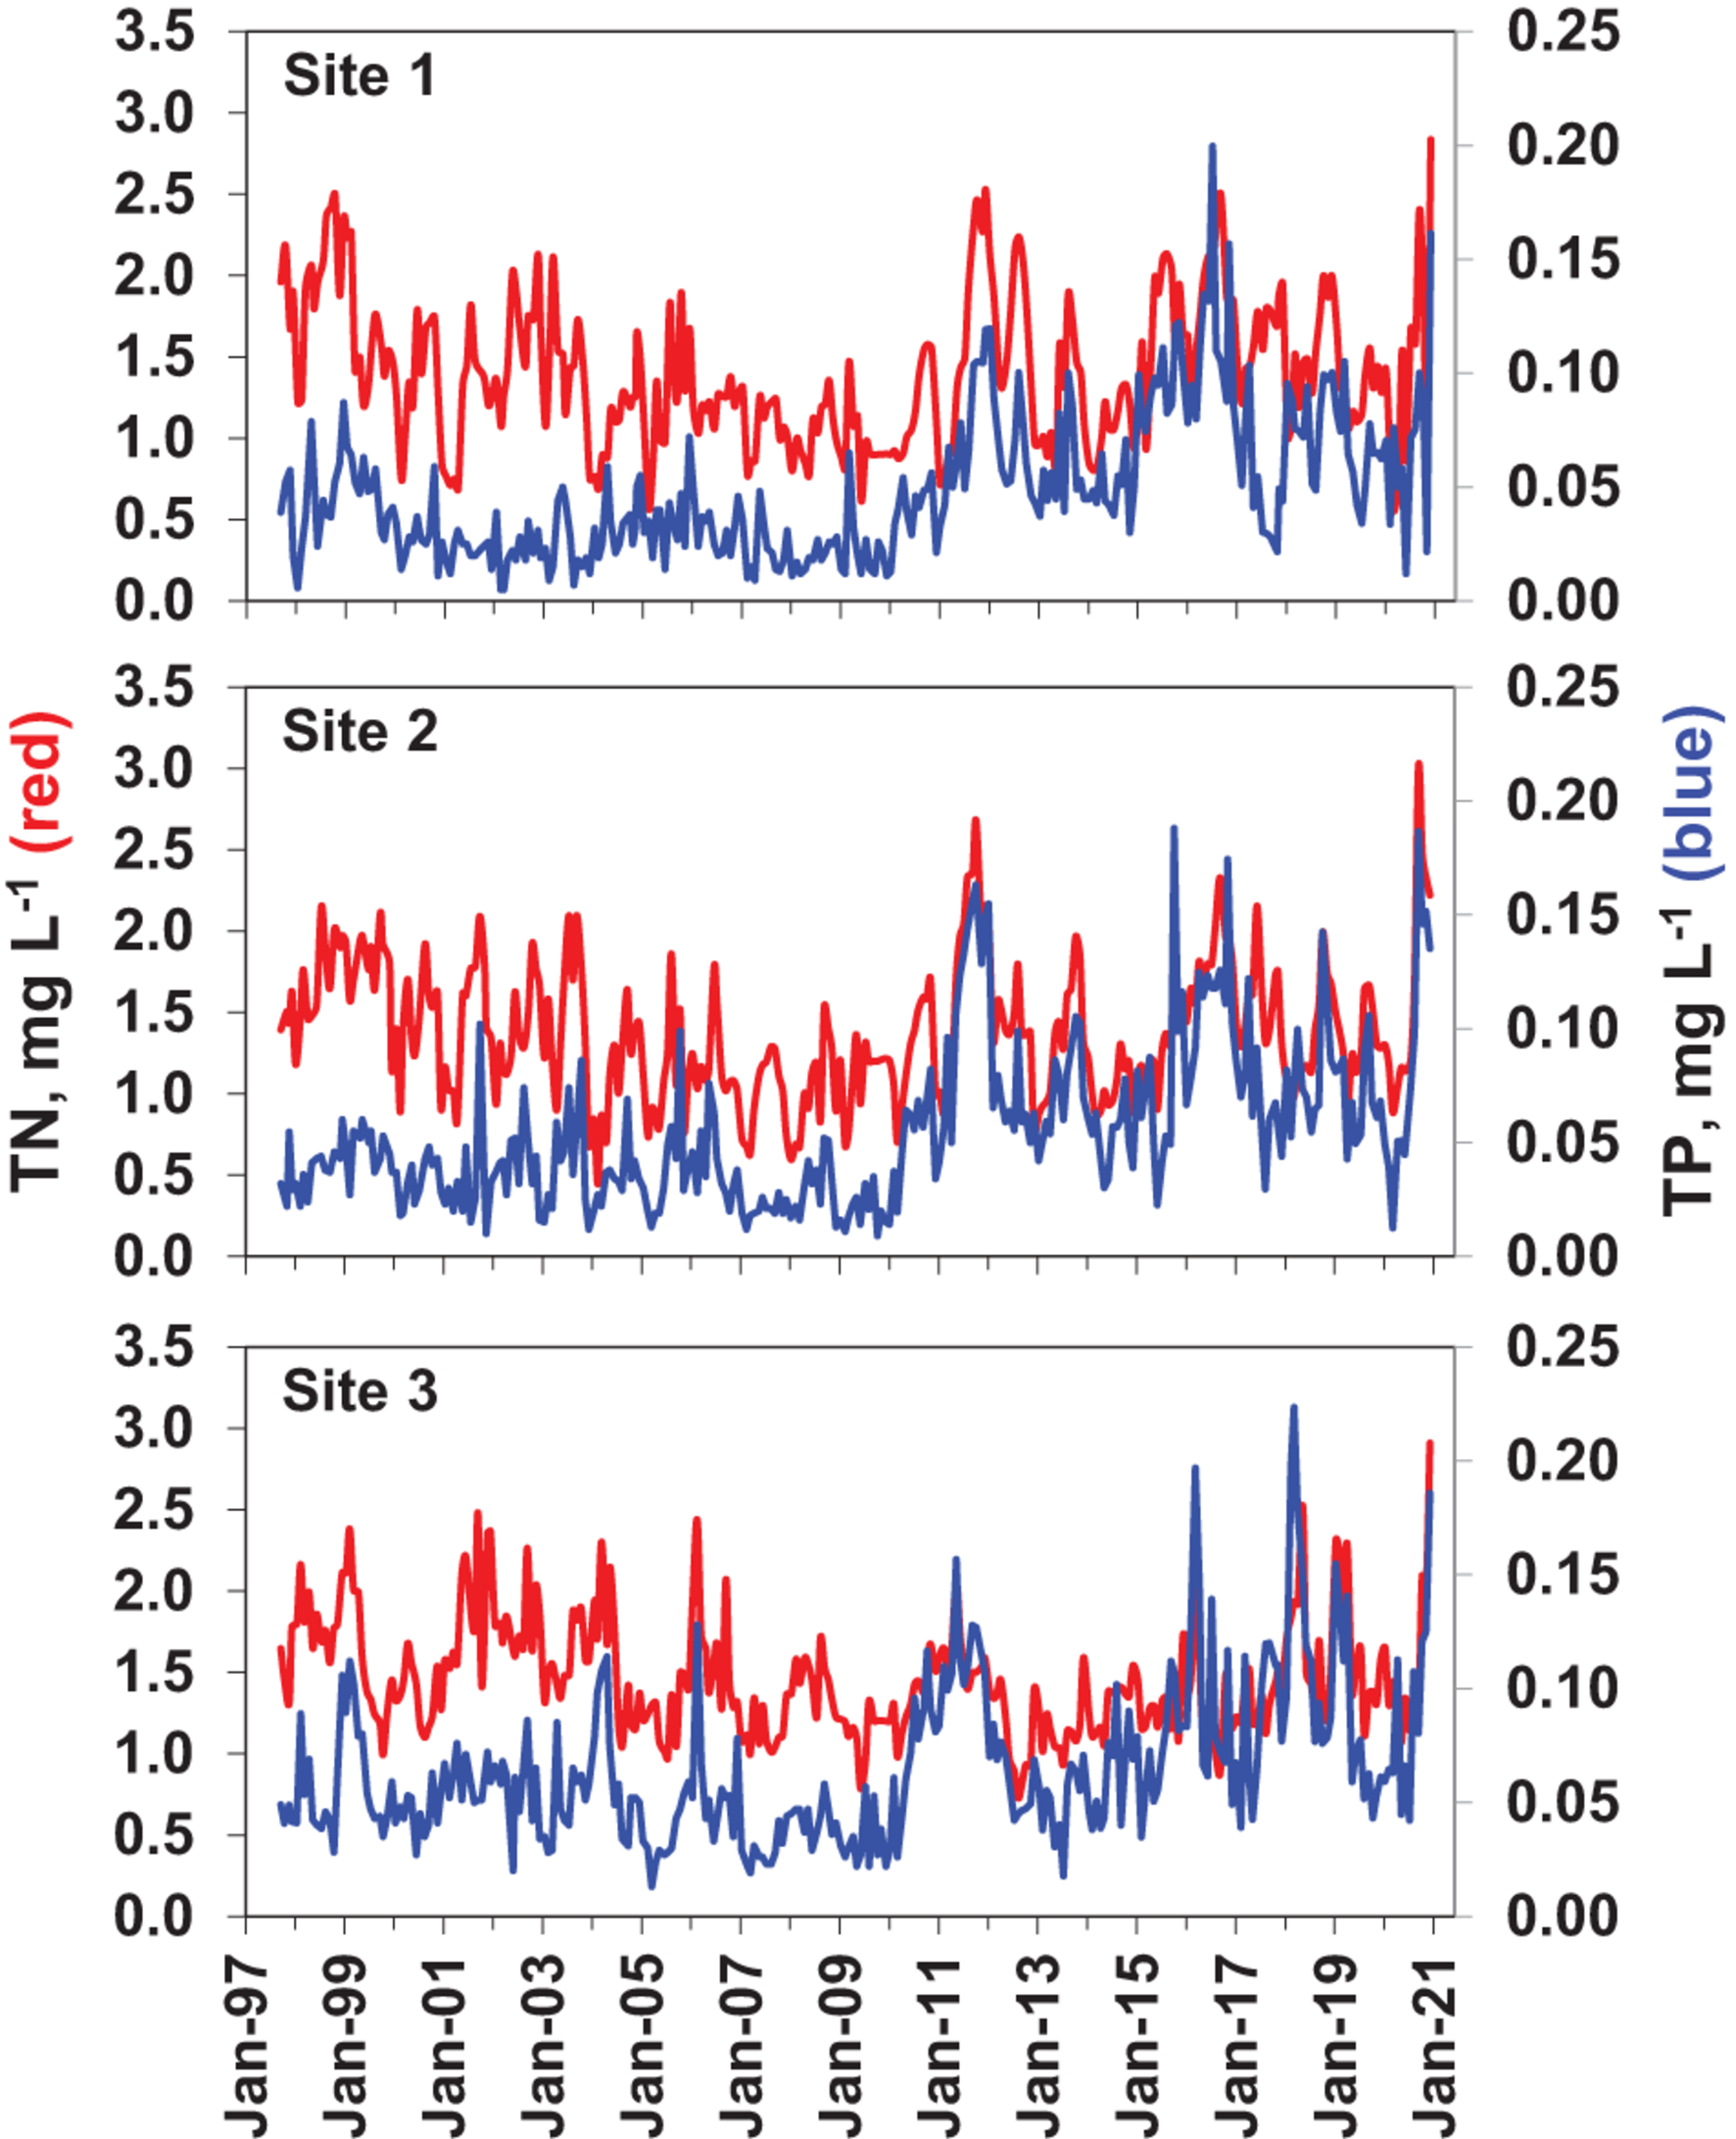
Total phosphorus (TP—blue lines) and total nitrogen (TN—red lines) concentrations at the three sampling sites are shown in the bottom panels for each site.
TABLE 3
| Mean concentration (mg L–1) | ||||
|
|
||||
| Site | Period | TP | TN | TN/TP |
| 1 | 1997–2010 | 0.031 B | 1.32 B | 54 A |
| (−0.016) | (−0.41) | (−34) | ||
| 2011–2020 | 0.073 A | 1.51 A | 24 B | |
| (−0.031) | (−0.46) | (−11) | ||
| 2 | 1997–2010 | 0.036 B | 1.31 B | 43 A |
| (−0.017) | (−0.38) | (−20) | ||
| 2011–2020 | 0.081 A | 1.46 A | 20 B | |
| (−0.036) | (−0.42) | (−7) | ||
| 3 | 1997–2010 | 0.051 B | 1.50 A | 33 A |
| (−0.022) | (−0.35) | (−12) | ||
| 2011–2020 | 0.085 A | 1.40 B | 19 B | |
| (−0.039) | (−0.35) | (−6) | ||
Mean total phosphorus (TP) concentrations, total nitrogen (TN) concentrations, and TN/TP ratios at the three primary sampling sites: 1. southern Mosquito Lagoon, 2. northern IRL at Titusville and 3. central Banana River Lagoon.
Standard deviations are shown in parentheses. The results of statistical multiple range tests using log-transformed data (p, 0.05) are shown as letter values next to mean values. Mean values for each site with the same letter designation are not significantly different.
Total nitrogen (TN) concentrations ranged from below 0.5 to near or above 3.0 mg L–1 at all three sites in the study (Figure 9). Peak concentrations gradually declined over the first 13 years of the study at all three sites, then rose again after 2010. From 1997 to 2010, TN concentrations ranged from 0.4 to 2.4 mg L–1 at Site 1 in southern Mosquito Lagoon, 0.2 to 2.3 mg L–1 at Site 2 in the northern IRL near Titusville, and 0.2 to 2.5 mg L–1 at Site 3 in the central Banana River (Figure 7). Mean values for 1997 to 2010 were 1.32, 1.31, and 1.50 mg L–1, for Sites 1, 2, and 3, respectively (Table 3). From 2010 to 2020, TN concentrations ranged from 0.6 to 2.9 mg L–1 at Site 1 in southern Mosquito Lagoon, 0.2 to 3.3 mg L–1 at Site 2 in the northern IRL near Titusville, and 0.2 to 3.2 mg L–1 at Site 3 in the central Banana River (Figure 9). Mean values for 2011 to 2020 were 1.51, 1.46, and 1.40 mg L–1, for Sites 1, 2, and 3, respectively (Table 3). Mean values for the 2011–2020 period were higher than the 1997–2010 period by 1.14-times at Site 1, and 1.11-times at Site 2, but declined by 0.93-times at Site 3.
Differences in mean TN and TP concentrations from the 1997–2010 and 2011–2020 time periods were further reflected in the TN/TP ratios (Table 3). Mean TN/TP ratios were 53.5, 42.5, and 33.1 at Sites 1-3, respectively, in 1997–2010, then declined to 23.5, 19.9, and 18.7 at the three sites in 2011–2020.
Cyclical Patterns and Regime Shifts
One of the prominent cyclical patterns observed over the 23-year time series was higher mean total phytoplankton biomass values during El Niño periods, (i.e., 2002–2006, 2009–2010, 2014–2016 and 2018–2019) than La Niña periods (1999–2001, 2007–2008, 2011–2014, and 2017–2018) (Table 4). Mean biomass values for the pre- and post- initial changepoint (2011) periods exhibited differences in range, but the same relationships between La Niña and El Niño periods. El Niño periods are generally associated with declining salinities, which reflect overall elevated levels of rainfall and external watershed inputs. La Niña periods exhibit the opposite trend.
TABLE 4
| Mean Biomass (g carbon m–2) |
||
| Years | Period | Mean Biomass |
| 1999–2001 | La Niña | 0.33 E |
| −0.21 | ||
| 2002–2006 | El Niño | 0.77 CD |
| −0.89 | ||
| 2007–2008 | La Niña | 0.35 E |
| −0.36 | ||
| 2009–2010 | El Niño | 0.66 D |
| −0.83 | ||
| 2011–2014 | La Niña | 1.81 B |
| −2.73 | ||
| 2014–2016 | El Niño | 3.38 A |
| −4.41 | ||
| 2017–2018 | La Niña | 1.15 BC |
| −1.75 | ||
| 2018–2019 | El Niño | 3.84 A |
| 5.02 | ||
Estimates of mean total phytoplankton biomass per m2 for La Niña and El Niño periods from 1998 to 2020 in the three sub-lagoons of NIRL represented by sites 1–3, i.e., southern Mosquito Lagoon, northern IRL near Titusville and central Banana River.
Standard deviations are shown in parentheses. The results of statistical multiple range tests using log-transformed data (p, 0.05) are shown as letter values next to mean values. Mean values for each site with the same letter designation are not significantly different.
The dramatic change observed in bloom characteristics in 2011 fit the general criteria for a regime shift (aka, alternative stable state change), i.e., a “stark change” in the structure and function of an ecosystem inferred from long-term empirical data (MacNally et al., 2014). The results indicate two important differences in the magnitude of phytoplankton blooms and their relationship to nutrient concentrations for the pre-2011 (1997–2010) and post-2010 (2011–2020) time periods, i.e., (1) higher range of TP concentrations in the post-2010 period than pre-2011 period in all three sub-regions of NIRL, and a similar pattern for TN at Site 1, but less pronounced at Sites 2 and 3 and (2) higher phytoplankton biomass maxima at any given nutrient level in the post-2010 period for both TP and TN (Figure 10). These relationships are further exemplified by the regression relationships between annual average TP and TN concentrations and annual average phytoplankton biomass in the 1997–2010 and 2011–2020 time periods, which show steeper slopes for the post-2010 period (Figure 11). Slopes for both the pre- and post- change point periods regressions were significantly different than zero (p < 0.01) for all of the regressions except that for TN in the pre-period (Figure 11C). R2 values for the regressions with TP were higher than for TN.
FIGURE 10
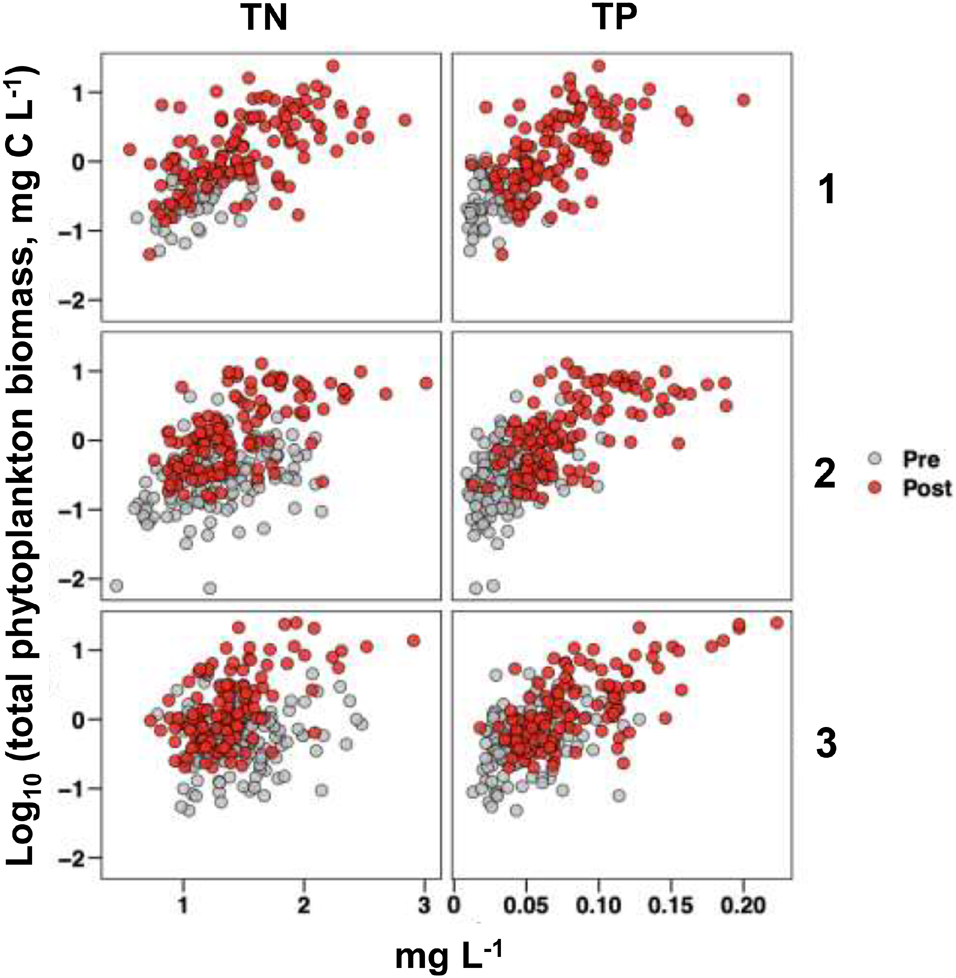
Log10-transformed total phytoplankton biomass versus TN (left) and TP (right) for sites 1, 2, and 3. Observations made prior to 2011 (pre) are shown in gray; observations made after 2010 (post) are shown in red. The total phytoplankton biomass data were log-transformed for visualization purposes as the majority of observations were made at relatively low total phytoplankton biomass measurements.
FIGURE 11
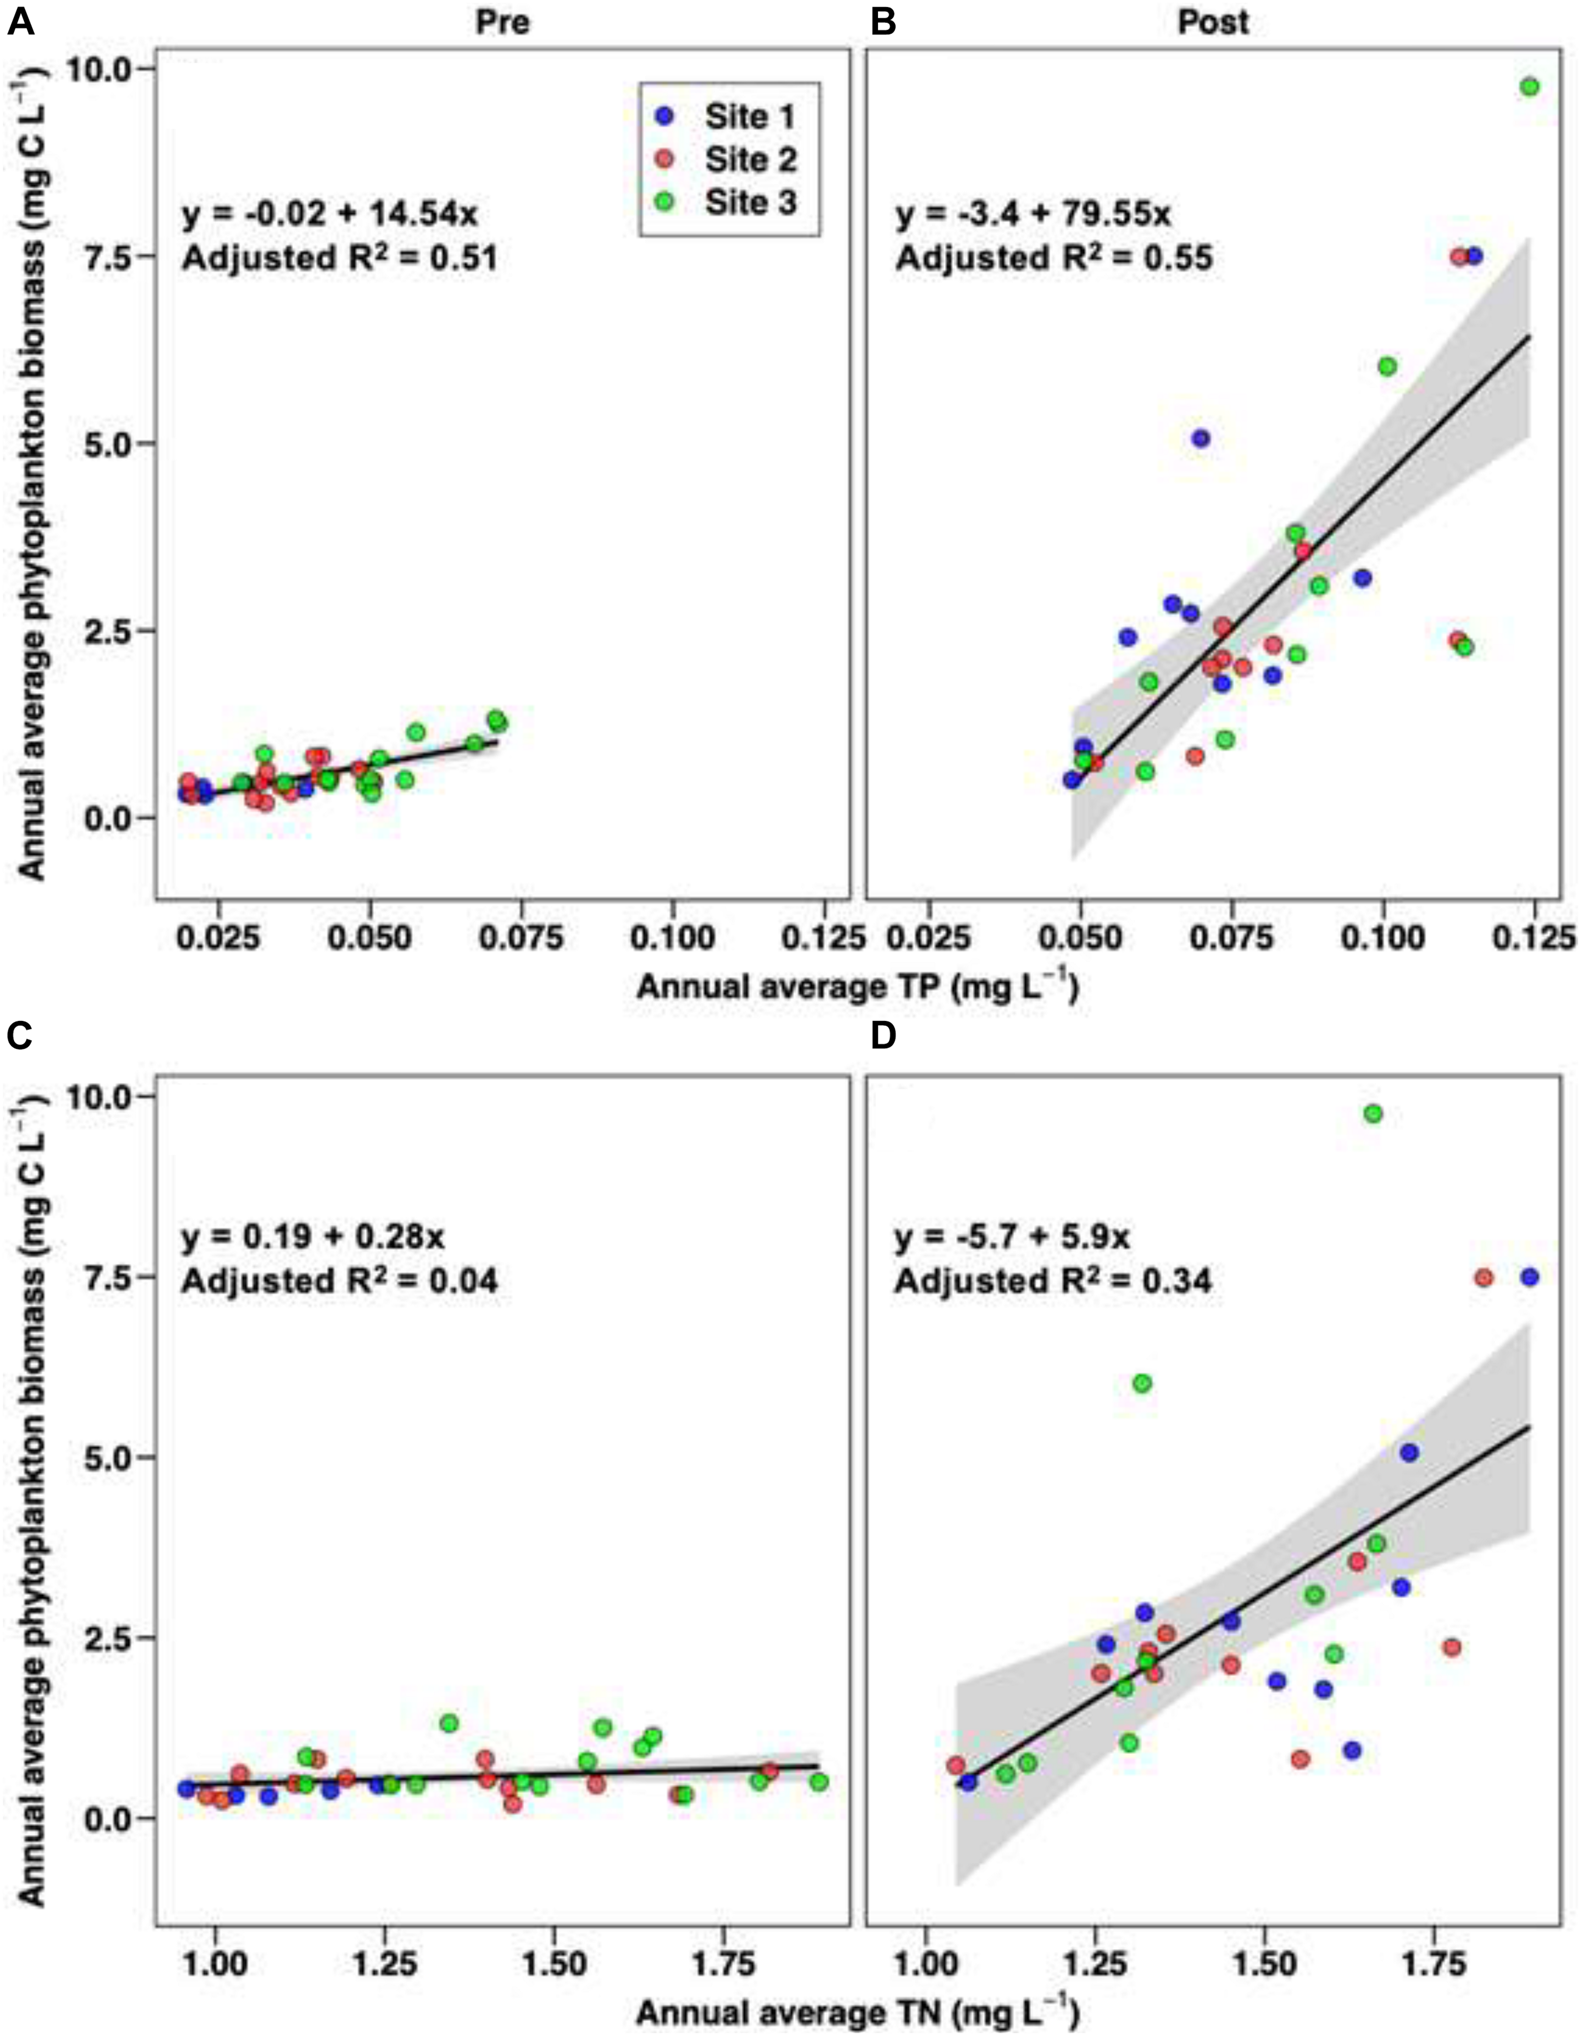
Linear regressions of annual average total phytoplankton biomass for the pre-shift (left) and post-shift (right) periods as a function of annual average total phosphorus [(top), (A,B)] and total nitrogen [(bottom), (C,D)]; observations from all three sites are included, with the colors of the points corresponding to the stations. The pre and post divisions were for data from 1997 to 2010 and 2011 to 2020, respectively.
Discussion
The NIRL ecosystem (i.e., NIRL) is subject to significant phytoplankton bloom activity. Three basic characteristics contribute to the potential for blooms; (1) long water residence times (i.e., average E50, 50% turnover rates >3 months) that provide the time needed for biomass accumulation, (2) shallow mean depths (i.e., 1.5–2 m) that enhance light availability for algal growth, and (3) high nutrient concentrations that increase algal biomass potential (Adkins et al., 2004; Steward et al., 2005; Steward and Green, 2007; Phlips et al., 2010; Phlips et al., 2015). As observed in many eutrophic coastal ecosystems around the world (Nixon, 1995; Heisler et al., 2008; O’Neil et al., 2012), dynamics of phytoplankton biomass in NIRL is correlated to changes in nutrient levels (Phlips et al., 2004, 2010, 2015; Steward and Green, 2007). Over the 23-year study period, phytoplankton blooms in NIRL have shown both cyclical patterns and a stark regime shift in intensity, duration and composition, beginning in 2011. These observations can be viewed within the context of variations in the availability of nutrients for the phytoplankton community.
Cyclical Patterns
From a seasonal perspective, the highest peaks in phytoplankton biomass in NIRL typically occur during the warmer months of the year, which coincides with the wet season (May–October), when external nutrient loads are elevated (Phlips et al., 2010). However, due to the location of NIRL in the subtropical region of east Florida, relatively modest seasonal variability in water temperature and incident irradiance enhance the potential for winter bloom events. During this study, winter bloom events were often dominated by cosmopolitan species with tolerance to lower temperatures, such as the diatom C. pelagica, and the dinoflagellate A. sanguinea, which have broader temperature preferences than the sub-tropical/tropical species found in NIRL (Badylak and Phlips, 2004; Phlips et al., 2010, 2015; Badylak et al., 2014). The potential for cold season blooms in NIRL is further illustrated by the intense A. lagunensis brown tides of 2016 and 2018, both of which began in the winter. By contrast, blooms in the warm season were often dominated by the tropical dinoflagellate species P. bahamense (Phlips et al., 2006).
In the future, progressive warming associated with climate change may result in further expansion of the peak bloom season (Jahan and Choi, 2014). The warming trend may also increase the frequency and intensity of tropical storms and hurricanes (Phlips et al., 2020). High rainfall and winds associated with major storms can increase external and internal (e.g., sediment resuspension and benthic biomass disruption) nutrient loads that support bloom development. This is illustrated by the occurrence of two major hurricanes (Emily and Irma) in Florida in 2017, which was followed by a major bloom event in NIRL starting in the winter of 2017/18 and extending into 2018.
On a longer time scale, another element of cyclical variability of phytoplankton blooms is the influence of El Niño and La Niña periods. A number of recent studies of coastal ecosystems have linked El Niño/La Niña cycles to changes in phytoplankton biomass and composition (Zhu et al., 2017; Zhao et al., 2018; Jiménez-Quiroz et al., 2019; Phlips et al., 2020). In the Southeastern United States, El Niño and La Niña periods are associated with wetter and dryer than average conditions, respectively (Piechota and Dracup, 1996; Schmidt and Luther, 2002). The pattern results in above and below average watershed inflows to coastal aquatic ecosystems (Kahya and Dracup, 1993; Dracup and Kahya, 1994). Nutrients enter NIRL from a variety of external sources, including surface water runoff, tributary inflows, groundwater inputs, rainfall, septic system seepage, and periodic permitted and accidental releases from sewage treatment systems (Swarzenski et al., 2001; Adkins et al., 2004; Steward and Green, 2007; Gao, 2009; Lapointe et al., 2015; Trefry and Fox, 2021). All of these inputs can be exacerbated by high rainfall levels. El Niño periods are noted for elevated rainfall levels in the dry season (i.e., late fall through early spring). Given the very long water residence times in NIRL (E50 > 3 months), elevated nutrient loads induced by rainfall in the dry season can enhance the potential for blooms from winter through early summer.
In this study, El Niño periods were characterized by higher peaks in bloom biomass (e.g., 2002–2006, 2009–2010, 2014–2016, 2018–2019), than in La Niña periods (e.g., 1999–2001, 2007–2008, 2011–2014, 2017–2018). One of the most dramatic examples of this relationship is the intense and protracted bloom in NIRL in 2015–2016, which began in the winter of 2015/16. This relationship is further illustrated by the positive correlation between the ENSO index and peak biomass of one of the dominant bloom-forming species in NIRL, the dinoflagellate P. bahamense (Phlips et al., 2006, 2015, 2020). A similar positive relationship between periods of elevated rainfall and blooms of P. bahamense has been reported in the Indo-Pacific region (Usup et al., 2012). Similar trends have been reported for rates of primary production in other coastal ecosystems (Belgrano et al., 1999; Paerl et al., 1999). By contrast, high rainfall El Niño periods in Baffin Bay in Texas appear to be associated with less intense brown tide blooms due to elevated flushing rates and reduced salinities (Cira et al., 2021). These contrasting impacts of El Niño/La Niña periods highlights the importance of recognizing regional differences in key ecosystem characteristics when determing the effects on HAB dynamics.
Regime Shift in NIRL
In addition to the aforementioned cyclical patterns, a sudden, stark and persistent shift in the biomass, composition and timing of phytoplankton blooms in NIRL was observed in 2011. The highest peaks in biomass in the post-2010 period were up to five or more times higher than prior to 2011, and the blooms expanded into the winter and spring seasons. From the perspective of phytoplankton community structure, an important feature of the post-shift period was the prominence of pico/nano-planktonic algae, including the brown tide species A. lagunensis, pico/nano-planktonic cyanobacteria and nano-planktonic eukaryotes. By contrast, in the pre-shift period microplanktonic dinoflagellates and diatoms were the dominant taxa in blooms. The results of this study provide insights into the drivers of the shift and how it fits into the concept of a regime shift.
Regime shifts in marine ecosystems have been attributed to a range of drivers of varying scale and character (Conversi et al., 2015; McMahon et al., 2015; Möllmann et al., 2015). Reports of regime shifts in planktonic communities have stressed the influences of climatic changes or events, such as well-documented long-term studies of temperature changes in the NE Atlantic Ocean (Beaugrand, 2004; Molinero et al., 2013; Alheit et al., 2019; Bode et al., 2020). Many reports of shifts also highlight the role that regional drivers, such as anthropogenic eutrophication and hydrologic alterations, can play in driving major and persistent changes in the structure and function of planktonic communities (Jahan and Choi, 2014; Phlips et al., 2015, 2020; Peperzak and Witte, 2019; Bode et al., 2020). There are frequently multiple drivers of change that operate synchronously (Beaugrand et al., 2015; Möllmann et al., 2015), and can lead to a cascade of trophic level impacts (Pershing et al., 2015). This is illustrated by the multi-year intense blooms of A. lagunensis in Laguna Madre lagoon in Texas that negatively impacted seagrasses and certain faunal communities (Buskey et al., 1998, 2001).
The regime shift in the intensity of phytoplankton blooms in NIRL involves both climatic and regional drivers. The increases in bloom biomass in 2011 coincided with a large increase in nutrient concentrations. Annual average TP concentrations after 2010 were two to three times higher than before 2011 and annual average TN concentrations were as high as any observed before 2010. The large increases in nutrients throughout NIRL in 2011 do not appear to be related to sudden increases in external load since it coincided with a largely below average rainfall period. Normally, low rainfall periods in NIRL are characterized by reduced external nutrient loads and comparatively low nutrient concentrations and phytoplankton biomass (Steward et al., 2005; Steward and Green, 2007; Phlips et al., 2010, 2015). This conundrum warrants a closer examination of changes in sources and sinks of nutrients underlying the regime shift in bloom characteristics in 2010. One major change in NIRL that coincided with the increases in nutrient levels and bloom intensities was widespread losses in seagrass communities, drift macroalgae and some pelagic fauna, including zooplankton and fish, in 2009–2011 (Phlips et al., 2015; Stevens et al., 2016). Major biomass losses in these communities appear to have precipitated a cascade of impacts, beginning with a re-distribution of bioavailable nutrients toward the phytoplankton community, and culminating in the regime shift in bloom intensities (Phlips et al., 2015). Estimates of the decline in seagrass, seagrass epiphytes and drift macroalgae biomass from 2009 to 2011 approximate the observed increase in peak phytoplankton biomass levels in 2011, providing supporting evidence for the latter hypothesis (Phlips et al., 2015).
Shifting of nutrient pools from benthic primary producer biomass into phytoplankton biomass has been observed in other eutrophic aquatic ecosystems subject to persistent phytoplankton blooms (Burkholder et al., 2007; Waycott et al., 2009; Schmidt et al., 2012). Losses of benthic primary producer biomass can enhance nutrient availability for phytoplankton blooms in several other ways. Bioavailable forms of nutrients entering the water column are competed for by planktonic and benthic primary producers, most prominently drift macroalgae, microphytobenthos (e.g., microalgae on the sediment surface) and epiphytes associated with seagrass communities (Phlips et al., 2015), therefore, losses in the latter communities can enhance nutrient availability for phytoplankton. Seagrass and microphytobenthos communities provide stabilization of surface sediments, therefore their demise decreases the benthic nutrient filter effect, resulting in increased fluxes of nutrients from sediments into the water column (Macintyre et al., 2004; Sundbäck et al., 2004; Murrell et al., 2009; Eyre et al., 2011; Anderson et al., 2014). Sediment destabilization also can enhance the potential for re-suspension of nutrient-rich muck sediments (Trefry et al., 1990; Aoki et al., 2020). In addition, periodic reductions in oxygen concentrations near the sediment surface associated with major phytoplankton blooms can enhance mobilization of nutrients from sediments into the water column (Reay et al., 1995; Engelsen et al., 2008; Cook et al., 2009). The senescence of blooms also contributes to the accumulation of nutrients in sediments, thereby enhancing legacy loads in the ecosystem (Lemley et al., 2021). All of these factors likely contributed to the additional nutrients needed for the exceptionally intense phytoplankton blooms observed in NIRL after 2010.
A number of factors likely contributed to the 2009–2011 declines in benthic primary producer communities in NIRL, including exceptionally low winter temperatures in 2009/2010 and 2010/2011 (i.e., temperature minima near 5°C) and above average salinities (i.e., salinities > 35 psu) due to below average rainfall levels. These observations also highlight a more general issue involving the response of subtropical ecosystems to low temperature excursions, because of the presence of large numbers of flora and fauna species of tropical origin sensitive to low temperature extremes. Analogous observations have been made in relation to uncharacteristically high temperature conditions in temperate ecosystems (Rhodes et al., 1993; Nehring, 1998; Cloern et al., 2005; Edwards et al., 2006). Low light availability for benthic primary producer communities caused by the protracted phytoplankton bloom in 2011 exacerbated losses of seagrass and drift macroalgal biomass (Hall et al., 2021). Continued intense phytoplankton blooms after 2011 have prolonged the problem of light limitation. The intense phytoplankton blooms in NIRL during the post-2010 period were associated with very low Secchi disk depths, i.e., 0.1–0.5 m. Based on the average depths of the sub-regions of NIRL (i.e., 2 m), such low Secchi depths create a condition where incident irradiances near the sediment surface are below that needed to support growth and survival of benthic primary producer communities, i.e., near 10–15% of surface irradiance (Dennison, 1987; Duarte, 1991; Steward et al., 2005; Duarte et al., 2007; Lee et al., 2007; Breininger et al., 2016). It is therefore not surprising that little to no recovery of seagrasses has been observed in annual surveys of distribution and biomass from 2011 to 2020 (Phlips et al., 2015). Similar issues have been raised for the 8-year brown tide event in Laguna Madre, Texas (Onuf, 1996).
Regime Shift in Phytoplankton Composition
The other major attribute of the regime shift in 2011 was the dominant role played by pico-nano planktonic phytoplankton in blooms. A similar dominance by nanoplanktonic species was observed during the eight-year brown tide event in Laguna Madre, Texas (Buskey et al., 2001). As observed in NIRL, the bloom in Texas was associated with fish kills and widespread losses of seagrass biomass. It has been hypothesized that elevated levels of ammonium and organic forms of nitrogen and phosphorus associated with recycled biomass (e.g., decaying seagrass, benthic algae, and senescing phytoplankton bloom biomass) provide a competitive advantage for brown tide and other pico-nanoplanktonic species in competition for nutrients (DeYoe and Suttle, 1994; Liu et al., 2001; Berg et al., 2002; Buskey et al., 2003; DeYoe et al., 2007; Glibert et al., 2007; Muhlstein and Villareal, 2007; Sun et al., 2012; Kang et al., 2015; Wetz et al., 2017). A similar argument may apply to pico/nano-planktonic bloom-forming species in NIRL post-2010 (Phlips et al., 2015; Papacek, 2018). Many species in these groups are flexible in their methods of obtaining nutrients, such as the use of organic forms, nitrogen fixation, and mixotrophic strategies (e.g., heterotrophy, osmotrophy, and phagotrophy; Phlips et al., 1989; Stolte and Riegman, 1996; Chung et al., 2003; Moore et al., 2005; Dyhrrnan and Ruttenberg, 2006; Burkholder et al., 2008; Sunda and Hardison, 2010; Kathuria and Martiny, 2011; Lindehoff et al., 2011; Yuan et al., 2012; Stoecker et al., 2017; Papacek, 2018). Many pico/nano-phytoplankton species are also known to be efficient in the use of phosphorus (Chung et al., 2003; Moore et al., 2005; Dyhrrnan and Ruttenberg, 2006; Sunda and Hardison, 2010; Kathuria and Martiny, 2011), including the brown tide species A. lagunensis that dominated many of the blooms in NIRL after 2011 (Kang et al., 2015). This observation helps to explain why some of the peaks in bloom biomass from 2012 to 2020 were high relative to TP concentrations, compared to blooms of micro-phytoplankton blooms prior to 2011.
Another factor that may have contributed to the exceptionally high phytoplankton biomass levels in the post-2010 period is reduction in top-down control. An ability to deter grazing has been reported for a range of bloom species (Turner and Tester, 1997; Buskey, 2008; Smayda, 2008; Sunda and Hardison, 2010), including the brown tide species A. lagunensis that has been a dominant feature of blooms in NIRL after 2010 (Buskey et al., 1997; Kang et al., 2015; Galimany et al., 2020). The effect may also extend to other taxa, such as certain cyanobacteria species (Urrutia-Cordero et al., 2016). The impact of variability in top-down versus bottom-up pressures on phytoplankton biomass has been observed in a number of marine ecosystems (Pershing et al., 2015).
Summary
Over the 23-year period of this study, major phytoplankton bloom events were frequently observed in NIRL Three characteristics contribute to the potential for blooms in NIRL, namely long water residence times that provide the time needed for biomass accumulation, shallow mean depths that enhance light availability for algal growth, and high internal and external nutrient loads that increase algal biomass potential. Cyclical climatic patterns (e.g., seasonal cycles and El Niño/La Niña periods) influence rainfall levels, which in turn impact external nutrient loads and thereby the timing and intensity of blooms. Beginning in 2011, a stark shift occurred in the character of blooms, with a dramatic increase in peak intensities of blooms and the appearance of new dominant taxa, including the brown tide species A. lagunensis and other nanoplanktonic taxa. At the same time historically important species, such as the toxic dinoflagellate P. bahamense, reached new peak biomass levels. The regime shift in the intensity and composition of blooms throughout NIRL coincided with major declines in two key structural and functional elements of the ecosystem, i.e., seagrasses and drift algae. The changes in the structure of the ecosystem appear to have resulted in dramatic increases in nutrient levels in the water column, leading to re-occurring intense phytoplankton blooms. The protracted nature of the blooms, and their negative impact on benthic light availability, likely exacerbated losses of seagrass biomass and established a new stable state, enhancing the flow of nutrients from both internal and external sources to phytoplankton. Changes in nutrient characteristics also may have provided conditions favorable for the enhanced role for pico- and nanoplanktonic phytoplankton species in bloom events. All of these considerations highlight that regime shifts are often a result of multiple stressors (Conversi et al., 2015; Möllmann et al., 2015). The potential for return to pre-regime shift dynamics in the phytoplankton community of NIRL may depend on the recovery of key elements of the system, such as seagrass communities.
Publisher’s Note
All claims expressed in this article are solely those of the authors and do not necessarily represent those of their affiliated organizations, or those of the publisher, the editors and the reviewers. Any product that may be evaluated in this article, or claim that may be made by its manufacturer, is not guaranteed or endorsed by the publisher.
Statements
Data availability statement
The raw data supporting the conclusions of this article will be made available by the authors, without undue reservation.
Author contributions
EP: primary author of the manuscript. SB: primary taxonomist on research. NN: statistical analyses. LH: field research leader. CJ: water quality data provider. ML and JM: water quality data provider. JL: assistance in phytoplankton taxonomy. All authors contributed to the article and approved the submitted version.
Funding
The research was in part funded by the St. Johns River Water Management District, the Indian River Lagoon National Estuary Program (EPA) and institutional support from the University of Florida Institute of Food and Agricultural Sciences. EP and NN were partly supported by the USDA National Institute of Food and Agriculture, Hatch project 1017098 and 1016068, respectively.
Conflict of interest
The authors declare that the research was conducted in the absence of any commercial or financial relationships that could be construed as a potential conflict of interest. The handling editor is currently organizing a Research Topic with authors EP and CJ.
Footnotes
1.^ https://waterdata.usgs.gov/nwis/uv?referred_modules=qw&search_site_no=02248380
2.^ https://nwis.waterdata.usgs.gov/nwis/uv?cb_00010=on&format=gif_default&site_no=02248380&period=&begin_date=1996-01-01&end_date=2017-12-31
References
1
Adkins M. Mao M. Taylor M. Green W. Basci C. Bergman M. et al (2004). Watershed model development for the Indian River Lagoon basin: Providing simulated runoff and pollution load to the Indian River Lagoon pollution load reduction model.Florida: St. Johns River Water Management District, Technical Memorandum 50.
2
Ahlgren G. (1983). Comparison of methods for estimation of phytoplankton carbon.Arch. Hydrobiol.98489–508.
3
Alheit J. Gröger J. Licandro P. McQuinn I. H. Pohlmann T. Tsikliras A. C. (2019). What happened in the mid-1990s? The coupled ocean-atmosphere processes behind climate-induced ecosystem changes in the northeast Atlantic and the Mediterranean.Deep Sea Res. II Top. Stud. Oceanogr.159130–142. 10.1016/j.dsr2.2018.11.011
4
Anderson D. M. Burkholder J. M. Cochlan W. P. Glibert P. M. Gobler C. J. Heil C. et al (2008). Harmful algal blooms and eutrophication: examining linkages from selected coastal regions of the United States.Harmful Algae839–53. 10.1016/j.hal.2008.08.017
5
Anderson I. C. Brush M. J. Piehler M. F. Currin C. A. Stanhope J. W. Smyth A. R. et al (2014). Impacts of climate-related drivers on the benthic nutrient filter in a shallow photic estuary.Estuaries Coasts37S46–S62. 10.1007/s12237-013-9665-5
6
Aoki L. R. McGlathery K. J. Oreska M. P. J. (2020). Seagrass restoration reestablishes the coastal nitrogen filter through enhanced burial.Limnol. Oceanogr.651–12. 10.1002/lno.11241
7
Badylak S. Kelly K. Phlips E. J. (2004). A description of Pyrodinium bahamense from the Indian River Lagoon, Florida, USA.Phycologia43653–657. 10.2216/i0031-8884-43-6-653.1
8
Badylak S. Phlips E. J. (2004). Spatial and temporal patterns of phytoplankton abundance and composition in a subtropical lagoon, the Indian River Lagoon. Florida, USA.J. Plankton Res.261–22. 10.1093/plankt/fbh114
9
Badylak S. Phlips E. J. Mathews A. L. (2014). Akashiwo sanguinea (Dinophyceae) blooms in a sub-tropical estuary: an alga for all seasons.Plankton Benthos Res.91–9. 10.3800/pbr.9.147
10
Beaugrand G. (2004). The North Sea regime shift: evidence, causes, mechanisms and consequences.Prog. Oceanogr.60245–262. 10.1016/j.pocean.2004.02.018
11
Beaugrand G. (2015). Theoretical basis for predicting climate-induced abrupt shifts in the oceans.Philos. Trans. R. Soc. B370:20130264. 10.1098/rstb.2013.0264
12
Beaugrand G. Conversi A. Chiba S. Edwards M. Fonda-Umani S. Greene C. et al (2015). Synchronous marine pelagic regime shifts in the Northern Hemisphere.Philos. Trans. R. Soc. B370:20130272. 10.1098/rstb.2013.0272
13
Beisner B. E. Haydon D. T. Cuddington K. (2003). Alternative stable states in ecology.Front. Ecol. Environ.1:376–382. 10.2307/3868190
14
Belgrano A. Lindahl O. Hernroth B. (1999). North Atlantic Oscillation primary productivity and toxic phytoplankton in the Gullmar Fjord, Sweden (1985-1996).Proc. R. Soc. Lond. B266425–430. 10.1098/rspb.1999.0655
15
Berg G. M. Repeta D. J. LaRoche J. (2002). Dissolved organic nitrogen hydrolysis rates in axenic cultures of Aureococcus anophagefferens (Pelagophyceae): comparison with heterotrophic bacteria.Appl. Environ. Microbiol.68401–404. 10.1128/AEM.68.1.401-404.2002
16
Bienfang P. K. Szyper J. P. Okamoto M. Y. Noda E. K. (1984). Temporal and spatial variability of phytoplankton in a subtropical ecosystem.Limnol. Oceanogr.29527–539. 10.4319/lo.1984.29.3.0527
17
Bode A. Álvarez M. Garcia L. M. G. Louro M. Á Nieto-Cid M. Ruíz-Villarrael M. et al (2020). Climate and local hydrography underlie recent regime shifts in plankton communities off Galicia (NW Spain).Oceans1181–197. 10.3390/oceans1040014
18
Breininger D. R. Breininger R. D. Hall C. R. (2016). Effects of surrounding land use and water depth on seagrass dynamics relative to a catastrophic algal bloom.Conserv. Biol.3167–75. 10.1111/cobi.12791
19
Burkholder J. M. Glibert P. M. Skelton H. M. (2008). Mixotrophy, a major mode of nutrition for harmful algal species in eutrophic waters.Harmful Algae877–93. 10.1016/j.hal.2008.08.010
20
Burkholder J. M. Tomasko D. A. Trouchette B. W. (2007). Seagrasses and eutrophication.J. Exp. Mar. Biol. Ecol.35046–72. 10.1016/j.jembe.2007.06.024
21
Buskey E. J. (2008). How does eutrophication affect the role of grazers in harmful algal bloom dynamics?.Harmful Algae8152–157. 10.1016/j.hal.2008.08.009
22
Buskey E. J. Deyoe H. Jochem F. J. Villareal T. A. (2003). Effects of mesozooplankton removal and ammonium addition on planktonic trophic structure during a bloom of the Texas ‘brown tide’: a mesocosm study. J. Plankton Res.25, 215–228.
23
Buskey E. J. Liu H. B. Collumb C. Bersano J. G. F. (2001). The decline and recovery of a persistent Texas brown tide algal bloom in the Laguna Madre (Texas. USA).Estuaries24337–346. 10.2307/1353236
24
Buskey E. J. Montagna P. A. Amos A. F. Whitledge T. E. (1997). Disruption of grazer populations as a contributing factor to the initiation of the Texas brown tide algal bloom.Limnol Oceanogr.421215–1222. 10.4319/lo.1997.42.5_part_2.1215
25
Buskey E. J. Wysor B. Hyatt C. (1998). The role of hypersalinity in the persistence of the Texas ‘brown tide’ in the Laguna Madre.J. Plankton Res.201553–1565. 10.1093/plankt/20.8.1553
26
Capon S. J. Lynch A. Bond N. Chessman B. Davis J. Davidson N. et al (2015). Regime shifts, thresholds and multiple stable states in freshwater ecosystems: a critical appraisal of the evidence.Sci. Total Environ.534122–130. 10.1016/j.scitotenv.2015.02.045
27
Chiswell S. M. Calil P. H. R. Boyd P. W. (2015). Spring blooms and annual cycles of phytoplankton: a unified perspective.J. Plankton Res.37500–508. 10.1093/plankt/fbv021
28
Chung C. C. Hwang S. P. Chang J. (2003). Identification of a high-affinity phosphate transporter gene in a prasinophyte alga, Tetraselmis chui, and its expression under nutrient limitation.Appl. Environ. Microbiol.69754–759. 10.1128/AEM.69.2.754-759.2003
29
Cira E. K. Palmer T. A. Wetz M. S. (2021). Phytoplankton dynamics in a low-inflow estuary (Baffin Bay, TX) during drought and high-rainfall conditions associated with an El Niño event.Estuaries Coasts10.1007/s12237-021-00904-7
30
Cloern J. E. (2001). Our evolving conceptual model of the coastal eutrophication problem.Mar. Ecol. Progr. Ser.210223–253. 10.3354/meps210223
31
Cloern J. E. Jassby A. D. (2010). Patterns and scales of phytoplankton variability in estuarine-coastal ecosystems.Estuaries Coasts33230–241. 10.1007/s12237-009-9195-3
32
Cloern J. E. Schraga T. S. Lopez C. B. Knowles N. Labiosa R. G. Dugdale R. (2005). Climate anomolies generate an exceptional dinoflagellate bloom in San Francisco Bay.Proc. Nat. Acad. Sci. U. S. A.10418561–18656. 10.1073/pnas.0706151104
33
Conversi A. Dakos V. Gårdmark A. Ling S. Folke C. Mumby P. J. et al (2015). A holistic view of marine regime shifts.Philos. Trans. R. Soc. B370:20130279. 10.1098/rstb.2013.0279
34
Cook P. L. M. Van Oevelen K. D. Soetaert K. Middleburg J. (2009). Carbon and nitrogen cycling on intertidal mudflats of a temperate Australian estuary. IV. Inverse model analysis and synthesis.Mar. Ecol. Progr. Ser.39435–48. 10.3354/meps08270
35
Dennison W. C. (1987). Effects of light on seagrass photosynthesis, growth and depth distribution.Aquatic. Bot.2715–26. 10.1016/0304-3770(87)90083-0
36
DeYoe H. R. Buskey E. J. Jochem F. J. (2007). Physiological responses of Aureoumbra lagunensis and Synechococcus sp. to nitrogen addition in a mesocosm study.Harmful Algae648–55. 10.1016/j.hal.2006.06.001
37
DeYoe H. R. Suttle C. A. (1994). The inability of the Texas brown tide alga to use nitrate and the role of ntrogen in the initiation of a persistent bloom of this organism.J. Phycol.30800–806. 10.1111/j.0022-3646.1994.00800.x
38
Dracup J. A. Kahya E. (1994). The relationships between U.S. streamflow and La Niña events.Water Resour. Res.302133–2141. 10.1029/94WR00751
39
Duarte C. M. (1991). Seagrass depth limits.Aquat. Bot.40363–377. 10.1016/0304-3770(91)90081-F
40
Duarte C. M. Marbà N. Krause-Jensen D. Sánchez-Camacho M. (2007). Testing the predictive power of seagrass depth limit models.Estuaries Coasts30652–656. 10.1007/BF02841962
41
Dyhrrnan S. T. Ruttenberg D. C. (2006). Presence and regulation of alkaline phosphatase activity in eukaryotic phytoplankton from the coastal ocean: implications for dissolved organic phosphorus remineralization.Limnol. Oceanogr.531381–1390. 10.4319/lo.2006.51.3.1381
42
Edwards M. Johns D. G. Leterme S. C. Svendsen E. Richardson A. J. (2006). Regional climate change and harmful algal blooms in the north-east Atlantic.Limnol. Oceanogr.51820–829. 10.4319/lo.2006.51.2.0820
43
Engelsen A. Hulth S. Pihl L. Sundbäck K. (2008). Benthic trophic status and nutrient fluxes in shallow-water sediments.Estuar. Coast. Shelf Sci.78783–795. 10.1016/j.ecss.2008.02.018
44
Eyre B. D. Ferguson A. J. P. Webb A. Maher D. Oakes J. M. (2011). Denitrification, N-fixation and phosphorus fluxes in different benthic habitats and their contribution to the nitrogen and phosphorus budgets of a shallow oligotrophic sub-tropical coastal system (southern Moreton Bay, Australia).Biogeochemistry102111–133. 10.1007/s10533-010-9425-6
45
Galimany E. Lunt J. Freeman C. Houk J. Sauvage T. Santos L. et al (2020). Bivalve feeding responses to microalgal bloom species in the Indian River Lagoon: the potential for top-down control.Estuaries Coasts451519–1532. 10.1007/s12237-020-00746-9
46
Gao X. (2009). Nutrient and dissolved oxygen TMDLs for the Indian River Lagoon and Banana River Lagoon.Florida: Report to the Florida Department of Environmental Protection.
47
Glibert P. M. (2020). Harmful algae at the complex nexus of eutrophication and climate change.Harmful Algae91:101583. 10.1016/j.hal.2019.03.001
48
Glibert P. M. Wazniak C. E. Hall M. R. Sturgis B. (2007). Seasonal and interannual trends in nitrogen and brown tide in Maryland’s coastal bays.Ecol. Appl.17579–587. 10.1890/05-1614.1
49
Hall L. M. Morris L. Chamberlain R. Hanisak D. Virnstein R. Paperno R. et al (2021). Spatiotemporal patterns in the biomass of drift macroalgae in the Indian River Lagoon, Florida, USA.Frontiers Mar. Sci.(submitted).
50
Heisler J. P. Glibert P. M. Burkholder J. A. Anderson D. M. Cochlan W. Dennison W. et al (2008). Eutrophication and harmful algal blooms: a scientific consensus.Harmful Algae83–13. 10.1016/j.hal.2008.08.006
51
Jahan R. Choi J. K. (2014). Climate regime shift and phytoplankton phenology in a macrotidal estuary: long-term surveys in Gyeonggi Bay, Korea.Estuaries Coasts371169–1187. 10.1007/s12237-013-9760-7
52
Janssen A. Teurlincx S. An S. Janse J. Paerl H. Mooij W. (2014). Alternative stable states in large shallow lakes?.J. Great Lakes Res.40813–826. 10.1016/j.jglr.2014.09.019
53
Jiménez-Quiroz M. C. Cervantes-Duarte R. Funes-Rodríguez R. Barón-Campis S. A. García-Romero F. J. Hernández-Trujillo S. et al (2019). Impact of “The Blob” and “El Niño” in the SW Baja California peninsula: plankton and environmental variability of Bahia Magdalena.Front. Mar. Sci.6:25. 10.3389/fmars.2019.00025
54
Kahya E. Dracup J. A. (1993). U.S. Streamflow patterns in relation to the El Niño/Southern Oscillation.Water Res.292491–2503. 10.1029/93WR00744
55
Kang Y. Koch F. Gobler C. J. (2015). The interactive roles of nutrient loading and zooplankton grazing in facilitating expansion of harmful blooms caused by the pelagophyte, Aureoumbra lagunensis, to the Indian River Lagoon, FL, USA.Harmful Algae49162–173. 10.1016/j.hal.2015.09.005
56
Kathuria S. Martiny A. C. (2011). Prevalence of a calcium-based alkaline phosphatase associated with the marine cyanobacterium Prochlorococcus and other ocean bacteria.Environ. Microbiol.1374–83. 10.1111/j.1462-2920.2010.02310.x
57
Killick R. Eckley I. A. (2014). Changepoint: an R Package for Changepoint Analysis.J. Stat. Softw.58:3. 10.18637/jss.v058.i03
58
Lapointe B. E. Herren L. W. Debortoli D. D. Vogel M. A. (2015). Evidence of sewage-driven eutrophication and harmful algal blooms in Florida’s Indian River Lagoon.Harmful Algae4382–102. 10.1016/j.hal.2015.01.004
59
Lee K. Park S. R. Kim Y. K. (2007). Effects of irradiance, temperature and nutrients on growth dynamics of seagrasses: a review.J. Exp. Mar. Biol. Ecol.350144–175. 10.1016/j.jembe.2007.06.016
60
Lemley D. A. Adams J. B. Largier J. L. (2021). Harmful algal blooms as a sink for inorganic nutrients in a eutrophic estuary.Mar. Ecol. Progr. Ser.66363–76. 10.3354/meps13655
61
Lindehoff E. Granéli E. Glibert P. M. (2011). Nitrogen uptake kinetics of Prymnesium parvum (Haptophyte).Harmful Algae1270–76. 10.1016/j.hal.2011.09.001
62
Lipp E. K. Schmidt N. Luther M. E. Rose J. B. (2001). Determining the effects of El Niño-Southern Oscillation events on coastal water quality.Estuaries24491–497. 10.2307/1353251
63
Liu H. Laws E. A. Villareal T. A. Buskey E. J. (2001). Nutrient-limited growth of Aureoumbra lagunensis (Pelagophyceae), with implications for its capability to outgrow other phytoplankton species in phosphate-limited environments.J. Phycol.37500–508.
64
Macintyre H. L. Lomas M. W. Cornwell J. Suggett D. J. Gobler C. J. Koch E. W. et al (2004). Mediation of benthic-pelagic coupling by microphytobenthos: an energy- and material-based model for initiation of blooms of Aureococcus anophagefferens.Harmful Algae3403–437. 10.1016/j.hal.2004.05.005
65
MacNally R. Albano C. Fleishman E. (2014). A scrutiny of the evidence for pressure-induced state shifts in estuarine and nearshore ecosystems.Austral. Ecol.39989–906. 10.1111/aec.12162
66
McMahon K. W. McCarthy M. D. Sherwood O. A. Larsen T. Guilerson T. P. (2015). Millennial-scale plankton regime shifts in the subtropical North Pacific Ocean.Science3301530–1533. 10.1126/science.aaa9942
67
Molinero J. C. Reygondeau G. Bonnet D. (2013). Climate variance influence on the non-stationary plankton dynamics.Mar. Environ. Res.8991–96. 10.1016/j.marenvres.2013.04.006
68
Möllmann C. Folke C. Edwards M. Conversi A. (2015). Marine regime shifts around the globe: theory, drivers and impacts.Philos. Trans. R. Soc. B370:20130260. 10.1098/rstb.2013.0260
69
Moore L. R. Ostrowski M. Scanlan D. J. Feren K. Sweetsir T. (2005). Ecotypic variation in phosphorus-acquisition mechanisms within marine picocyanobacteria.Aquat. Microb. Ecol.39257–269. 10.3354/ame039257
70
Muhlstein H. I. Villareal T. A. (2007). Organic and inorganic nutrient effects of on growth rate-irradiance relationships in the Texas brown-tide alga Aureoumbra lagunensis (Pelagophyceae).J. Phycol.431223–1226. 10.1111/j.1529-8817.2007.00412.x
71
Murrell M. C. Campbell J. G. Hagy J. D. III Caffrey J. M. (2009). Effects of irradiance on benthic and water column processes in a Gulf of Mexico estuary: pensacola Bay, Florida, USA.Estuar. Coast. Shelf Sci.81501–512. 10.1016/j.ecss.2008.12.002
72
Nehring S. (1998). Establishment of thermophilic phytoplankton species in the North Sea: biological indicators of climate change?.ICES J. Mar. Sci.55818–823. 10.1006/jmsc.1998.0389
73
Nixon S. (1995). Coastal marine eutrophication: a definition, social consequences and future concerns.Ophelia41199–219. 10.1080/00785236.1995.10422044
74
Moestrup Ø Akselmann-Cardella R. Churro C. Fraga S. Hoppenrath M. Iwataki M., et al. (eds) (2009). IOC-UNESCO Taxonomic Reference List of Harmful Micro Algae. Available online at: http://www.marinespecies.org/hab(Accessed May 9, 2021).
75
O’Neil J. M. Davis T. W. Burford M. A. Gobler C. J. (2012). The rise of harmful cyanobacteria blooms: the potential roles of eutrophication and climate change.Harmful Algae14313–334. 10.1016/j.hal.2011.10.027
76
Onuf C. (1996). Seagrass responses to long-term light reduction by brown tide in upper Laguna Madre, Texas: distribution and biomass patterns.Mar. Ecol. Progr. Ser.138219–231. 10.3354/meps138219
77
Paerl H. W. Willey J. D. Go M. Peierls B. L. Pinckney J. L. Fogel M. L. (1999). Rainfall stimulation of primary production in Western Atlantic Ocean waters: roles of different nitrogen sources and co-limiting nutrients.Mar. Ecol. Progr. Ser.176205–214. 10.3354/meps176205
78
Papacek J. R. (2018). Shifting nutrient forms and ratios: Implications for harmful algal blooms and nitrogen cycling in a subtropical estuary.Ph.D. thesis. Florida: University of Florida.
79
Peperzak L. Witte H. (2019). Abiotic drivers of interannual phytoplankton variability and a 1999–2000 regime shift in the North Sea examined by multivariate statistics.J. Phycol.551274–1289. 10.1111/jpy.12893
80
Pershing A. J. Mills K. E. Record N. R. Stamieszkin K. Wurtzell K. V. Byron C. J. et al (2015). Evaluating trophic cascades as drivers of regime shifts in different ocean ecosystems.Philos. Trans. R. Soc. B370:20130265. 10.1098/rstb.2013.0265
81
Phlips E. J. Badylak S. (2012). Phytoplankton abundance and composition in the Indian River Lagoon, 2011-2012. St. Johns River Water Management District, Special Publication 2013-SP3.Florida: St. Johns River Water Management District.
82
Phlips E. J. Badylak S. Bledsoe E. L. Cichra M. (2006). Factors influencing the distribution and abundance of Pyrodinium bahamense in coastal ecosystems of Florida.Mar. Ecol. Progr. Ser.32299–115. 10.3354/meps322099
83
Phlips E. J. Badylak S. Christman M. Wolny J. Garland J. Hall L. et al (2011). Scales of temporal and spatial variability of harmful algae blooms in the Indian River, Florida, USA.Harmful Algae10277–290. 10.1016/j.hal.2010.11.001
84
Phlips E. J. Badylak S. Christman M. C. Lasi M. A. (2010). Climatic trends and temporal patterns of phytoplankton composition, abundance and succession in the Indian River Lagoon, Florida, USA.Estuaries Coasts33498–512. 10.1007/s12237-009-9166-8
85
Phlips E. J. Badylak S. Hart J. Haunert D. Lockwood J. Manley H. et al (2012). Climatic influences on autochthonous and allochthonous phytoplankton blooms in a subtropical estuary, St. Lucie Estuary, Florida, USA.Estuaries Coasts35335–352. 10.1007/s12237-011-9442-2
86
Phlips E. J. Badylak S. Lasi M. Chamberlain R. Green W. Hall L. et al (2015). From red tides to green and brown tides: bloom dynamics in a restricted subtropical lagoon under shifting climatic conditions.Estuaries Coasts38886–904. 10.1007/s12237-014-9874-6
87
Phlips E. J. Badylak S. Love N. Hansen P. John C. V. Gleeson R. (2004). A comparison of water quality and hydrodynamic characteristics of the Guana Tolomato Matanzas National Estuarine Research Reserve and the Indian River Lagoon in Florida.J. Coast. Res.4593–109. 10.2112/SI45-093.1
88
Phlips E. J. Badylak S. Lynch T. L. (1999). Blooms of the picoplanktonic cyanobacterium Synechococcus in Florida Bay.Limnol. Oceanogr.441166–1175. 10.4319/lo.1999.44.4.1166
89
Phlips E. J. Badylak S. Nelson N. Havens K. (2020). Hurricanes, El Niño and harmful algal blooms in two sub-tropical Florida estuaries: direct and indirect impacts.Sci. Rep.10:1910. 10.1038/s41598-020-58771-4
90
Phlips E. J. Zeman C. Hansen P. (1989). Growth, photosynthesis, nitrogen fixation and carbohydrate production by a unicellular cyanobacterium, Synechococcus sp. (Cyanophyta).J. Appl. Phycol.1137–145. 10.1007/BF00003876
91
Piechota T. C. Dracup J. A. (1996). Drought and regional hydrology variation in the United States: associations with the El Niño-Southern Oscillation.Water Res.321359–1373. 10.1029/96WR00353
92
R Core Team (2020). R: A Language And Environment For Statistical Computing.Austria: R Foundation for Statistical Computing.
93
Reay W. G. Gallager D. L. Simmons G. M. Jr. (1995). Sediment-water column oxygen and nitrogen fluxes in nearshore environments of the lower Delmarva Peninsula.Mar. Ecol. Progr. Ser.118215–227. 10.3354/meps118215
94
Rhodes L. L. Haywood A. J. Ballantine W. J. MacKenzie A. L. (1993). Algal blooms and climate anomalies in north-east New Zealand, August-December 1992.N. Z. J. Mar. Freshwater Res.27419–430. 10.1080/00288330.1993.9516583
95
Scheffer M. Carpenter S. R. (2003). Catastrophic regime shifts in ecosystems; linking theory to observation.Trends Ecol. Evol.18648–656. 10.1016/j.tree.2003.09.002
96
Scheffer M. Hosper S. H. Meijer M. L. Moss B. Jeppesen E. (1993). Alternative equilibria in shallow lakes.Trends Ecol. Evol.8275–279. 10.1016/0169-5347(93)90254-M
97
Schmidt A. L. Wysmyk J. K. C. Craig S. E. Lotze H. K. (2012). Regional-scale effects of eutrophication in ecosystem structure and services of seagrass beds.Limnol. Oceanogr.571389–1402. 10.4319/lo.2012.57.5.1389
98
Schmidt N. Luther M. E. (2002). ENSO impacts on salinity in Tampa Bay, Florida.Estuaries25976–984. 10.1007/BF02691345
99
Sheng Y. P. Davis J. D. (2003). Indian River Lagoon pollution load reduction (IRLPLR) model development. Final Report to the St. Johns River Water Management District, Volume 1: A 3-D IRL hydrodynamic/salinity model (UF-CH3D). Florida: St. Johns River Water Management District.
100
Sicko-Goad L. M. Schelske C. L. Stoermer E. F. (1984). Estimation of intracellular carbon and silica content of diatoms from natural assemblages using morphometric techniques.Limnol. Oceanogr.291170–1178. 10.4319/lo.1984.29.6.1170
101
Siegel D. A. Doney S. C. Yoder J. A. (2002). The North Atlantic spring phytoplankton bloom and Sverdrup’s critical depth hypothesis.Science296730–733. 10.1126/science.1069174
102
Sigua G. C. Tweedale W. A. (2003). Watershed scale assessment of nitrogen and phosphorus loadings in the Indian River Lagoon basin, Florida.J. Environ. Manag.67363–372. 10.1016/S0301-4797(02)00220-7
103
Smayda T. J. (1978). “From phytoplankters to biomass,” in Phytoplankton Manual, ed.SourniaA. (Paris: UNESCO), 273–279.
104
Smayda T. J. (2008). Complexity in the eutrophication-harmful algal bloom relationship, with comment on the importance of grazing.Harmful Algae8140–151. 10.1016/j.hal.2008.08.018
105
Spencer M. Birchenough N. Mieszhowska N. Robinson L. Simpson S. Burrows M. et al (2011). Temporal change in UK marine communities: trends or regime shifts.Mar. Ecol.3210–24. 10.1111/j.1439-0485.2010.00422.x
106
Stevens P. W. Blewett D. A. Boucek R. E. Rehage J. S. Winner B. L. Young J. M. et al (2016). Resilience of a tropical sport fish population to a severe cold event varies across five estuaries in southern Florida.Ecosphere7:e01400. 10.1002/ecs2.1400
107
Steward J. S. Green W. C. (2007). Setting load limits for nutrients and suspended solids based upon seagrass depth-limit targets.Estuaries Coasts30657–670.
108
Steward J. S. Virnstein R. W. Morris L. J. Lowe E. F. (2005). Setting seagrass depth, coverage, and light targets for the Indian River Lagoon System, Florida.Estuaries28923–935.
109
Stoecker D. K. Hansen P. J. Caron D. A. Mitra A. (2017). Mixotrophy in the marine plankton.Ann. Rev. Mar. Sci.9311–335.
110
Stolte W. Riegman R. (1996). A model approach for size-selective competition of marine phytoplankton for fluctuating nitrate and ammonium.J. Phycol.32732–740.
111
Strathmann R. R. (1967). Estimating the organic carbon content of phytoplankton from cell volume or plasma volume.Limnol. Oceanogr.12411–418.
112
Sun J. Liu D. (2003). Geometric models for calculating cell biovolume and surface area for phytoplankton.J. Plankton Res.251331–1346.
113
Sun M. Sun J. Qiu J. Jing H. Liu H. (2012). Characterization of the proteomic profiles of the brown tide Aureoumbra lagunensis under phosphate- and nitrogen-limiting conditions and of its phosphate limitation-specific protein with alkaline phosphatase activity.Appl. Environ. Microbiol.782025–2033.
114
Sunda W. G. Hardison D. R. (2010). Evolutionary tradeoffs among nutrient acquisition, cell size, and grazing defense in marine phytoplankton promote ecosystem stability.Mar. Ecol. Progr. Ser.40163–76.
115
Sundbäck K. Linares F. Larson F. Wulff A. (2004). Benthic nitrogen fluxes along a deep gradient in a microtidal fjord: the role of denitrification and microphytobenthos.Limnol. Oceanogr.491095–1107.
116
Swarzenski P. W. Martin J. B. Cable J. C. (2001). “Submarine ground-water discharge in upper Indian River Lagoon,” in U.S.G.S Karst Group Proceedings, ed.KunianskyE. L. (Florida: U.S. Geological Survey) 194–197.
117
Trefry J. H. Fox A. L. (2021). Extreme runoff of chemical species of nitrogen and phosphorus threatens a Florida barrier island lagoon. Front. Mar. Sci.(accepted for publication).
118
Trefry J. H. Metz S. Trocine R. Iricanin N. Burnside D. Chen N. et al (1990). Design and operation of a muck sediment survey. Special Publication #SJ-90-SP3.Florida: St. Johns River Water Management District.
119
Turner J. T. Tester P. A. (1997). Toxic marine phytoplankton, zooplankton grazers, and pelagic food webs.Limnol. Oceanogr.421203–1214. 10.4319/lo.1997.42.5_part_2.1203
120
Urrutia-Cordero P. Ekvall M. K. Hansson L. (2016). Controlling harmful cyanobacteria: taxa-specific responses of cyanobacteria to grazing by large-bodied Daphnia in a biomanipulation scenario.PLoS One11:e0153032. 10.1371/journal.pone.0153032
121
Usup G. Ahmad A. Matsuoka K. Lim P. T. Leaw C. P. (2012). Biology, ecology and bloom dynamics of the toxic dinoflagellate Pyrodinium bahamense.Harmful Algae14301–312. 10.1016/j.hal.2011.10.026
122
Utermöhl H. (1958). Zur Vervollkommnung der quantitativen phytoplankton-methodik.Mitt. Int. Ver. Theor. Amgew. Limnol.9:39. 10.1080/05384680.1958.11904091
123
Verity P. Robertson C. Y. Tronzo C. R. Andrews M. G. Nelson J. R. Stieracki M. E. (1992). Relationships between cell volume and the carbon and nitrogen content of marine photosynthetic nanoplankton.Limnol. Oceanogr.371434–1446. 10.4319/lo.1992.37.7.1434
124
Viaroli P. Bartoli M. Giordani G. Naldi M. Orfanidis S. Zaldivar J. M. (2008). Community shifts, alternative stable states, biogeochemical controls and feedbacks in eutrophic coastal lagoons: a brief overview.Aqua. Conserv. Mar. Freshwater Ecosyst.18S105–S117. 10.1002/aqc.956
125
Waycott M. Duarte C. Carruthers T. Orth R. Dennison W. Olyarnik S. et al (2009). Accelerating loss of seagrasses across the globe threatens coastal ecosystems.Proc. Nat. Acad. Sci. U. S. A.10612377–12381. 10.1073/pnas.0905620106
126
Wetz M. S. Cira E. K. Sterba-Boatwright B. Montagna P. A. Palmer T. A. Hayes K. C. (2017). Exceptionally high organic nitrogen concentrations in a semi-arid South Texas estuary susceptible to brown tide blooms.Estuar. Coast. Shelf Sci.18827–37. 10.1016/j.ecss.2017.02.001
127
Winder M. Cloern J. E. (2010). The annual cycles of phytoplankton biomass.Philos. Trans. R. Soc. Lond. B3653215–3226. 10.1098/rstb.2010.0125
128
Work K. Havens K. Sharfstein B. East T. (2005). How important is carbon to planktonic grazers in a turbid, subtropical lake?J. Plankton Res.27357–372. 10.1093/plankt/fbi013
129
Yuan X. Glibert P. M. Xu J. Liu H. Chen M. Yin K. et al (2012). Inorganic and organic nitrogen uptake by phytoplankton and bacteria in Hong Kong waters.Estuaries Coasts35325–334. 10.1007/s12237-011-9433-3
130
Zeilis A. Leisch F. Hornik K. Kleiber C. (2002). Strucchange: an R Package for testing for structural change in linear regression models.J. Stat. Softw.71–38. 10.18637/jss.v007.i02
131
Zhao H. Zhao J. Sun X. Chen F. Han G. (2018). A strong summer phytoplankton bloom southeast of Vietnam in 2007, a transitional year from El. Niño to La Niña.PLoS One13:e0189926. 10.1371/journal.pone.0189926
132
Zhu Z. Qu P. Fu F. Tennenbaum N. Tatters A. O. Hutchins D. A. (2017). Understanding the blob bloom: warming increases toxicity and abundance of the harmful bloom diatom Pseudo-nitzschia in California coastal waters.Harmful Algae6736–43.
133
Zingone A. Phlips E. J. Harrison P. (2010). Multiscale variability of twenty-two coastal phytoplankton time series: a global comparison.Estuaries Coasts33224–229.
Summary
Keywords
harmful algae blooms, brown tide, red tide, Aureoumbra lagunensis , Pyrodinium bahamense
Citation
Phlips EJ, Badylak S, Nelson NG, Hall LM, Jacoby CA, Lasi MA, Lockwood JC and Miller JD (2021) Cyclical Patterns and a Regime Shift in the Character of Phytoplankton Blooms in a Restricted Sub-Tropical Lagoon, Indian River Lagoon, Florida, United States. Front. Mar. Sci. 8:730934. doi: 10.3389/fmars.2021.730934
Received
25 June 2021
Accepted
30 August 2021
Published
28 September 2021
Volume
8 - 2021
Edited by
Kevin Brett Johnson, Florida Institute of Technology, United States
Reviewed by
Adolf Konrad Stips, European Commission, Italy; Lohengrin Fernandes, Instituto de Estudos do Mar Almirante Paulo Moreira, Brazil
Updates
Copyright
© 2021 Phlips, Badylak, Nelson, Hall, Jacoby, Lasi, Lockwood and Miller.
This is an open-access article distributed under the terms of the Creative Commons Attribution License (CC BY). The use, distribution or reproduction in other forums is permitted, provided the original author(s) and the copyright owner(s) are credited and that the original publication in this journal is cited, in accordance with accepted academic practice. No use, distribution or reproduction is permitted which does not comply with these terms.
*Correspondence: Edward J. Phlips, phlips@ufl.edu
This article was submitted to Marine Ecosystem Ecology, a section of the journal Frontiers in Marine Science
Disclaimer
All claims expressed in this article are solely those of the authors and do not necessarily represent those of their affiliated organizations, or those of the publisher, the editors and the reviewers. Any product that may be evaluated in this article or claim that may be made by its manufacturer is not guaranteed or endorsed by the publisher.