 L. Holly Sweat
 Hunter Alexander
 Edward J. Phlips
 Kevin B. Johnson
- 1Biological Oceanography Laboratory, Department of Ocean Engineering and Marine Sciences, Florida Institute of Technology, Melbourne, FL, United States
- 2Fisheries and Aquatic Sciences Program, School of Forest, Fisheries, and Geomatics Sciences, Institute of Food and Agricultural Sciences, University of Florida, Gainesville, FL, United States
Mesozooplankton, as abundant grazers of microalgae in coastal systems, have the potential to prevent or mitigate harmful algal blooms (HABs) and their effects. The Indian River Lagoon (IRL) is a subtropical estuary in eastern Florida (United States) where repeated blooms, dominated by the toxic dinoflagellate Pyrodinium bahamense, the brown tide species Aureoumbra lagunensis, pico/nano planktonic cyanobacteria and other nano-eukaryotes, have highlighted the need to better understand fluctuations in the grazing potential of mesozooplankton populations across bloom cycles. Mesozooplankton and abiotic environmental data were collected at five sites in the northern IRL system at 6-week intervals from November 2013 through June 2016. A total of 107 taxa from 14 phyla were detected. Communities varied across sites, dates and between bloom and non-bloom periods, with densities up to 338 individuals L–1. Eight taxa comprising 85–94% of the total population at each site were identified as primary potential grazers, including barnacle nauplii, cladocerans, adult copepods, gastropod veligers, larvaceans, and polychaete metatrochophores. Although abundant, the estimated grazing potential of the primary taxa, calculated from their measured densities and previously published grazing rates, suggest that mesozooplankton lack the capacity to suppress phytoplankton once they reach bloom levels. These findings illustrate the utility of monitoring data and underscore the importance of systematically evaluating algal bloom controls with a consideration for the dynamic conditions of each unique ecosystem.
Introduction
Mesozooplankton are important grazers of phytoplankton in a wide variety of marine systems. Comprised of holoplankton such as copepods and meroplanktonic larvae ranging from 200 μm to 2 mm, mesozooplanktonic grazers ingest an estimated 12–18% of global oceanic primary production annually (Calbet, 2001; Calbet and Saiz, 2005). Ingestion rates are typically greatest in highly productive coastal systems (Calbet, 2001) such as estuaries, where eutrophication and other anthropogenic alterations support the formation of phytoplankton blooms (Sunda et al., 2006; Anderson et al., 2008; Heisler et al., 2008; Raven et al., 2020).
The Indian River Lagoon (IRL) estuary is a biodiverse barrier island lagoon stretching from warm temperate to subtropical climate zones across 251 km of Florida’s east coast (United States). The estuary system consists of three connected regions: the Mosquito Lagoon, the Indian River Lagoon and the Banana River Lagoon. Phytoplankton blooms have long been observed in the IRL, but they experienced a dramatic increase in intensity and change in composition in 2011 (Phlips et al., 2021). Prior to 2011, relatively large dinoflagellates and diatoms were the dominant bloom species (Phlips et al., 2015). However, widespread seagrass losses in 2009–2010, and extraordinarily cold winter water temperatures in 2010, were followed by blooms of small-celled species (<5 μm in diameter). In 2011, picocyanobacteria and Pedinophyceae species bloomed throughout the northern IRL, followed by repeated intense blooms of the brown tide pelagophyte Aureoumbra lagunensis, and other small-celled taxa (Phlips et al., 2021). None of these taxa were documented at such levels in the estuary prior to 2011 but have occurred repeatedly in the years since (Phlips et al., 2015, 2020; Schaefer et al., 2019). The blooms have decreased light penetration and dissolved oxygen concentrations, leading to large-scale losses of habitat and changes in biological communities (Phlips et al., 2015; Lapointe et al., 2020; Lewis et al., 2020, 2021; Lazensky et al., 2021) that have defined the IRL for decades.
Harmful algal blooms (HABs) are not isolated to the IRL or similar systems. In the United States alone, such blooms occur in all 50 states, caused by over 100 taxa (Anderson et al., 2021) that impact human and ecosystem health, tourism, and commercial fishing and aquaculture industries with a combined value of $7 billion in 2018/2019 (National Marine Fisheries Service, 2021). Climate change and other anthropogenically-driven environmental effects are expanding ranges and increasing bloom frequencies of many phytoplankton taxa (Gobler, 2020). It is therefore crucial to better understand bloom impacts on ecosystems, and to evaluate potential top-down controls such as grazing by a variety of organisms.
Microzooplankton (20–200 μm) are recognized for their potential to graze blooms of small-celled phytoplankton (e.g., Sautour et al., 2000; Sherr and Sherr, 2007; Calbet, 2008; Schmoker et al., 2013) like those occurring in the IRL system. In contrast, mesozooplankton have received less attention as top-down bloom controls because they are typically deemed inefficient consumers of small cells (Calbet and Landry, 1999; Calbet et al., 2003; Davis et al., 2012; Morison et al., 2020). However, some studies have documented the ability of mesozooplankton to consume particles <5 μm (Calbet et al., 2000; Davis et al., 2012). Furthermore, these larger zooplankton are major components of the IRL system (Youngbluth et al., 1976; Rey et al., 1991; Dix and Hanisak, 2015), are a critical link between phytoplankton and higher trophic levels (Sommer and Stibor, 2002; Lobry et al., 2008; David et al., 2016), and should be considered in the big picture as bloom impacts and potential control mechanisms are explored. This study investigated mesozooplankton in the IRL system with the following objectives:
(1) Evaluate the spatial and temporal variability of mesozooplankton communities at bloom hotspots.
(2) Estimate the grazing potential of mesozooplankton populations on natural levels of phytoplankton biomass.
(3) Identify key mesozooplankton grazers as potential candidates for bloom control.
Materials and Methods
Field Procedures
Mesozooplankton were sampled at five sites across the northern Indian River Lagoon (IRL) system (Figure 1) that were selected because of previous phytoplankton bloom activity (Phlips et al., 2015): the southern Mosquito Lagoon (MLA), the IRL at Titusville (TIV) and Cocoa (COA), Banana River North (BRN) and Banana River Central (BRC). MLA is 2 km southeast of the Haulover Canal, which serves as the only direct connection between the Mosquito Lagoon and the IRL. BRN is situated 2.8 km northwest of the Port Canaveral lock that links the Banana River Lagoon to the Atlantic Ocean. BRN and COA are each approximately 3 km from opposite sides of the Port Canaveral Barge Canal, which connects the IRL and Banana River Lagoon through the Sykes Creek drainage basin on Merritt Island. The average navigable distance between sites is 18.9 km. Mean depth ranged from 1.61 ± 0.03 to 3.13 ± 0.12 m for BRC and COA, respectively (Table 1).
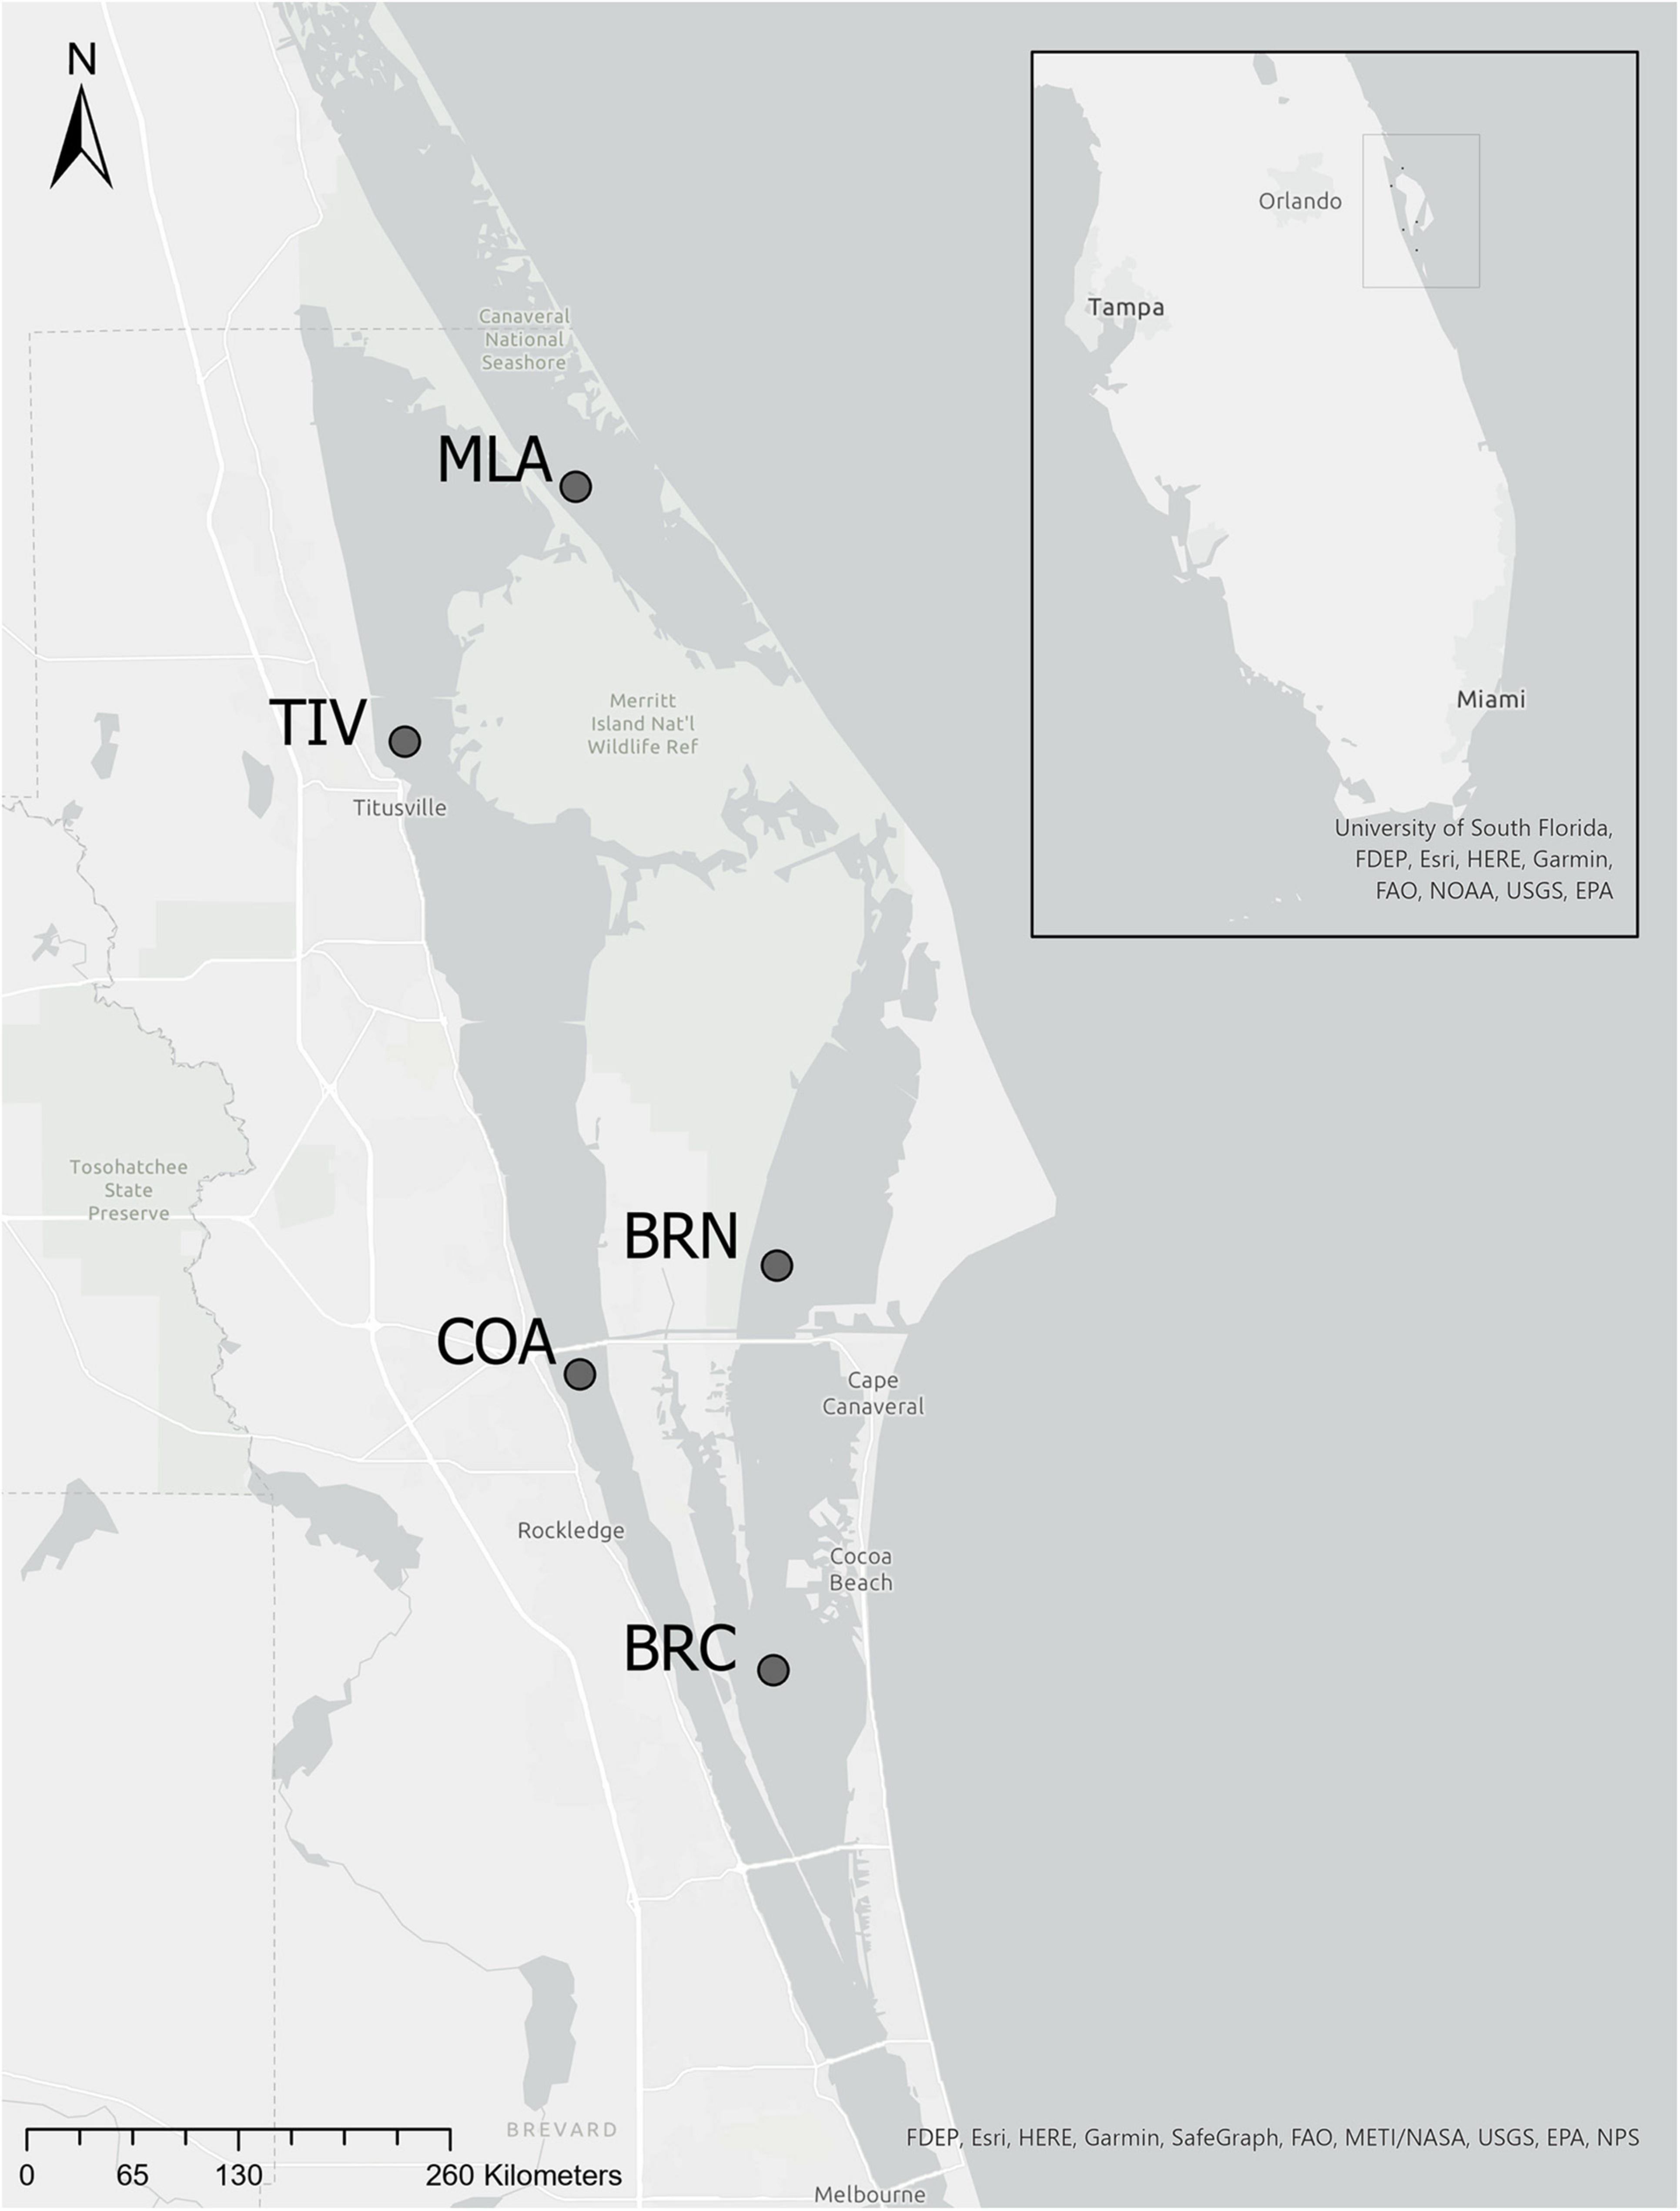
Figure 1. Five mesozooplankton sampling sites in the northern Indian River Lagoon system, east central Florida, United States.
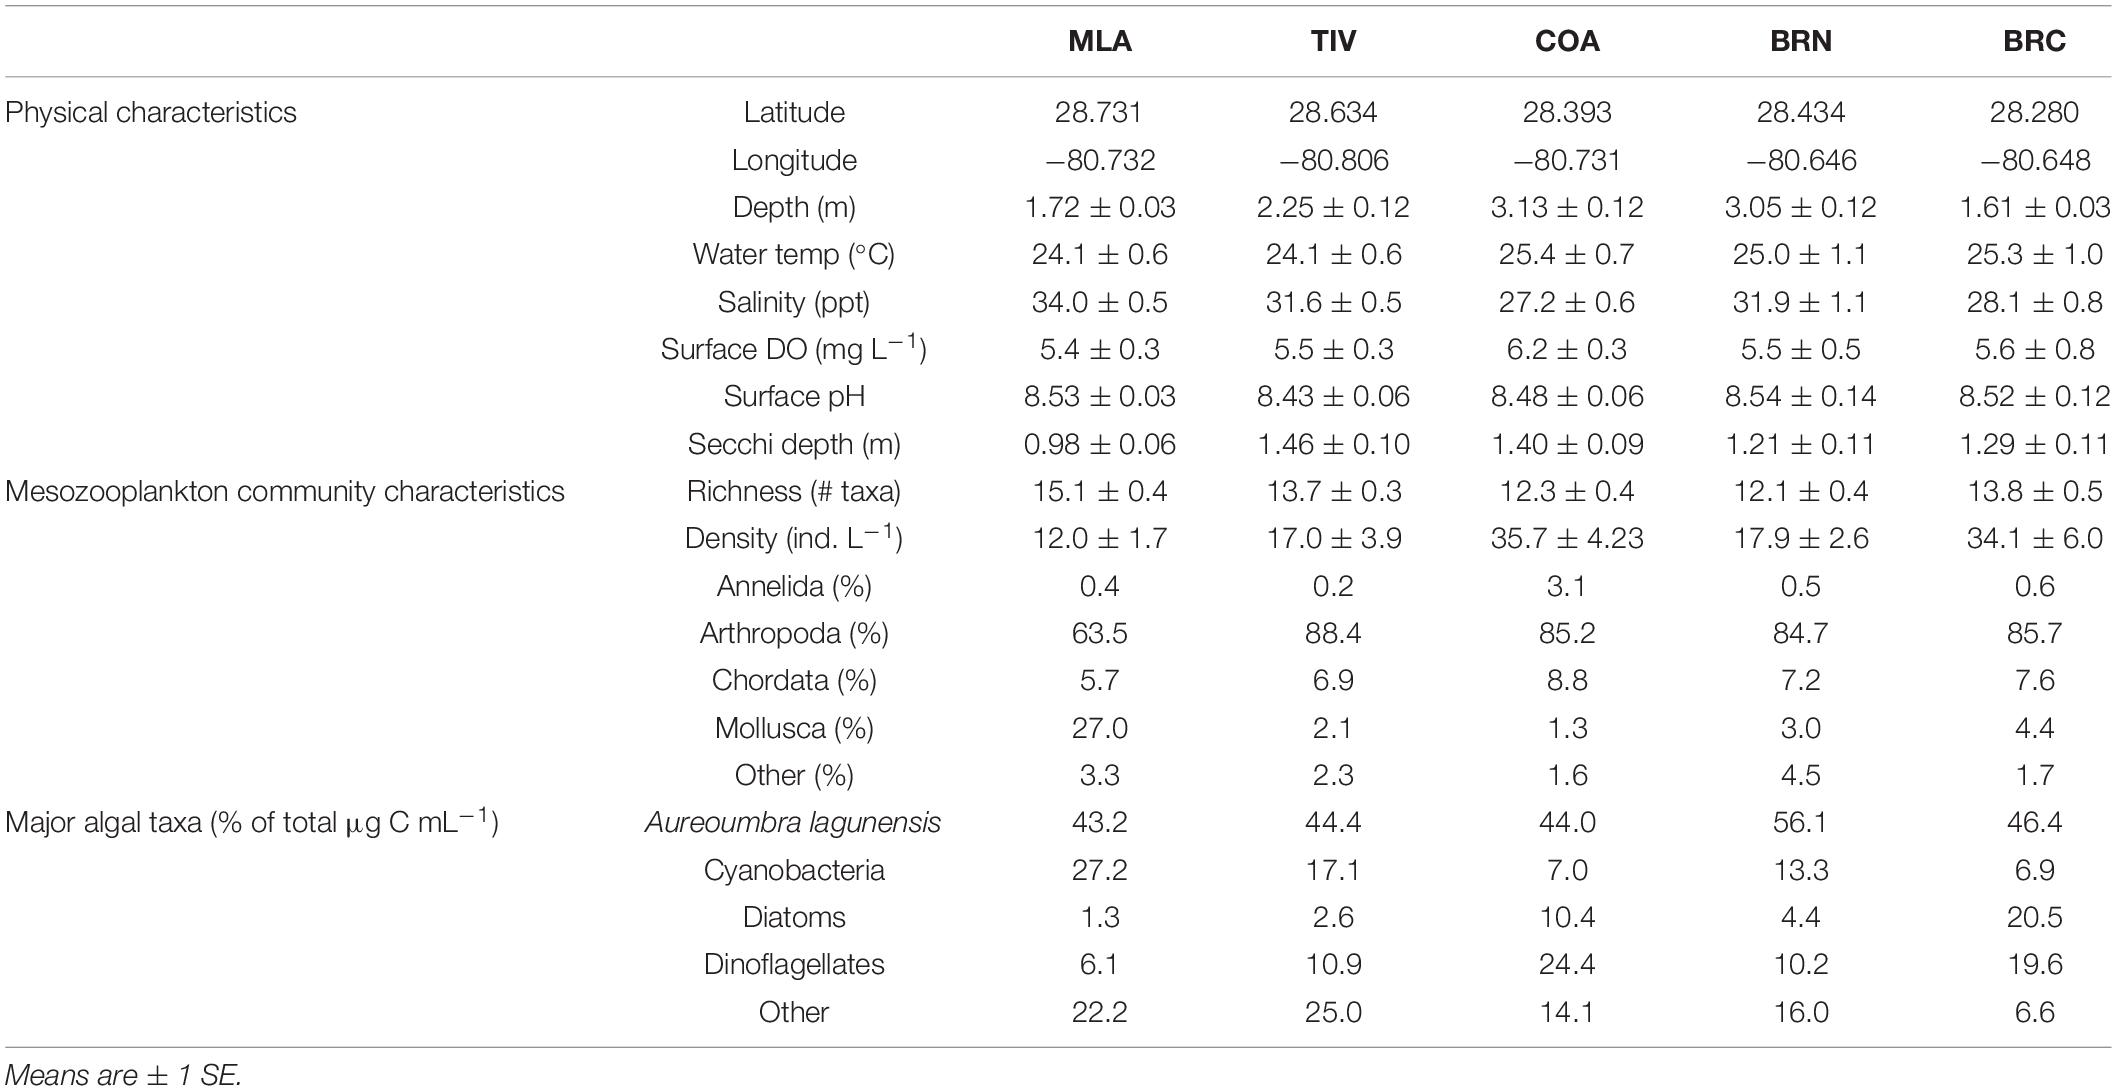
Table 1. Key physical and biological characteristics of all five sampling sites.
Daytime plankton samples (n = 4) were collected with a ring net (153-μm mesh, 30-cm diameter) every 6 weeks from November 17, 2013 through June 27, 2016 for all sites except COA, which began on June 25, 2014. The net was towed horizontally within 1 m of the surface, effectively representing the entire shallow and generally well-mixed water column, which was supported by the presence of several benthic and demersal taxa (e.g., Caprella and Cerapus amphipods, Sphaeroma isopods, Oxyurostylis cumaceans, and several species of benthic foraminiferans and harpacticoid copepods) in the samples. Tow duration was 1 min and was reduced as needed to prevent clogging, which occurred when phytoplankton and zooplankton densities were at their highest and when byproducts (e.g., mucus and molts) were abundant. Tow volumes (0.02–35.63 m3, mean = 7.98 ± 0.41 m3) were calculated from tow speeds and confirmed by in-net (Model 2030R, General Oceanics, Inc., Miami, FL, United States) and external (Model FP211, Global Water Instrumentation, Inc., Gold River, CA, United States) flowmeters. All resulting samples were immediately preserved in 5% formalin with sodium tetraborate buffer.
During each sampling event, total depth (m), water temperature (°C) and salinity (ppt) were measured with a CastAway® CTD (SonTek, San Diego, CA, United States). Average water column temperatures and salinities were calculated using data from the profiles at standardized depths (0.15, 0.45, 0.75, and 1.05 m) within the range of a typical net tow. Surface dissolved oxygen (DO, mg L–1) and pH were measured with a YSI Model 85 handheld multiparameter meter (YSI, Inc., Yellow Springs, OH, United States). Water clarity was determined via Secchi disk depth (m) using a weighted, limnological disk (20-cm diameter).
Laboratory Procedures
After 1–2 weeks of fixation, samples were re-sieved (153 μm), transferred to 1-μm filtered seawater, and divided zero to eight times with a Motoda plankton splitter (Motoda, 1959) to obtain aliquot densities at which all individuals could be easily differentiated in a 10 cm × 10 cm gridded tray. Using stereomicroscopy (35× magnification), zooplankton from each grid were enumerated and identified to the lowest possible taxonomic level using several sources (e.g., Davis, 1949; Grice, 1960; Smith and Johnson, 1996; Johnson and Allen, 2012) until ≥300 individuals were recorded (Davidson and Clem, 2003; BS EN 14407:2004, 2004). Counts were normalized by volume for comparison across samples.
Phytoplankton and Grazing Potential
Algal biomass data (A. lagunensis, cyanobacteria, diatoms, dinoflagellates, others) for the study period were obtained from weekly to biweekly monitoring by the Phlips Lab at the University of Florida. At each site, daytime phytoplankton samples (n = 5) were collected with an integrated water sampler (Sch 40 PVC pipe, 3.2 cm diameter) lowered vertically from the surface to within 0.1 m of the bottom. The five samples were pooled to reduce the effect of patchiness, and duplicate aliquots were preserved, one with Lugol’s iodine solution and one with buffered glutaraldehyde (Phlips et al., 2010, 2020).
Phytoplankton composition was determined using the Utermöhl method (Utermöhl, 1958). Preserved samples were settled in 19-mm diameter cylindrical chambers. Phytoplankton cells were identified and counted at 400 and 100× magnification using inverted phase contrast microscopy (Leica Microsystems, Wetzlar, Germany). At 400×, 30–100 grids were examined until a minimum of 100 cells of a single taxon were counted. At 100×, a total bottom count was obtained for taxa >30 μm in size. Fluorescence microscopy was used on glutaraldehyde-preserved aliquots to enumerate picoplanktonic cyanobacteria (i.e., picocyanobacteria, which is mainly spherical Synechococcus spp. in the IRL) at 1,000× magnification (Phlips et al., 1999). Light microscopy was used to identify and enumerate A. lagunensis based on morphological features evident from previous work (Phlips and Badylak, 2013), which initially characterized A. lagunensis via light, scanning electron and transmission electron microscopy that was later supported by immunological assays and 18S rRNA gene sequencing conducted by colleagues at the Florida Fish and Wildlife Research Institute and Stony Brook University. To estimate cell biovolumes, subsamples of seawater were filtered onto 0.2 μm Whatman® Nuclepore™ filters (GE Healthcare, Chicago, IL, United States) and mounted with immersion oil between a microscope slide and cover slip. Biovolumes were estimated by assigning combinations of geometric shapes to fit the cell characteristics of individual taxa (Smayda, 1978). Specific phytoplankton dimensions were measured for ≥100 randomly selected cells. Species of variable size (e.g., many diatom taxa) were placed into size categories. Phytoplankton carbon values (μg C mL–1) were estimated by multiplying biovolume estimates (expressed as 106 μm3 mL–1) by conversion factors for different taxonomic groups: 0.061 for diatoms, 0.22 for cyanobacteria and small picoplanktonic eukaryotes (including A. lagunensis), and 0.16 for dinoflagellates and other taxa (Strathmann, 1967; Ahlgren, 1983; Sicko-Goad et al., 1984; Work et al., 2005).
The phytoplankton data were used to characterize sites, define bloom periods and compare with estimated grazing rates. Bloom periods at each site were defined as dates with an algal biomass >2 μg C mL–1 (Phlips et al., 2015, 2020) for at least one of the five phytoplankton categories. The phytoplankton monitoring schedule was more frequent and sometimes offset from that of the mesozooplankton monitoring. Therefore, a zooplankton sampling event was considered to occur during a phytoplankton bloom if bloom conditions were observed the same day that the zooplankton were collected, or both before and after (typically 1–7 days) they were collected. The same strategy was employed to define non-bloom periods. Relative chlorophyll (RFU) data from nearby continuous water quality monitoring stations (St. Johns River Water Management District Aquarius WebPortal1) were used to support these designations. If the bloom status on a particular zooplankton sampling date remained unresolved, that date was defined as ‘unknown’ and was excluded from bloom/non-bloom comparisons.
Key potential grazers were identified as primarily herbivorous or omnivorous taxa reaching densities >10 ind. L–1 during the study period. Data on these taxa were used to demonstrate whether mesozooplankton may have the capacity to suppress algal blooms in this estuary through grazing. Ingestion rates (IR) were obtained from studies of the key grazers, or closely related taxa known to occur in the region, at the same or similar life stages, and examined at water temperatures within the range of this study (10.6–31.8°C). The minimum and maximum estimated grazing potentials (EGPmin and EGPmax, μg C mL–1 d–1) for each taxon during each sampling event were obtained by multiplying their in situ densities (ind. mL–1) by their IRmin and IRmax values (μg C ind.–1 d–1), respectively. The EGPmin and EGPmax values were summed across the suite of eight key grazers to calculate the minimum and maximum Estimated Metagrazing Potential (EMPmin and EMPmax, μg C mL–1 d–1) for the entire mesozooplankton community at each site over time. This EMP range provides an extremely rough but relatively inclusive estimate of mesozooplankton grazing potential at a site – ‘best’ and ‘worst-case’ scenarios that consider a variety of conditions and prey types.
Data Analysis
Univariate statistical analyses were conducted in The Real Statistics add-in package for Microsoft Excel2. Following Levene’s tests for homoscedasticity, Welch’s analysis of variance (ANOVA, α = 0.05) and Games–Howell post hoc tests were used to detect differences among sites for abiotic parameters, species richness (S) and zooplankton density (ind. L–1). Welch’s t-tests were used to identify differences in key grazer densities from bloom and non-bloom periods within each site.
Multivariate community analyses were performed on square root transformed count data using the PRIMER v5 software package (PRIMER-E Ltd., Plymouth, United Kingdom). A two-way crossed analysis of similarities (ANOSIM, α = 0.05, Bray–Curtis similarities) was used to find differences in zooplankton community composition among sites and dates. Within each site, differences in communities between bloom and non-bloom periods were detected with a one-way ANOSIM. Groups were considered different only when R > 0.250 and p < 0.05 (Clarke and Gorley, 2001). Taxa driving the differences were identified with similarity percentage (SIMPER) analyses.
Results
Across all sites, a total of 439 samples were collected and 107 taxa from 14 phyla were identified. Per sample mesozooplankton richness and density ranged from 5 to 25 taxa and 0.1 to 338.1 ind. L–1, respectively.
Site Characteristics
Key physical and biological characteristics varied among the five sites during the study period (Table 1). Pairwise comparisons revealed that MLA was generally the most saline site (compared with TIV, BRC, and COA: p ≤ 0.026) with the lowest water clarity (as Secchi depth, compared with TIV and COA: p ≤ 0.002). No differences were detected among sites with regard to water column temperature, surface DO or surface pH (p ≥ 0.313). MLA and TIV exhibited higher species richness than BRN and COA (p ≤ 0.038), with BRC situated between the two groups. In contrast, MLA and TIV, along with BRN, hosted lower zooplankton densities than one or both of the other sites (p ≤ 0.012).
Zooplankton communities were dominated by arthropods (primarily copepods) at all sites, with MLA also containing a large percentage of molluscs (Table 1). A. lagunensis was the prevailing alga overall (43.2–56.1%), with percentages of other groups varying considerably by site. Bloom conditions occurred across all sites at a wide range of water temperatures during both wet and dry seasons (Figure 2), with blooms being detected from 5 to 26 days at BRN and MLA, respectively. Prior to June 2015, phytoplankton communities at all sites were assemblages of cyanobacteria, diatoms, dinoflagellates and others, which formed occasional blooms up to 12 μg C L–1. During this period, A. lagunensis was a minor contributor to the system (Figure 2). In late 2015, total algal biomass dominated by A. lagunensis and ‘other’ taxa, rose at all sites and remained elevated for several months, peaking at 29.89 μg C L–1 (85% A. lagunensis) at BRN on March 07, 2016. At the height of this bloom, the presence of other phytoplankton taxa was minimal.
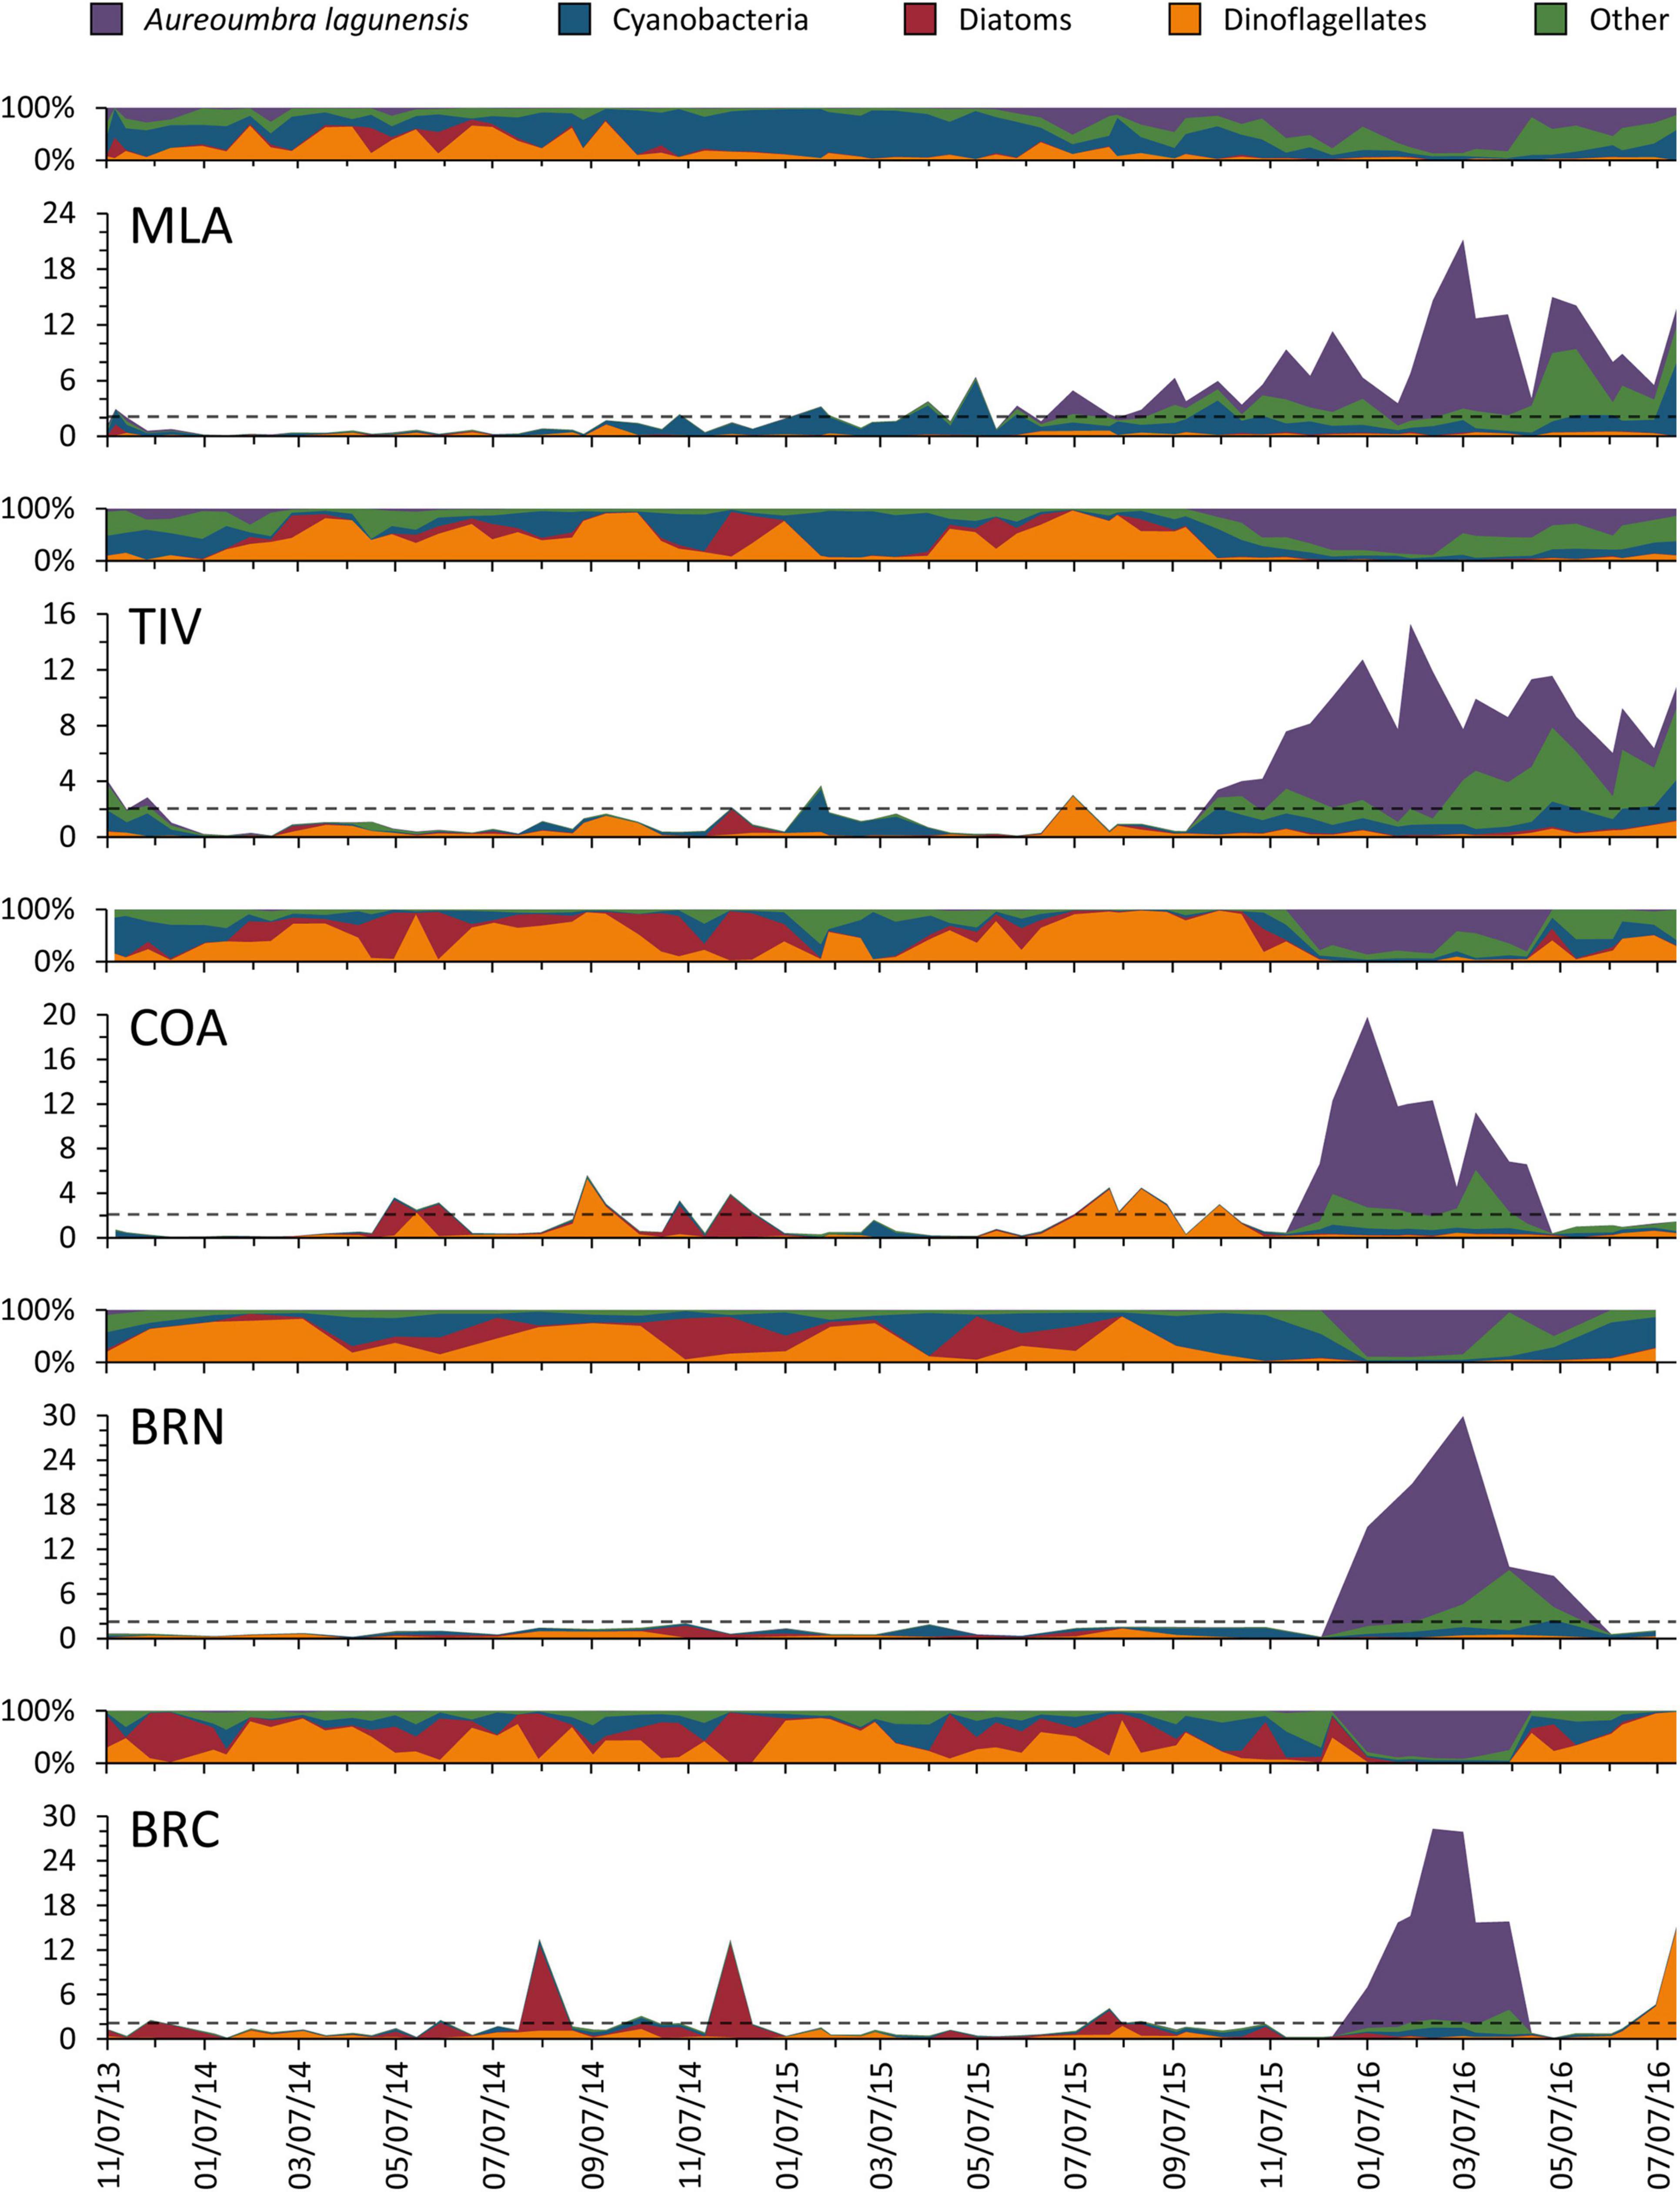
Figure 2. For each of the five mesozooplankton sampling sites, relative percentages (top) and biomasses (μg C mL–1, bottom) of all five phytoplankton categories monitored during the study. The gray dashed lines denote the 2 μg C mL–1 bloom threshold.
Mesozooplankton Community Differences
Mesozooplankton communities varied across sites (global R = 0.840, p = 0.001; pairwise R ≥ 0.706, p = 0.001) and dates (global R = 0.910, p = 0.001; pairwise R ≥ 0.599, p = 0.001), and between bloom and non-bloom periods at BRN (R = 0.440, p = 0.001) and BRC (R = 0.479, p = 0.001). All differences were driven mainly by fluctuating densities of the three dominant copepods: the omnivorous Acartia tonsa and Oithona colcarva, and the primarily herbivorous Parvocalanus crassirostris. These copepods reached respective densities of 325, 156, and 116 ind. L–1. At BRN and BRC, P. crassirostris was a major component of the communities only during non-bloom periods, while A. tonsa and O. colcarva were omnipresent.
Grazing Potential
Eight taxa comprising 85–94% of the total population at each site were identified as primary potential grazers: Amphibalanus spp. barnacle nauplii, Evadne sp. cladocerans, gastropod veligers (one species), Oikopleura sp. larvaceans, polychaete metatrochophores (one species), and the copepods A. tonsa, O. colcarva, and P. crassirostris. Of 40 density comparisons of these taxa between bloom and non-bloom periods, 23 were lower during bloom events (p ≤ 0.049, Table 2). The greatest impacts were seen on populations at BRN and BRC, where all eight and seven out of eight key grazers declined during blooms, respectively.
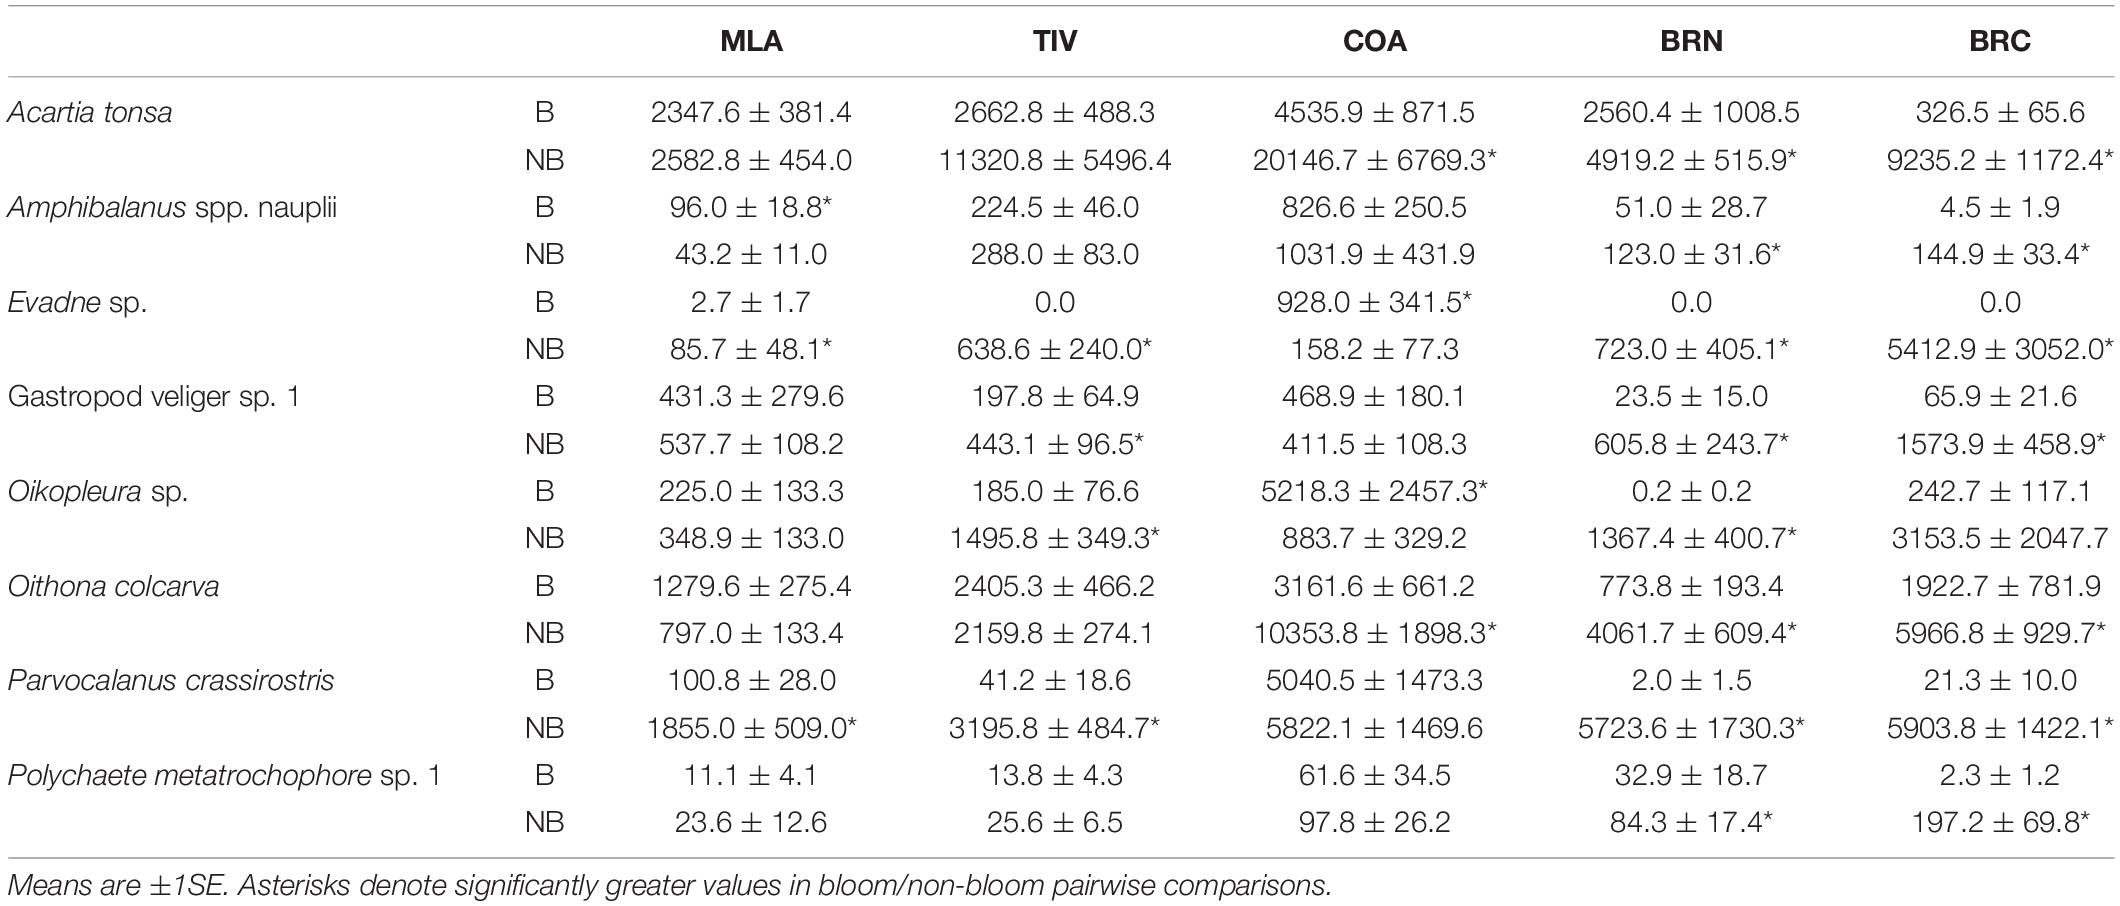
Table 2. Key grazer densities (ind. m–3) at each site during known bloom (B) and non-bloom (NB) conditions.
A review of the relevant literature on these taxa and their close relatives uncovered per-species ingestion rates (IRs) ranging from 0.001 to 13.1 μg (1–13,100 ng) C ind.–1 d–1 for Oithona and Oikopleura, respectively (Table 3). The largest community-wide Estimated Metagrazing Potential (EMPmax) of 1.22 μg C mL–1 d–1 was documented at TIV on October 1, 2015, resulting from high densities of all three copepod species. On several occasions, the EMPmax exceeded the minimum phytoplankton biomass documented at a particular site (Figure 3), signaling that mesozooplankton grazing can be high enough to impact phytoplankton populations. However, EMPmax never exceeded the 2 μg C mL–1 bloom threshold, suggesting that mesozooplankton lack the grazing capacity needed to suppress phytoplankton in this system once they reach bloom levels.
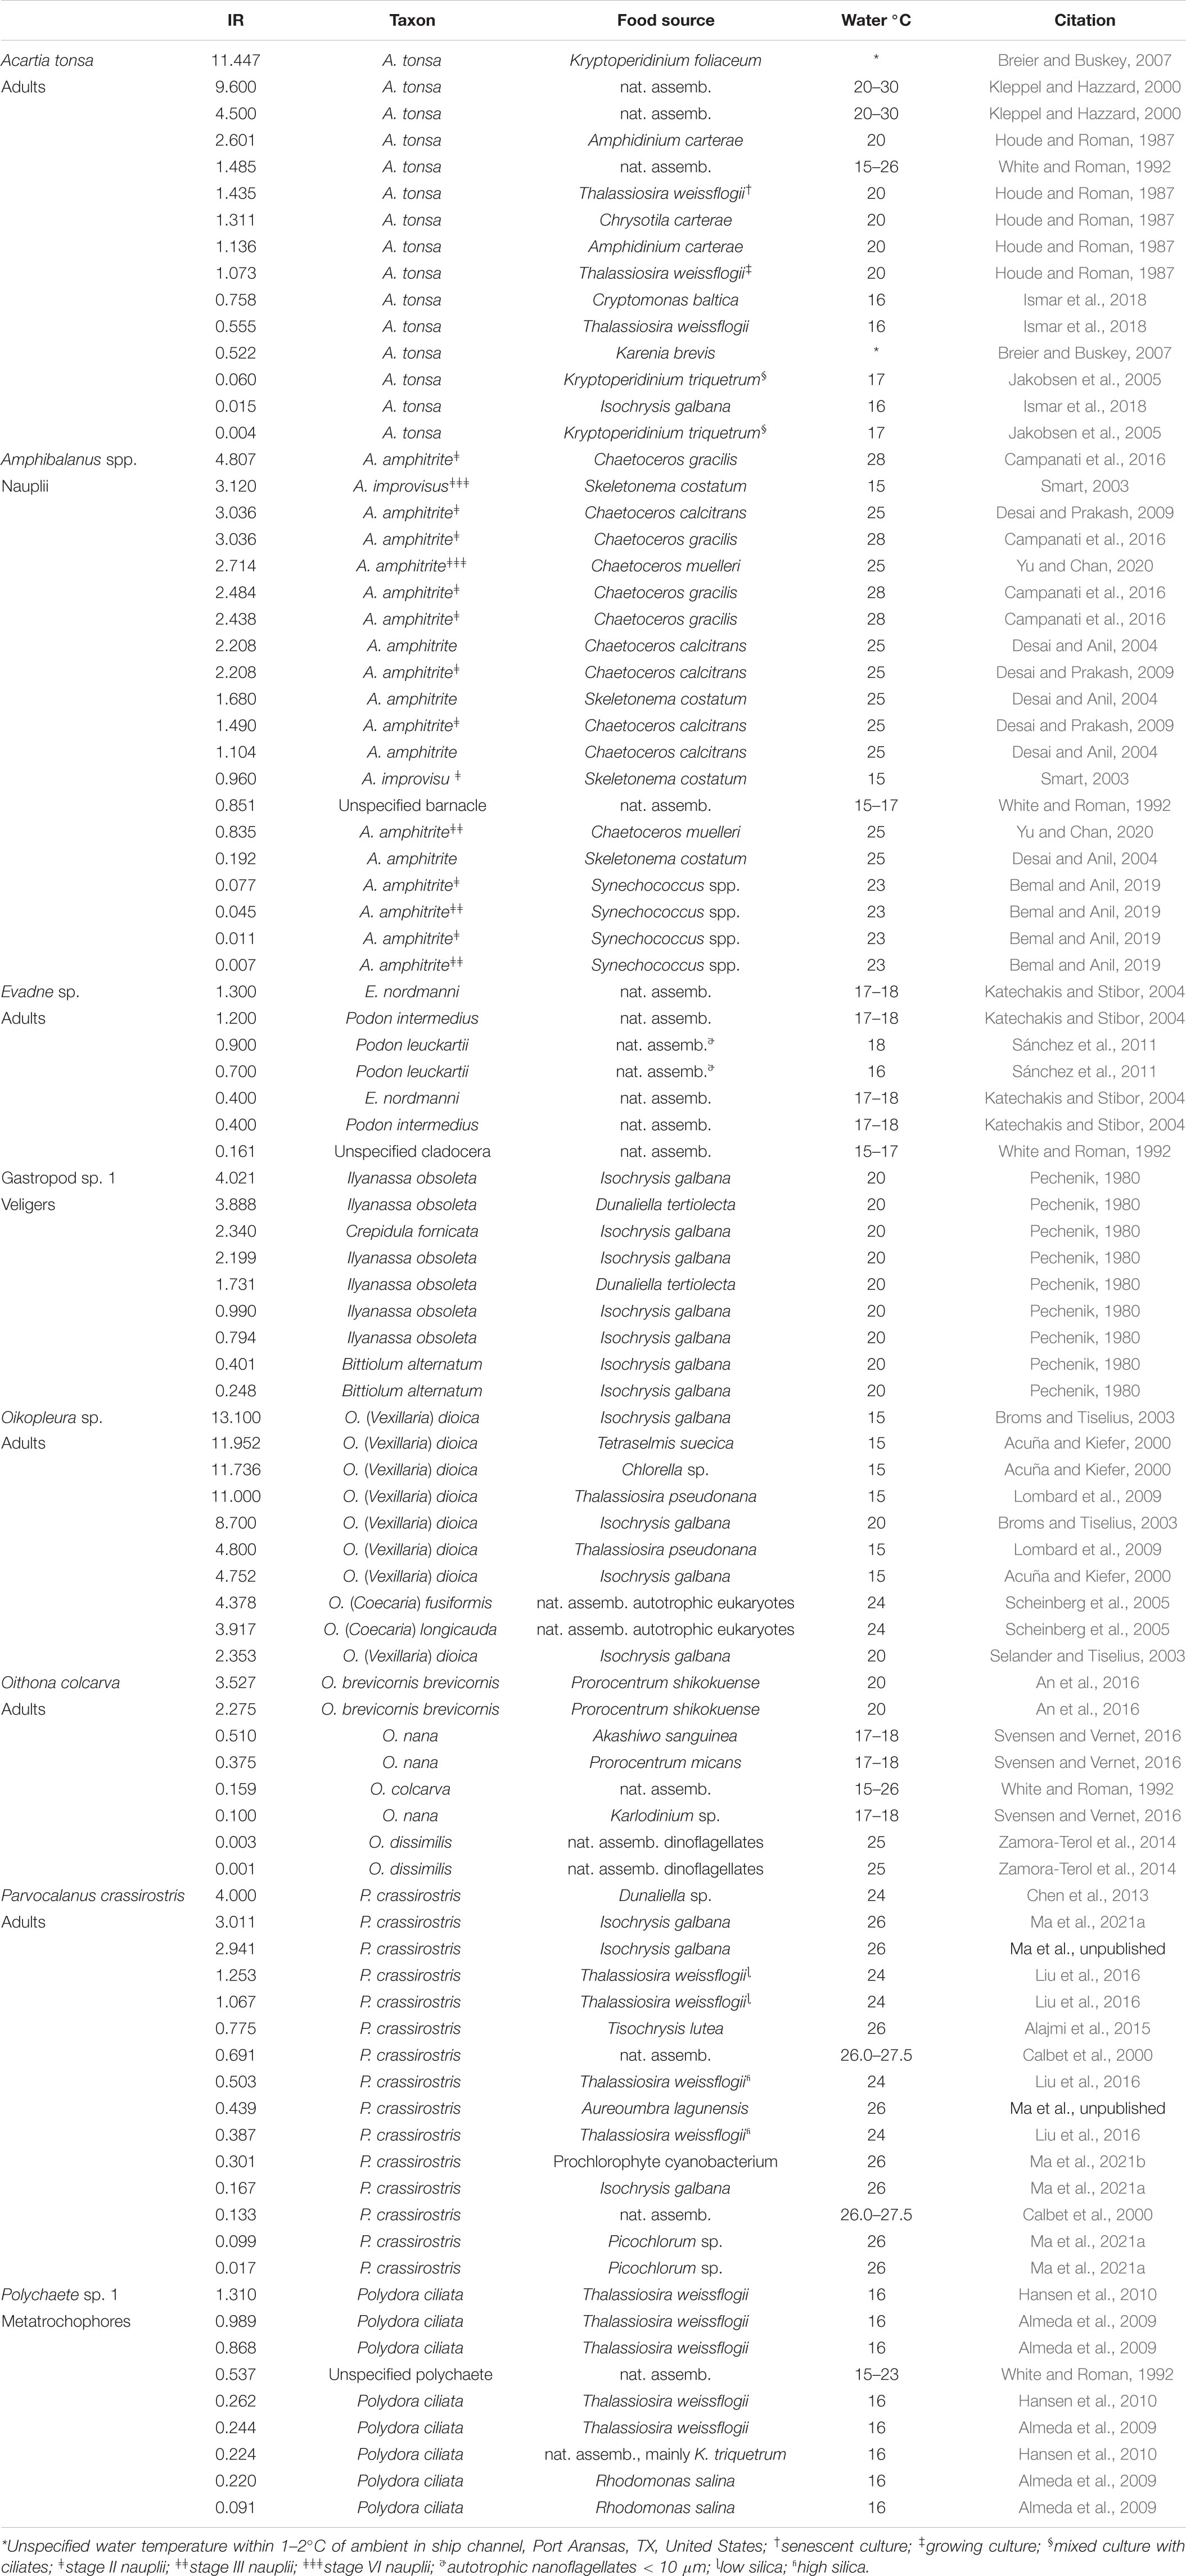
Table 3. Ingestion rates (IR, μg C ind–1 d–1) from studies of key grazers, or closely related taxa known to occur in the region, at the same or similar life stages, and examined at water temperatures within the range of this study.
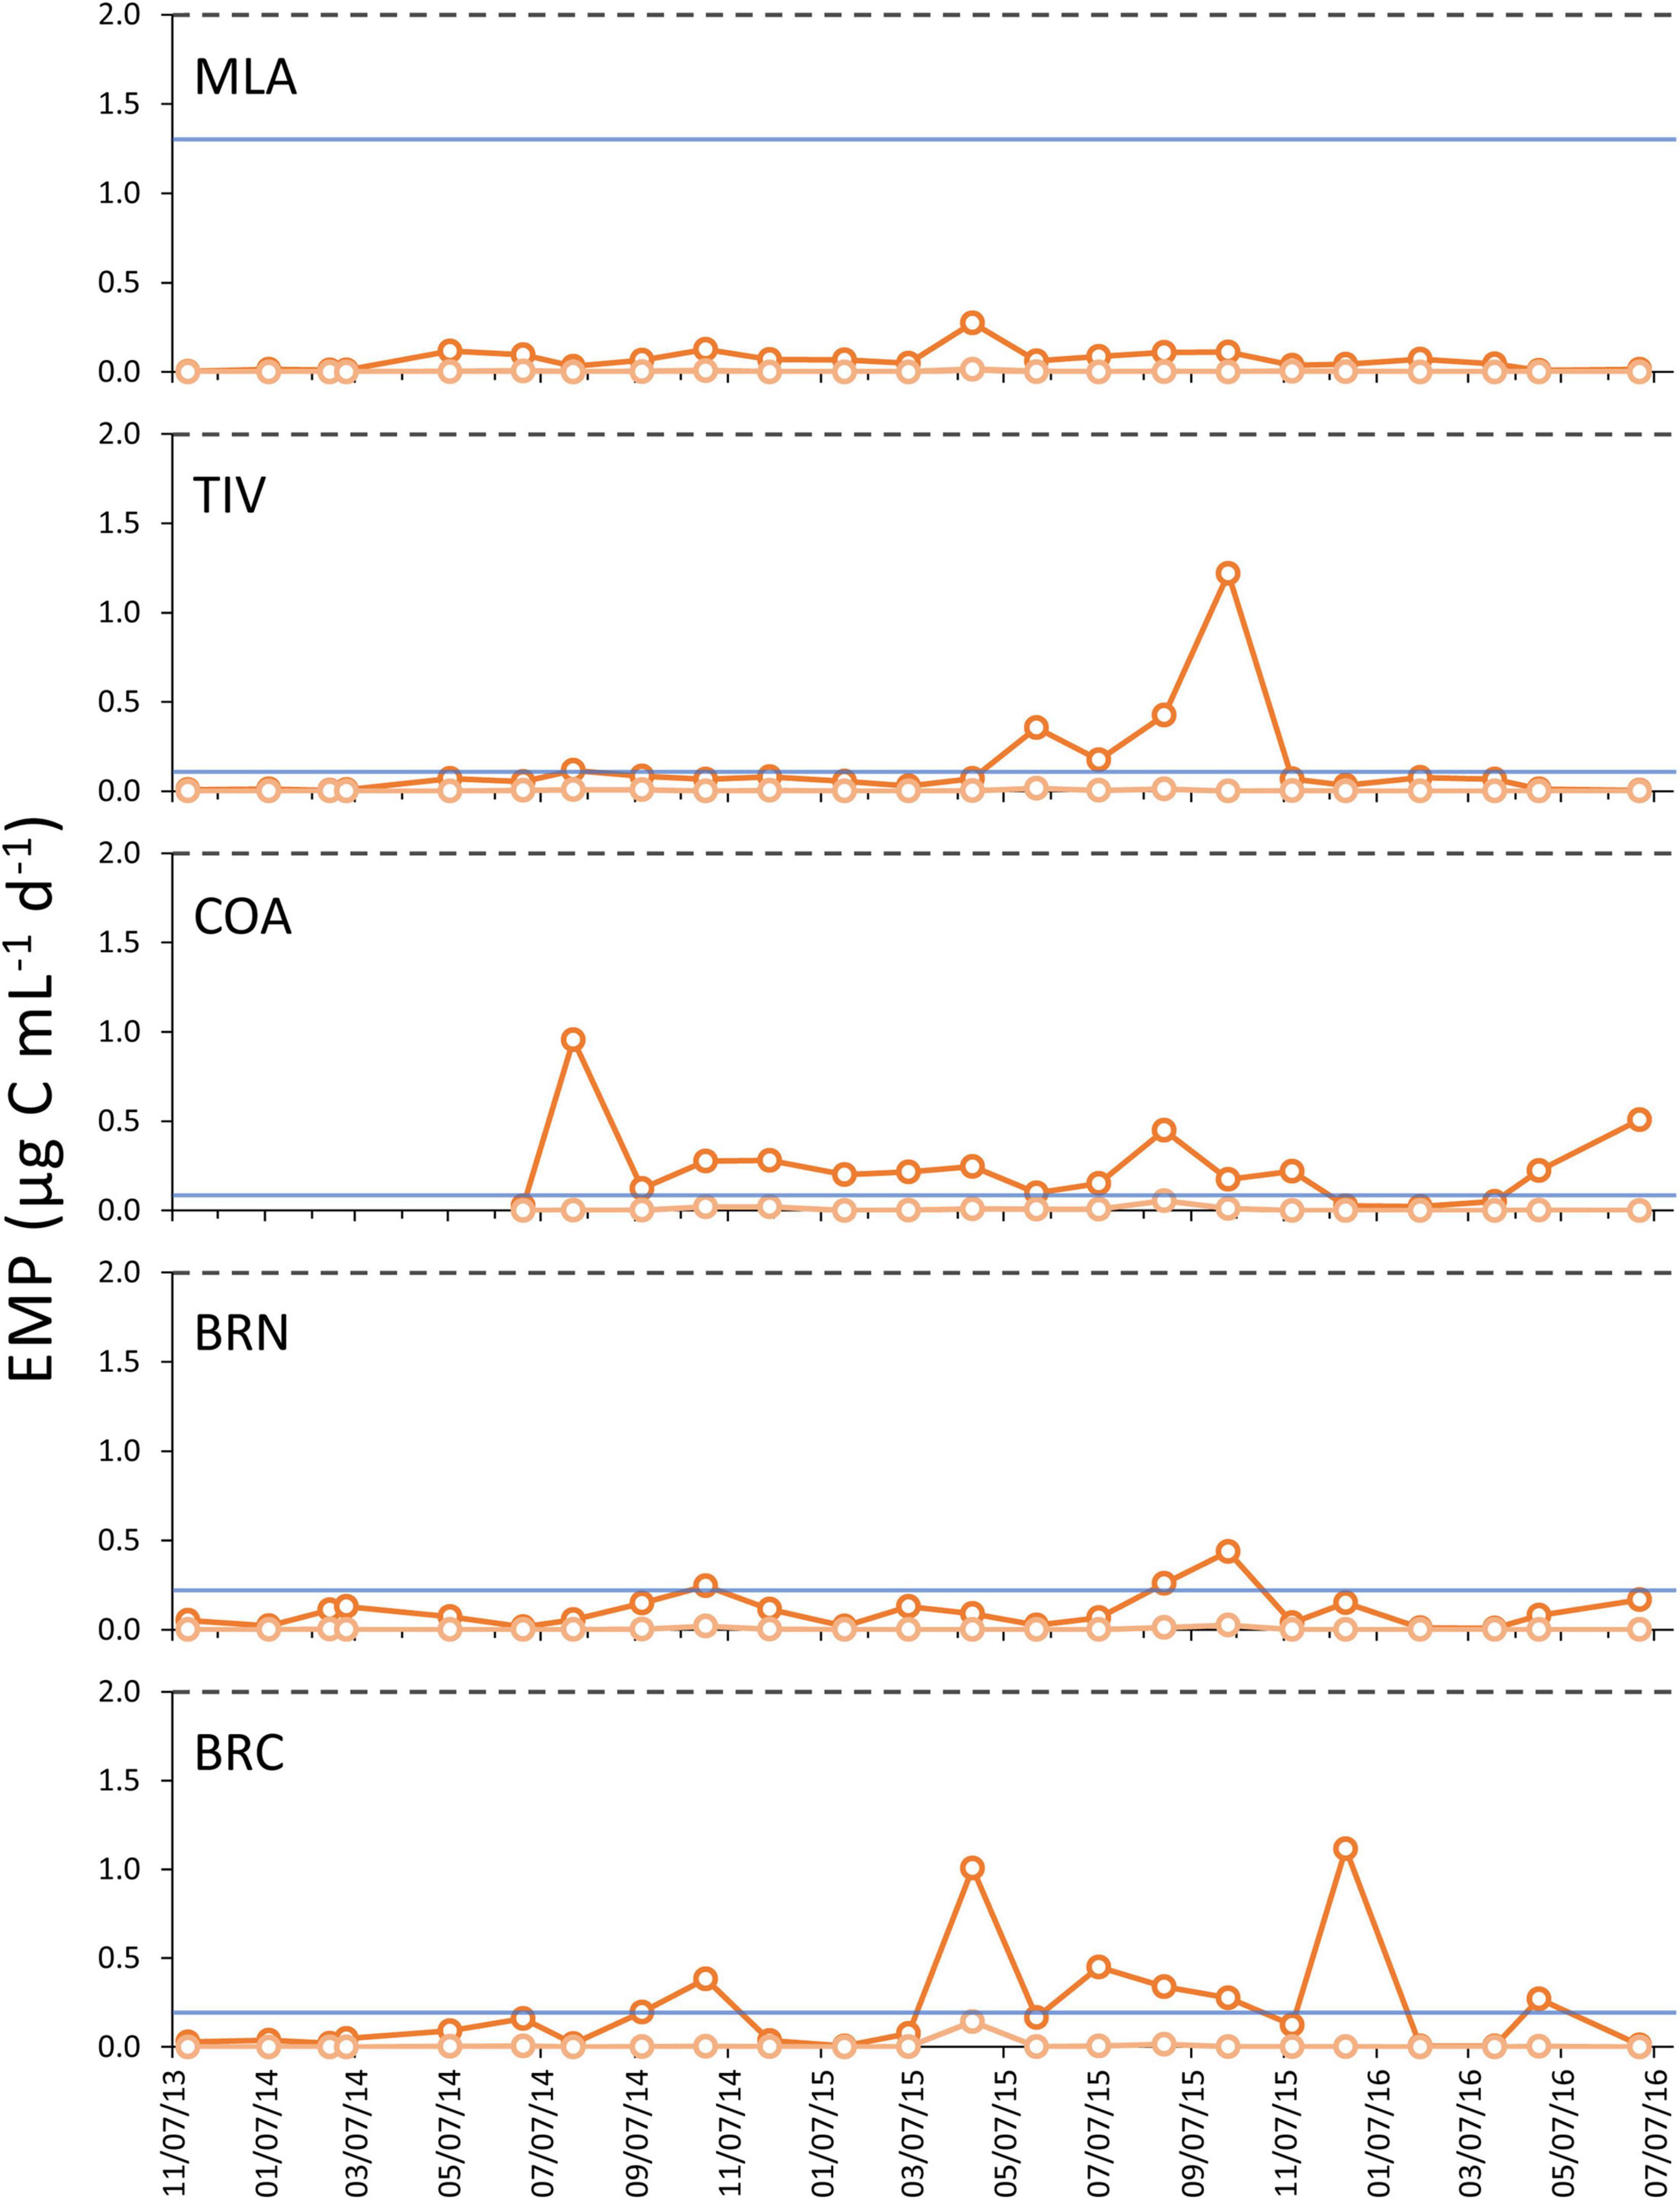
Figure 3. Estimated Metagrazing Potential maxima (EMPmax, dark orange lines) and minima (EMPmin, pale orange lines) for the suite of key mesozooplankton grazers across all five monitoring sites. To aid comparisons between grazing potential and phytoplankton biomass, the phytoplankton bloom threshold (2 μg C mL–1, gray dashed lines) and the minimum phytoplankton biomass recorded at each site (blue solid lines), are denoted.
Discussion
This investigation documents the spatial and temporal variation in mesozooplankton communities from a subtropical estuary affected by recurring phytoplankton blooms and provides a rough estimate of their grazing potential. It is important to acknowledge some limitations of this study. First, although the zooplankton tows sampled the majority of the well-mixed water column, only collecting during the day could have poorly estimated the abundances of some grazers due to diel vertical migration. Secondly, although grazing potential ranges were based on rates measured in a variety of conditions, they were still calculated indirectly from other studies. Grazing within a system is affected by a combination of factors, including those not examined by this study, such as phytoplankton quality and the abundance of alternative microzooplankton prey for omnivorous grazers. However, this study presents a method of utilizing datasets often readily available to scientists and resource managers working in bloom-impacted estuaries, providing an approximation of grazing potential to further monitoring and management efforts when direct grazing measurements are unavailable.
Results suggest that, while mesozooplankton grazing in the Indian River Lagoon system may exert some control on phytoplankton when abundances are low, it was not sufficient during the study period to suppress phytoplankton populations once they reached bloom levels. The largest Estimated Metagrazing Potential (EMPmax) calculated for the mesozooplankton community was 1.22 μg C mL–1 d–1, lower than the 2 μg C mL–1 threshold used herein to define bloom events. The brown tide pelagophyte A. lagunensis exhibited the largest algal biomass of all the phytoplankton groups surveyed during the study period. The prevalence of this alga and the composition of the zooplankton communities may help explain the apparent inability of mesozooplankton grazing to control blooms in the northern IRL system.
Two major factors affecting zooplankton grazing efficacy are prey cell size and the trophic modes of potential grazers. Many of the most abundant bloom-forming phytoplankton in the IRL and elsewhere are <5 μm, including A. lagunensis, pedinophytes, Synechococcus and other picocyanobacteria. Several studies have documented a tendency for mesozooplankton to graze on larger cells. Such findings are consistent with this study, which recorded the peak EMPs prior to the height of the A. lagunensis bloom, when algal biomasses were dominated by larger diatoms and dinoflagellates.
In addition, omnivorous mesozooplankton may also prey on microzooplankton that are often the more effective grazers of small autotrophs (Sautour et al., 2000; Calbet and Landry, 2004; Liu et al., 2005; Calbet, 2008; Davis et al., 2012). In this study, the copepods A. tonsa and O. colcarva were the most abundant mesozooplankton. Both genera are omnivorous and consume microzooplankton as a major and sometimes dominant part of their diets (Lonsdale et al., 1979, 2000; Castellani et al., 2005). Numerous studies have documented feeding in Acartia and Oithona under a variety of conditions. Jonsson and Tiselius (1990) observed the feeding behavior of A. tonsa on several ciliate taxa and on the alga Cryptomonas baltica. The authors noted that the copepods would devote time to suspension feeding on algal cells only when they were particularly abundant. At lower algal densities, A. tonsa would switch to raptorial feeding on ciliates. Rollwagen-Bollens and Penry (2003) investigated the feeding dynamics of Acartia spp. at two locations in San Francisco Bay (CA, United States) that hosted different assemblages of potential prey. The findings revealed that the copepods consumed different prey at the two sites but tended to target motile ciliates and flagellates >10 μm. Using in situ mesocosms containing natural densities of A. lagunensis and Synechococcus sp. from the upper Laguna Madre lagoon (Texas, United States), Buskey et al. (2003) tested whether A. tonsa indirectly affected phytoplankton densities by consuming herbivorous ciliates. Ciliate numbers increased in mesocosms where the copepods were removed, signaling that A. tonsa preyed on the microzooplankton. However, the rise in ciliate grazers had different impacts on the two autotrophs, reducing Synechococcus sp. but leaving A. lagunensis populations unaffected. A laboratory study by Saiz et al. (2014) on Oithona davisae feeding revealed that adult females preyed most heavily on organisms >4 μm, including ciliates, heterotrophic flagellates and nauplii from other copepod species. The authors hypothesized that these preferences were the result of ambush feeding behavior that requires prey to be large and motile enough to trigger hydromechanical detection. Finally, in a study of the variability of mesozooplankton grazing on phytoplankton at two contrasting sites in Hong Kong, Chen et al. (2017) documented a high degree of carnivory in mesozooplankton populations comprised largely of Acartia and Oithona. The preference for microzooplankton prey reduced mean grazing impacts on phytoplankton to <4% at both sites.
Another factor likely contributing to the persistence of A. lagunensis in the northern IRL system is a set of characteristics and behaviors exhibited by the species that reduces grazer fitness: (1) potential low nutritive value and toxicity, (2) allelopathy toward competitive phytoplankton, and (3) the secretion of protective exopolymers. During the brown tide-rich blooms in late 2015 and 2016, mesozooplankton populations declined at all sites, presumably driven by deteriorating conditions from the rise in A. lagunensis biomass. After zooplankton declined in the Laguna Madre lagoon (Texas, United States) following an outbreak of A. lagunensis, Buskey and Hyatt (1995) investigated the condition of A. tonsa fed on cultures of the brown tide alga. Adult egg production rates and naupliar survival both decreased. The findings suggested that A. lagunensis was mortally toxic to nauplii and a poor food for adults, producing egg release rates similar to those of starved copepods. In a study that assessed the development of A. tonsa nauplii grazing on another brown tide organism, Aureococcus anophagefferens, Smith et al. (2008) found that naupliar development was delayed when larvae consumed the alga. Interestingly, the nauplii selectively fed on more palatable algae only when the cells were larger than A. anophagefferens.
Recent work has revealed that brown tides can also inhibit the growth of competing phytoplankton, potentially lowering the availability of other food sources for grazers. In an investigation of the allelopathic effects of A. lagunensis and A. anophagefferens on a wide variety of phytoplankton, Kang and Gobler (2018) documented reductions of up to 96% in the abundance of competing autotrophs. Filtrate of Aureoumbra cultures also reduced the photosynthetic efficiency of Synechococcus and the diatom Chaetoceros calcitrans by 53 and 19%, respectively. A particularly concerning discovery was that strains of Aureoumbra isolated from the IRL in 2012 and 2013 had a higher allelopathic potency compared to those obtained from Laguna Madre, Texas 20 years ago. The 2015–2016 blooms in the present study were usually dominated by A. lagunensis biomass, but frequently contained elevated levels of other phytoplankton as well. However, diatoms and dinoflagellates, two well-documented primary food sources for mesozooplankton, never exceeded 0.64 μg C mL–1 during this period. These results may reflect the use of allelopathic chemicals by A. lagunensis to reduce competitive phytoplankton populations.
The utilization of extracellular polymeric substances (EPS) may also give A. lagunensis a competitive edge. In laboratory experiments using cultures isolated from Texas, Liu and Buskey (2000a) found that the alga formed a mucus layer of secreted EPS. As populations progressed from growth to decline, per cell EPS production increased threefold, which was maximized under hypersaline conditions. The authors continued their investigation by feeding high and low EPS cultures of A. lagunensis to three protozoan species common in the bloom area (Liu and Buskey, 2000b). All taxa showed reduced growth rates in the high EPS treatment. A subsequent experiment with one of those taxa, the ciliate Aspidisca sp., revealed that the slower growth resulted from reduced grazing, possibly from mucus clogging its feeding apparatus or from impaired grazing caused by the altered swimming behavior observed in the high EPS treatment.
Two of the most promising candidates for grazing down brown tide and other phytoplankton during this study were the copepod P. crassirostris and the larvacean Oikopleura sp. Both taxa were major contributors to the EMP peaks documented at COA and BRC, and while A. tonsa exhibited the highest densities overall, P. crassirostris was the most abundant primarily herbivorous grazer. However, densities of the copepod dropped by an average 81% during bloom periods. Researchers have also documented reduced feeding and increased mortality of P. crassirostris during grazing experiments on A. lagunensis and two other common IRL bloom taxa (Ma et al., 2021a, b and unpublished data), suggesting it is not a viable mitigator of many algal blooms in this estuary. In contrast, Oikopleura sp. was significantly more abundant during bloom periods at COA, although this was driven largely by its high densities during diatom and dinoflagellate-rich blooms in 2014 and summer 2015. However, the larvacean was still one of the most abundant taxa, with densities >3 ind. L–1, during the start of the 2015–2016 A. lagunensis blooms at MLA and TIV. Although we are unaware of any studies investigating the effects of A. lagunensis on Oikopleura, Badylak and Phlips (2008) tracked the abundances of Oikopleura dioica and the copepods A. tonsa and O. colcarva during a bloom of the toxic dinoflagellate P. bahamense in Tampa Bay (FL). While populations of both copepods declined, O. dioica abundances mimicked those of P. bahamense, suggesting it was more tolerant to the toxic alga. This resilience during some blooms, coupled with the ability to ingest copious small phytoplankton caught in mucous feeding nets (Acuña and Kiefer, 2000; Scheinberg et al., 2005; Troedsson et al., 2007), positions Oikopleura as the most likely mesozooplankter to suppress blooms of phytoplankton <5 μm in the northern IRL system.
However, another layer of complexity exists for grazers able to consume A. lagunensis, in particular. The same EPS coating that deters some herbivores may keep the algal cells from being digested or even damaged when they are consumed. In a laboratory study testing the viability of A. lagunensis consumed by A. tonsa, Bersano et al. (2002) found undamaged cells that proceeded to inoculate new algal cultures after being sequestered inside copepod fecal pellets for 3 days. The authors postulated that the EPS layer helped protect cells from digestion, allowing them to re-enter the water column and persist as primary producers. This process has been documented for other algae as well. Porter (1976) detailed the grazing of the green alga Sphaerocystis schroeteri by freshwater cladocerans from the genus Daphnia. Cells of this autotroph form colonies that are surrounded by a protective gelatinous sheath. Observations revealed that S. schroeteri was fed on at a lower rate than unsheathed algal taxa and was resistant to digestion when consumed. In fact, >90% of ingested cells passed through the gut undamaged. The author noted that grazing did break up cell clusters and remove the protective sheath of many colonies, but this removal allowed for the uptake of nutrients by S. schroeteri from within the guts of Daphnia, boosting algal growth that could compensate for the minor losses due to grazing.
These studies provide ample evidence that A. lagunensis can reduce grazing opportunities and foster malnourishment, starvation and population declines of mesozooplankton grazers. In the present study, dramatic reductions of primary grazers at all sites during the most intense blooms may have been caused by one or more of these ‘anti-grazer’ mechanisms, allowing the blooms to persist for several months. The IRL system is a complex and diverse estuary where phytoplankton communities that were dominated by diatoms and dinoflagellates have been largely displaced over the past decade by smaller taxa that appear to evade grazing by mesozooplankton. The frequency of small-celled phytoplankton blooms is likely to increase as warming ocean temperatures favor these taxa over larger autotrophs (Flombaum et al., 2013; Phlips et al., 2015; Cloern, 2018). Recent research has revealed additional competitive advantages for some small species, such as the discovery of a protective resting stage for A. lagunensis that may facilitate future blooms and geographic expansion (Kang et al., 2017). This projected spread forewarns that more coastal systems will grapple with similar threats to economic, public and ecosystem health stemming from blooms of shared taxa. However, each estuary facing recurring phytoplankton blooms is unique with changing biological communities that provide different probabilities for top-down control. Therefore, it is important to systematically evaluate these potential controls with a consideration for the dynamic conditions of each ecosystem.
Data Availability Statement
The raw data supporting the conclusions of this article will be made available by the authors, without undue reservation.
Author Contributions
KJ, LS, and HA conceived and designed the mesozooplankton monitoring plan. LS and HA collected and curated the mesozooplankton and abiotic environmental data. EP supplied the phytoplankton data. LS analyzed the data and wrote the manuscript with support from KJ, HA, and EP. All authors contributed to the article and approved the submitted version.
Funding
This work was supported by St. Johns River Water Management District, award #27786. Funding for the publication of this manuscript was provided by the Smithsonian National Museum of Natural History and by the Indian River Lagoon National Estuary Program (IRLNEP) through an EPA Region 4 supplemental funding grant. This is Smithsonian Marine Station contribution #1168.
Conflict of Interest
The authors declare that the research was conducted in the absence of any commercial or financial relationships that could be construed as a potential conflict of interest.
The handling editor is currently organizing a Research Topic with one of the author, KJ.
Publisher’s Note
All claims expressed in this article are solely those of the authors and do not necessarily represent those of their affiliated organizations, or those of the publisher, the editors and the reviewers. Any product that may be evaluated in this article, or claim that may be made by its manufacturer, is not guaranteed or endorsed by the publisher.
Acknowledgments
We would like to acknowledge Angel Seery, Xiao Ma, Kate Beckett, Tony Cox, and Casey Hederman for their help in the lab and field. We thank Tim Fletcher and Bill Battin for providing vessel and equipment support. Special thanks to Chuck Jacoby for his guidance and dedication to the Indian River Lagoon, and to St. Johns River Water Management District for sponsoring this research. We acknowledge and thank the IRL Council, host of the IRLNEP, and the U.S. EPA for providing encouragement and funding to support publication of this manuscript.
Footnotes
References
Acuña, J. L., and Kiefer, M. (2000). Functional response of the appendicularian Oikopleura dioica. Limnol. Oceanogr. 45, 608–618. doi: 10.4319/lo.2000.45.3.0608
Ahlgren, G. (1983). Comparison of methods for estimation of phytoplankton carbon. Arch. Hydrobiol. 98, 489–508.
Alajmi, F., Zeng, C., and Jerry, D. R. (2015). Domestication as a novel approach for improving the cultivation of calanoid copepods: a case study with Parvocalanus crassirostris. PLoS One 10:e0133269. doi: 10.1371/journal.pone.0133269
Almeda, R., Pedersen, T. M., Jakobsen, H. H., and Alcaraz, M. (2009). Feeding and growth kinetics of the planktotrophic larvae of the spionid polychaete Polydora ciliata (Johnston). J. Exp. Mar. Biol. Ecol. 382, 61–68. doi: 10.1016/j.jembe.2009.09.017
An, X., Li, X., and Li, Z. (2016). Effects of concentrations of Prorocentrum donghaiense and Oxyrrhis marina on the feeding behaviour of Oithona brevicornis. Nat. Environ. Pollut. Technol. 15, 1195–1198.
Anderson, D. M., Burkholder, J. M., Cochlan, W. P., Glibert, P. M., Gobler, C. J., Heil, C. A., et al. (2008). Harmful algal blooms and eutrophication: examining linkages from selected coastal regions of the United States. Harmful Algae 8, 39–53. doi: 10.1016/j.hal.2008.08.017
Anderson, D. M., Fensin, E., Gobler, C. J., Hoeglund, A. E., Hubbard, K. A., Kulis, D. M., et al. (2021). Marine harmful algal blooms (HABS) in the United States: history, current status and future trends. Harmful Algae 102:101975. doi: 10.1016/j.hal.2021.101975
Badylak, S., and Phlips, E. J. (2008). Spatial and temporal distributions of zooplankton in Tampa Bay, Florida, including observations during a HAB event. J. Plankton Res. 30, 449–465. doi: 10.1093/plankt/fbn010
Bemal, S., and Anil, A. C. (2019). Picophytoplankton Synechococcus as food for nauplii of Amphibalanus amphitrite and Artemia salina. Hydrobiologia 835, 21–36. doi: 10.1007/s10750-019-3923-x
Bersano, J. G. F., Buskey, E. J., and Villareal, T. A. (2002). Viability of the Texas brown tide alga, Aureoumbra lagunensis, in fecal pellets of the copepod Acartia tonsa. Plankton Biol. Ecol. 49, 88–92.
Breier, C. F., and Buskey, E. J. (2007). Effects of the red tide dinoflagellate, Karenia brevis, on grazing and fecundity in the copepod Acartia tonsa. J. Plankton Res. 29, 115–126. doi: 10.1093/plankt/fbl075
Broms, F., and Tiselius, P. (2003). Effects of temperature and body size on the clearance rate of Oikopleura dioica. J. Plankton Res. 25, 573–577. doi: 10.1093/plankt/25.5.573
BS EN 14407:2004 (2004). Water Quality – Guidance Standard for the Identification, Enumeration and Interpretation of Benthic Diatom Samples from Running Waters. London: British Standards Institution.
Buskey, E. J., Deyoe, H., Jochem, F. J., and Villareal, T. A. (2003). Effects of mesozooplankton removal and ammonium addition on planktonic trophic structure during a bloom of the texas ‘brown tide’: a mesocosm study. J. Plankton Res. 25, 215–228. doi: 10.1093/plankt/25.2.215
Buskey, E. J., and Hyatt, C. J. (1995). Effects of the Texas (USA) ‘brown tide’ alga on planktonic grazers. Mar. Ecol. Prog. Ser. 126, 285–292. doi: 10.3354/meps126285
Calbet, A. (2001). Mesozooplankton grazing effect on primary production: a global comparative analysis in marine ecosystems. Limnol. Oceanogr. 46, 1824–1830. doi: 10.4319/lo.2001.46.7.1824
Calbet, A. (2008). The trophic roles of microzooplankton in marine systems. ICES J. Mar. Sci. 65, 325–331. doi: 10.1093/icesjms/fsn013
Calbet, A., and Landry, M. R. (1999). Mesozooplankton influences on the microbial food web: direct and indirect trophic interactions in the oligotrophic open ocean. Limnol. Oceanogr. 44, 1370–1380. doi: 10.4319/lo.1999.44.6.1370
Calbet, A., and Landry, M. R. (2004). Phytoplankton growth, microzooplankton grazing, and carbon cycling in marine systems. Limnol. Oceanogr. 49, 51–57. doi: 10.4319/lo.2004.49.1.0051
Calbet, A., Landry, M. R., and Scheinberg, R. D. (2000). Copepod grazing in a subtropical bay: species-specific responses to a midsummer increase in nanoplankton standing stock. Mar. Ecol. Prog. Ser. 193, 75–84. doi: 10.3354/meps193075
Calbet, A., and Saiz, E. (2005). The ciliate-copepod link in marine ecosystems. Aquat. Microb. Ecol. 38, 157–167. doi: 10.3354/ame038157
Calbet, A., Vaqué, D., Felipe, J., Vila, M., Alcaraz, M., and Estrada, M. (2003). Relative grazing impact of microzooplankton and mesozooplankton. Mar. Ecol. Prog. Ser. 259, 303–309. doi: 10.3354/meps259303
Campanati, C., Yip, S., Lane, A., and Thiyagarajan, V. (2016). Combined effects of low pH and low oxygen on the early-life stages of the barnacle Balanus amphitrite. ICES J. Mar. Sci. 73, 791–802. doi: 10.1093/icesjms/fsv221
Castellani, C., Irigoien, X., Harris, R. P., and Lampitt, R. S. (2005). Feeding and egg production of Oithona similis in the North Atlantic. Mar. Ecol. Prog. Ser. 288, 173–182. doi: 10.3354/meps288173
Chen, M., Liu, H., and Chen, B. (2017). Seasonal variability of mesozooplankton feeding rates on phytoplankton in subtropical coastal and estuarine waters. Front. Mar. Sci. 4:186. doi: 10.3389/fmars.2017.00186
Chen, M., Liu, H., and Li, H. (2013). Effect of mesozooplankton feeding selectivity on the dynamics of algae in the presence of intermediate grazers–a laboratory simulation. Mar. Ecol. Prog. Ser. 486, 47–58. doi: 10.3354/meps10393
Cloern, J. E. (2018). Why large cells dominate estuarine phytoplankton. Limnol. Oceanogr. 63, S392–S409. doi: 10.1002/lno.10749
David, V., Selleslagh, J., Nowaczyk, A., Dubois, S., Bachelet, G., Blanchet, H., et al. (2016). Estuarine habitats structure zooplankton communities: implications for the pelagic trophic pathways. Estuar. Coast. Shelf. Sci. 179, 99–111. doi: 10.1016/j.ecss.2016.01.022
Davidson, C. L., and Clem, S. A. (2003). Comparison of 100-Organism vs. 300-Organism Subsampling for use with ADEQ’s Aquatic Macroinvertebrate Sampling Methodology. Little Rock, AR: Arkansas Department of Environmental Quality, Water Division.
Davis, C. C. (1949). Observations of plankton taken in marine waters of Florida in 1947 and 1948. Q. J. Fla. Acad. Sci. 12, 67–103.
Davis, T. W., Koch, F., Marcoval, M. A., Wilhelm, S. W., and Gobler, C. J. (2012). Mesozooplankton and microzooplankton grazing during cyanobacterial blooms in the western basin of Lake Erie. Harmful Algae 15, 26–35. doi: 10.1016/j.hal.2011.11.002
Desai, D. V., and Anil, A. C. (2004). The impact of food type, temperature and starvation on larval development of Balanus amphitrite Darwin (Cirripedia: Thoracica). J. Exp. Mar. Biol. Ecol. 306, 113–137. doi: 10.1016/j.jembe.2004.01.005
Desai, D. V., and Prakash, S. (2009). Physiological responses to hypoxia and anoxia in Balanus amphitrite (Cirripedia: Thoracica). Mar. Ecol. Prog. Ser. 390, 157–166. doi: 10.3354/meps08155
Dix, N., and Hanisak, M. D. (2015). Microzooplankton grazing experiments in the subtropical Indian River Lagoon, Florida challenge assumptions of the dilution technique. J. Exp. Mar. Biol. Ecol. 465, 1–10. doi: 10.1016/j.jembe.2014.12.010
Flombaum, P., Gallegos, J. L., Gordillo, R. A., Rincón, J., Zabala, L. L., Jiao, N., et al. (2013). Present and future global distributions of the marine cyanobacteria Prochlorococcus and Synechococcus. Proc. Natl. Acad. Sci. U.S.A. 110, 9824–9829. doi: 10.1073/pnas.1307701110
Gobler, C. J. (2020). Climate change and harmful algal blooms: insights and perspective. Harmful Algae 91:101731. doi: 10.1016/j.hal.2019.101731
Grice, G. D. (1960). Calanoid and cyclopoid copepods collected from the Florida Gulf coast and Florida Keys in 1954 and 1955. Bull. Mar. Sci. 10, 217–226.
Hansen, B. W., Jakobsen, H. H., Andersen, A., Almeda, R., Pedersen, T. M., Christensen, A. M., et al. (2010). Swimming behavior and prey retention of the polychaete larvae Polydora ciliata (Johnston). J. Exp. Mar. Biol. Ecol. 213, 3237–3246. doi: 10.1242/jeb.038810
Heisler, J., Glibert, P., Burkholder, J., Anderson, D., Cochlan, W., Dennison, W., et al. (2008). Eutrophication and harmful algal blooms: a scientific consensus. Harmful Algae 8, 3–13. doi: 10.1016/j.hal.2008.08.006
Houde, S. E. L., and Roman, M. R. (1987). Effects of food quality on the functional ingestion response of the copepod Acartia tonsa. Mar. Ecol. Prog. Ser. 40, 69–77.
Ismar, S. M., Kottmann, J. S., and Sommer, U. (2018). First genetic quantification of sex-and stage-specific feeding in the ubiquitous copepod Acartia tonsa. Mar. Biol. 165, 1–10. doi: 10.1007/s00227-017-3281-z
Jakobsen, H. H., Halvorsen, E., Hansen, B. W., and Visser, A. W. (2005). Effects of prey motility and concentration on feeding in Acartia tonsa and Temora longicornis: the importance of feeding modes. J. Plankton Res. 27, 775–785. doi: 10.1093/plankt/fbi051
Johnson, W. S., and Allen, D. (2012). Zooplankton of the Atlantic and Gulf Coasts: A Guide to Their Identification and Ecology. Baltimore, MD: Johns Hopkins University Press.
Jonsson, P. P., and Tiselius, P. (1990). Feeding behaviour, prey detection and capture efficiency of the copepod Acartia tonsa feeding on planktonic ciliates. Mar. Ecol. Prog. Ser. 60, 35–44. doi: 10.3354/meps060035
Kang, Y., and Gobler, C. J. (2018). The brown tide algae, Aureococcus anophagefferens and Aureoumbra lagunensis (Pelagophyceae), allelopathically inhibit the growth of competing microalgae during harmful algal blooms. Limnol. Oceanogr. 63, 985–1003. doi: 10.1002/lno.10714
Kang, Y., Tang, Y. Z., Taylor, G. T., and Gobler, C. J. (2017). Discovery of a resting stage in the harmful, brown-tide-causing pelagophyte, Aureoumbra lagunensis: a mechanism potentially facilitating recurrent blooms and geographic expansion. J. Phycol. 53, 118–130. doi: 10.1111/jpy.12485
Katechakis, A., and Stibor, H. (2004). Feeding selectivities of the marine cladocerans Penilia avirostris, Podon intermedius and Evadne nordmanni. Mar. Biol. 145, 529–539. doi: 10.1007/s00227-004-1347-1
Kleppel, G. S., and Hazzard, S. E. (2000). Diet and egg production of the copepod Acartia tonsa in Florida Bay. II. Role of the nutritional environment. Mar. Biol. 137, 111–121. doi: 10.1007/s002270000319
Lapointe, B. E., Herren, L. W., Brewton, R. A., and Alderman, P. K. (2020). Nutrient over-enrichment and light limitation of seagrass communities in the Indian River Lagoon, an urbanized subtropical estuary. Sci. Total Environ. 699:134068. doi: 10.1016/j.scitotenv.2019.134068
Lazensky, R., Silva-Sanchez, C., Kroll, K. J., Chow, M., Chen, S., Tripp, K., et al. (2021). Investigating an increase in Florida manatee mortalities using a proteomic approach. Sci. Rep. 11:4282. doi: 10.1038/s41598-021-83687-y
Lewis, D. M., Thompson, K. A., MacDonald, T. C., and Cook, G. S. (2021). Understanding shifts in estuarine fish communities following disturbances using an ensemble modeling framework. Ecol. Indic. 126:107623. doi: 10.1016/j.ecolind.2021.107623
Lewis, D. M., Troast, B. V., Glomb, J. C., and Cook, G. S. (2020). An ecological characterization of fish assemblages in Mosquito Lagoon, Florida. Southeast. Nat. 19, 491–510. doi: 10.1656/058.019.0306
Liu, H., and Buskey, E. J. (2000a). Hypersalinity enhances the production of extracellular polymeric substance (EPS) in the Texas brown tide alga, Aureoumbra lagunensis (Pelagophyceae). J. Phycol. 36, 71–77. doi: 10.1046/j.1529-8817.2000.99076.x
Liu, H., and Buskey, E. J. (2000b). The exopolymer secretions (EPS) layer surrounding Aureoumbra lagunensis cells affects growth, grazing, and behavior of protozoa. Limnol. Oceanogr. 45, 1187–1191. doi: 10.4319/lo.2000.45.5.1187
Liu, H., Chen, M., Zhu, F., and Harrison, P. J. (2016). Effect of diatom silica content on copepod grazing, growth and reproduction. Front. Mar. Sci. 3:89. doi: 10.3389/fmars.2016.00089
Liu, H., Dagg, M. J., Wu, C. J., and Chiang, K. P. (2005). Mesozooplankton consumption of microplankton in the Mississippi River plume, with special emphasis on planktonic ciliates. Mar. Ecol. Prog. Ser. 286, 133–144. doi: 10.3354/meps286133
Lobry, J., David, V., Pasquaud, S., Lepage, M., Sautour, B., and Rochard, E. (2008). Diversity and stability of an estuarine trophic network. Mar. Ecol. Prog. Ser. 358, 13–25. doi: 10.3354/meps07294
Lombard, F., Renaud, F., Sainsbury, C., Sciandra, A., and Gorsky, G. (2009). Appendicularian ecophysiology I: food concentration dependent clearance rate, assimilation efficiency, growth and reproduction of Oikopleura dioica. J. Mar. Syst. 78, 606–616. doi: 10.1016/j.jmarsys.2009.01.004
Lonsdale, D. J., Caron, D. A., Dennett, M. R., and Schaffner, R. (2000). Predation by Oithona spp. on protozooplankton in the Ross Sea, Antarctica. Deep Sea Res. 2 Top. Stud. Oceanogr. 47, 3273–3283. doi: 10.1016/S0967-0645(00)00068-0
Lonsdale, D. J., Heinle, D. R., and Siegfried, C. (1979). Carnivorous feeding behavior of the adult calanoid copepod Acartia tonsa Dana. J. Exp. Biol 36, 235–248. doi: 10.1016/0022-0981(79)90119-9
Ma, X., Jacoby, C. A., and Johnson, K. B. (2021a). Grazing by the copepod Parvocalanus crassirostris on Picochlorum sp. at harmful bloom densities and the role of particle size. Front. Mar. Sci. 8:664154. doi: 10.3389/fmars.2021.664154
Ma, X., Jacoby, C. A., and Johnson, K. B. (2021b). High densities of a prochlorophyte (unresolved species) inhibit grazing by the herbivorous copepod Parvocalanus crassirostris. Front. Mar. Sci. 8:664153. doi: 10.3389/fmars.2021.664153
Morison, F., Pierson, J. J., Oikonomou, A., and Menden-Deuer, S. (2020). Mesozooplankton grazing minimally impacts phytoplankton abundance during spring in the western North Atlantic. PeerJ 8:e9430. doi: 10.7717/peerj.9430
National Marine Fisheries Service (2021). Fisheries of the United States, 2019. U.S. Department of Commerce, NOAA Current Fishery Statistics No. 2019. Available online at: https://www.fisheries.noaa.gov/national/sustainable-fisheries/fisheries-united-states. (accessed June 17, 2021)
Pechenik, J. A. (1980). Growth and energy balance during the larval lives of three prosobranch gastropods. J. Exp. Mar. Biol. Ecol. 44, 1–28. doi: 10.1016/0022-0981(80)90098-2
Phlips, E. J., and Badylak, S. (2013). Phytoplankton Abundance and Composition in the Indian River Lagoon. 2011-2012 Annual Report to St. Johns River Water Management District. Gainesville, FL: University of Florida.
Phlips, E. J., Badylak, S., Christman, M. C., and Lasi, M. A. (2010). Climatic trends and temporal patterns of phytoplankton composition, abundance, and succession in the Indian River Lagoon, Florida, USA. Estuar. Coast. 33, 498–512. doi: 10.1007/s12237-009-9166-8
Phlips, E. J., Badylak, S., Lasi, M. A., Chamberlain, R., Green, W. C., Hall, L. M., et al. (2015). From red tides to green and brown tides: bloom dynamics in a restricted subtropical lagoon under shifting climatic conditions. Estuar. Coast. 38, 886–904. doi: 10.1007/s12237-014-9874-6
Phlips, E. J., Badylak, S., and Lynch, T. C. (1999). Blooms of the picoplanktonic cyanobacterium Synechococcus in Florida Bay, a subtropical inner-shelf lagoon. Limnol. Oceanogr. 44, 1166–1175. doi: 10.4319/lo.1999.44.4.1166
Phlips, E. J., Badylak, S., Nelson, N. G., Hall, L. M., Jacoby, C. A., Lasi, M. A., et al. (2021). Cyclical patterns and a regime shift in the character of phytoplankton blooms in a restricted sub-tropical lagoon, Indian River Lagoon, Florida, United States. Front. Mar. Sci. 8:730934. doi: 10.3389/fmars.2021.730934
Phlips, E. J., Badylak, S., Nelson, N. G., and Havens, K. E. (2020). Hurricanes, El Niño and harmful algal blooms in two sub-tropical Florida estuaries: direct and indirect impacts. Sci. Rep. 10:1910. doi: 10.1038/s41598-020-58771-4
Porter, K. G. (1976). Enhancement of algal growth and productivity by grazing zooplankton. Science 192, 1332–1334. doi: 10.1126/science.192.4246.1332
Raven, J. A., Gobler, C. J., and Hansen, P. J. (2020). Dynamic CO2 and pH levels in coastal, estuarine, and inland waters: theoretical and observed effects on harmful algal blooms. Harmful Algae 91:101594. doi: 10.1016/j.hal.2019.03.012
Rey, J. R., Kain, T., Crossman, R., Peterson, M., Shaffer, J., and Vose, F. (1991). Zooplankton of impounded marshes and shallow areas of a subtropical lagoon. Fla. Sci. 54, 191–203.
Rollwagen-Bollens, G. C., and Penry, D. L. (2003). Feeding dynamics of Acartia spp. copepods in a large, temperate estuary (San Francisco Bay, CA). Mar. Ecol. Prog. Ser. 257, 139–158. doi: 10.3354/meps257139
Saiz, E., Griffell, K., Calbet, A., and Isari, S. (2014). Feeding rates and prey: predator size ratios of the nauplii and adult females of the marine cyclopoid copepod Oithona davisae. Limnol. Oceanogr. 59, 2077–2088. doi: 10.4319/lo.2014.59.6.2077
Sánchez, N., González, H. E., and Iriarte, J. L. (2011). Trophic interactions of pelagic crustaceans in Comau Fjord (Chile): their role in the food web structure. J. Plankton Res. 33, 1212–1229. doi: 10.1093/plankt/fbr022
Sautour, B., Artigas, L. F., Delmas, D., Herbland, A., and Laborde, P. (2000). Grazing impact of micro- and mesozooplankton during a spring situation in coastal waters off the Gironde estuary. J. Plankton Res. 22, 531–552. doi: 10.1093/plankt/22.3.531
Schaefer, A. M., Hanisak, M. D., McFarland, M., and Sullivan, J. M. (2019). Integrated observing systems: an approach to studying harmful algal blooms in south Florida. J. Oper. Oceanogr. 12, S187–S198. doi: 10.1080/1755876X.2019.1606879
Scheinberg, R. D., Landry, M. R., and Calbet, A. (2005). Grazing of two common appendicularians on the natural prey assemblage of a tropical coastal ecosystem. Mar. Ecol. Prog. Ser. 294, 201–212. doi: 10.3354/meps294201
Schmoker, C., Hernández-León, S., and Calbet, A. (2013). Microzooplankton grazing in the oceans: impacts, data variability, knowledge gaps and future directions. J. Plankton Res. 35, 691–706. doi: 10.1093/plankt/fbt023
Selander, E., and Tiselius, P. (2003). Effects of food concentration on the behaviour of Oikopleura dioica. Mar. Biol. 142, 263–270. doi: 10.1007/s00227-002-0949-8
Sherr, E. B., and Sherr, B. F. (2007). Heterotrophic dinoflagellates: a significant component of microzooplankton biomass and major grazers of diatoms in the sea. Mar. Ecol. Prog. Ser. 352, 187–197. doi: 10.3354/meps07161
Sicko-Goad, L. M., Schelske, C. L., and Stoermer, E. F. (1984). Estimation of intracellular carbon and silica content of diatoms from natural assemblages using morphometric techniques. Limnol. Oceanogr. 29, 1170–1178. doi: 10.4319/lo.1984.29.6.1170
Smart, T. I. (2003). The Effects of Body Size and Particle Size on Feeding Rates and Morphology of the Larvae of Three Congeneric Barnacles (Class Cirripedia: Genus Balanus). Master’s thesis. Eugene, OR: University of Oregon.
Smayda, T. J. (1978). “From phytoplankters to biomass,” in Phytoplankton Manual, ed. A. Sournia (Paris: UNESCO), 273–279.
Smith, D. L., and Johnson, K. B. (1996). A Guide to Marine Coastal Plankton and Marine Invertebrate Larvae, 2nd Edn. Dubuque: Kendall/Hunt Publishing Company.
Smith, J. K., Lonsdale, D. J., Gobler, C. J., and Caron, D. A. (2008). Feeding behavior and development of Acartia tonsa nauplii on the brown tide alga Aureococcus anophagefferens. J. Plankton Res. 30, 937–950. doi: 10.1093/plankt/fbn050
Sommer, U., and Stibor, H. (2002). Copepoda–cladocera–tunicata: the role of three major mesozooplankton groups in pelagic food webs. Ecol. Res. 17, 161–174. doi: 10.1046/j.1440-1703.2002.00476.x
Strathmann, R. R. (1967). Estimating the organic carbon content of phytoplankton from cell volume or plasma volume. Limnol. Oceanogr. 12, 411–418. doi: 10.4319/lo.1967.12.3.0411
Sunda, W. G., Graneli, E., and Gobler, C. J. (2006). Positive feedback and the development and persistence of ecosystem disruptive algal blooms. J. Phycol. 42, 963–974. doi: 10.1111/j.1529-8817.2006.00261.x
Svensen, C., and Vernet, M. (2016). Production of dissolved organic carbon by Oithona nana (Copepoda: Cyclopoida) grazing on two species of dinoflagellates. Mar. Biol. 163, 1–8. doi: 10.1007/s00227-016-3005-9
Troedsson, C., Frischer, M. E., Nejstgaard, J. C., and Thompson, E. M. (2007). Molecular quantification of differential ingestion and particle trapping rates by the appendicularian Oikopleura dioica as a function of prey size and shape. Limnol. Oceanogr. 52, 416–427. doi: 10.4319/lo.2007.52.1.0416
Utermöhl, H. (1958). Zur vervollkommnung der quantitativen phytoplankton-methodik. Mitt. Int. Ver. Theor. Angew. Limnol. 9, 1–38. doi: 10.1080/05384680.1958.11904091
White, J. R., and Roman, M. R. (1992). Seasonal study of grazing by metazoan zooplankton in the mesohaline Chesapeake Bay. Mar. Ecol. Prog. Ser. 86, 251–251. doi: 10.3354/meps086251
Work, K., Havens, K., Sharfstein, B., and East, T. (2005). How important is bacterial carbon to planktonic grazers in a turbid, subtropical lake? J. Plankton Res. 27, 357–372. doi: 10.1093/plankt/fbi013
Youngbluth, M., Gibson, R., Blades, P., Meyer, D., Stephens, C., and Mahoney, R. (1976). “Plankton in the Indian River Lagoon,” in Indian River Coastal Zone Study Third Annual Report: A Report on Research Progress October 1975–October 1976, ed. D. K. Young (Fort Pierce, FL: Harbor Branch Consortium), 40–60.
Yu, S. P., and Chan, B. K. K. (2020). Effects of polystyrene microplastics on larval development, settlement, and metamorphosis of the intertidal barnacle Amphibalanus amphitrite. Ecotox. Environ. Safe. 194:110362. doi: 10.1016/j.ecoenv.2020.110362
Keywords: bloom controls, estuary, Florida, grazing potential, harmful algal blooms, Indian River Lagoon, mesozooplankton, phytoplankton
Citation: Sweat LH, Alexander H, Phlips EJ and Johnson KB (2021) Mesozooplankton Community Dynamics and Grazing Potential Across Algal Bloom Cycles in a Subtropical Estuary. Front. Mar. Sci. 8:734270. doi: 10.3389/fmars.2021.734270
Received: 30 June 2021; Accepted: 05 November 2021;
Published: 01 December 2021.
Edited by:
Charles Alan Jacoby, St. Johns River Water Management District, United StatesReviewed by:
Hongbin Liu, Hong Kong University of Science and Technology, Hong Kong SAR, ChinaEdward Buskey, The University of Texas at Austin, United States
Copyright © 2021 Sweat, Alexander, Phlips and Johnson. This is an open-access article distributed under the terms of the Creative Commons Attribution License (CC BY). The use, distribution or reproduction in other forums is permitted, provided the original author(s) and the copyright owner(s) are credited and that the original publication in this journal is cited, in accordance with accepted academic practice. No use, distribution or reproduction is permitted which does not comply with these terms.
*Correspondence: L. Holly Sweat, c3dlYXRsQHNpLmVkdQ==
†Present address: L. Holly Sweat, Smithsonian Marine Station, National Museum of Natural History, Smithsonian Institution, Fort Pierce, FL, United States; Hunter Alexander, Data Collection Bureau, Southwest Florida Water Management District, Brooksville, FL, United States