 Héctor M. Guzmán
 Caitlin E. Beaver
 Edgardo Díaz-Ferguson
- 1Smithsonian Tropical Research Institute, Panama City, Panama
- 2U.S. Geological Survey, Wetland and Aquatic Research Center, Gainesville, FL, United States
- 3Coiba Scientific Station (COIBA AIP), City of Knowledge, Panama City, Panama
The whale shark (Rhincodon typus) is an endangered and highly migratory species, of which solitary individuals or aggregations are observed in oceans worldwide and for which conservation efforts are hindered by a lack of comprehensive data on genetic population connectivity. Tissue samples were collected from wandering whale sharks in Pacific Panama to determine genetic diversity, phylogeographic origin, and possible global and local connectivity patterns using a 700–800 bp fragment of the mitochondrial control region gene. Genetic diversity among samples was high, with five new haplotypes and nine polymorphic sites identified among the 15 sequences. Haplotype diversity (Hd = 0.83) and nucleotide diversity (π = 0.00516) were similar to those reported in other studies. Our sequences, in particular haplotypes PTY1 and PTY2, were similar to those previously reported in the Arabian Gulf and the Western Indian Ocean populations (a novel occurrence in the latter case). Haplotypes PTY3, PTY4, and PTY5 were similar to populations in Mexico and the Gulf of California. In contrast, the only populations to which our Panamanian sequences were genetically dissimilar were those from the Atlantic Ocean. The absence of reference sequences in GenBank from southern sites in the Eastern Tropical Pacific, such as Galapagos (Ecuador), Gorgona and Malpelo Islands (Colombia), and Coco Island (Costa Rica), reduced our capacity to genetically define regional patterns. Genetic differentiation and connectivity were also assessed using an analysis of molecular variance (AMOVA), which showed a similar population structure (five groups) to the neighbor-joining tree. Other population features based on neutrality tests, such as Tajima’s D and Fu’s Fs statistics, showed positive values for Panama of 0.79 and 1.61, respectively. Positive values of these statistics indicate a lack of evidence for population expansion among the sampled individuals. Our results agree with previous reports suggesting that whale sharks can travel over long distances and that transboundary conservation measures may be effective for species protection.
Introduction
Large marine vertebrates with complex migratory behaviors pose a research challenge for marine scientists, particularly if their populations are endangered. The whale shark (Rhincodon typus) is a cosmopolitan, pelagic shark species listed as endangered by the International Union for Conservation of Nature (IUCN), which indicates that the global population has declined by over 50% (Pierce and Norman, 2016). During the nearly four decades in which the IUCN Red List has been continuously reassessed, sustained population declines have changed the status of this species from vulnerable to endangered. Whale sharks are negatively impacted directly and indirectly (as bycatch) by fisheries working in whale shark aggregation areas, as well as by vessel collisions, inappropriate tourism, and new trade opportunities for whale shark byproducts such as fins, meat, and oil (Chen and Phipps, 2002; Li et al., 2012; Pierce and Norman, 2016; Ibarra-García et al., 2017). The conservation of whale sharks is challenging because of their slow growth and maturation rates, which make them vulnerable to overexploitation (Cortés, 2000; Vignaud et al., 2014). The whale shark’s complex life history, conservation status, basin-scale migratory patterns, ecology, and other important characteristics (i.e., gestation duration, sex ratio, and breeding season) have only been characterized in some regions (Cochran et al., 2016; Sequeira et al., 2016).
Although the reproductive ecology of whale sharks is vastly unknown, the cosmopolitan species is known to move long distances. However, it remains unclear whether the species migrates across or within the world’s oceans (Sequeira et al., 2013). Sequeira et al. (2013) provided the first inferred global connectivity map for whale sharks based on the available genetic and tracking data at the time, and they suggested that whale sharks can move among three major ocean basins. One inferred connection may have occurred between the Indian and Pacific Ocean basins. They estimated that whale sharks could travel >10,000 km/year for 2–4 years, assuming they moved at a constant speed, and excluding the longest track on record of movement of >13,000 km from the Gulf of California to the Western Pacific in 1,144 days (Eckert and Stewart, 2001). Additional information is also required to understand the factors that promote the aggregation of whale sharks along specific areas of the Pacific (Taylor, 1996) and Atlantic Oceans (de la Parra Venegas et al., 2011) and to evaluate nomadic individuals and compare them to those in other well-known aggregation areas within the Eastern Pacific, such as Mexico and the Galapagos (Ramírez-Macías et al., 2012, 2017; Acuña-Marrero et al., 2014). Whale sharks have a circumtropical distribution (Rowat and Brooks, 2012), but it is unknown whether the species is composed of a single panmictic population or several reproductively isolated subpopulations. However, the possibility that there are two functionally isolated subpopulations (in the Atlantic and Indo-Pacific regions) is intriguing (see Castro et al., 2007; Schmidt et al., 2009; Vignaud et al., 2014; Pierce and Norman, 2016), and, if the connectivity between these subpopulations and those in non-contiguous countries’ waters may be limited (Brooks et al., 2010; Hueter et al., 2013) remains to be explored.
Population genetic analysis is an approach that can be used to unravel the nature and extent of population connectivity by differentiating gene flow from seasonal movements among groups of marine animals. Genetic connectivity data are essential for understanding the migration, population structure, and sustainability of large marine animals (Dudgeon et al., 2012), due to the difficulty of direct observation of specimens over the long term. The genetic connectivity patterns of whale sharks are currently described as generational and at the macroscale (global) level (i.e., suggesting that large-scale migrations are only carried out by large females) (Acuña-Marrero et al., 2014). Nonetheless, more data are required to investigate the microscale (local connectivity patterns within oceanic regions) among whale sharks from Eastern and Western Pacific regions, in order to better understand the life history of this species (Castro et al., 2007; Schmidt et al., 2009; Guzman et al., 2018). Sequeira et al. (2013) pointed out the need for data to be collected outside of aggregation areas by sampling widely spaced migratory individuals to complement our knowledge of inter-aggregation connections. Identifying global patterns of shared haplotypes in whale sharks could provide insight into historic connectivity as a compelling argument for developing local and international strategies for the management and conservation of whale shark populations.
This study was conducted on transient migratory whale sharks in coastal waters along Pacific Panama, which is potentially a missing component of regional or global populations. Visiting individuals are rarely observed in large groups or in aggregations within predictable areas, and solitary animals are mainly observed in transit through Panamanian waters. The results of this study may also support the characterization of migratory patterns along the Eastern Tropical Pacific, as well as global patterns of migration for nomadic individuals (Castro et al., 2007; Guzman et al., 2018). The objective of this study was to describe the haplotype composition, genetic origin, and genetic diversity of nomadic whale sharks within the Eastern Pacific, and their migratory behavior along the Panamanian coast with an updated and unique comparison of haplotype composition at the global level.
Materials and Methods
Fieldwork and Sampling
There are areas in Pacific Panama where solitary whale sharks are seldom observed, particularly along the coasts of the northern islands in the Gulf of Chiriquí (Western Pacific Panama) from Cebaco Island to the Las Octavios islets, and at Wahoo Rock and Canal de Afuera Island, which are both inside Coiba National Park (Figure 1). From 2010 to 2012, 21 solitary sharks were sampled around the abovementioned islands by snorkeling and using a 3.0 m Manny PuigTM pole spear with a 3.0 cm × 0.5 cm stainless steel sterilized biopsy dart to obtain tissue samples. All samples were preserved immediately in vials containing 90% ethanol and were refrigerated until analysis. Samples from Cebaco Island and Las Octavios were collected in 2010, whereas those from Canal de Afuera Island and Wahoo Rock were collected in the consecutive years of 2011 and 2012. The procedures considered all applicable international, national, and/or institutional guidelines for the care and use of animals and were in accordance with the ethical standards of the institution or practice at which the studies were conducted. The Animal Care and Use Committee of the Smithsonian Tropical Research Institute approved the tagging and biopsy sampling procedures (No. 2006-17-10-16-06).
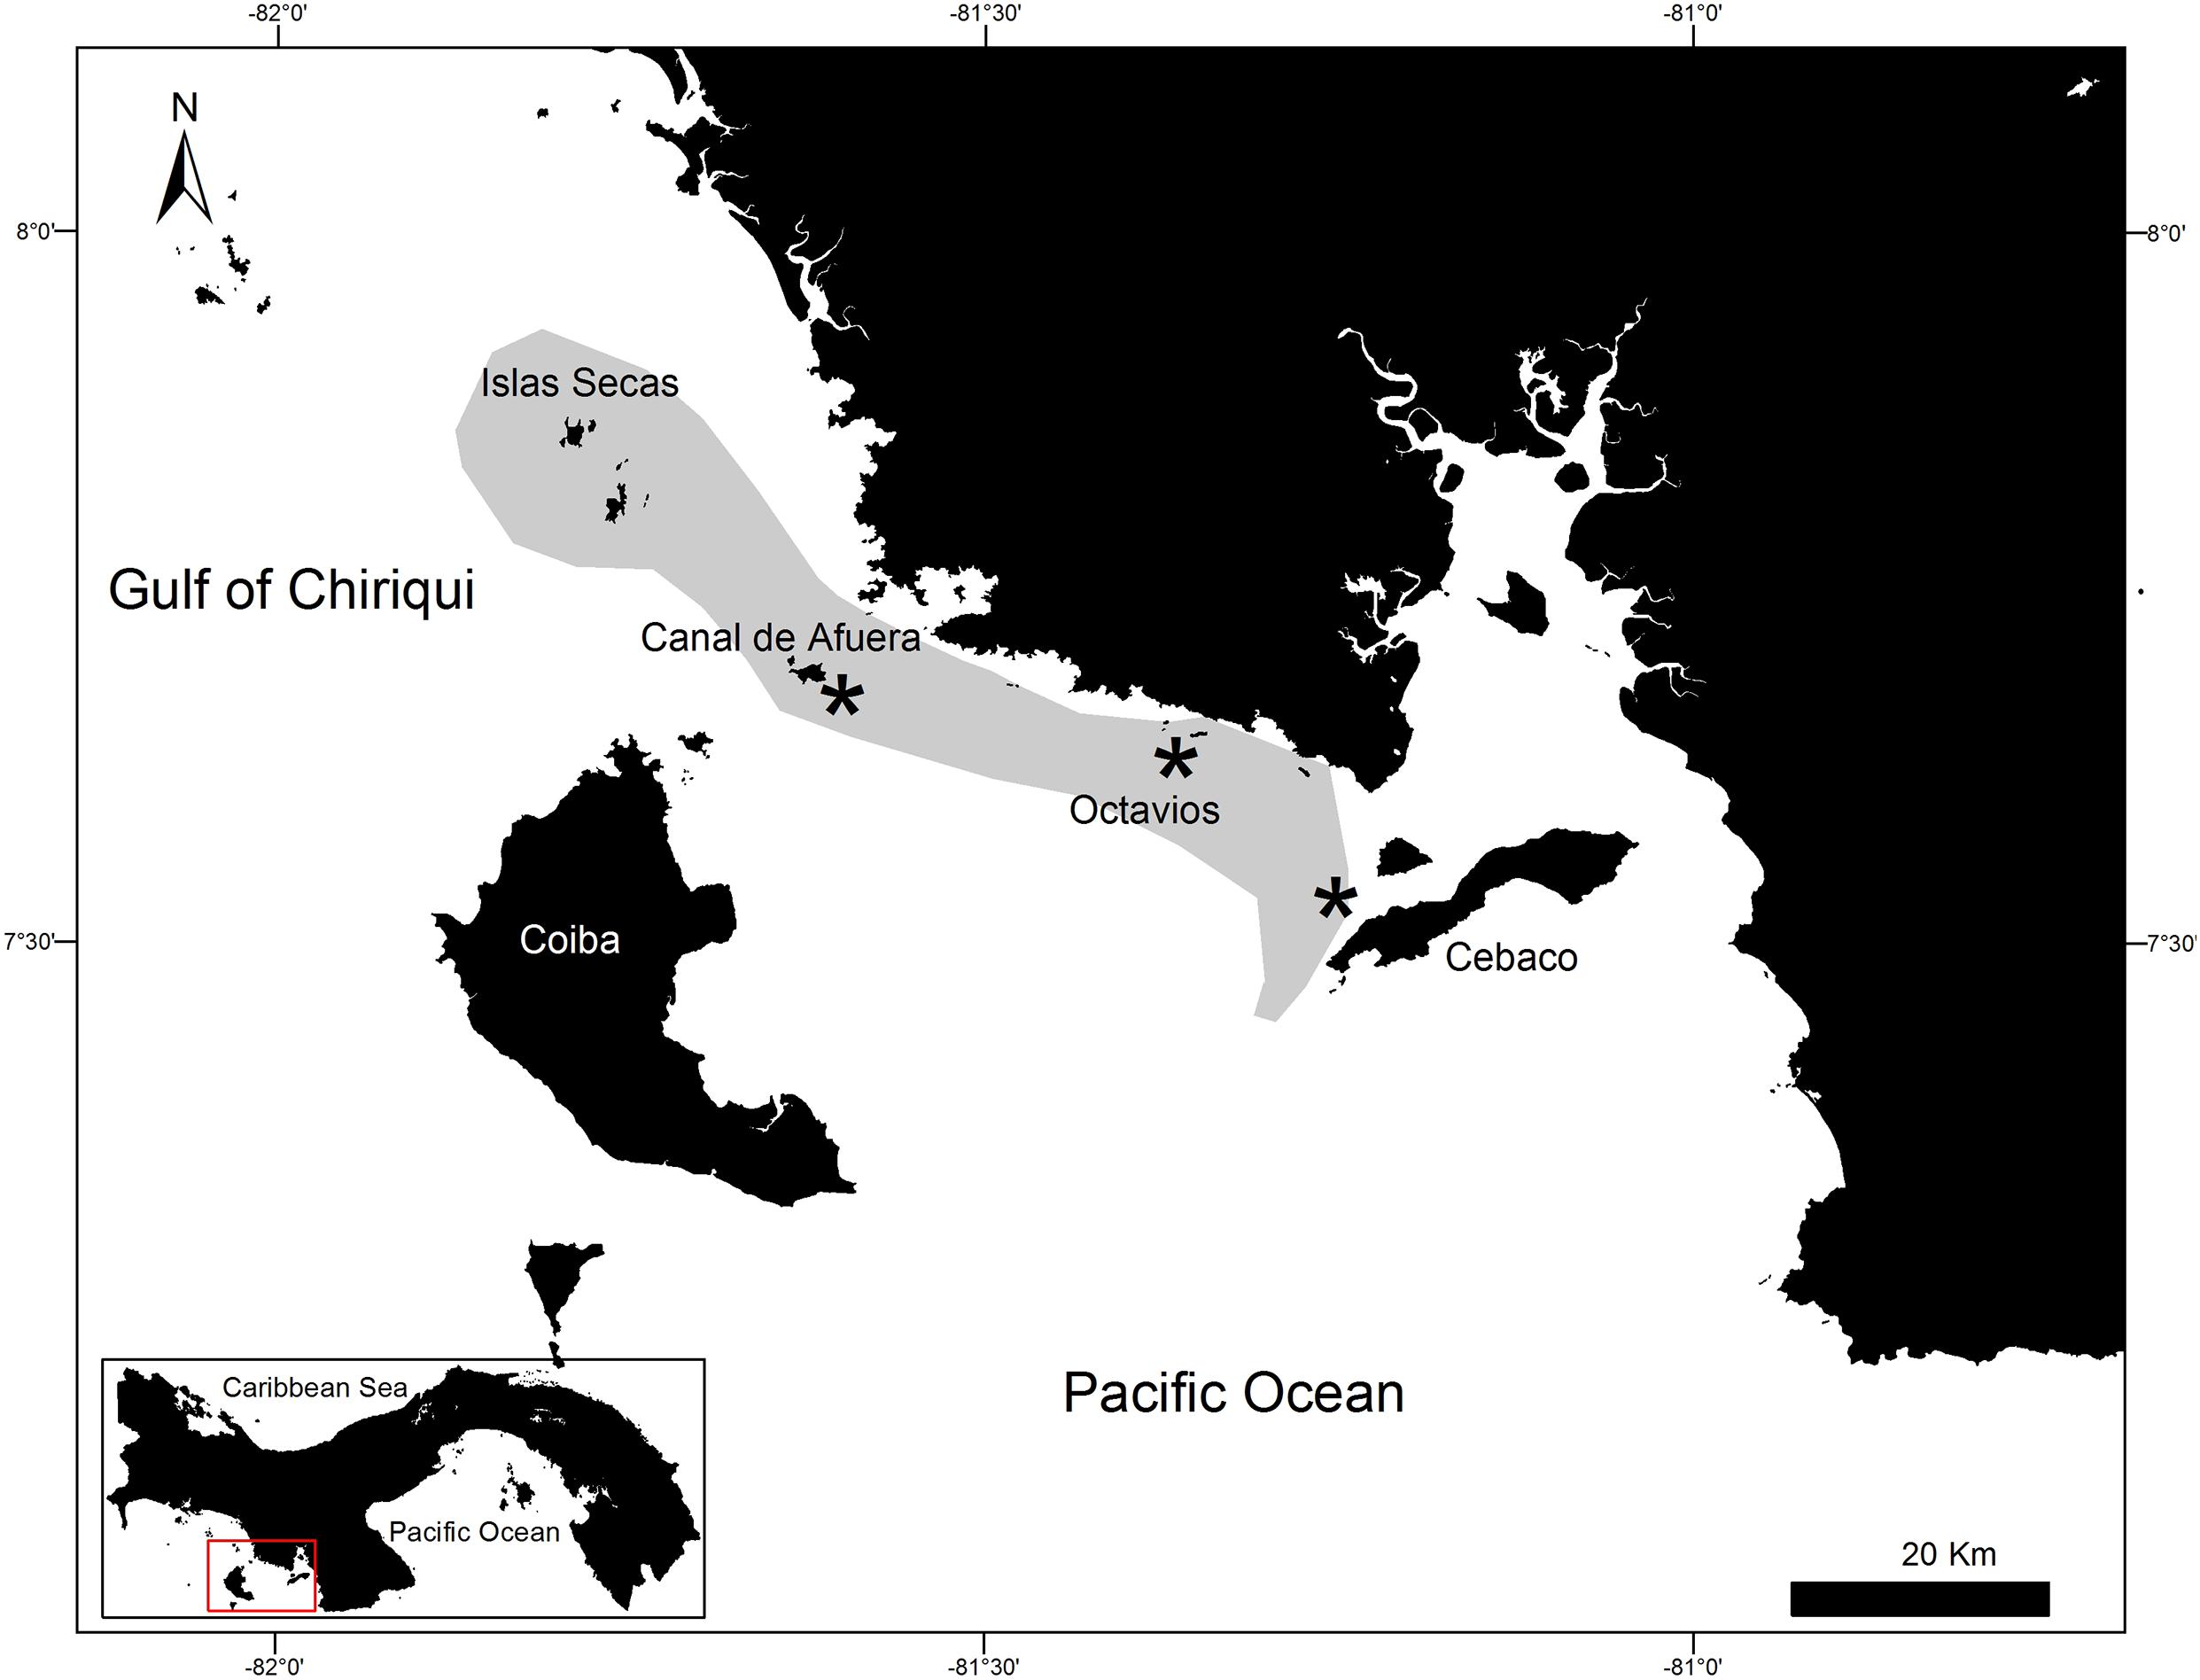
Figure 1. Map of the Gulf of Chiriqui, Pacific Panama, showing the sampled sites (*) at Cebaco Island, the Las Octavios islets, and Canal de Afuera Island (Coiba Island National Park), and the aggregation area (shaded) of Rhincodon typus between Cebaco Island and the Secas Archipelago.
DNA Extraction, PCR Amplification, and Sequencing
The tissue samples were lysed overnight, and then DNA was extracted following the blood and tissue DNeasy kit protocol (QIAGEN, Inc., Valencia, CA, United States). A 700–800 bp fragment of the mitochondrial control region was amplified using primers developed within tRNAPro (WSCR1-F: 5-TTG GCT CCC AAA GCC AAG ATT CTT C-3) and (WSCR2-R: 5-CTT AAT ATT TAT TGT TCC TGG TTT CAG CC-3) with conditions reported by Castro et al. (2007), PCR reactions with a final volume of 25 μL, which consisted of 2 μL of whale shark DNA, 12.5 μL of PCR 1× master mix (QIAGEN), 1 μL of each 0.5 μM primer, and 8.5 μL of PCR-grade water. All reactions were amplified at 95°C for 1 min, followed by 35 cycles of 95°C for 45 s, 58°C for 1 min, and 73°C for 90 s, followed by a final extension at 72°C for 7 min. Positive amplification of PCR products was confirmed using a 1.5% agarose gel and cleaned using a PCR Clean Up Kit (QIAGEN). Cleaned products were subjected to a BigDye 3.1 cycle sequence reaction and then cleaned using the BigDye XTerminator purification kit (Applied Biosystems, Foster City, CA, United States). All cleaned PCR products were sequenced using an electronic ABI 3130 sequencer. The quality of each sequence was verified using Sequencing Analysis 5.2 (ABI). Sequences were exported as FASTA files to Geneious 11.0 (Kearse et al., 2012), wherein they were aligned, trimmed, and edited to a final length of 688 bp.
Genetic Diversity and Local, Regional, and Global Patterns of Connectivity
A search for the origin of each sequence and taxonomic verification were both conducted using BLAST (Altschul et al., 1997). Validation through the Barcode of Life Data System was not possible because all the sequences obtained belonged to a control region segment. All sequences accession numbers were deposited in the GenBank database (OK094076-OK094090) (see Table 1). Genetic diversity was determined as the total number of polymorphic sites, nucleotide diversity (π), total number of haplotypes (H), and haplotype diversity (Hd). These were calculated using DNAsp Version 6.0 (Librado and Rozas, 2009). Local connectivity (microscale connectivity) patterns were assessed by comparing the values of Nei’s genetic distances (DA) among Pacific Panamanian sites (i.e., Coiba vs. Cebaco). These parameters were also calculated using DNAsp and a permutation test with 1,000 replicates, excluding sequence gaps.
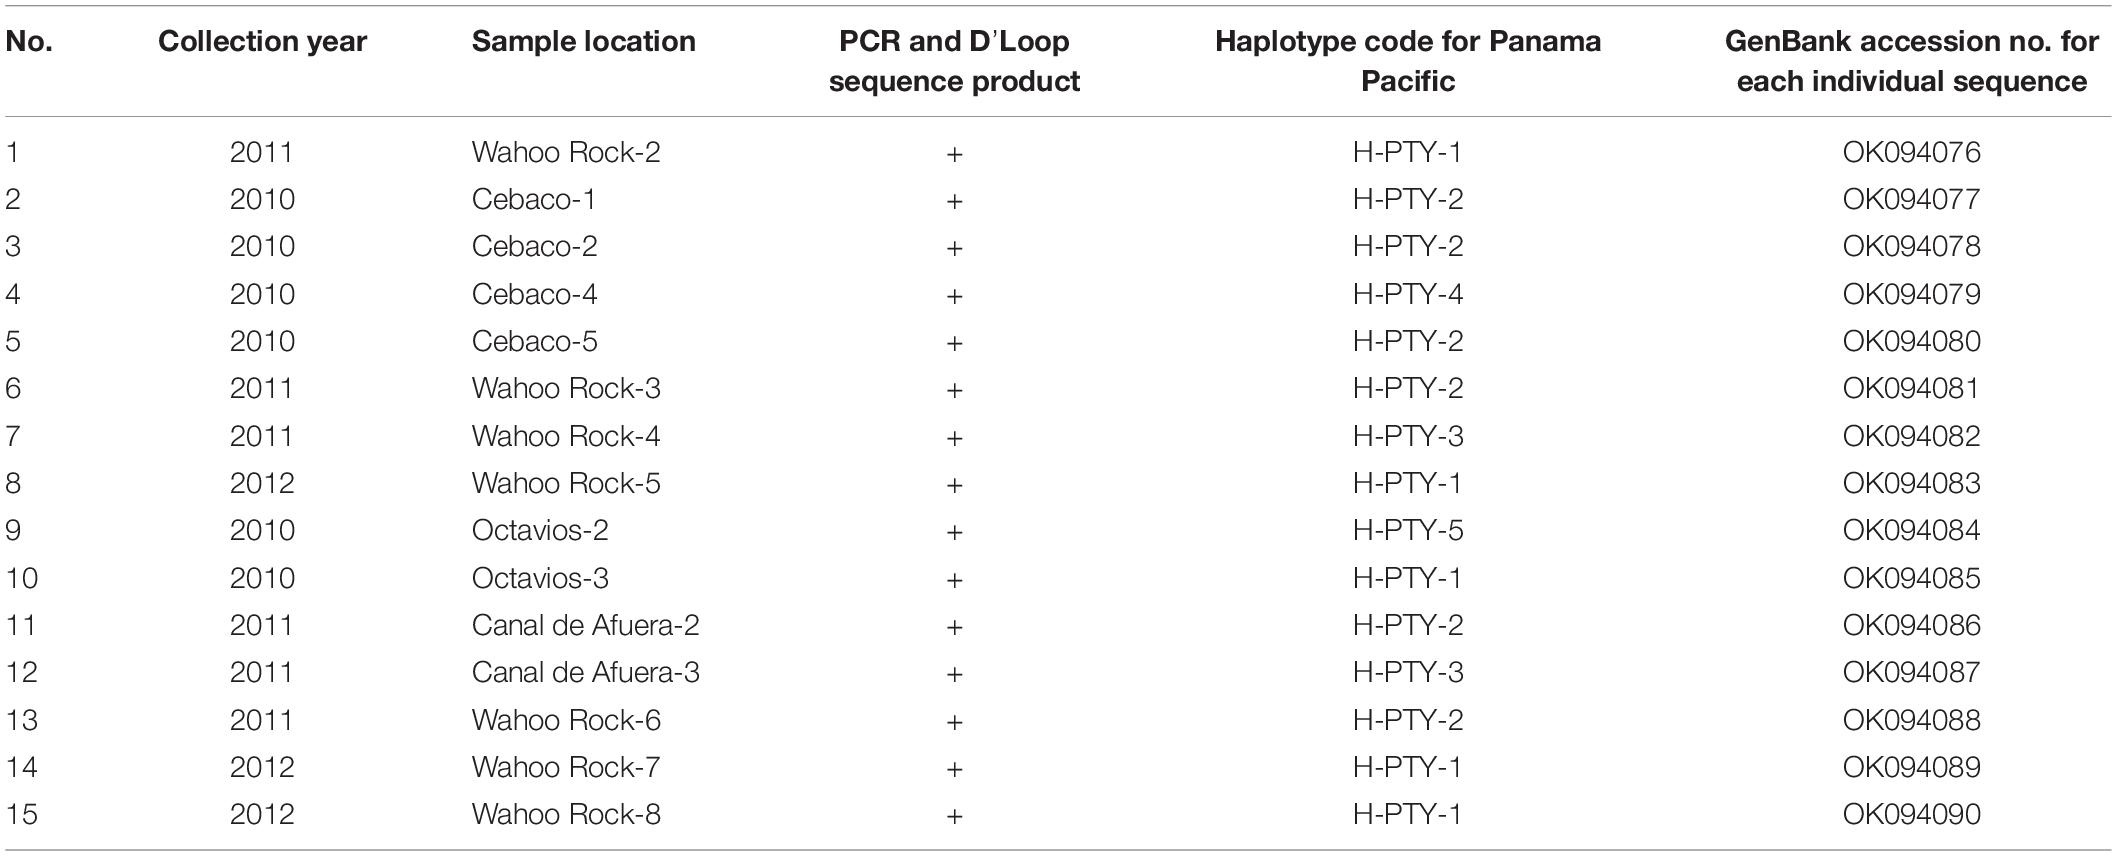
Table 1. Locations, haplotype codes, and accession numbers obtained from GenBank for 15 sequence products from Rhincodon typus individuals collected along the Pacific coast of Panama.
Further data analysis was conducted using DNAsp to evaluate global connectivity patterns (macroscale connectivity) using DA values for different oceanic regions of the world. The DA analysis was conducted by comparing our Pacific Panamanian sequences with 688 bp sequences from Castro et al. (2007) and Sigsgaard et al. (2016), collected from all available global oceanic regions (the Northwestern Atlantic, Northeastern Pacific, Northwestern Pacific, Western Indian Ocean, and Eastern Indian Ocean). Despite the existence of sequences from other world regions in GenBank, not all sequences could be used in this analysis because of inconsistencies in amplicon size and target region (Ramírez-Macías et al., 2007, 2012). Some sequences were not considered in the global connectivity analysis because DNAsp Version 6.0 requires that all sequences have the same size in such analyses. Thus, consensus sequences (700–800 bp) were used and we omitted sequences from other gene regions (i.e., Ramírez-Macías et al., 2007). However, to understand the possible genetic origin of the nomadic animals sampled from Panamanian waters, phylogenetic and molecular evolutionary analyses were conducted using MEGA version X (Kumar et al., 2018). The Tamura-Nei genetic distance substitution model was used, as it is the best fit model determined by Castro et al. (2007), and a neighbor-joining consensus tree was generated with a bootstrap of 7,500 replicates. A total of 701 sequences were included in the network, including those obtained in this study and other reference sequences from Castro et al. (2007), Ramírez-Macías et al. (2007), Vignaud et al. (2014), Sigsgaard et al. (2016), and Meekan et al. (2017). The consensus tree was visualized by exporting the Newick tree file with bootstrap support from MEGA-X into FigTree v.1.4.4 for further annotations and formatting (Rambaut et al., 2018; Figure 2).
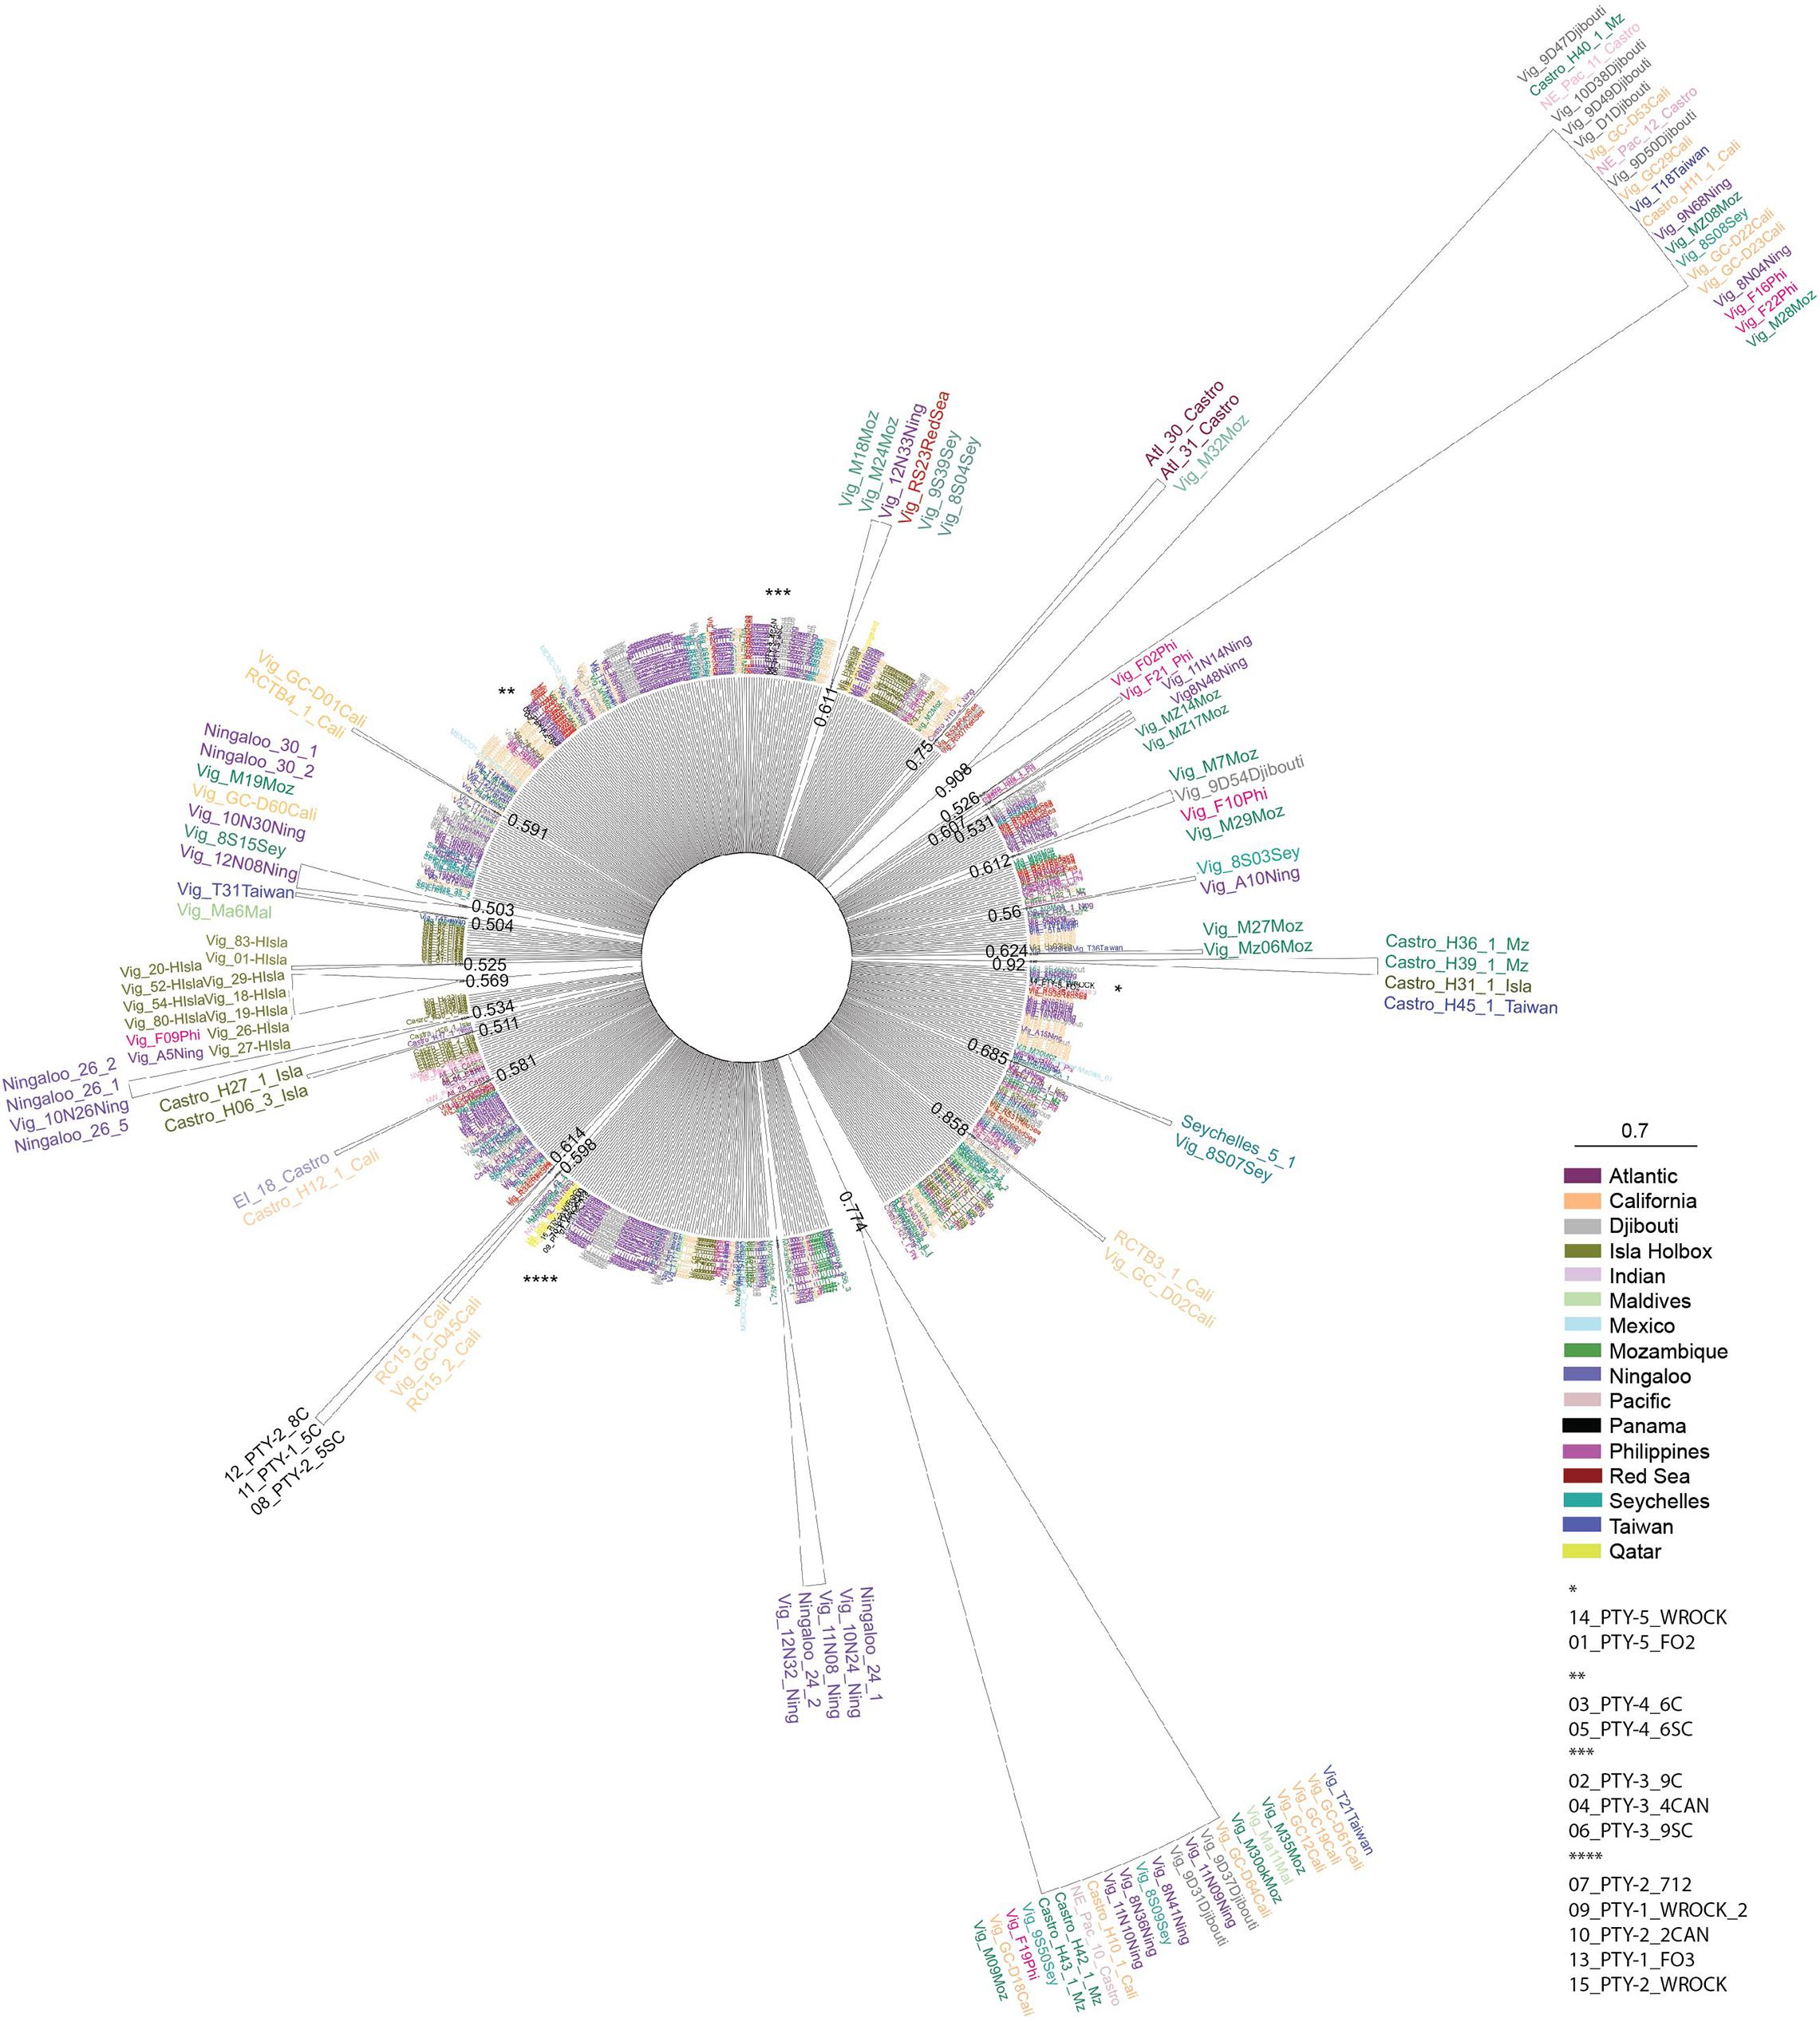
Figure 2. Radial neighbor-joining consensus tree based on the Tamura-Nei genetic distance model with bootstraps of 7,500 replicates. Reference sequences from other global regions Castro et al. (2007), Ramírez-Macías et al. (2007), Vignaud et al. (2014), Sigsgaard et al. (2016), and Meekan et al. (2017). The topology of the tree compares genetic distances between all Rhincodon typus sequences obtained from Pacific Panamanian samples, and taxa names are color coded based on the geographic origin of sampling and are detailed in the figure key. Bootstrap values are reported at the base of each cartooned clade for simplicity. Asterisks represent the location of Pacific Panamanian samples in the radial tree that did not form individual clades and the specific sequences are identified in the key.
Possible patterns of connectivity within populations, among regions, and within populations among regions were tested using an analysis of molecular variance (AMOVA) with Arlequin 3.5 (Excoffier and Lischer, 2010). Three a priori scenarios (group compositions) were compared in an attempt to understand and infer the possible patterns of regional and global connectivity of the whale sharks observed in Panama. Scenario (a): five groupings (Panama Pacific, Western and Eastern Indian Ocean, Northwest and Northeast Pacific Ocean, Mexico, and the Atlantic Ocean). Scenario (b): four groupings as stated in scenario A but combining Mexico and the Northwest and Northeast Pacific Ocean in the same grouping. Scenario (c): five groupings combining the Panama Pacific with Mexico, combining the Western and Eastern Indian Ocean together, and considering the Northwest Pacific, Northeast Pacific, and the Atlantic Ocean individually. Local connectivity was tested indirectly by calculating a measure of genetic differentiation among sites in Arlequin 3.5, with 1,000 permutations and 100,000 steps of Markov chain Monte Carlo after 10,000 burn-in steps (ΦST). Samples from different locations were grouped into oceanic regions as follows: West Indian-Djibouti, Maldives, Mozambique, Qatar, Red Sea, Seychelles, East Indian—Ningaloo, West Pacific—Philippines, Taiwan, East Pacific—California, Atlantic—Isla Holbox, Mexico, and the Gulf of Mexico (Castro et al., 2007; Ramírez-Macías et al., 2007; Vignaud et al., 2014; Sigsgaard et al., 2016; Meekan et al., 2017).
Additional historic population genetic features based on neutrality tests, such as Tajima’s D and Fu’s Fs statistics, were calculated using DNAsp (Tajima, 1989; Fu, 1997; Librado and Rozas, 2009). Statistically significant negative values of these parameters provide evidence of historical demographic events, such as demographic expansions in populations that have increased in size, which increases the frequency of rare alleles (Simonsen et al., 1995; Rooney et al., 2001; Avise, 2004; Schmidt et al., 2009). In contrast, statistically significant positive values of Tajima’s D and Fu’s Fs are found in populations that have been reduced in size and thus have reduced frequencies of rare alleles (Simonsen et al., 1995).
Results
Genetic Diversity
We obtained DNA and its corresponding PCR products and sequences from 15 of the 21 whale shark tissue samples collected from Panama. These are the first sequences deposited in GenBank for this species which have been collected in the waters of the Pacific Ocean along Central America. All analyzed samples from Panama showed 100% similarity to Rhincodon typus in the BLAST search analysis (Altschul et al., 1997).
Genetic diversity analyses of the 15 Pacific Panamanian sequences revealed the presence of five new haplotypes. The overall value of haplotype diversity (Hd) was 0.830 (range: 0.760–0.830), and the overall nucleotide diversity (π) was 0.00516 (range: 0.00440–0.00513). No significant differences in genetic composition were observed among the different sampled localities in Panama (i.e., when comparing the genetic composition of the Wahoo Rock samples with those from Cebaco, Canal de Afuera, and Las Octavios). The most common haplotypes were PTY1 and PTY2 (accession numbers to be provided upon acceptance for publication). Other new haplotypes reported for Panama in this study were PTY3, PTY4, and PTY5 (accession numbers also to be provided upon acceptance) (Table 1).
Local, Regional, and Global Patterns of Connectivity
The sequence similarity and DA values calculated among regions and sites provided an initial idea of the local, regional, and global connectivity patterns of whale sharks. The PTY1 and PTY2 haplotypes showed high similarity with specific truncated segments of 688 bp from the reference GenBank sequences with the accession numbers EU182444.1, KX944499.1, KX944495.1, and KX944489.1, corresponding to haplotype 44 reported by Castro et al. (2007) and to haplotypes 46, 34, and 96 reported by Sigsgaard et al. (2016). These GenBank sequences corresponded to those from samples collected in the Western Indian Ocean, specifically from the Arabian Gulf in Qatar (Figure 2). Haplotypes PTY3, PTY4, and PTY5 were similar instead to haplotypes from the Northeastern Pacific (Mexico and Gulf of California; Ramírez-Macías et al., 2007), Northwestern Pacific (Taiwan and the Philippines; Castro et al., 2007), and Eastern Indian Ocean (Western Australia) regions (Figure 2).
In addition to haplotype similarity, local connectivity was assessed using DA values calculated for the Panamanian sites. This analysis showed similarities (small DA values and similar haplotype compositions) among the Panamanian sites, as was expected based on the relatively short distances between them (Figure 1). DA similarities were observed regardless of the collection date (Tables 1, 2). To evaluate global connectivity patterns, the DA values of Panamanian sequences were compared to those from different regions of oceans across the world (lower diagonal in lower matrix of Table 2). Based on this analysis, the region most similar to Panama was the Western Indian Ocean (DA = 0.0008). When global data were compared with Panamanian sequences, similarities were found between Panamanian sequences and the Western Indian Ocean (Ningaloo, Mozambique, Gulf of Qatar) and the North Eastern Pacific sequences (Mexico and California), as observed in the neighbor-joining radial consensus tree (Figure 2; Castro et al., 2007; Ramírez-Macías et al., 2007; Vignaud et al., 2014; Sigsgaard et al., 2016; Meekan et al., 2017).
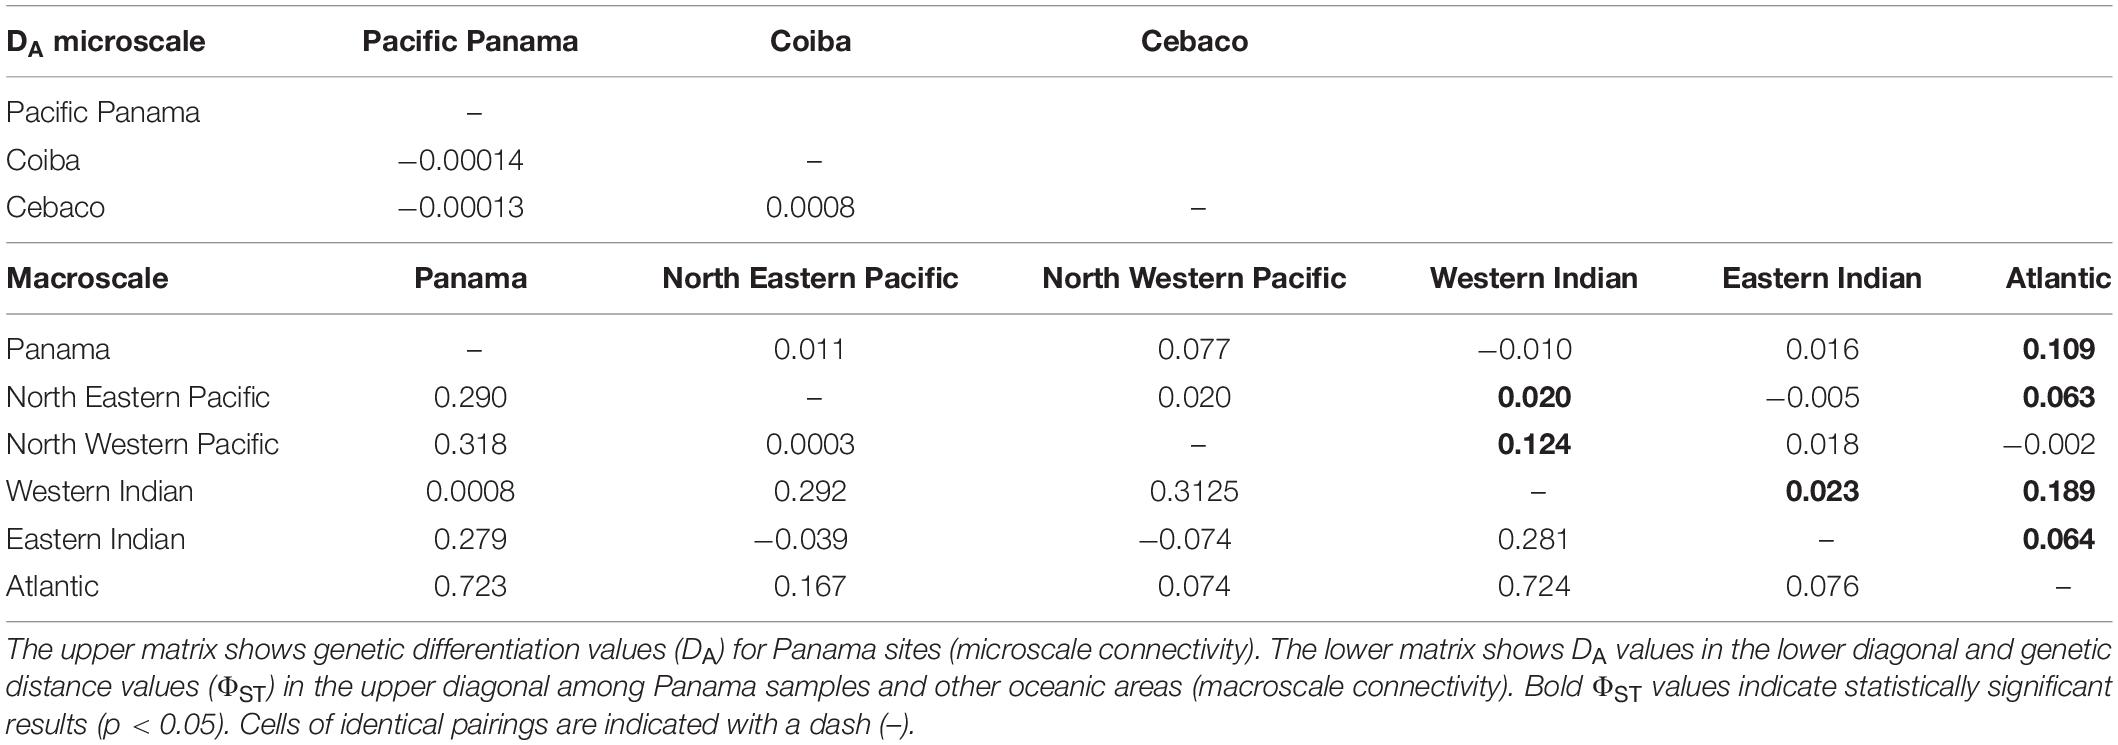
Table 2. Indirect assessment of genetic connectivity based on genetic distances (DA) between sites, both matrices using 1,000 replicates.
An AMOVA was also conducted to test the patterns of local, regional, and global connectivity. AMOVA results showed a lack of significant genetic differentiation among different regions (p > 0.1), indicating that a lack of genetic structure was the most likely scenario among the three proposed scenarios described in section “Materials and Methods” (see Table 3). However, genetic differentiation within regions and within populations was observed due to the existence of unique haplotypes in all populations, including the Panamanian samples (Table 3). In particular, scenario (a) (five groupings) showed identity and similarity among all populations (Table 3). Based on ΦST values, the Atlantic region was statistically different from every other region, including Panamanian sequences (p = 0.045), except for the North Western Pacific region (p = 0.33) (upper diagonal in lower matrix of Table 2). Additionally, the Western Indian region was significantly different from all other regions (p < 0.01), except for the Panamanian sequences (p = 0.43) (Table 2).
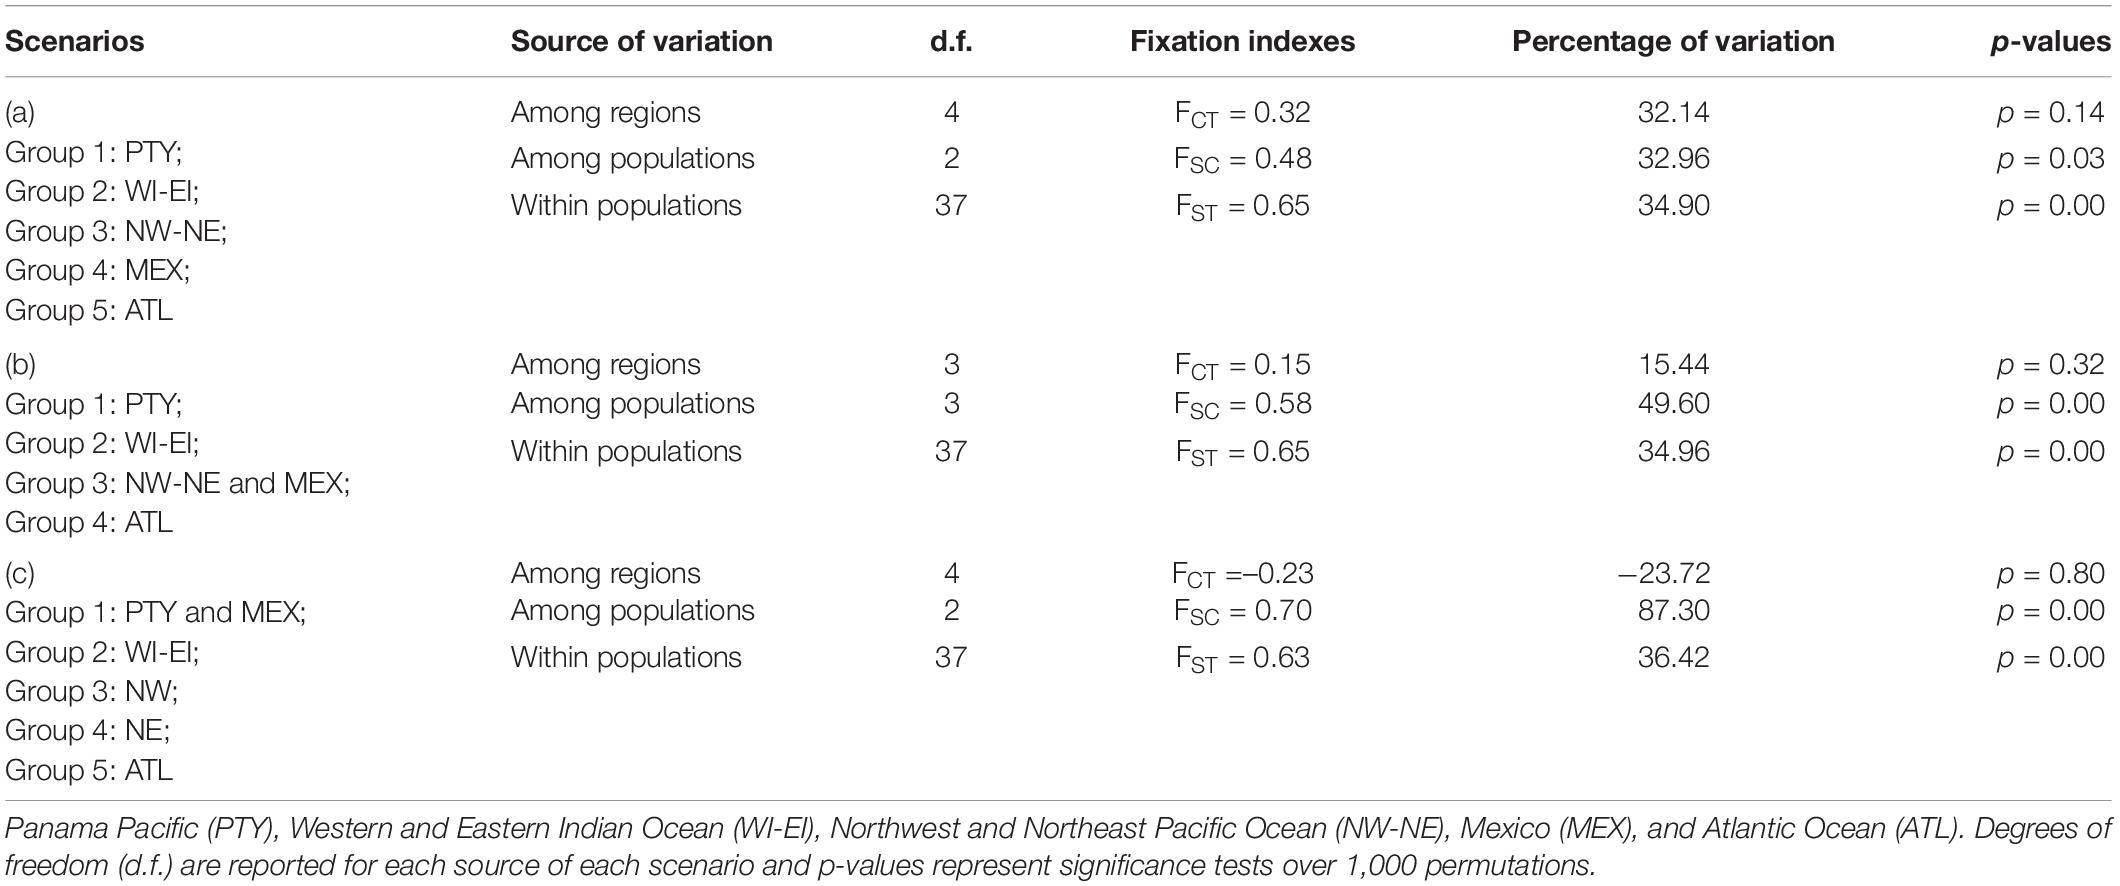
Table 3. Whale shark control region haplotype analysis of molecular variance (AMOVA) testing combinations of global regions in different scenarios.
Results of the neutrality tests, which were conducted to understand historical population changes in this species, showed positive values of 0.79 and 1.61 for Tajima’s D and Fu’s Fs statistics (p > 0.05), respectively. Positive values of these parameters indicate a lack of evidence to support a historical population expansion among the sampled individuals. These are the first historical demographic data which have been reported for individual whale sharks from the Eastern Tropical Pacific Marine Corridor, and are crucial data that can be used for the conservation of this species (sensu Domingues et al., 2017).
Discussion
This study was conducted on transient migratory whale sharks rarely observed in large aggregations in Panamanian coastal waters, aiming to characterize the migratory patterns by describing the haplotype composition, genetic origin, and genetic diversity of nomadic whale sharks within the Eastern Pacific, with an updated and unique comparison of haplotype composition at the global level.
We recognize that our sample size may not have been large enough to be representative of a regional population of whale sharks (as suggested by Vignaud et al., 2014), but these samples are nevertheless the first contributions of genetic data for nomadic individuals outside of aggregation areas. Transient individuals are difficult to sample and can potentially provide information on the missing fraction of genetic variability within the population. In addition, any contribution of genetic data is still a benefit to this field of research. Indeed, previous studies, including those conducted in the Eastern Pacific region, have used fewer than five samples per location (Castro et al., 2007; Schmidt et al., 2009) to infer worldwide genetic connectivity and differentiation. When the population dynamics of a large pelagic animal are analyzed, many factors must be considered, such as the highly migratory and transient behavior of the species, the potential for small pocket areas in the region to be visited and transited by relatively unpredictable total numbers of only a few individuals (<20), reduced residency time of individuals (Fox et al., 2013), and possible temporary isolation of some individuals from the rest of the population for several years (sensu Sequeira et al., 2012). Despite the fact that Coiba represents a very small area within the migratory routes of whale sharks, our samples encompassed a period of at least 3 years during which transiting animals traveled through the area with no clear indication of high site fidelity (sensu McCoy et al., 2018). These samples included an animal tagged with a satellite transmitter in Coiba that later traveled on a trans-Pacific route (Guzman et al., 2018), which is discussed in detail below.
Genetic Diversity
High levels of genetic diversity have been reported for whale sharks globally, with nucleotide diversity ranging from 0.004 to 0.007 among all oceanic regions (Castro et al., 2007). Examples of this high level of variation are the 44 haplotypes found among only 70 samples, and high haplotype and nucleotide diversity (Hd = 0.97, π = 0.007, respectively) reported by Castro et al. (2007). High levels of genetic diversity have also been observed at small geographic scales. For example, 14 haplotypes have been previously observed among 36 sampled animals (Hd = 0.90, π = 0.005) from the Gulf of California (Ramírez-Macías et al., 2007). Our results are similar to those previously obtained from other oceanic regions, with 5 haplotypes detected among 15 sequences (Hd = 0.83, π = 0.005). Other genetic studies have been conducted on whale shark populations, but these studies reported limited data: only the total number of haplotypes and no other genetic diversity data such as haplotype and nucleotide diversity was reported (i.e., Meekan et al., 2017).
The high diversity found in whale sharks is likely due to the slightly larger size and variation in the control region reported for this species, as compared to other chondrichthyan species (Castro et al., 2007; Alam et al., 2014). In addition, the increased connectivity promoted by a highly migratory lifestyle favors increased genetic diversity in cosmopolitan species due to the introduction of new alleles from faraway populations (Table 3). However, a possible sex ratio bias that favors males has been reported, with few exceptions, within aggregations of whale sharks (Norman et al., 2017). This challenges the observed high diversity of this species. In contrast, Zhang et al. (2003) reported that a sex ratio biased toward females could possibly generate a greater female effective population size (Nef) that would promote higher genetic diversity in the maternally inherited mtDNA region. This could be the case for the Eastern Pacific region, where an exceptional sex ratio of 99 females per 100 adults was reported in the Galapagos (Acuña-Marrero et al., 2014), and in the Gulf of California, a sex ratio of 84 females per 100 adults was reported (Ketchum et al., 2013). These are the populations geographically closest to our study area in Panama. The values of genetic diversity and the new haplotypes identified in our study provide an important baseline for future monitoring of these animals during their migrations along the Eastern Tropical Pacific Corridor and beyond.
Local, Regional, and Global Patterns of Connectivity
Panamanian samples showed lower differentiation among collection sites and years (Coiba, 2011–2012 vs. Cebaco and Las Octavios, 2010) based on their similar haplotype compositions and the calculated DA values among them (Table 2). However, the DA results and neighbor-joining consensus tree suggested that our sequences, in particular for haplotypes PTY1 and PTY2, were similar to previously reported sequences from the Western Indian Ocean (Castro et al., 2007) and the Arabian Gulf populations (Sigsgaard et al., 2016). Haplotypes PTY3, PTY4, and PTY5 were similar to haplotypes in populations from Mexico and the Gulf of California (Castro et al., 2007; Ramírez-Macías et al., 2007; Figure 2). The absence of reference sequences in GenBank from the southern sites in the Eastern Tropical Pacific Marine Corridor, such as the Galapagos (Ecuador), Gorgona and Malpelo Islands (Colombia), Coco Island (Costa Rica), and from the mainland of the same areas, reduces our capacity to genetically define regional or microscale patterns of migration within the Eastern Pacific. However, whale sharks satellite-tagged in Panama (Figure 1) provided 28 tracks with distinct and strong evidence of the regional connectivity of Panama with the aforementioned offshore islands, and of the existence of a mainland corridor along the coast of Central America to as far away as the Gulf of Tehuantepec and Clipperton Island (Guzman, unpublished data). Similarly, a 12 m adult female whale shark tagged in Galapagos traveled near the Coco and Malpelo islands in 95 days, an area that is apparently associated with the Panama wind jet and is a high productivity area (Hearn et al., 2016; Ryan et al., 2017). Elevated connectivity has also been reported for other shark species along the Eastern Tropical Pacific Marine Corridor (Nance et al., 2009, 2011).
The positive values of Tajima’s D and Fu’s Fs statistics in the neutrality tests conducted on the Panamanian sequences did not provide evidence of historical population expansion in these individuals. In contrast, positive values of these parameters indicate migration, reduced population size, or balancing selection (Schmidt and Pool, 2002). This is coherent with our results based on 15 sequences of transient individuals that showed positive but non-significant (p > 0.05) Tajima’s D values of 0.79 and 1.61 Fu’s Fs statistic.
At the macroscale level, previous studies using diallelic and mitochondrial markers suggested the absence of genetic structuring in whale sharks within the Pacific and Eastern Indian Ocean basins and indicated that land barriers are not an impediment to the long-range dispersal of whale sharks (Castro et al., 2007; Schmidt et al., 2009). We did observe differentiation between the Arabian Gulf and Indo-Pacific samples, which is noteworthy considering the large-scale dispersal of this species (Sigsgaard et al., 2016). The relatively low genetic differentiation found between the Western Indian Ocean and Panamanian sequences warrants larger sample sizes to be studied for transient individuals along the Panama coastline. However, differences in haplotype frequencies between the Atlantic and Indo-Pacific populations have been found using both mitochondrial (Castro et al., 2007) and diallelic markers (Schmidt et al., 2009). Additional findings provided by our study are that there is relatively low genetic similarity between the Panamanian haplotypes and the Eastern Indian and Atlantic Ocean haplotypes. These results support the connectivity patterns previously described by Castro et al. (2007), Vignaud et al. (2014), and Meekan et al. (2017), where the existence of two separate global populations of whale sharks is inferred.
Our genetic results demonstrated subpopulation current connectivity between the biogeographic regions of the Eastern Pacific and the Indo-Pacific, particularly with the Western Indo-Pacific Ocean (AMOVA scenario (a); that is, a potential westerly migratory pathway for subpopulations between 15°N and 30°N). This is similar to the inferred migration route suggested by Sequeira et al. (2013). This hypothesis is supported by additional evidence from the trans-Pacific track traveled by a tagged 7 m female, who traveled >20,000 km in 841 days from Coiba Island (Panama) via Clipperton Island to the Marianas Trench, apparently using the North Equatorial Current (Guzman et al., 2018) and following the potential pathway previously suggested for the Eastern Pacific subpopulation (Eckert and Stewart, 2001). Connectivity was also observed between nomadic samples collected in Panama and sequences from Mexico (Ramírez-Macías et al., 2012), suggesting connections between these animals and the Eastern Tropical Pacific aggregations. Despite the lack of direct evidence of gene flow exclusively associated with whale shark females, the genetic connectivity and therefore migration and gene flow from other Pacific regions was evidenced by sequence similarity and moderate-to-high values of genetic diversity. It is important to consider that genetic variation of mitochondrial genes is directly associated with increasing female effective population size (Nef). As previously mentioned, the satellite-tagged female that traveled across the Pacific from the eastern Pacific (Panama) to the western Pacific (Guzman et al., 2018), suggests gene flow and connectivity with the Indian Ocean throughout the South China Sea, providing evidence of females’ presence and potential reproduction.
Conclusion and Future Efforts
This study contributed both the first genetic data for nomadic whale sharks from outside of common aggregation areas and the first demographic information for whale sharks traveling near the Pacific Panama coastline. Evidence of nomadic individuals transiting to the Eastern Pacific and Indo-Pacific Ocean subpopulations was observed. Although nomadic individuals are currently found in Pacific Panama waters, in 2009, a group of 30 individual sharks was observed in the Gulf of Panama (east Pacific Panama) in the open sea far from coastal areas during the upwelling season. Many studies have recorded new foraging grounds for whale shark aggregations corresponding to spawning events of other species, indicating adaptability to highly productive areas (Taylor, 1996; Heyman et al., 2001, 2005; Hoffmayer et al., 2007; de la Parra Venegas et al., 2011). Transient whale sharks may increase in numbers in such highly productive areas in response to climate change (in particular, increases in warming water temperature, upwelling, and productivity) which provides an opportunity to improve our sample size. The samples used in this study can serve as a baseline for genetic diversity of nomadic individuals in this region, which can provide insight if potential whale shark migratory and/or movement patterns change or whale shark population sizes continue to decrease.
Our results suggest that the connectivity of this transboundary species could benefit from binding regional regulations for its protection. Whale sharks are protected in one way or another in most countries of the eastern Pacific region by local regulations, from Mexico to Peru, where fishing and commercialization are prohibited and ecotourism is highly encouraged. An effective form of species conservation could be the establishment of marine corridors in the region. The only corridor for the protection of the species was politically established in 2014 along with six Central American countries including Panama, Costa Rica, Nicaragua, Honduras, El Salvador, and Guatemala (OSPESCA, 2014). However, a similar proposal for a corridor southward from Panama to Chile was presented to the Permanent Commission for the South Pacific (CPPS) but was not considered by the member countries, to avoid binding regulations, deciding instead for protective local management regulations. In addition, areas of proven aggregation in the region (e.g., Galapagos, Mexico) have protection within existing marine protected areas, including several islands where sharks usually transit, such as Coco, Malpelo, Coiba, and others. In the north of Peru, seasonal aggregations are observed and protection is being sought as part of a protected area under consideration. Overall, it can be considered that there are important efforts and initiatives throughout the region, further conservation of the species in the high seas could be promoted with the creation of seaways or Migravias.
Future research efforts can help unravel the regional connectivity patterns of whale sharks in the Eastern Tropical Pacific using diallelic markers such as microsatellites or single-nucleotide polymorphisms (SNPs), satellite data, and information about the sex of the animals studied. To provide a better understanding of sex-biased migration and effective population size, samples from the northern and central regions of the Eastern Tropical Pacific Marine Corridor, such as Costa Rica, Colombia, and the Galapagos, should be included in such analyses. Research efforts could also focus on the development of molecular markers for both sex determination and understanding the reproductive ecology and possible site philopatry of whale sharks (Portnoy and Heist, 2012; Domingues et al., 2017). Genetic data may help provide insights into temporal population oscillations and aggregations related to climate change, illegal fishing, and boat collisions. These factors have been reported to affect whale sharks in other regions of the world, such as the Ningaloo Reef in Australia and other countries across the Indo-Pacific region, where reduced values of genetic diversity are indicative of overexploitation (sensu Sanzogni et al., 2015). In addition, new, non-invasive methodologies are important to consider for increasing sample sizes (via proxy measurements such as haplotype frequencies) and geographic range. For example, environmental DNA (eDNA) from water samples (Sigsgaard et al., 2016) and invertebrate-derived DNA (iDNA) from hematophagous parasites (sensu Meekan et al., 2017) could be collected.
Data Availability Statement
The data presented in the study are deposited in the Gene Bank repository, accession numbers OK094076 to OK094090.
Ethics Statement
The animal study was reviewed and approved by the Smithsonian Animal Care and Use Committee.
Author Contributions
HG conceived the study, carried out the fieldwork, and collected all the tissue samples. ED-F and CB conducted the genetic diversity, connectivity, and demographic genetic analyses. All authors prepared, edited, read, and approved the final manuscript.
Funding
This research was partially funded by the MarViva Foundation (Panama), the International Community Foundation-CANDEO, the Secretaria Nacional de Ciencia, Tecnología e Innovación de Panamá, Coiba Scientific Station (COIBA AIP), and the Research Opportunity Fund of the Smithsonian Tropical Research Institute.
Author Disclaimer
Any use of trade, firm, or product names is for descriptive purposes only and does not imply endorsement by the United States Government.
Conflict of Interest
The authors declare that the research was conducted in the absence of any commercial or financial relationships that could be construed as a potential conflict of interest.
Publisher’s Note
All claims expressed in this article are solely those of the authors and do not necessarily represent those of their affiliated organizations, or those of the publisher, the editors and the reviewers. Any product that may be evaluated in this article, or claim that may be made by its manufacturer, is not guaranteed or endorsed by the publisher.
Acknowledgments
We thank C. Guevara and K. Mantel for their field assistance. We also thank the Genetics and Molecular Biology Laboratory of the University of Panama for providing space and infrastructure for processing the samples. The government of Panama provided research permits. We also thank J. P. Torres-Florez for his valuable comments on the manuscript.
References
Acuña-Marrero, D., Jiménez, J., Smith, F., Doherty, P. F. Jr., Hearn, A., Green, J. R., et al. (2014). Whale shark (Rhincodon typus) seasonal presence, residence time and habitat use at Darwin Island, Galapagos Marine Reserve. PLoS One 9:e115946. doi: 10.1371/journal.pone.0115946
Alam, M. T., Petit, R. A., Read, T. D., and Dove, A. D. (2014). The complete mitochondrial genome sequence of the world’s largest fish, the whale shark (Rhincodon typus), and its comparison with those of related shark species. Gene 539, 44–49. doi: 10.1016/j.gene.2014.01.064
Altschul, S. F., Madden, T. L., Schäffer, A. A., Zhang, J., Zhang, Z., Miller, W., et al. (1997). Gapped BLAST and PSI-BLAST: a new generation of protein database search programs. Nucleic Acids Res. 25, 3389–3402. doi: 10.1093/nar/25.17.3389
Avise, J. (2004). Molecular Markers, Natural History, And Evolution, 2nd Edn. Massachusetts, MA: Sinauer Associates, Inc. Publishers, 684.
Brooks, K., Rowat, D., Pierce, S. J., Jouannet, D., and Vely, M. (2010). Seeing spots: photo-identification as a regional tool for whale shark identification. West. Indian Ocean J. Mar. Sci. 9, 185–194.
Castro, A. L., Stewart, B. S., Wilson, S. G., Hueter, R. E., Meekan, M. G., Motta, P. J., et al. (2007). Population genetic structure of the Earth’s largest fish, the whale shark (Rhincodon typus). Mol. Ecol. 16, 5183–5192. doi: 10.1111/j.1365-294X.2007.03597.x
Chen, V. Y., and Phipps, M. J. (2002). Management And Trade Of Whale Sharks In Taiwan. Taiwan: TRAFFIC East Asia-Taipei, 26.
Cochran, J. E. M., Hardenstine, R. S., Braun, C. D., Skomal, G. B., Thorrold, S. R., Xu, K., et al. (2016). Population structure of a whale shark Rhincodon typus aggregation in the Red Sea. J. Fish Biol. 89, 1570–1582. doi: 10.1111/jfb.13054
de la Parra Venegas, R., Hueter, R., González Cano, J., Tyminski, J., Gregorio Remolina, J., Maslanka, M., et al. (2011). An unprecedented aggregation of whale sharks, Rhincodon typus, in Mexican coastal waters of the Caribbean Sea. PLoS One 6:e18994. doi: 10.1371/journal.pone.0018994
Domingues, R. R., Hilsdorf, A. W., and Gadig, O. B. (2017). The importance of considering genetic diversity in shark and ray conservation policies. Conserv. Genet. 19, 501–525. doi: 10.1007/s10592-017-1038-3
Dudgeon, C. L., Blower, D. C., Broderick, D., Giles, J. L., Holmes, B. J., Kashiwagi, T., et al. (2012). A review of the applications of molecular genetics for fishery management and conservation of sharks and rays. J. Fish Biol. 80, 1789–1843. doi: 10.1111/j.1095-8649.2012.03265.x
Eckert, S. A., and Stewart, B. S. (2001). Telemetry and satellite tracking of whale sharks. Rhincodon typus, in the Sea of Cortez, Mexico, and the North Pacific Ocean. Environ. Biol. Fishes 60, 299–308. doi: 10.1023/A:1007674716437
Excoffier, L., and Lischer, H. E. (2010). Arlequin Suite ver 3.5, a New Series of Programs to perform population genetic analyses under Linux & Windows. Mol. Ecol. Resour. 10, 564–567. doi: 10.1111/j.1755-0998.2010.02847.x
Fox, S., Foisy, I., De La Parra Venegas, R., Galván Pastoriza, B. E., Graham, R. T., Hoffmayer, E. R., et al. (2013). Population structure and residency of whale sharks Rhincodon typus at Utila, Bay Islands, Honduras. J. Fish Biol. 83, 574–587. doi: 10.1111/jfb.12195
Fu, Y. X. (1997). Statistical tests of neutrality of mutations against population growth, hitchhiking and background selection. Genetics 147, 915–925. doi: 10.1093/genetics/147.2.915
Guzman, H. M., Gomez, C. G., Hearn, A., and Eckert, S. A. (2018). Longest recorded transpacific migration of a whale shark (Rhincodon typus). Mar. Biodivers. Rec. 11, 1–8.
Hearn, A. R., Green, J., Román, M. H., Acuña-Marrero, D., Espinoza, E., and Klimley, A. P. (2016). Adult female whale sharks make long-distance movements past Darwin Island (Galapagos. Ecuador) in the Eastern Tropical Pacific. Mar. Biol. 163:214. doi: 10.1007/s00227-016-2991-y
Heyman, W. D., Graham, R. T., Kjerfve, B., and Johannes, R. E. (2001). Whale sharks Rhincodon typus aggregate to feed on fish spawn in Belize. Mar. Ecol. Prog. Ser 215, 275–282. doi: 10.3354/meps215275
Heyman, W. D., Kjerfve, B., Graham, R. T., Rhodes, K. L., and Garbutt, L. (2005). Spawning aggregations of Lutjanus cyanopterus (Cuvier), on the Belize Barrier Reef over a six year period. J. Fish Biol. 67, 83–101. doi: 10.1111/j.0022
Hoffmayer, E. R., Franks, J. S., Driggers, W. B., Oswald, K. J., and Quattro, J. M. (2007). Observations of a feeding aggregation of whale sharks, Rhincodon typus, in the north central Gulf of Mexico. Gulf Carib. Res. 19, 69–73. doi: 10.18785/gcr.1902.08
Hueter, R. E., Tyminski, J. P., and de la Parra, R. (2013). Horizontal movements, migration patterns, and population structure of whale sharks in the Gulf of Mexico and northwestern Caribbean Sea. PLoS One 8:e71883. doi: 10.1371/journal.pone.0071883
Ibarra-García, E. C., Ortiz, M., Ríos-Jara, E., Cupul-Magaña, A. L., Hernández-Flores, Á, and Rodríguez-Zaragoza, F. A. (2017). The functional trophic role of whale shark (Rhincodon typus) in the northern Mexican Caribbean: network analysis and ecosystem development. Hydrobiologia 792, 121–135. doi: 10.1007/s10750-016-3049-3
Kearse, M., Moir, R., Wilson, A., Stones-Havas, S., Cheung, M., Sturrock, S., et al. (2012). Geneious Basic: an integrated and extendable desktop software platform for the organization and analysis of sequence data. Bioinformatics 28, 1647–1649. doi: 10.1093/bioinformatics/bts199
Ketchum, J. T., Galván-Magaña, F., and Klimley, A. P. (2013). Segregation and foraging ecology of whale sharks. Rhincodon typus, in the southwestern Gulf of California. Environ. Biol. Fish. 96, 779–795. doi: 10.1007/s10641-012-0071-9
Kumar, S., Stecher, G., Li, M., Knyaz, C., and Tamura, K. (2018). MEGA X: molecular evolutionary genetics analysis across computing platforms. Mol. Biol. Evol. 35, 1547–1549. doi: 10.1093/molbev/msy096
Li, W., Wang, Y., and Norman, B. (2012). A preliminary survey of whale shark Rhincodon typus catch and trade in China: an emerging crisis. J. Fish Biol. 80, 1608–1618. doi: 10.1111/j.1095-8649.2012.03250.x
Librado, P., and Rozas, J. (2009). DnaSP v5: a software for comprehensive analysis of DNA polymorphism data. Bioinformatics 25, 1451–1452. doi: 10.1093/bioinformatics/btp187
McCoy, E., Burce, R., David, D., Aca, E. Q., Hardy, J., Labaja, J., et al. (2018). Long-term photo-identification reveals the population dynamics and strong site fidelity of adult whale sharks to the coastal waters of Donsol, Philippines. Front. Mar. Sci. 5:271. doi: 10.3389/fmars.2018.00271
Meekan, M., Austin, C. M., Tan, M. H., Wei, N. V., Miller, A., Pierce, S. J., et al. (2017). iDNA at sea: recovery of whale shark (Rhincodon typus) mitochondrial DNA sequences from the whale shark copepod (Pandarus rhincodonicus) confirms global population structure. Front. Mar. Sci. 4:420. doi: 10.3389/fmars.2017.00420
Nance, H. A., Daly-Engel, T. S., and Marko, P. B. (2009). New microsatellite loci for the endangered scalloped hammerhead shark, Sphyrna lewini. Mol. Ecol. Resour. 9, 955–957. doi: 10.1111/j.1755-0998.2008.02510.x
Nance, H. A., Klimley, P., Galvan-Magaña, F., Martínez-Ortíz, J., and Marko, P. B. (2011). Demographic processes underlying subtle patterns of population structure in the scalloped hammerhead shark, Sphyrna lewini. PLoS One 6:e21459. doi: 10.1371/journal.pone.0021459
Norman, B. M., Holmberg, J. A., Arzoumanian, Z., Reynolds, S. D., Wilson, R. P., Rob, D., et al. (2017). Undersea constellations: the global biology of an endangered marine megavertebrate further informed through citizen science. Bioscience 67, 1029–1043. doi: 10.1093/biosci/bix127
OSPESCA (2014). Reglamento Regional OSP-07-2014, Para Fortalecer La Sostenibilidad Poblacional Del Tiburón Ballena (Rhincodon Typus) En Los Países Miembros Del Sica, El Salvador 8 p. http://www.fao.org/faolex/results/details/es/c/LEX-FAOC180626/ (accessed October 10, 2021).
Pierce, S. J., and Norman, B. (2016). Rhincodon typus. IUCN Red List Threat Species 2016:e.T19488A2365291.
Portnoy, D. S., and Heist, E. J. (2012). Molecular markers: progress and prospects for understanding reproductive ecology in elasmobranchs. J. Fish Biol. 80, 1120–1140. doi: 10.1111/j.1095-8649.2011.03206.x
Rambaut, A., Drummond, A. J., Xie, D., Baele, G., and Suchard, M. A. (2018). Posterior summarization in Bayesian phylogenetics using Tracer 1.7. Syst. Biol. 67, 901–904. doi: 10.1093/sysbio/syy032
Ramírez-Macías, D., Queiroz, N., Pierce, S. J., Humphries, N. E., Sims, D. W., and Brunnschweiler, J. M. (2017). Oceanic adults, coastal juveniles: tracking the habitat use of whale sharks off the Pacific coast of Mexico. PeerJ 5:e3271. doi: 10.7717/peerj.3271
Ramírez-Macías, D., Vázquez-Haikin, A., and Vázquez-Juárez, R. (2012). Whale shark Rhincodon typus populations along the west coast of the Gulf of California and implications for management. Endang. Species Res. 18, 115–128. doi: 10.3354/esr00437
Ramírez-Macías, D., Vazquez-Juarez, R., Galvan-Magana, F., and Latismere-Barragan, H. (2007). Variations of the mitochondrial control region sequence in whale sharks from the Gulf of California, Mexico. Fish. Res. 84, 87–95.
Rooney, A. P., Honeycutt, R. L., and Derr, J. N. (2001). Historical population change of bowhead whales inferred from DNA sequence polymorphism data. Evolution 55, 1678–1685. doi: 10.1111/j.0014-3820.2001.tb00687.x
Rowat, D., and Brooks, K. S. (2012). A review of the biology, fisheries and conservation of the whale shark Rhincodon typus. J. Fish Biol. 80, 1019–1056. doi: 10.1111/j.1095-8649.2012.03252.x
Ryan, J. P., Green, J. R., Espinoza, E., and Hearn, A. R. (2017). Association of whale sharks (Rhincodon typus) with thermo-biological frontal systems of the eastern tropical Pacific. PLoS One 12:e0182599. doi: 10.1371/journal.pone.0182599
Sanzogni, R. L., Meekan, M. G., and Meeuwig, J. J. (2015). Multi-Year impacts of ecotourism on whale shark (Rhincodon typus) visitation at Ningaloo reef Western Australia. PLoS One 10:e0127345. doi: 10.1371/journal.pone.0127345
Schmidt, D., and Pool, J. (2002). The effect of population history in the distribution of Tajimas D statistic. J. Endocrinol. 33, 211–222.
Schmidt, J. V., Schmidt, C. L., Ozer, F., Ernst, R. E., Feldheim, K. A., Ashley, M. V., et al. (2009). Low genetic differentiation across three major oceans populations of the whale shark Rhincodon typus. PLoS One 4:e4988. doi: 10.1371/journal.pone.0004988
Sequeira, A. M., Mellin, C., Meekan, M. G., Sims, D. W., and Bradshaw, C. J. (2013). Inferred global connectivity of whale shark Rhincodon typus populations. J. Fish Biol. 82, 367–389. doi: 10.1111/jfb.12017
Sequeira, A., Mellin, C., Rowat, D., Meekan, M. G., and Bradshaw, C. J. (2012). Ocean-scale prediction of whale shark distribution. Divers. Distrib. 18, 504–518. doi: 10.1111/j.1472-4642.2011.00853.x
Sequeira, A. M., Thums, M., Brooks, K., and Meekan, M. G. (2016). Error and bias in size estimates of whale sharks: implications for understanding demography. R. Soc. Open Sci. 3:150668. doi: 10.1098/rsos.150668
Sigsgaard, E. E., Nielsen, I. B., Bach, S., Lorenzen, E. D., Robinson, D. P., Knudsen, S. W., et al. (2016). Population characteristics of a large whale shark aggregation inferred from seawater environmental DNA. Nat. Ecol. Evol. 1, 1–4.
Simonsen, K. L., Churchill, G. A., and Aquadro, C. F. (1995). Properties of statistical tests of neutrality for DNA polymorphism data. Genetics 141, 413–429. doi: 10.1093/genetics/141.1.413
Tajima, F. (1989). Statistical-method for testing the neutral mutation hypothesis by DNA polymorphism. Genetics 123, 585–595. doi: 10.1093/genetics/123.3.585
Taylor, J. G. (1996). Seasonal occurrence, distributions and movements of the whale shark, Rhincodon typus, at Ningaloo reef, Western Australia. Mar. Freshw. Res. 47, 637–642.
Vignaud, T. M., Maynard, J. A., Leblois, R., Meekan, M. G., Vázquez-Juárez, R., Ramírez-Macías, D., et al. (2014). Genetic structure of populations of whale sharks among ocean basins and evidence for their historic rise and recent decline. Mol. Ecol 23, 2590–2601. doi: 10.1111/mec.12754
Keywords: whale shark, Rhincodon typus, Eastern Tropical Pacific, population genetics, global connectivity, Panama, conservation
Citation: Guzmán HM, Beaver CE and Díaz-Ferguson E (2021) Novel Insights Into the Genetic Population Connectivity of Transient Whale Sharks (Rhincodon typus) in Pacific Panama Provide Crucial Data for Conservation Efforts. Front. Mar. Sci. 8:744109. doi: 10.3389/fmars.2021.744109
Received: 19 July 2021; Accepted: 29 September 2021;
Published: 22 October 2021.
Edited by:
Rob Harcourt, Macquarie University, AustraliaReviewed by:
Susana Caballero, University of Los Andes, ColombiaNatascha Wosnick, Federal University of Paraná, Brazil
Copyright © 2021 Guzmán, Beaver and Díaz-Ferguson. This is an open-access article distributed under the terms of the Creative Commons Attribution License (CC BY). The use, distribution or reproduction in other forums is permitted, provided the original author(s) and the copyright owner(s) are credited and that the original publication in this journal is cited, in accordance with accepted academic practice. No use, distribution or reproduction is permitted which does not comply with these terms.
*Correspondence: Héctor M. Guzmán, Z3V6bWFuaEBzaS5lZHU=