 Veran Weerathunga1
 Wei-Jen Huang1Sam Dupont2Hsueh-Han Hsieh1Nathangi Piyawardhana1
 Fei-Ling Yuan1
 Jhe-Syuan Liao1
 Chia-Yu Lai1
 Wei-Ming Chen1Chin-Chang Hung1*
- 1Department of Oceanography, National Sun Yat-sen University, Kaohsiung, Taiwan
- 2Kristineberg Marine Research Station, Department of Biological and Environmental Sciences, University of Gothenburg, Fiskebäckskil, Sweden
The atmospheric partial pressure of CO2 (pCO2) has been increasing dramatically since the beginning of the industrial revolution and about 30% of the CO2 produced by anthropogenic activities was absorbed by the ocean. This led to a perturbation of the seawater carbonate chemistry resulting in a decrease of the average surface ocean pH by 0.1 and termed ocean acidification (OA). Projections suggest that pCO2 may reach 900 μatm by the end of the twenty-first century lowering the average pH of the surface ocean by 0.4 units. The negative impacts of OA on many species of marine invertebrates such as mollusks, echinoderms, and crustaceans are well documented. However, less attention has been paid to the impacts of low pH on fitness and immune system in crustaceans. Here, we exposed Pacific white shrimps to 3 different pHs (nominal pH 8.0, 7.9, and 7.6) over a 100-days experiment. We found that, even though there were no significant effects on fitness parameters (survival, growth and allometries between length and weight), some immune markers were modified under low pH. A significant decrease in total hemocyte count and phenoloxidase activity was observed in shrimps exposed to pH 7.6 as compared to pH 8.0; and phagocytosis rate significantly decreased with decreasing pH. A significant increase in superoxide production was also observed at pH 7.6 as compared to pH 8.0. All these results suggest that a 100-days exposure to pH 7.6 did not have a direct effect on fitness but lead to a modulation of the immune response.
Introduction
The atmospheric CO2 partial pressure (pCO2) has been increasing dramatically since the beginning of the industrial revolution (Feely et al., 2004) and about 30% of the CO2 produced by anthropogenic activities was absorbed by the ocean (Sabine et al., 2004). This led to a drop of the average pH of the surface ocean by 0.1 units (Orr et al., 2005). It is projected that atmospheric CO2 partial pressure may reach 900 μatm by the end of the twenty-first century lowering the average pH of the surface ocean pH by 0.4 units from its pre-industrial value (Caldiera and Wickett, 2003; Feely et al., 2008; IPCC, 2014). This gradual lowering of pH in the ocean and associated changes in carbonate chemistry of seawater are termed ocean acidification (OA). As a consequence of the declining pH in seawater, relative abundance of dissolved inorganic carbon (DIC) species shift, resulting in increased aqueous CO2 and HCO3– ion concentration and decreased in CO32– ion concentration and calcium carbonate saturation state (Orr et al., 2005).
A large body of evidence is documenting the biological impact of OA, ranging from negative to positive (Wittmann and Pörtner, 2013). Early works revealed inter- and even intra-species responses while other parameters such as life-history stages, exposure duration, tested level pH and other drivers were modulating the response. More recently, local adaptation to present natural variability in pH or pCO2 has been identified as a key predictor of species sensitivity to ocean acidification (Vargas et al., 2017). This also highlighted the importance to consider environmental variability while designing and interpreting experimental work. While the main focus of the early work was on calcification, immune defense and energy budget appeared to play a key role in species response to OA. Immune suppression under OA was observed in many invertebrate species including Norway lobsters (Hernroth et al., 2012), common starfish (Hernroth et al., 2011), blue mussels (Ellis et al., 2015; Sun et al., 2017), blood clams (Liu et al., 2016) and Pacific oysters (Cao et al., 2018). However, recent studies showed enhanced immune response in east pacific red octopus (Culler-Juarez and Onthank, 2021) and in Chinese mitten crabs (Luo et al., 2021) exposed to OA. Migliaccio et al. (2019) found phenotypic plasticity in the immune system of purple sea urchins living nearby CO2 vents (pH 7.8 ± 0.2) as compared to the same species living in high pH coastal environments (pH 8.02). In addition, enhanced energetic costs or alterations in energy allocation to different metabolic functions with a consequence for the energy budget of marine invertebrates was observed (Bibby et al., 2008; Stumpp et al., 2011; Mackenzie et al., 2014; Liu et al., 2016; Meseck et al., 2016; Cao et al., 2018).
In many invertebrates, hemocytes are the main cells that act as the defender of the organisms against pathogens and other foreign bodies (Rowley, 2016). There are three distinct hemocyte types in crustaceans: hyaline, granular, and semi granular cells (Söderhäll and Smith, 1983; Ratcliffe et al., 1985). Hyaline cells involve in immune defense act as phagocytic cells (Söderhäll and Smith, 1983), and produce reactive oxygen species (ROS) such as superoxide ions (Bell and Smith, 1993; Song and Hsieh, 1994; Muñoz et al., 2000), a type of microbicidal radical which can directly destruct the engulfed or encapsulated pathogen by the cell (Holmblad and Söderhäll, 1999). As these superoxide ions are toxic to living cells of the organism itself, an antioxidant system which is known as superoxide dismutase (SOD) scavenges the excess radicals to form hydrogen peroxide and oxygen (Holmblad and Söderhäll, 1999). On the other hand, granular and semi granular cells also play a role in the immune response by encapsulation, nodule formation, degranulation, and conversion of prophenoloxidase into melanin which shields off the infected region of the organism (Rowley, 2016).
We exposed pacific white shrimps to different nominal pHs (8.0, 7.9, and 7.6) relevant in the context of present and future pH variability over a 100-days experiment. To understand the impact on fitness, we measured survival and growth. Four basic hemolymph immune markers, playing a significant role in the survival and health of the organism were measured: total hemocyte count (THC), superoxide ion production (SOP), phenoloxidase activity (PO activity), and phagocytosis (PGT).
Materials and Methods
Organisms and Experimental System
Juvenile Pacific white shrimps, litopenaeus vannamei were obtained from a local shrimp farm in Taiwan and 200 of them having similar weights and lengths were kept for 2 weeks in a 1,000 L tank (inside the experiment premises) before starting the experiment. During that phase, shrimps were fed with commercially available shrimp’s diet (major component: 38% of crude proteins) up to 4% of the total body weight per day. Salinity, temperature, and pH of the tank were 31.02 ± 0.21, 25.93 ± 1.56 °C, 8.07 ± 0.04, respectively. After measuring the initial weights (Shimadzu UniBloc, readability: 0.01g), nine random groups of 15 shrimps were moved into 9 glass 100-L tanks. There was no significant difference [ANOVA: F(2, 8) = 0.741, p-value = 0.655] in initial weights of shrimps among 9 tanks. The initial average weight and length of shrimps were 9.3 ± 2.4 g and 10.1 ± 1.0 cm, respectively. Natural seawater pumped from the coast of the Sizihwan (passed through filters) was continuously flowed at a rate of 750 ml/min in each tank, separately and the system was maintained over 100-days (from 27th February 2020 to 05th of June, 2020). Shrimps were fed ad libitum with the previously mentioned diet four times per day. Three nominal pH values were selected (8.0, 7.9, and 7.6) covering present and near-future natural variability in the coastal zone. Seawater pH was decreased in a stepwise manner by 0.05 units per day until it reached the target pH to limit the stress of sudden increased acidity. Tank pH was maintained by diffusing pure CO2 using a pH controller (Leilih P-LE-08, resolution 0.01 pH units, Taiwan) separately for each tank. pH probes of controllers were calibrated at weekly intervals using NIST buffer solutions (PanReac AppliChem, ITW Reagents, Germany).
In a preliminary experiment, a seawater flow rate of 750 ml per min was identified as optimal to maintain experimental conditions in the 100 L tanks (stable pH, pCO2, dissolved oxygen, nitrite and ammonia). As the source water for each tank always had a pH value above 8.00, the pH of seawater in nominal pH 7.9 and 7.6 tanks were always in favor to increase. When the pH was above the target pH, the pH controller ensured diffusion of CO2 into the tank until the desired pH was reached. Each tank was equipped with a separate water filter to maintain the water quality. Water was drawn from the bottom, passed through the filter, and released to the surface. This bottom-up mixing ensured the homogeneity of pH inside the tank. Further, we cleaned each tank two times per day to avoid the accumulation of organic matter. Filtration, high enough flow rate, and frequent cleaning were also important to maintain high dissolved oxygen concentrations in our experimental system. Therefore, even without any external oxygenation to tanks, the dissolved oxygen concentration was closer to 5 mg/L (Table 1). Experiment was conducted in-door and covering tank walls in black to ensure stable pH controlling.
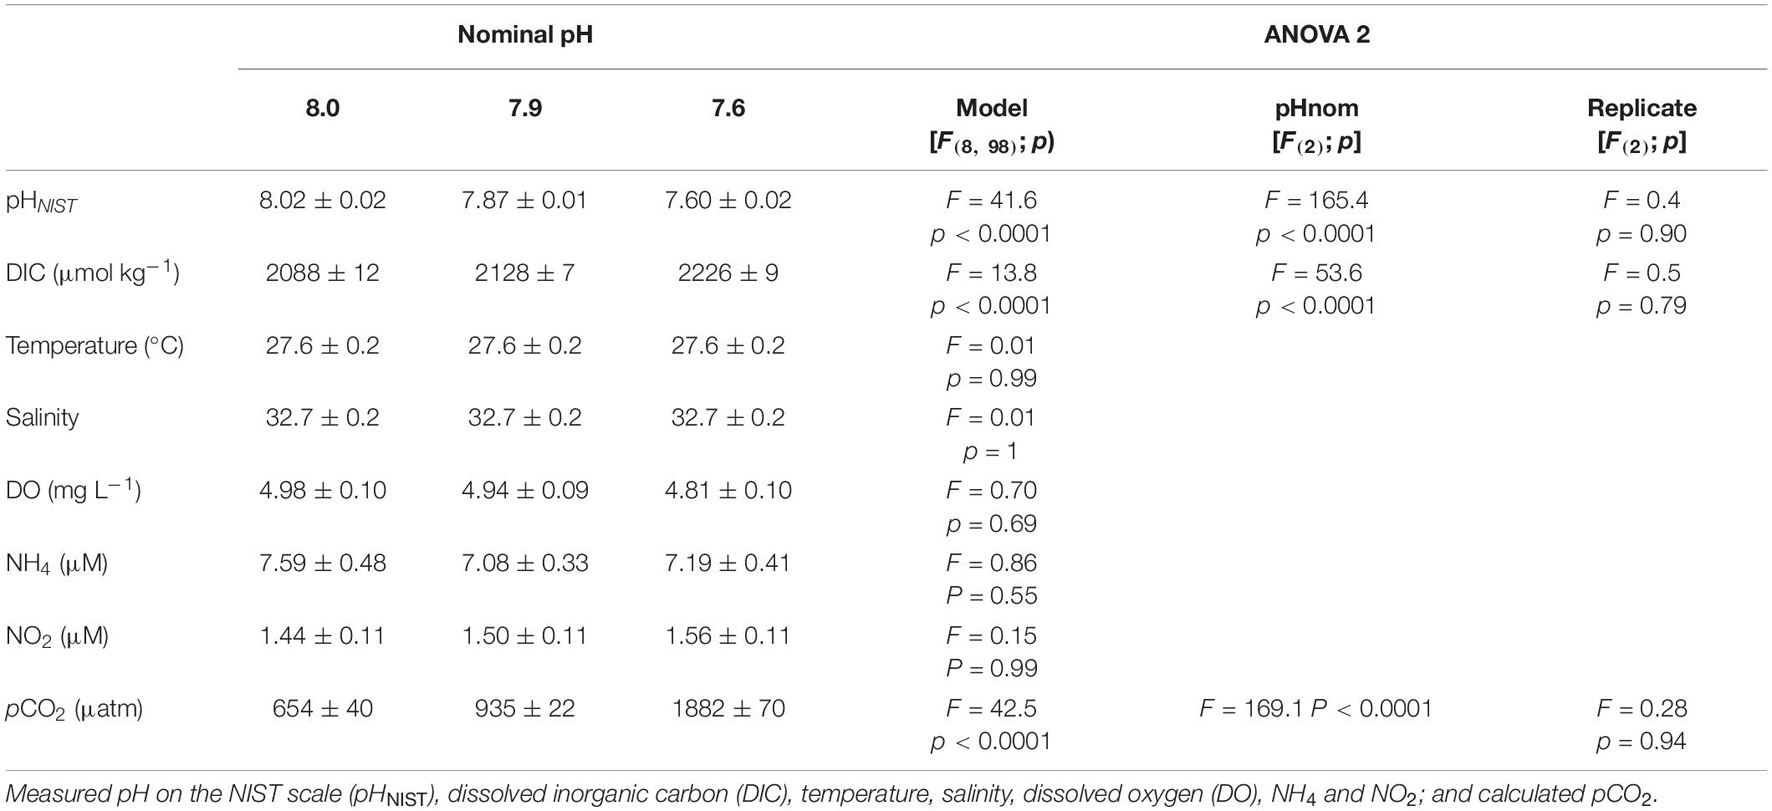
Table 1. Physico-chemical parameters for each nominal pH treatment and results from respective analyses of variance testing the impact of pH treatment and difference between replicates.
Seawater Physico-Chemical Measurements
Weekly water samples were taken from each tank into 100 ml borosilicate bottles to determine the dissolved inorganic carbon (DIC) and pH. Samples were quickly poisoned with 60 μl of saturated HgCl2 and kept in dark pending measurements to prevent any biological activities. Sample storage and carbonate chemistry parameters analysis were carried under room temperature of 24–26°C at National Sun-Yat sen University, Taiwan. DIC was analyzed using Apollo SciTech’s AS-C3 DIC analyzer (Newark, DE, United States, precession ± 2 μmol/kg) connected LI-COR 7000 CO2/H2O analyzer (the United States, accuracy within 1% nominally) and the quality check was carried out during the measurements using certified reference materials (batch #185 and #186) from Dr. A. Dickson’s laboratory at the Scripps Institution of Oceanography. Thermo Scientific Orion Star A211 benchtop pH meter was used to measure the pH of the sample and the pH sensor was calibrated by using three different buffer solutions, pH 4.01, pH 7.01, and pH 9.00 (HANNA, NIST traceable buffer solutions, the accuracy of ± 0.01 pH units at 25°C). Temperature (WTW Cond 3110 SET 1, Germany, accuracy ± 0.1°C), salinity (WTW Cond 3110 SET 1, Germany), and dissolved oxygen concentration (WTW Oxi 3310 Set 1, Germany, accuracy ± 0.5% of reading) of each tank were recorded concurrently with seawater sampling. CO2 partial pressure (pCO2) of water samples was calculated using CO2Sys_v2.1 (Pierrot et al., 2006) with dissociation constants (K1 and K2) from Mehrbach et al. (1973) refitted by Dickson and Millero (1987), the dissociation constant for hydrogen sulfate ion HSO4– from Dickson (1990) and [B]I value from Lee et al. (2010).
Determinations of dissolved inorganic nitrite (NO2–) and ammonia (NH4+) were done with the colorimetric methods as described by Pai et al. (2001) and Grasshoff et al. (2009) on samples taken simultaneously using acid cleaned polyethylene bottles of 100 ml capacity.
Biological Measurements
Shrimp Growth Parameters
Survival (in %) was calculated for each replicate as the percentage of shrimps surviving the duration of the experiment. Wet weights (in g) and lengths (in cm) of each shrimp were measured every 2 weeks (including beginning and end) throughout the experiment. The wet weight of each shrimp was measured inside a water beaker (the same water from the tank to which the shrimp belongs) using a Shimadzu UniBloc balance. Lengths were measured outside the water using a ruler. Growth rate (in cm day–1 and g day–1) was calculated for each replicate as the coefficient of the significant linear relationship between length or weight and time (in days; see Supplementary Tables 1, 2). Length and weight were correlated following significant exponential relationships (see Supplementary Table 3).
Shrimp Immune System Parameters
Immune system parameters: total hemocyte count (THC), phenoloxidase (PO) activity, superoxide (O2–) production (SOP), and phagocytosis (PGT) were measured at the end of the experiment after withdrawing 0.3 ml volume of hemolymph from the ventral sinus (near the 1st abdominal segment) of each shrimp. Hemolymph samples were immediately transferred into falcon tubes filled with 2.7 ml of pre-cooled (∼10°C) anticoagulant solution (0.01 M Tris-HCl, 0.25 M sucrose, 0.1 M sodium citrate; pH 7.6) as in Song and Hsieh (1994).
To determine THC, 10 μl of a diluted blood sample was transferred into a hemocytometer (Neubauer, Germany), and the number of hemocytes in 5 large squares (1 × 1 mm2) were counted using a Nikon microscope (Eclipse 80i) equipped with Olympus microscope digital camera (UC90). Cells located at lower and right-hand borders were not included in the count. As each cell has a capacity of 0.1 μl, cell density (THC) can be calculated by using the equation (1), where χ cells = average cells per square,
Samples were then diluted with the anticoagulant solution to ensure all blood samples having an equal cell density of 106 cells/ml.
PO activity was measured based on spectrophotometric methods described in Hernández-López et al. (1996) and Liu and Chen (2004) with a slight modification to the centrifugation force following Yeh and Chen (2009). Three replicates were tested for each shrimp to ensure the data quality. For each replicate, two samples were prepared: one for measuring PO activity and one for measuring the background PO activity. A 50 μl aliquot of diluted hemolymph sample was transferred into a sterilized Eppendorf tube and centrifuged at 800 × g at 4°C for 20 min (Eppendorf centrifuge 5810R, Germany). The supernatant was carefully discarded using a micropipette, and pellets were again centrifuged (800 × g at 4°C for 20 min) after adding 500 μl of cacodylate-citrate buffer (0.01 M sodium cacodylate, 0.45 M sodium chloride, 0.10 M trisodium citrate, pH 7.0). After removing the supernatant, pellets were re-suspended in 100 μl cacodylate buffer solution (0.01 M sodium cacodylate, 0.45 M sodium chloride, 0.01 M calcium chloride, 0.26 M magnesium chloride, pH 7.0). Subsequently, all samples were moved into a 96-well plate (Thermo Scientific, Denmark). For PO activity measurements, wells were treated with 50 μl of trypsin (1 mg of trypsin in 1 ml of cacodylate buffer). For PO background activity measurements, wells were treated with 50 μl of cacodylate buffer. After keeping 10 min at 25°C, 50 μl of L-DOPA (3 mg of L-dihydroxyphenylalanine in 1 ml of cacodylate buffer) was added to each well and kept for 15 min at 25°C. Finally, optical density (OD) of produced dopachrome from L-DOPA was recorded at a wavelength of 492 nm using an ELISA reader (M965, Metertech, Taiwan, accuracy ± 0.005 Abs). PO activity (in absorbance units) in shrimp hemolymph was calculated as follows,
SOP was measured in diluted hemolymph samples according to the method from Song and Hsieh (1994) with some adjustments from Liu and Chen (2004). Three replicates were done for hemolymph from each shrimp. For each replicate, two samples were prepared: one for measuring induced SOP while the other for measuring the background SOP. Initially, 100 μl aliquot of the diluted hemolymph sample was transferred into a sterilized Eppendorf tube and was centrifuged at 700 × g at 4°C for 20 min. The supernatant was discarded and 100 μl of 0.1% zymosan was added to samples measuring induced SOP while background samples were treated with 100 μl of MCHBSS solution (modified complete Hanks’s Balanced Salt solution having 10 mM CaCl2, 3 mM MgCl2, and 5 mM MgSO4). After incubating samples at room temperature for 30 min, the supernatant was removed, and pellets were washed three times with 100 % methanol. All samples were stained with 100 μl of 0.3 % NBT (nitroblue tetrazolium) solution and kept for 30 min at room temperature. Excess NBT solution was removed, and remnants were fixed with 100 % methanol. Subsequently, samples were rinsed three times with 100 μl of 70 % methanol solution and air-dried for 30 min. One hundred and twenty microliter of 2 M KOH and 140 μl DMSO (dimethyl sulphoxide) solutions were added to samples to dissolve formazan. After mixing (Thermolyne Maxi Mix II Vortex Mixer), solutions were transferred into a 96-well plate (Thermo Scientific, Denmark), and optical density was recorded at a wavelength of 630 nm using an ELISA reader (M965, Metertech, Taiwan, accuracy ± 0.005 Abs). Superoxide (O2–) production (in absorbance units) was expressed as a ratio of OD between the induced sample and background sample as follows,
Phagocytosis (PGT) activity was measured based on methods from Barracco et al. (1999); Ordás et al. (2000), and Chen et al. (2005) with some modifications. After slides were rinsed with 75% ethanol, 200 μl of diluted hemolymph samples were spread well on slides and kept for 1 h at room temperature. Likewise, triplicates were prepared from the hemolymph sample of each shrimp. Thereafter, slides were washed with MCHBSS buffer, and 200 μl of latex beads (0.8 μm, 3 × 10⁷ beads/ml) was added to each slide and incubated for 1 h at room temperature. Slides were then washed with MCHBSS buffer and fixed with 100% alcohol. After 5 min, slides were washed twice with sterilized deionized water, stained with 5 % Giemsa solution (kept 20 min), and washed with the sterilized deionized water again. After drying for 24 h, the total number of hemocytes and the number of hemocytes containing beads were counted using a Nikon microscope (Eclipse 80i) equipped with Olympus microscope digital camera (UC90). Phagocytosis (in %) was evaluated using the following equation,
Statistical Analyses
Statistical analyses were performed using the SAS software. Physico-chemical parameters (pH, DIC, temperature, salinity, DO, NH4+, NO2–, and pCO2) and immune markers (THC, SOP, PO, and Phagocytic activity) were analyzed with a two-way analysis of variance (ANOVA) to test for significant differences between pH treatments and replicates. Linear and exponential regressions were used to calculate growth rate and the relationship between weight and size, respectively. One-way ANOVAs were then used to test the effect of pH on survival, growth rates, and allometries between weight and size. Scheffe’s post-hoc tests were used when relevant to discriminate between treatments. Data were normally distributed according to the Kolmogorov-Smirnov test. Equality of variance was tested using the Levene median test. All data are expressed as average and standard error of mean and the significance level α was set at 0.05.
Results
Seawater Physico-Chemical Measurements
Measured and calculated physico-chemical parameters are summarized in Table 1. Target pHs were reached and significant differences (ANOVA 2; p < 0.0001; Table 1) between nominal pH were observed for pHNIST, DIC, and pCO2 with no significant difference (p > 0.05; Table 1) between replicates. Temporal variations have been observed in both temperature and salinity from the last phase of winter (end of February 2020) to the middle of the summer (beginning of June 2020). Temperature and salinity ranged from 24.8 to 30.3°C and from 30.3 to 33.9, respectively, over the study period. However, there were no significant differences (ANOVA 2; p > 0.05; Table 1) between pH treatments and replicates for temperature, salinity as well as other parameters of water quality (DO, NH4+ and NO2–).
Biological Measurements
Fitness Parameters
By the end of the experiment, 35.5 ± 2.7% of the shrimps survived with no significant difference between pH treatments [ANOVA: F(2, 8) = 0.06, p = 0.94; Figure 1]. Further, there was no considerable difference in shrimp survival with time between 3 nominal pH groups (Supplementary Figure 1). Pacific white shrimp’s survival rates in our experiment were lower than those in larger cement tank culturing systems (Araneda et al., 2008). This may be due to transparent glass material, surrounding noise, confined space, and limited indoor light conditions. Growth rate (cm day–1 and g day–1) was calculated for each replicate as the coefficient of the significant linear relationship of length (cm) or weight (g) with time (day; Supplementary Tables 1, 2). Shrimp grew at a rate of 0.055 ± 0.002 cm day–1 throughout the experiment with no significant difference between pH treatments [ANOVA: F(2, 8) = 0.37, p = 0.71; Figure 2]. Weight of the shrimps in pH 8.0, pH 7.9, and pH 7.6 treatments were increased at rates of 0.134 ± 0.030, 0.138 ± 0.030, and 0.143 ± 0.022 g day–1, respectively, and there was no significant difference among 3 nominal pH treatments [ANOVA: F(2, 8) = 0.075, p = 0.928]. Weight (g) and length (cm) were correlated following significant exponential relationships (Figure 3 and Supplementary Table 3) with an overall relationship as followed:
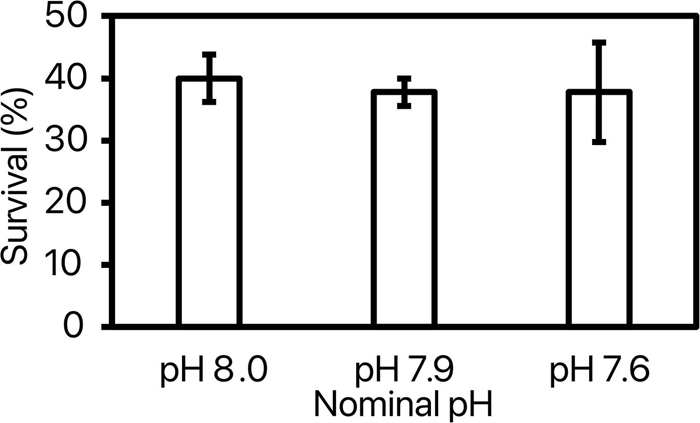
Figure 1. Percentage of shrimp surviving until the end of the experiment in each nominal pHNIST.
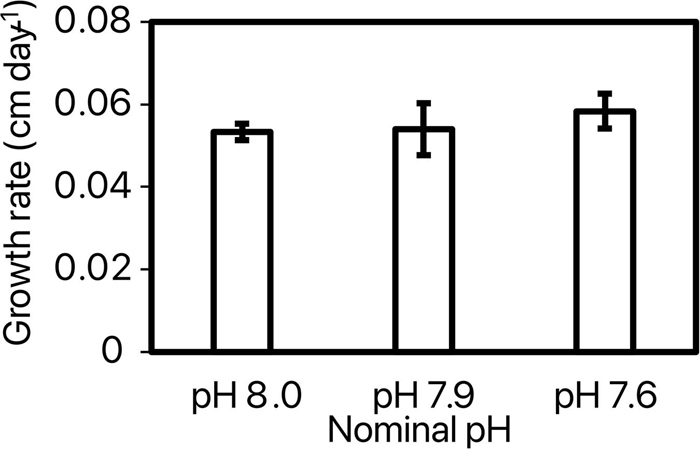
Figure 2. Growth rates (cm day–1) of shrimp maintained at the 3 different nominal pHNIST.
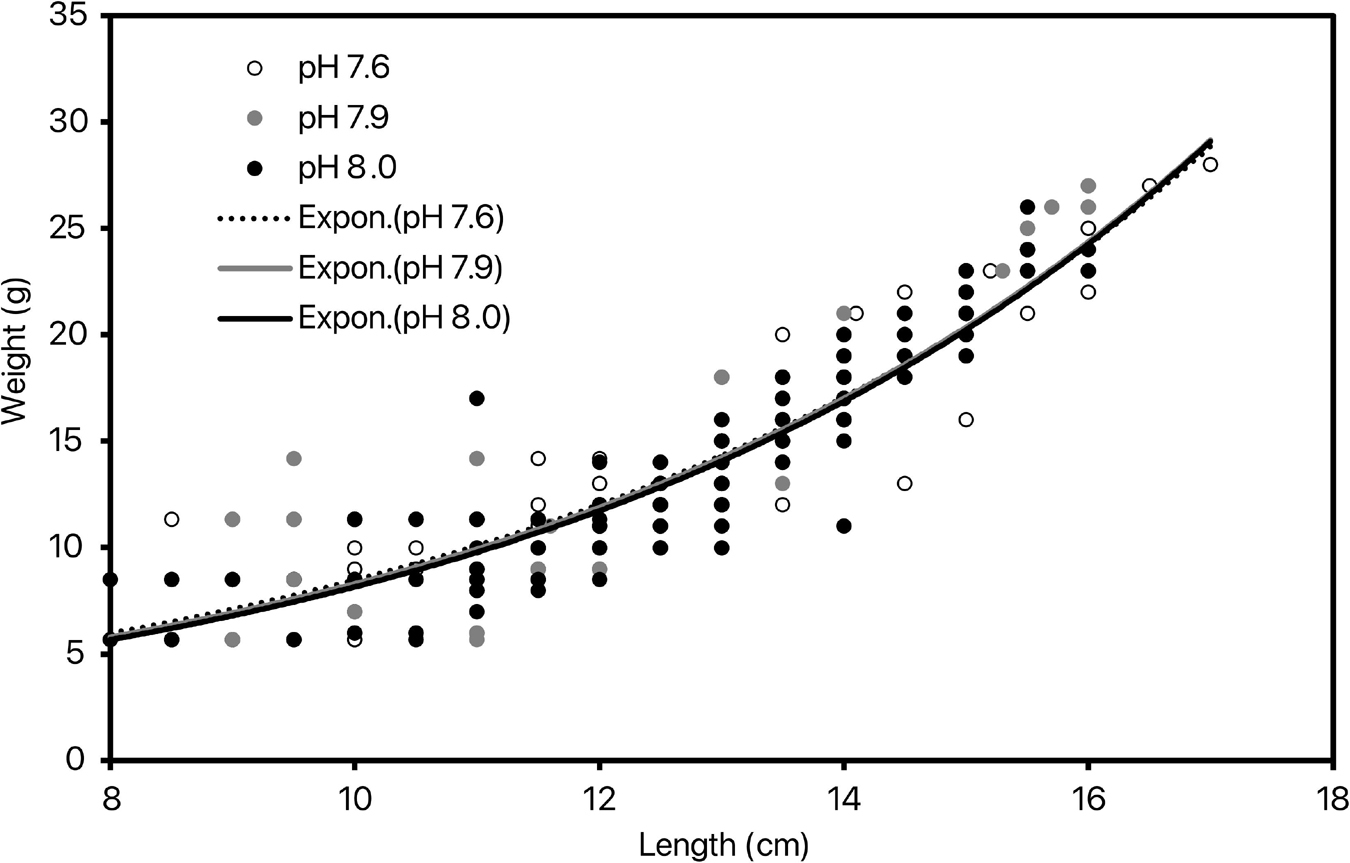
Figure 3. The exponential relationship between shrimp length (cm) and weight (g) at the 3 tested nominal pHNIST.
There was no significant effect of pH on this relationship [ANOVA: F(2, 8) = 0.05, p = 0.96].
Immune Markers
Overall, the total hemocyte count (THC) was 224.5 ± 16.3 104 cells ml–1. ANOVA 2 revealed an effect of pH [model: F(8, 37) = 3.53, p = 0.006; pH: F(2) = 4.50, p = 0.019] and replicate [F(6) = 2.85, p = 0.026] on THC. The only significant difference showed by the post-hoc test was a higher THC at pH 8.0—replicate 2 (403.1 ± 35.1 104 cells ml–1) as compared to pH 7.6—replicate 3 (106.3 ± 41.2 104 cells ml–1) (Figure 4).
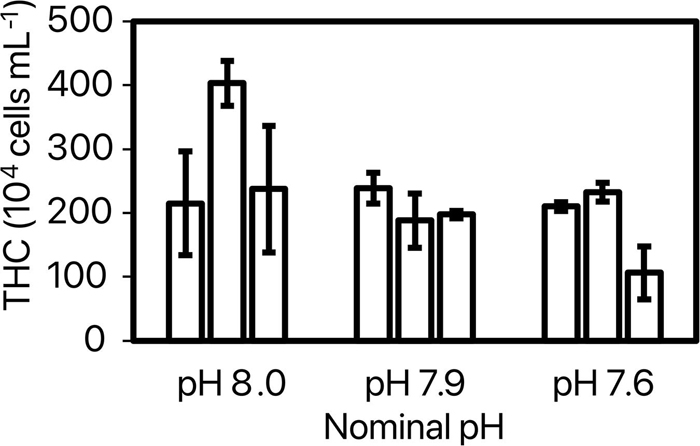
Figure 4. Total hemocyte counts (THC, 104 cells mL–1) for each replicate of tested nominal pHNIST.
Superoxide production (SOP) was impacted by pH [model: F(8, 38) = 3.51, p = 0.006; pH: F(2) = 13.21, p < 0.0001] with no difference between replicate [F(6) = 0.71, p = 0.64]. The post-hoc test revealed a significant increase of SOP by 61% in shrimp exposed to pH 7.6 as compared to the two other pHs (Figure 5).
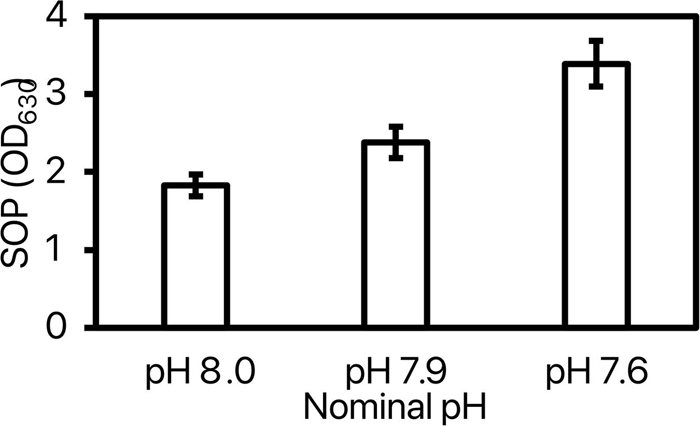
Figure 5. Superoxide production (SOP) measured at OD630 of the 3 tested nominal pHNIST.
For phenoloxydase (PO) activity, pH had a significant effect [model: F(8, 37) = 3.66, p = 0.005; pH: F(2) = 8.61, p = 0.0012] but not replicate [F(6) = 1.24, p = 0.32]. Post-hoc test revealed a 44% lower PO activity in shrimp exposed to pH 7.6 as compared to the two other pHs (Figure 6).
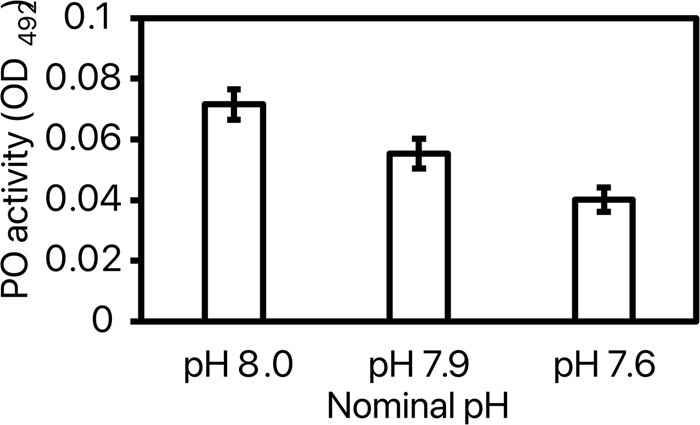
Figure 6. Phenoloxydase (PO) activity measured at OD492 of the 3 tested nominal pHNIST.
pH [model: F(8, 35) = 19.22, p < 0.0001; pH: F(2) = 70.48, p < 0.0001] but not replicate [F(6) = 1.79, p = 0.14] had an effect on the phagocytic activity. The phagocytic activity significantly decreased with decreasing pH leading to a 20% decrease at pH 7.9 and a 40% decrease at pH 7.6 as compared to pH 8.0 (Figure 7).
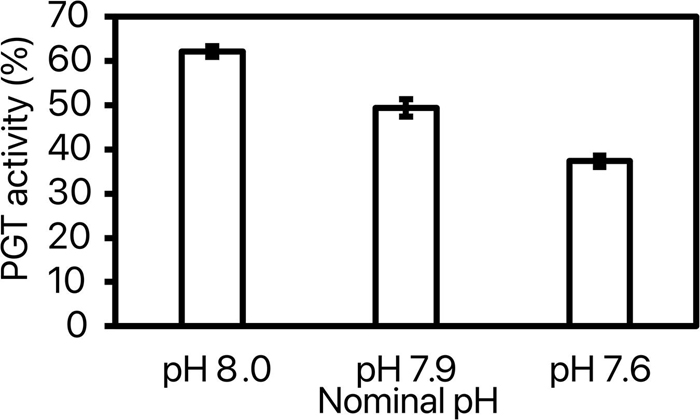
Figure 7. Phagocytic (PGT) activity (%) at the 3 tested nominal pHNIST.
Discussion
Our results show no direct impact of the exposure to lower pH (7.9 and 7.6) on fitness parameters (survival, growth, and allometries). This is consistent with some previously published studies on crustaceans. Mantis shrimps did not show any changes in their survival or growth following exposure to reduced pH of 7.57 for 6 months (DeVries et al., 2016). Lowder et al. (2017) reported that California grass shrimps exposed to a pH of 7.48 survived 7 weeks without any significant difference in carapace length compared to the controller group (pH of 7.98). Other studies documented negative impacts at similar low pH levels. Kurihara et al. (2008) found that Pacific grass shrimps raised under high pCO2 (1,000 and 1,900 ppm) for 7 weeks experienced increased mortality while a decrease in growth rate was observed only at the extreme pCO2 treatment. Decreased pH (7.8 and 7.5) both affected growth and increased mortality of both juvenile red king crabs and tanner crabs while compared to higher pH (8.04) (Long et al., 2013).
While pH had no significant effect on fitness in our experiment, effects of decreased pH were observed for immune markers. For the THC, only a mild trend was observed as only one replicate in pH 7.6 had significantly lower THC than one replicate on pH 8.0 (Figure 4). A decline in THC was also noted in Norway lobsters (Hernroth et al., 2012), Blue mussels (Sun et al., 2017), Blood clams (Liu et al., 2016), common starfish (Hernroth et al., 2011) and American lobsters (Harrington and Hamlin, 2019) exposed to low pH. A significant decrease of hemocyte numbers was observed in Pacific white shrimps exposed to pH 7.5 for 15 days compared to pH 8.0 (Pan et al., 2005) and the same species exposed to pH 6.5 for 120 h exhibited a significant decrease in THC as compared to shrimps raised at pH 8.2 (Li and Chen, 2008).
Our results show that exposure to pH 7.6 increased superoxide production as compared to the two other pH treatments (Figure 5). This is consistent with the available literature, mostly on mollusks, showing that decreased pH can stimulate oxidative stress in the marine organism through increased ROS production (Tomanek et al., 2011; Wang et al., 2016; Sun et al., 2017; Cao et al., 2018; Liao et al., 2019). Enhanced production of ROS such as superoxide ions and hydrogen peroxide were observed under various environmental challenges in marine invertebrates (Liu and Chen, 2004; Hannam et al., 2010; Hernroth et al., 2012; Wang et al., 2016; Sun et al., 2017; Cao et al., 2018). However, the protective response of the antioxidant system (SOD, CAT, several peroxiredoxins) by scavenging excess radicals, can be varied under different situations. In some cases, the antioxidant system was overwhelmed by the elevated ROS production or it failed due to the influence of the respective stressors (Liu and Chen, 2004; Hannam et al., 2010; Hernroth et al., 2012; Wang et al., 2016; Sun et al., 2017; Cao et al., 2018) while in the other cases the antioxidant system successfully scavenged the excess radicals to protect organisms cell structure from the oxidative damage (Tomanek et al., 2011; Hu et al., 2015).
PO activity of shrimps exposed to pH 7.6 was lower than for shrimps maintained at pH 8.0 (Figure 6). This is consistent with observations on Atlantic blue crabs (Tanner et al., 2006) and Pacific white shrimps (Kathyayani et al., 2019) under low pH of 7.0 and 6.0, respectively. A decrease of PO activity was also shown in Atlantic blue crabs (Tanner et al., 2006) and Pacific white shrimps (Kathyayani et al., 2019) under hypoxic and elevated ammonia concentration, respectively. In crustaceans, semi-granular and granular immune cells are the predominant sites that store and activate the pro-phenoloxidase system into melanin (Johansson and Soderhall, 1989; Rowley, 2016), shielding the infected region of the cuticle (Hernroth et al., 2012). Therefore, the reduction of these cells in the hemolymph can be lead to suppression in the production of PO enzyme, which is the central enzyme of the pro-phenoloxidase activation cascade system (Rowley, 2016). A similar argument was presented by Meseck et al. (2016) for Tanner crabs exposed to pH 7.5, mentioning that observed alterations of normal functions in semi-granular and granular cells under low pH, could suppress the full functionality of phenoloxidase regulation. Hernroth et al. (2012) hypothesized that the conversion of pro-phenoloxidase to phenoloxidase could be impaired in Norway lobsters under low pH conditions. However, while the hemocyte count declined by 50%, they observed no significant difference in the mean PO activity. They assumed that neglecting the degranulation process of hemocytes during the in vitro measurements led to that result. In our study, following the method described in Hernández-López et al. (1996) and Liu and Chen (2004), we have used centrifugation to induce the degranulation of hemocytes and we did observe both a decrease in THC and PO activity.
Phagocytic (PGT) activity in Pacific white shrimps was the most sensitive parameter to pH. Shrimp exposure to pH 7.9 led to a 20% decrease in phagocytic activity as compared to pH 8.0 while exposure to pH 7.6 led to a 40% decrease. Similarly, a decrease in phagocytic activity was observed in Pacific oysters (Cao et al., 2018), blood clams (Liu et al., 2016), blue mussels (Bibby et al., 2008; Sun et al., 2017), common starfish (Hernroth et al., 2011) and Norway lobsters (Hernroth et al., 2012) exposed to low pH conditions. Cao et al. (2018) hypothesized that energy suppression in Pacific oysters could be linked to the reduction of phagocytosis. Liu et al. (2016) suggested that suppressed phagocytic activity in blood clams may be associated with the observed reduction in THC. Bibby et al. (2008) and Li et al. (2015) proposed that changes in concentration of Ca2+ in intracellular structures may suppress the phagocytosis in blue mussels and Akoya pearl oysters, as it is an important messenger in cell signaling which controls the hemocytes functions such as phagocytosis. Hyaline cells are the type of immune cells involve in phagocytosis along with the formation of radicals such as superoxide ions (Johansson and Soderhall, 1989; Rowley, 2016).
Overall, the Pacific white shrimp only experienced sub-lethal effects within the tested pH range (8.0–7.6). This species live in tropical marine habitats. Adults live and spawn in the open ocean, while post-larvae migrate inshore to spend their juvenile and sub-adult stages in coastal estuaries, lagoons, or mangrove areas. As a consequence, the species experience large fluctuations in pH characteristics of such habitats and the tested scenarios in our experiment are well within the natural range of variability. Marine organisms are naturally exposed to a wide range of environmental conditions including pH that constitutes their ecological niche. As a consequence of evolution, an organism is often adapted to its niche and the concept of stress is then relative. Stress can then be defined as a condition evoked in an organism by one or more environmental and biological factors that bring the organism near or over the limits of its ecological niche (Van Straalen, 2003). Previous work has demonstrated that the pH effect can lead to different physiological and evolutionary processes depending on its intensity. Within the present range of natural variability, it leads to sub-lethal physiological plasticity while stress, selection, and mortality occur under pH levels deviating from the present natural range (Dorey et al., 2013; Thor and Dupont, 2015; De Wit et al., 2016; Ventura et al., 2016; Vargas et al., 2017). As a consequence, the absence of negative effect on fitness in our experiment is not surprising and sub-lethal effects can be interpreted as an expression of plasticity.
The observed sub-lethal effects on immune parameters could be interpreted in the context of shifts in energy budget under low pH. Melzner et al. (2009) stated that many brachyuran crustaceans increase their metabolic demand under low pH for efficient ion- regulatory mechanisms by using powerful ion regulatory apparatus which are located in gill epithelia to maintain their acid-base balance. Han et al. (2018) showed that Pacific white shrimps achieve a new, balanced steady-state under low pH by maintaining higher osmoregulation rates. Activities of ion exchanging enzymes such as V-ATPase (Na+/H+) and HCO3–-ATPase (Cl–/ HCO3–) were enhanced under low pH conditions (pH 7.1 and 7.6) in Pacific white shrimps and those enzymes showed a negative correlation with pH (Pan et al., 2007). Further, they suggested that changing the H+ and OH– concentration in water can stimulate the activities of the V-ATPase enzyme in the gill epithelium membrane and increase the excretion of H+ to maintain the internal acid-base balance. Yet, this process does not directly enhance the energy demand as there are no ATPase linked to these enzymes, but this exchange is powered by the activities of Na+/K+ ATPase pumps which are the driving force as well as main energy consumer of the ion exchange process in marine ectothermic organisms including crustaceans (Morris, 2001; Freire et al., 2008; Melzner et al., 2009). Moreover, H+ and HCO3– ions are accumulated in gill epithelial cells as carbonic anhydrase enzymes involved in the hydration of excretory CO2 to form carbonic acids (H2CO3) which can further dissociate into H+ and HCO3– ions (Freire et al., 2008; Melzner et al., 2009). The aforementioned enhanced activities of the V-ATPase enzyme may drive into Cl- uptake, forcing enhanced functioning of HCO3–—ATPase, which can exchange HCO3– ions with Cl– ions into the extracellular fluid (Pan et al., 2007; Melzner et al., 2009). As a consequence of the higher energetic cost for upregulated ion exchange, less energy may be invested into immune defense. However, how the observed changes in immune markers translate into health is difficult to assess. For example, Ellis et al. (2015) observed an apparent impairment in immune markers under low pH but hemolymph bactericidal activity was restored when mussels were exposed to the pathogenic bacteria Vibrio tubiaschii. This illustrates the possibility of reversible physiological trade-off rather than an irreversible impairment of immune function.
Our results are mostly in accordance with the published literature on the impact of low pH in shrimps. However, some differences in sensitivity between studies and species were observed. These can be partly attributed to methodological differences but also reflect differences in local adaptation. Species experiencing different pH variability in their natural environments have different sensitivities to low pH as a consequence of local adaptation (Vargas et al., 2017).
While the tested pHs in our experiment are within the present range of variability, the exposure to pH 7.6 highlights potential increased energy costs. In the context of ocean acidification, the Pacific white shrimp will be exposed more frequently to such pH values in the near future as well as to pH value deviating from the present range of variability. This will have negative sub-lethal but also lethal consequences for the species (Vargas et al., 2017) with potential impacts for natural populations as well as aquaculture. Identifying thresholds as well as solutions to minimize the impacts (e.g., adaptation of aquaculture practices, ecosystem-based management) should then be a priority.
Data Availability Statement
The raw data supporting the conclusions of this article will be made available by the authors, without undue reservation.
Author Contributions
C-CH and W-JH conceptualized and designed the experiment with contributions from SD and VW. Conducting the experiment, data collection, and sample analysis were done by VW with contributions from H-HH, NP, F-LY, J-SL, C-YL, and W-MC. VW and SD did the formal analyses. VW wrote the original draft of the manuscript with major reviewing and editing from SD, C-CH, and W-JH. All other authors read and edited the manuscript. All authors contributed to the article and approved the submitted version.
Funding
This work was supported by the Ministry of Education and the Ministry of Science and Technology (MOST), Taiwan, funded projects (MOST-108-2611-M-110-019-MY3, MOST-108-2621-M-110-001 and MOST-107-2911-I-110-301).
Conflict of Interest
The authors declare that the research was conducted in the absence of any commercial or financial relationships that could be construed as a potential conflict of interest.
Publisher’s Note
All claims expressed in this article are solely those of the authors and do not necessarily represent those of their affiliated organizations, or those of the publisher, the editors and the reviewers. Any product that may be evaluated in this article, or claim that may be made by its manufacturer, is not guaranteed or endorsed by the publisher.
Acknowledgments
We are glad to express our sincere thank to W.S. Weerakkody, S.Y. Huang, and M.H. Chuang for their support to maintain the experimental system. Further, we are very thankful to K.C. Huang, K.J. Kao, Cheau Chen, J.Y. Chen, and R.D.D.W. Kulathunga for their support during the sample analysis.
Supplementary Material
The Supplementary Material for this article can be found online at: https://www.frontiersin.org/articles/10.3389/fmars.2021.748837/full#supplementary-material
References
Araneda, M., Pérez, E. P., and Gasca-Leyva, E. (2008). White shrimp Penaeus vannamei culture in freshwater at three densities: condition state based on length and weight. Aquaculture 283, 13–18. doi: 10.1016/j.aquaculture.2008.06.030
Barracco, M. A., Medeiros, I. D., and Moreira, F. M. (1999). Some haemato-immunological parameters in the mussel Perna perna. Fish Shellfish Immunol. 9, 387–404. doi: 10.1006/fsim.1998.0196
Bell, K. L., and Smith, V. J. (1993). In vitro superoxide production by hyaline cells of the shore crab Carcinus maenas (L.). Dev. Comp. Immunol. 17, 211–219. doi: 10.1016/0145-305X(93)90040-W
Bibby, R., Widdicombe, S., Parry, H., Spicer, J., and Pipe, R. (2008). Effects of ocean acidification on the immune response of the blue mussel Mytilus edulis. Aquat. Biol. 2, 67–74. doi: 10.3354/ab00037
Caldiera, K., and Wickett, M. E. (2003). Anthropogenic carbon and ocean pH. Nature 425:365. doi: 10.1038/425365a
Cao, R., Wang, Q., Yang, D., Liu, Y., Ran, W., Qu, Y., et al. (2018). CO2-induced ocean acidification impairs the immune function of the Pacific oyster against Vibrio splendidus challenge: an integrated study from a cellular and proteomic perspective. Sci. Total Environ. 625, 1574–1583. doi: 10.1016/j.scitotenv.2018.01.056
Chen, H., Mai, K., Zhang, W., Liufu, Z., Xu, W., and Tan, B. (2005). Effects of dietary pyridoxine on immune responses in abalone, Haliotis discus hannai Ino. Fish Shellfish Immunol. 19, 241–252. doi: 10.1016/j.fsi.2004.12.006
Culler-Juarez, M. E., and Onthank, K. L. (2021). Elevated immune response in Octopus rubescens under ocean acidification and warming conditions. Mar. Biol. 168, 137. doi: 10.1007/s00227-021-03913-z
De Wit, P., Dupont, S., and Thor, P. (2016). Selection on oxidative phosphorylation and ribosomal structure as a multigenerational response to ocean acidification in the common copepod Pseudocalanus acuspes. Evol. Appl. 9, 1112–1123. doi: 10.1111/eva.12335
DeVries, M. S., Webb, S. J., Tu, J., Cory, E., Morgan, V., Sah, R. L., et al. (2016). Stress physiology and weapon integrity of intertidal mantis shrimp under future ocean conditions. Sci. Rep. 6:38637. doi: 10.1038/srep38637
Dickson, A. G. (1990). Standard potential of the reaction: AgCl(s) + 12H2(g) = Ag(s) + HCl(aq), and and the standard acidity constant of the ion HSO4- in synthetic sea water from 273.15 to 318.15 K. J. Chem. Thermodyn. 22, 113–127. doi: 10.1016/0021-9614(90)90074-Z
Dickson, A. G., and Millero, F. J. (1987). A comparison of the equilibrium constants for the dissociation of carbonic acid in seawater media. Deep Sea Res. Part A Oceanogr. Res. Pap. 34, 1733–1743. doi: 10.1016/0198-0149(87)90021-5
Dorey, N., Lançon, P., Thorndyke, M., and Dupont, S. (2013). Assessing physiological tipping point of sea urchin larvae exposed to a broad range of pH. Glob. Chang. Biol. 19, 3355–3367. doi: 10.1111/gcb.12276
Ellis, R. P., Widdicombe, S., Parry, H., Hutchinson, T. H., and Spicer, J. I. (2015). Pathogenic challenge reveals immune trade-off in mussels exposed to reduced seawater pH and increased temperature. J. Exp. Mar. Bio. Ecol. 462, 83–89. doi: 10.1016/j.jembe.2014.10.015
Feely, R. A., Fabry, V. J., and Guinotte, J. M. (2008). Ocean acidification of the North Pacific Ocean. PICES Press 16, 22–26.
Feely, R. A., Sabine, C. L., Lee, K., Berelson, W., Kleypas, J., Fabry, V. J., et al. (2004). Impact of anthropogenic CO2 on the CaCO3 system in the oceans. Science 305, 362–366. doi: 10.1126/science.1097329
Freire, C. A., Onken, H., and McNamara, J. C. (2008). A structure-function analysis of ion transport in crustacean gills and excretory organs. Comp. Biochem. Physiol. A Mol. Integr. Physiol. 151, 272–304. doi: 10.1016/j.cbpa.2007.05.008
Grasshoff, K., Kremling, K., and Ehrhardt, M. (2009). Methods of Seawater Analysis. Weinheim: John Wiley & Sons, 159–192.
Han, S. Y., Wang, B. J., Liu, M., Wang, M. Q., Jiang, K. Y., Liu, X. W., et al. (2018). Adaptation of the white shrimp Litopenaeus vannamei to gradual changes to a low-pH environment. Ecotoxicol. Environ. Saf. 149, 203–210. doi: 10.1016/j.ecoenv.2017.11.052
Hannam, M. L., Bamber, S. D., Galloway, T. S., John Moody, A., and Jones, M. B. (2010). Effects of the model PAH phenanthrene on immune function and oxidative stress in the haemolymph of the temperate scallop Pecten maximus. Chemosphere 78, 779–784. doi: 10.1016/j.chemosphere.2009.12.049
Harrington, A. M., and Hamlin, H. J. (2019). Ocean acidification alters thermal cardiac performance, hemocyte abundance, and hemolymph chemistry in subadult American lobsters Homarus americanus H. Milne Edwards, 1837 (Decapoda: malcostraca: nephropidae). J. Crustac. Biol. 39, 468–476. doi: 10.1093/jcbiol/ruz015
Hernández-López, J., Gollas-Galván, T., and Vargas-Albores, F. (1996). Activation of the prophenoloxidase system of the brown shrimp (Penaeus californiensis Holmes). Comp. Biochem. Physiol. C Pharmacol. Toxicol. Endocrinol. 113, 61–66. doi: 10.1016/0742-8413(95)02033-0
Hernroth, B., Baden, S., Thorndyke, M., and Dupont, S. (2011). Immune suppression of the echinoderm Asterias rubens (L.) following long-term ocean acidification. Aquat. Toxicol. 103, 222–224. doi: 10.1016/j.aquatox.2011.03.001
Hernroth, B., Sköld, H. N., Wiklander, K., Jutfelt, F., and Baden, S. (2012). Simulated climate change causes immune suppression and protein damage in the crustacean Nephrops norvegicus. Fish Shellfish Immunol. 33, 1095–1101. doi: 10.1016/j.fsi.2012.08.011
Holmblad, T., and Söderhäll, K. (1999). Cell adhesion molecules and antioxidative enzymes in a crustacean, possible role in immunity. Aquaculture 172, 111–123. doi: 10.1016/S0044-8486(98)00446-3
Hu, M., Li, L., Sui, Y., Li, J., Wang, Y., Lu, W., et al. (2015). Effect of pH and temperature on antioxidant responses of the thick shell mussel Mytilus coruscus. Fish Shellfish Immunol. 46, 573–583. doi: 10.1016/j.fsi.2015.07.025
IPCC (2014). Synthesis Report. Contribution of Working Groups I. II and III to the Fifth Assessment Report of the Intergovernmental Panel on Climate Change. Geneva: Intergovernmental Panel on Climate Change, 151.
Johansson, M. W., and Soderhall, K. (1989). Cellular immunity in crustaceans and the proPO system. Parasitol. Today 5, 171–176. doi: 10.1016/0169-4758(89)90139-7
Kathyayani, S. A., Poornima, M., Sukumaran, S., Nagavel, A., and Muralidhar, M. (2019). Effect of ammonia stress on immune variables of Pacific white shrimp Penaeus vannamei under varying levels of pH and susceptibility to white spot syndrome virus. Ecotoxicol. Environ. Saf. 184:109626. doi: 10.1016/j.ecoenv.2019.109626
Kurihara, H., Matsui, M., Furukawa, H., Hayashi, M., and Ishimatsu, A. (2008). Long-term effects of predicted future seawater CO2 conditions on the survival and growth of the marine shrimp Palaemon pacificus. J. Exp. Mar. Biol. Ecol. 367, 41–46. doi: 10.1016/j.jembe.2008.08.016
Lee, K., Kim, T. W., Byrne, R. H., Millero, F. J., Feely, R. A., and Liu, Y. M. (2010). The universal ratio of boron to chlorinity for the North Pacific and North Atlantic oceans. Geochim. Cosmochim. Acta 74, 1801–1811. doi: 10.1016/j.gca.2009.12.027
Li, C. C., and Chen, J. C. (2008). The immune response of white shrimp Litopenaeus vannamei and its susceptibility to Vibrio alginolyticus under low and high pH stress. Fish Shellfish Immunol. 25, 701–709. doi: 10.1016/j.fsi.2008.01.007
Li, S., Liu, Y., Liu, C., Huang, J., Zheng, G., Xie, L., et al. (2015). Morphology and classification of hemocytes in Pinctada fucata and their responses to ocean acidification and warming. Fish Shellfish Immunol. 45, 194–202. doi: 10.1016/j.fsi.2015.04.006
Liao, H., Yang, Z., Dou, Z., Sun, F., Kou, S., Zhang, Z., et al. (2019). Impact of ocean acidification on the energy metabolism and antioxidant responses of the Yesso scallop (Patinopecten yessoensis). Front. Physiol. 10:1967. doi: 10.3389/fphys.2018.01967
Liu, C. H., and Chen, J. C. (2004). Effect of ammonia on the immune response of white shrimp Litopenaeus vannamei and its susceptibility to Vibrio alginolyticus. Fish Shellfish Immunol. 16, 321–334. doi: 10.1016/S1050-4648(03)00113-X
Liu, S., Shi, W., Guo, C., Zhao, X., Han, Y., Peng, C., et al. (2016). Ocean acidification weakens the immune response of blood clam through hampering the NF-kappa β and toll-like receptor pathways. Fish Shellfish Immunol. 54, 322–327. doi: 10.1016/j.fsi.2016.04.030
Long, W. C., Swiney, K. M., Harris, C., Page, H. N., and Foy, R. J. (2013). Effects of ocean acidification on juvenile red king crab (Paralithodes camtschaticus) and tanner crab (Chionoecetes bairdi) growth, condition, calcification, and survival. PLoS One 8:e60959. doi: 10.1371/journal.pone.0060959
Lowder, K. B., Allen, M. C., Day, J. M. D., Deheyn, D. D., and Taylor, J. R. A. (2017). Assessment of ocean acidification and warming on the growth, calcification, and biophotonics of a California grass shrimp. ICES J. Mar. Sci. 74, 1150–1158. doi: 10.1093/icesjms/fsw246
Luo, B. Y., Qian, H. L., Jiang, H. C., Xiong, X. Y., Ye, B. Q., Liu, X., et al. (2021). Transcriptional changes revealed water acidification leads to the immune response and ovary maturation delay in the Chinese mitten crab Eriocheir sinensis. Comp. Biochem. Physiol. Part D Genomics Proteomics 39:100868. doi: 10.1016/j.cbd.2021.100868
Mackenzie, C. L., Lynch, S. A., Culloty, S. C., and Malham, S. K. (2014). Future oceanic warming and acidification alter immune response and disease status in a commercial shellfish species, Mytilus edulis L. PLoS One 9:e99712. doi: 10.1371/journal.pone.0099712
Mehrbach, C., Culberson, C. H., Hawley, J. E., and Pytkowicx, R. M. (1973). Measurement of the apparent dissociation constants of carbonic acid in seawater at atmospheric pressure. Limnol. Oceanogr. 18, 897–907. doi: 10.4319/lo.1973.18.6.0897
Melzner, F., Gutowska, M. A., Langenbuch, M., Dupont, S., Lucassen, M., Thorndyke, M. C., et al. (2009). Physiological basis for high CO2 tolerance in marine ectothermic animals: pre-adaptation through lifestyle and ontogeny? Biogeosciences 6, 2313–2331. doi: 10.5194/bg-6-2313-2009
Meseck, S. L., Alix, J. H., Swiney, K. M., Long, W. C., Wikfors, G. H., and Foy, R. J. (2016). Ocean acidification affects hemocyte physiology in the tanner crab (Chionoecetes bairdi). PLoS One 11:148477. doi: 10.1371/journal.pone.0148477
Migliaccio, O., Pinsino, A., Maffioli, E., Smith, A. M., Agnisola, C., Matranga, V., et al. (2019). Living in future ocean acidification, physiological adaptive responses of the immune system of sea urchins resident at a CO2 vent system. Sci. Total Environ. 672, 938–950. doi: 10.1016/j.scitotenv.2019.04.005
Morris, S. (2001). Neuroendocrine regulation of osmoregulation and the evolution of air-breathing in decapod crustaceans. J. Exp. Biol. 204, 979–989. doi: 10.1242/jeb.204.5.979
Muñoz, M., Cedeño, R., Rodríguez, J., Van Der Knaap, W. P. W., Mialhe, E., and Bachère, E. (2000). Measurement of reactive oxygen intermediate production in haemocytes of the penaeid shrimp, Penaeus vannamei. Aquaculture 191, 89–107. doi: 10.1016/S0044-8486(00)00420-8
Ordás, M. C., Ordás, A., Beloso, C., and Figueras, A. (2000). Immune parameters in carpet shell clams naturally infected with Perkinsus atlanticus. Fish Shellfish Immunol. 10, 597–609. doi: 10.1006/fsim.2000.0274
Orr, J. C., Fabry, V. J., Aumont, O., Bopp, L., Doney, S. C., Feely, R. A., et al. (2005). Anthropogenic ocean acidification over the twenty-first century and its impact on calcifying organisms. Nature 437, 681–686. doi: 10.1038/nature04095
Pai, S. C., Tsau, Y. J., and Yang, T. I. (2001). pH and buffering capacity problems involved in the determination of ammonia in saline water using the indophenol blue spectrophotometric method. Anal. Chim. Acta 434, 209–216. doi: 10.1016/S0003-2670(01)00851-0
Pan, L. Q., Jiang, L. X., and Miao, J. J. (2005). Effects of salinity and pH on immune parameters of the white shrimp Litopenaeus vannamei. J. Shellfish Res. 24, 1223–1227. doi: 10.2983/0730-8000(2005)24[1223:eosapo]2.0.co;2
Pan, L. Q., Zhang, L. J., and Liu, H. Y. (2007). Effects of salinity and pH on ion-transport enzyme activities, survival and growth of Litopenaeus vannamei postlarvae. Aquaculture 273, 711–720. doi: 10.1016/j.aquaculture.2007.07.218
Pierrot, D., Lewis, E., and Wallace, D. W. R. (2006). MS Excel Program Developed for CO2 System Calculations. ORNL/CDIAC-105a. Oak Ridge, TN: Carbon Dioxide Information Analysis Centre, Oak Ridge National Laboratory, U.S. Department of Energy.
Ratcliffe, N. A., Rowley, A. F., Fitzgerald, S. W., and Rhodes, C. P. (1985). Invertebrate immunity: basic concepts and recent advances. Int. Rev. Cytol. 97, 183–350. doi: 10.1016/S0074-7696(08)62351-7
Sabine, C. L., Feely, R. A., Gruber, N., Key, R. M., Lee, K., Bullister, J. L., et al. (2004). The oceanic sink for anthropogenic CO2. Science 305, 367–371. doi: 10.1126/science.1097403
Söderhäll, K., and Smith, V. J. (1983). Separation of the haemocyte populations of Carcinus maenas and other marine decapods, and prophenoloxidase distribution. Dev. Comp. Immunol. 7, 229–239. doi: 10.1016/0145-305X(83)90004-6
Song, Y. L., and Hsieh, Y. T. (1994). Immunostimulation of tiger shrimp (Penaeus monodon) hemocytes for generation of microbicidal substances: analysis of reactive oxygen species. Dev. Comp. Immunol. 18, 201–209. doi: 10.1016/0145-305X(94)90012-4
Stumpp, M., Wren, J., Melzner, F., Thorndyke, M. C., and Dupont, S. T. (2011). CO2 induced seawater acidification impacts sea urchin larval development I: elevated metabolic rates decrease scope for growth and induce developmental delay. Comp. Biochem. Physiol. A Mol. Integr. Physiol. 160, 331–340. doi: 10.1016/j.cbpa.2011.06.022
Sun, T., Tang, X., Jiang, Y., and Wang, Y. (2017). Seawater acidification induced immune function changes of haemocytes in Mytilus edulis: a comparative study of CO2 and HCl enrichment. Sci. Rep. 7:41488. doi: 10.1038/srep41488
Tanner, C. A., Burnett, L. E., and Burnett, K. G. (2006). The effects of hypoxia and pH on phenoloxidase activity in the Atlantic blue crab, Callinectes sapidus. Comp. Biochem. Physiol. A Mol. Integr. Physiol. 144, 218–223. doi: 10.1016/j.cbpa.2006.02.042
Thor, P., and Dupont, S. (2015). Transgenerational effects alleviate severe fecundity loss during ocean acidification in a ubiquitous planktonic copepod. Glob. Chang. Biol. 21, 2261–2271. doi: 10.1111/gcb.12815
Tomanek, L., Zuzow, M. J., Ivanina, A. V., Beniash, E., and Sokolova, I. M. (2011). Proteomic response to elevated pCO2 level in eastern oysters, Crassostrea virginica: evidence for oxidative stress. J. Exp. Biol. 214, 1836–1844. doi: 10.1242/jeb.055475
Van Straalen, N. M. (2003). Ecotoxicology becomes stress ecology. Environ. Sci. Technol. 37, 324A–330A. doi: 10.1021/es0325720
Vargas, C. A., Lagos, N. A., Lardies, M. A., Duarte, C., Manríquez, P. H., Aguilera, V. M., et al. (2017). Species-specific responses to ocean acidification should account for local adaptation and adaptive plasticity. Nat. Ecol. Evol. 1:0084. doi: 10.1038/s41559-017-0084
Ventura, A., Schulz, S., and Dupont, S. (2016). Maintained larval growth in mussel larvae exposed to acidified under-saturated seawater. Sci. Rep. 6:23728. doi: 10.1038/srep23728
Wang, Q., Cao, R., Ning, X., You, L., Mu, C., Wang, C., et al. (2016). Effects of ocean acidification on immune responses of the Pacific oyster Crassostrea gigas. Fish Shellfish Immunol. 49, 24–33. doi: 10.1016/j.fsi.2015.12.025
Wittmann, A. C., and Pörtner, H. O. (2013). Sensitivities of extant animal taxa to ocean acidification. Nat. Clim. Chang. 3, 995–1001. doi: 10.1038/nclimate1982
Keywords: pCO2, ocean acidification, seawater carbonate chemistry, growth, energy budget, dissolved inorganic carbon
Citation: Weerathunga V, Huang W-J, Dupont S, Hsieh H-H, Piyawardhana N, Yuan F-L, Liao J-S, Lai C-Y, Chen W-M and Hung C-C (2021) Impacts of pH on the Fitness and Immune System of Pacific White Shrimp. Front. Mar. Sci. 8:748837. doi: 10.3389/fmars.2021.748837
Received: 28 July 2021; Accepted: 13 September 2021;
Published: 05 October 2021.
Edited by:
Guang Gao, Xiamen University, ChinaReviewed by:
Meng-Chou Lee, National Taiwan Ocean University, TaiwanPei-Jie Meng, National Dong Hwa University, Taiwan
Copyright © 2021 Weerathunga, Huang, Dupont, Hsieh, Piyawardhana, Yuan, Liao, Lai, Chen and Hung. This is an open-access article distributed under the terms of the Creative Commons Attribution License (CC BY). The use, distribution or reproduction in other forums is permitted, provided the original author(s) and the copyright owner(s) are credited and that the original publication in this journal is cited, in accordance with accepted academic practice. No use, distribution or reproduction is permitted which does not comply with these terms.
*Correspondence: Chin-Chang Hung, Y2NodW5nQG1haWwubnN5c3UuZWR1LnR3