 Cai John Tomos Ladd
 Mollie Frances Duggan-Edwards2
 Jordi F. Pagès
 Martin Wiggers Skov
- 1School of Geographical and Earth Sciences, University of Glasgow, Glasgow, United Kingdom
- 2School of Ocean Sciences, Bangor University, Menai Bridge, United Kingdom
- 3Department de Biologica Evolutiva, Ecologica i Ciències Ambientals, Universitat de Barcelona, Barcelona, Spain
- 4Centre d’Estudis Avançats de Blanes (CEAB-CSIC), Blanes, Spain
Resilience of coastal ecosystems to climate change is largely determined by the interaction between plants and the surrounding tidal environment. Research has tended to focus on processes operating at the local scale to explain resilience mechanisms, overlooking potentially important landscape-scale processes and patterns. We show from aerial images spanning 67 years across 3 estuaries that saltmarsh loss was compensated by expansion elsewhere in the estuary when tidal channels shifted position. Compensatory expansion rates were as high as 6 m/yr. This phenomenon of “geomorphic compensation” represents a hitherto overlooked large-scale self-organizing pattern that facilitates the long-term persistence of marshes in estuaries. The geomorphic compensation pattern likely also occurs in other hydrological systems including mangrove forests, and seagrass meadows, and river islands. Compensatory erosion-expansion patterns occurred at the same time as net marsh extent increased by between 120 and 235% across all three estuaries. Marsh expansion mostly occurred in the lower parts of each estuary, where channel migration and compensatory expansion was less evident. Patterns of geomorphic compensation therefore appear to operate at discrete spatio-temporal scales, nested within a hierarchy of coastal morphodynamic processes that govern longer-term patterns of either net marsh gain or loss. Coastal ecosystem resilience can therefore only be fully appreciated when examining erosion and expansion patterns at both local and landscape scales. The intrinsic dynamics of marshes described here have important implications for the long-term delivery of ecosystem services.
Introduction
Estuaries are amongst the most productive environments on Earth, supporting salt marsh, mangrove, and sea grass ecosystems that are the focus of recent global conservation efforts (Van Coppenolle and Temmerman, 2020). Salt marshes globally are considered at-risk from climate change and human pressure (Nicholls et al., 2007; Deegan et al., 2012; Gabler et al., 2017), placing under threat important ecosystem services such as carbon sequestration and coastal flood protection (Möller et al., 2014; Rogers et al., 2019). Whilst large-scale changes in areal marsh extent have been anthropogenically induced (Kirwan et al., 2011; Silliman et al., 2012), marshes expand and erode in response to natural variation in the environment (Reed et al., 2018; Brooks et al., 2020; Ladd, 2021). Understanding the mechanisms of marsh change is a first step toward elucidating the effects of human induced changes to marsh extent, including those associated with climate change. To date, studies have focused on local-scale interactions between plant growth, sediment mobility and wave/current forcing to explain why marshes contract and expand tens of meters at the seaward marsh edge (van Wesenbeeck et al., 2008; Wang et al., 2017). Fewer studies have considered how changes in forcing at the landscape scale shape marsh extent (Leonardi et al., 2016; Ladd et al., 2019a). Migrating tidal channels have been identified as a likely driver of lateral marsh dynamics across entire estuaries (Pringle, 1995; Chauhan, 2009; Traini et al., 2015), however, the principle has remained untested until now.
Estuaries are highly dynamic and subject to erosive river and wave action that influence the expanse of ecosystems. Erosional forces are concentrated in channels that drain the estuary of tidal and riverine water, and the meanderings of channels have profound influence on the shape of the estuarine landscape and the distribution and cover of its ecosystems (Coco et al., 2013). Channels are known to periodically change course and the small-scale effects on ecosystems from such shifts are well described, including local habitat erosion by scouring and/or the expansion of ecosystems through the redistribution of sediment (Hughes, 2012). However, the extent to which channel shifts explain the periodic re-distributions of ecosystems around the margins of estuaries is less explored. Little is known about how channel shifts affect the sum area of ecosystems at the estuarine scale, and how resilient ecosystems are to periodic shifts in channels. Here, we use salt marshes as a model system to explore how shifting tidal channels affect landscape-scale ecosystem resilience.
Tidal channels migrate across the estuary either gradually in response to displaced bidirectional flood and ebb tidal currents (Li et al., 2008), or rapidly after river floods, storm surges or dredging activities that can move large volumes of sediment along channel margins (Braudrick et al., 2009; Carrasco et al., 2021). The movement of channels scour the estuary bed where flow is greatest (Sylvester et al., 2019). A channel shift near a marsh edge will grow the elevation difference between the marsh and the downshore tidal flat. The step-change in elevation concentrates wave and current forcing which drives marsh erosion (Fagherazzi et al., 2012; Bouma et al., 2016; Willemsen et al., 2018). Once initiated, rates of lateral erosion can be as high as 8 m yr–1 (Cox et al., 2003). Where channel flow is reduced after migration, new sediment deposition raises the tidal flat to elevations suitable for the establishment of plant seedlings and the seaward expansion of the marsh (Wang and Temmerman, 2013; Balke et al., 2014).
Whilst channel shifts undoubtedly account for some marsh erosion and expansion, the extent to which they explain longer term and estuarine scale marsh distribution remains unclear. Moreover, studies of marsh change have also tended to focus on individual marshes, even though the effects of channel migration are likely to extend well beyond single sites to influence landscape-scale marsh morphology and dynamics across the estuary (Lanzoni and Seminara, 2002; Burningham, 2008). For example, Pringle (1995) reported the near total loss of ca. 200 ha of salt marsh over a period of 20 years following the migration of a tidal channel. On the opposite side of the estuary, tidal flats rapidly became vegetated to form a new, extensive marsh (Gray, 1972). Such a phenomenon, where channel shifts cause erosion in one part of the estuary and, at the same time, marsh expansion in another, may be commonplace. Indeed, erosion-expansion compensation patterns have been reported at a localized scale along interior marsh creek banks (Burns et al., 2021). Estuarine-scale channel-marsh dynamics would represent a hitherto unreported landscape-scale resilience mechanism, whereby net marsh area cover stays the same despite local scale erosion (Figure 1).
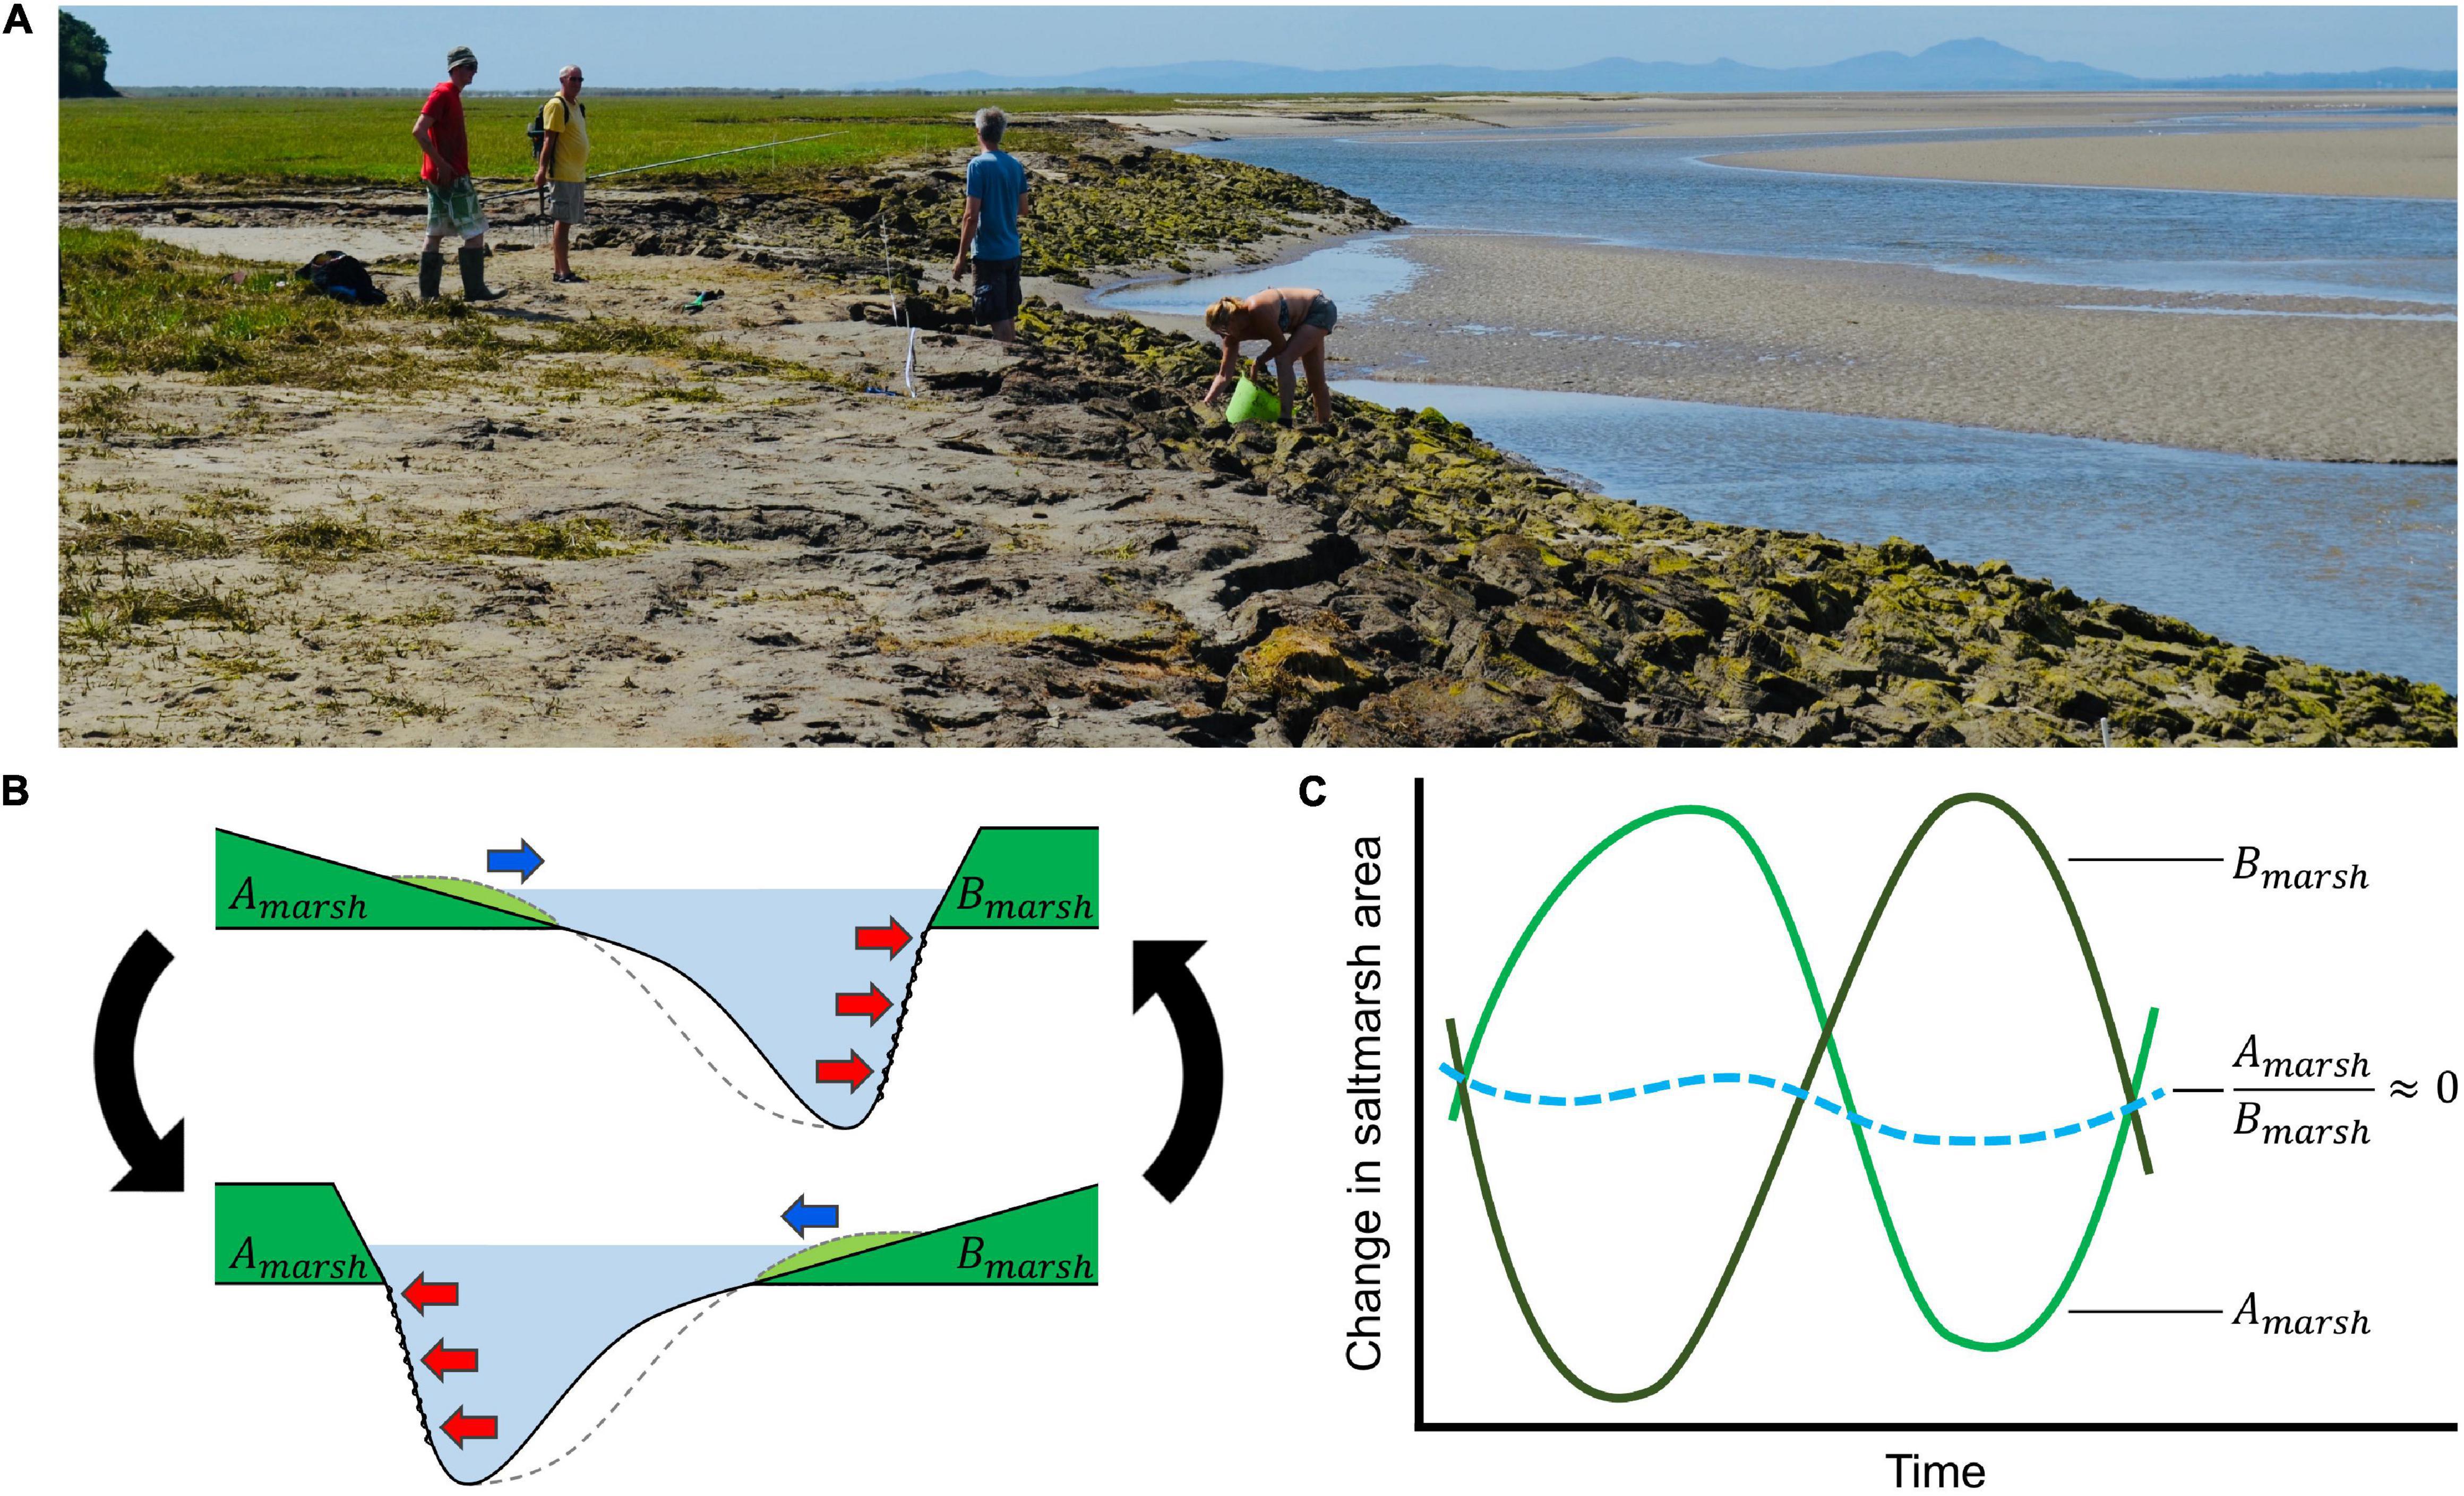
Figure 1. (A) Salt marsh exposure to hydrological forcing strongly depends on the position of ever shifting tidal channels in estuaries. For a typical estuary, (B) marshes (green) are found on opposite banks, separated by tidal channels (light blue). (i) Erosion by scouring occurs as channels move nearer the marsh edge (red arrows). On the opposite bank, the migration of channels away from the marsh edge facilitates sediment deposition, allowing marshes to expand laterally (blue arrow). (ii) When the direction of channel migration eventually changes, marsh erosion and expansion patterns are reversed. We hypothesise that cyclical switching in the direction that channels migrate (black arrows) means that (C) marsh erosion and expansion is synchronised, resulting in no net change in marsh area (blue dashed line). Such a biogeomorphic system would represent a compensatory resilience mechanism on a landscape scale (image: Glaslyn-Dwyryd estuary, Wales).
Here, we provide the first estuarine-scale, multi-marsh study of erosion and expansion in response to tidal channel migration. We use a timeseries of aerial photographs from 1946 to 2013 for twelve salt marshes in three estuaries in Wales, to examine coupled changes in salt marsh lateral extent and tidal channel position. We hypothesize that: (1) temporal variation in the position of the seaward edges of saltmarshes correlate with shifts in the position of tidal channels, and that; (2) channel migration couples marsh erosion on one estuarine bank with marsh expansion on the opposite bank, in a compensatory fashion that results in no net change in marsh cover at the estuarine scale (Figure 1). We also investigate whether patterns of channel-marsh change have been influenced by changes in wind-wave or river flow, which are the main drivers of channel migration.
Materials and Methods
Study Estuaries
Salt marsh extent and tidal channel migration patterns were studied in three estuaries: the Glaslyn-Dwyryd, the Mawddach and the Dyfi, located in Cardigan Bay, Wales, United Kingdom (Figure 2). All three estuaries were drowned river and glacial valleys, flooded during the later stages of Holocene transgression (Larcombe and Jago, 1996). During the 1800s, estuary sizes and tidal prisms were reduced by railway embankment and seawall construction on river flood plains (Rhind and Jones, 1994). Import of non-cohesive, medium grained terrigenous sediments via flood-dominant tides has subsequently reduced the estuary accommodation space (Brown and Davies, 2010), lowering the average estuary depth to between 4 and 10 m (Manning and Whitehouse, 2012). Each estuary is macrotidal with extreme neap and spring tidal ranges of 0.8 and 5.0 m, respectively. Strong tidal flows along the length of the estuaries produce current velocities of 1 m s–1 during flood tides that produce tidal flows of around 280–1,400 m3 s–1 during neap and spring tides, respectively (Larcombe and Jago, 1996). Tidal flows are considerably stronger than mean freshwater flows, which are typically around 20 m3 s–1 (Shi and Lamb, 1991). The estuaries are sheltered from north-westerly wind-generated waves by sand-shingle spits at the estuary mouths, protecting the well-developed intertidal flats, salt marshes and tidal channels (Pye and Blott, 2014).
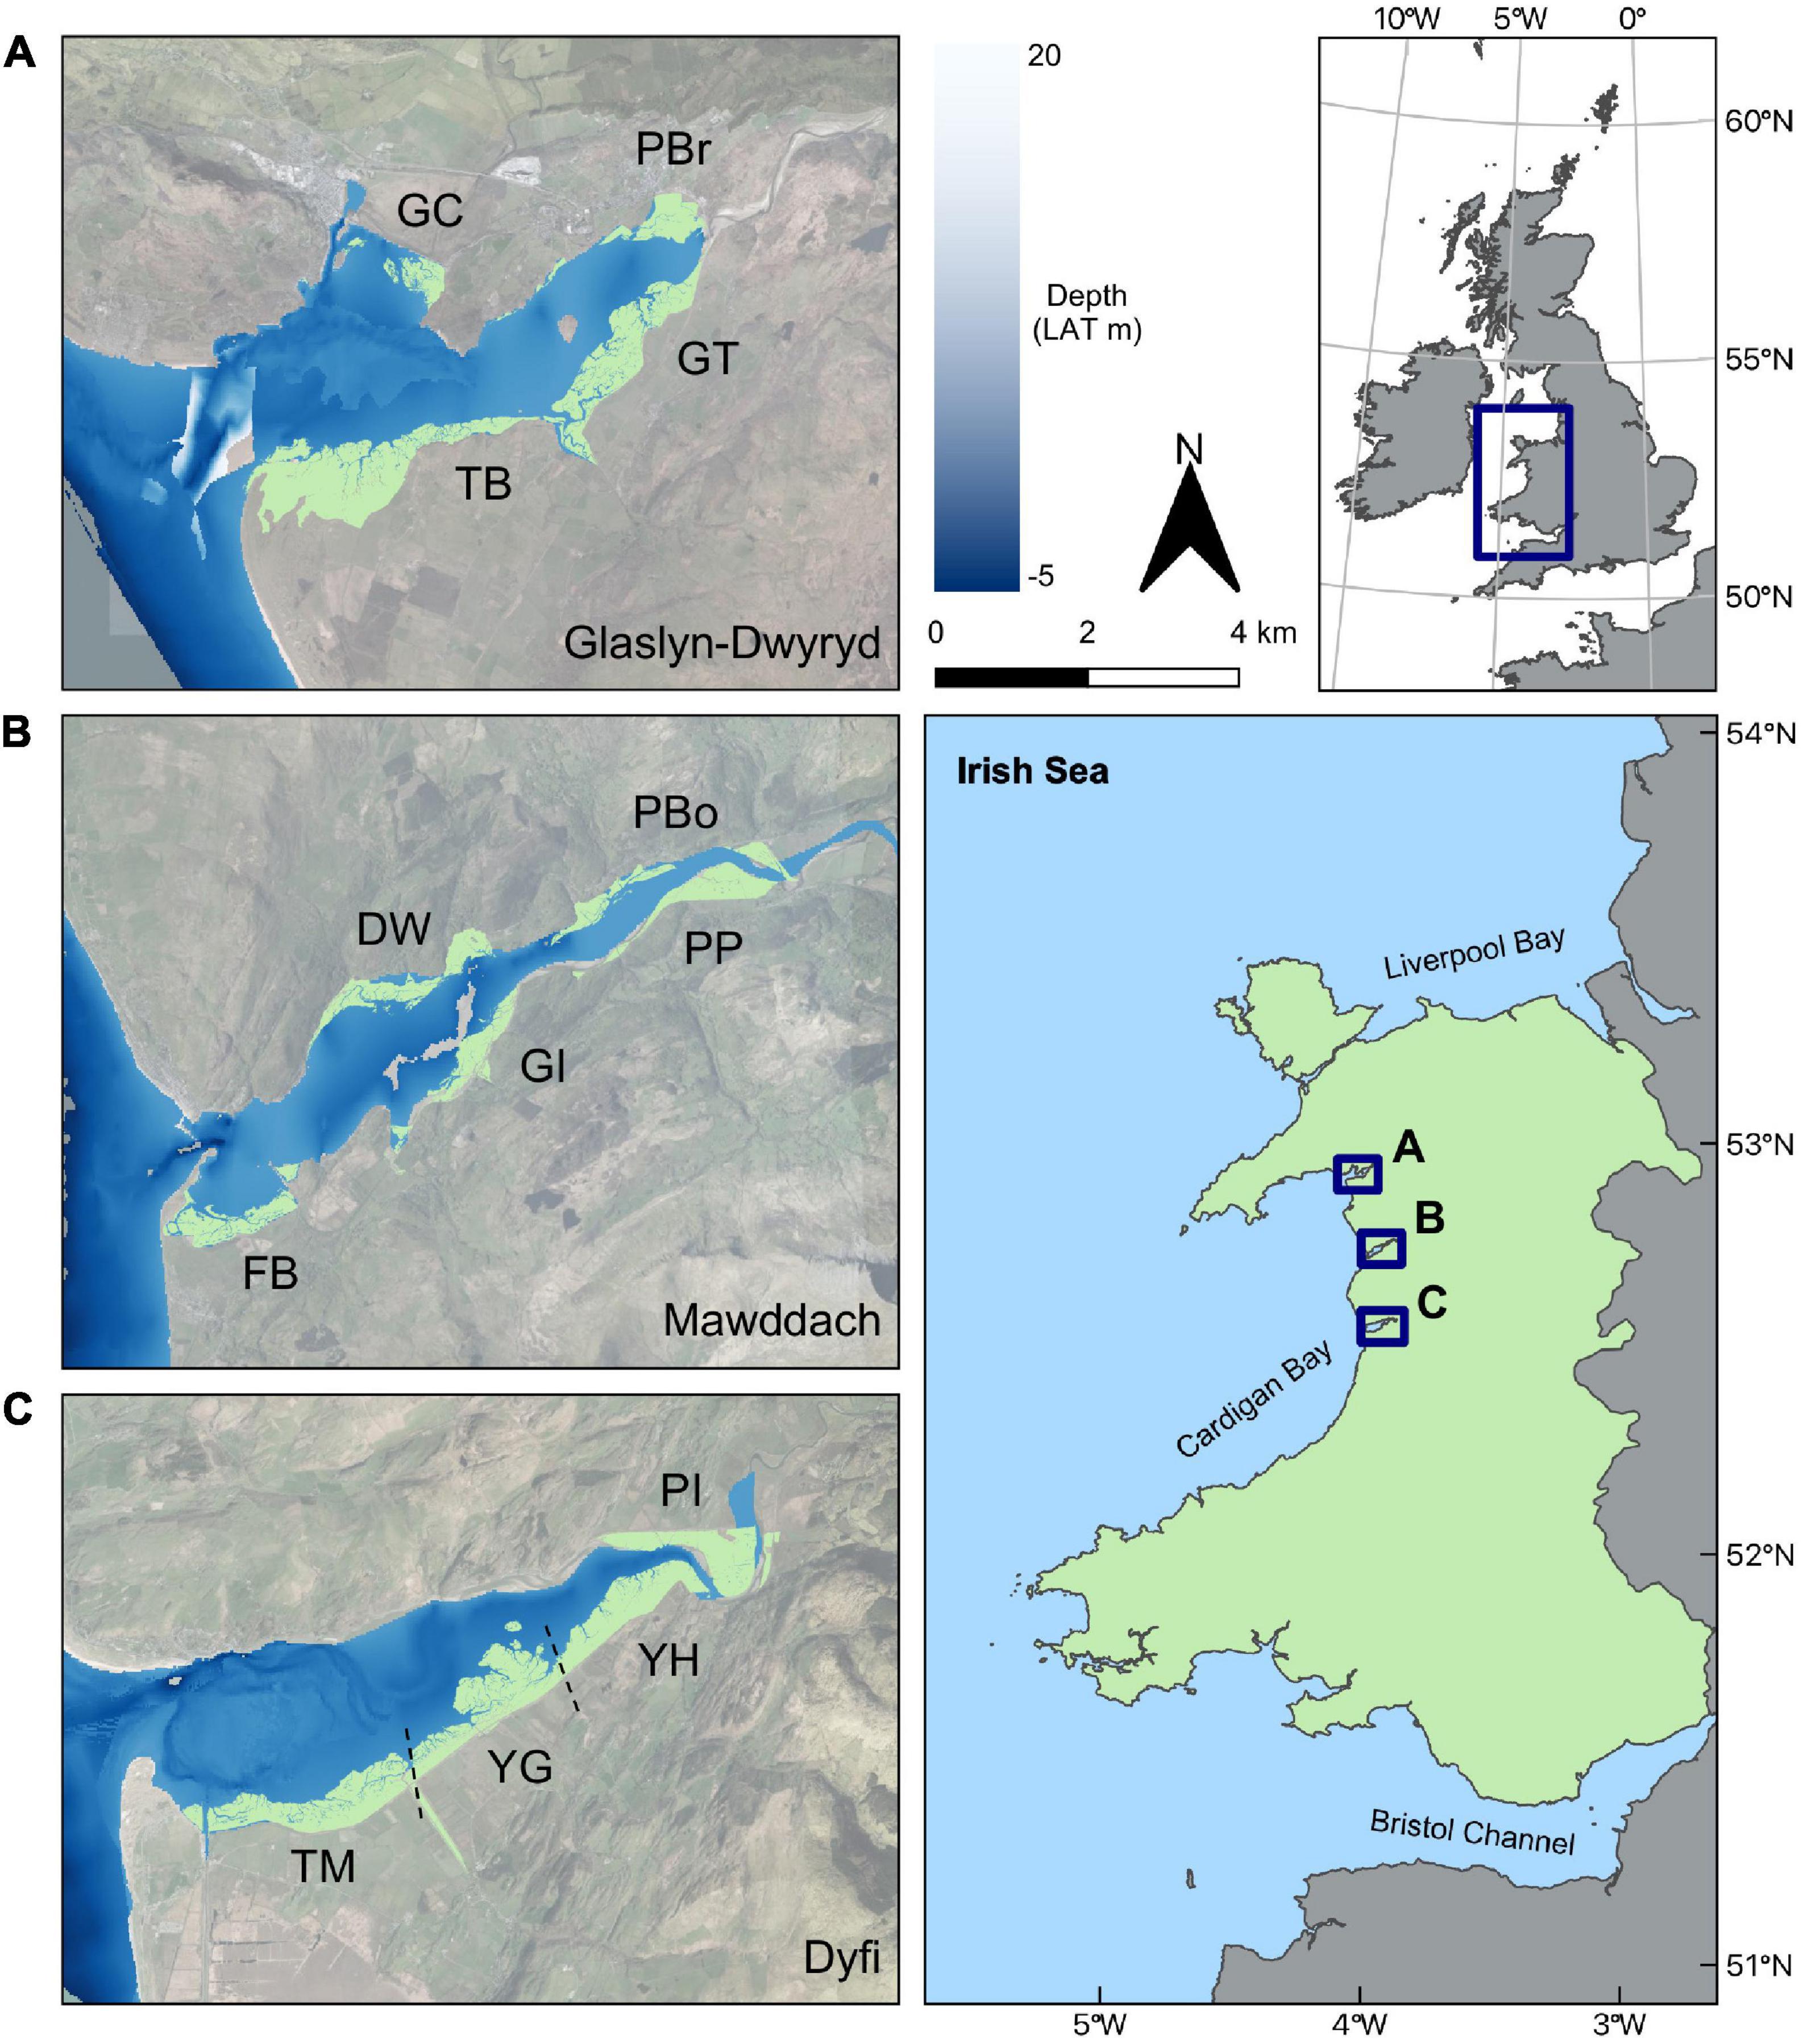
Figure 2. Locations of the three estuary complexes in Cardigan Bay, West Wales, United Kingdom: (A) Glaslyn-Dwyryd, (B) Mawddach, and (C) Dyfi. Marsh sites in (A–C) are shown in light green color. Labels refer to the names of salt marsh sites (GC, Glaslyn Cob; TB, Traeth Bach; GT, Glastraeth; PBr, Pont Briwet; FB, Fairbourne; DW, Dwynant; GI, Garth Isaf; PP, Penmaenpool; PBo, Pont Borthwnog; TM, Traeth Maelgwyn; YG, Ynys Greigiog; YH, Ynys Hir, and; PI, Penmaen Isa). The estuarine depth scale is in meters relative to the Lowest Astronomical Tide (LAT).
Processing Aerial Photographs
To measure change in salt marsh extent and tidal channel position over time, we used a collection of aerial photographs taken between 1946 and 2013. Only image sets that covered the entirety of each estuary were used with the exception of the image set from 1971–72 for the Dyfi estuary. This image set had two missing images, that represented 4% of the estuary coverage. Missing areas were excluded from further trend analyses (Supplementary Table 1). We scanned aerial photographs at a resolution of ca. 400 dpi and georeferenced them in a Geographic Information System (GIS) to British National Grid, using a Thin Plate Spline algorithm with Lancsoz resampling suited to coarse resolution historical image rectification. A combination of Ordnance Survey 1:25,000 raster maps (EDINA) and Environment Agency 1:7,500 orthorectified images from 2006 to 2009 (Phelan et al., 2011) provided basemaps to match the unrectified photographs to well-distributed control points including crossroads, building corners and salt marsh creeks. Resulting georeferenced images had pixel sizes corresponding to ca. 0.25 × 0.25 m in the field.
We manually delineated marshes and channels for the entirety of each estuary at a scale of 1:7,500. To aid in distinguishing between features, aerial image contrast was set to 50% to exaggerate “dark” vegetated surfaces and wet channels from “light” bare tidal flats. Polygon vertices were placed every 10 meters along the margins of salt marshes and tidal channels. Marsh patches less than 5 m in diameter, creeks narrower than 10 m and unvegetated features in the interior of salt marshes, such as salt pans, were ignored. In most cases, salt marshes were bounded by embankments that allowed for simple identification of the landward marsh edge. An error term was calculated for each measure of marsh areal extent using the method outlined in Wernette et al. (2017). The channel edge was manually identified as the transition between light (dry) and dark (wet) pixels in each image. Condition of the tide when images were captured was not known, therefore a standard channel edge between years was difficult to justify. However, potential error of several meters would be offset by variation by tens of meters in channel position over time, so this method was considered acceptable.
Quantifying Geomorphic Change of Marshes and Channels
We used the GIS layers of marsh extent to calculate marsh area change over time. Next, we created four GIS layers per estuary to interpret temporal marsh and channel change between 1946 and 2013. Marsh and channel extents in each observation year (see Supplementary Table 1) were stacked in a GIS to classify extents in four ways: (1) a “saltmarsh geomorphic state” layer depicted where marshes had consistently eroded or expanded, fluctuated between erosion and expansion phases, or remained unchanged. Areas where the marsh had consistently occurred were classified as “stable.” Areas where salt marsh gain occurred were classified as “expanded.” Areas which had been vegetated and became bare were classified as “eroded.” Areas that had fluctuated between marsh being present, absent, and present again (or absent, present, absent) were classified as “dynamic.” (2) A “saltmarsh age” layer represented the number of years from a 2020 baseline back to when the marsh first appeared. Areas where marshes consistently occurred were classified as being older than the earliest image year. Since the exact year when a marsh appears will lie sometime between two image sets, an age range was given (between the older and newer of the compared aerial photographs). (3) A “saltmarsh-mudflat transitions” layer showed the number of times an area had fluctuated from saltmarsh to mudflat or mudflat to saltmarsh. (4) A “channel locational probability” layer represented temporal change in tidal channel movement across each estuary. We used the locational probability technique outlined by Graf (2000) to do this. This technique shows the probability that a channel will be found at a given point along the estuary, based on where the channel was previously observed. For example, if a channel was found in the same area in every photograph year, that area received a locational probability score of 100%. An additional set of maps were produced showing changes in marsh and channel position between successive image years.
To assess the relationship between marsh and channel movements, in a GIS we placed transects (perpendicular to estuary centerlines) every 200 m along the length of each estuary (Supplementary Figure 1) and measured the distances from the marsh land-boundary (back of the marsh, henceforth referred to as “land”) to (i) the seaward marsh edge and (ii) the nearest tidal channel for each timestamp. We also recorded the estuary width across each transect, distance from the top of the estuary where each transect was located, and which year an observation of marsh and channel location was made, to determine whether position in the estuary and observation year had a confounding effect on channel-marsh dynamics. Only transects where marshes occurred at least once during the survey period were used in this analysis. All distance measurements were expressed as percentage values of either estuary width (from one estuary bank to the other along a transect) or length (from the top to the bottom of an estuary), allowing for comparisons between the three estuaries.
River and Wind Influence on Channel Shifts
We collated daily average river flow, annual maximum river flow and annual flood event frequency data taken from a river gauge (float with counterweight) near the Dyfi estuary (ID: 64001; coordinates: 52°36′3″′N 3°51′17″W). Data was provided by the National River Flow Archive1 and was quality controlled before being made available for download. No post-processing of the data was therefore required (Robson and Reed, 1999). Daily wind speed and direction at Aberporth weather station (ID: 1198; coordinates: 1198, 52°8′21″N, 4°34′12″W) were taken from the Met Office Integrated Data Archive System (MIDAS) distributed by the British Atmospheric Data Centre2. We selected stations based on proximity to estuaries and availability of long temporal dataset ranges. Prior to analysis, wind speed data was screened for quality and completeness using methods outlined in Watson et al. (2015). MIDAS assign a “flag” to measurements that have an unreliable observation, and these were excluded from further analysis, as were duplicates. Any given year was only used in later calculations when the dataset held observations from ≥ 75% of days per year, and when each month had observations for ≥ 50% of days.
Statistical Analyses
We used a mixed effects model to determine the effect on the response variable “distance from the land to the seaward marsh edge” from four explanatory variables (1) “distance from the land to the nearest tidal channel,” (2) “estuary width,” (3) “distance from the estuary top,” and (4) “year.” Multicollinearity between predictor variables was established from Variance Inflation Factor (VIF) tables, whereby variables with VIF scores of > 3 were excluded (Zuur et al., 2010). Estuary width and distance from the estuary top were highly correlated (r = 0.75) so estuary width was subsequently dropped from further analysis. Since measures of distance from land to both the marsh edge and the nearest channel were made for the same transect over time, and since the use of all three estuaries in the analysis could introduce spatial autocorrelation, “year” and “estuary” were included as random factors in the maximal mixed effects model. Restricted maximum likelihood (REML) estimation and AIC scores determined that the inclusion of “estuary” significantly improved the model fit (Zuur et al., 2009), however, the inclusion of “year” did not and was subsequently dropped in favor of the most parsimonious model. The minimal adequate model was selected using likelihood ratio tests and AIC scores. All statistical analyses were carried out in the R software package. All variables were verified for homoscedasticity and normality and log transformations applied where necessary. The final model was checked for homoscedasticity using the “cftest” function of the “multcomp” package (Hothorn et al., 2016).
We also used a time series analysis to determine whether the response variables “daily average river flow,” “annual maximum river flow,” and “annual flood event frequency” (between 1963 and 2013), as well as “daily average wind speed,” and “daily average wind direction” (between 1957 and 2017), had changed significantly over time (Crawley, 2012). Change over time was first detrended from seasonal variability using the “stl” function; a locally weighted regression procedure (Cleveland et al., 1990). Mixed Effects models were then used to determine whether applying both “seasonal” and “long term” trend fits (model 1) better explained change in each of the response variables over time than when a “seasonal” fit alone was considered (model 2). If model 1 was significantly different (assessed by Chi2) and had a lower AIC value than model 2, this would indicate a long-term trend existed in the data. Model fixed effects were the “seasonal” and “long term” trend fits. The REML approach was used on each Mixed Effects model for a fair selection of the parsimonious model (Zuur et al., 2009). “Year” was designated as a random effect. We fitted linear regression models (continuous data) and generalized linear models with Poisson error distribution (count data) to determine whether response variables changed over time. See Supplementary Material 1 for further details on the full statistical analysis used.
Results
Channel-Marsh Evolution in Estuaries
Tidal channels and salt marshes changed considerably over the 1946–2013 period (Figure 3). Tidal channels showed progressive migration and course switching in all parts of each estuary (Figure 3; greyscale shading), except at the tops of the Mawddach (Figures 3A–F), and Dyfi (Figures 3G–I) estuaries where channel position was largely fixed. Channel shifts were frequently followed by both marsh erosion and expansion. Two marshes in the Glaslyn-Dwyryd and Mawddach (GC and GI) emerged once tidal channels moved away from the shore, allowing 66 ha of marsh to develop between 1946 and 2013 (Figure 4 and Supplementary Figures 2, 3). In contrast, channel migration toward the south-western GT marsh in the Glaslyn-Dwyryd estuary eroded the marsh by as much as 330 m between 1946 and 2013 (Supplementary Figure 2). The relative proportions represented by each category of salt marsh geomorphic behavior (stable, expanding, eroding or dynamic), age and number of state changes between marsh and mudflat were similar between estuaries. Approximately a third of marsh area per estuary remained stable over the 67 observation years (Figure 3; brown area in left panels, dark red in middle panels, light blue in right panels) and were concentrated in the inner estuary or along the rear of wide marshes (i.e., at higher elevations) in the outer estuary. The rest either eroded, expanded or were dynamic (both erosion and expansion).
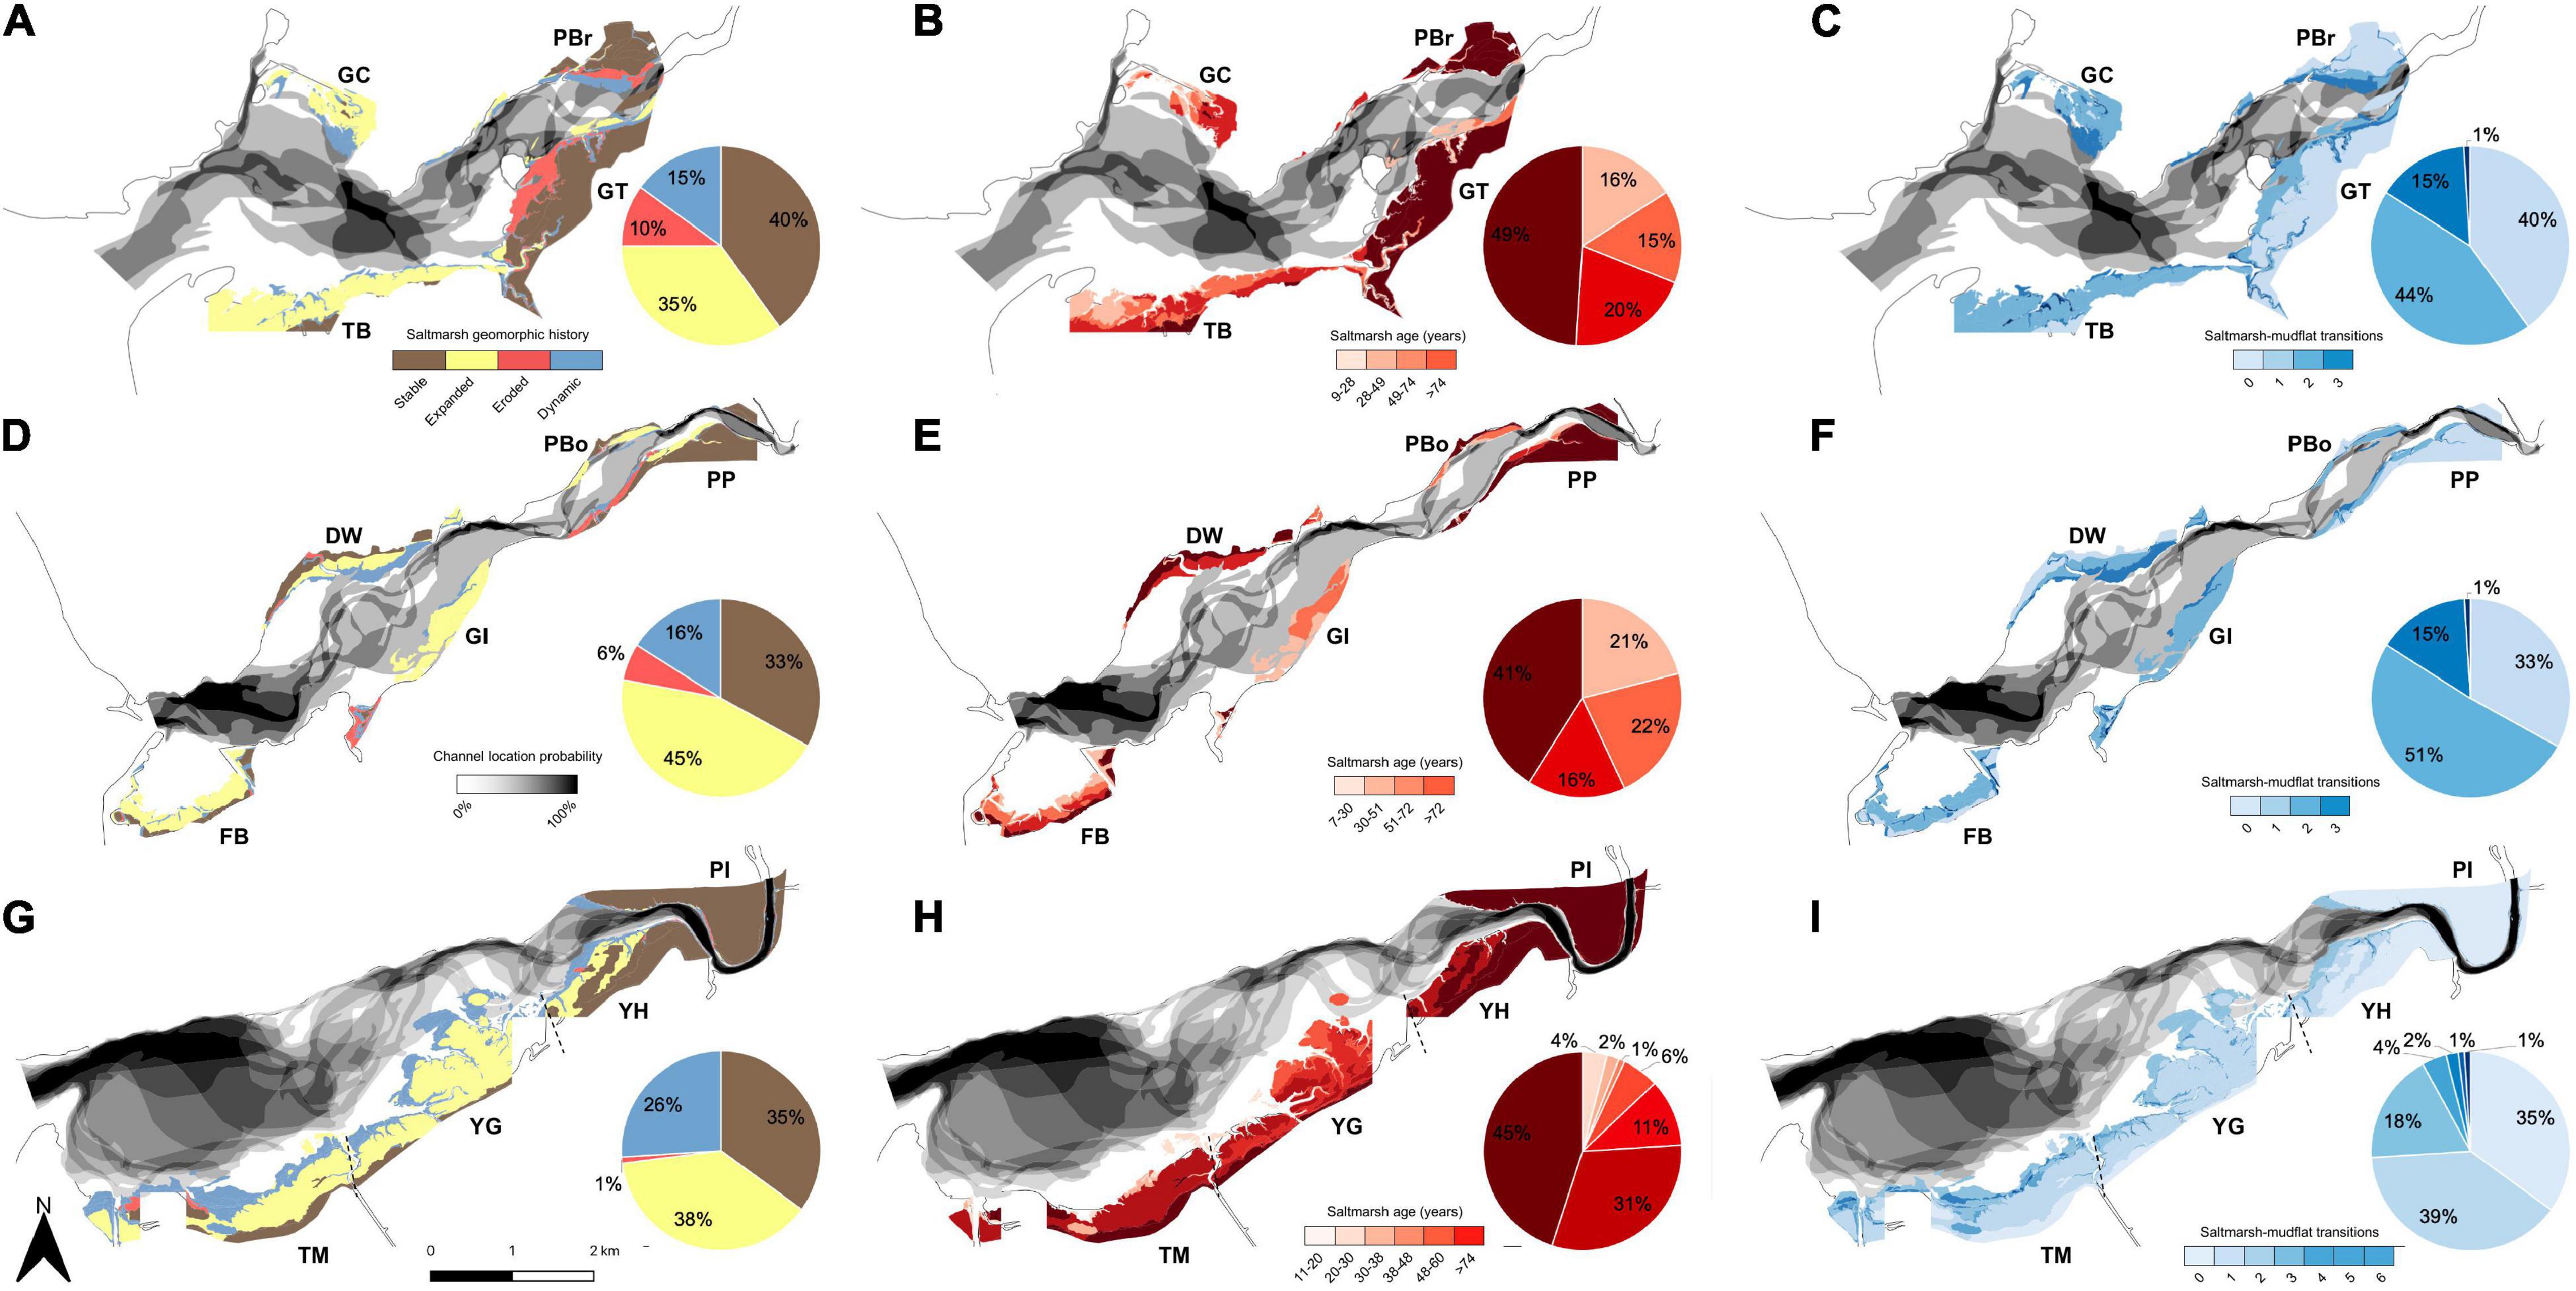
Figure 3. Tidal channel and salt marsh change for the (A–C) Glaslyn-Dwyryd, (D–F) Mawddach and (G–I) Dyfi estuaries between 1946 and 2013. Channel shifts are indicated in gray to black: the darker the color the more stable (spatially fixed) the channel over the observation period. Left panels (A,D,G) show how marshes have changed over time. Brown areas represent stable marshes that remained unchanged throughout the study period. Yellow and red areas represent areas that expanded and eroded, respectively. Blue areas represent dynamic marshes that cycled between phases of erosion and expansion. The middle panels (B,E,H) show marsh ages (darker colors are older marshes). Right panels (C,F,I) show number of times an area transitioned between marsh and mudflat states (dark colors represent more transitions). Pie charts show the percentage of total marsh area represented by each category. Labels refer to the names of salt marsh sites (GC, Glaslyn Cob; TB, Traeth Bach; GT, Glastraeth; PBr, Pont Briwet; FB, Fairbourne; DW, Dwynant; GI, Garth Isaf; PP, Penmaenpool; PBo, Pont Borthwnog; TM, Traeth Maelgwyn; YG, Ynys Greigiog; YH, Ynys Hir, and; PI, Penmaen Isa).
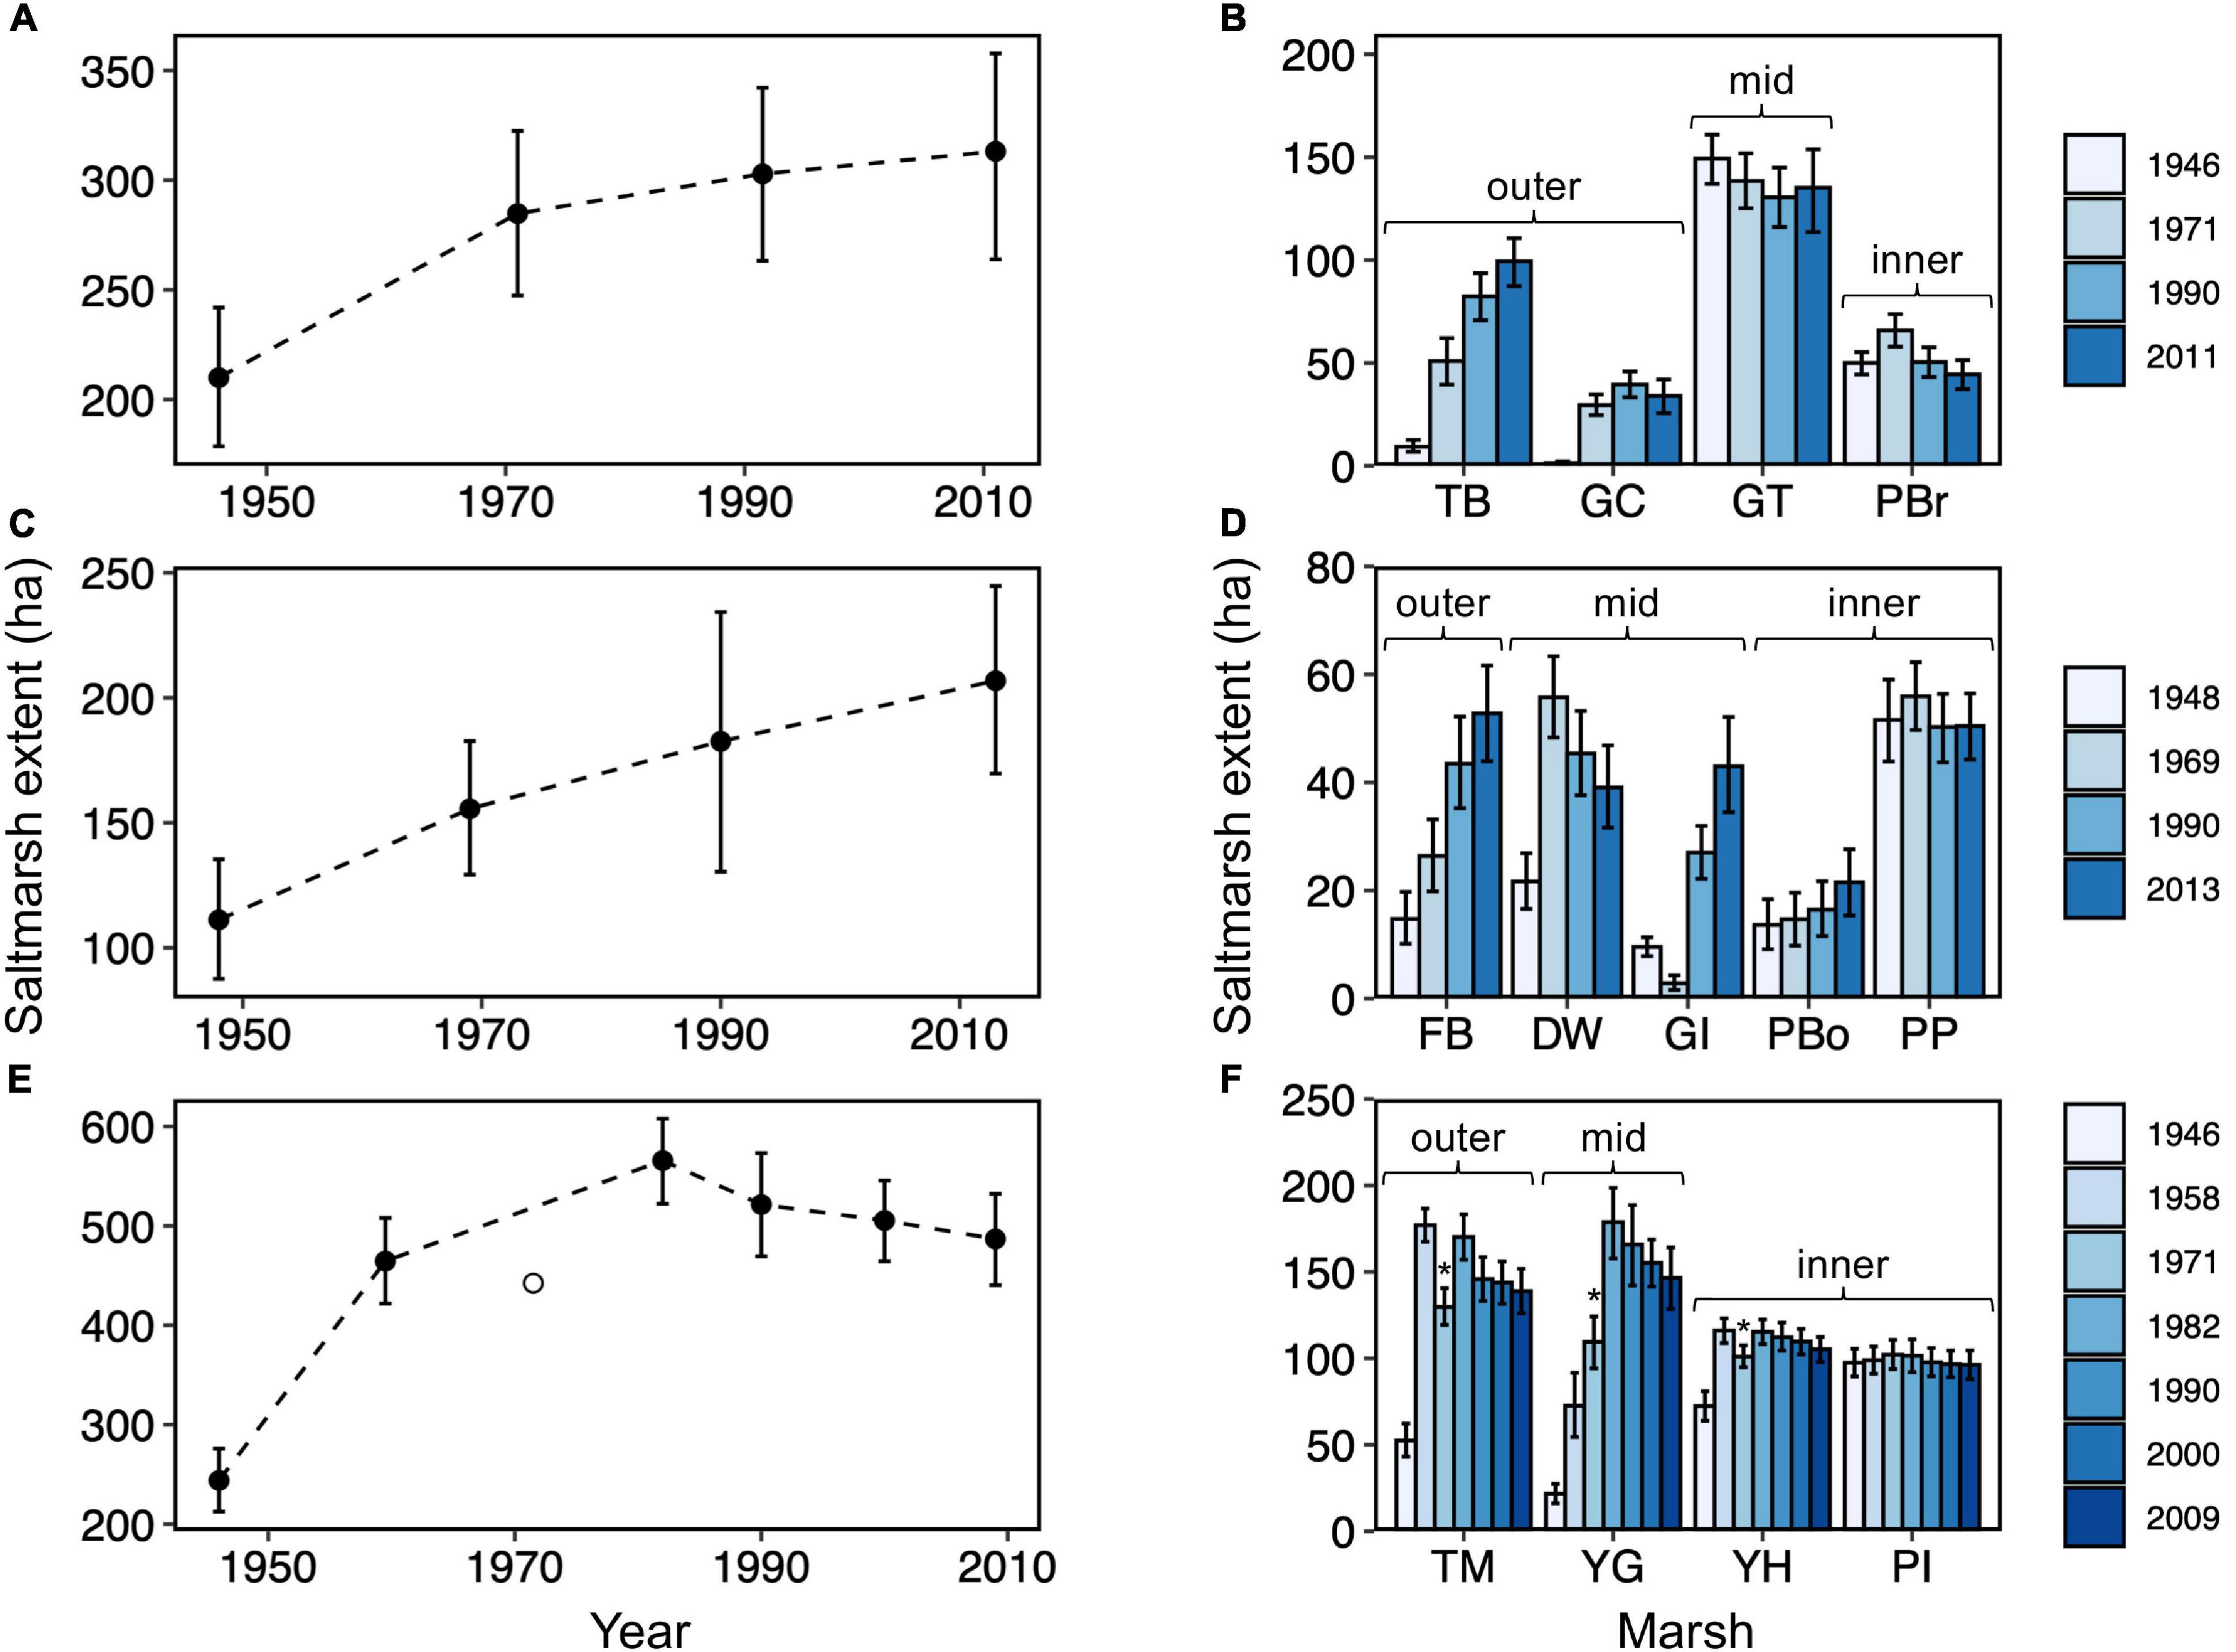
Figure 4. Change in salt marsh extent between 1946 and 2013 for the Glaslyn-Dwyryd (A,B), Mawddach (C,D), and Dyfi (E,F) estuaries, as observed at the estuarine scale (A,C,E) and at the individual marsh scale (B,D,F). Labels refer to the names of salt marsh sites (GC, Glaslyn Cob; TB, Traeth Bach; GT, Glastraeth; PBr, Pont Briwet; FB, Fairbourne; DW, Dwynant; GI, Garth Isaf; PP, Penmaenpool; PBo, Pont Borthwnog; TM, Traeth Maelgwyn; YG, Ynys Greigiog; YH, Ynys Hir and PI, Penmaen Isa). Vertical error bars represent 95% confidence interval in marsh extent. The hollow circle (E) and asterisks (F) indicate marsh extent measurements that were lower than expected due to missing aerial images.
Overall, there was a greater tendency for marsh expansion (35–45% in Figure 3; left panel, yellow areas) than erosion (1–10% in Figure 3; left panel, red). Expansion was mostly in the outer estuary or along the margins of stable marshes of the inner estuary (Figure 3; left panel, yellow). The number of transitions between marsh and mudflat states increased the further marshes developed out from the coast and into the estuarine basin (Figures 3C,F,I; right panel). These high-transition areas, also represented as “dynamic” areas by the blue color in left panels of Figure 3, were especially pronounced in the Dyfi estuary, representing 26% of all geomorphic states. Overall, marsh area per estuary expanded by 120, 235, and 162% for the Glaslyn-Dwyryd, Mawddach, and Dyfi estuaries, respectively (Figures 4A,C,E). Dyfi estuary experienced the fastest rise in marsh extent to a peak of 565.7 ha in 1982, followed by a moderate decline (Figure 4E). Marsh expansion was concentrated in the outer estuary and along all mid estuary marshes (except “GT”: Figure 4B) whilst inner estuary marshes remained relatively stable (Figures 4B,D,F).
All three estuaries had local marsh area loss compensated for by marsh expansion elsewhere in the estuary. We recognized three geomorphic types of compensatory coupling of expansion with erosion (Figure 5). Figure 5 and Supplementary Figures 2–4):
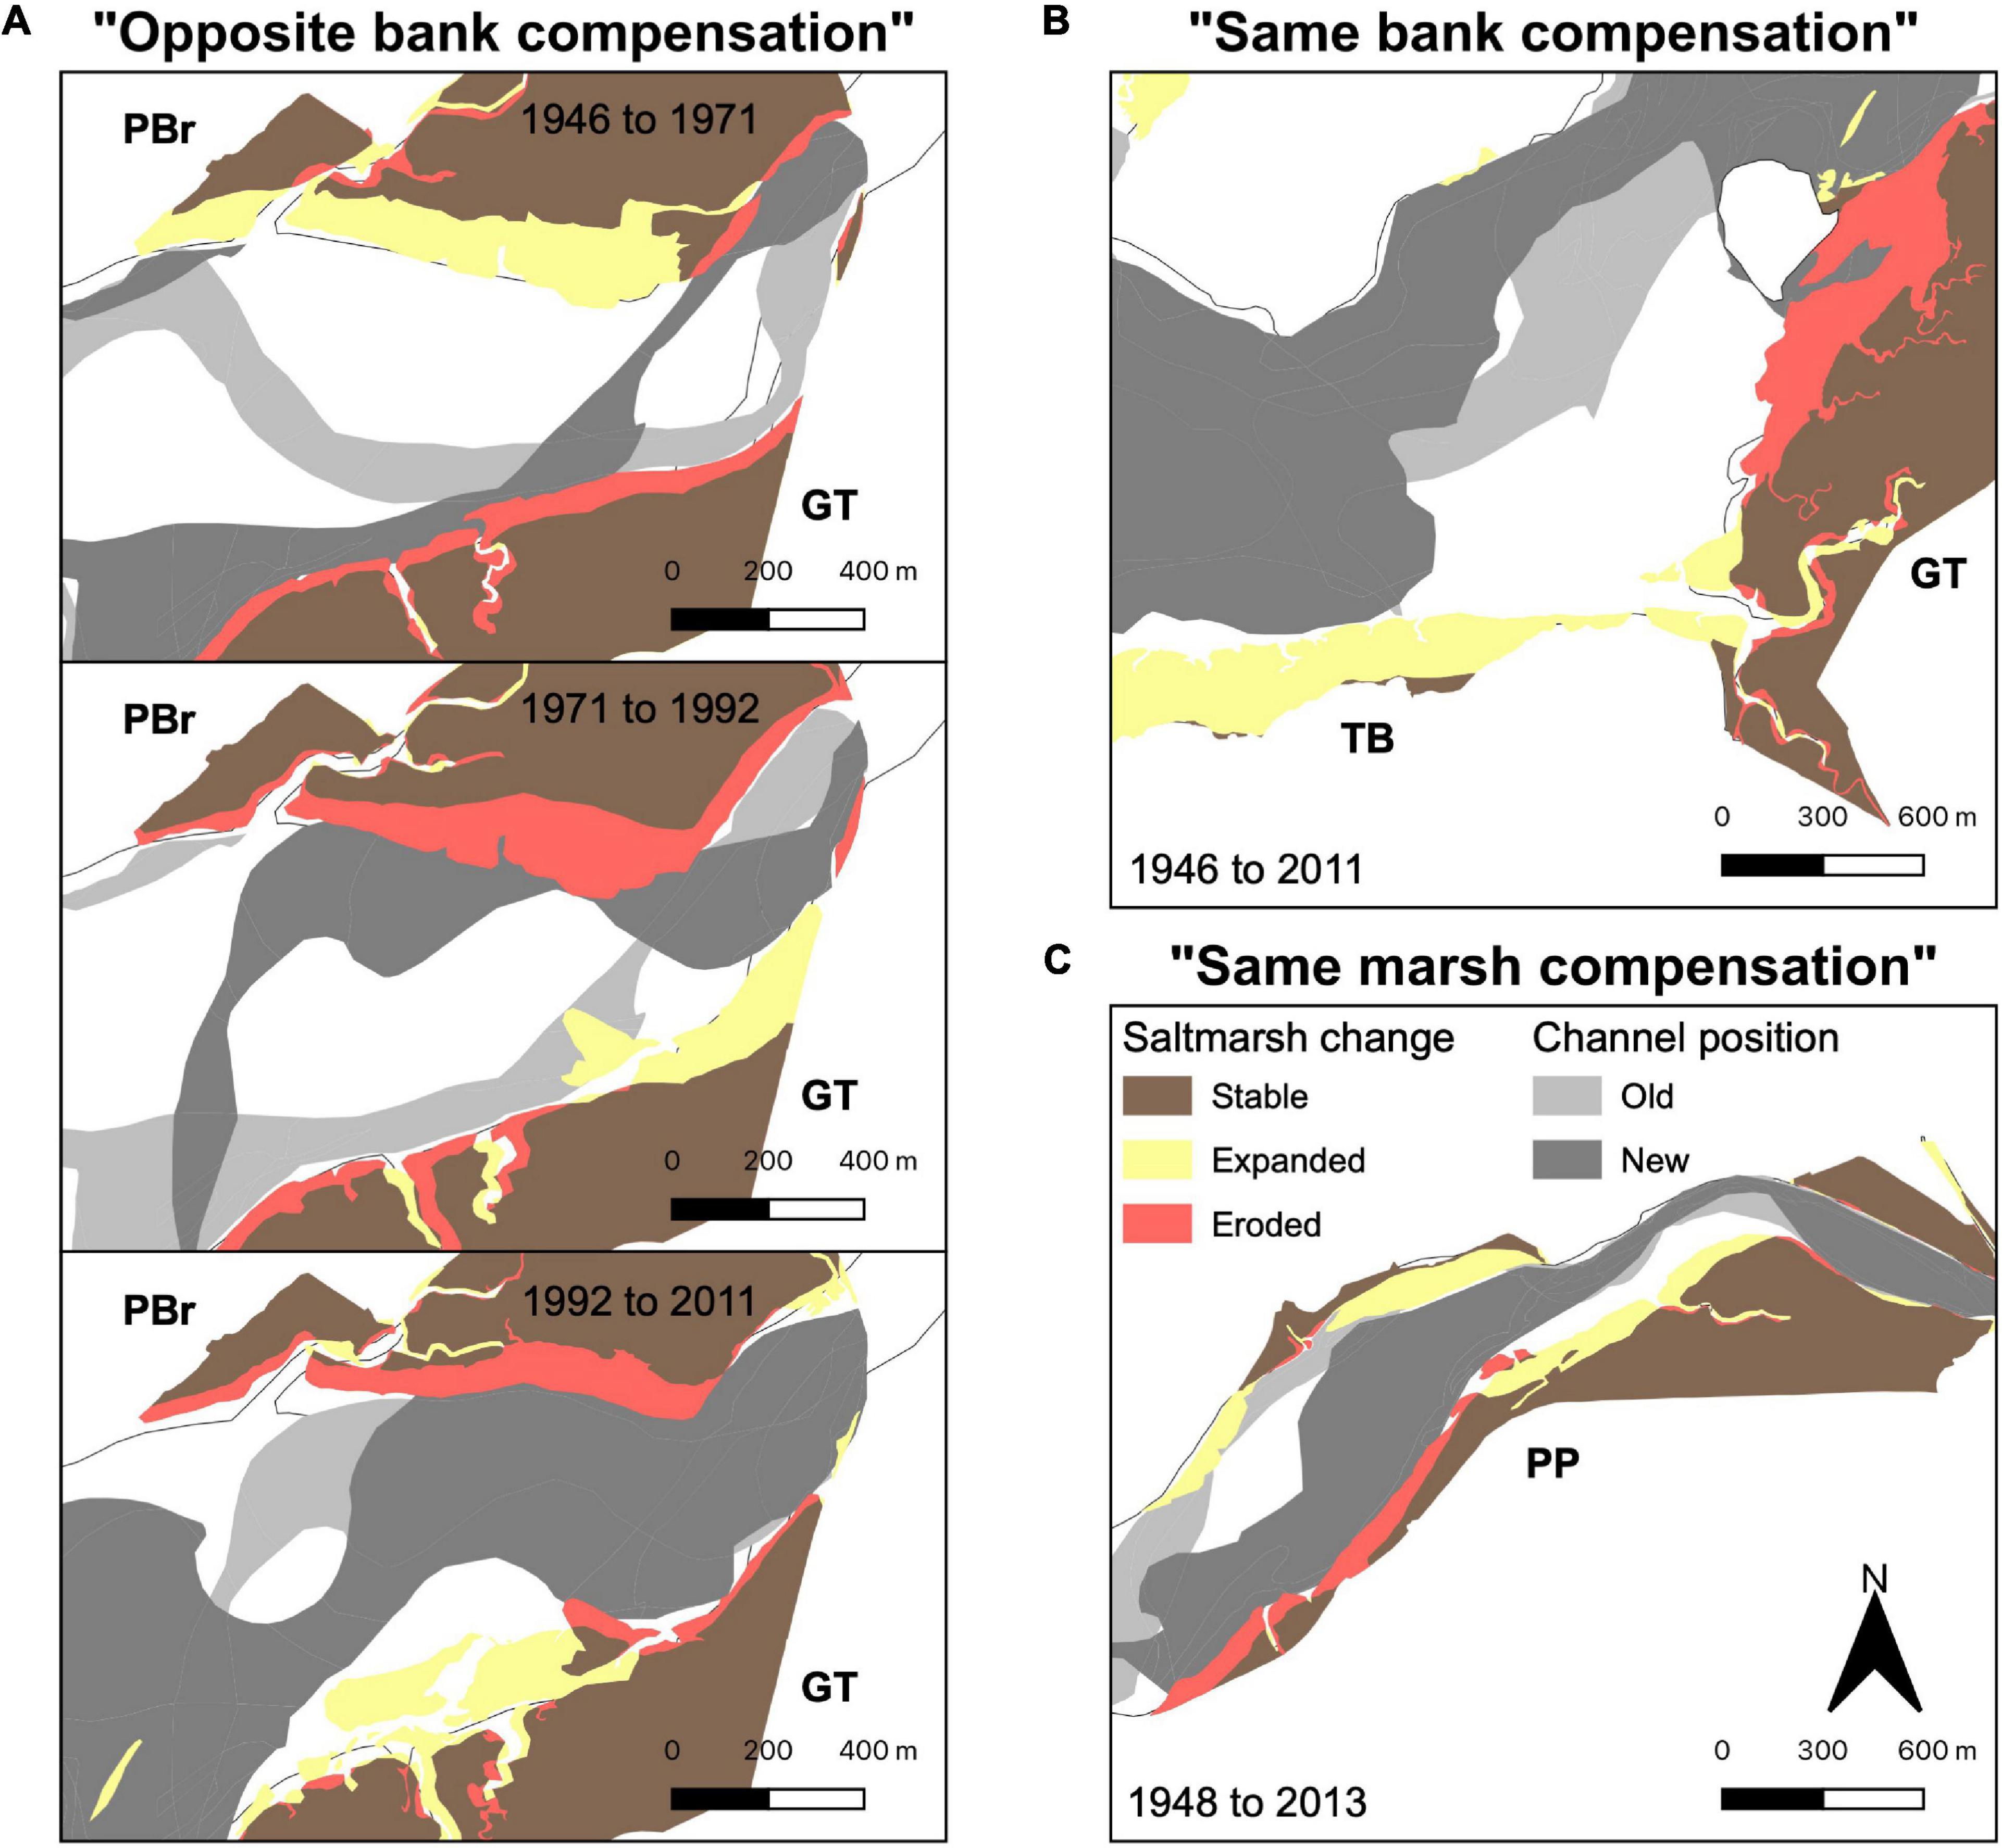
Figure 5. Illustrations of three modes of compensatory coupling of salt marsh erosion and expansion. (A) Opposite bank compensation erosion on one estuary bank is associated with expansion on the opposite bank. (B) “Same bank compensation”: loss at one marsh is followed by expansion at another. (C) “Same marsh compensation”: simultaneous erosion and expansion in the same marsh. Yellow, red and brown represent marsh gain, loss and no change, respectively. Light gray areas demarcate the position of tidal channels in the earlier year, whilst dark gray areas show tidal channel positions in the later year. Figures (B,C) relate to the full study duration, whilst (A) show three timesteps to illustrate cyclicity in switching between estuary banks. Labels refer to the names of salt marsh complexes (GC, Glaslyn Cob; TB, Traeth Bach; GT, Glastraeth; PBr, Pont Briwet; FB, Fairbourne; DW, Dwynant; GI, Garth Isaf; PP, Penmaenpool, and; PBo, Pont Borthwnog). Changes in marsh and channel configuration for each timestep can be seen in Supplementary Figures 2–4.
1. “Opposite bank compensation”: marsh erosion on one estuary bank (red) coincided with marsh expansion on the opposite bank (yellow). This type was often cyclical (Figure 5A; color pattern switching banks). From 1946 to 1971 in the Glaslyn-Dwyryd estuary, the northern bank PBr marsh expanded by 4.5 m yr–1 whilst the southern bank GT marsh eroded by 1.5 m yr–1; this trend reversed in 1971–2011, with PBr eroding by −3 m yr–1 and GT expanding by 3 m yr–1 (Figure 5A and Supplementary Figures 2A–C). Similarly, in the Mawddach, the northern DW marsh eroded by 1.5 m yr–1 between 1969 and 2013, whilst the southern GI marsh expanded 6 m yr–1 to compensate (Supplementary Figures 3A–C). Between 1948 and 2013 in the Mawddach, the northern PBo marsh expanded by 1 m yr–1, whilst the southern PP marsh eroded by 1 m yr–1 (Supplementary Figures 3A–C).
2. “Same bank compensation”: erosion and expansion coinciding in different marshes on the same bank (Figure 5A). In the Glaslyn-Dwyryd, erosion by −3 m yr–1 of the GT marsh mirrored a 2.5 m yr–1 expansion of the TB marsh between 1946 and 2011 (Figure 5B and Supplementary Figures 2A–C). In the Dyfi estuary, TM eroded as YG expanded between 1961 and 1971 (Supplementary Figure 4B). Between 1971 and 1982, YH eroded as YG and TM expanded (Supplementary Figure 4C). Between 2000 and 2009, marshes between TM and YG emerged as marshes along the rest of estuary eroded (Supplementary Figure 4F).
3. “Same marsh compensation”: erosion and expansion coinciding in a single marsh. Between 1948 and 2013 in the Mawddach, the southern PP marsh eroded by 1 m yr–1 whilst the eastern portion expanded at a similar rate (Figure 5C and Supplementary Figures 3A–C). In the Dyfi, erosion of western YG was mirrored by expansion on the eastern side of the marsh between 1982 and 1990 (Supplementary Figure 4D). The trend continued between 1990 and 2000, as the western TM erosion was also compensated by expansion along the eastern flank during this time (Supplementary Figure 4E).
Figure 6 shows the percentage of the estuary occupied by salt marsh and tidal channel over the study period, from the top to the bottom of each estuary (left to right in x-axis). The portion of estuary width occupied by marsh decreased from 75 to 95% at the top of estuaries to < 20% at the bottom of estuaries (Figure 6; green line). Marshes tended to be more stable in the top than the bottom of estuaries (Figure 6; smaller error bars on left than right on green line). Channels occupied 15–30% of the estuary width, except near the bottom of Mawddach and Dyfi estuaries where the proportions reached 80 and 65%, respectively (Figure 6; blue line). Temporal variation in channel position (Figure 6; error bars on blue line) was high along the length of each estuary and up to 75% of estuary width, except near the estuary tops, where variation dropped as the distance between channel and marsh reduced.
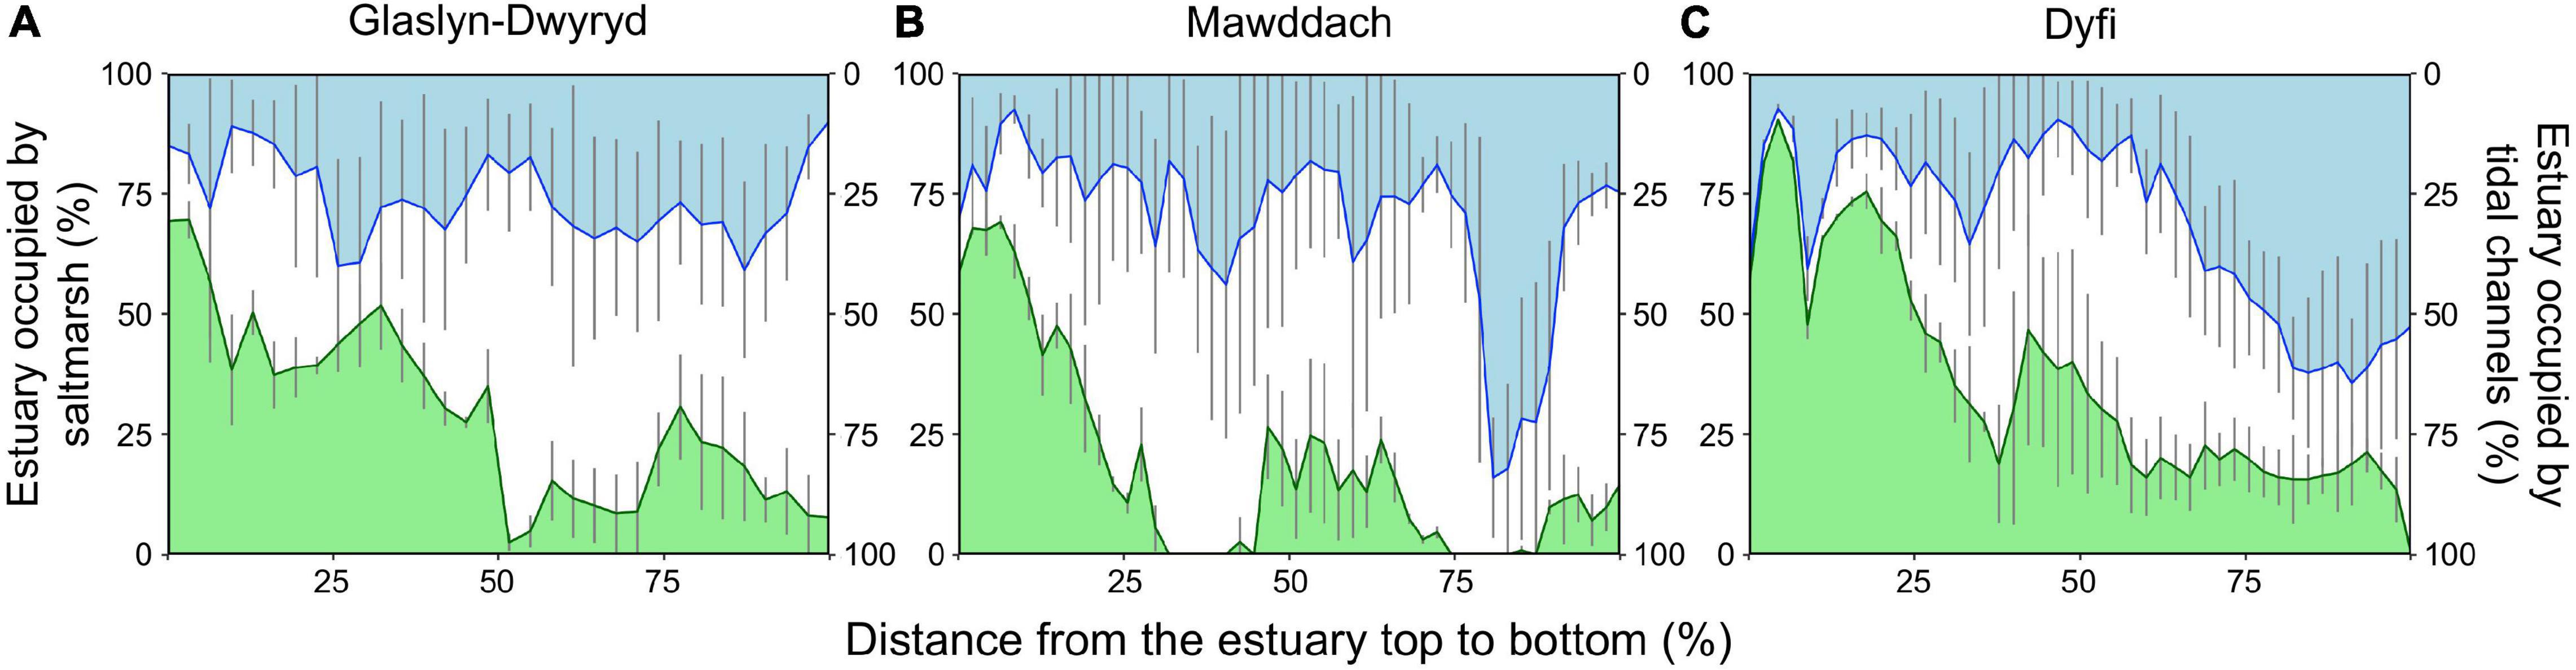
Figure 6. The mean percentage of estuarine widths occupied by salt marsh (green) and tidal channel (blue) between 1946 and 2013, as recorded at intervals of 200 m (expressed as a percentage) from the top (left) to the bottom (right) of the (A) Glaslyn-Dwyryd, (B) Mawddach, and (C) Dyfi estuaries. Estuary widths (y-axis) and lengths (x-axis) are expressed in percent to standardize across variation in estuarine size. Space between marsh and channel lines represents the portion occupied by mudflat. Vertical error bars represent standard deviation in marsh extent.
Table 1 and Figure 7 summarize the results of the Mixed Effects model. The further away the channel, the wider was a marsh (Table 1 and Figure 7A). However, the closer marshes got to the outer estuary, the smaller the portion of estuarine width they occupied (Figure 7B) and therefore the association between marsh width and channel proximity weakened toward the outer estuary (hence the interaction term in Table 1). The proportion of estuarine width occupied by marshes showed a slight, but significant increase from 1946 to 2013 (Figure 7C).
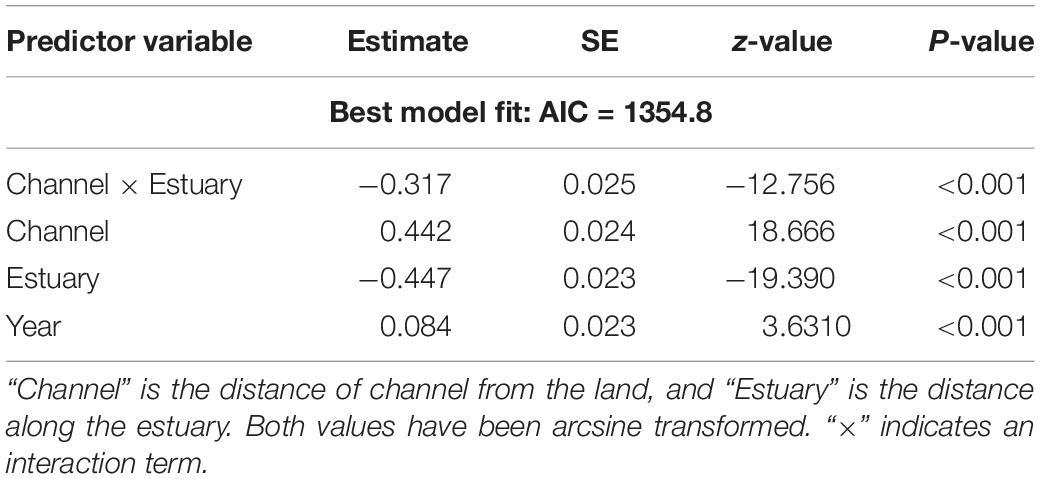
Table 1. Predictor variables of salt marsh width selected from a minimal adequate model (Mixed Effects model with “estuary” as a random intercept).
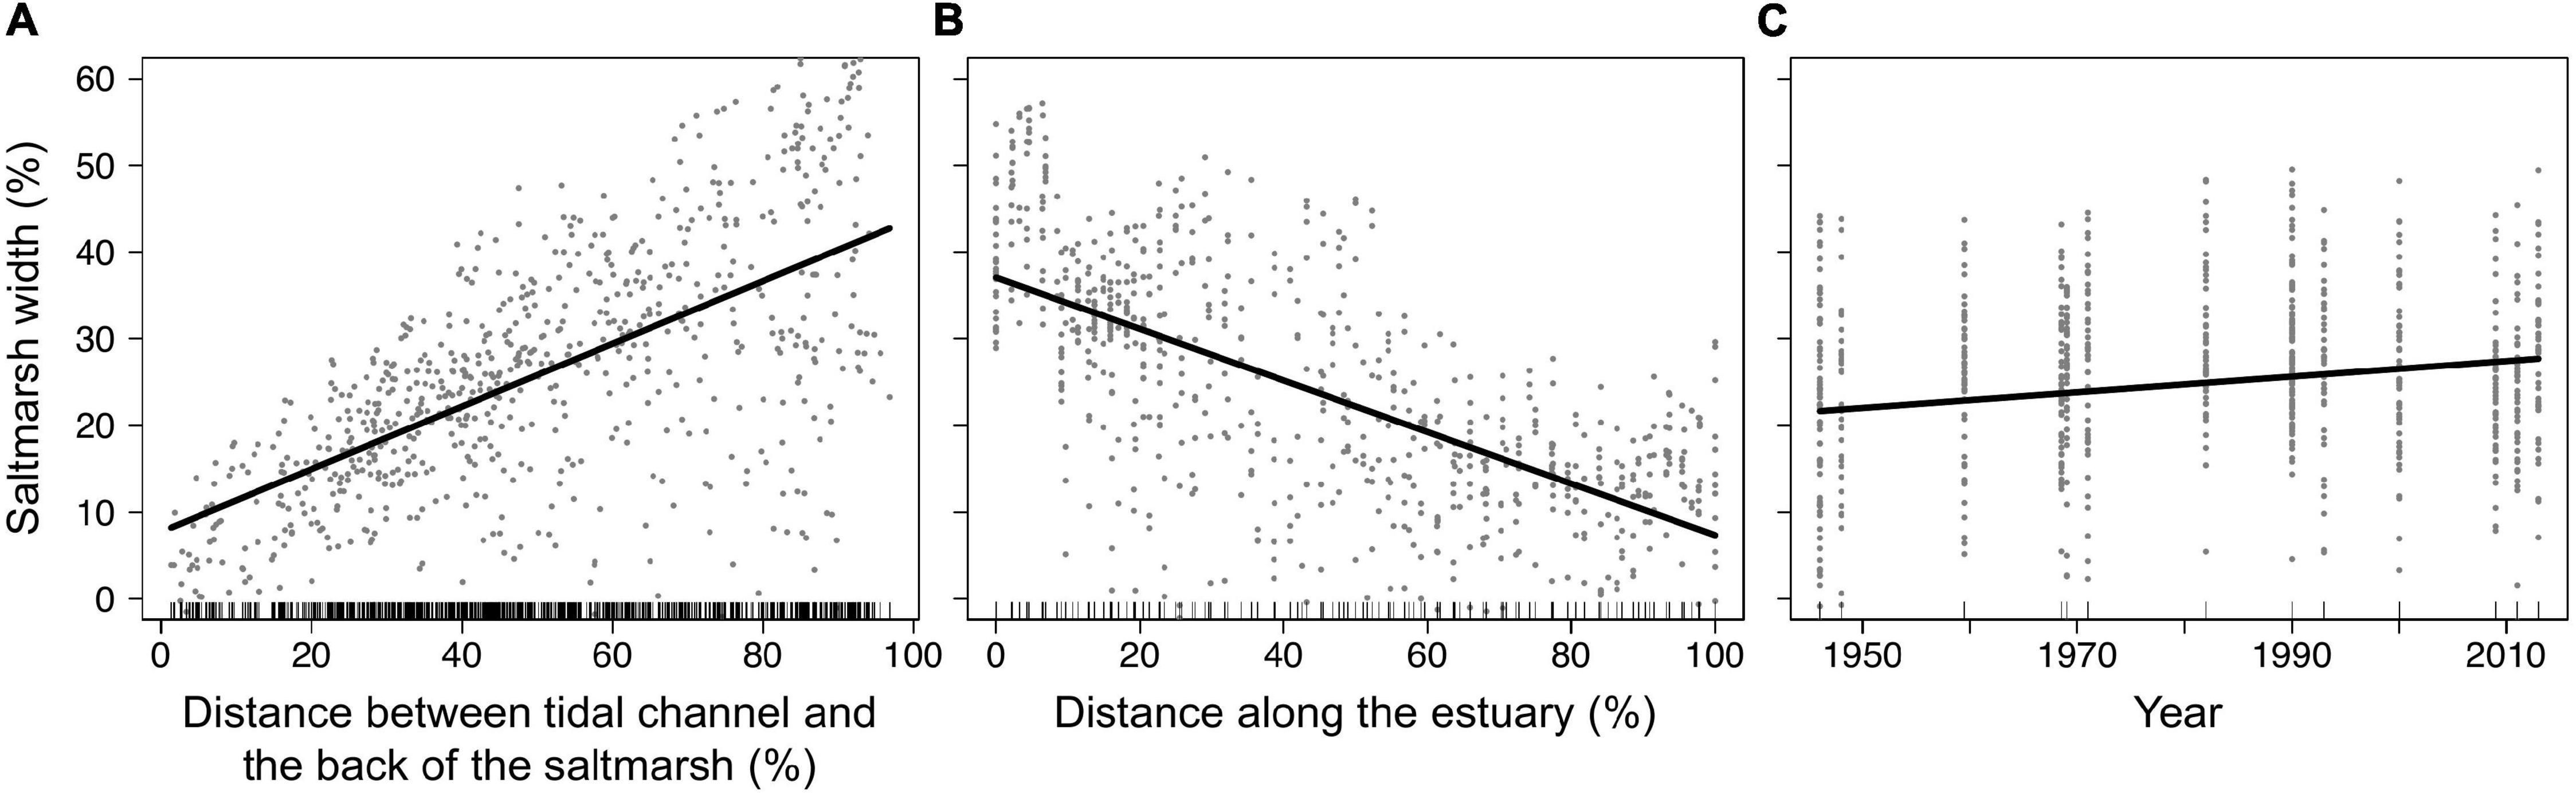
Figure 7. Relationships between the marsh width and key predictor variables: (A) Distance from the back of the marsh to the nearest tidal channel, (B) distance along the estuary from top (left) to bottom (right), and (C) year of survey (identified from a mixed effects model with “estuary” as a random intercept; Table 1). Measurements were standardized as a percentage of estuarine width [all y-axes and x-axis of (A)] or estuarine length [x-axis of (B)]. Data points represent distribution of standardized partial residuals. Solid lines represent model fit though the data. Tick marks along the bottom of each plot denote deciles of the distribution of each predictor value. See Supplementary Figure 5 for the interaction effect of channel and marsh position on the width of marshes.
Drivers of Marsh and Channel Dynamics
Figure 8 shows how wind parameters at a nearby weather station and river flow at the top of the Dyfi estuary varied over the study period. The wind and river parameters had high seasonal variability (Figures 8A–C; gray lines), however indications of any pattern of change (increase/decrease) over the 77-year observation period was either weak or absent: Change in annual average wind direction was weakly significant (Figure 8B), shifting toward a more westerly direction by 0.14 degrees a year between 1957 and 2017 [linear model: F(1, 59) = 5.413, p = 0.023, Adjusted R2 = 0.069]. The number of annual flood events (Figure 8D) showed a significant, but small, increase of 0.01 per year between 1962 and 2013 (Poisson model: AIC = 223.63, p = 0.043). No trend in annual average wind speed or daily average river flow could be detected (Figures 8A,C).
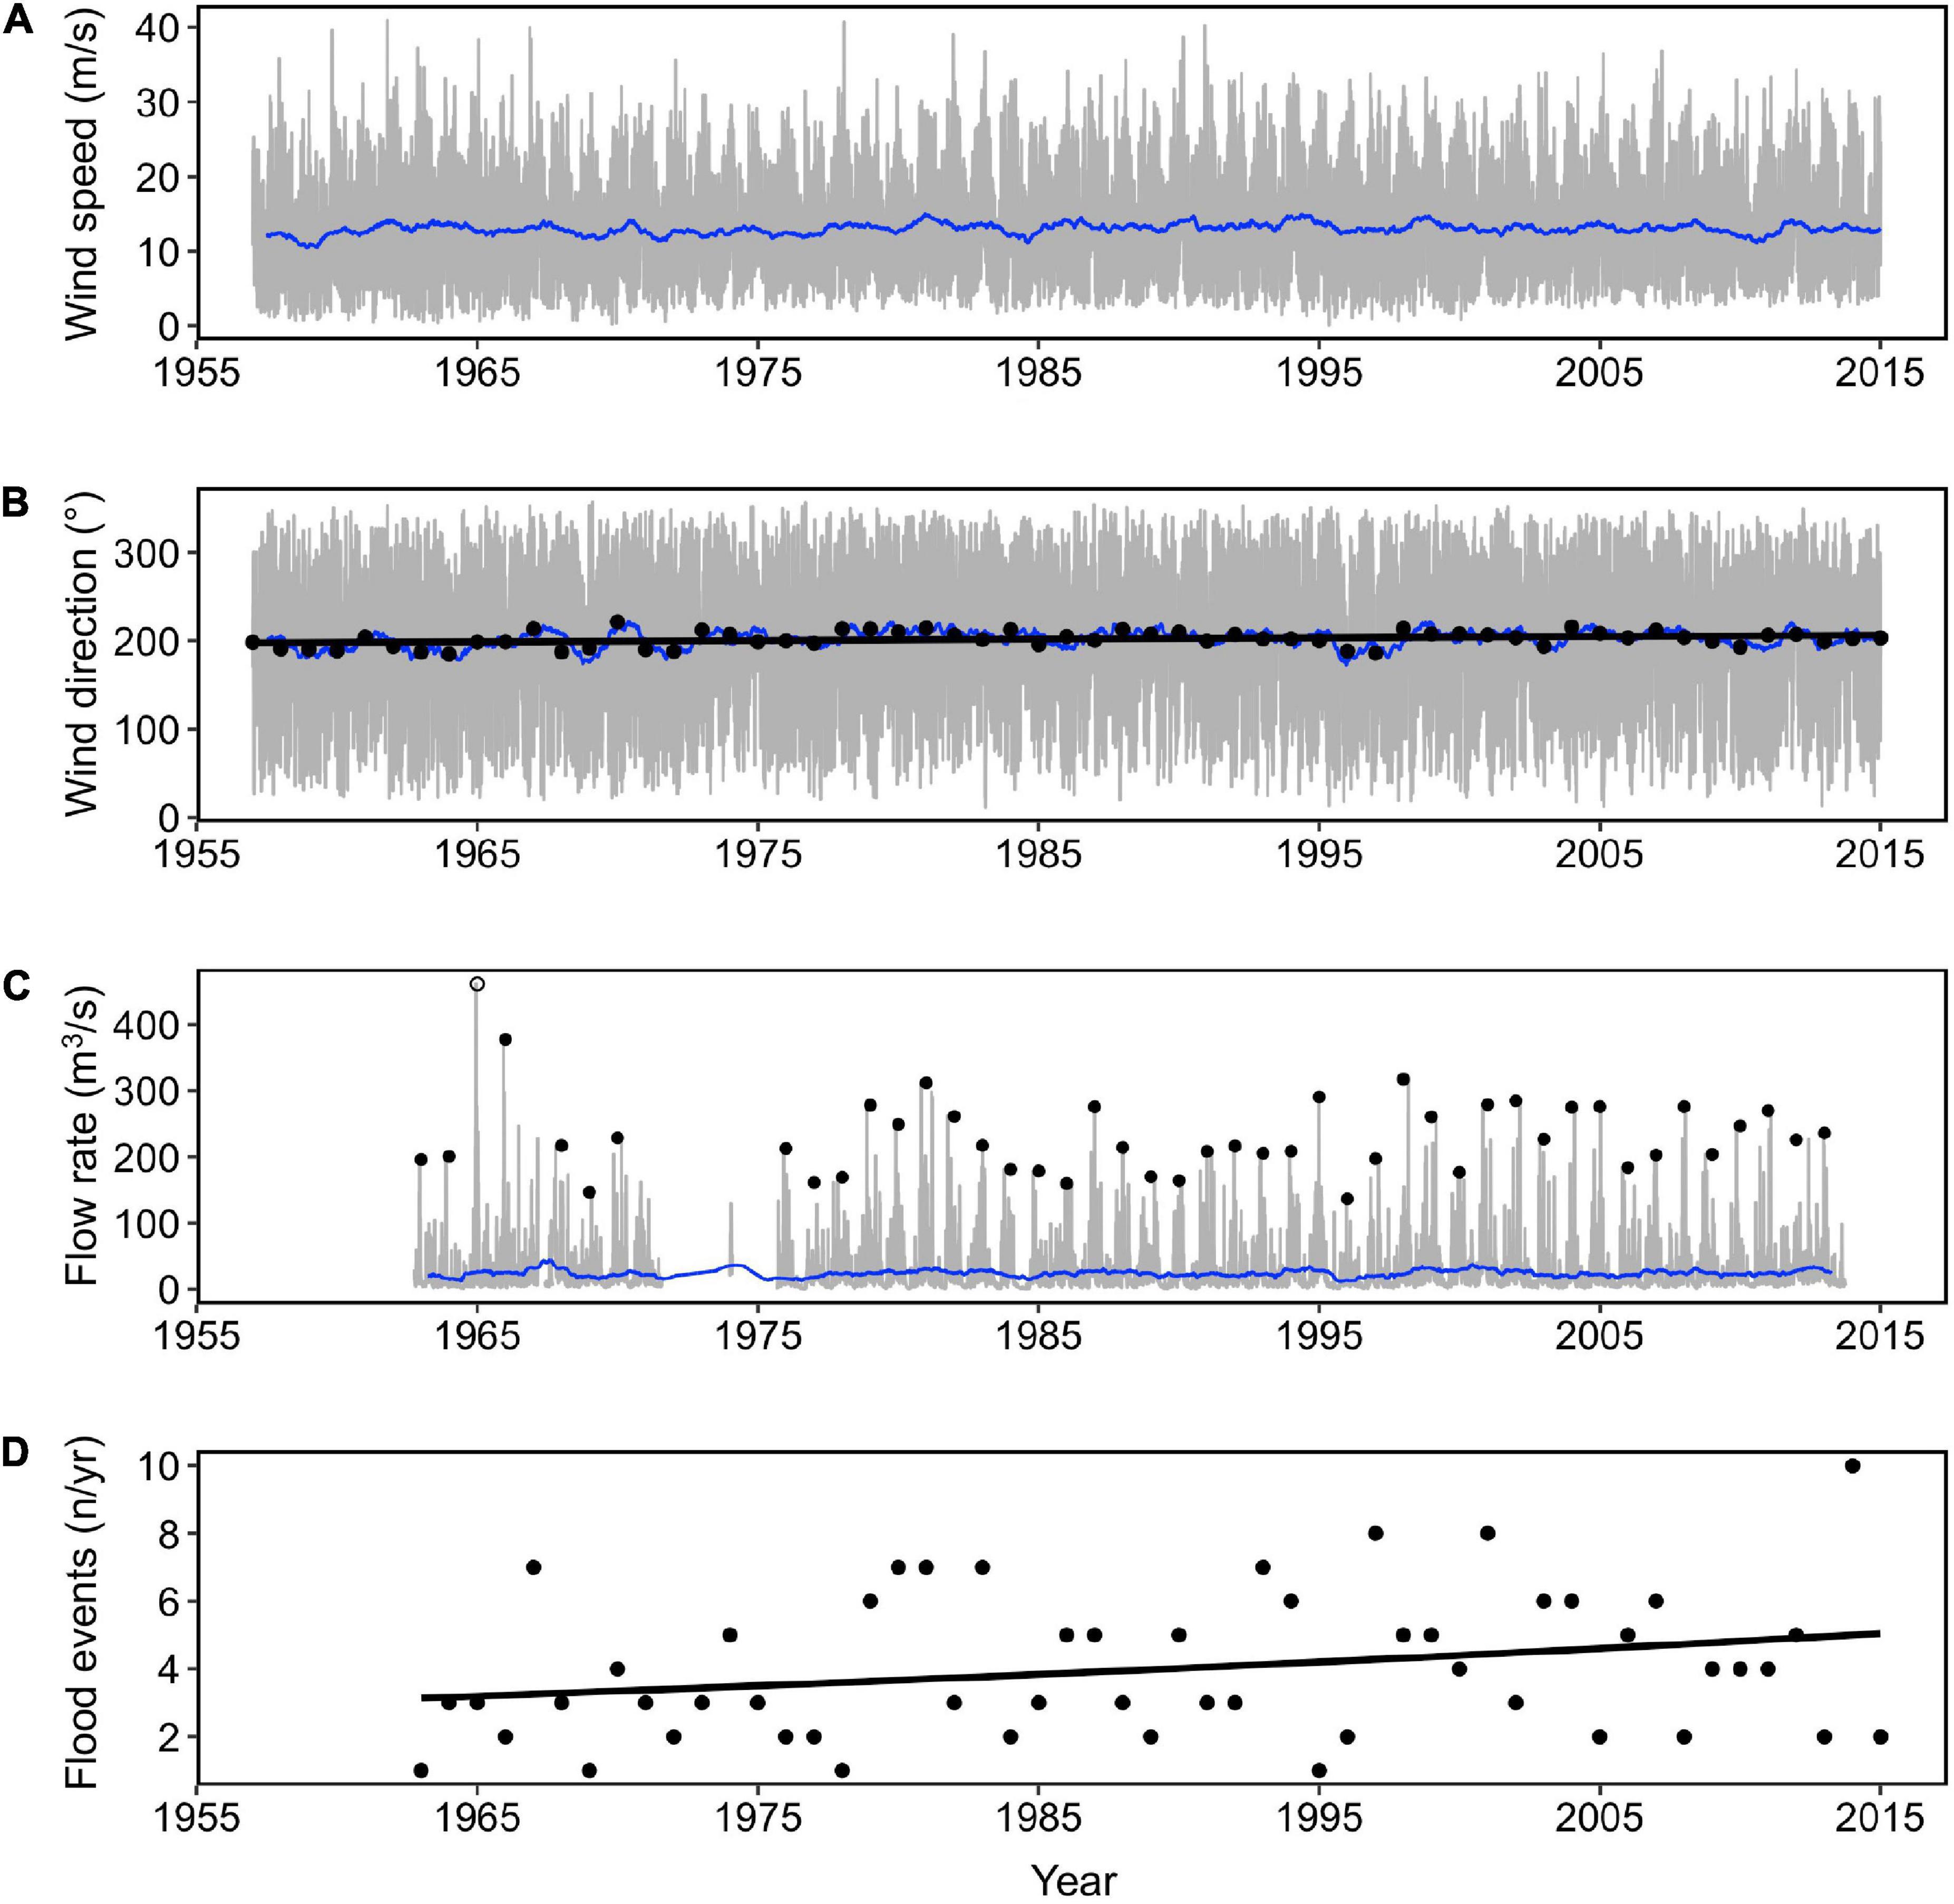
Figure 8. (A) Daily average wind speed (gray line) with annual moving averages (blue line), (B) daily average wind direction (gray line) with annual moving averages (blue line), and annual average wind direction (black circle) for the period 1957–2017 (wind station, station ID 1198, 52°8′21″N, 4°34′12″W). (C) Daily average river flow rate (gray line) with annual moving average (blue line), maximum annual flood event per water year (black circle), and (D) number of flood events per year (black points) for the period 1957–2017 (river gage, ID 64001, 52°36′3″N, 3°51′17″W). Black lines indicate fitted values for parsimonious models. Hollow circle indicates a single outlier, which was not included in the model fit for (C).
Discussion
We found estuarine saltmarshes exhibited large-scale resilience to erosion, despite individual marshes within estuarine complexes periodically eroding. Migrating channels drove phases of marsh erosion and expansion which were often synchronised at the estuary scale: as part of a marsh eroded, another part expanded elsewhere in the estuary over the same period. Such a “geomorphic compensation” phenomenon was evident between marshes on (i) opposite estuary banks, (ii) between singular marshes on the same bank in the mid and inner estuary, and (iii) along the margins of the same marsh. This meant change in the total area of all marshes in the mid and inner estuaries was low, despite up to 260 m of lateral change during erosion and expansion phases in some cases. The phenomenon of geomorphic compensation is likely commonplace in other biogeomorphic systems. Compensation after erosion has been described along mangrove forests in deltas (Ghosh et al., 2018), coastal seagrass meadows (León-Pérez et al., 2020), and vegetated islands in braided rivers (Francis et al., 2009). The driver of geomorphic compensation need not necessarily be restricted to channel dynamics. Patterns of compensatory marsh establishment have been identified in response to sea level rise (Kirwan and Gedan, 2019), storm surges (Campbell and Wang, 2019), and dredging activity (Spearman et al., 2014).
Capacity for erosion to be compensated by expansion elsewhere in the estuary has important implications for the large-scale resilience of tidal landscapes. The present paradigm of ecosystem resilience often emphasizes interactions at the scale of plants and the immediate surrounding environment: resilience is gained over the short-term through a positive feedback between plant growth and sediment trapping, that entails a loss of resilience over the longer-term as elevation gain exposes the vegetated edge to erosion in a negative feedback (Bouma et al., 2016; Stallins and Corenblit, 2018; Brückner et al., 2019). Unless sediment released during erosion encourages plant establishment in front of eroding edges in a cyclical manner (van der Wal et al., 2008), the removal of sediment (as is the case when a tidal channel shifts) is perceived as a loss of resilience; the high-elevation and “vegetated” state has undergone a regime shift to an alternative low-elevation and “unvegetated” stable state (Marani et al., 2010; Wang and Temmerman, 2013). However, when a larger-scale perspective is taken, we show that sediment released from one regime shift (“vegetated” to “unvegetated”) can drive a regime shift in the other direction (“unvegetated” to “vegetated”) elsewhere in the estuary, resulting a persistence of net habitat extent.
In the same way that marsh edges can cycle between erosion and expansion phases (van der Wal et al., 2008), this study confirms the existence of a similar self-organizing pattern between multiple marshes operating at the estuarine scale. The importance of long-distance interactions, in which ecological processes between ecosystems kilometers apart bolster resilience, is beginning to be recognized (van de Koppel et al., 2015). Long-distance interactions between landscape units, such as the geomorphic compensation phenomenon described here, may be equally important in governing the resilience of biogeomorphic systems. Detecting large-scale resilience requires clearly defined boundaries in which compensatory erosion-expansion patterns occur and can be assessed. Such a requirement is relatively simple in estuaries, where marsh extent is confined between the fully marine and fully fluvial ends of an estuary. For other settings, such as open-coast environments, defining appropriate boundaries may be challenging and the mechanistic drivers for compensation more complex to identify. Since tidal landscape habitat types are ultimately driven by sediment flux (Ganju et al., 2017), identifying littoral “sediment cells” (i.e., the transport pathways and boundaries of sediment flux) could provide a way to define the template in which geomorphic compensation can be detected (French et al., 2016).
Patterns of erosion-expansion compensation described here occurred at the same time as a net increase in marsh extent at estuarine scales. The expansion mainly occurred in the outer estuaries, reflecting a tendency for marsh expansion across western Britain caused by positive sediment supply (Ladd et al., 2019a). The present phase of sediment import may be part of a longer-term cycle of sediment import and export that occur in estuaries over centennial to millennial timescales (Dronkers, 2005; Townend et al., 2007). Both geomorphic compensation and net marsh gain patterns therefore appear to be operating under a set of discrete spatio-temporal scales and drivers, as a feature of coastal morphodynamics (Ladd, 2021). At the finer-scale, channel migration drives marsh erosion and expansion patterns. At the macro-scale, marsh change is dictated by sediment import/export phases. The hierarchical nesting of discrete erosion-expansion patterns play an important role in how tidal landscapes evolve (Braswell and Heffernan, 2019). Identifying the mechanisms that drive resilience at each scale can help better predict response of biogeomorphic landscapes to forcing (Stallins and Corenblit, 2018).
Except for proportionally smaller marshes (where marshes had yet to become wide enough to be exposed to channel migration), and where bedrock outcrops and headlands prevented channel migration (Burningham, 2008), channel migration drove compensation patterns throughout each estuary. We therefore demonstrate the often-overlooked importance of migrating tidal channels as long-term regulators of lateral marsh dynamics. Channel shifts are a common morphodynamic feature of estuaries, lagoons, and deltas worldwide (Coco et al., 2013). The role of channel shifts as a driver of coastal ecosystem dynamics is likely to be of greater importance than previously thought. High interannual variability of river and wind wave forcing likely drove the shifting of tidal channels in this study. Sea level rise, changes to sediment supply and changes in tidal prism by estuarine construction work all risk changing intertidal profiles, and hence the configuration and migration patterns of tidal channels (Olabarrieta et al., 2018; Elmilady et al., 2019; Ladd et al., 2019a). Interrupting channel-habitat interaction could negatively impact any compensatory expansion patterns and undermine landscape scale ecosystem resilience.
Geomorphic compensation has important practical implications for how ecosystem services at landscape scales are valued and managed. Certain ecosystem services are likely to be unaffected by erosion-expansion dynamics if net marsh extent remains consistent. For example, marshes provide a habitat provision service for nesting birds and insects. Vegetation patches of varying height and density are required for wader birds’ selection preference of nest sites to be met (Sharps, 2015). Bees rely on saltmarsh flower meadows for foraging (Davidson et al., 2020). If a marsh undergoes erosion at one location whilst a marsh elsewhere in the estuary expands, the habitat provision service would remain resilient, since structurally diverse vegetation and geomorphic profiles are maintained at the estuarine scale. Estuarine marshes also effectively attenuate storm surges and the upstream attenuation effect is determined by marsh extent, not specific location in the estuary (Fairchild et al., 2021). The storm surge capacity of marshes is therefore unlikely to be affected by compensatory erosion-expansion cycles. Other ecosystem services will likely be undermined by geomorphic compensation. Marsh loss would negatively impact on localized wave attenuation, as wave dissipation is strongly correlated with marsh width (Fairchild et al., 2021). Organic carbon stored in marsh deposits would be released during erosion, and it remains unclear whether the carbon could be reburied during marsh expansion or whether a portion of the carbon would be reintroduced into the carbon cycle (Mueller et al., 2019). Understanding how changes in the biological components of marshes affects ecosystem service delivery remains an important research gap (Koch et al., 2009). Additional work should also consider the implications of large-scale resilience mechanisms in the long-term provision of ecosystem services.
Data Availability Statement
The dataset on saltmarsh extent change can be accessed at Ladd et al. (2019b), and the remaining datasets supporting our conclusions are given in Supplementary Data 1.
Author Contributions
CL and MD-E digitized the aerial images. CL processed the data. CL and JP completed the statistical analyses. CL prepared the initial manuscript. All authors contributed to the editing of the final manuscript.
Funding
This work was supported by the Coleg Cymraeg Cenedlaethol (Ysgoloriaethau Ymchwil), the Welsh Government and Higher Education Funding Council for Wales (S r Cymru National Research Network for Low Carbon, Energy and Environment), the Natural Environment Research Council (C-SIDE Project) (Grant No. NE/R010846/1), and the United Kingdom Research and Innovation Global Challenges Research Fund (Living Deltas Research Hub) (Grant No. NE/S008926/1).
Conflict of Interest
The authors declare that the research was conducted in the absence of any commercial or financial relationships that could be construed as a potential conflict of interest.
Publisher’s Note
All claims expressed in this article are solely those of the authors and do not necessarily represent those of their affiliated organizations, or those of the publisher, the editors and the reviewers. Any product that may be evaluated in this article, or claim that may be made by its manufacturer, is not guaranteed or endorsed by the publisher.
Acknowledgments
We acknowledge the Royal Commission on the Ancient and Historical Monuments of Wales and the Central Register of Air Photography for Wales as the source of aerial images. We also thank Prof. Tom Spencer from Cambridge University for valuable feedback on the initial manuscript.
Supplementary Material
The Supplementary Material for this article can be found online at: https://www.frontiersin.org/articles/10.3389/fmars.2021.757715/full#supplementary-material
Footnotes
References
Balke, T., Herman, P. M., and Bouma, T. J. (2014). Critical transitions in disturbance-driven ecosystems: identifying windows of opportunity for recovery. J. Ecol. 102, 700–708. doi: 10.1111/1365-2745.12241
Bouma, T. J., van Belzen, J., Balke, T., van Dalen, J., Klaassen, P., Hartog, A. M., et al. (2016). Short-term mudflat dynamics drive long-term cyclic salt marsh dynamics. Limnol. Oceanogr. 61, 2261–2275. doi: 10.1002/lno.10374
Braswell, A. E., and Heffernan, J. B. (2019). Coastal wetland distributions: delineating domains of macroscale drivers and local feedbacks. Ecosystems 22, 1256–1270. doi: 10.1007/s10021-018-0332-3
Braudrick, C. A., Dietrich, W. E., Leverich, G. T., and Sklar, L. S. (2009). Experimental evidence for the conditions necessary to sustain meandering in coarse-bedded rivers. Proc. Natl. Acad. Sci. U.S.A. 106, 16936–16941. doi: 10.1073/pnas.0909417106
Brooks, H., Möller, I., Carr, S., Chirol, C., Christie, E., Evans, B., et al. (2020). Resistance of salt marsh substrates to near-instantaneous hydrodynamic forcing. Earth Surf. Proc. Land 46, 67–88. doi: 10.1002/esp.4912
Brown, J., and Davies, A. (2010). Flood/ebb tidal asymmetry in a shallow sandy estuary and the impact on net sand transport. Geomorphology 114, 431–439. doi: 10.1016/j.geomorph.2009.08.006
Brückner, M. Z. M., Schwarz, C., van Dijk, W. M., van Oorschot, M., Douma, H., and Kleinhans, M. G. (2019). Salt marsh establishment and eco-engineering effects in dynamic estuaries determined by sepceis growth and mortality. J. Geo. Res. Earth Surf. 124, 2962–2986. doi: 10.1029/2019JF005092
Burningham, H. (2008). Contrasting geomorphic response to structural control: the loughros estuaries, northwest Ireland. Geomorphology 97, 300–320. doi: 10.1016/j.geomorph.2007.08.009
Burns, C. J., Alexander, C. R., and Alber, M. (2021). Assessing long-term trends in lateral salt-marsh shoreline change along a U.S. east coast latitudinal gradient. J. Coast. Res. 37, 291–301. doi: 10.2112/JCOASTRES-D-19-00043.1
Campbell, A., and Wang, Y. (2019). High spatial resolution remote sensing for salt marsh mapping and change analysis at fire island nationla seashore. Remote Sens. 11:1107. doi: 10.3390/rs11091107
Carrasco, R. A., Kombiadou, K., Amado, M., and Matias, A. (2021). Past and future marsh adaptation: lessons learned from the Ria Formosa lagoon. Sci. Tot. Env. 790:148082. doi: 10.1016/j.scitotenv.2021.148082
Chauhan, P. P. S. (2009). Autocyclic erosion in tidal marshes. Geomorphology 110, 45–57. doi: 10.1016/j.geomorph.2009.03.016
Cleveland, R. B., Cleveland, W. S., and Terpenning, I. (1990). STL: a seasonal-trend decomposition procedure based on loess. J. Off. Stat. 6, 3–73.
Coco, G., Zhou, Z., van Maanen, B., Olabarrieta, M., Tinoco, R., and Townend, I. (2013). Morphodynamics of tidal networks: advances and challenges. Mar. Geol. 346, 1–16. doi: 10.1016/j.margeo.2013.08.005
Cox, R., Wadsworth, R., and Thomson, A. (2003). Long-term changes in salt marsh extent affected by channel deepening in a modified estuary. Cont. Shelf Res. 23, 1833–1846. doi: 10.1016/j.csr.2003.08.002
Davidson, K. E., Fowler, M. S., Skov, M. W., Forman, D., Alison, J., Botham, M., et al. (2020). Grazing reduces bee abundance and diversity in saltmarshes by suppressing flowering of key plant species. Agric. Ecosyst. Environ. 291:106760. doi: 10.1016/j.agee.2019.106760
Deegan, L. A., Johnson, D. S., Warren, R. S., Peterson, B. J., Fleeger, J. W., Fagherazzi, S., et al. (2012). Coastal eutrophication as a driver of salt marsh loss. Nature 490, 388–392. doi: 10.1038/nature11533
Elmilady, H., van der Wegen, M., Roelvink, D., and Jaffe, B. (2019). Intertidal area disappears under sea level rise: 250 years of morphodynamic modeling in San Pablo Bay, California. J. Geophys. Res. Earth Surf. 124, 38–59. doi: 10.1029/2018JF004857
Fagherazzi, S., Kirwan, M. L., Mudd, S. M., Guntenspergen, G. R., Temmerman, S., D’Alpaos, A., et al. (2012). Numerical models of salt marsh evolution: ecological, geomorphic, and climatic factors. Rev. Geophys. 50, 1–28. doi: 10.1029/2011RG000359
Fairchild, T. P., Bennett, W. G., Smith, G. S., Day, B., Skov, M. W., Möller, I., et al. (2021). Coastal wetlands mitigate storm flooding and associated costs in estuaries. Environ. Res. Lett. 16:074034. doi: 10.1088/1748-9326/ac0c45
Francis, R. A., Corenblit, D., and Edwards, P. J. (2009). Perspectives on biogeomorphology, ecosystem engineering and self-organisation in island-braided fluvial ecosystems. Aquat. Sci. 71, 290–304. doi: 10.1007/s00027-009-9182-6
French, J., Payo, A., Murray, B., Orford, J., Eliot, M., and Cowell, P. (2016). Appropriate complexity for the prediction of coastal and estuarine geomorphic behaviour at decadal to centennial scales. Geomorphology 256, 3–16.
Gabler, C. A., Osland, M. J., Grace, J. B., Stagg, C. L., Day, R. H., Hartley, S. B., et al. (2017). Macroclimatic change expected to transform coastal wetland ecosystems this century. Nat. Clim. Chang. 7, 142–147. doi: 10.1038/NCLIMATE3203
Ganju, N. K., Defne, Z., Kirwan, M. L., Fagherazzi, S., D’Alpaos, A., and Carniello, L. (2017). Spatially integrative metrics reveal hidden vulnerability of microtidal salt marshes. Nat. Commun. 8:14156. doi: 10.1038/ncomms14156
Ghosh, M. K., Kumar, L., and Langat, P. K. (2018). Mapping tidal channel dynamics in the Sundarbans, Bangladesh, between 1974 and 2017, and implications for the sustainability of the Sundarbans mangrove forest. Environ. Monit. Assess. 190:582. doi: 10.1007/s10661-018-6944-4
Graf, W. L. (2000). Locational probability for a dammed, urbanizing stream: salt river Arizona, USA. Environ. Manage. 25, 321–335. doi: 10.1007/s002679910025
Gray, A. (1972). The ecology of Morecambe Bay. V. the salt marshes of Morecambe Bay. J. Appl. Ecol. 9, 207–220. doi: 10.2307/2402057
Hothorn, T., Bretz, F., Westfall, P., Heiberger, R. M., Schuetzenmeister, A., and Scheibe, S. (2016). Simultaneous inference in general parametric models. Biom. J. 50, 346–363. doi: 10.1002/bimj.200810425
Hughes, Z. J. (2012). “Tidal channels on tidal flats and marshes,” in Principles of Tidal Sedimentology, eds R. A. Davis and R. W. Dalrymple (New York, NY: Springer), 269–300. doi: 10.1007/978-94-007-0123-6_11
Kirwan, M. L., and Gedan, K. B. (2019). Sea-level driven land conversion and the formation of ghost forests. Nat. Clim. Chang. 9, 450–457. doi: 10.1038/s41558-019-0488-7
Kirwan, M. L., Murray, A. B., Donnelly, J. P., and Corbett, D. R. (2011). Rapid wetland expansion during European settlement and its implication for marsh survival under modern sediment delivery rates. Geology 39, 507–510. doi: 10.1130/G31789.1
Koch, E. W., Barbier, E. B., Silliman, B. R., Reed, D. J., Perillo, G. M. E., Hacker, S. D., et al. (2009). Non-linearity in ecosystem services: temporal and spatial variability in coastal protection. Front. Ecol. Environ. 7:29–37. doi: 10.1890/080126
Ladd, C. J. T. (2021). Review of processes and management of saltmarshes across Great Britain. Proc. Geo. Assoc. 132, 269–283. doi: 10.1016/j.pgeola.2021.02.005
Ladd, C. J. T., Duggan-Edwards, M. F., Bouma, T. J., Pagès, J. F., and Skov, M. W. (2019a). Sediment supply explains long-term and large-scale patterns in salt marsh lateral expansion and erosion. Geophys. Res. Lett. 46, 11178–11187. doi: 10.1029/2019GL083315
Ladd, C. J. T, Duggan-Edwards, M. F., Bouma, T. J., Pagès, J. F., and Skov, M. W. (2019b). Data From: Change in Saltmarsh Extent for Six Regions Across Great Britain (1846–2016). NERC Environmental Information Data Centre. doi: 10.5285/03b62fd0-41e2-4355-9a06-1697117f0717
Lanzoni, S., and Seminara, G. (2002). Long-term evolution and morphodynamic equilibrium of tidal channels. J. Geophys. Res. Oceans 107, 1–13. doi: 10.1029/2000JC000468
Larcombe, P., and Jago, C. F. (1996). The morphological dynamics of intertidal megaripples in the Mawddach Estuary, north Wales, and the implications for palaeoflow reconstructions. Sedimentology 43, 541–559. doi: 10.1046/j.1365-3091.1996.d01-16.x
Leonardi, N., Defne, Z., Ganju, N. K., and Fagherazzi, S. (2016). Salt marsh erosion rates and boundary features in a shallow bay. J. Geophys. Res. Earth Surf. 121, 1861–1875. doi: 10.1002/2016JF003975
León-Pérez, M. C., Armstrong, R. A., Hernández, W. J., Aguilar-Perera, A., and Thompson-Grim, J. (2020). Seagrass cover expansion off Gaja de Muertos Island, Puerto Rico, as determined by long-term analysis of historical aerial images (1950-2014). Ecol. Indic. 117:106561. doi: 10.1016/j.ecolind.2020.106561
Li, C., Chen, C., Guadagnoli, D., and Georgiou, I. Y. (2008). Geometry-induced residual eddies in estuaries with curved channels: observations and modeling studies. J. Geophys. Res. Oceans 113:C01005. doi: 10.1029/2006JC004031
Manning, A., and Whitehouse, R. (2012). Enhanced UK Estuaries Database: Explanatory Notes and Metadata. Development of Estuary Morphological Models. Technical Report. Wallingford: HR Wallingford.
Marani, M., D’Alpaos, A., Lanzoni, S., Carniello, L., and Rinaldo, A. (2010). The importance of being coupled: stable states and catastrophic shifts in tidal biomorphodynamics. J. Geophys. Res. Earth Surf. 115, 1–15. doi: 10.1029/2009JF001600
Möller, I., Kudella, M., Rupprecht, F., Spencer, T., Paul, M., van Wesenbeeck, B. K., et al. (2014). Wave attenuation over coastal salt marshes under storm surge conditions. Nat. Geosci. 7, 727–731. doi: 10.1038/NGEO2251
Mueller, P., Ladiges, N., Jack, A., Schmiedl, G., Kutzbach, L., Jensen, K., et al. (2019). Assessing the long-term carbon-sequestration potential of the semi-natural salt marshes in the European Wadden Sea. Ecosphere 10:e02556. doi: 10.1002/ecs2.2556
Nicholls, R. J., Wong, P. P., Burkett, V., Codignotto, J., Hay, J., McLean, R., et al. (2007). “Coastal systems and low-lying areas,” in Impacts, Adaptation, and Vulnerability, eds M. L. Parry, O. F. Canziani, J. P. Palutikof, P. J. van der Linden, and C. E. Hanson (Cambridge: Cambridge Univ. Press), 315–357.
Olabarrieta, M., Geyer, W. R., Coco, G., Friedrichs, C. T., and Cao, Z. (2018). Effects of density-driven flows on the long-term morphodynamic evolution of funnel-shaped estuaries. J. Geophys. Res. Earth Surf. 123, 2901–2924. doi: 10.1029/2017JF004527
Phelan, N., Shaw, A., and Baylis, A. (2011). The Extent of Saltmarsh in England and Wales: 2006-2009. Bristol: Environment Agency.
Pringle, A. (1995). Erosion of a cyclic salt marsh in Morecambe Bay, north-west England. Earth Surf. Process Landf. 20, 387–405. doi: 10.1002/esp.3290200502
Pye, K., and Blott, S. J. (2014). The geomorphology of UK estuaries: the role of geological controls, antecedent conditions and human activities. Estuar. Coast. Shelf Sci. 150, 196–214. doi: 10.1016/j.ecss.2014.05.014
Reed, D., van Wesenbeeck, B., Herman, P. M., and Meselhe, E. (2018). Tidal flat-wetland systems as flood defenses: understanding biogeomorphic controls. Estuar. Coast. Shelf Sci. 213, 269–282. doi: 10.1016/j.ecss.2018.08.017
Rhind, P., and Jones, A. (1994). Brackish salt marsh communities in the glaslyn marsh trust reserve. Field Studies 8, 373–384.
Rogers, K., Kelleway, J. J., Saintilan, N., Megonigal, J. P., Adams, J. B., Holmquist, J. R., et al. (2019). Wetland carbon storage controlled by millennial-scale variation in relative sea-level rise. Nature 567, 91–95. doi: 10.1038/s41586-019-0951-7
Sharps, E. A. (2015). The Effects of Salt Marsh Conservation Grazing on Breeding Common Redshank Tringa Totanus. Ph.D. Dissertation. Bangor: Bangor University.
Shi, Z., and Lamb, H. (1991). Post-glacial sedimentary evolution of a microtidal estuary, Dyfi Estuary, West Wales, UK. Sediment Geol. 73, 227–246. doi: 10.1016/0037-0738(91)90086-S
Silliman, B. R., Van de Koppel, J., McCoy, M. W., Diller, J., Kasozi, G. N., Earl, K., et al. (2012). Degradation and resilience in louisiana salt marshes after the BP–deepwater horizon oil spill. Proc. Natl. Acad. Sci. U.S.A. 109, 11234–11239. doi: 10.1073/pnas.1204922109
Spearman, J., Baugh, J., Feates, N., Dearnaley, M., and Eccles, D. (2014). Small estuary, big port – progress in the management of the stour-orwell estuary system. Estuar. Coast. Shelf Sci. 150, 299–311. doi: 10.1016/j.ecss.2014.07.003
Stallins, J. A., and Corenblit, D. (2018). Interdependence of geomorphic and ecologic resilience properties in a geographic context. Geomorphology 305, 76–93. doi: 10.1016/j.geomorph.2017.09.012
Sylvester, Z., Durkin, P., and Covault, J. A. (2019). High curvatures drive river meandering. Geology 47, 263–266. doi: 10.1130/G45608.1
Townend, I. H., Wang, Z. B., and Rees, J. (2007). Millennial to annual volume changes in the Humber Estuary. Proc. R. Soc. A 463, 837–854. doi: 10.1098/rspa.2006.1798
Traini, C., Proust, J.-N., Menier, D., and Mathew, M. (2015). Distinguishing natural evolution and human impact on estuarine morpho-sedimentary development: a case study from the Vilaine Estuary, France. Estuar. Coast. Shelf Sci. 163, 143–155. doi: 10.1016/j.ecss.2015.06.025
Van Coppenolle, R., and Temmerman, S. (2020). Identifying global hotspots where coastal wetland conservation can contribute to nature-based mitigation of coastal flood risks. Glob. Planet Change 187:103125. doi: 10.1016/j.gloplacha.2020.103125
van de Koppel, J., van der Heide, T., Altieri, A. H., Eriksson, B. K., Bouma, T. J., Olff, H., et al. (2015). Long-distance interactions regulate the structure and resilience of coasal ecosystems. Annu. Rev. Mar. Sci. 7, 139–158. doi: 10.1146/annurev-marine-010814-015805
van der Wal, D., Wielemaker-van den Dool, A., and Herman, P. M. (2008). Spatial patterns, rates and mechanisms of salt marsh cycles (Westerschelde, The Netherlands). Estuar. Coast. Shelf Sci. 76, 357–368. doi: 10.1016/j.ecss.2007.07.017
van Wesenbeeck, B. K., Van de Koppel, J., Herman, P. M. J., and Bouma, T. J. (2008). Does scale-dependent feedback explain spatial complexity in salt-marsh ecosystems? Oikos 117, 152–159. doi: 10.1111/j.2007.0030-1299.16245.x
Wang, C., and Temmerman, S. (2013). Does biogeomorphic feedback lead to abrupt shifts between alternative landscape states?: an empirical study on intertidal flats and marshes. J. Geophys. Res. Earth Surf. 118, 229–240. doi: 10.1029/2012JF002474
Wang, H., van der Wal, D., Li, X., van Belzen, J., Herman, P. M. J., Hu, Z., et al. (2017). Zooming in and out: scale dependence of extrinsic and intrinsic factors affecting salt marsh erosion. J. Geophys. Res. Earth Surf. 122, 1455–1470. doi: 10.1002/2016JF004193
Watson, S. J., Kritharas, P., and Hodgson, G. (2015). Wind speed variability across the UK between 1957 and 2011. Wind Energy 18, 21–42. doi: 10.1002/we.1679
Wernette, P., Shortridge, A., Lusch, D. P., and Arbogast, A. F. (2017). Accounting for positional uncertainty in historical shoreline change analysis without ground reference information. Int. J. Remote Sens. 38, 3906–3922. doi: 10.1080/01431161.2017.1303218
Willemsen, P. W. J. M., Borsje, B. W., Hulscher, S. J. M. H., van der Wal, D., Zhu, Z., Oteman, B., et al. (2018). Quantifying bed level change at the transition of tidal flat and salt marsh: can we understand the lateral location of the marsh edge? J. Geophys. Res. Earth Surf. 123, 2509–2524. doi: 10.1029/2018JF004742
Zuur, A., Ieno, E. N., Walker, N., Saveliev, A. A., and Smith, G. M. (2009). Mixed Effects Models and Extensions in Ecology With R. New York, NY: Springer.
Keywords: coastal biogeomorphology, ecosystem resilience, scale-dependence, saltmarsh edge, tidal channel migration, sheltered macrotidal estuaries, ecosystem services
Citation: Ladd CJT, Duggan-Edwards MF, Pagès JF and Skov MW (2021) Saltmarsh Resilience to Periodic Shifts in Tidal Channels. Front. Mar. Sci. 8:757715. doi: 10.3389/fmars.2021.757715
Received: 12 August 2021; Accepted: 27 September 2021;
Published: 20 October 2021.
Edited by:
Nicoletta Leonardi, University of Liverpool, United KingdomReviewed by:
Pat Dale, Griffith University, AustraliaPeter M. J. Herman, Delft University of Technology, Netherlands
Copyright © 2021 Ladd, Duggan-Edwards, Pagès and Skov. This is an open-access article distributed under the terms of the Creative Commons Attribution License (CC BY). The use, distribution or reproduction in other forums is permitted, provided the original author(s) and the copyright owner(s) are credited and that the original publication in this journal is cited, in accordance with accepted academic practice. No use, distribution or reproduction is permitted which does not comply with these terms.
*Correspondence: Cai John Tomos Ladd, Y2FpLmxhZGRAZ2xhc2dvdy5hYy51aw==