Abstract
Mesophotic reefs (30–150 m) occur in the tropics and subtropics at depths beyond most scientific diving, thereby making conventional surveys challenging. Towed cameras, submersibles, and mixed-gas divers were used to survey the mesophotic reef fish assemblages and benthic substrates of the Au‘au Channel, between the Hawaiian Islands of Maui and Lāna‘i. Non-parametric multivariate analysis: Non-metric Multidimensional Scaling (NMDS), Hierarchical Cluster Analysis (HCA), Multi-Response Permutation Procedure (MRPP), and Indicator Species Analysis (ISA) were used to determine the association of mesophotic reef fish species with benthic substrates and depth. Between 53 and 115-m depths, 82 species and 10 genera of fish were observed together with 10 types of benthic substrate. Eight species of fish (Apolemichthys arcuatus, Centropyge potteri, Chaetodon kleinii, Chromis leucura, Chromis verater, Forcipiger sp., Naso hexacanthus, and Parupeneus multifasciatus) were positively associated with increasing depth, Leptoseris sp. coral cover, and hard-bottom cover, and one species (Oxycheilinus bimaculatus) of fish was positively associated with increasing Halimeda sp. algae cover. Fish assemblages associated with rubble were not significantly different from those associated with sand, Montipora coral beds and Leptoseris coral beds, but were distinct from fish assemblages associated with hard bottom. The patterns in the data suggested two depth assemblages, one “upper mesophotic” between 53 and 95 m and the other deeper, possibly part of a “lower mesophotic” assemblage between 96 and 115 m at the edge of the rariphotic and bottomfish complex.
Introduction
Mesophotic Coral Ecosystems (MCEs) are the most understudied coral reef ecosystems in the world. MCEs are found in the tropics and subtropics between 30 and 150-m depths, a range defined by the limit of scientific scuba diving (30 m) and corals’ ability to photosynthesize (150 m) (Hinderstein et al., 2010). The mapping of mesophotic benthic habitats has documented distinct coral and algal substrates (Rooney et al., 2010; Blythe-Skyrme et al., 2013), but little data exist for the fish assemblages that inhabit these substrates, particularly in Hawai‘i. MCEs have been described as transition zones between shallow and deep-reef fish assemblages (Brokovich et al., 2008; Weijerman et al., 2019), and represent a frontier for research as demonstrated by the continuing discovery of new and conspicuous reef fish species (Pyle, 1996; Pyle et al., 2008; Rocha et al., 2017; Arango et al., 2019). Despite increasing interest in MCEs during the last decade (Lindfield et al., 2016; Abesamis et al., 2020), the effective management of this habitat remains problematic due to limited knowledge about the community structure and habitat associations of mesophotic fish assemblages (Dennis and Bright, 1988; Hinderstein et al., 2010; Bejarano et al., 2014; Pinheiro et al., 2016).
In Hawai‘i, MCEs have recently been described within select geographic regions in association with specific bathymetric habitat features (e.g., banks, ledges) or benthic cover (e.g., algal meadows, high coral cover) (Rooney et al., 2010; Blythe-Skyrme et al., 2013; Pyle et al., 2016). Many studies have investigated various aspects of MCE benthic habitats in the main Hawaiian Islands including coral beds, algal meadows, coral physiology, fish life histories, and fish trophic ecology (Boland and Parrish, 2005; Kahng and Kelley, 2007; Rooney et al., 2010; Blythe-Skyrme et al., 2013; Costa et al., 2015; Pochon et al., 2015; Bradley et al., 2016; Pyle et al., 2016; Spalding et al., 2016; Asher et al., 2017; Weijerman et al., 2019), with the number and spatial extent of surveys increasing in recent years (2009–2018) (Spalding et al., 2019). Much less is known of MCEs in the Northwestern Hawaiian Islands (NWHI) as a result of the additional logistical constraints of research at these distant locations. Seven studies conducted in the NWHI have been published to date, focusing on benthic substrate cover, fish assemblages on banks, a comparison of shallow reef vs. mesophotic fish, foraging habitat of the Hawaiian Monk Seal and/or levels of fish endemism (Parrish et al., 2000; Parrish and Boland, 2004; Rooney et al., 2010; Kane et al., 2014; Fukunaga et al., 2016, 2017; Kosaki et al., 2016).
Studies in Hawai‘i and elsewhere have described zonation in fish assemblages across mesophotic depths. Weijerman et al. (2019) divided fish assemblages of the mesophotic zone in Hawai‘i into an upper mesophotic zone (30–59 m) and a lower mesophotic zone (60–129 m) with deeper depths described as “rariphotic” and “bathyal” zones.
Mesophotic fish assemblages have been associated with various benthic habitats (Dennis and Bright, 1988; Bejarano et al., 2010; Garcia-Sais, 2010; Asher et al., 2017; Stefanoudis et al., 2019; Williams et al., 2019) and with depth (Brokovich et al., 2008; Pearson and Stevens, 2015; Semmler et al., 2016; Asher et al., 2017; Sih et al., 2017; Coleman et al., 2018; Stefanoudis et al., 2019; Williams et al., 2019) and observed as early as 1981 in the Cayman Islands (Lukens, 1981). Thresher and Colin (1986) perceived multiple “fish communities” within the mesophotic assemblage of fishes on the outer wall at Enewetak Atoll in the Marshall Islands; however, their categorization was not rigorously quantitative. Dennis and Bright (1988) recognized multiple benthic-fish associations that were related to depth at the Flower Garden banks in the northwestern Gulf of Mexico.
This study investigates the MCE reef fish assemblages of the Au‘au Channel between Lāna‘i and Maui in the main Hawaiian Islands using archived MCE survey data collected between 2007 and 2011 by the National Oceanic and Atmospheric Administration (NOAA) National Marine Fisheries Service (NMFS) These surveys utilized three distinct platforms: Towed Optical Assessment Device (TOAD), submersibles Pisces IV and V (SUB), and mixed-gas scuba diving (SCUBA).
Materials and Methods
Study Site
Seafloor depth of Au‘au Channel (Figure 1) ranges from 0 to approximately 250 m, with much of the area located in the mesophotic zone (Costa et al., 2015). During the last glacial maximum 21,000 years ago, this channel was a dry land bridge between Maui and Lāna‘i. Lakes and lagoons on this land bridge were submerged by rising sea level and became ideal habitat for hard corals and precious corals in the genera Antipathes and Myripathes (Grigg et al., 2002; Price and Elliott-Fisk, 2004). The Au‘au Channel bottom is heterogeneous and features a variety of substrate types such as large beds of Halimeda sp. algae, sand, Montipora sp. coral and Microdictyon sp. algae, hard pavement, Leptoseris sp. coral, and rubble (Costa et al., 2015).
FIGURE 1
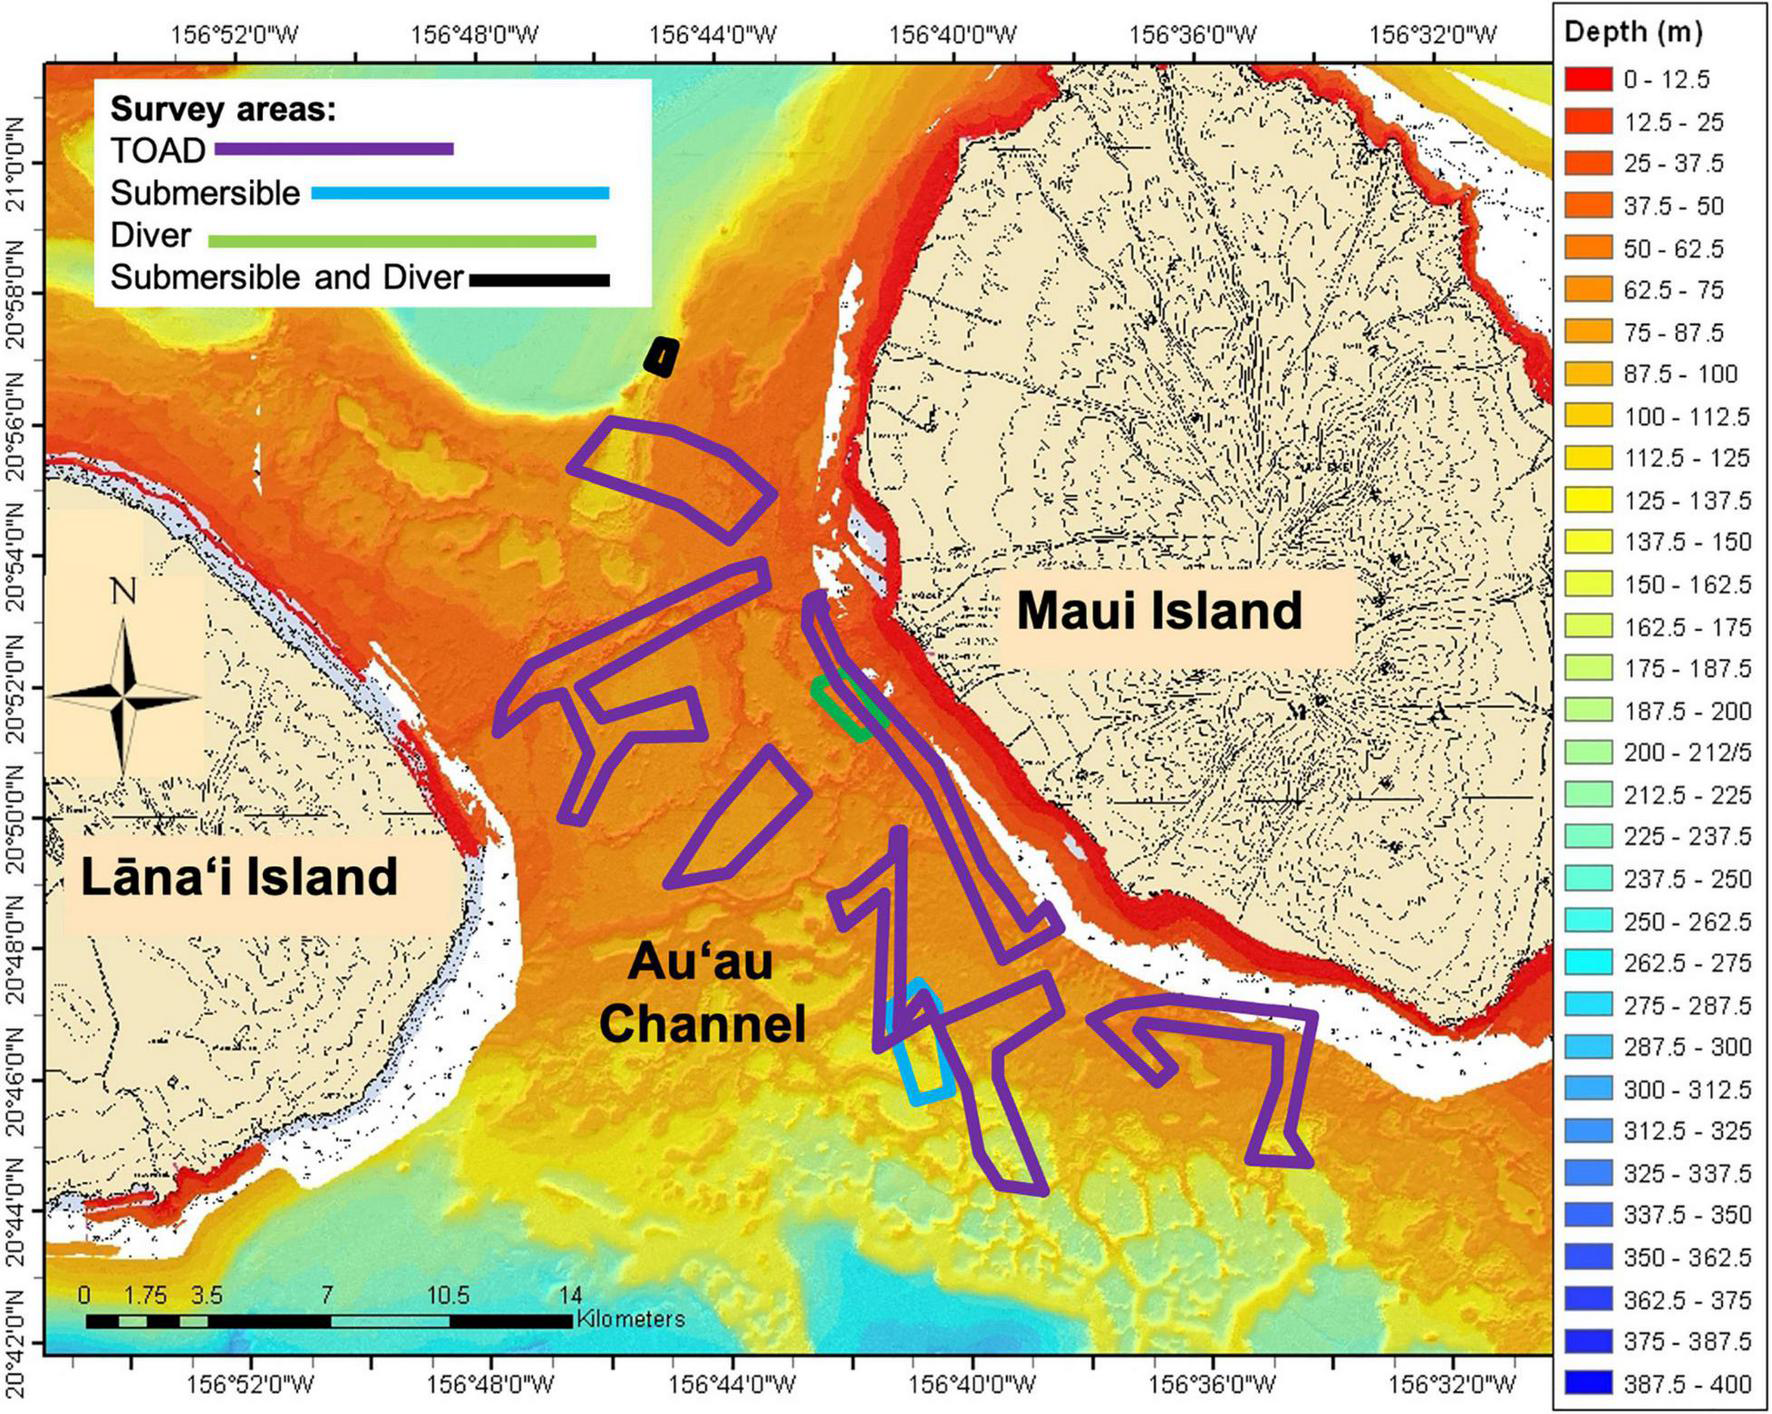
Bathymetry of the Au‘au Channel with survey areas. Lāna‘i Island is on the left and Maui Island is on the right. TOAD surveys denoted by purple, Submersible surveys in blue, Diver surveys in green and Submersible and Diver surveys in black.
Survey Methods
Visual surveys of fish and substrate cover were conducted using strip transects of various widths and distances, dependent on the survey platform. Fish were identified to the finest taxonomic level possible (ideally to species or minimally to genus) and their abundance recorded. All fish were sized (standard length, SL) to the nearest centimeter using platform-specific techniques. The TOAD and submersibles had two or more lasers spaced a specific distance apart to aid in length estimation during observations (Kelley et al., 2005; Rooney et al., 2010). Both the TOAD and submersible maintained video recordings of the survey with the laser scale within the field of view. These video recordings were matched against the observer’s observations to control or correct for bias. To minimize possible biases and variability in fish identification and sizing, one observer (the senior author) was primarily used, with two additional trained observers. Observations from the additional observers were compared to the video log and to the primary observer’s observations to control for bias.
Divers conducted transects that were 25 m long by 2 m wide (Brokovich et al., 2008). One diver counted and sized fish; the second diver followed and video-recorded the substrate along the transect tape.
Submersible transects followed a specific isobath and habitat and finished either after 20 min or when the end of the habitat was reached (Kelley et al., 2005). The position of the submersible was continuously recorded via TrackLink 5000HA (LinkQuest Inc.) and plotted on a bathymetric chart. Area surveyed was determined by the transect distance multiplied by a strip width of 6 m, which is the width of area of a single viewport on the submersible (Kelley et al., 2005). Due to the constraints of surveying fish out of a submersible viewport, only fish ≥10 cm were identified and sized. Observations were verbally recorded onto the mission videotape via microphone within the command sphere and later transcribed and scored.
TOAD transects followed an approximately straight track, regardless of depth or substrate. The TOAD was deployed at a specific geographic location, towed continuously, tracked using GPS, and recovered at transect end. Thus, transects varied in both duration and length, with the distance of the track determined by mapping the GPS locations and calculating the linear distances between all consecutive points. Transect area surveyed was determined using transect length multiplied by the camera’s view width of 22 m (Rooney et al., 2010). Due to the limitations of the camera only fish ≥10 cm could be identified and sized.
Transect substrate was recorded by video. TOAD and SUB transects used the point intersect method to determine percent cover. Every 30 s of video was scored by an evenly spaced 5-point screen overlay to calculate percent cover (Blythe-Skyrme et al., 2013). Because divers surveyed small specific areas limited to one type of substrate, percent cover for SCUBA surveys was visually estimated along the transect. These substrate observations were classified into 10 categories: sand, hard bottom, rubble, Leptoseris sp. Coral, Montipora sp. Coral, Porites sp. Coral, Black Coral, Halimeda sp. Algae, Microdictyon sp. Algae, and Ulva sp. Algae. Percent cover data for the 10 categories were estimated for every survey.
Data Analysis
Survey methods varied in transect strip width and length, fish size detectability, and spanned different depths and substrates, which produced unstandardized data that were not normally distributed and contained numerous zeros and some high counts. Data were transformed into presence/absence and non-parametric multivariate analyses were employed to counter the sampling limitations and data deficiencies.
Fish species were divided into two life stages (juvenile, adult) using 50% of the maximum published size (Randall, 2005, 2007; Froese and Pauly, 2014)1 as the threshold value between juvenile and adult (Binohlan and Froese, 2009; Froese and Pauly, 2014; see text footnote 1). This produced a primary matrix of 180 species-life stages and 52 surveys.
Mean depth and mean percent cover by substrate type were estimated for each survey, resulting in a secondary matrix of 11 environmental variables (depth plus 10 substrates) and 52 surveys. Using the PC-Ord program, these matrices were used to perform four complementary multivariate analyses: Non-metric Multidimensional Scaling (NMDS), Hierarchical Cluster Analysis (HCA), Multi-response Permutation Procedure (MRPP), and Indicator Species Analysis (ISA) (McCune and Grace, 2002). To make the NMDS and the HCA results comparable, both relied on the relative Sorensen distance measure. The significance for association in NMDS was estimated by 999 randomized iterations and for ISA it was 4999 permutations (Legendre and Legendre, 1998; McCune and Grace, 2002).
Two Mantel tests (McCune and Grace, 2002) were conducted to assess the null hypothesis of no relationship between the similarity of the fish community (matrix 1) and the substrate data (matrix 2) for all pair-wise surveys. NMDS was chosen over Principal Component Analysis (PCA) to compare matrix 1 with matrix 2 because of the large number of zero values and occasional large counts in data matrices (Kenkel and Orloci, 1986; McCune and Grace, 2002). HCA was used to organize the surveys into discrete groups based on similarities among fish species and utilized the overall percent of variance explained by NMDS (50%) as the threshold for these groups. These groups also indicated the five dominant benthic habitats and was the basis for the ranges of the six depth bins. MRPP tested the null hypothesis of no difference between all pair-wise group comparisons of the five benthic habitat types, and six binned depth categories. Depth bin categories were defined by 10 m depth increments, except for the first bin which was a 15 m depth increment. ISA was used to identify which fish species were indicators of the distinct MRPP groups identified on the basis of depth categories, and benthic habitat types.
Results
Fifty-two surveys (9 SCUBA diver, 29 SUB and 14 TOAD) were conducted between 53 and 115 meters utilizing the three survey platforms (Table 1). Eighty-two fish species and an additional ten fish genera were identified (92 total taxa). Ten different benthic substrates were observed and classified as: sand, hard bottom, rubble, Leptoseris sp. coral, Montipora sp. coral, Porites sp. coral, black coral, Halimeda sp. algae, Microdictyon sp. algae, and Ulva sp. algae. There was a significant but weak, positive relationship between fish assemblage and depth or substrate (Mantel test, r = 0.200, P < 0.001, 999 randomizations).
TABLE 1
| Survey method | Number of surveys | Depth range (m) | Survey length (m) | Survey width (m) | Total area surveyed (m2) | Total number of fish |
| Mesophotic TOAD | 14 | 53–136 | 296–3854 | 22 | 225,646 | 997 |
| Mesophotic SUB | 29 | 64–110 | 153–833 | 6 | 46,360 | 6,052 |
| Mesophotic SCUBA | 9 | 48–83 | 25 | 2 | 500 | 48 |
Survey methods used in this study, showing effort and number of fish recorded.
SCUBA, Self-Contained Underwater Breathing Apparatus; TOAD, Towed Optical Assessment Device; SUB, Pisces 4 or 5 Submersible.
NMDS yielded a significant (P < 0.001) 3-dimensional solution that altogether explained 50.4% of the variance (21.7% Axis 1: Depth, Leptoseris and Hard Bottom, 14.8% Axis 2: Montipora and 13.9% Axis 3: Halimeda) with a stress of 11.567. Using Clarke’s rule of thumb where 5–10 is good ordination and 10–20 is a usable portrayal, a stress of 11.567 indicates a low risk of misinterpretation (McCune and Grace, 2002; Figure 2). Pair-wise orthogonality of the 3 axes were 99.3% (axis 1 vs. axis 2), 99.3% (axis 1 vs. axis 3), and 99.7% (axis 2 vs. axis 3), indicating that all axes were aligned at nearly 90 degrees to each other. Mean depth, 2 substrate types, and 8 fish species were significantly correlated with Axis 1 (Table 2). Both age classes of Cirrhilabrus jordani but no substrates or depth, were significantly correlated with Axis 2. Finally, Halimeda substrate and Adult Oxycheilinus bimaculatus were significantly correlated with Axis 3 (Table 2).
FIGURE 2
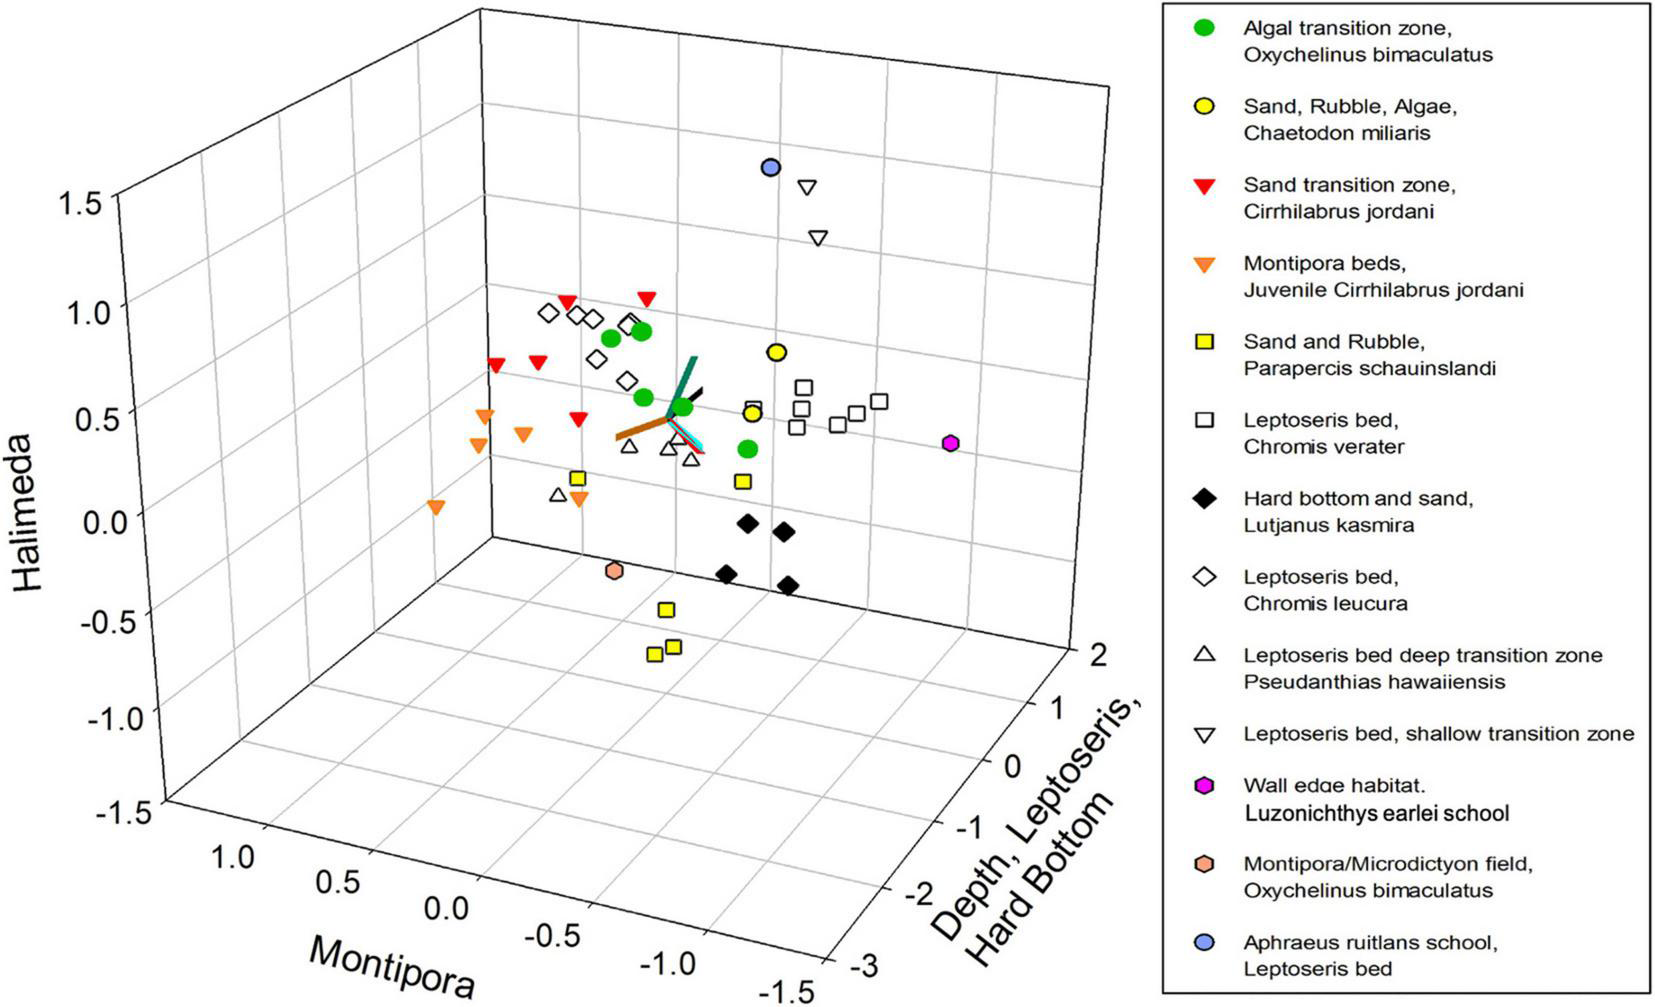
Non-metric Multidimensional Scaling (NMDS) plot of fish species abundance and substrate categories. Samples are color-coded according to their hierarchical cluster membership. Environmental variables are shown using gradients in depth and four substrate types (Hard Bottom, Halimeda, Leptoseris, and Montipora).
TABLE 2
| Axis 1 (21.7% total variance) |
|||
| Environment | Tau value | Fish | Tau value |
| Depth | +0.344 | Chromis leucura, Adult | +0.436 |
| Leptoseris sp. | +0.482 | Centropyge potteri, Adult | +0.434 |
| Hard bottom | +0.351 | Apolemichthys arcuatus, Adult | +0.360 |
| Chromis verater, Adult | +0.359 | ||
| Chaetodon kleinii, Adult | +0.342 | ||
| Forcipiger sp., Adult | +0.311 | ||
| Naso hexacanthus, Adult | +0.302 | ||
| Parupeneus multifasciatus, Adult | +0.297 | ||
|
|
|||
| Axis 2 (14.8% total variance) | |||
|
|
|||
| Environment | Tau value | Fish | Tau value |
|
|
|||
| Cirrhilabrus jordani, Juvenile | +0.422 | ||
| Cirrhilabrus jordani, Adult | +0.328 | ||
|
|
|||
| Axis 3 (13.9% total variance) | |||
|
|
|||
| Environment | Tau value | Fish | Tau value |
|
|
|||
| Halimeda | +0.374 | Oxycheilinus bimaculatus, Adult | +0.305 |
Significant Kendall Tau correlations (P < 0.001) of environmental variables and fish species within the axes-space of Non-metric Multidimensional Scaling.
NMDS ordination was used to identify discrete groupings of samples with similar fish community structure, using Hierarchical Clustering with a threshold of 50% for defining groupings (Figure 3). This produced ten clusters and three ungrouped surveys (Table 3 and Figure 3). These clusters, which were grouped primarily by fish species and secondarily by substrate types had descriptors assigned based upon this hierarchy of definition (Table 3). These different groups were then plotted on the NMDS ordination graph (Figure 2) and illustrated the relation of the groups with the substrate-defined axes.
FIGURE 3
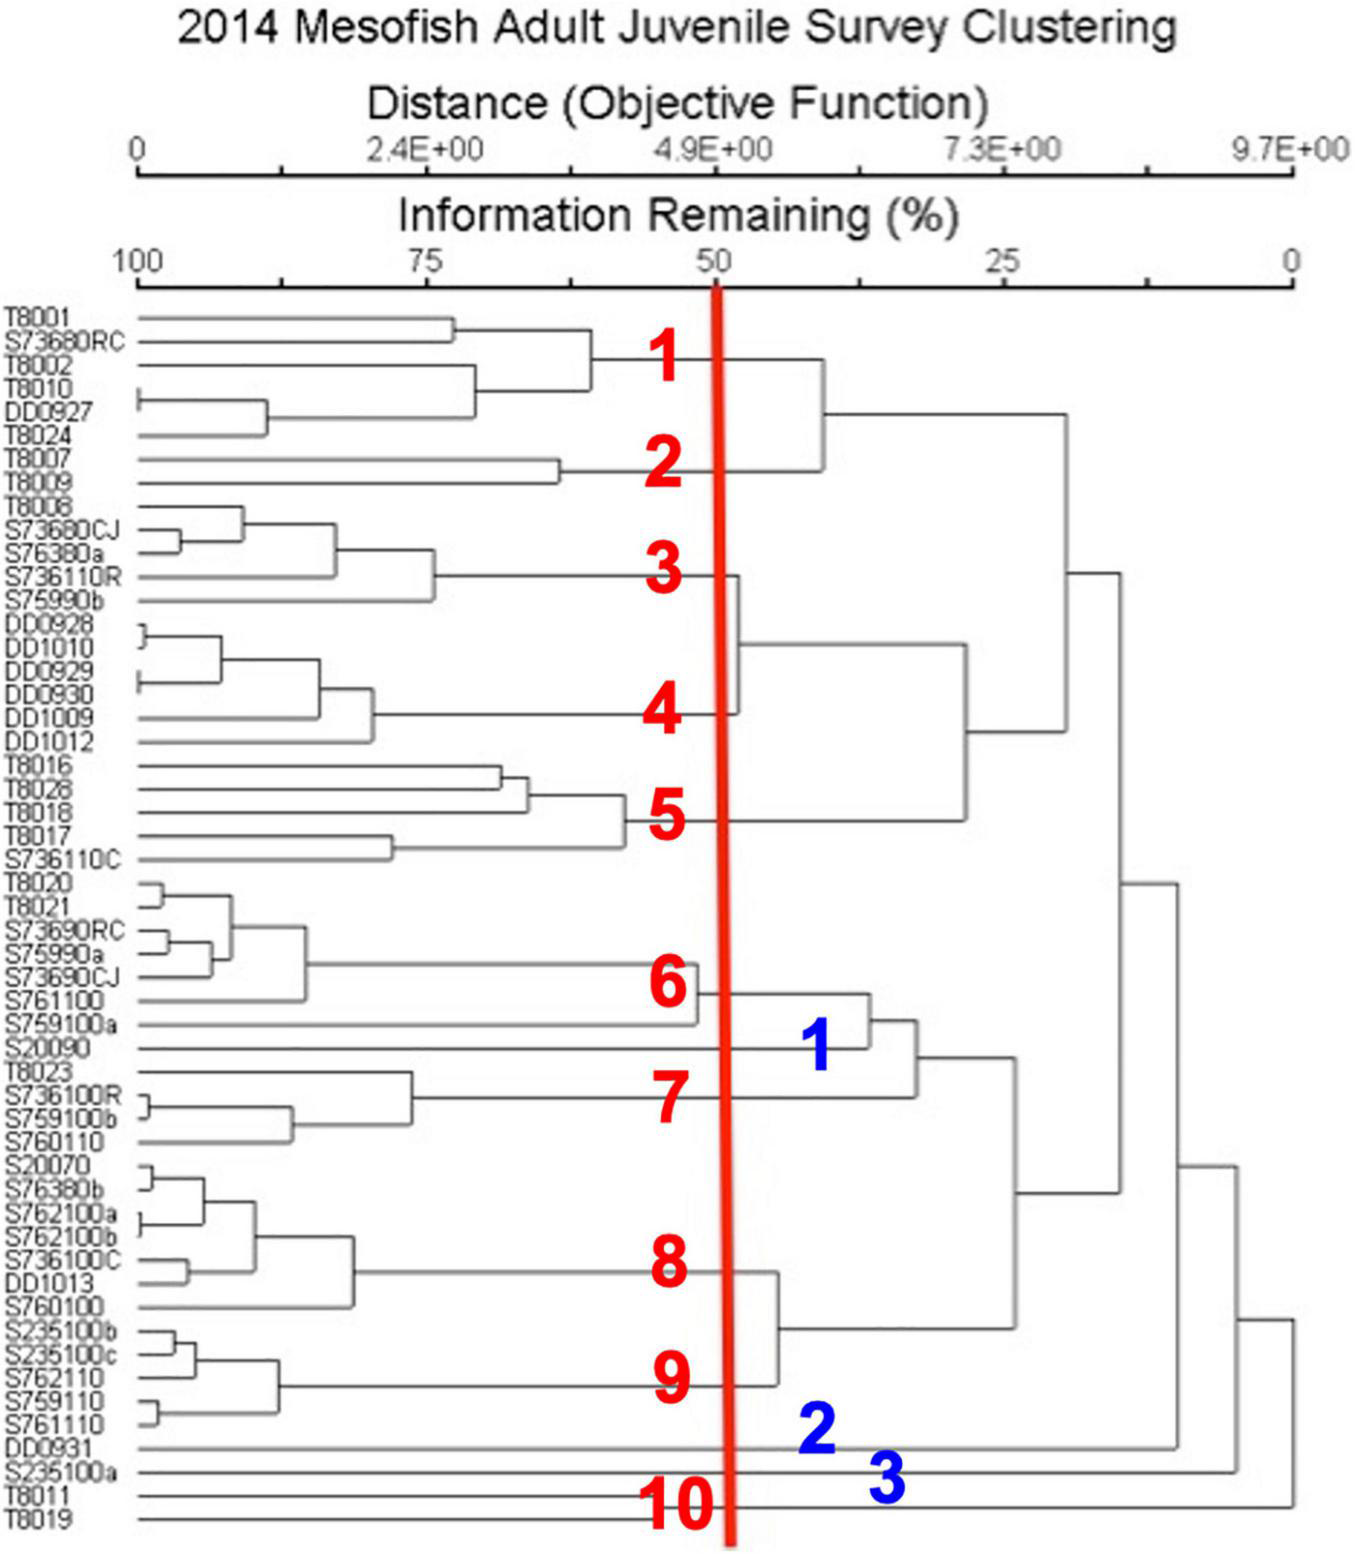
Hierarchical clustering analysis of fish abundance by survey. Red line indicates the 50% explained variance cut-off from the NMDS, red numbers indicate the 10 clusters and blue numbers indicate surveys that were not part of a cluster. Survey by method (T, TOAD; S, Submersible; DD, Deep Diver) and date.
TABLE 3
| Cluster name | # Surveys | Mean depth (m) | Depth range (m) | Dominant fish (% all fish) | # fish species | Dominant substrate (% all cover) | # Substrate types |
| Algal field transition zone with Oxycheilinus bimaculatus | 6 | 75.4 | 65–86.2 | Oxycheilinus bimaculatus A (31) | 19 | Sand (60) | 7 |
| Sand, rubble and algae with Chaetodon miliaris | 2 | 85.2 | 84.6–85.8 | Chaetodon miliaris A (26) | 31 | Sand (40) | 7 |
| Transition zone with Cirrhilabrus jordani | 5 | 88.1 | 72.3–111.1 | Cirrhilabrus jordani A (34) | 46 | Sand (50) | 9 |
| Diver Montipora beds | 6 | 62.7 | 50–70 | Cirrhilabrus jordani J (66) | 7 | Montipora (72) | 4 |
| Sand and rubble with Parapercis schauinslandii | 5 | 102.1 | 88.8–122.7 | Parapercis schauinslandii A (33) | 23 | Sand (53) | 8 |
| Leptoseris bed with Chromis verater and other reef fish | 7 | 92.3 | 85.6–101.5 | Chromis verater A (54) | 69 | Leptoseris (35) | 8 |
| Hard bottom and sand with Lutjanus kasmira and reef fish | 4 | 96.0 | 74.8–109.9 | Lutjanus kasmira A (67) | 51 | Hard bottom (33) | 8 |
| Chromis leucura Leptoseris beds | 7 | 89.8 | 70–100.4 | Chromis leucura A (57) | 44 | Leptoseris (38) | 6 |
| Deep transition zone of Leptoseris bed with Pseudanthias hawaiiensis | 5 | 105.7 | 99.8–110.0 | Pseudanthias hawaiiensis A (56) | 29 | Leptoseris (31) | 6 |
| Shallow transition zone of Leptoseris bed | 2 | 91.7 | 87.9–95.5 | Chaetodon kleinii A (50) | 4 | Sand (56) | 5 |
| Wall edge habitat | 1 | 93.2 | 93.0–93.4 | Luzonichthys earlei A (85) | 24 | Hard bottom (67) | 5 |
| Oxycheilinus bimaculatus in Montipora/Microdictyon field | 1 | 73 | 73 | Oxycheilinus bimaculatus J (100) | 1 | Montipora (50); Microdictyon (50) | 2 |
| Aphraeus rutilans school in a Leptoseris bed | 1 | 99.6 | 99.4–99.8 | Aphareus rutilans A (95) | 4 | Leptoseris, (77) | 3 |
Results of the hierarchical clustering analysis identifying and quantifying the components of clusters.
A, Adul; J, Juvenile.
The grouping pattern appeared to correlate well with the plots of substrate (Figure 4) and fish species (Figure 5) indicating fish assemblages were affected by substrate. There are two clusters of 7 surveys each that are defined by a damsel fish species (Chromis verater or Chromis leucura) and each species association with Leptoseris coral beds (Table 3). Another cluster of six surveys defines shallow Montipora coral beds as habitats with juvenile Cirrhilabrus jordani. A cluster of six surveys shows the relationship of adult Oxychelinus bimaculatus with Halimeda algal beds. A cluster of five surveys defined a transition zone that had adult Cirrhilabrus jordani as the dominant fish species. Clusters defined transition zones, sand and rubble zones and even hard bottom zones (Table 3). The clusters are grouped consistently in regards to their member surveys when plotted (Figure 2) and suggests a strong positive association with substrate. These clusters defined five primary benthic habitats: Sand, Hard Bottom, Leptoseris coral beds, Montipora coral beds and Rubble. While Rubble was never a dominant substrate, it accounted for a large percentage of benthic habitat especially in the transition zone. Three singular surveys had unusual fish abundance that impacted their compatibility with other groups. The two surveys that were dominated by large schools were submersible surveys. In one case at a depth of 99 m, 85% of the observed fish were Aphraeus rutilans. In the other case at a depth 93 m, 95% of the observed fish were Luzonichthys earlei. A TOAD survey recorded a single Oxychelinus bimaculatus at a depth of 73 m (Table 3).
FIGURE 4
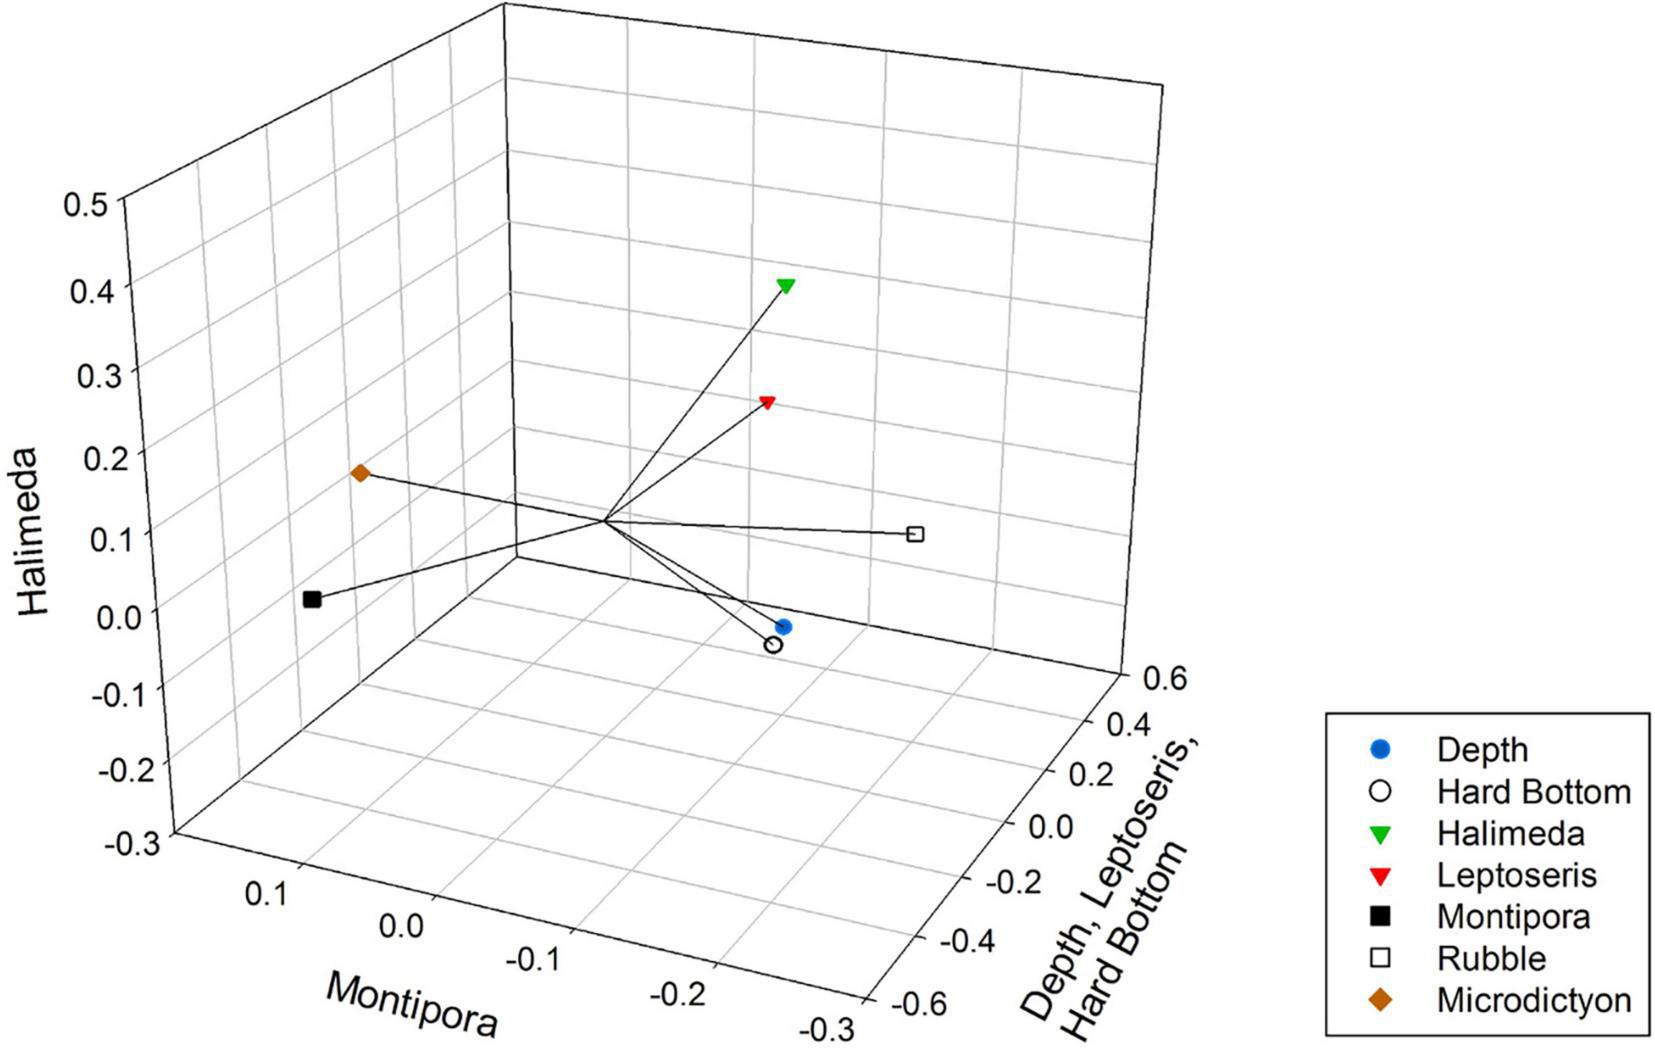
Non-metric Multidimensional Scaling plot of environmental variables, showing their Kendall Tau correlations with the three axes (vectors). Axis one is correlated with depth, Leptoseris and hard bottom. Axis two did not correlate with any substrate and axis three correlated with Halimeda.
FIGURE 5
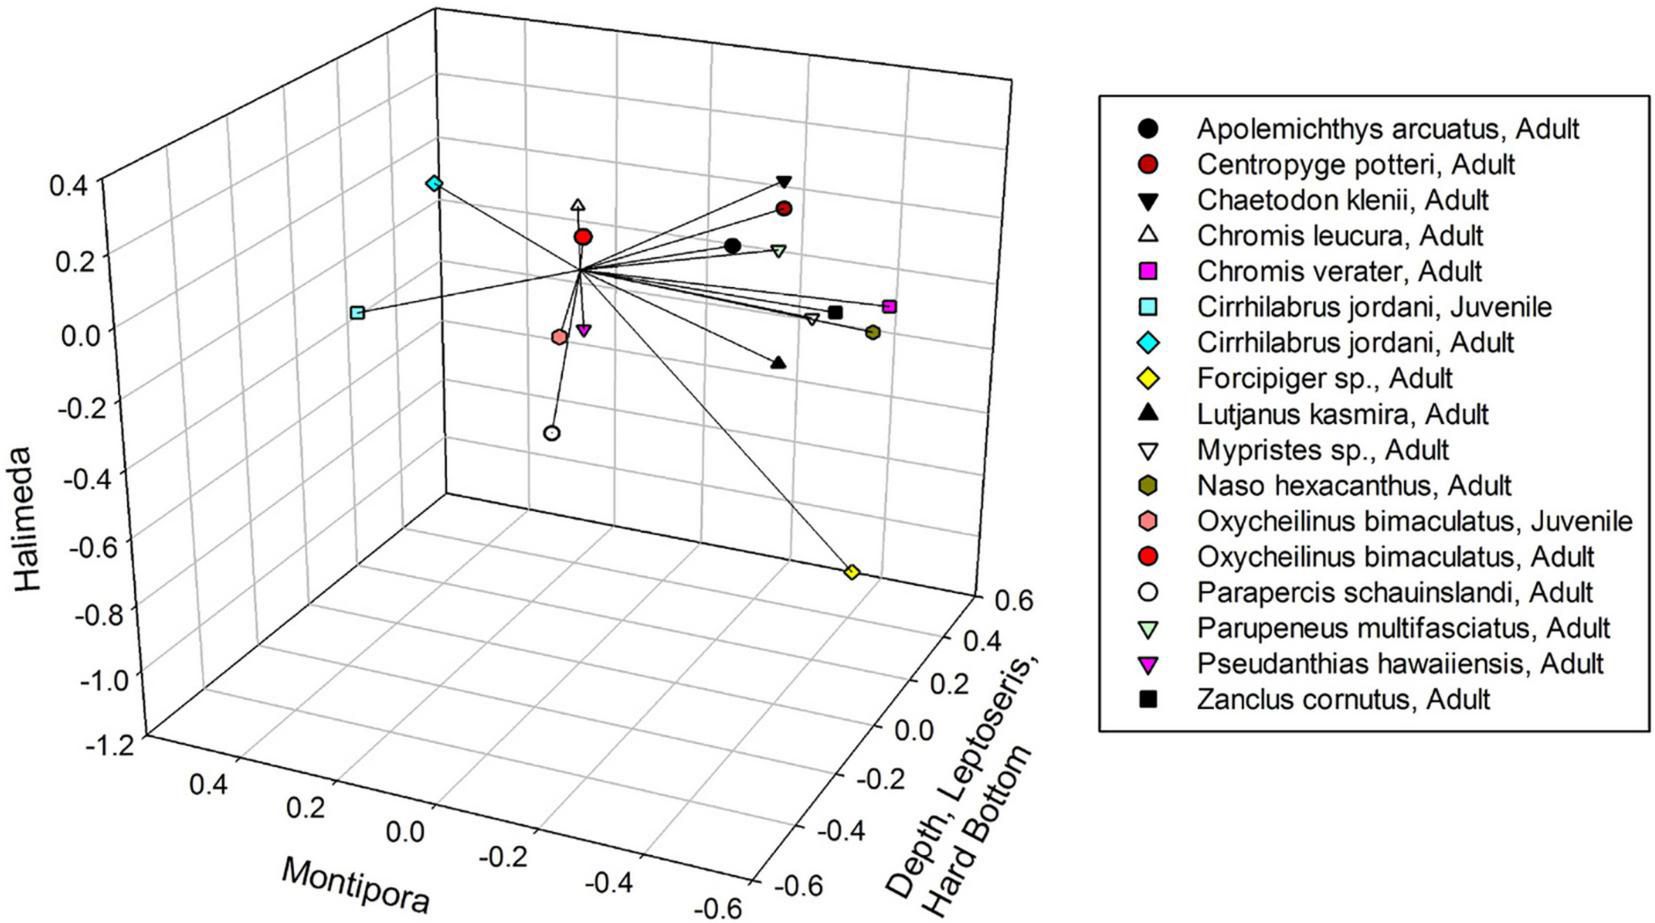
Non-metric Multidimensional Scaling plot of fish species, showing their Kendall Tau correlations with the three axes (vectors). Axis one is correlated with depth, Leptoseris and hard bottom. Axis three is correlated with Halimeda. Axis two is not correlated with any environmental variable.
MRPP showed that fish assemblages differed (P < 0.001) among the five dominant benthic habitat categories (Table 4). Pairwise comparisons of fish assemblages indicated similarities among the benthic habitat types, with Rubble being central, sharing similarities with Sand, Montipora sp. coral bed, and Leptoseris sp. coral bed fish assemblages, whereas the fish assemblages of Hard Bottom only related to those of Leptoseris sp. coral beds (Figure 6). Fish assemblages also significantly differed (P < 0.001) between the six depth bins (Table 5). However, pairwise comparisons indicated relationships among the four shallowest depth bins (50–95 m), with the fish assemblages of the 2 deepest depth bins (96–105 m, 106–115 m) showing no similarities to the shallower depth bins or to each other (Figure 7).
TABLE 4
| Comparison | p-value | A-value |
| Overall | 0.001 | 0.158 |
| Sand vs. Rubble | 0.993 | 0.045 |
| Sand vs. Leptoseris | 0.028 | 0.042 |
| Sand vs. Hard bottom | 0.002 | 0.091 |
| Sand vs. Montipora | 0.020 | 0.051 |
| Rubble vs. Leptoseris | 0.748 | 0.024 |
| Rubble vs. Hard bottom | 0.028 | 0.115 |
| Rubble vs. Montipora | 0.174 | 0.042 |
| Leptoseris vs. Hard bottom | 0.331 | 0.011 |
| Leptoseris vs. Montipora | 0.001 | 0.195 |
| Hard bottom vs. Montipora | 0.001 | 0.192 |
MRPP results of benthic habitat comparison.
Significant results are highlighted with bold font.
FIGURE 6
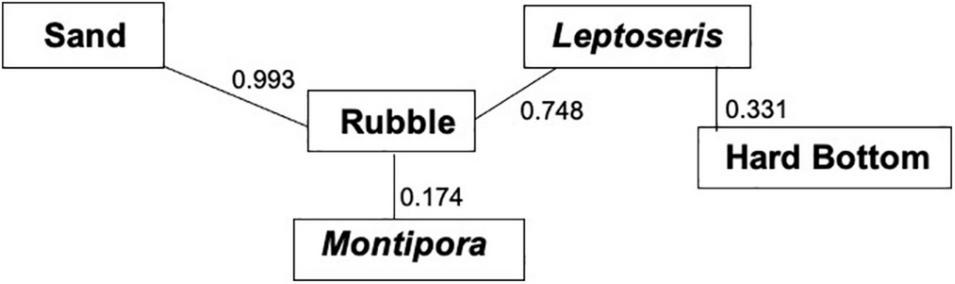
Multi-response permutation procedure (MRPP) relationships for benthic habitat categories. Connected benthic habitat types are not significantly different from one another in terms of their fish assemblages. P-values between the benthic habitat categories are next to the connecting lines.
TABLE 5
| Comparison | p-value | A-value |
| Overall | 0.001 | 0.103 |
| 66–75 m vs. 76–85 m | 0.520 | 0.011 |
| 66–75 m vs. 86–95 m | 0.040 | 0.059 |
| 66–75 m vs. 96–105 m | 0.001 | 0.108 |
| 66–75 m vs. 106–115 m | 0.028 | 0.081 |
| 66–75 m vs. 50–65 m | 0.291 | 0.022 |
| 76–85 m vs. 86–95 m | 0.150 | 0.037 |
| 76–85 m vs. 96–105 m | 0.015 | 0.092 |
| 76–85 m vs. 106–115 m | 0.007 | 0.165 |
| 76–85 m vs. 50–65 m | 0.342 | 0.017 |
| 86–75 m vs. 96–105 m | 0.020 | 0.055 |
| 86–75 m vs. 106–115 m | 0.020 | 0.087 |
| 86–75 m vs. 50–65 m | 0.007 | 0.141 |
| 96–105 m vs. 106–115 m | 0.047 | 0.053 |
| 96–105 m vs. 50–65 m | 0.000 | 0.247 |
| 106–115 m vs. 50–65 m | 0.004 | 0.216 |
MRPP results of depth categories comparison.
Significant results are highlighted with bold font.
FIGURE 7
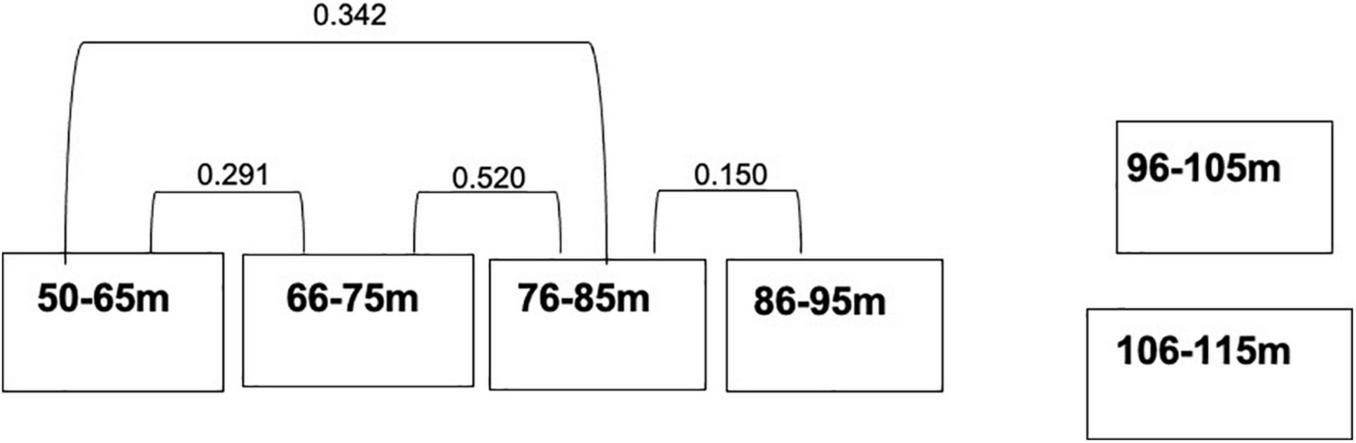
Multi-response permutation procedure relationships for the depth domains. Connected depth types are not significantly different from one another in terms of their fish assemblages. P-values between the substrate categories are next to the connecting lines.
Four significant Indicator Species, with values greater than 50%, were documented (Table 6). Two species were indicators of the deepest depth category (106–115 m): Pseudanthias hawaiiensis and juvenile Parapercis schauinslandii. Another two species were indicators of a hard-bottom substrate: Pseudanthias hawaiiensis and Odontanthias fuscipinnis. Centropyge potteri, was an indicator of Leptoseris sp. coral beds.
TABLE 6
| Group | Species | P-value | Indicator value (%) |
| Depth range: 106–115 m | Pseudanthias hawaiiensis, Adult | 0.001 | 64.5 |
| Depth range: 106–115 m | Parapercis schauinslandi, Juvenile | 0.004 | 50.2 |
| Hard bottom | Pseudanthias hawaiiensis, Adult | 0.001 | 73.3 |
| Hard bottom | Odontanthias fuscipinnis, Adult | 0.001 | 57.3 |
| Leptoseris coral | Centropyge potteri, Adult | 0.009 | 59.0 |
Groups and their indicator species.
To be an Indicator, the species’ value had to ≥ 50%, where 50% was the overall percent of variance explained by NMDS. Significant results are highlighted in bold font.
Discussion
NMDS and HCA discerned fish assemblage associations with benthic substrates and depth in our Au‘au Channel data. NMDS Axis 1 showed the strongest association with increasing depth, hard bottom, and Leptoseris coral cover, whereas Halimeda algal fields were associated with Axis 3. Surveys conducted throughout the Hawaiian Islands by Rooney et al. (2010), Blythe-Skyrme et al. (2013), Costa et al. (2015), and Pyle et al. (2016) corroborate these findings, with Leptoseris coral sp. coverage increasing between the depths of 75 and 110 m and then diminishing at greater depths. Halimeda algal fields are prevalent throughout the Au‘au Channel at 90–100 m depths (Rooney et al., 2010). Leptoseris coral sp. and hard-bottom substrates increased with depth and supported a diversity of fishes including highly abundant planktivores such as Chromis verater and C. leucura. Increases in specific fish trophic groups associated with increasing depth and hard bottom have been described by Thresher and Colin (1986) who saw an increase in planktivores and Asher et al. (2017) who observed greater abundance and species in mobile invertivores.
Oxycheilinus bimaculatus is a wrasse that has a preference for algal beds and rubble fields (Randall, 2007). Halimeda fields comprise much bottom area in the Au‘au Channel (Rooney et al., 2010) and are bordered by transition zones of rubble or sand. Both Oxycheilinus bimaculatus and Halimeda are associated with axis three as indicators of an algal field habitat.
Montipora coral beds, another prevalent substrate in Au‘au Channel (Rooney et al., 2010), occurred only between 50 and 70-m depths; this habitat was populated by small-bodied and juvenile fish, primarily by juvenile and adult Cirrhilabrus jordani. Montipora coral beds were not strongly associated with a specific NMDS axis; however, they were most positively associated (tau value = 0.127) with Axis 2 and both life stages of Cirrhilabrus jordani. Axis 2 thus represents the Montipora coral bed habitat found at 50–70 m.
Large algal beds became obscured in our comparison between fish assemblages and substrate because the surveys that had algal beds contained larger areas of sand, rubble, or Montipora coral. The dominant cover was represented by five groups: Sand, Rubble, Hard Bottom, and Leptoseris and Montipora corals. Rubble was the central substrate with Sand, Montipora, and Leptoseris all associated with Rubble, but with no inter-relationship between each other. This result indicates that rubble is a transitional substrate that borders all of these habitats. Leptoseris coral also was associated with Hard Bottom, most likely because Leptoseris usually occurred in areas that had exposed Hard Bottom (Rooney et al., 2010; Blythe-Skyrme et al., 2013). This is reflected by the axes on our NMDS plot: Axis 3 represents the Halimeda sp. algae (Sand) and transition zones (Rubble), whereas Axis 1 represents the separate Leptoseris coral and Hard Bottom habitats.
Fish assemblages thus were inter-related in a manner that created two groups. The first set of inter-relationships indicates a clear depth range of associated fish assemblages: 50–95 m. This depth pattern seems to form an “upper” mesophotic fish assemblage in the Au‘au Channel. Deeper than 95 m the assemblages are unrelated to each other or the “upper” group which may mean that these depths are either a transition zone to deep ocean fish assemblages or that they form a “lower” mesophotic reef fish assemblage. Pinheiro et al. (2016), Semmler et al. (2016), Baldwin et al. (2018), Rocha et al. (2018), and Weijerman et al. (2019) describe similar breaks in “upper,” “lower,” and “rariphotic” fish assemblages at similar depths.
Four fish species showed relationships with either depth or substrate, with one appearing as an indicator for both. Adult Pseudanthias hawaiiensis and juvenile Parapercis schauinslandi were indicators of the deepest depth range of 106–115 m. Parapercis schauinslandi primarily occupies the sand and rubble that is found to greater extents at this depth. The P. schauinslandi that occur here appear to be mostly juveniles or small adults, which might indicate that the deep sand fields at the edge of Leptoseris beds are locations for juvenile recruitment, analogous to what Brokovich et al. (2007) found for a pomancanthid angelfish in the Gulf of Aqaba.
Centropyge potteri, Pseudanthias hawaiiensis, and Odontanthias fuscipinnis were indicator species for Hard Bottom. Pseudanthias hawaiiensis and O. fuscipinnis are usually found in areas of high relief, such as steep slopes or walls (Randall, 2007), corresponding to our Hard Bottom category. Pseudanthias hawaiiensis is a known deep-water species (Randall, 2007) and Hard Bottom increased as depth increased, further linking this species to the substrate and depth strata. NMDS results associating Centropyge potteri with rugose Leptoseris coral beds are consistent with the species preference for coral reef habitat (Randall, 2007).
ISA and MRPP results are further consistent with the original NMDS analysis, where Pseudanthias hawaiiensis and Centropyge potteri positively associated with Axis 1, the axis of Depth (Pseudanthias hawaiiensis), Hard Bottom (Pseudanthias hawaiiensis), and Leptoseris sp. coral (Centropyge potteri). This result indicates that mesophotic fish assemblages are associated primarily with specific benthic habitats similar to what was observed in the Gulf of Mexico by Dennis and Bright (1988), and in Puerto Rico by Bejarano et al. (2010) and Garcia-Sais (2010).
In the Au‘au Channel of Hawai‘I we observed what appeared to be a distinct “upper” mesophotic fish assemblage and either a “lower” or transitional assemblage as observed by Pinheiro et al. (2016), Semmler et al. (2016), Baldwin et al. (2018), and Weijerman et al. (2019).
Our analysis (NMDS, HCA, MRPP, and ISA) indicate that the mesophotic fish assemblage of the Au‘au Channel can be divided into an “upper” (50–95 m) and “lower” (96–115 m) group with specific species associated with specific benthic habitats. This is similar to what Stefanoudis et al. (2019) observed with mesophotic fish assemblage variance associated primarily with depth followed by benthic habitat. Further studies of fish (and other) assemblage components of mesophotic reef ecosystems are needed to further determine zonation of assemblages with depth and/or benthic habitat.
Publisher’s Note
All claims expressed in this article are solely those of the authors and do not necessarily represent those of their affiliated organizations, or those of the publisher, the editors and the reviewers. Any product that may be evaluated in this article, or claim that may be made by its manufacturer, is not guaranteed or endorsed by the publisher.
Statements
Data availability statement
The raw data supporting the conclusions of this article will be made available by the authors, without undue reservation.
Ethics statement
No animals were sampled by this project and thus there was no requirement for ethical review and approval for an animal study.
Author contributions
RB, FP, and JR conducted the surveys. KH, ED, and RB conducted the data analysis. RB wrote the manuscript. All authors contributed to the article and approved the submitted version.
Funding
Funding for remote camera surveys, submersible dives and technical scuba diving were awarded under NOAA grants: NA10OAR4300132, NA07NOS4780187, NA07NOS4780188, NA07NOS4780189, NA07NOS4780190, NA05OAR4301108, and NA09OAR4300219.
Acknowledgments
We thank C. Kelley for translating the submersible tracks and plots and C. Bradley for her advice and for being a great sub diving buddy. Funding and support was provided through the NOAA NCCOS Deep-CRES Program.
Conflict of interest
The authors declare that the research was conducted in the absence of any commercial or financial relationships that could be construed as a potential conflict of interest.
Supplementary material
The Supplementary Material for this article can be found online at: https://www.frontiersin.org/articles/10.3389/fmars.2021.785308/full#supplementary-material
Footnotes
References
1
Abesamis R. A. Utzurrum J. A. Raterta L. J. Russ G. P. (2020). Shore-fish assemblage structure in the central Philippines from shallow coral reefs to the mesophotic zone.Mar. Biol.1671–15.
2
Arango B. G. Pinheiro H. T. Rocha C. Greene B. D. Pyle R. L. Copus J. M. et al (2019). Three new species of Chromis (Teleostei, Pomacentridae) from mesophotic coral ecosystems of the Philippines.ZooKeys8351–15. 10.3897/zookeys.835.27528
3
Asher J. Williams I. D. Harvey E. S. (2017). Mesophotic depth gradients impact reef fish assemblage composition and functional group partitioning in the Main Hawaiian Islands.Front. Mar. Sci.4:98. 10.3389/fmars.2017.00098
4
Baldwin C. C. Tornabene L. Robertson D. R. (2018). Below the mesophotic.Sci. Rep.8:4920.
5
Bejarano I. Appeldoorn R. S. Nemeth M. (2014). Fishes associated with mesophotic coral ecosystems in La Parguera, Puerto Rico.Coral Reefs33313–328.
6
Bejarano I. Nemeth M. Appledorn R. S. (2010). “Use of mixed-gas rebreathers to access fish assemblages in mesophotic coral ecosystems (MCE) off La Parguera shelf-edge, Puerto Rico,” in Proceedings of the 63rd Gulf and Caribbean Fisheries Institute (Ft. Pierce, FL: Gulf and Caribbean Fisheries Institute), 130–133.
7
Binohlan C. Froese R. (2009). Empirical equations for estimating maximum length from length at first maturity.J. Appl. Ichthyol.25611–613.
8
Blythe-Skyrme V. Rooney J. Parrish F. Boland R. (2013). Mesophotic Coral Ecosystems–Potential Candidates as Essential Fish Habitat and Habitat Areas of Particular Concern. NOAA Administrative Report H-12-03. Honolulu, HI: Pacific Islands Fisheries Science Center.
9
Boland R. C. Parrish F. A. (2005). A description of fish assemblages in the black coral beds off Lahaina. Maui, Hawai‘i.Pac. Sci.59411–420.
10
Bradley C. J. Longnecker K. Pyle R. L. Popp B. N. (2016). Compound-specific isotopic analysis of amino acids reveals dietary changes in mesophotic coral reef fish.Mar. Ecol. Prog. Ser.55865–79.
11
Brokovich E. Einbinder S. Kark S. Shashar N. Kiflawi M. (2007). A deep nursery for juveniles of the zebra angelfish Genicanthus caudovittatus.Environ. Biol. Fishes801–6.
12
Brokovich E. Einbinder S. Shashar N. Kiflawi M. Kark S. (2008). Descending to the twilight-zone: changes in coral reef fish assemblages along a depth gradient down to 65 m.Mar. Ecol. Prog. Ser.371253–262.
13
Coleman R. B. Copus J. M. Coffey D. M. Whitton R. K. Bowen B. W. (2018). Shifting reef fish assemblages along a depth gradient in Pohnpei, Micronesia.PeerJ6:e4650. 10.7717/peerj.4650
14
Costa B. Kendall M. S. Parrish F. A. Rooney J. Boland R. C. Chow M. et al (2015). Identifying suitable locations for mesophotic hard corals offshore of Maui, Hawai‘i.PLoS One10:e0130285. 10.1371/journal.pone.0130285
15
Dennis G. D. Bright T. J. (1988). Reef fish assemblages on hard banks in the Northwestern Gulf of Mexico.Bull. Mar. Sci.43280–307.
16
Froese R. Pauly D. (eds) (2014). FishBase.Washington, DC: World Wide Web electronic publication.
17
Fukunaga A. Kosaki R. K. Wagner D. (2017). Changes in mesophotic reef fish assemblages along depth and geographical gradients in the Northwestern Hawaiian Islands.Coral Reefs36785–790.
18
Fukunaga A. Kosaki R. K. Wagner D. Kane C. (2016). Structure of mesophotic reef fish assemblages in the Northwestern Hawaiian Islands.PLoS One11:e0157861. 10.1371/journal.pone.0157861
19
Garcia-Sais J. R. (2010). Reef habitats and associated sessile-benthic and fish assemblages across a euphotic-mesophotic depth gradient in Isla Desecheo, Puerto Rico.Coral Reefs29277–288.
20
Grigg R. W. Grossman E. E. Earle S. A. Gittings S. R. Lott D. McDonough J. (2002). Drowned reefs and antecedent karst topography, Au‘au channel, S.E. Hawaiian Islands.Coral Reefs2173–82.
21
Hinderstein L. M. Marr J. C. A. Martinez F. A. Dowgiallo M. J. Puglise K. A. Pyle R. L. et al (2010). Theme section on “mesophotic coral ecosystems: characterization, ecology, and management”.Coral Reefs29247–251.
22
Kahng S. E. Kelley C. (2007). Vertical zonation of habitat forming benthic species on a deep photosynthetic reef (50–140 m) in the Au‘au Channel, Hawaii.Coral Reefs26679–687.
23
Kane C. Kosaki R. K. Wagner D. (2014). High levels of mesophotic reef fish endemism in the Northwestern Hawaiian Islands.Bull. Mar. Sci.90693–703.
24
Kelley C. Moffitt R. Smith J. R. (2005). Mega- to micro-scale classification and description of bottomfish essential fish habitat on four banks in the Northwestern Hawaiian Islands.Atoll Res. Bull.453318–332.
25
Kenkel N. C. Orloci L. (1986). Applying metric and nonmetric multidimensional scaling to ecological studies: some new results.Ecology67919–923.
26
Kosaki R. K. Pyle R. L. Leonard J. Hauk B. Whitton R. K. Wagner D. (2016). 100% endemism in mesophotic reef fish assemblages at Kure Atoll, Northwestern Hawaiian Islands.Mar. Bio. Divers.47783–784.
27
Legendre P. Legendre L. (1998). Numerical Ecology, 2nd Edn. Amsterdam: Elsevier.
28
Lindfield S. J. Harvey E. S. Halford A. R. McIlwain J. L. (2016). Mesophotic depths as refuge areas for fishery-targeted species on coral reefs.Coral Reefs35125–137.
29
Lukens R. R. (1981). Observations of deep-reef ichthyofauna from the Bahama and Cayman Islands, with notes on relative abundance and depth distribution.Gulf Res. Rep.7179–81.
30
McCune B. Grace J. B. (2002). Analysis of Ecological Communities.Gleneden Beach, OR: MjM Software Design.
31
Parrish F. A. Boland R. C. (2004). Habitat and reef-fish assemblages of banks in the Northwestern Hawaiian Islands.Mar. Biol.1441065–1073.
32
Parrish F. A. Craig M. P. Ragen T. J. Marshall G. J. Buhleier B. M. (2000). Identifying diurnal foraging habitat of endangered Hawaiian monk seals using a seal-mounted video camera.Mar. Mamm. Sci.16244–258.
33
Pearson R. Stevens T. (2015). Distinct cross-shelf gradient in mesophotic reef fish assemblages in subtropical eastern Australia.Mar. Ecol. Prog. Ser.532185–196.
34
Pinheiro H. T. Goodbody-Gringhy G. Jessup M. E. Shepard B. Chequer A. D. Rocha L. A. (2016). Upper and lower mesophotic coral reef fish communities evaluated by underwater visual censuses in two Caribbean locations.Coral Reefs35139–151.
35
Pochon X. Forsman Z. Spalding H. Padilla-Gaminϸo J. Smith C. Gates R. (2015). Depth specialization in mesophotic corals (Leptoseris spp.) and associated algal symbionts in Hawai’i.R. Soc. Open Sci.2:140351. 10.1098/rsos.140351
36
Price J. P. Elliott-Fisk D. (2004). Topographic history of the Maui Nui complex, Hawai’i and its implications for biogeography.Pac. Sci.5827–45.
37
Pyle R. L. (1996). The twilight zone.Nat. Hist.10559–62.
38
Pyle R. L. Boland R. Bolick H. Bowen B. W. Bradley C. J. Kane C. et al (2016). A comprehensive investigation of mesophotic coral ecosystems in the Hawaiian Archipelago.PeerJ4:e2475. 10.7717/peerj.2475
39
Pyle R. L. Earle J. L. Greene B. D. (2008). Five new species of the damsel fish genus Chromis (Perciformes: Labroidei: Pomacentridae) from deep coral reefs in the tropical western Pacific.Zootaxa16713–31.
40
Randall J. E. (2005). Reef and Shore Fishes of the South Pacific, New Caledonia to Tahiti and the Pitcairn Islands.Honolulu, HI: University of Hawaii.
41
Randall J. E. (2007). Reef and Shore Fishes of the Hawaiian Islands.Honolulu, HI: University of Hawaii.
42
Rocha L. A. Pinheiro H. T. Shepherd B. Papastamatiou Y. P. Luiz O. J. Pyle R. L. et al (2018). Mesophotic coral ecosystems are threatened and ecologically distinct from shallow water reefs.Science361281–284. 10.1126/science.aaq1614
43
Rocha L. A. Pinheiro H. T. Wandell M. Rocha C. R. Shepherd B. (2017). Roa rumsfeldi, a new butterflyfish (Teleostei, Chaetodontidae) from mesophotic coral ecosystems of the Philippines.ZooKeys709127–134. 10.3897/zookeys.709.20404
44
Rooney J. Donham E. Montgomery A. Spalding H. Parrish F. Boland R. C. et al (2010). Mesophotic coral ecosystems in the Hawaiian Archipelago.Coral Reefs29361–367. 10.7717/peerj.2475
45
Semmler R. F. Hoot W. C. Reaka M. L. (2016). Are mesophotic coral ecosystems distinct communities and can they serve as refugia for shallow reefs?Coral Reefs36434–444. 10.1371/journal.pone.0188598
46
Sih T. L. Cappo M. Kingsford M. (2017). Deep-reef fish assemblages of the Great Barrier Reef shelf-break (Australia).Sci. Rep.7:10886. 10.1038/s41598-017-11452-1
47
Spalding H. L. Conklin K. Y. Smith C. M. O’Kelly C. J. Sherwood A. R. (2016). New Ulvaceae (Ulvophyceae, Chlorophyta) from mesophotic ecosystems across the Hawaiian archipelago.J. Phycol.5240–53. 10.1111/jpy.12375
48
Spalding H. L. Copus J. M. Bowen B. W. Kosaki R. K. Longenecker K. Montgomery A. D. et al (2019). “The Hawaiian Archipelago,” in Mesophotic Coral Reef Ecosystems, edsLoyaY.PugliseK. A.BridgeT. (Cham: Springer Nature), 445–464.
49
Stefanoudis P. V. Gress E. Pitt J. M. Smith S. R. Kincaid T. Rivers M. et al (2019). Depth-dependent structuring of reef fish assemblages from the shallows to the rariphotic zone.Front. Mar. Sci.6:307. 10.3389/fmars.2019.00307
50
Thresher R. E. Colin P. L. (1986). Trophic structure, diversity and abundance of fishes of the deep reef (30-300m) at Enewetak, Marshall Islands.Bull. Mar. Sci.38253–272.
51
Weijerman M. Grüss A. Dove D. Asher J. Williams I. D. Kelley C. et al (2019). Shining a light on the composition and distribution patterns of mesophotic and subphotic fish communities in Hawai ‘i.Mar. Ecol. Prog. Ser.630161–182.
52
Williams J. Jordan A. Harasti D. Davies P. Ingleton T. (2019). Taking a deeper look: quantifying the differences in fish assemblages between shallow and mesophotic temperate rocky reefs.PLoS One14:e0206778. 10.1371/journal.pone.0206778
Summary
Keywords
mesophotic, reef, fish, depth, substrate
Citation
Boland RC, Hyrenbach KD, DeMartini EE, Parrish FA and Rooney JJ (2022) Quantifying Mesophotic Fish Assemblages of Hawai‘i’s Au‘au Channel: Associations With Benthic Habitats and Depth. Front. Mar. Sci. 8:785308. doi: 10.3389/fmars.2021.785308
Received
29 September 2021
Accepted
09 December 2021
Published
05 January 2022
Volume
8 - 2021
Edited by
Maren Ziegler, University of Giessen, Germany
Reviewed by
Darren James Coker, King Abdullah University of Science and Technology, Saudi Arabia; Rene A. Abesamis, Silliman University, Philippines
Updates
Copyright
© 2022 Boland, Hyrenbach, DeMartini, Parrish and Rooney.
This is an open-access article distributed under the terms of the Creative Commons Attribution License (CC BY). The use, distribution or reproduction in other forums is permitted, provided the original author(s) and the copyright owner(s) are credited and that the original publication in this journal is cited, in accordance with accepted academic practice. No use, distribution or reproduction is permitted which does not comply with these terms.
*Correspondence: Raymond C. Boland, Raymond.Boland@noaa.gov
†Deceased
This article was submitted to Coral Reef Research, a section of the journal Frontiers in Marine Science
Disclaimer
All claims expressed in this article are solely those of the authors and do not necessarily represent those of their affiliated organizations, or those of the publisher, the editors and the reviewers. Any product that may be evaluated in this article or claim that may be made by its manufacturer is not guaranteed or endorsed by the publisher.