Abstract
The small yellow croaker, Larimichthys polyactis, is a keystone species in the Yellow Sea and the East China Sea, with significant impacts on the regional ecosystem, but has experienced decades of population decline as a result of environmental changes and overfishing. The settlement of post-larval L. polyactis is a period of high mortality, with impacts on population recruitment and survival. This study examines the feeding habits of 49 post-larval and early juvenile L. polyactis in the Yangtze River estuary, in order to reveal diet composition before and after the settlement period. DNA barcoding methods (MiSeq and TA cloning) were used to examine gastrointestinal contents in detail. Both methods revealed that dietary breadth increased with increasing body length, while the dominance of copepods in the diet decreased as the body length increased. Post-larva (body length < 17 mm in this study) primarily fed on copepods. At the beginning of settlement (body length between 17 and 19 mm), L. polyactis began to ingest larger organisms, such as fishes and mysids, along with copepods. Larger early juveniles (body length > 20 mm) demonstrated a much wider dietary breadth, implying that successful settlement had occurred. Diet species richness in the MiSeq group was significantly greater than species richness in the TA cloning group, making the trend more pronounced within the MiSeq group. This indicates that the MiSeq method was more efficient than TA cloning in this study. We recommend that future research to investigate the feeding habits of fish larvae should combine MiSeq and visual examination methods.
Introduction
The small yellow croaker (Larimichthys polyactis) is a demersal marine fish, mainly distributed in marginal seas in eastern China, around southern Japan, and the Korean Peninsula (Froese and Pauly, 2017). As a keystone species in the Yellow Sea and the East China Sea, its population dynamics and interactions with the abiotic and biotic environments have a more significant impact than many other species on the regional ecosystem (Tang and Su, 2000; Zheng et al., 2003; Jin et al., 2005). Over the last seven decades, yellow croaker populations in the Yellow Sea and the East China Sea have experienced a long-term decline in L50 (body length at median sexual maturity) and A50 (age at median sexual maturity). This is thought to be caused by environmental changes, such as rising sea surface temperature and overfishing (Li et al., 2011). Most small yellow croakers caught in the Yellow Sea and the East China Sea over recent years have been less than 1 year old (Jin et al., 2005; Lin et al., 2011). As a result, there is increasing concern over the longer-term survival of yellow croaker populations and potential impacts on the sustainability of the regional ecosystem and fishery.
Food quantity, quality, and timing are essential to the recruitment and survival of larval fish populations (Cushing, 1990; Beaugrand et al., 2003; Burrow et al., 2011; Swalethorp et al., 2014). Thus, research on fish feeding habits could provide important information on the survival and sustainability of local small yellow croaker populations. The ontogenetic, diel, seasonal, and spatial variations in the feeding habits of the small yellow croaker have been analyzed by visual gastrointestinal content analysis (Lin, 1962; Xue et al., 2005; Guo et al., 2010). However, visual identification of prey from gastrointestinal contents requires comprehensive taxonomic expertise, and a significant proportion of unrecognizable remains is often excluded from subsequent analysis (Xue et al., 2005; Guo et al., 2010; Landaeta et al., 2015). Detecting just one or two additional prey species from stomach contents could lead to different conclusion about the feeding strategy of a species (Boling et al., 2012; Leray et al., 2013; Huang et al., 2014), so unidentified components should never be disregarded during gastrointestinal content analysis. Several techniques have been adopted to enhance diet analysis, among which DNA-based techniques are widely used, due to their significant efficiency and versatility (Symondson, 2002; King et al., 2008; Navarrete et al., 2009). Depending on the particular study objectives, prey-specific DNA may be identified using PCRs with species-specific, group-specific, or universal primers. Although universal primers are the most efficient for identifying prey items, they usually simultaneously amplify a vast amount of host DNA due to low species-specificity (Suzuki et al., 2006, 2008). PCR clamping could be the most promising approach to improve this situation by including a predator species-specific annealing blocking primer in the PCR to prevent the amplification of predator DNA (Vestheim and Jarman, 2008; Leray et al., 2013).
The technical advances of next-generation sequencing (NGS, also known as high-throughput sequencing) enable the sequencing of vast quantities of different DNA or RNA segments, from different species simultaneously, by performing “massive parallel analysis” (Liu et al., 2013). This allows the most comprehensive description of the composition of the tested sample. Previous studies have adopted the advantages of MiSeq in investigating the intestinal microbiome of fishes (Franchini et al., 2014; Li et al., 2014); however, no studies have reported using this technique to elucidate complex shifts in the feeding habits of fish larvae or juveniles.
As a demersal fish, the settlement of the small yellow croaker involves a movement from open to coastal water, as pelagic larvae become benthic juveniles (Chen et al., 2015; Lin et al., 2018). The Yangtze River estuary is a vital nursery ground for the small yellow croaker, where post-larva and juveniles dominate the developmental stages (Lin et al., 2018). High mortality during settlement is observed in coral reef fishes (Doherty et al., 2004), which may partially attribute to the poor availability of suitable prey and shifts in feeding habits during the settlement period. The prosperous prey organisms in the Yangtze River estuary may thus be an important factor in the successful settlement of small yellow croakers. This study uses molecular techniques to examine the gastrointestinal contents of post-larval and early juvenile small yellow croakers in the region to reveal their feeding habits during the settlement period.
Materials and Methods
Fish Sampling Techniques
Samples were collected every month by conducting horizontal tows (at speeds of 1–2 knots) with a plankton net (1.3 m diameter, 6 m length, and 0.5 mm mesh) in the East China Sea, from April to July 2017. At two of the survey sites in the Yangtze River Estuary region (Figure 1), between April and June, a total of 49 post-larval and juvenile small yellow croakers (L. polyactis) were collected and stored in absolute ethanol at −20°C. The specimens were sorted into post-larva and juvenile, based on their morphology, using the method of Kendall et al. (1984), and their body length was measured. Then, individual animals were allocated to one of the 11 groups, distinguished by developmental stage and average body length. Then, 6 groups were allocated to analysis using TA cloning, and 5 groups were allocated to analysis using MiSeq sequencing (Table 1).
FIGURE 1
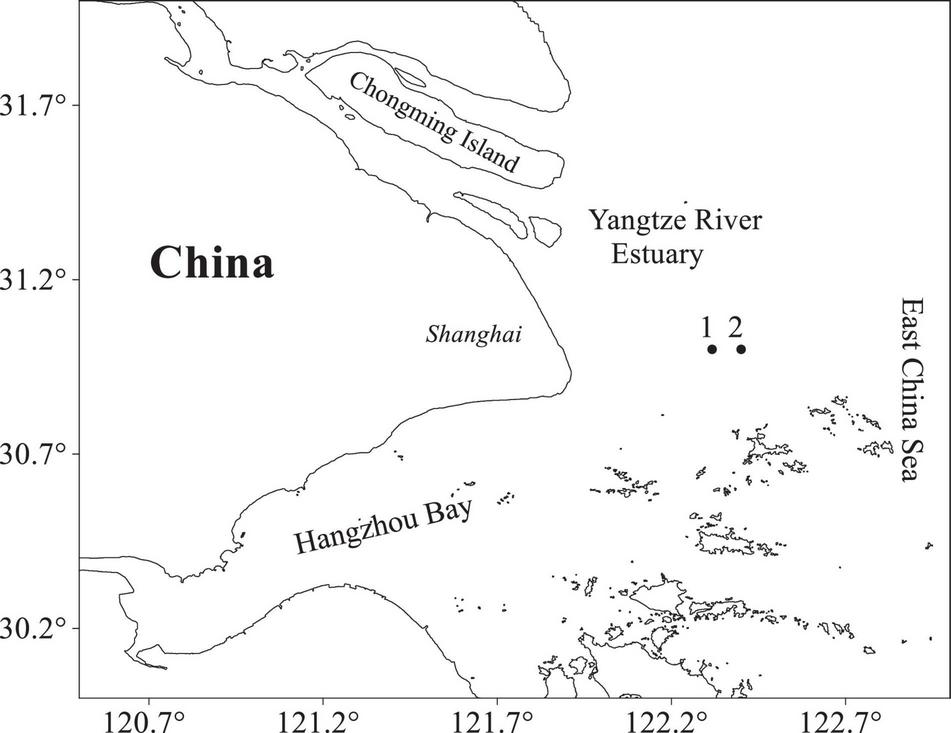
Locations of sampling sites in the Yangtze River Estuary region. Numbers 1 and 2 are sampling locations.
TABLE 1
| Sample | Development stage | Method | Average body length (mm) | Standard deviation (mm) | Number of specimens |
| A | Post-larvae | TA cloning | 14.06 | 1.22 | 7 |
| B | Post-larvae | TA cloning | 15.92 | 0.33 | 4 |
| C | Post-larvae | TA cloning | 17.92 | 0.87 | 3 |
| D | Juveniles | TA cloning | 22.01 | 0.59 | 3 |
| E | Juveniles | TA cloning | 25.31 | 0.63 | 3 |
| F | Juveniles | TA cloning | 32.14 | 2.56 | 3 |
| G | Post-larvae | Miseq | 13.54 | 0.42 | 14 |
| H | Post-larvae | Miseq | 17.77 | 0.40 | 3 |
| J | Juveniles | Miseq | 19.00 | 0.46 | 3 |
| K | Juveniles | Miseq | 21.21 | 1.21 | 3 |
| L | Juveniles | Miseq | 31.89 | 1.17 | 3 |
Larimichthys polyactis samples, developmental stages, analysis methods, and body lengths.
DNA Extraction From Gastrointestinal Contents
Each specimen was carefully washed with sterile ddH2O (double-distilled water) to eliminate contaminants from the body surface. Then, the entire gastrointestinal tract was exposed, on a clean bench, and the gastrointestinal contents were removed using a fine acupuncture needle under a stereoscope. Gastrointestinal contents from all animals in the same group (groups A–L) were pooled for DNA analysis. Then, genome DNA was extracted from each group using a TaKaRa MiniBEST Universal Genomic DNA Extraction Kit (Takara Biomedical Technology Co., Ltd., China).
TA Cloning
To prevent co-amplification of predator DNA, during PCR, we included an L. polyactis-specific annealing blocking primer as used by Leray et al. (2013). Three primers were designed as below: 5′-GGWACWGGWTGAACWGTWTAYCCYCC-3′ (mlCOIintF), 5′-TANACYTCNGGRTGNCCRAARAAYCA-3′ (jgHCO2198), and 5′-GTCTACCCCCCACTTGCTGGAAATCT-3′ (annealing primer, with Spacer C3 CPG to 3′).
The PCR was performed using a TaKaRa Ex Taq® Kit (Takara), in a volume of 50 μl, which contained 1 μl each of mlCOlintF primer (10 μM), jgHCO2198 primer (10 μM) and annealing primer (100 μM), 0.25 μl of ExTaq (5 U/μl), 5 μl of 10× Ex Taq Buffer (Mg2+ Plus), 4 μl of dNTP (2.5 mM), and 1 μl of genome DNA. Touchdown PCR programs were carried out at 95°C for 4 min followed by 5 cycles of 95°C for 30 s, then 60°C for 45 s (-1°C per cycle), and 72°C for 45 s, followed by 30 cycles of 55°C with the annealing primer, and a final extension at 72°C for 10 min.
The amplified products were analyzed using a 2% agarose gel electrophoresis and purified using a TIANgel Midi Purification Kit [TIANGEN Biotech (Beijing) Co., Ltd., China]. The isolated fragments were ligated into the pGEM-T Easy vector (Promega, Madison, WI, United States) and transformed into DH5α strain of Escherichia coli [TIANGEN Biotech (Beijing) Co., Ltd., China]. Recombinant clones were incubated overnight at 37°C in Luria-Broth, containing 1.5% agar and ampicillin (50 μg/ml), following selection of colonies by blue-white plaque screening. A total of 30 white colonies were picked up and analyzed by PCR, to screen the size of inserted fragments. After overnight culturing, the colonies were sent to Sangon Biotech Company (Shanghai, China) for plasmid DNA extraction and DNA sequencing.
MiSeq Sequencing
The genome DNA of samples in MiSeq groups were also amplified using PCR (95°C for 4 min, 30 cycles of 95°C for 30 s, 60°C for 45 s, and 72°C for 45 s, followed by a final extension at 72°C for 10 min) using the primers mlCOIintF and jgHCO2198, where a barcode was an eight-base sequence unique to each sample. PCR reactions were performed in a triplicate 20 μl mixture containing 4 μl of 5× FastPfu buffer, 2 μl of 2.5 mM dNTPs, 0.8 μl of each primer (5 μM), 0.4 μl of FastPfu polymerase, and 10 ng of template DNA. The amplicons were extracted from a 2% agarose gel and then purified using the AxyPrep DNA Gel Extraction Kit (Axygen Biosciences, Union City, CA, United States) and quantified using QuantiFluor™-ST (Promega) according to the protocol of the manufacturer.
Purified amplicons were pooled in equimolar and paired-end sequenced (2 × 300) on an Illumina MiSeq platform (Illumina, San Diego, CA, United States), according to the standard protocols by Majorbio Bio-Pharm Technology Co. Ltd. (Shanghai, China). When processing sequencing data, raw FASTQ files were demultiplexed, quality-filtered by Trimmomatic, and merged by FLASH with the following criteria: (i) the reads were truncated at any site receiving an average quality score <20 over a 50 bp sliding window; (ii) primers were matched exactly, allowing 2 nucleotide mismatches, and reads containing ambiguous bases were removed; and (iii) sequences whose overlap was longer than 10 bp were merged according to their overlap sequence. Operational taxonomic units (OTUs) were clustered with 97% similarity cutoff using UPARSE (version 7.11), and chimeric sequences were identified and removed using UCHIME. The taxonomy of each COI gene sequence was analyzed using the RDP Classifier algorithm2 against the FGR database (release 7.3) using a confidence threshold of 70%.
Data Analysis
Operational taxonomic units belonging to L. polyactis, fungi, parasites, and obvious contaminants were excluded from further analysis. Species taxonomic ranks mainly referred to the Worms database (WoRMS Editorial Board, 2021) and Eschmeyer’s Catalog of Fishes Online Database (Fricke et al., 2021). Diversity was represented by species richness (number of species) and the Shannon-Wiener index. Some of the data did not conform to a normal distribution (Shapiro-Wilk test), so the Mann-Whitney U test was used to test for differences in body length, species richness, and Shannon-Wiener index. Non-metric Multidimensional Scaling (NMDS) and analysis of similarities (ANOSIM) were performed on the square-rooted species matrix. The Vegan package (Oksanen et al., 2020) and Tidyverse package (Wickham et al., 2019) were used for data analysis. All statistical analyses were performed with R 4.1.0 (R Core Team, 2021).
Ethical Statement
The present experimental procedures were carried out in strict accordance with the recommendations in the ethical guidelines of EU Directive 2010/63/EU for animal experiments.
Results
After removing the amplicons of L. polyactis, possible contaminants (i.e., Homo sapiens) and parasites (i.e., Hematodinium sp.1), 26, 29, 30, 30, 30, and 30 amplicons remained for each sample of the TA cloning group (samples A–F), respectively, and 9881, 21223, 10526, 10506, and 18761 amplicons remained for each sample of the MiSeq group (samples G, H, J, K, and L), respectively. Algae and rotifers were not excluded (Nannochloropsis limnetica and Paralia sulcata) because it was difficult to determine whether they were (actively or incidentally) consumed from surrounding water or indirectly ingested through other herbivorous zooplankton, especially bearing in mind that freshwater species can be washed out of an estuary in the runoff. As a result, 31 prey species were identified across different taxonomic orders belonging to nine phyla. MiSeq sequencing identified 27 prey species, compared to 13 species by the TA cloning, showing an enhanced ability to detect rare OTUs. L. polyactis feeds on plankton (e.g., copepods, jellyfish, mysids, arrow worms, and krill), co-occurring larval fishes or possibly fish eggs, even sessile larva (e.g., barnacles), and benthic organisms (e.g., mud snails, and crabs). Most of these are dominant species or common species in the Yangtze River Estuary. Copepods have the highest species richness of all taxa in the prey list, followed by fishes, crabs, and mysids (Table 2).
TABLE 2
| Kingdom | Phylum | Class | Order | Family | Species name | Spp. Abbrev.* | MiSeq† | TA† |
| Chromista | Ochrophyta | Eustigmatophyceae | Eustigmatales | Monodopsidaceae | Nannochloropsis limnetica | nl | + | |
| Bacillariophyceae | Paraliales | Paraliaceae | Paralia sulcata | ps | + | |||
| Animalia | Cnidaria | Hydrozoa | Anthoathecata | Bougainvilliidae | Nemopsis bachei | nb | + | |
| Limnomedusae | Geryoniidae | Liriope tetraphylla | lt | + | ||||
| Ctenophora | Ctenophora sp.1 | ct | + | + | ||||
| Rotifera | Eurotatoria | Philodinida | Philodinidae | Macrotrachela sp.1 | ma | + | ||
| Rotifera sp.1 | ro | + | ||||||
| Mollusca | Gastropoda | Neogastropoda | Nassariidae | Nassarius variciferus | nv | + | ||
| Annelida | Polychaeta | Polychaeta sp.1 | po | + | ||||
| Arthropoda | Hexanauplia | Calanoida | Paracalanidae | Paracalanus aculeatus | pa | + | ||
| Paracalanus parvus | pp | + | + | |||||
| Pontellidae | Labidocera euchaeta | le | + | + | ||||
| Pseudodiaptomidae | Pseudodiaptomus poplesia | pd | + | + | ||||
| Tortanidae | Tortanus vermiculus | tv | + | + | ||||
| Cyclopoida | Corycaeidae | Ditrichocorycaeus affinis | da | + | ||||
| Unclassified copepoda sp.1 | u1 | + | + | |||||
| Thecostraca | Sessilia | Balanidae | Amphibalanus sp.1 | am | + | |||
| Malacostraca | Euphausiacea | Euphausiidae | Pseudeuphausia sinica | pu | + | |||
| Decapoda | Sesarmidae | Orisarma dehaani | od | + | ||||
| Varunidae | Helice tientsinensis | ht | + | |||||
| Neoeriocheir leptognathus | ne | + | ||||||
| Amphipoda | Gammaridea sp.1 | ga | + | |||||
| Mysida | Mysidae | Hyperacanthomysis brevirostris | hb | + | ||||
| Iiella pelagica | ip | + | + | |||||
| Mysida sp.1 | my | + | ||||||
| Chaetognatha | Sagittoidea | Aphragmophora | Sagittidae | Zonosagitta nagae | zn | + | ||
| Chordata | Actinopteri | Syngnathiformes | Callionymidae | Callionymus olidus | co | + | + | |
| Gobiiformes | Gobiidae | Chaeturichthys stigmatias | cs | + | ||||
| Mugiliformes | Mugilidae | Planiliza haematocheilus | ph | + | ||||
| Acropomatiformes | Lateolabracidae | Lateolabrax japonicus | lj | + | ||||
| Unclassified | Unclassified sp.1 | u2 | + |
Prey species of post-larval and juvenile L. polyactis.
*Spp. Abbrev, species name abbreviations.
† “+” indicates species occurrence.
Species richness ranged between 2 and 17 species, with a Shannon-Wiener index ranging from 0.53 to 1.95. Species richness and Shannon-Wiener index tended to increase with body length, meaning that prey species diversity was generally greater for larger L. polyactis, but the trend was more pronounced in the MiSeq group (Figures 2A,B). There was no significant difference in the body length (Mann-Whitney U test, W = 225, P > 0.05) or Shannon-Wiener index (Mann-Whitney U test, W = 18, P > 0.05) between the TA cloning group and the MiSeq group (Figures 2B,C). However, species richness was significantly greater in the MiSeq group than in the TA cloning group (Mann-Whitney U test, W = 27, P < 0.05). Pearson correlations of the body length with species richness and body length with the Shannon-Wiener index for the TA cloning group were 0.65 and 0.68, respectively, compared with 1.00 and 0.74 for the MiSeq group, suggesting that food richness was closely associated with the developmental stages. In this study, we found that larval L. polyactis began to grow scales at ca. 18 mm body length, representing the beginning of the juvenile stage. Prey species richness and diversity began to rise from samples E and K onward, when body length exceeded 20 mm (Figure 3), displaying a successful shift of feeding habits into the juvenile stage. It should be noted that the transitional body lengths mentioned above may not apply to L. polyactis living in other regions or populations, or during other seasons.
FIGURE 2
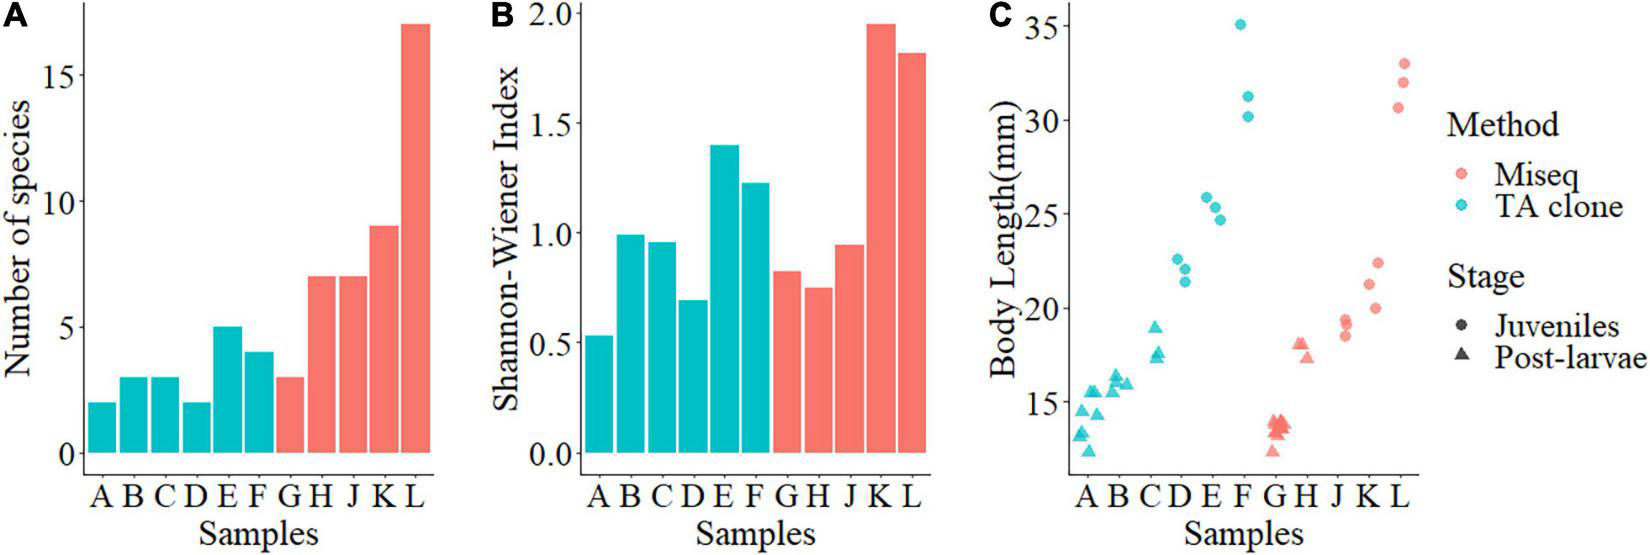
Prey species richness, prey diversity, and body length of post-larval and juvenile small yellow croakers (Larimichthys polyactis). (A) Prey species richness; (B) Prey diversity; (C) Body length. Red indicates samples analyzed using MiSeq, and blue indicates samples analyzed using TA cloning. In panels (A,B), bars A, B, C, G, and H show post-larva, and bars D, E, F, J, K, and L show juveniles. In panel (C), triangles represent post-larva, and dots represent juveniles.
FIGURE 3
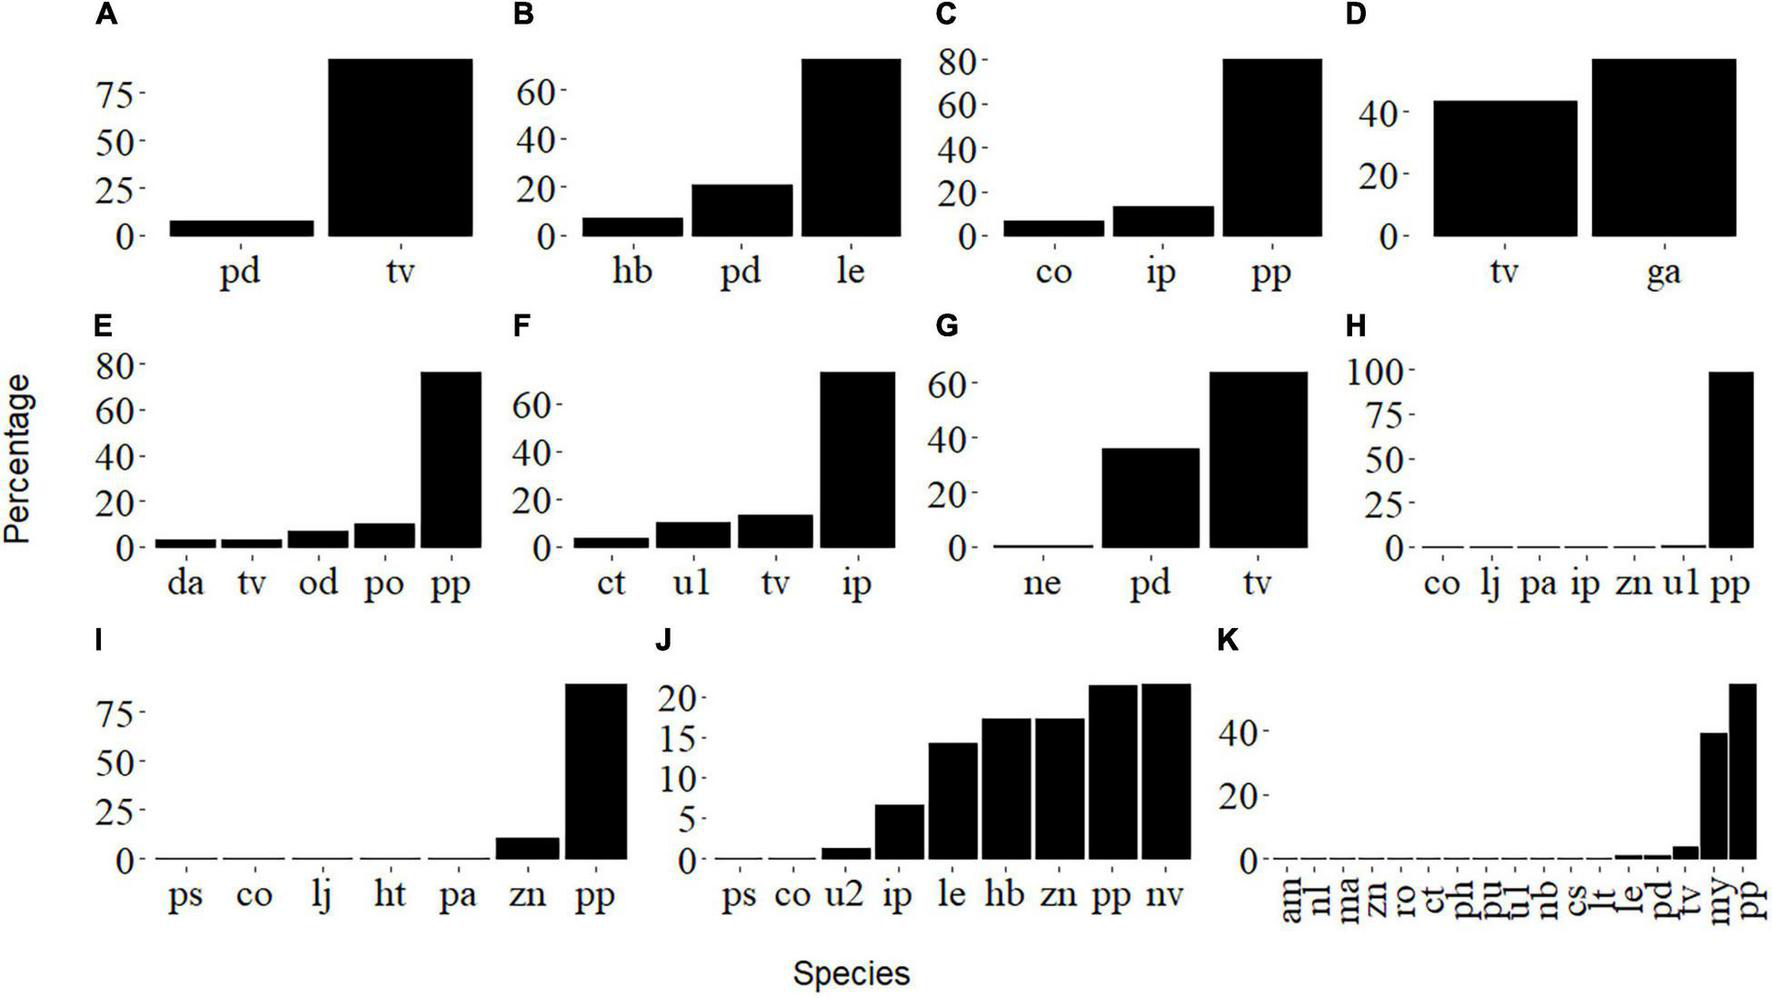
Percentage of prey amplicons for post-larval (i.e., (A–C,G,H)) and juvenile (i.e., (D–F,I–K)) L. polyactis. See Table 2 for the species abbreviations.
The prey species composition for groups A, B, and G, with average body lengths below 17 mm, were dominated by copepods, mainly Tortanus vermiculus, Labidocera euchaeta, and Pseudodiaptomus poplesia. Samples C, H, and J, with average body lengths between 17 and 19 mm, mainly fed on copepods (Paracalanus parvus). However, they also consumed larger organisms such as fishes (probably eggs or larvae of Callionymus olidus, Lateolabrax japonicus, etc.) and mysids (Iiella pelagica, etc.), and this probably represents a transitional stage between post-larva and juvenile. Groups with body lengths greater than 20 mm displayed a more diverse diet, including plankton (Copepoda, Sagittidae), polychaetes (Polychaeta), jellyfish (Hydrozoa, Ctenophora), mud snails (Nassarius variciferus), barnacles (Amphibalanus sp.), krill (Mysida), mullet (Planiliza haematocheilus), etc.; this may be an indication of successful settlement (Figure 3). There were significant differences in prey composition among the three body length groups (ANOSIM, R = 0.34, P < 0.05). However, samples on the Non-metric Multidimensional Scaling ordination plot (Figure 4) are not well clustered due to many shared prey species, indicating that the changes in feeding habits between post-larval and juvenile L. polyactis occur progressively.
FIGURE 4
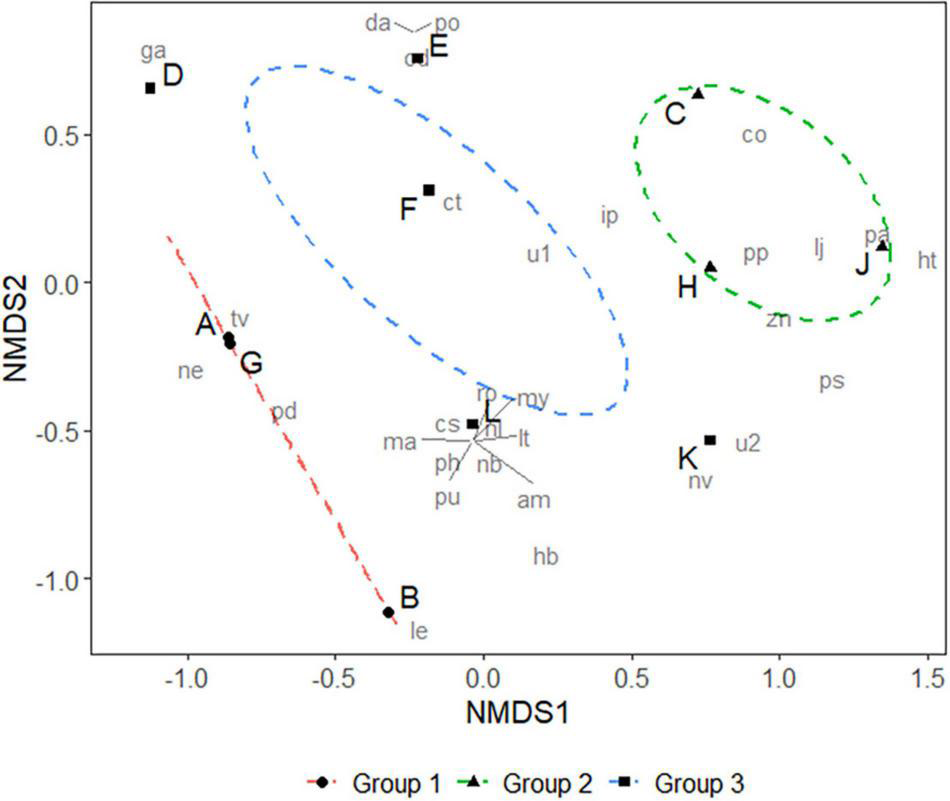
Non-metric Multidimensional Scaling (NMDS) of prey animals of larval and juvenile L. polyactis. Stress = 0.09, and confidence limit for the ordination ellipse is 90%. Analysis of similarity (ANOSIM) on three groups: R = 0.34, P < 0.05. Group 1 represents animals with an average body length <17 mm (post-larva); Group 2 represents animals between 17 and 19 mm (post-larva or juvenile at the transitional stage); Group 3 represents animals >20 mm (juvenile).
Discussion
In this study, we examined the gastrointestinal contents of post-larval and juvenile small yellow croakers using DNA barcoding and revealing how feeding habits shift from post-larva to early juvenile during settlement. The same trend was recognized by Llopiz (2013) who reported that the dominant prey types of higher latitude larvae were nauplii and calanoid copepods, with a shift from smaller to larger prey through larval ontogeny. Lin (1962) identified 19 OTUs from prey in 2,593 small yellow croaker samples with body lengths ranging from 9 to 140 mm. Twelve OTUs were identified from 11 to 35 mm samples (similar to this study), with eight to species level (Sagitta crassa, Calanus pacificus, L. euchaeta, Acartia bifilosa, Acanthomysis longirostris, Themisto gracilipes, Leptochela gracilis, and Crangon affinis). Bai (1966) identified 17 OTUs from prey in more than 1,300 samples measuring 4 mm–80 mm, and Guo et al. (2010) identified 34 OTUs from prey in 731 samples measuring 20 mm–109 mm. However, in the previous studies of L. polyactis feeding habits, the less accurate identification of preys species and grouping strategies did not allow a good observation on the critical period of feeding habits transition. Robert et al. (2014) recommended that, research on the survival and recruitment of larval fish should investigate diet composition at the species level. The difficulty of species-level diet analysis lies in the identification of food remnants. For example, it is difficult to identify the source of plankton chitin debris, remnants of soft-bodied organisms such as jellyfish and fish larvae, and even protozoa (Montagnes et al., 2010). This challenge can be solved by molecular approaches, which are able to identify fragments without obvious morphological features; however, molecular approaches also bearing the disadvantage in quantifying the relative abundance of preys. Combining visual identification and metabarcoding (Kodama et al., 2017) might be an optimal solution in the future to improve dietary research on larval fish.
Next-generation sequencing showed a superior ability to reveal wider dietary breadth than TA cloning in this study. Further studies should apply NGS techniques to a broader list of predators. Besides, several other NGS techniques have been used to identify fish gut microbiome and/or content (as reviewed in Ghanbari et al., 2015). Comparative studies with different sequencing methods can also be conducted to identify the optimum method with the greatest efficiency. The most exciting outcome of this research is that when early stage larvae are obtained, prey selection during initial feeding can be revealed in detail by these molecular approaches, even if samples sizes are small, which will be of particular benefit to research on fish breeding.
Publisher’s Note
All claims expressed in this article are solely those of the authors and do not necessarily represent those of their affiliated organizations, or those of the publisher, the editors and the reviewers. Any product that may be evaluated in this article, or claim that may be made by its manufacturer, is not guaranteed or endorsed by the publisher.
Statements
Data availability statement
The data presented in the study are deposited in the NCBI Sequence Read Archive (SRA) database, accession number PRJNA784007.
Ethics statement
Ethical review and approval was not required for the animal study because the present experimental procedures were carried out in strict accordance with the recommendations in the ethical guidelines of EU Directive 2010/63/EU for animal experiments.
Author contributions
YC and FH conducted the sampling and experimental analysis. WW and WZ analyzed the data and revised the manuscript. MW advised on experimental design.
Funding
This study was supported by the Central Public-interest Scientific Institution Basal Research Fund, ECSFR, CAFS (2015T04), and the Special Funds for Survey of Nearshore Spawning Ground by the Ministry of Agriculture and Rural Affairs (125C0505).
Conflict of interest
The authors declare that the research was conducted in the absence of any commercial or financial relationships that could be construed as a potential conflict of interest.
Supplementary material
The Supplementary Material for this article can be found online at: https://www.frontiersin.org/articles/10.3389/fmars.2021.786724/full#supplementary-material
References
1
Bai X. E. (1966). “Feeding habits of larval and juvenile small yellow croaker (Pseudosciaena polyactis) in the Bohai Sea and the Yellow Sea,” in Proceedings of the Western Pacific Fisheries Commission 8th Symposium, ed.Chinese Office of the Pacific West Fisheries Commission (Beijing: China Science Press), 18–30.
2
Beaugrand G. Brander K. M. Lindley J. A. Souissi S. Reid P. C. (2003). Plankton effect on cod recruitment in the North Sea.Nature426661–664. 10.1038/nature02164
3
Boling W. B. Sinclair G. A. Wawrik B. (2012). Identification of calanoid copepod prey species via molecular detection of carbon fixation genes.Mar. Biol.1591165–1171. 10.1007/s00227-011-1877-2
4
Burrow J. F. Horwood J. W. Pitchford J. W. (2011). The importance of variable timing and abundance of prey for fish larval recruitment.J. Plankton Res.331153–1162. 10.1371/journal.pone.0017456
5
Chen Y. Zhong J. Xu Z. Chen J. (2015). Spatio-temporal distribution of larval and juvenile fishes at frequent harmful algal blooms (HABs) areas of the East China Sea in spring.Haiyang Xuebao3744–54.
6
Cushing D. H. (1990). “Plankton production and year-class strength in fish populations: an update of the match/mismatch hypothesis,” in Advances in Marine Biology, Vol. 26edsBlaxterJ. H. S.SouthwardA. (Cambridge, MA: Academic Press), 249–293.
7
Doherty P. J. Dufour V. Galzin R. Hixon M. A. Meekan M. G. Planes S. (2004). High mortality during settlement is a population bottleneck for a tropical surgeonfish.Ecology852422–2428. 10.1890/04-0366
8
Franchini P. Fruciano C. Frickey T. Jones J. C. Meyer A. (2014). The gut microbial community of Midas cichlid fish in repeatedly evolved limnetic–benthic species pairs.PLoS One9:e95027. 10.1371/journal.pone.0095027
9
Fricke R. Eschmeyer W. N. van der Laan R. (2021). Eschmeyer’s Catalog of Fishes: Genera, Species, References. Available online at: https://researcharchive.calacademy.org/research/ichthyology/catalog/fishcatmain.asp(Accessed August 05, 2021)
10
Froese R. Pauly D. (2017). FishBase. Available online at: https://www.fishbase.org(Accessed August 05, 2021)
11
Ghanbari M. Kneifel W. Domig K. J. (2015). A new view of the fish gut microbiome: advances from next-generation sequencing.Aquaculture448464–475.
12
Guo B. Zhang B. Jin X. S. (2010). Diet composition and ontogenetic variation in feeding habits of juvenile small yellow croaker Pseudosciaena polyactis Bleeker in the Yellow Sea.J. Fish. Sci. China17289–297.
13
Hixon M. A. (1991). “Predation as a process structuring coral reef fish communities,” in The Ecology of Fishes on Coral Reefs, ed.SaleP. F. (San Diego, CA: Academic Press), 475–508. 10.1016/b978-0-08-092551-6.50022-2
14
Huang Y. S. Xu D. H. Chen H. J. (2014). PCR-based in situ dietary analysis of Calanus sinicus Brodsky in Yellow River Estuary and adjacent waters.J. Ocean Univ. China4483–91.
15
Jin X. S. Zhao X. Y. Meng T. X. Cui Y. (2005). Biology Resource and Environment in the Bohai Sea and Yellow Sea.Beijing: China Science Press.
16
Kendall A. W. Jr. Ahlstrom E. H. Moser H. G. (1984). “Early life history stages of fishes and their characters,” in Ontogeny and Systematics of Fishes. Special Publication 1, edsMoserH. G.RichardsW. J.CohenD. M.FahayM. P.KendallA. W.Jr.RichardsonS. L. (Lawrence, KS: Allen press), 11–22.
17
King R. A. Read D. S. Traugott M. Symondson W. O. C. (2008). Invited review: molecular analysis of predation: a review of best practice for DNA-based approaches.Mol. Ecol.17947–963. 10.1111/j.1365-294X.2007.03613.x
18
Kodama T. Hirai J. Tamura S. Takahashi T. Tanaka Y. Ishihara T. et al (2017). Diet composition and feeding habits of larval Pacific bluefin tuna Thunnus orientalis in the Sea of Japan: integrated morphological and metagenetic analysis.Mar. Ecol. Prog. Ser.583211–226. 10.3354/meps12341
19
Landaeta M. F. Bustos C. A. Contreras J. E. Salas-Berríos F. Palacios-Fuentes P. Alvarado-Niño M. et al (2015). Larval fish feeding ecology, growth and mortality from two basins with contrasting environmental conditions of an inner sea of northern Patagonia.Chile. Mar. Environ. Res.10619–29. 10.1016/j.marenvres.2015.03.003
20
Leray M. Agudelo N. Mills S. C. Meyer C. P. (2013). Effectiveness of annealing blocking primers versus restriction enzymes for characterization of generalist diets: unexpected prey revealed in the gut contents of two coral reef fish species.PLoS One8:e58076. 10.1371/journal.pone.0058076
21
Li X. M. Zhu Y. J. Yan Q. Y. Ringø E. Yang D. G. (2014). Do the intestinal microbiotas differ between paddlefish (Polyodon spathula) and bighead carp (Aristichthys nobilis) reared in the same pond?J. Appl. Microbiol.1171245–1252. 10.1111/jam.12626
22
Li Z. L. Shan X. J. Jin X. S. Dai F. Q. (2011). Long-term variations in body length and age at maturity of the small yellow croaker (Larimichthys polyactis Bleeker, 1877) in the Bohai Sea and the Yellow Sea.China Fish. Res.11067–74.
23
Lin J. Q. (1962). “Study on the feeding habit and condition of young and adult small yellow croaker,” in Proceedings of Marine Fishery Resource, edsZhuS. P.ZhangX. W.LiuX. S.XuG. Z. (Beijing: China Agriculture Press), 34–43.
24
Lin L. S. Liu Z. L. Jiang Y. Z. Huang W. Gao T. X. (2011). Current status of small yellow croaker resources in the southern Yellow Sea and the East China Sea.Chin. J. Oceanol. Limnol.29547–555. 10.1007/s00343-011-0182-8
25
Lin N. Chen Y. G. Jin Y. Yuan X. W. Ling J. Z. Jiang Y. Z. (2018). Distribution of the early life stages of small yellow croaker in the Yangtze River estuary and adjacent waters.Fish. Sci.84357–363. 10.1007/s12562-018-1177-6
26
Liu L. Li Y. H. Li S. L. Hu N. He Y. M. Pong R. et al (2013). “Comparison of next-generation sequencing systems,” in Biofuel Production: Algae and Aquatic Plants, ed.GikonyoB. (Palm Bay, FL: Apple Academic Press), 279–303.
27
Llopiz J. K. (2013). Latitudinal and taxonomic patterns in the feeding ecologies of fish larvae: a literature synthesis.J. Mar. Syst.10969–77. 10.1016/j.jmarsys.2012.05.002
28
Montagnes D. J. Dower J. F. Figueiredo G. M. (2010). The Protozooplankton-ichthyoplankton trophic link: an overlooked aspect of aquatic food webs.J. Eukaryotic Microbiol.57223–228. 10.1111/j.1550-7408.2010.00476.x
29
Navarrete P. Espejo R. T. Romero J. (2009). Molecular analysis of microbiota along the digestive tract of juvenile Atlantic salmon (Salmo salar L.).Microb. Ecol.57550–561. 10.1007/s00248-008-9448-x
30
Oksanen J. Blanchet F. G. Kindt R. Legendre P. Minchin P. R. O’hara R. B. et al (2020). Vegan: Community Ecology Package. R Package Version 2.5-7. Available online at: https://cran.r-project.org/package=vegan(accessed August 15, 2021).
31
R Core Team (2021). R: A Language and Environment for Statistical Computing.Vienna: R Foundation for Statistical Computing.
32
Robert D. Murphy H. M. Jenkins G. P. Fortier L. (2014). Poor taxonomical knowledge of larval fish prey preference is impeding our ability to assess the existence of a “critical period” driving year-class strength.ICES J. Mar. Sci.712042–2052.
33
Suzuki N. Hoshino K. Murakami K. Takeyama H. Chow S. (2008). Molecular diet analysis of phyllosoma larvae of the Japanese spiny lobster Panulirus japonicus (Decapoda: Crustacea).Mar. Biotechnol.1049–55. 10.1007/s10126-007-9038-9
34
Suzuki N. Murakami K. Takeyama H. Chow S. (2006). Molecular attempt to identify prey organisms of lobster phyllosoma larvae.Fish. Sci.72342–349.
35
Swalethorp R. Kjellerup S. Malanski E. Munk P. Nielsen T. G. (2014). Feeding opportunities of larval and juvenile cod (Gadus morhua) in a Greenlandic fjord: temporal and spatial linkages between cod and their preferred prey.Mar. Biol.1612831–2846. 10.1007/s00227-014-2549-9
36
Symondson W. O. C. (2002). Molecular identification of prey in predator diets.Mol. Ecol.11627–641. 10.1046/j.1365-294x.2002.01471.x
37
Tang Q. S. Su J. L. (2000). Global Ocean Ecosystem Dynamic of China. I. Key Scientific Problems and Strategy of Development.Beijing: China Science Press.
38
Vestheim H. Jarman S. N. (2008). Blocking primers to enhance PCR amplification of rare sequences in mixed samples–a case study on prey DNA in Antarctic krill stomachs.Front. Zool.5:12. 10.1186/1742-9994-5-12
39
Wickham H. Averick M. Bryan J. Chang W. McGowan L. D. Froncois R. et al (2019). Welcome to the tidyverse.J. Open Source Softw.4:1686. 10.21105/joss.01686
40
WoRMS Editorial Board (2021). World Register of Marine Species. Available online at: https://www.marinespecies.org(Accessed August 05, 2021)
41
Xue Y. Jin X. Zhang B. Liang Z. (2005). Seasonal, diel and ontogenetic variation in feeding patterns of small yellow croaker in the central Yellow Sea.J. Fish Biol.6733–50. 10.1111/j.0022-1112.2005.00677.x
42
Zheng Y. J. Chen X. Z. Cheng J. H. Wang Y. L. Shen X. Q. Chen W. Z. et al (2003). The Living Resources and the Environment in the Continental Shelf of the East China Sea.Shanghai: Shanghai Science and Technology Press.
Summary
Keywords
Larimichthys polyactis , shifting feeding habits, MiSeq sequencing, settlement, TA cloning
Citation
Chen Y, Wang W, Zhou W, Hu F and Wu M (2022) Shifting Feeding Habits During Settlement Among Small Yellow Croakers (Larimichthys polyactis). Front. Mar. Sci. 8:786724. doi: 10.3389/fmars.2021.786724
Received
30 September 2021
Accepted
26 November 2021
Published
10 January 2022
Volume
8 - 2021
Edited by
Chen Jiang, Dalian Ocean University, China
Reviewed by
Jin-Xian Liu, Institute of Oceanology, Chinese Academy of Sciences (CAS), China; Osamu Nishimiya, Ehime University, Japan
Updates
Copyright
© 2022 Chen, Wang, Zhou, Hu and Wu.
This is an open-access article distributed under the terms of the Creative Commons Attribution License (CC BY). The use, distribution or reproduction in other forums is permitted, provided the original author(s) and the copyright owner(s) are credited and that the original publication in this journal is cited, in accordance with accepted academic practice. No use, distribution or reproduction is permitted which does not comply with these terms.
*Correspondence: Meiqin Wu, keer0316@hotmail.com
†These authors have contributed equally to this work and share first authorship
This article was submitted to Marine Fisheries, Aquaculture and Living Resources, a section of the journal Frontiers in Marine Science
Disclaimer
All claims expressed in this article are solely those of the authors and do not necessarily represent those of their affiliated organizations, or those of the publisher, the editors and the reviewers. Any product that may be evaluated in this article or claim that may be made by its manufacturer is not guaranteed or endorsed by the publisher.