Abstract
Fish migration has always played an essential role in marine conservation and fisheries management. However, migration patterns are changing globally alongside changing ocean conditions. This affects the spatial scale of required governance and, consequently, our food supply. Technological advances in the bio-tracer approach using isotopes would make it possible to monitor fish migration differently from the conventional bio-logging method. Eye lenses of fish are incrementally grown and metabolically inert. Therefore, stable isotope analysis of eye lenses can reconstruct the geographic and trophic histories of fish. However, it is difficult to distinguish between the two pieces of information: migration and changing trophic relationships with the conventional bulk stable isotope approach. In this study, we measured the nitrogen isotope ratios of individual amino acids in eye lenses of chub mackerel (n = 3) from the western North Pacific to test whether the two pieces of information could be distinguished. A maximum of 34 growth layers was obtained from a single eye lens. For assigning the isotopic trends observed in lens tissues to specific life stages or size classes, we established a relationship between lens size and fork length (FL) as a reference framework. The reconstructed nitrogen isotope chorology of chub mackerel showed an increase in trophic position of about 1 unit from juvenile (FL ∼30 mm) to adult stages (FL ∼300 mm). The variation in nitrogen isotope ratios of phenylalanine (a source amino acid) in the eye lenses was –3 to 5‰. This baseline variability could be used for estimating fish movements. This study proposed compound-specific nitrogen isotope analysis of amino acids in eye lenses as a new tool capable of reconstructing the geographic and trophic histories of migratory fish.
Introduction
Marine conservation and fisheries science have long recognised the importance of fish migration (Moulton and American Association for the Advancement of Science, 1939). However, the advances in tracking technology and the ecological theory of fish migrations have not been fully integrated into management (Lowerre-Barbieri et al., 2019). In addition to the conventional biologging approach, bio-tracers such as isotopes are increasing in popularity as a tool used to track fish migrations (Matsubayashi et al., 2020). Isotope records in body parts such as lenses, otoliths, scales and vertebrae of fish can be used to reconstruct their diets and movements within isotopically variable environments, providing valuable information for management (Tzadik et al., 2017). In recent years, the application of eye lenses has made particular progress (Bell-Tilcock et al., 2021). Eye lenses of fish are transparent, spherical, and primarily composed of a structural protein called crystallin (Mahler et al., 2013). Like otoliths, lenses are incrementally grown and metabolically inert, recording information over a fish’s entire life (Wallace et al., 2014; Peebles and Hollander, 2020). Lenses contain 66% water, 33% protein and 1% others, including lipids, carbohydrates and trace elements (Feher, 2012). Lens development starts during the early embryonic stage (Grainger, 1992). As fish grow, lens fibre cells are laid down in concentric layers (laminae), similar to the layers of an onion (Wallace et al., 2014; Bell-Tilcock et al., 2021). The lens nucleus (nuclear fibre cells at the centre) is the oldest part of the lens and among the oldest cells in the body. The most recent growth of the fish is recorded in the outermost layer (Peebles and Hollander, 2020). Lenses serve as a focussing device within the eye, therefore, they must be transparent and refractive to allow images to form on the retina (Kröger, 2013). To establish transparency within the lens, cytoplasmic organelles, including the cellular nucleus and its DNA are removed from fibre cells. Following this process, crystallin and other proteins are left behind and de novo protein synthesis ceases (Wride, 2011).
Nitrogen isotopic composition (δ15N values) of primary producers varies spatially in the oceans due to spatial differences in N cycling. For example, regions that have strong N2-fixation inputs generally have lower δ15N values (near 0‰). In contrast, areas that are affected by denitrification have higher δ15N values. Nutrient utilisation is also known to affect the δ15N values. In general, regions with low nutrient utilisation have low δ15N values, whereas areas with high nutrient utilisation have higher δ15N values (Yoshikawa et al., 2018). Such spatial isotope distribution in the oceans (isoscape) is reflected in the tissues of fish through trophic pathways and is useful for assessing the geographic distributions of fish (McMahon et al., 2013). Lenses are rich in nitrogen and suitable for δ15N analysis. This contrasts with hard tissues such as otoliths that are nitrogen-poor (Tzadik et al., 2017). Isotopic composition of bulk N is most commonly measured. Trends within bulk nitrogen isotopic records in eye lens protein reflect both geographic movements and changing trophic relationships. Therefore, to address the geographic movement, the trophic relationship should be accounted (Peebles and Hollander, 2020). Compound-specific nitrogen isotope analysis of amino acids (CSIA-AA) could account for those two effects by providing information on the trophic position (TP) of the organism and the δ15N values at the base of the food web (Ohkouchi et al., 2017; Ishikawa, 2018). Glutamic acid (Glu), a trophic amino acid (TAA) tends to show large 15N enrichment (by about 8‰) relative to diet during trophic transfer. In contrast, phenylalanine (Phe), a source amino acid (SAA) shows little 15N enrichment (about 0–1‰) relative to diet during trophic transfer. Therefore, this SAA directly estimates the δ15N value at the base of the food web (Ohkouchi et al., 2017) and is useful for studying the migration of fish, thus allowing for direct comparison of isotope ratios between the target migratory animal and an isoscape (Matsubayashi et al., 2020).
In the present study, we tested if CSIA-AA of eye lens laminae could distinguish between the lifelong changes in baseline δ15N values and TPs of fish and evaluated if CSIA-AA of eye lens laminae is useful for fish movement studies. For this purpose, we used chub mackerel (Scomber japonicus), an important fisheries species caught in Iwate Prefecture, Japan. In the western North Pacific, chub mackerel widely migrate from subtropical Kuroshio to subarctic Oyashio regions. They use the subtropical Kuroshio region, especially along the southern coast of Japan, as a spawning ground (Yatsu et al., 2005; Higuchi et al., 2019). The eggs and larvae are transported to the east by the Kuroshio current. The juveniles migrate into and use the Kuroshio–Oyashio transition area as a nursery ground. They are also known to migrate to the Oyashio region, where their prey, zooplankton, is abundant in summer (Higuchi et al., 2019). Chub mackerel in the region begins to mature at about 300 mm in fork length (FL) (Watanabe and Yatsu, 2004). Fish in the Oyashio–Kuroshio region generally show δ15Nphe values of –4 to 6‰ (Ishikawa et al., 2021). Therefore, this range is expected in the eye lens of chub mackerel caught in the region. The δ15N values are lower in the subtropical Kuroshio region than in the subarctic Oyashio region because the subtropical Kuroshio is influenced by N fixation inputs (Yoshikawa et al., 2018). Another feature expected to characterise isotopic chronologies from fish eye lenses is an increase in TP with growth (Simpson et al., 2019; Curtis et al., 2020). Such ontogenetic shifts are common in fish (Romanuk et al., 2011), primarily due to a widening of gape size that allows consumption of larger prey (Arim et al., 2010). For example, chub mackerel mainly feed on phytoplankton and zooplankton during the larval stage (Taga et al., 2019) and shift their diet to a mixture of phytoplankton, zooplankton and fish larvae as they grow (Molina et al., 1996).
Materials and Methods
Lens Collection and Dissection
Adult chub mackerel (n = 3) of size 335, 338, and 344 mm in FL collected from Otsuchi Bay, Iwate prefecture, Japan, in August 2020 were used for stable nitrogen isotope analysis. The fish were kept frozen at –20°C and transported to the Japan Agency for Marine-Earth Science and Technology (JAMSTEC, Yokosuka, Japan). Prior to dissection, the frozen fish were thawed at room temperature. Lenses were delaminated, according to the procedure by Wallace et al. (2014). Since isotopic records do not seem to vary between left and right eye lenses (Wallace et al., 2014), right ones were used for the analysis. A whole eye was removed by severing the optic nerve and connective tissues at their junction with the sclera (Figure 1). An incision was made in the cornea to allow removal of the lens using forceps. Using a deionised water rinse, exterior material was removed manually and then the lens was placed on a glass petri dish. Using two pairs of fine-tip forceps, successive layers of cortical laminae were separated under a dissecting stereomicroscope until the lens nucleus could not delaminate further. Delamination always started at the same lens pole and proceeded to the other. During the delamination when the lens became too dry, a drop of deionised water was added to the lens to assist delamination. After each delamination, an ocular micrometre was used to measure the diameter at the equator. Lamina position (in mm) is the lens radius after lamina removal plus half the thickness of the removed lamina. Each eye lens was dissected into 33–34 laminae. Each lamina sample was put in a pre-combusted glass vial, freeze-dried, and stored.
FIGURE 1
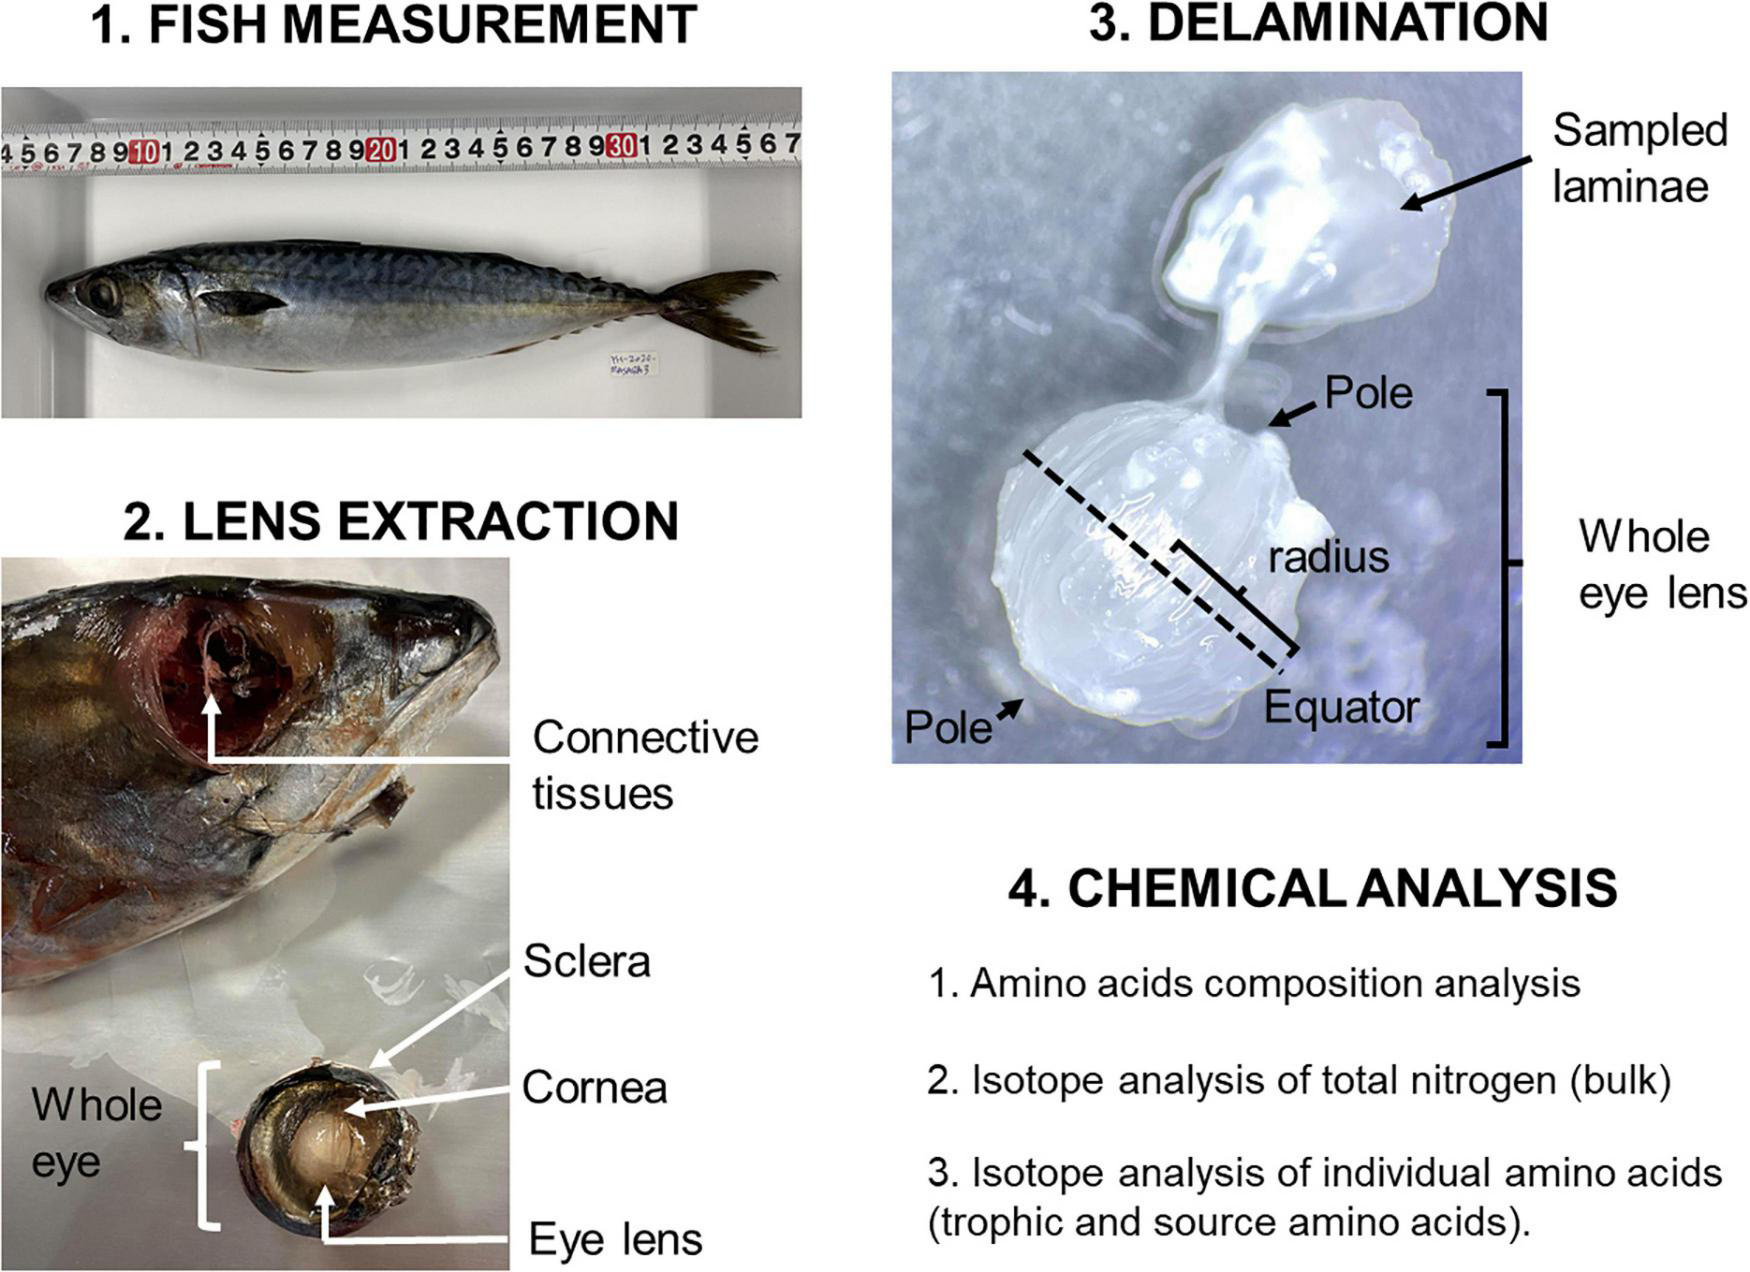
Illustration of workflow for fish eye lens sampling and preparation for isotope analysis (details in the main text).
Bulk Nitrogen Isotope Analysis
For the bulk δ15N analysis, all the delaminated layers (n = 34) were analysed from one individual and selected 10 layers were analysed for the others to minimise experimental effort. About 10 μg (dry weight) of eye lens material was placed in pre-cleaned smooth wall tin capsules for bulk N isotope analysis using a modified elemental analyser/isotope-ratio mass spectrometry (EA/IRMS) system for microscale isotope analysis (Ogawa et al., 2010) at JAMSTEC. While the conventional EA/IRMS system generally requires 1 mg of proteinous tissues such as fish muscle, this modified system is much more sensitive and requires 100 times less material with analytical error comparable to the conventional system. In brief, this modified EA-IRMS system consisted of a Delta plus XP IRMS coupled to a Flash EA1112 interfaced via a continuous flow interface, ConFlo III (Thermo Finnigan, Bremen, Germany). Isotopic compositions are reported relative to atmospheric N2 (AIR). The analytical errors (1σ) of the standard measurements were better than ±0.14‰.
Compound-Specific Nitrogen Isotope Analysis of Amino Acids
Six selected samples from each individual were analysed for δ15NAAs measurements to minimise experimental effort. Samples were prepared based on amino acid derivatisation procedures, according to Chikaraishi et al. (2015). In brief, samples were hydrolysed with 12 M HCl at 110°C for 12 h. Hydrophobic constituents in the hydrolysed samples were removed by washing with n-hexane:dichloromethane (3:2, v:v). Amino acids in the samples were derivatised sequentially using thionyl chloride:2-propanol (1:4, v:v) at 110°C for 2 h and then pivaloyl chloride:dichloromethane (1:4, v:v) at 110°C for 2 h. The abundance of individual amino acids was measured by gas chromatography (GC) using a 6890N GC instrument with a nitrogen-phosphorus detector (NPD) (Agilent Technologies, Palo Alto, CA, United States). The abundance of 12 derivatised amino acids (alanine: Ala, glycine: Gly, valine: Val, leucine: Leu, isoleucine: Ile, aspartic acid: Asp, threonine: Thr, serine: Ser, methionine: Met, glutamic acid: Glu, phenylalanine: Phe, and tyrosine: Tyr) were quantified by comparison with the peak area of amino acid standards on NPD chromatograms. Twelve amino acids were well separated on a chromatogram (Figure 2).
FIGURE 2
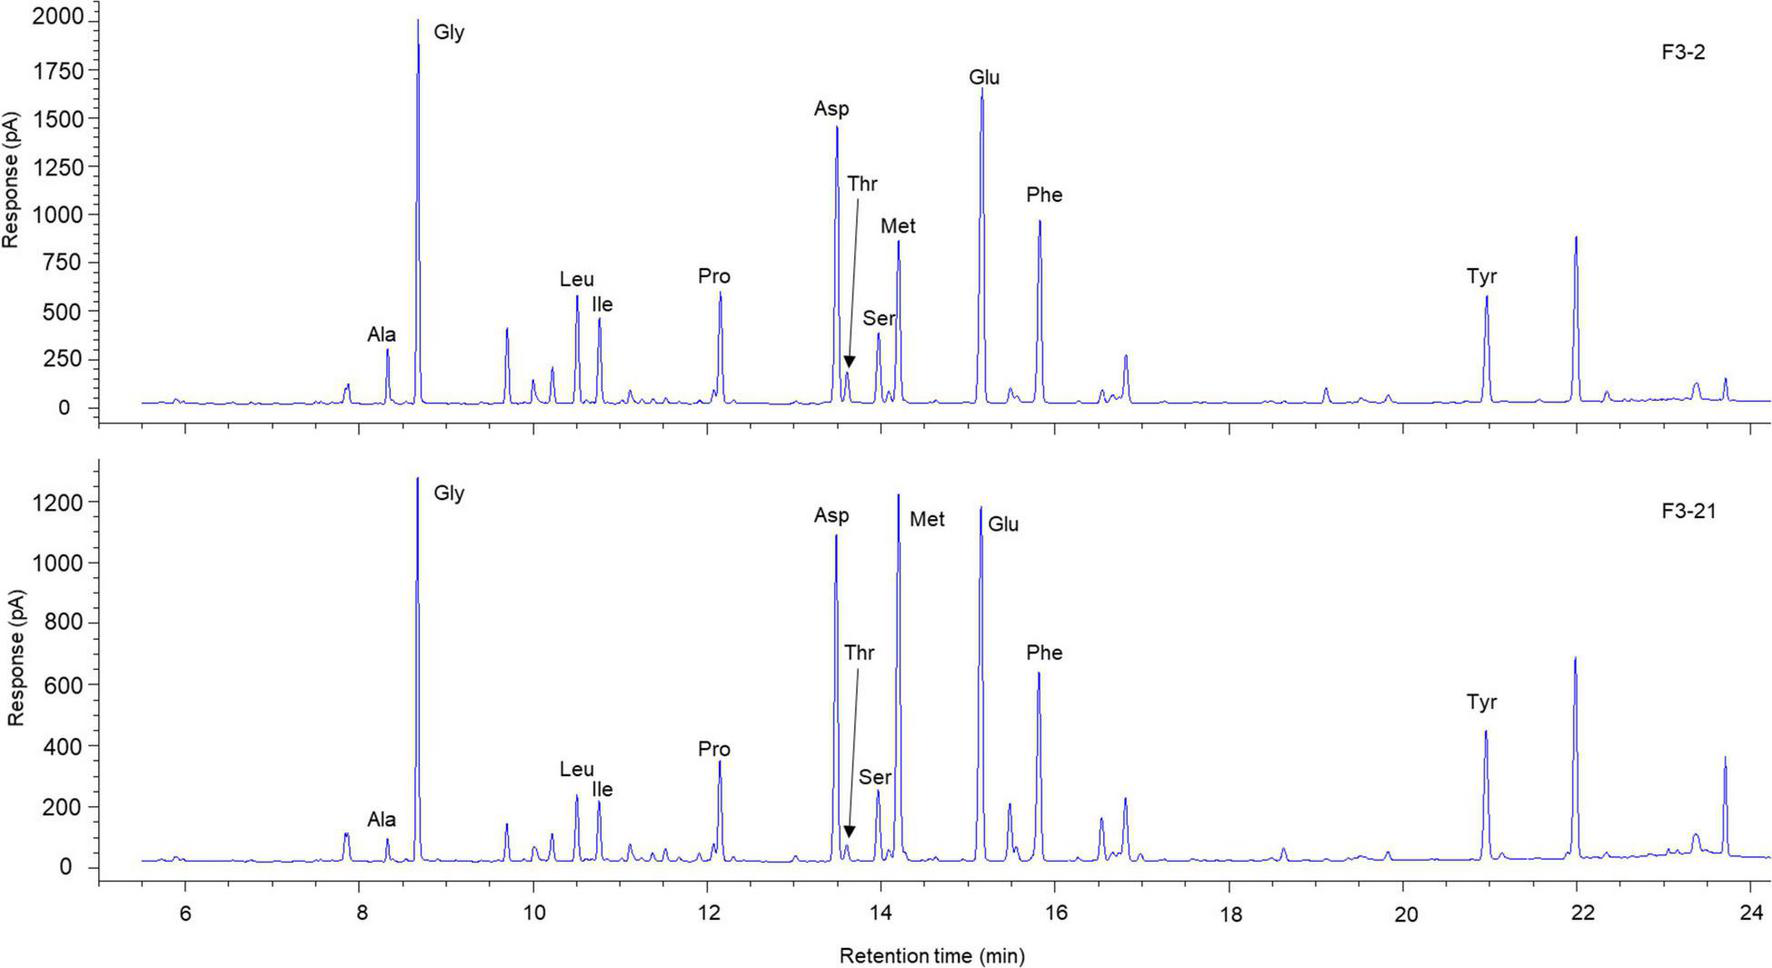
Representative chromatogram of AAs in eye lenses of Chub mackerel. The Met content is substantially higher in the inner laminae, F3-21 (bottom graph), than in the outer laminae, F3-2 (top graph).
Stable nitrogen isotopic composition of amino acids was determined by gas chromatography/combustion/isotope ratio mass spectrometry (GC/C/IRMS) using a 6890N GC instrument (Agilent Technologies, Palo Alto, CA, United States) coupled to a Delta plus XP IRMS instrument via GC-combustion III interface (Thermo Finnigan, Bremen, Germany) at JAMSTEC. Isotopic compositions were reported as a conventional δ notation relative to atmospheric N2 (AIR). The analytical errors (1σ) of the standard measurements were better than ±0.8‰ covering the range of analyte size of < 70 ngN. Triplicate δ15N measurements per sample were performed. Duplicate measurements were performed for one sample (ID 1-31) that did not contain enough material for triplicate measurements. Using δ15NGlu and δ15Nphe values, TP of an individual fish was estimated as follows (Chikaraishi et al., 2009); TPGlu–Phe = (δ15NGlu-δ15Nphe–3.4)/7.6 + 1, where δ15NGlu and δ15Nphe are the δ15N values of Glu and Phe, respectively. Because there is small 15N enrichment (about 0.4‰) in Phe for each trophic step (Chikaraishi et al., 2009), the following equation from Xing et al. (2020) was used to estimate the δ15NBaseline values; δ15NBaseline = δ15Nphe–0.4 (TP – 1). Mean ± SD values were estimated from the triplicate measurements. ANOVA was used to explore the differences between group means. Linear regression was used to assess how the δ15NGlu and δ15Nphe values correlate with the bulk δ15N values. Before performing ANOVA, the assumptions of homogeneity of variance and normality in distribution were checked by performing Levene’s test and Shapiro-Wilk’s test, respectively. All statistical analyses were conducted in R version 4.1.2 with α set at 0.05.
Lens-Body Size Relationship
A relationship between lens size and FL was established as a reference framework (Figure 3) to assign the isotopic trends observed in interior lens tissues to specific life stages or size classes. Lens-length relationships are generally linear (Quaeck-Davies et al., 2018; Simpson et al., 2019; Curtis et al., 2020). To establish this relationship for chub mackerel, length and lens measurements across a size distribution (n = 46; FL 41–370 mm; Supplementary Table 1) were used. Ten adult samples (FL 335–370 mm) were collected from Otsuchi Bay. Because it was difficult to obtain larval and juvenile chub mackerel from the field, reared samples (n = 36; FL 41–185 mm) were used. Chub mackerel were reared at the Hakatajima Station, National Research Institute of Fisheries and Environment of Inland Sea (Imabari, Japan), following the procedure reported by Nakamura et al. (2020). Lenses were extracted from intact eyes. The diameters of lenses were measured at their widest point using an ocular micrometre. FL was measured before dissection. Using linear regression, a linear relationship between lens radius and FL (y = 0.013; R2 = 0.993, F(1, 42) = 1359, p = 0.001; Figure 3) was established. The residual standard error (RSE) of the model was 17.54. The intercept was set at zero, assuming that lens radius (mm) is zero at FL 0 mm. The relationship between FL and age (year) was also estimated using the following equation from Hwang et al. (2008); FLt = 34.1(1–e–2.19(t+0.0035)).
FIGURE 3
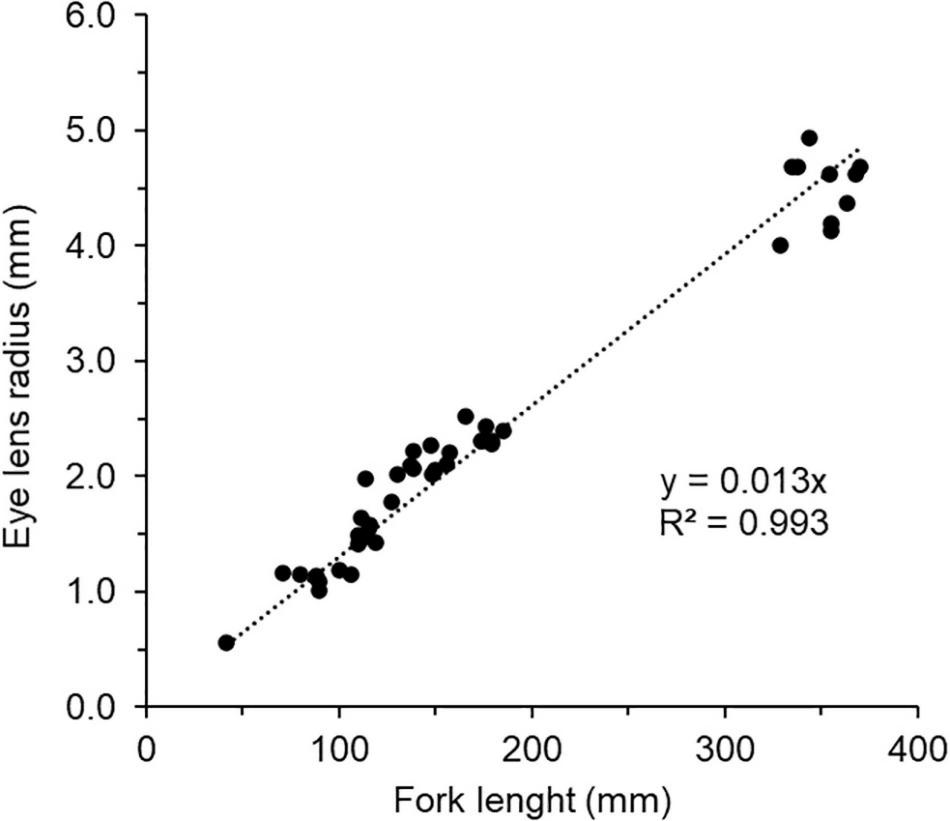
Linear regression of fork length and lens radius of chub mackerel (n = 46). The sample details are shown in Supplementary Table 1.
Results and Discussion
Amino Acid Compositions of Fish Eye Lenses
Eye lenses of aquatic vertebrates like fish typically have a higher refractive index compared to those of vertebrates on the land because, in water, corneas lack refractive power (Mahler et al., 2013). Crystallins in fish lenses are adapted for dense packing in hard lenses and possess a very high Met content. The high Met content contributes to protein stability and mediates intermolecular interactions that enhance dense protein packing in lenses (Chang et al., 1988; Srikanthan et al., 2004; Mahler et al., 2013). The content of Met is generally high even in mammals, but this is significantly exceeded in fish (Mahler et al., 2013). Consistent with the above studies, our result shows a high content of Met in eye lenses of chub mackerel. The Met content was highest (∼22%) at the lens core, where the protein density and refractive index are higher. The Met content was lowest at the outmost layer (∼6%; Table 1). Along with Met, the contents of Gly (14–17%), Asp (14–18%), Glu (17–21%), and Phe (9–11%) were also high. Those five amino acids were about 70% of the total of 12 derivatised amino acids. This amino acid composition is different from the amino acid composition of bone collagen, which is rich in Gly (Eastoe, 1957), and muscle, which is rich in Leu, Glu, Gly, and Asp (Ryu et al., 2021). The lens amino acid composition observed in this study generally agreed with the past studies, e.g., Mahler et al. (2013) and Falco et al. (2016). In some cases, the lens amino acid composition differs among species or individuals characterised by different lifestyles and inhabiting different environments (Falco et al., 2016). In our study, the amino acid composition pattern was fairly consistent among the three individuals of chub mackerel studied (Table 1).
TABLE 1
| ID | Radius, mm | Ala | Gly | Leu | Ile | Pro | Asp | Thr | Ser | Met | Glu | Phe | Tyr |
| Fl-1 | 3.6 | 1.6 | 14.0 | 5.6 | 4.2 | 6.1 | 15.0 | 2.1 | 5.1 | 6.8 | 17.7 | 10.7 | 11.2 |
|
|
|||||||||||||
| Fl-3 | 2.3 | 1.3 | 14.9 | 5.0 | 4.1 | 6.3 | 16.5 | 1.7 | 4.4 | 11.0 | 18.9 | 10.7 | 5.2 |
|
|
|||||||||||||
| Fl-11 | 1.7 | 0.9 | 13.9 | 4.0 | 3.4 | 4.8 | 16.6 | 1.2 | 4.3 | 9.5 | 20.9 | 11.6 | 8.8 |
|
|
|||||||||||||
| Fl-21 | 1.1 | 1.0 | 15.1 | 3.6 | 3.5 | 3.8 | 16.8 | 1.7 | 3.5 | 11.6 | 19.9 | 12.5 | 7.0 |
|
|
|||||||||||||
| Fl-26 | 0.7 | 0.5 | 12.2 | 2.4 | 1.9 | 4.4 | 19.8 | 1.0 | 4.3 | 16.3 | 20.1 | 12.0 | 5.1 |
|
|
|||||||||||||
| Fl-31 | 0.4 | ||||||||||||
|
|
|||||||||||||
| F2-1 | 3.8 | 0.7 | 18.5 | 4.7 | 2.6 | 5.6 | 16.7 | 2.2 | 4.7 | 8.1 | 21.0 | 11.7 | 3.6 |
|
|
|||||||||||||
| F2-2 | 2.7 | 0.4 | 10.9 | 3.5 | 2.2 | 4.4 | 17.6 | 1.6 | 4.2 | 11.8 | 23.8 | 13.9 | 5.7 |
|
|
|||||||||||||
| F2-5 | 2.0 | 1.1 | 14.0 | 4.6 | 3.8 | 5.6 | 15.2 | 1.4 | 4.0 | 11.6 | 18.3 | 11.5 | 9.0 |
|
|
|||||||||||||
| F2-12 | 1.5 | 0.6 | 12.6 | 3.5 | 2.9 | 4.8 | 15.9 | 1.2 | 4.2 | 13.5 | 20.2 | 12.1 | 8.5 |
|
|
|||||||||||||
| F2-22 | 0.8 | 0.1 | 6.1 | 1.4 | 0.9 | 3.3 | 17.3 | 0.8 | 4.4 | 20.5 | 22.5 | 14.3 | 8.3 |
|
|
|||||||||||||
| F2-29 | 0.3 | 0.0 | 4.8 | 0.9 | 0.6 | 2.7 | 17.1 | 0.7 | 4.4 | 22.2 | 23.8 | 14.6 | 8.3 |
|
|
|||||||||||||
| F3-1 | 4.0 | 2.9 | 14.6 | 6.4 | 4.4 | 7.3 | 14.0 | 2.4 | 5.3 | 5.9 | 16.7 | 9.2 | 10.9 |
|
|
|||||||||||||
| F3-2 | 3.0 | 2.0 | 15.3 | 5.1 | 4.1 | 5.7 | 15.6 | 1.7 | 3.9 | 9.2 | 20.1 | 10.7 | 6.6 |
|
|
|||||||||||||
| F3-10 | 1.8 | 1.8 | 16.3 | 4.6 | 4.3 | 5.6 | 14.6 | 1.3 | 3.3 | 12.8 | 17.3 | 10.2 | 7.7 |
|
|
|||||||||||||
| F3-16 | 1.2 | 1.3 | 16.8 | 3.0 | 2.6 | 3.8 | 18.0 | 0.8 | 2.6 | 15.3 | 20.8 | 10.2 | 4.8 |
|
|
|||||||||||||
| F3-21 | 0.8 | 0.8 | 13.8 | 2.9 | 2.6 | 4.6 | 15.8 | 0.9 | 3.6 | 18.8 | 18.6 | 10.1 | 7.5 |
|
|
|||||||||||||
| F3-27 | 0.3 | 1.0 | 14.8 | 2.0 | 2.1 | 3.8 | 16.6 | 0.7 | 3.5 | 22.1 | 18.3 | 9.3 | 5.7 |
Amino acid composition (%) of eye lens laminae of Chub mackerel (n = 3).
Nitrogen Isotopic Composition of Fish Eye Lenses
Eye lenses are rich in protein. The C/N ratios (weight) were about 3 (Supplementary Table 2). Lenses generally contain 66% water, 33% protein and 1% others such as lipids, carbohydrates and trace elements (Feher, 2012). Therefore, it can be considered that the N isotope ratio measured from the eye lens dominantly reflects nitrogen from proteins (or AAs) within the lens. Nitrogen isotope ratios usually vary between individual amino acids. In many cases, nitrogen isotope ratios of individual amino acids in biological samples such as fish muscle can differ by greater than 20‰ (Ohkouchi et al., 2017). Therefore, variation in amino acid composition influences the bulk δ15N value. This study focuses on δ15N values of two amino acids, Glu and Phe. The contents of these two amino acids out of the 12 derivatised amino acids were about 20 and 11%, respectively. While Glu had higher δ15N values ranging from 10 to 21‰, Phe had lower values ranging from –3 to 5‰. The δ15N values of corresponding bulk tissues were intermediate, ranging from 3 to 12‰. Both the δ15NGlu and δ15Nphe values significantly correlated with the bulk δ15N values, however, the δ15NGlu values corelated with the bulk values more (RSE = 1.14, R2 = 0.841, F(1, 16) = 90.84, p = 0.001) than the δ15Nphe values [RSE = 1.65, R2 = 0.666, F(1, 16) = 34.96, p = 0.001]. The bulk δ15N values increased from the inner layers to the outer layers (Figure 4). The shift was up to about 9‰ within an eye lens. For the two individuals (F1 and F3), the inner most layer showed a slightly higher value. This δ15N pattern is possibly due to a maternal effect. For example, the mother diet could be reflected in the inner laminae due to the use of nutrients derived from the egg. This δ15N pattern has been observed in eye lenses of other fish such as rays and sharks (Simpson et al., 2019) and in shells of nautiloid cephalopods (Kashiyama et al., 2010).
FIGURE 4
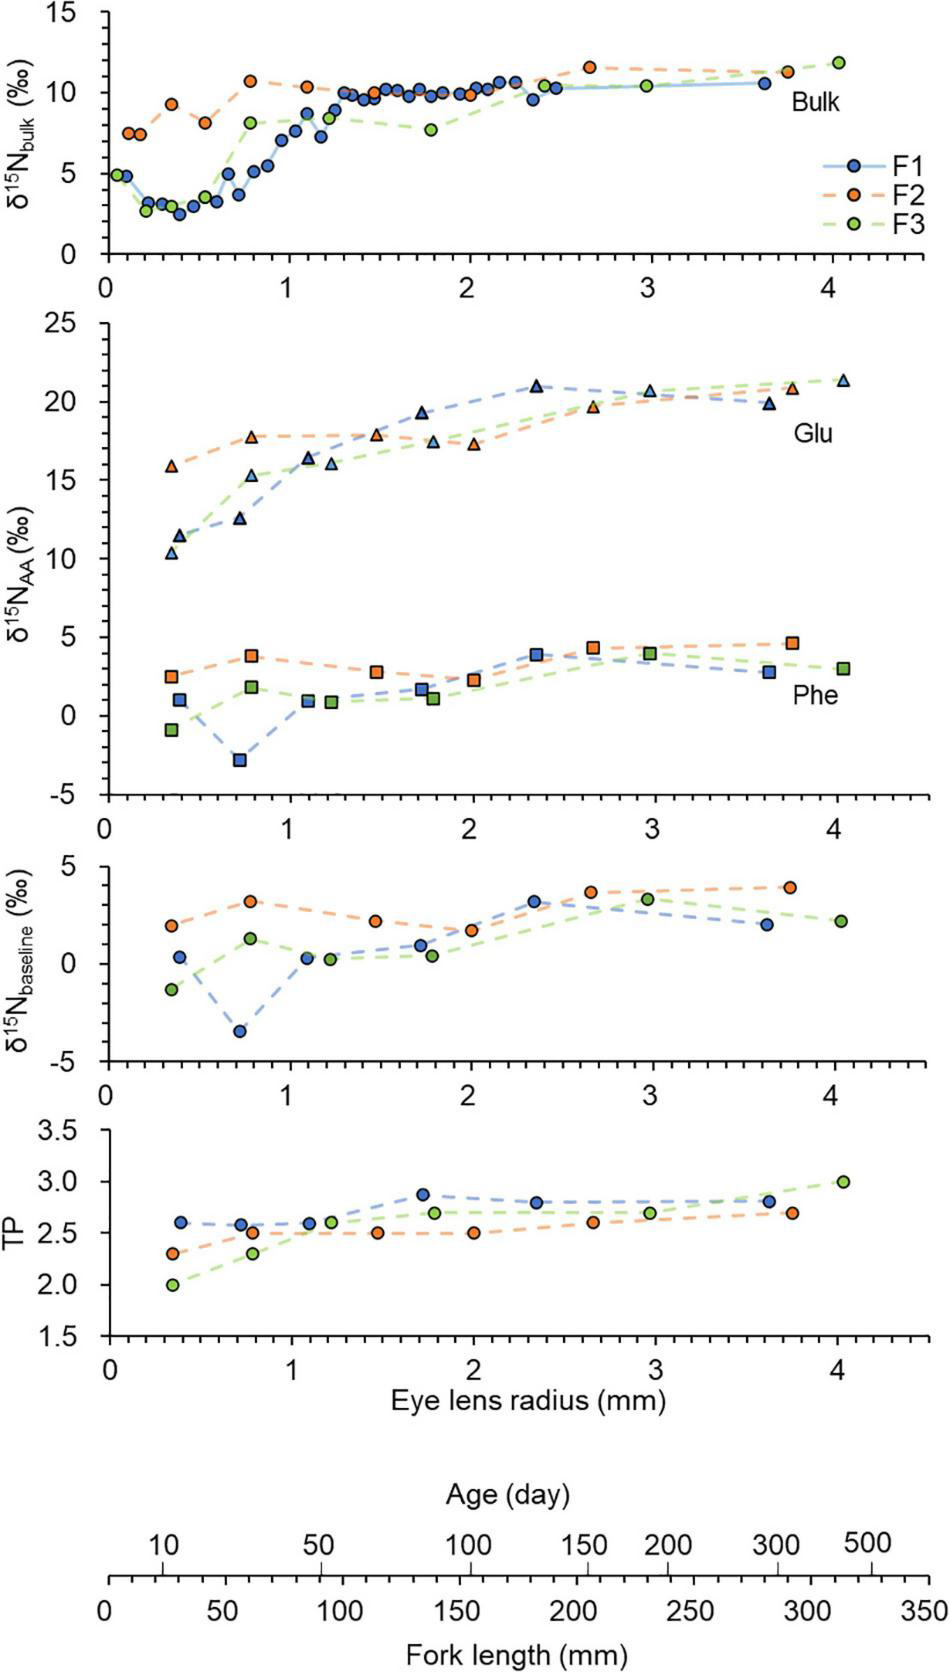
Chronologies of δ15N values measured in eye lenses of Chub mackerel (n = 3), including bulk values and those of individual amino acids (Glu — triangle and Phe — square). The baseline and TP values were calculated using an equation from Chikaraishi et al. (2009) and Xing et al. (2020). Data are plotted against fork length which was estimated using linear regression of fork length and lens radius (Figure 3), and age which was estimated using an equation from Hwang et al. (2008). 34, 33, and 33 laminae were obtained for F1, F2, and F3, respectively. However, only selected laminae were analysed. The solid line indicates continuously analysed laminae, and dotted lines indicate discontinuously analysed laminae.
The δ15NGlu values also increased from the inner layers to the outer layers, likely due to an increase in TP. The shift was up to about 11‰ within an eye lens. In contrast, Phe did not show 15N enrichment from the inner layers to the outer layers. Phe is a SAA that has little 15N enrichment (0–1‰) relative to diet during trophic transfer and directly provides an estimate of the δ15N value of the primary producers, i.e., δ15NBaseline (Ohkouchi et al., 2017; Xing et al., 2020). Therefore, the δ15NBaseline variation (–3 to 4‰) in the lenses should reflect the movement between the Kuroshio and Oyashio regions. The δ15NBaseline values significantly varied along the individual life for F1 [ANOVA F(5, 10) = 10.64, p < 0.01], but the values did not significantly varied for F2 and F3 (p > 0.05). The measured range of δ15Nphe values agreed with the range of δ15Nphe values (–4 to 6‰) of fish (muscle tissue) caught from the Kuroshio–Oyashio boundary region (Ishikawa et al., 2021). The δ15N values are relatively lower in the subtropical Kuroshio region than the subarctic Oyashio region because the subtropical Kuroshio is influenced by N fixation inputs (Yoshikawa et al., 2018). The δ15NBaseline values were generally lower during their early life stage. Ecological interpretation is limited because only three individuals were measured in the present study. However, this δ15NBaseline pattern is probably because chub mackerel in the western North Pacific use the subtropical Kuroshio region, especially along the southern coast of Japan, as their spawning ground and use the Kuroshio–Oyashio transition area as a nursery ground (Yatsu et al., 2005; Higuchi et al., 2019). The δ15NBaseline values varied more between the three individuals during the larval stage (FL = 20 mm) and juvenile stage (FL = 20–100 mm). This is most likely due to the dispersion of larvae and differences in their growth rate and swimming ability during their larval and juvenile stages. For example, juveniles with faster larval growth are known to proactively enter Oyashio–Kuroshio mixed water region (Higuchi et al., 2019). TPGlu–Phe values varied from 1.9 to 3.0. As expected from the previous eye lens studies (Simpson et al., 2019; Curtis et al., 2020), an increase in TP with growth was observed from the eye lens isotopic chronology. The TPGlu–Phe values increased from the core (about 1.9) to the outer layers (about 3.0). The TPGlu–Phe values significantly increased for F1 [ANOVA F(5, 10) = 5.66, p < 0.01], but the values did not significantly increased for F2 and F3 (p > 0.05). The TP shift mainly occurred between 30 and 130 mm (FL). Such ontogenetic shift is common in fish (Romanuk et al., 2011) and most likely associated with a widening of gape size that allows consumption of larger prey (Arim et al., 2010). For example, chub mackerel mainly feed on phytoplankton and zooplankton during their larval-juvenile stage (Taga et al., 2019) and change their prey to a mixture of phytoplankton, zooplankton and fish larvae as they grow (Molina et al., 1996). Overall, as expected from the previous studies (e.g., Ohkouchi et al., 2017), measuring the nitrogen isotope ratios of individual amino acids could discriminate between the changes in TP and baseline.
Reconstructing Life History of Fish From Eye Lens Isotope Chronologies
As expected from the past studies, eye growth and body length had a linear relationship (Quaeck-Davies et al., 2018; Simpson et al., 2019; Curtis et al., 2020). Lens radius was linearly related to FL (R2 = 0.99; Figure 3). A maximum of 34 laminae samples was obtained from an individual chub mackerel eye lens (ID = 1; Supplementary Table 2). The position (lens radius mm) of sampled layers ranged from 0.09 (innermost) to 3.63 (outermost). The corresponding FL (mm) ranged from 7.2 to 279, and age (day) ranged from 2.3 to 282. The time resolution of the bulk δ15N isotope chronology ranged from 4.9 to 148 days. In general, the time resolution increased towards the core because the inner layers were sampled thinner than the outer layers. Furthermore, since the optimal swimming speed of chub mackerel is known (42.5 cm s–1 regardless of temperature and fish size; Guo et al., 2020), the maximum distance that the fish travelled could also be estimated. For example, using the optimal swimming speed, the maximum distance that the individual travelled between the two outermost layers (2.47 mm, i.e., 134 day and 3.68 mm, i.e., 282 day) was estimated to be 5435 km. In addition to isotope values, such information could be used as additional information to assess the geographic distribution of fish using an isoscape., e.g., Matsubayashi et al. (2020).
Past studies have already shown the potential of eye lens isotope ratios for reconstructing the lifelong geographic and trophic histories of fish (Quaeck-Davies et al., 2018; Curtis et al., 2020; Peebles and Hollander, 2020). The eye lens of chub mackerel contained a substantial amount of source AAs including Phe and Met (Mahler et al., 2013; Falco et al., 2016) and 15Nphe values significantly correlated with the bulk δ15N values. Therefore, the lifelong changes in the δ15N baseline could be detected using the conventional bulk isotope analysis. An advantage of using CSIA-AA was that the baseline changes were theoretically distinguished. 15NBaseline directly estimates the δ15N value at the base of the food web and allows for direct comparison of isotope ratios between the target migratory animal and a nitrogen isoscape (Matsubayashi et al., 2020). Therefore, 15NBaseline is informative for investigating the movement history of fish. Fish movements could be estimated by combining lens nitrogen isotope chronologies (i.e., lifelong changes in δ15Nphe baseline values) and nitrogen isoscapes. This type of work has already been successfully achieved by Matsubayashi et al. (2020), who estimated the migration route of chum salmon between the Western North Pacific and the Bering Sea using the nitrogen isotope chronology reconstructed from CSIA-AA of vertebrae. Compared to hard tissues such as vertebrae that are relatively nitrogen-poor (Tzadik et al., 2017), eye lenses are richer in protein and well-suited for CSIA-AA and other isotope analyses such as carbon and sulphur isotope analyses. Because eye lens development starts during the embryonic period, eye lenses are well-suited for reconstructing early life histories.
There are several important assumptions for reconstructing the life history of fish from lens nitrogen isotope chronologies. First, lens formation is representative of ambient nitrogen sources. This assumption requires validation using controlled environments (e.g., laboratory-controlled diets) in the future. However, several studies, including the present study, provided evidence that the 15NBaseline cancels the trophic discrimination between diet and consumer, e.g., Matsubayashi et al. (2020) and Xing et al. (2020). It is also assumed that the nitrogen composing the lamina is originated from the recent diet and is not from the reserves (e.g., mobilisation of muscle protein). Second, the 15NBaseline reflects the isotope values in specific geographic locations at particular times. Substantial spatial variations in nitrogen ratios within the animal’s habitat range are needed. Feeding needs to be carried out to record ambient nitrogen sources. A time lag between the consumer feeding on prey and the prey nitrogen being incorporated into the laminae probably exists. For example, Bell-Tilcock et al. (2021) show that salmon took 39 rearing days to reflect the diet signal in the laminae fully. However, this likely depends on the lens growth rate. In the present study, this time lag was not assessed. However, this needs to be addressed in future for more accurate interpretations of lens isotope chronologies. Third, the isotope value in each lamina is unchanged from the value at the time when each lamina was formed. Protein exchanges are limited to lateral diffusion among cells of similar age rather than centripetal diffusion among laminae and are limited to the water-soluble fraction of crystallins (Peebles and Hollander, 2020). Stewart et al. (2013) provided evidence that this exchange is not sufficient to mask the temporal details of the isotope record.
The migration patterns of many fish are changing due to changing ocean conditions (for example, global warming). This makes marine conservation and fisheries management even more challenging (Lennox et al., 2019). It is essential to know the spawning grounds, habitats, and seasonal migrations of fish. Recording devices such as archival tags cannot adequately assess the movements of fish throughout their lives. However, a combination of the eye lens-based approach implemented in this study and isoscapes may help us overcome this limitation by providing the life-long feeding and movements history of fish.
Publisher’s Note
All claims expressed in this article are solely those of the authors and do not necessarily represent those of their affiliated organizations, or those of the publisher, the editors and the reviewers. Any product that may be evaluated in this article, or claim that may be made by its manufacturer, is not guaranteed or endorsed by the publisher.
Statements
Data availability statement
The original contributions presented in the study are included in the article/Supplementary Material, further inquiries can be directed to the corresponding author.
Ethics statement
The animal study was reviewed and approved by the National Research Institute of Fisheries Science.
Author contributions
YH led writing and coordinated the data compilation and analysis. All authors conceptualized the study and contributed to writing and data compilation and analysis.
Funding
We acknowledge support from JSPS KAKENHI Grant Number 21K14910, JSPS KAKENHI 19H04247 and the Interdisciplinary Collaborative Research Program of the Atmosphere and Ocean Research Institute, the University of Tokyo.
Acknowledgments
We thank Y. Sasaki, T. Ishimura, and T. Kurosaki for assistance with laboratory work, J. Matsubayashi for useful discussions, and M. Carrigg for proofreading the manuscript.
Conflict of interest
The authors declare that the research was conducted in the absence of any commercial or financial relationships that could be construed as a potential conflict of interest.
Supplementary material
The Supplementary Material for this article can be found online at: https://www.frontiersin.org/articles/10.3389/fmars.2021.796532/full#supplementary-material
References
1
Arim M. Abades S. R. Laufer G. Loureiro M. Marquet P. A. (2010). Food web structure and body size: trophic position and resource acquisition.Oikos119147–153.
2
Bell-Tilcock M. Jeffres C. A. Rypel A. L. Sommer T. R. Katz J. V. E. Whitman G. et al (2021). Advancing diet reconstruction in fish eye lenses.Methods Ecol. Evol.12449–457.
3
Chang T. Jiang Y.-J. Chiou S.-H. Chang W.-C. (1988). Carp gamma-crystallins with high methionine content: cloning and sequencing of the complementary DNA.Biochim. Biophys. Acta951226–229. 10.1016/0167-4781(88)90044-9
4
Chikaraishi Y. Ogawa N. O. Kashiyama Y. Takano Y. Suga H. Tomitani A. et al (2009). Determination of aquatic food-web structure based on compound-specific nitrogen isotopic composition of amino acids.Limnol. Oceanogr. Methods7740–750. 10.4319/lom.2009.7.740
5
Chikaraishi Y. Steffan S. A. Takano Y. Ohkouchi N. (2015). Diet quality influences isotopic discrimination among amino acids in an aquatic vertebrate.Ecol. Evol.52048–2059. 10.1002/ece3.1491
6
Curtis J. S. Albins M. A. Peebles E. B. Stallings C. D. (2020). Stable isotope analysis of eye lenses from invasive lionfish yields record of resource use.Mar. Ecol. Prog. Ser.637181–194.
7
Eastoe J. (1957). The amino acid composition of fish collagen and gelatin.Biochem. J.65363–368. 10.1042/bj0650363
8
Falco F. Barra M. Cammarata M. Cuttitta A. Jia S. Bonanno A. et al (2016). Amino acid composition in eyes from zebrafish (Danio rerio) and sardine (Sardina pilchardus) at the larval stage.SpringerPlus5:519. 10.1186/s40064-016-2137-1
9
Feher J. (2012). “4.8 - Vision,” in Quantitative Human Physiology, 2nd Edn, ed.FeherJ. (Boston: Academic Press), 456–470.
10
Grainger R. M. (1992). Embryonic lens induction: shedding light on vertebrate tissue determination.Trends Genet.8349–355. 10.1016/0168-9525(92)90280-h
11
Guo C. Ito S. Wegner N. C. Frank L. N. Dorval E. Dickson K. A. et al (2020). Metabolic measurements and parameter estimations for bioenergetics modelling of pacific chub mackerel Scomber japonicus.Fish. Oceanogr.29215–226. 10.1111/fog.12465
12
Higuchi T. Ito S.-I. Ishimura T. Kamimura Y. Shirai K. Shindo H. et al (2019). Otolith oxygen isotope analysis and temperature history in early life stages of the chub mackerel Scomber japonicus in the Kuroshio–Oyashio transition region.Deep Sea Res. II Top. Stud. Oceanogr.169-170:104660.
13
Hwang S.-D. Kim J.-Y. Lee T.-W. (2008). Age, growth, and maturity of chub mackerel off korea.N. Am. J. Fish. Manag.28, 1414–1425. 10.1577/M07-063.1
14
Ishikawa N. F. (2018). Use of compound-specific nitrogen isotope analysis of amino acids in trophic ecology: assumptions, applications, and implications.Ecol. Res.33825–837. 10.1007/s11284-018-1616-y
15
Ishikawa N. F. Ogawa N. O. Chikaraishi Y. Yamaguchi M.-O. Fujikura K. Miyairi Y. et al (2021). Influences of ocean currents on the diets of demersal fish communities in the western north pacific revealed by their muscle carbon and nitrogen isotopic compositions.Front. Mar. Sci.8:641282.
16
Kashiyama Y. Ogawa N. O. Chikaraishi Y. Kashiyama N. Sakai S. Tanabe K. et al (2010). Reconstructing the Life History of Modern and Fossil Nautiloids Based on the Nitrogen Isotopic Composition of Shell Organic Matter and Amino Acids.Cephalopods: present and past. Tokyo: Tokai University Press.
17
Kröger R. H. (2013). Optical plasticity in fish lenses.Prog. Retin. Eye Res.3478–88.
18
Lennox R. J. Paukert C. P. Aarestrup K. Auger-Méthé M. Baumgartner L. Birnie-Gauvin K. et al (2019). One hundred pressing questions on the future of global fish migration science, conservation, and policy.Front. Ecol. Evol.7:286.
19
Lowerre-Barbieri S. K. Kays R. Thorson J. T. Wikelski M. (2019). The ocean’s movescape: fisheries management in the bio-logging decade (2018–2028).ICES J. Mar. Sci.76477–488.
20
Mahler B. Chen Y. Ford J. Thiel C. Wistow G. Wu Z. (2013). Structure and dynamics of the fish eye lens protein, γM7-crystallin.Biochemistry523579–3587. 10.1021/bi400151c
21
Matsubayashi J. Osada Y. Tadokoro K. Abe Y. Yamaguchi A. Shirai K. et al (2020). Tracking long-distance migration of marine fishes using compound-specific stable isotope analysis of amino acids.Ecol. Lett.23881–890. 10.1111/ele.13496
22
McMahon K. W. Hamady L. L. Thorrold S. R. (2013). A review of ecogeochemistry approaches to estimating movements of marine animals.Limnol. Oceanogr.58697–714.
23
Molina R. E. Manrique F. A. Velasco H. E. (1996). Filtering apparatus and feeding of the Pacific mackerel (Scomber japonicus) in the Gulf of California.California Cooperative Oceanic Fish. Investig. Rep.3251–256.
24
Moulton F. American Association for the Advancement of Science (1939). “The migration and conservation of salmon,” in Proceedings of a Symposium Held in the Chateau Laurier, Ottawa.
25
Nakamura M. Yoneda M. Ishimura T. Shirai K. Tamamura M. Nishida K. (2020). Temperature dependency equation for chub mackerel (Scomber japonicus) identified by a laboratory rearing experiment and microscale analysis.Mar. Freshw. Res.71:1384. 10.1071/mf19313
26
Ogawa N. O. Nagata T. Kitazato H. Ohkouchi N. (2010). “Ultra-sensitive elemental analyser/isotope ratio mass spectrometer for stable nitrogen and carbon isotope analyses” in Earth, Life, and Isotopes, edsOhkouchiN.TayasuI.KobaK. (Kyoto: Kyoto University Press), 339–353
27
Ohkouchi N. Chikaraishi Y. Close H. G. Fry B. Larsen T. Madigan D. J. et al (2017). Advances in the application of amino acid nitrogen isotopic analysis in ecological and biogeochemical studies.Organic Geochem.113150–174.
28
Peebles E. B. Hollander D. J. (2020). Combining Isoscapes with Tissue-Specific Isotope Records to Recreate the Geographic Histories of Fish.Berlin: Springer International Publishing, 203–218.
29
Quaeck-Davies K. Bendall V. A. Mackenzie K. M. Hetherington S. Newton J. Trueman C. N. (2018). Teleost and elasmobranch eye lenses as a target for life-history stable isotope analyses.PeerJ6:e4883. 10.7717/peerj.4883
30
Romanuk T. N. Hayward A. Hutchings J. A. (2011). Trophic level scales positively with body size in fishes.Glob. Ecol. Biogeogr.20231–240.
31
Ryu B. Shin K.-H. Kim S.-K. (2021). Muscle protein hydrolysates and amino acid composition in fish.Mar. Drugs19377. 10.3390/md19070377
32
Simpson S. J. Sims D. W. Trueman C. N. (2019). Ontogenetic trends in resource partitioning and trophic geography of sympatric skates (Rajidae) inferred from stable isotope composition across eye lenses.Mar. Ecol. Prog. Ser.624103–116.
33
Srikanthan D. Bateman O. A. Purkiss A. G. Slingsby C. (2004). Sulfur in human crystallins.Exp. Eye Res.79823–831. 10.1016/j.exer.2004.05.009
34
Stewart D. N. Lango J. Nambiar K. P. Falso M. J. S. Fitzgerald P. G. Rocke D. M. et al (2013). Carbon turnover in the water-soluble protein of the adult human lens. Mol. Vis.19, 463–475.
35
Taga M. Kamimura Y. Yamashita Y. (2019). Effects of water temperature and prey density on recent growth of chub mackerel Scomber japonicus larvae and juveniles along the Pacific coast of Boso–Kashimanada.Fish. Sci.85931–942.
36
Tzadik O. E. Curtis J. S. Granneman J. E. Kurth B. N. Pusack T. J. Wallace A. A. et al (2017). Chemical archives in fishes beyond otoliths: a review on the use of other body parts as chronological recorders of microchemical constituents for expanding interpretations of environmental, ecological, and life-history changes.Limnol. Oceanogr. Methods15238–263.
37
Wallace A. A. Hollander D. J. Peebles E. B. (2014). Stable isotopes in fish eye lenses as potential recorders of trophic and geographic history.PLoS One9:e108935. 10.1371/journal.pone.0108935
38
Watanabe C. Yatsu A. (2004). Effects of density-dependence and sea surface temperature on interannual variation in length-at-age of chub mackerel (Scomber japonicus) in the Kuroshio-Oyashio area during 1970–1997.Fish. Bull.102196–206.
39
Wride M. A. (2011). Lens fibre cell differentiation and organelle loss: many paths lead to clarity.Philos. Trans. R. Soc. Lond. B Biol. Sci.3661219–1233. 10.1098/rstb.2010.0324
40
Xing D. Choi B. Takizawa Y. Fan R. Sugaya S. Tsuchiya M. et al (2020). Trophic hierarchy of coastal marine fish communities viewed via compound-specific isotope analysis of amino acids.Mar. Ecol. Prog. Ser.652137–144.
41
Yatsu A. Watanabe T. Ishida M. Sugisaki H. Jacobson L. D. (2005). Environmental effects on recruitment and productivity of Japanese sardine Sardinops melanostictus and chub mackerel Scomber japonicus with recommendations for management.Fish. Oceanogr.14263–278. 10.1111/j.1365-2419.2005.00335.x
42
Yoshikawa C. Makabe A. Matsui Y. Nunoura T. Ohkouchi N. (2018). Nitrate isotope distribution in the subarctic and subtropical North Pacific.Geochem. Geophys. Geosyst.192212–2224. 10.1029/2018gc007528
Summary
Keywords
fish, migration, eye lens, nitrogen, isotope, amino acid
Citation
Harada Y, Ito S-i, Ogawa NO, Yoshikawa C, Ishikawa NF, Yoneda M and Ohkouchi N (2022) Compound-Specific Nitrogen Isotope Analysis of Amino Acids in Eye Lenses as a New Tool to Reconstruct the Geographic and Trophic Histories of Fish. Front. Mar. Sci. 8:796532. doi: 10.3389/fmars.2021.796532
Received
17 October 2021
Accepted
31 December 2021
Published
03 February 2022
Volume
8 - 2021
Edited by
Yunping Xu, Shanghai Ocean University, China
Reviewed by
Antonio Bode, Oceanographic Center of A Coruña, Spanish Institute of Oceanography, Spain; Oscar Sosa-Nishizaki, Center for Scientific Research and Higher Education in Ensenada (CICESE), Mexico
Updates
Copyright
© 2022 Harada, Ito, Ogawa, Yoshikawa, Ishikawa, Yoneda and Ohkouchi.
This is an open-access article distributed under the terms of the Creative Commons Attribution License (CC BY). The use, distribution or reproduction in other forums is permitted, provided the original author(s) and the copyright owner(s) are credited and that the original publication in this journal is cited, in accordance with accepted academic practice. No use, distribution or reproduction is permitted which does not comply with these terms.
*Correspondence: Yota Harada, y.harada@jamstec.go.jp
This article was submitted to Marine Biogeochemistry, a section of the journal Frontiers in Marine Science
Disclaimer
All claims expressed in this article are solely those of the authors and do not necessarily represent those of their affiliated organizations, or those of the publisher, the editors and the reviewers. Any product that may be evaluated in this article or claim that may be made by its manufacturer is not guaranteed or endorsed by the publisher.