Abstract
In this study, microplastics were sampled and analyzed from surface water and sediment samples from July to August in 2020, in the Beibu Gulf (the northern South China Sea [SCS]), a gulf with intensive fishery activities while the economy is less developed, compared with other coastal areas of China. The abundances of microplastics in seawater and sediment in the Beibu Gulf were 0.67 items/m3 and 4.33 items/kg of dry weight, respectively. In seawater, the fragments (92.38%) contributed the most, and polystyrene (PS) was the dominant polymer (53.23%). In sediment, the most abundant microplastics were fiber (82.93%) and rayon (RY; 39.54%). The abundances of remarkably higher microplastics were found in the seawater and sediment adjacent to the urban area. The abundances of microplastics in far coastal sediment were only slightly lower than that in the coastal sediment, indicating that microplastics are ready to transport and bury in open area sediment. Significant positive correlations between the microplastic abundance and population density and per capita gross domestic product (GDP) were found in Chinese coastal seawater, with low population density and less developed economy, and the microplastic pollution in the Beibu Gulf was at a low level. This study provides preliminary data of microplastics in the Beibu Gulf, supporting further investigation of transportation fate and management of this emerging pollutant from the coastal zone to the SCS.
Introduction
As an emerging marine pollutant, microplastics (defined as those plastics with size < 5 mm) can be derived from the degradation of larger plastics in the ocean by sunlight, microbes and mechanical abrasion (Cózar et al., 2014; Khan, 2020; Cordova et al., 2021), or from discharge of wastewater that contains microplastics (Jambeck et al., 2015; Liu et al., 2017; Rochman, 2018; Naji et al., 2020; Nurhasanah et al., 2021). Due to the low density and stable properties, microplastics can be transported to a long distance in the ocean. For example, microplastics have been found in polar waters, deep seawaters, and ocean central island waters and can stably exist in seawater, sediments, and organisms (Cauwenberghe et al., 2013; Isobe et al., 2017; Waller et al., 2017; Li et al., 2019; Wu et al., 2020). Microplastics will produce harmful additives and monomers and also carry heavy metals and persistent organic pollutants in the marine environment (Boyle et al., 2020; Catarino et al., 2021; Chen et al., 2021). Microplastics may be ingested by marine organisms, which could cause various adverse effects. Thus, they are potentially incorporated into the marine food web through trophic transfer and ultimately endanger human health through the consumption of contaminated seafood (Lusher et al., 2017; Pannetier et al., 2020; Philipp et al., 2021). Thus, monitoring microplastics in the ocean (especially the coastal zone) and exploring its biogeochemical cycle are the hot science topics in recent years (Everaert et al., 2018; Li Y. et al., 2020).
The Beibu Gulf, a semi-enclosed bay where microplastics are more likely to accumulate (Sharma et al., 2021; Zhou et al., 2021), is located in the northern South China Sea (SCS), surrounded by three major cities, such as Beihai, Qinzhou, and Fangchenggang, with a total population of 6.2 million (2020). As one of the world’s largest fishing grounds in the SCS, mariculture is highly crowded in the coastal zone of the Beibu Gulf compared with other coastal areas of China. Intensive anthropogenic activities, including fishery and mariculture, have contributed a large amount of microplastics in the adjacent sea (Zhang et al., 2017; Cheung L. T. O. et al., 2018; Wang et al., 2018; Li Y. et al., 2020; Li Z. et al., 2020; Xue et al., 2020). Few studies reported microplastics in the coastal zones of the Beibu Gulf. Zhu et al. (2019) reported high levels of microplastics in the Maowei Sea (a bay of the Beibu Gulf), a traditional oyster farm bay. Xue et al. (2020) discovered that a large amount of microplastics derived from fishery activities were buried in deep sediment, suggesting that the microplastic storage worldwide might be underestimated because most of the previous studies examined only surface sediment. To date, still less is known of the abundance and distribution of microplastics in the coastal and far coastal zones of the Beibu Gulf.
At the same time, though Beibu Gulf is experiencing the economic development and rapid urbanization of the surrounded human land, still it is one of the least developed regions among the coastal areas of China, with per capita gross domestic product (GDP) of USD 8.56k, while for whole China is USD 11.3k (2020). The microplastic pollution should be at a low level according to the positive relationships found between microplastic abundance and factors, such as land use percentages (Kataoka et al., 2019), population density (Yonkos et al., 2014), and GDP (Fan et al., 2019) in some water bodies. However, the Beibu Gulf is also a microcosm of the fishery industry of China and Southeast Asian countries and fishery is one of the pillar industries. Therefore, the Beibu Gulf is a typical area to study the co-influence of socioeconomics and fishery industry to the microplastic pollution, understanding the status of microplastics in Beibu Gulf is helpful in taking measures and policymaking to reduce microplastics in China and Southeast Asian countries (Xue et al., 2020).
In this study, the characteristics and distributions of microplastics in the coastal zones of the Beibu Gulf were investigated, and socioeconomic indices, such as population density and per capita GDP, were chosen to assess the microplastic pollution status in the Beibu Gulf. To obtain more comparable data, a Manta net with a netmesh of 0.33 mm was used for surface seawater microplastic sampling (Yonkos et al., 2014; Chen et al., 2018; Xu et al., 2021). Sample preparation of microplastics in seawater and sediment was conducted according to the literature methods, i.e., wet oxidation (10% potassium hydroxide [KOH] for water; 30% hydrogen peroxide [H2O2] for sediment) and density separation (1.2 g/cm3 sodium chloride [NaCl]) were employed (NOAA Marine Debris Program, 2015; Rocha-Santos and Duarte, 2015; Wang et al., 2020; Wu et al., 2020). Stereo microscope and micro-Fourier transform infrared spectrometer (μ-FTIR) were used to identify microplastics.
The aims of this study were to: (1) determine the microplastic abundance, size, color, and polymer composition in the Beibu Gulf, (2) analyze the differences of the microplastic status between Beibu Gulf and other comparable Chinese sea areas, (3) confirm the relationships between microplastic abundances and socioeconomic indices, and (4) provide preliminary data for further study of the transportation fate and management of microplastics in the Beibu Gulf and the SCS. The result of this study may be useful for the cooperation actions taken by the departments of marine environment protection, marine fishery, waste treatment, and public organizations to handle the microplastic pollution in the Beibu Gulf and other ocean waters.
Materials and Methods
Field Sampling
Study Area
Sampling was conducted in the Beibu Gulf by two cruises, one was L cruise (coastal area) in July 2020 by the R/V Yueke 1, during which 59 stations were sampled for seawater and 43 stations for sediment. The other was B cruise (far coastal area) in August 2020 by the R/V Yuexiayuzhi 20028, during which 16 stations were sampled for seawater and 23 stations for sediment. The study area and sampling station distribution are shown in Figure 1.
FIGURE 1
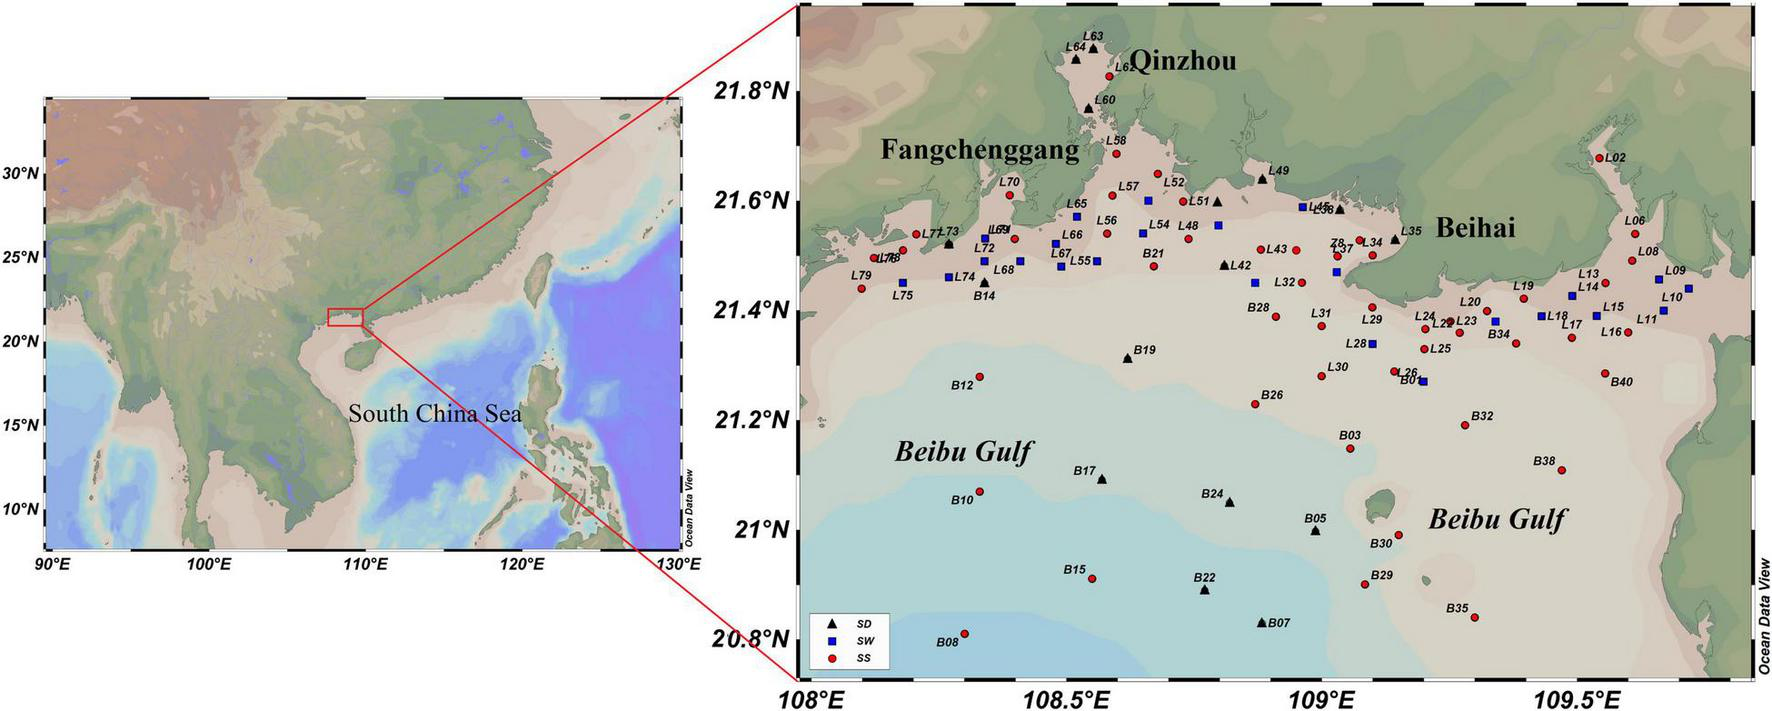
Location of Beibu Gulf and sampling station distribution. L stations were sampled during L cruise, while B stations were sampled during B cruise. SD, sediment station, SW, seawater station, SS, sediment and seawater station.
Sampling Methods
Seawater samples were collected using a Manta trawl (330 μm mesh nylon net), while surface sediment (>5 cm) was collected using a Van Veen sediment collector. Detailed sampling methods were described in the Supplementary Materials.
Sample Preparation
The sample treatment for seawater was slightly modified according to Wang et al. (2020), and the sediments were analyzed according to Wu et al. (2020). Notably, 10% KOH and 30% H2O2 were used for the wet oxidation of seawater and sediment, respectively. Saturated NaCl (1.2 g/cm3) was used for the density separation of microplastics in seawater and sediment. Sample pretreatment methods were detailed in the Supplementary Materials.
Characterization
The Shape, Color, and Size of Microplastics
A SteREO Discovery V8 microscope (Zeiss, Germany) equipped with a digital camera (C 33; OPLENIC, United States) and “ZEN lite” software was used to characterize the physical properties of the microplastics. Guidelines from Zhao et al. (2018) were used to identify the microplastics: (1) the particle cannot be easily broken with tweezers, (2) the color of the particle is uniform, and (3) the particle is free of biological tissues and cell structures. The size of each particle was measured along its longest axis (Wang et al., 2020).
The Composition of Microplastics
A μ-FTIR (Nicolet iN10; Thermo Fisher, United States) was used to determine the chemical composition of inspected materials, all suspected microplastics were examined, and only materials with polymers were successfully determined as microplastics (Cai et al., 2018; Wang et al., 2020). The sample was measured in the transmittance mode. The spectral range (650–4,000 cm–1) and aperture range (from 50 × 50 mm to 150 × 150 mm) were selected according to particle size. The spectra obtained were matched with the OMNIC polymer spectral library (standard database) to identify the polymer types, and at least 70% similarity was assigned to the polymer conformation (Mecozzi et al., 2016).
Quality Control
All labware equipment used in the study were rinsed three times with Milli-Q water before use. All solutions and liquids used in the study were filtered by a glass fiber filter (GF/F Whatman, 47 mm diameter, and 0.7 μm pore size) before use. Procedural blank samples (n = 3) were analysed to correct the potential laboratory contamination in each batch sample treatment, and the recovery of the methods used was performed using standard reference materials (National Marine Environmental Monitoring Centre, China), with 95%. Other measures were taken in the lab to keep the contamination at the lowest level, such as using aluminum foil to cap the containers and wearing cotton clothes.
Data Analysis
Statistical analysis was carried out using the EXCEL 2010 (Microsoft Inc., United States) and SigmaPlot 12.5 (Systat Software Inc., United States) software. Figures were drawn using the SigmaPlot 12.5 software, while distribution maps were drafted using the Ocean Data View 4 (Alfred Wegener, Germany) software.
Results
Abundance of Microplastics
Seawater Samples
A total of 75 stations of seawater samples were collected from the two (L + B) cruises. The mean abundance of microplastics in all seawater samples was 0.67 ± 1.09 items/m3, while the mean abundances of 0.78 ± 1.20 and 0.26 ± 0.32 items/m3 were obtained in seawater from L and B stations, respectively. These results were comparable with other studies, in which 0.3 mm trawl nets were used. The microplastic abundances reported in different Chinese sea areas are summarized in Table 1. The abundance observed in the Beibu Gulf was in the same order of magnitude as those in the Bohai Sea (0.79 items/m3), Yellow Sea (0.33 ± 0.28 items/m3), East China Sea (0.31 items/m3), and Hangzhou Bay (0.14 ± 0.12 items/m3) but much lower than those in Yangtze Estuary (67.5 ± 94.4 items/m3), Jiaozhou Bay (46 ± 28 items/m3), Xiangshan Bay (8.91 ± 4.7 items/m3), Haizhou Bay (2.6 ± 1.4 items/m3), Xiamen Bay (514.3 ± 520 items/m3), and Hong Kong waters (3.973 ± 1.777 items/m3). As expected, the mean abundance of microplastics in the Beibu Gulf was one order of magnitude higher than in the SCS (0.045 ± 0.093 items/m3).
TABLE 1
| Location | Abundance |
References | |
| In seawater (items/m3) | In sediment (items/kg d.w.) | ||
| Bohai Sea | 0.79 | 48.88 | Xu et al., 2021 |
| Jiaozhou Bay | 46 ± 28 | 15 ± 6 | Zheng et al., 2019 |
| Yellow Sea | 0.33 ± 0.28 | 2580 ± 1140 | Wang et al., 2018 |
| North Yellow Sea | ND | 37.1 ± 42.7 | Zhu et al., 2018 |
| Haizhou Bay | 2.6 ± 1.4 | 330 ± 260 | Li Z. et al., 2020 |
| East China Sea | 0.31 | ND | Liu et al., 2018 |
| East China Sea | ND | 142 ± 38 | Zhang et al., 2019 |
| Yangtze Estuary | 67.5 ± 94.4 | 28.3 ± 14.4 | Li Y. et al., 2020; Li Z. et al., 2020 |
| Hangzhou Bay | 0.14 ± 0.12 | 84.3 ± 56.6 | Wang et al., 2020 |
| Xiangshan Bay | 8.91 ± 4.7 | 1740 ± 2150 | Chen et al., 2018 |
| Xiamen Bay | 514.3 ± 520 | 181 | Tang et al., 2018 |
| Hong Kong waters | 3.973 ± 1.777 | – | Cheung P. K. et al., 2018 |
| Beibu Gulf | ND | 405 ± 336a | Xue et al., 2020 |
| Qin River Estuary, Maowei Sea, Beibu Gulf | 0.1–4.6 | 0-97 | Zhang et al., 2020 |
| Maowei Sea, Beibu Gulf | 1200–10100 | ND | Zhu et al., 2019 |
| Beibu Gulf | 0.67 ± 1.09 | 13.87 ± 9.9 | This study |
| Coast area of Beibu Gulf (L) | 0.78 ± 1.2 | 15 ± 10.74 | |
| Far coast area of Beibu Gulf (B) | 0.26 ± 0.32 | 12.21 ± 8.07 | |
| South China Sea | 0.045 ± 0.093 | ND | Cai et al., 2018 |
Summary of microplastic abundances reported in surface water and sediment from various sea areas in China (data published within the last 3 years, revised from Wang et al., 2020).
ND, no data available.
aFloating phase was potassium formate solution, with a density of 1.5 g/cm3.
Sediment Samples
A total of 66 stations of sediment samples were collected from the two (L + B) cruises. The mean abundance of microplastics in sediment samples was 13.87 ± 9.9 items/kg of dry weight (d.w.), while mean abundances of 15.00 ± 10.74 items/kg d.w. and 12.21 ± 8.07 items/kg d.w. were obtained in sediment from L and B stations, respectively. The microplastic abundances in sediments from other areas are also summarized in Table 1. The table shows that from the aspect of microplastics, the sediment quality in the Beibu Gulf was the best in China since the microplastic abundance was the lowest (13.87 ± 9.9 items/kg d.w.), while higher abundances (0–97 items/kg d.w.) were observed in the Qin River Estuary and Maowei Sea, which is a traditional oyster farm sea, indicating the contribution of mariculture. A much higher abundance (405 ± 336 items/kg d.w.) was discovered in the Beibu Gulf by Xue et al. (2020), in which a potassium formate solution with a density of 1.5 g/cm3 was used as floating phase, yielding more microplastics from the sediments.
Microplastic Characteristics
Seawater Samples
Among all the seawater samples, the fragment was prevalent shape (91.0–92.6%), and no microplastic sphere was detected (Figure 2A). Only a small amount of fiber (4.9%), film (2.0%), and particle (0.8%) were found in L stations, whereas fiber (8.4%) and particle (0.6%) were found in the B station (Figure 3). Most of the microplastics were white (>50%), followed by transparent (33.0%) and green (6.4%) in L stations, whereas transparent (14.0%) and black (4.5%) in B stations (Figure 2B) were observed.
FIGURE 2
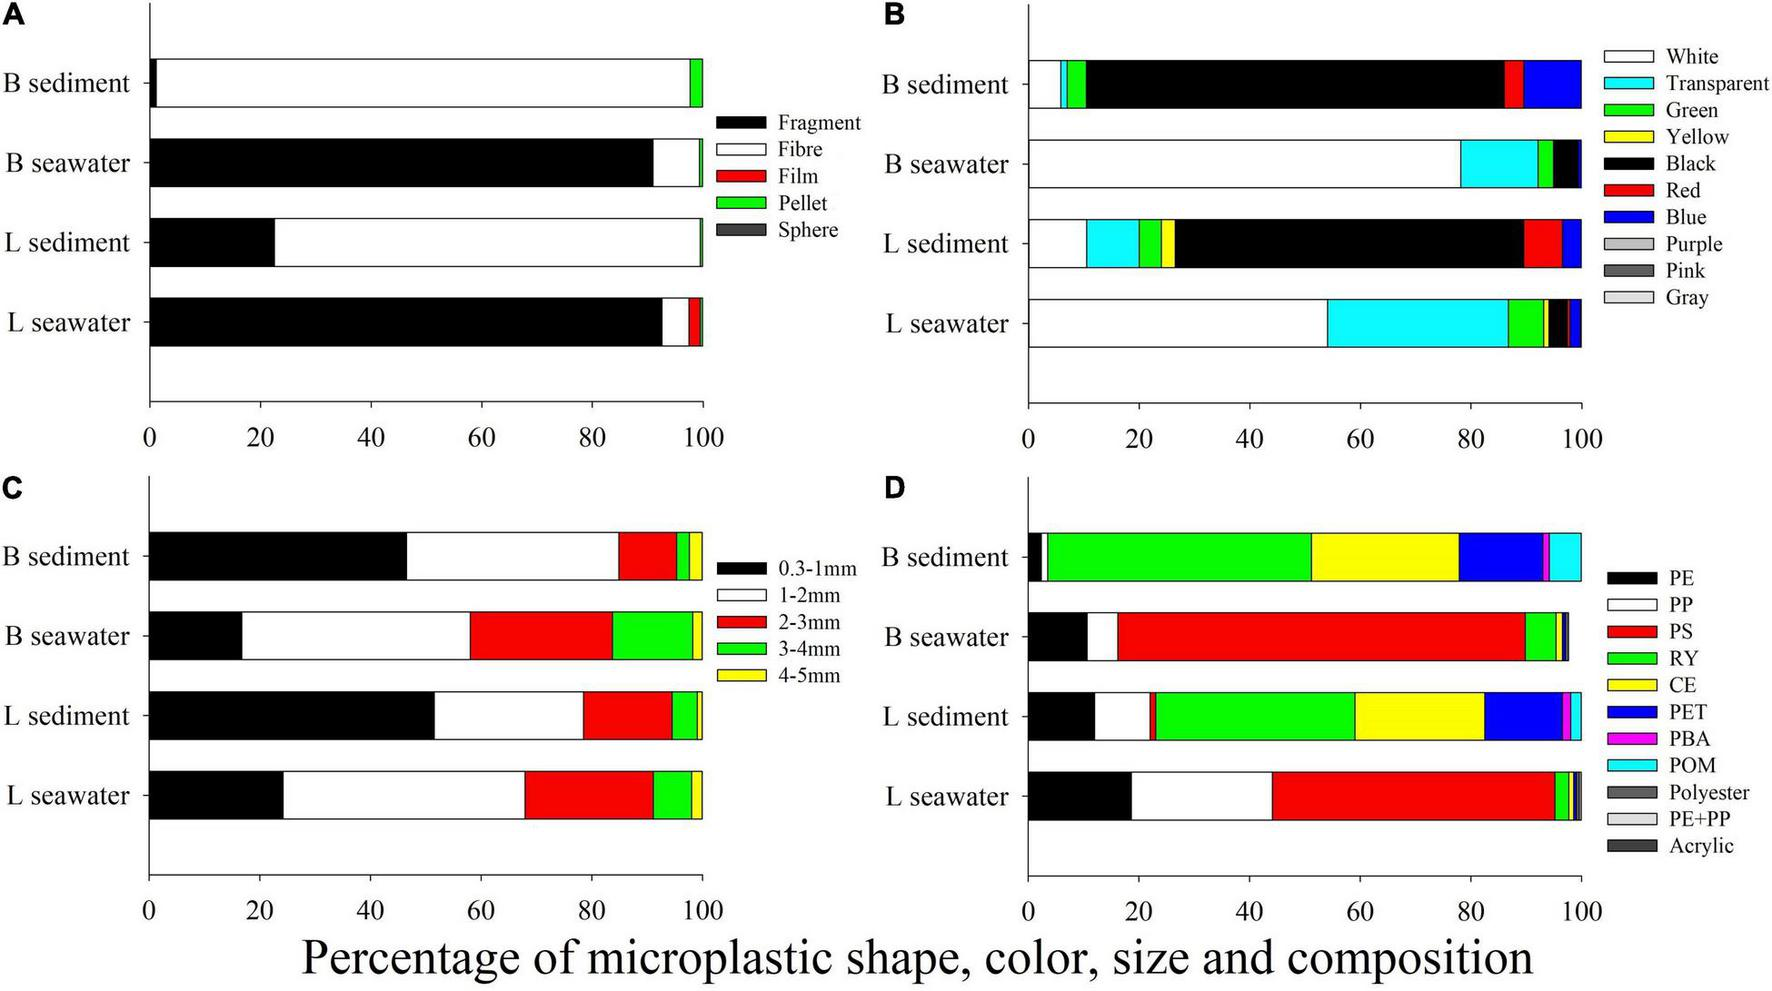
Microplastic characteristics observed from the seawater and sediment samples in the Beibu Gulf (the northern South China Sea): shape (A), color (B), size (C), and composition (D).
FIGURE 3
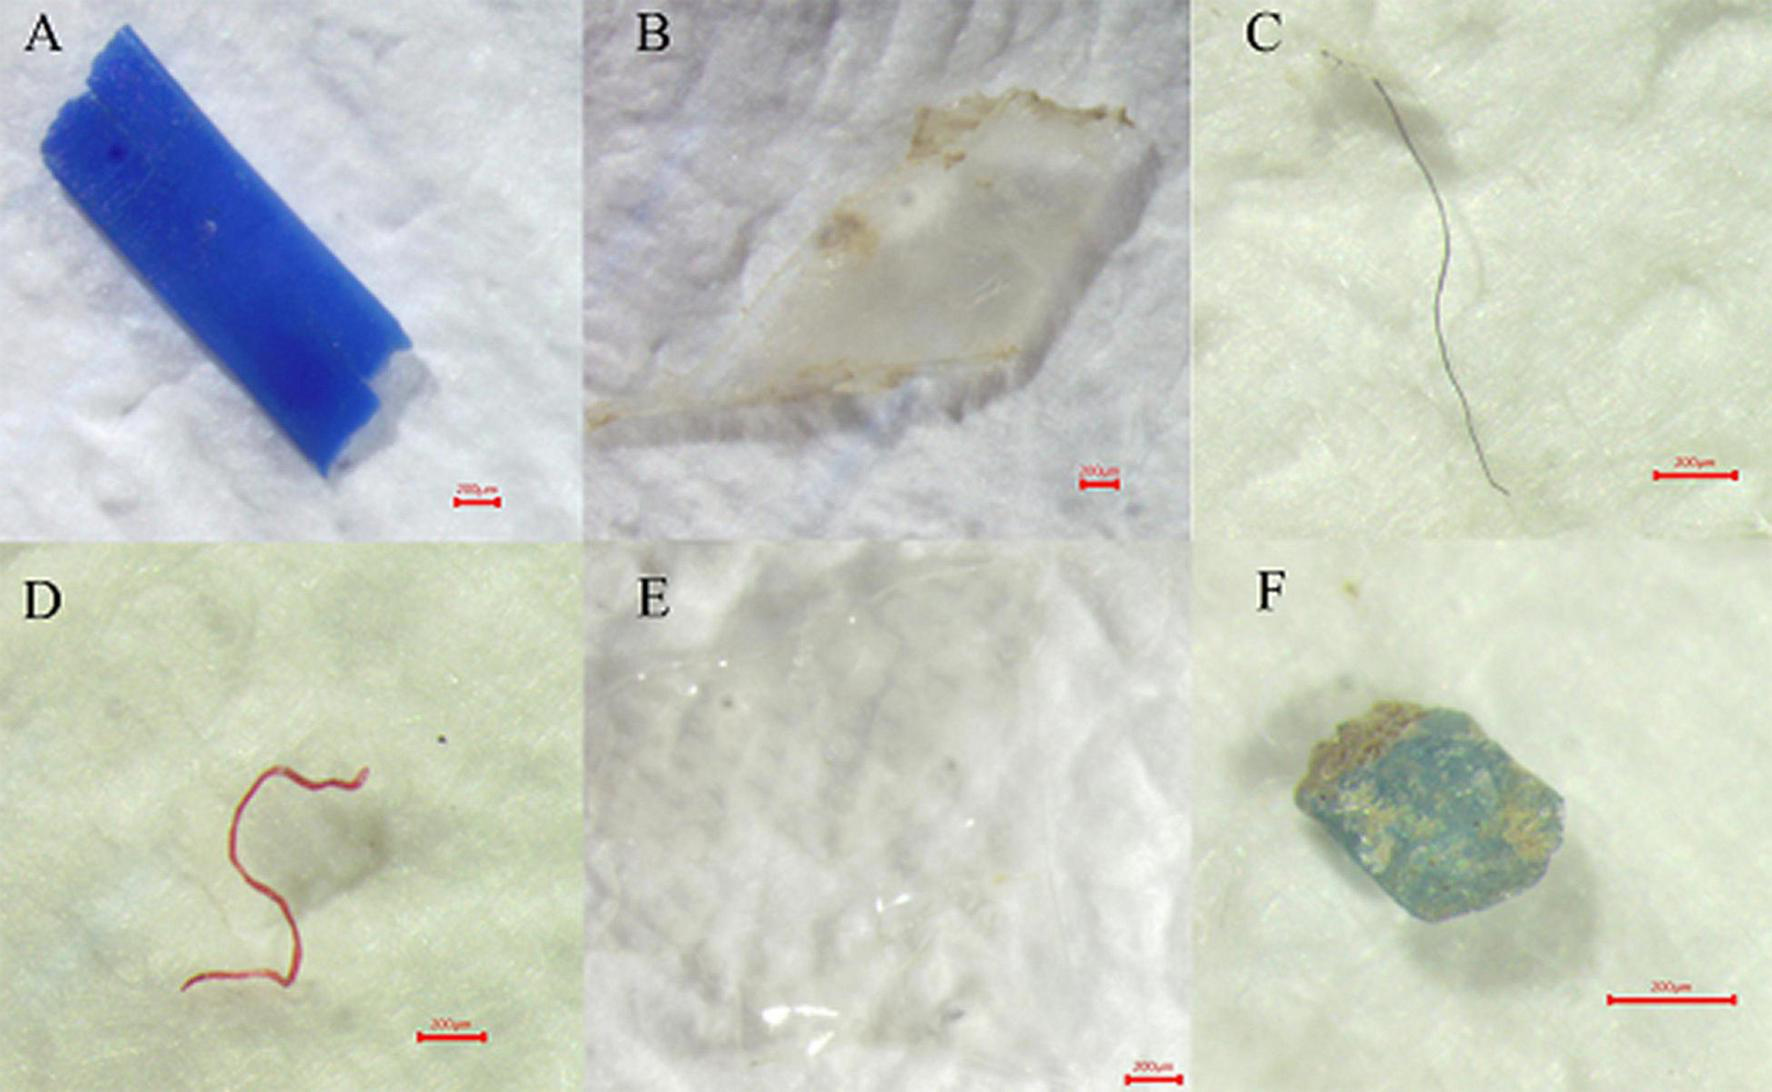
Selected microplastic shapes inspected by SteREO microscope: fragment (A,B), fiber (C,D), film (E), and pellet (F).
The size compositions of microplastics in seawater are shown in Figure 2C. In both L and B stations, microplastics with a diameter of 0.33–1 mm were the dominant polymers, accounting for 51.5 and 46.5%, respectively, followed by 1–2 mm (27.0 and 38.4%) and 2–3 mm (16 and 10.46%). Microplastics with a diameter of 3–5 mm were proportioned to less than 10% in the two sampling areas.
Typical polymer μ-FTIR spectra are shown in Figure 4. To identify the synthetic polymer, a relatively higher matching degree (>75%) was set to provide more accurate results. There was little shift of the main polymer absorption band according to the comparisons (Chen et al., 2018; Li Y. et al., 2020). Eleven polymers were detected in seawater samples, including polyethylene (PE), polypropylene (PP), PS, rayon (RY), cellulose (CE), polyethylene terephthalate (PET), polyester, polybutylene adipate glycol (PBA), polyoxymethylene (POM), and acrylic. The proportion of each polymer type in seawater is shown in Figure 2D. The main polymers in coastal seawater (L stations) were PS (51.1%), PP (25%), PE (18.6%), and RY (2.5%), while in far coastal areas (B stations), they were PS (73.7%), PE (10.6%), PP and RY (5.6%), and CE (1.1%).
FIGURE 4
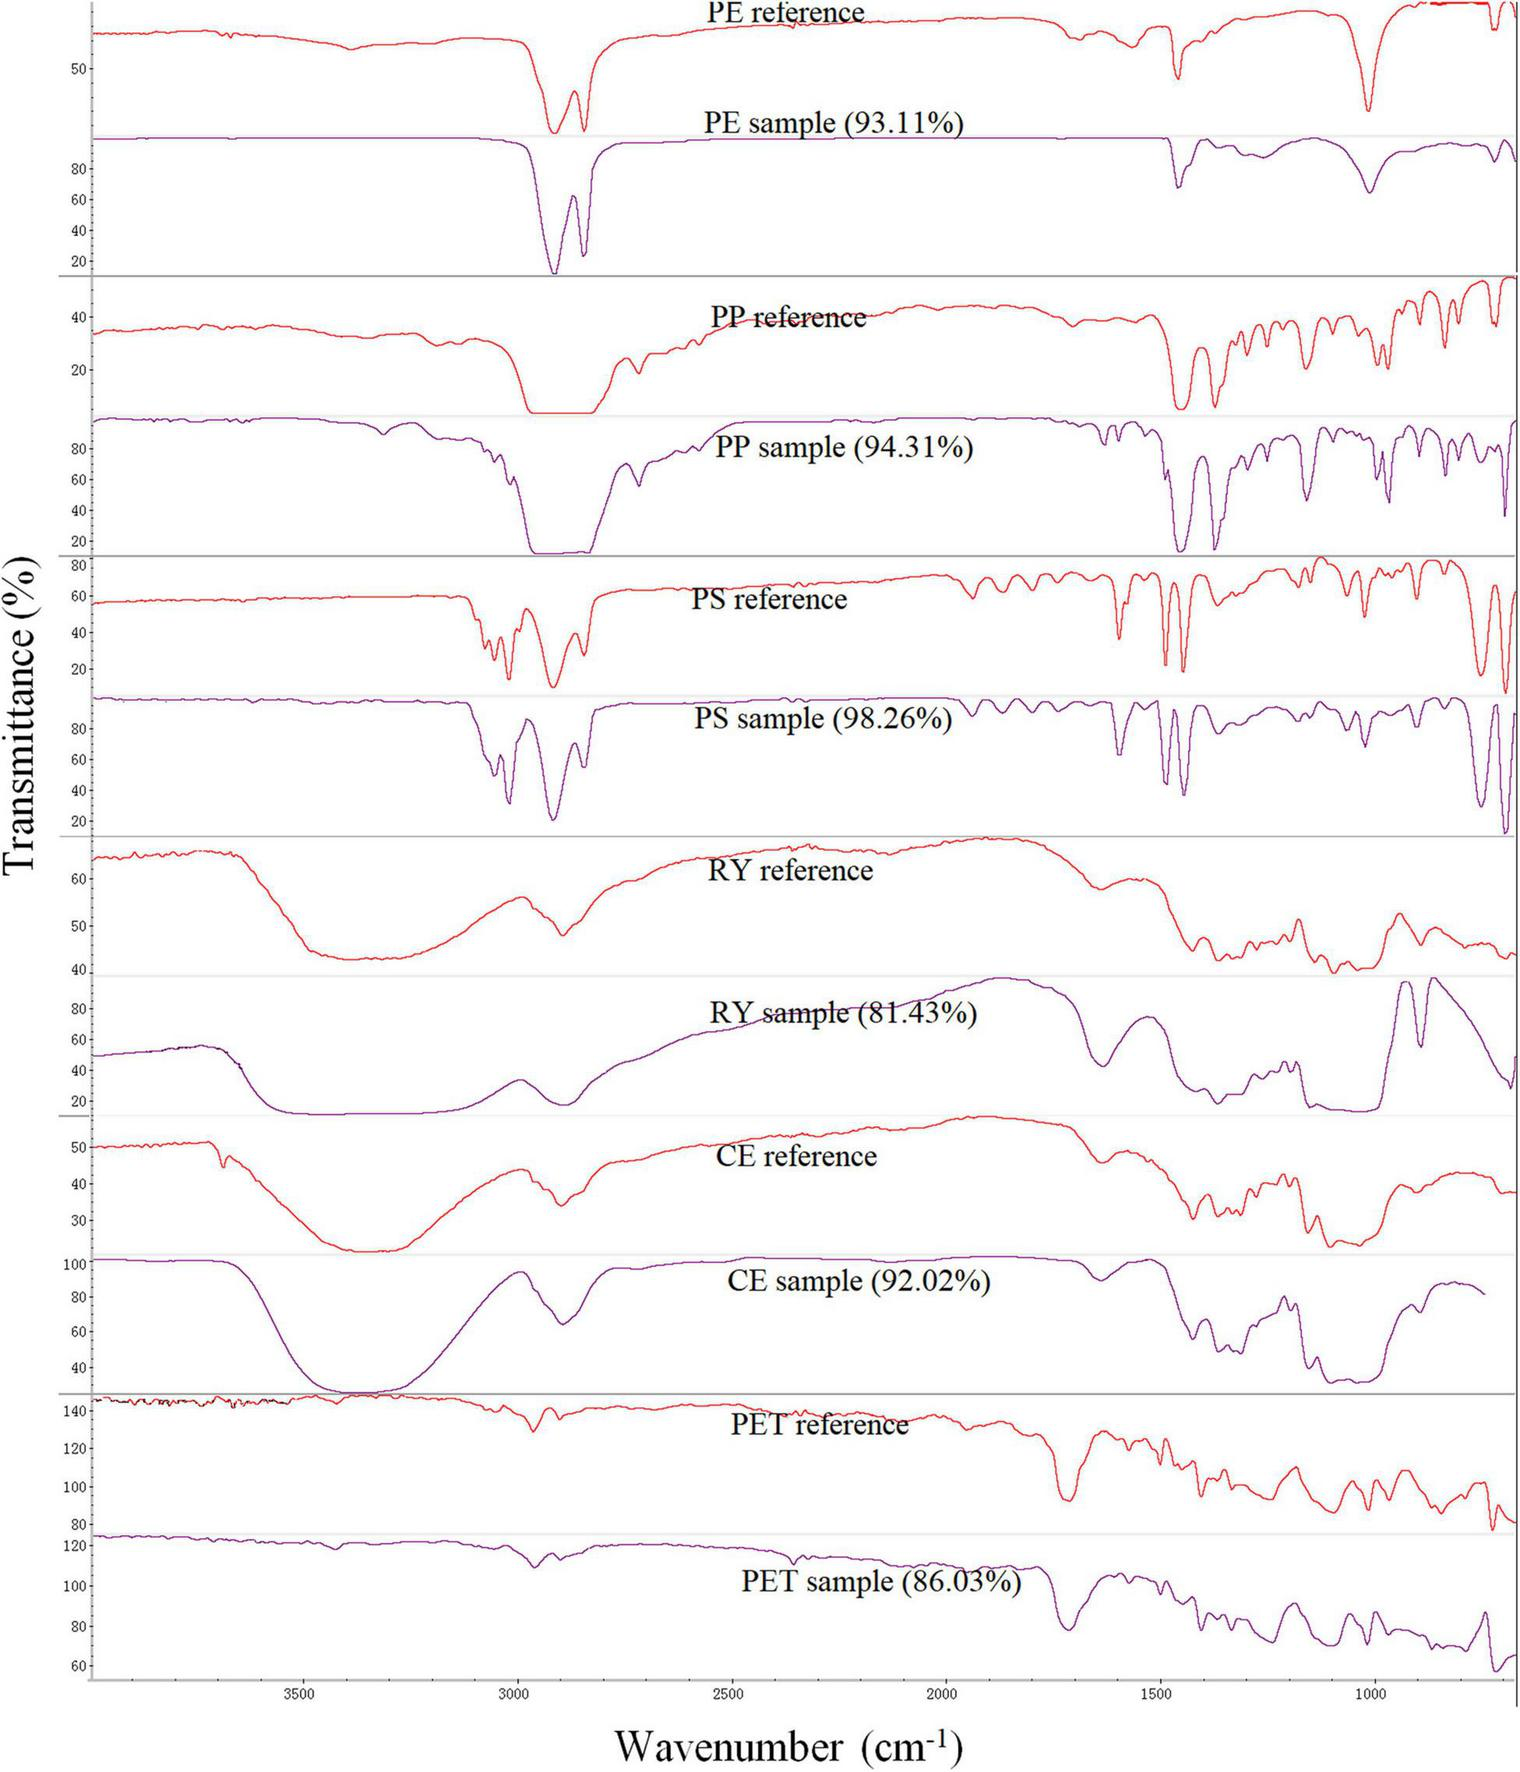
Typical polymer spectra observed by micro-Fourier transform infrared spectrometer (numbers in brackets were the matching degree).
Sediment Samples
As for microplastics in sediment (Figure 2A), the fiber was the prevalent shape (96.5 and 77.0% for L and B stations, respectively), and no microplastic film and sphere were detected. Only a small amount of fragment (22.5%) and particle (0.5%) were found in L stations, while fragment (1.2%) and particle (2.3%) were found in the B station. The microplastic color in sediment was dominated by black (both > 60.0%) (Figure 2B).
The size compositions of microplastics in sediment are shown in Figure 2C. In both L and B stations, microplastics with a diameter of 1–2 mm were the dominant, accounted for 43.8% and 41.3%, respectively, followed by 0–1 mm (24.2%), 2–3 mm (23.2%), 3–4 mm (6.9%), and 4–5 mm (2.2%) in L stations, and 2–3 mm (25.7%), 0–1 mm (16.7%), 3–4 mm (14.5%), and 4–5 mm (2.8%) in B stations.
Eight polymers were detected in sediment samples, including PE, PP, PS, RY, CE, polyester, PET, and acrylic. The proportion of each polymer types in sediment is shown in Figure 2D. The main polymers in coastal sediment (L stations) were RY (36.0%), CE (23.5%), polyester (14.0%), PE (12.0%), PP (10%), acrylic (2.0%), PET (1.5%), and PS (1.0%), while in far coastal sediment (B stations) they were RY (47.6%), CE (26.7%), polyester (15.1%), acrylic (5.8%), PE (2.3%), and PP and PET (1.2%).
Discussion
Distribution Characteristics of Microplastics
Seawater
The distribution of microplastics in seawater demonstrated the significant contributions of anthropogenic activities to the coastal seawater, especially the strong influence of fishery activities, such as oyster farming and fish culture occurred in the coastal area of the Beibu Gulf (Xue et al., 2020). As shown in Figure 5, the abundances of microplastics in L stations were remarkably higher than those in B stations, with an average abundance of 0.78 ± 1.20 and 0.26 ± 0.32 items/m3, respectively. A large amount of microplastics were found in seawater close to urban areas, such as Zhenzhu Bay, Qinzhou Bay, and Lianzhou Bay, compared with other seawaters like Tieshan Bay. The stations in these bays with relatively higher microplastic abundances were coincidentally located in the Port and Navigation Zone (PNZ) and Tourism and Entertainment Zone (TEZ), according to the official marine functional zoning of Guangxi (2011–2020) (The People’s Government of Guangxi, 2012). Seawaters adjacent to urban areas (especially PNZ and TEZ) receive a large amount of plastic litters and domestic sewage discharge, resulting in high abundant microplastics in these seawaters, as evident in Figure 5. However, the PNZ may not control the abundance of microplastics in seawater. For example, Tieshan Bay is the largest PNZ in the Beibu Gulf, while the abundances of microplastics in seawater were the lowest among the bays. One of the reasons was that Tieshan Bay is surrounded by rural area with a population density of 418 persons/km2, presented the remarkably low microplastic abundance (0.39 ± 0.44 items/m3), while Lianzhou Bay is surrounded by urban area with a population density of 4,272 persons/km2, presented the highest microplastic abundance (2.49 ± 1.6 items/m3). The other reason was that there is no TEZ in Tieshan Bay but the other three bays have, while the plastic litters produced by tourists were one of the main sources of microplastics in the seawater. Compared with the microplastic abundances in Zhenzhu Bay, Qinzhou Bay, and Lianzhou Bay with PNZ and TEZ, the microplastic abundances in the mariculture and fishery zone were quite small. These findings further confirmed that the relatively higher microplastic abundances found in seawater adjacent to the urban areas than the rural areas, and anthropogenic activities (i.e., domestic and industrial littering and sewage discharge) domain the microplastic distribution in seawater, rather than mariculture and fishery zone (Naidoo et al., 2015; Zhao et al., 2015; Tang et al., 2018).
FIGURE 5
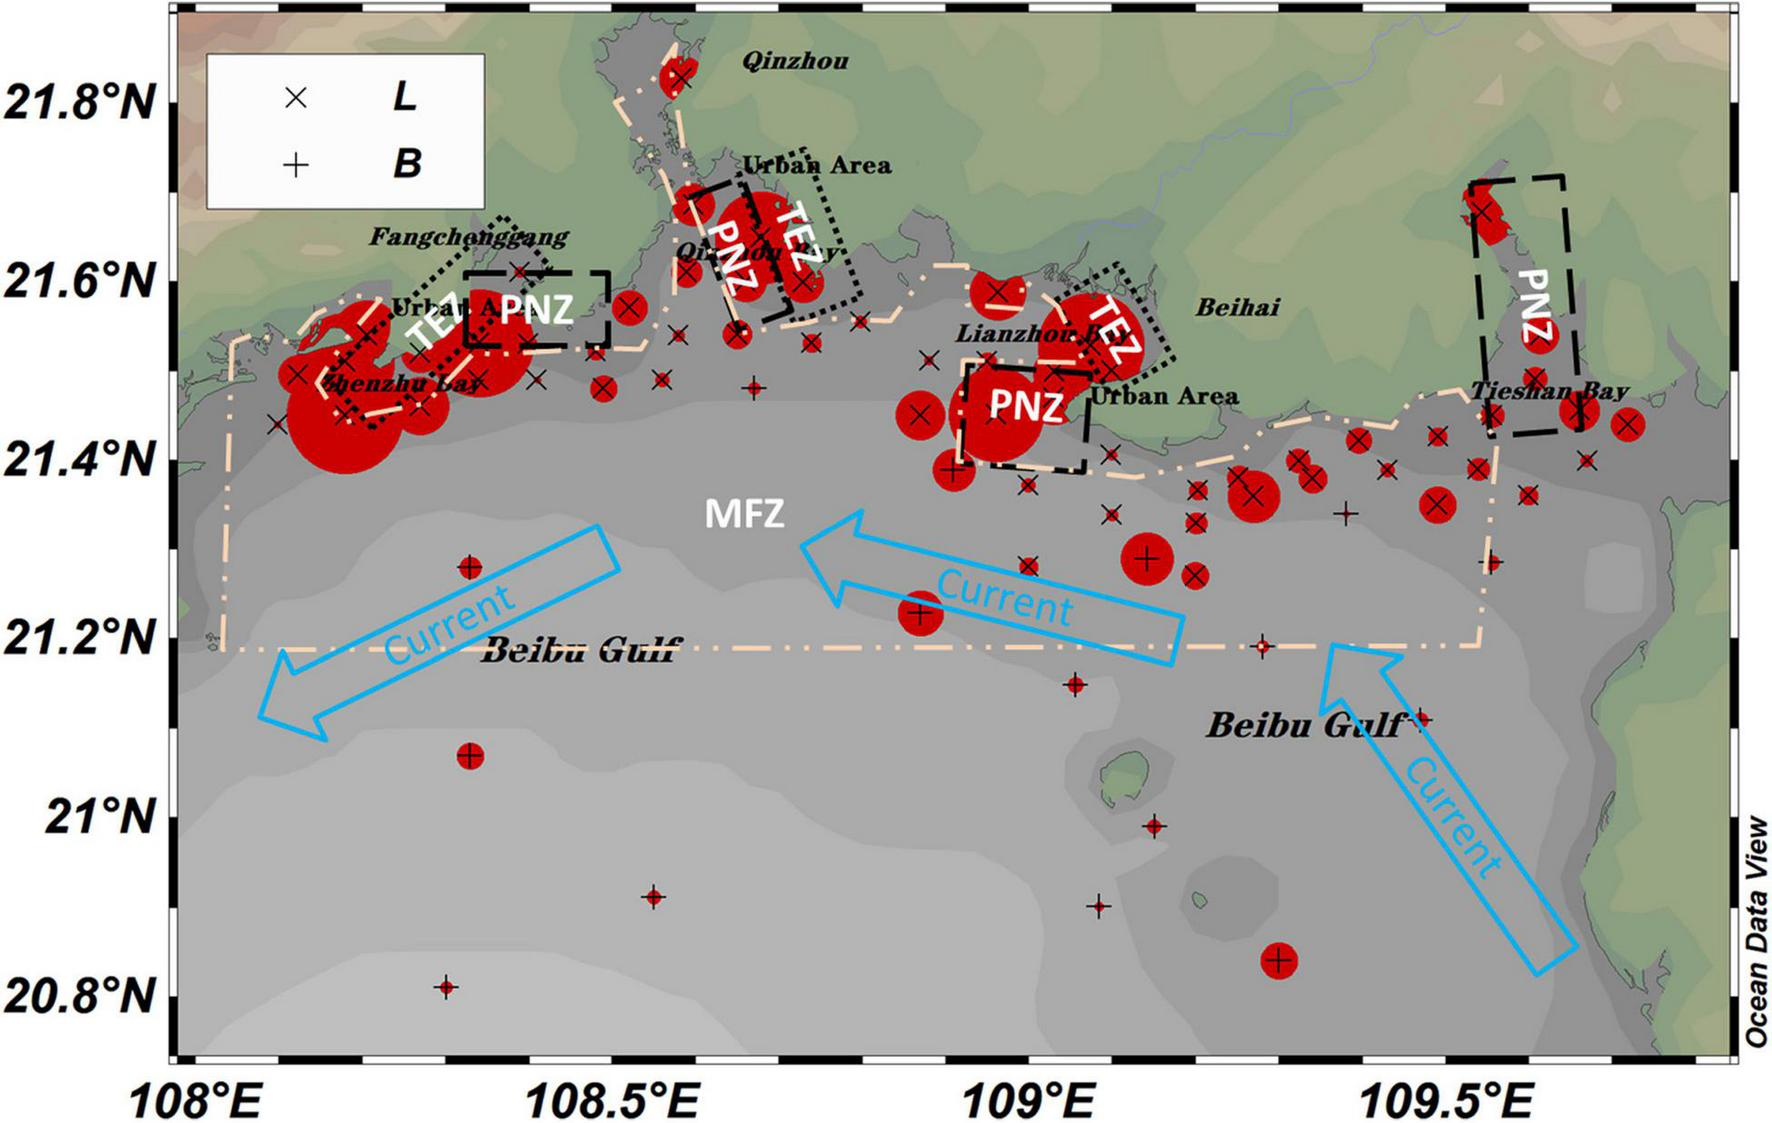
Distributions of microplastics in seawater from L and B stations. MFZ, Mariculture and Fishery Zone; TEZ, Tourism and Entertainment Zone; PNZ, Port and Navigation Zone.
It is known that current can influence microplastic distribution in the ocean (Eriksen et al., 2013; Pan et al., 2019); a case study in the Jiaozhou Bay reported by Zheng et al. (2019) showed that residual currents seem to have a significant impact on the distribution and composition of microplastics. In this study, the abundance of microplastics in seawater increased from the east to the west (Figure 5), which was consistent with the current existed in the coastal areas of Beibu Gulf (Gao et al., 2014; Chen et al., 2019), showing that the current in the Beibu Gulf may have influence on the transportation of microplastics in the seawater.
Sediment
Similar to the distribution of microplastics in seawater, microplastic abundances in sediment samples from Zhenzhu Bay, Qinzhou Bay, and Lianzhou Bay were higher than those from Tieshan Bay and other stations, far away from urban areas (Figure 6; Vaughan et al., 2017). In addition, the intensive traditional oyster farm (floating row or pile) distributed in Zhenzhu Bay, Qinzhou Bay (Maowei sea), and Lianzhou Bay contributed a large proportion of microplastics in the sediment (Zhu et al., 2019, 2021; Xue et al., 2020). However, the average abundance of microplastics in L sediment stations (15.00 ± 10.74 items/kg d.w.) was only slightly higher than that of B sediment stations (12.21 ± 8.07 items/kg d.w.), indicating that a large amount of microplastics are readily transported to long distance, and sink down and bury in the sediment (Näkki et al., 2019).
FIGURE 6
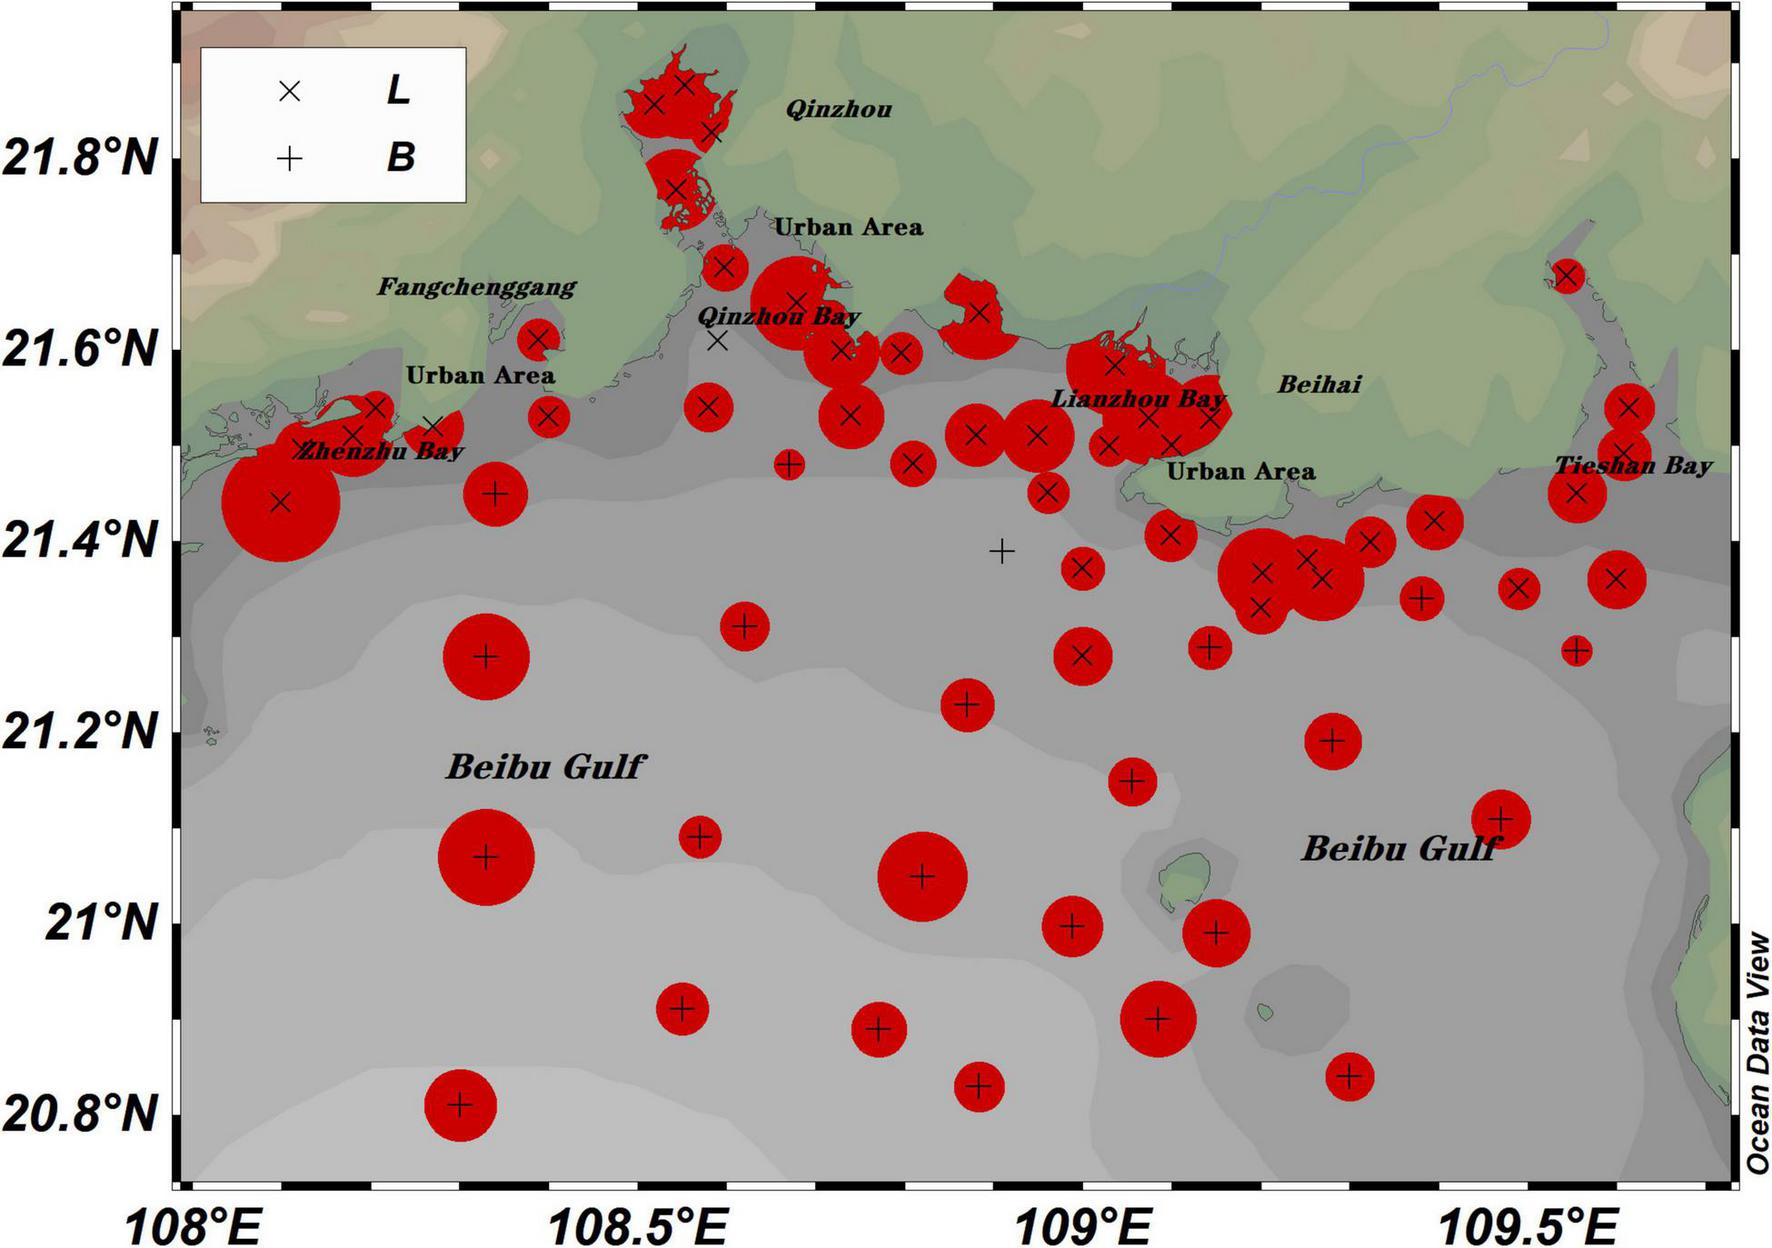
Distributions of microplastics in sediment from L and B stations.
Correlation Between Seawater and Sediment
Previous studies have shown that the abundance of microplastics in the seawater and sediment was positively correlated (Zheng et al., 2019; Li Z. et al., 2020; Wang et al., 2020); however, no significant correlations were observed between seawater and sediment in this study, probably related to mismatch in spatiotemporal distributions and variations in the characteristics, fate, and behavior of microplastics in the surface water and sediment (Xu et al., 2021). The average microplastic abundance ratio of sediment to seawater in L (19.23) and B (46.96) stations was obviously different, as shown in Table 2. Interestingly, it seems that the microplastic sedimentation in far coast area (B station) was much stronger than that in coastal area (L station); evidently, most of the microplastics were retained in the sediment of B stations while only a minimal amount in coastal area sediment. Furthermore, higher abundances of microplastics were found in coastal seawater, and a substantial part of them were sequestered into the far coast sediment, further confirming that the sediment is the sink of microplastics (Long et al., 2015; Martin et al., 2017; Zheng et al., 2019).
TABLE 2
| L | B | |
| Seawater (items/m3) | 0.78 | 0.26 |
| Sediment (items/kg d.w.) | 15 | 12.21 |
| Sediment/Seawater | 19.23 | 46.96 |
Average microplastic abundances in seawater and sediment sample in this study.
Dai et al. (2018) reported that the microplastic abundances were inversely correlated with the chlorophyll-a in surface water in the Bohai Sea; therefore, the algae aggregation might have an effect on the sinking of the microplastics into the sediment. In this study, no significant correlations were obtained between microplastics and chlorophyll-a or suspended particles, showing that the sedimentation of microplastics in the study area was controlled by multiple processes that remain further exploration, e.g., benthos might promote the burial of microplastics in the sediments (Gebhardt and Forster, 2018).
Comparison of Microplastic Characteristics
The main microplastic characteristics determined in the seawater and sediment samples in the sea areas of China are summarized in Table 3. Most identified microplastics existed were fragments (92.38%) in seawater, which is of great difference from other areas, e.g., fibers were the dominant components in most sea areas of China, such as Jiaozhou Bay, Haizhou Bay, and Yellow Sea offshore. The dominant polymer in seawater was PS, which is widely used to produce plastic foam applied in the mariculture and other packing materials, and usually, it is white. The dominant color of microplastics in seawater was found to be white (56.20%), inconsistent with the microplastic color discovered in most seawaters reported in China. In addition, most colored microplastics are subjected to be decolored by sunlight (ultraviolet radiation), resulting in transformation to white. Since white microplastics are not as attractable as other colored microplastics, when missed to be eaten by marine organisms, they were likely to be retained in the water. The PS foam has more porous structures and then might be easily broken down into small plastics by sunlight, wind, and current, bringing much more fragments into the sea (Song et al., 2017), inconsistent with the dominant foams and fragments observed in the seawater in Hong Kong (Cheung P. K. et al., 2018), the north coast of Surabaya (Cordova et al., 2019), and this study, also inconsistent with the dominant PS foams (macroplastics), found in the beach and sediment of tourist spots in the coastal of Beihai, Qinzhou, and Fangchenggang according to the Marine Environment Bulletin (2017; Department of Ocean and Fishery of Guangxi). These findings provided clues for the mitigation of PS microplastic pollution such as the recycling of the PS foams used in mariculture.
TABLE 3
| Sample | Shape | Color | Size | Composition | ||
| Bohai Sea | Seawater | Fragment (67.4%) | Transparent (>24.9%) | 0.4–2 mm (64.2%) | Alkyd resin | Xu et al., 2021 |
| Sediment | Fiber (54.9%) | Blue (>18.5%) | 0–1 mm (69.3%) | RY | ||
| Jiaozhou Bay | Seawater | Fiber (∼85%) | Black (∼40%) | 1–2 mm (∼40%) | PET (∼55%) | Zheng et al., 2019 |
| Sediment | Fiber (∼88%) | Black (∼30%) | 0–1 mm (55%) | PET (∼50%) | ||
| Yellow Sea offshore | Seawater | Fiber (75.4%) | Black (∼40%) | 1–3 mm (∼30%) | – | Wang et al., 2018 |
| Sediment | Fiber (68.7%) | Transparent (∼30%) | 1–3 mm (∼30%) | – | ||
| North Yellow Sea | Seawater | Film (58.1%) | Transparent (∼80%) | 0.03–1 mm (∼80%) | PE (77.8%) | Zhu et al., 2018 |
| Sediment | Film (61.4%) | Transparent (∼70%) | 0–1 mm (∼80%) | PP (44.5%) | ||
| Haizhou Bay | Seawater | Fiber (91.12%) | Blue (50.9%) | 0.16–1 mm (∼47%) | PET (41.71%) | Li Z. et al., 2020 |
| Sediment | Fiber (93.21%) | Blue (33.25%) | 0.16–1 mm (∼40%) | RY (∼41.98%) | ||
| East China Sea | Seawater | Foam (54.8%) | White (71.9%) | 0.5–5 mm (88.6%) | PE (45.5%) | Liu et al., 2018 |
| Sediment | – | – | – | – | ||
| East China Sea | Seawater | – | – | – | – | Zhang et al., 2019 |
| Sediment | Fiber (77%) | Blue (35%) | 0.06–1 mm (89%) | Cellophane (37.2%) | ||
| Yangtze Estuary | Seawater | Fragment (39.2%) | White (64.7%) | 0–1 mm (∼48.05%) | PE (37.3%) | Li Y. et al., 2020 |
| Sediment | Fiber (66.7%) | Transparent (16.2%) | 0-1mm (88.5%) | PP (28.6%) | ||
| Hangzhou Bay | Seawater | Pellet (46.4%) | – | 0–1 mm (36.4%) | PE (52.3%) | Wang et al., 2020 |
| Sediment | Fiber (59.8%) | – | 0–1 mm (38%) | RY (49.7%) | ||
| Xiangshan Bay | Seawater | Foam | – | 0.25–2 mm | PE (38.6%) | Chen et al., 2018 |
| Sediment | – | – | 0.25–2 mm | RY (56.3%) | ||
| Xiamen Bay | Seawater | Granule (∼30%) | White (50%) | – | PE (50.4%) | Tang et al., 2018 |
| Sediment | Fiber (70%) | Black (26%) | – | PP | ||
| Hong Kong waters | Seawater | Foam | – | 0.3–0.7 mm | PS | Cheung P. K. et al., 2018 |
| Sediment | – | – | – | – | ||
| Beibu Gulf | Seawater | – | – | – | – | Xue et al., 2020 |
| Sediment | Fiber (69.6%) | – | 1–5 mm (∼50%) | PP (68.7%) | ||
| Qin River Estuary, Maowei Sea, Beibu Gulf | Seawater | Fiber (38.2%) | White (∼28.5%) | 1–5 mm (88.9%) | PP (39%) | Zhang et al., 2020 |
| Sediment | Film (62.8) | White (30%) | 1–5 mm (76%) | PP (55.3%) | ||
| Maowei Sea, Beibu Gulf | Seawater | Fiber (∼80%) | White (∼80%) | 1–5 mm (4∼0%) | PES(∼40%) | Zhu et al., 2019 |
| Sediment | – | – | – | – | ||
| In total (except Beibu Gulf) | Seawater | Fiber | White | 0–1 mm | PE | |
| Sediment | Fiber | Transparent | 0–1 mm | RY | ||
| Beibu Gulf | Seawater | Fragment (92.38%) | White (56.20%) | 1–2 mm (44%) | PS (53.23%) | This study |
| Sediment | Fiber (82.93%) | Black (66.83%) | 0–1 mm (50.04%) | RY (39.54%) |
Main microplastic characteristics observed in surface water and sediment in Chinese coastal seas and selected similar bays in other country with comparable data (data published within the last 3 years, revised from Xu et al., 2021).
The dominant size (1–2 mm) of microplastics measured in seawater in this study is larger than those (0–1 mm) in the other sea areas, possibly because that smaller microplastics tend to sink down to the sediment, and PS fragments need to be in relatively larger size to keep floating on the surface seawater. This further confirms that a large amount of microplastics are white PS foams (macro fragment) in samples collected in this field study, especially in the coastal area.
Similar to the most study areas, fibers were the dominant microplastics in the sediment in this study (Table 3). It is known that fibers were originated mainly from fabrics and were difficult to remove during sewage treatment. The Beibu Gulf is a semi-enclosed bay receiving all the sewage from the river and coastal cities, which supports the findings. This finding is also consistent with the high relative abundance of RY in the sediment in this study, a synthetic polymer largely used in the textile industry (Kauffman, 1993; De Falco et al., 2018). The density of RY is usually less than PS, but still acts as a high-density polymer. Furthermore, the RY detected in this study existed as very small size (0–1 mm), having large specific surface area for the microplastics, leading to more fiber microplastics settled and buried in the sediment. In addition, small microplastics tend not to retain in the water column and are likely to be deposited in sediments (Enders and Lenz, 2015; Wu et al., 2019; Xu et al., 2021), which was supported by the finding in this study that dominant microplastics were much smaller (0–1 mm, 50.04%) in sediments than in the surface water (1–2mm, 44%). These features were also discovered in Bohai and Yellow Seas (Dai et al., 2018; Zhao et al., 2018; Xu et al., 2021), Haizhou Bay, Hangzhou Bay, and Xiangshan Bay, indicating that more effective wastewater treatment technology should be adopted to remove the fibrous microplastic RY from domestic and industrial wastewater. Interestingly, the dominant color of fibers in the sediment in this study was black, and the same dominant color of microplastics discovered in Xiamen Bay (Tang et al., 2018) was quite different from the transparent in other sea area sediment, which need more exploration.
Comparison of Microplastic Abundances in Semi-Enclosed Bays
A semi-enclosed bay is likely to accumulate microplastics due to intensive anthropogenic activities and restricted water exchange (Li et al., 2018; Zhou et al., 2021). For example, up to 27.7 items/L of microplastic abundances were found in seawater of Bohai Sea (Dai et al., 2018), Maowei Sea (an inner bay of Beibu Gulf; Zhu et al., 2019, 2021), and Baltic Sea (Zhou et al., 2021), in which studies bulk water sampling was employed. However, significant lower microplastic abundance in seawater of Bohai Sea was reported using trawl net sampling by Xu et al. (2021), since much smaller filter pore size was used in the former method, theoretically resulted more microplastics were collected, and higher abundances were revealed than the trawl net sampling. Still, significantly higher microplastic abundances (>0.33 mm) in seawater were reported using bulk water sampling in those semi-enclosed bays than the Beibu Gulf. As a typical semi-enclosed bay, the Bohai Sea is surrounded by highly developed regions in China compared with the Beibu Gulf. However, the microplastic abundance in seawater of Bohai Sea (0.79 items/m3) and Beibu Gulf (0.67 items/m3) was almost the same mainly because of the comparable population density, per capita GDP, and more relevantly, roughly the same water exchange time (406 days vs. 509 days; Cai, 2013; Fang, 2014). In contrast, the microplastic abundance in sediment of Bohai Sea (48.88 items/kg d.w.) was larger than Beibu Gulf (13.87 items/kg d.w.), indicating that the sediment in Bohai Sea accumulated more microplastics than Beibu Gulf since the Bohai Sea region was suffering much longer time economic development than the Beibu Gulf (Dai et al., 2018). Compared with the microplastics in Benoa Bay with similar ecosystems (i.e., mangroves and estuaries) (Suteja et al., 2021), the microplastic abundance (0.62 items/m3) was nearly equal to the Beibu Gulf, suggesting that the indices influencing microplastic pollution, including population, GDP, and fishery between Beibu Gulf and Benoa Bay, were comparable, which provided clues for the applications of the microplastic pollution management in both waters.
Microplastic Abundance Links to Socioeconomics in China
Report showed that the plastic consumption was correlated with socioeconomic indices (Hossain et al., 2021). Therefore, the population density and other socioeconomic parameters are important when interpreting the occurrence of the microplastics (Lebreton et al., 2017; Wang, 2018; Mai et al., 2019; Chen B. et al., 2020; Wu et al., 2021). In this study, population density and per capita GDP were selected from districts with comparable microplastic data from Table 1; subsequently, we found positive correlations between microplastic abundance in seawater and population density and per capita GDP, respectively (Figure 7). Similarly, Yonkos et al. (2014) and Fan et al. (2019) found significant positive correlations between microplastic abundance in water and population density in four estuarine rivers in the Chesapeake Bay and the Pearl River catchment, indicating that large population areas released more microplastics. And Chen H. et al. (2020) reported a positive correlation between microplastic concentration in the global waterbodies and per capita GDP, indicating that increasing human living standards would accelerate the demand for plastic products, leading to the increase in the degree of microplastic pollution. However, Tang et al. (2018) and Chen H. et al. (2020) reported a positive correlation between microplastic abundance and population number (not population density), and Tang et al. (2018) reported a poor negative correlation between microplastic abundance and per capita GDP, which were contrary to the results of this study. These findings would play important roles in the first step of developing policy and regulations to mitigate the microplastic pollution risk (Xu et al., 2020).
FIGURE 7
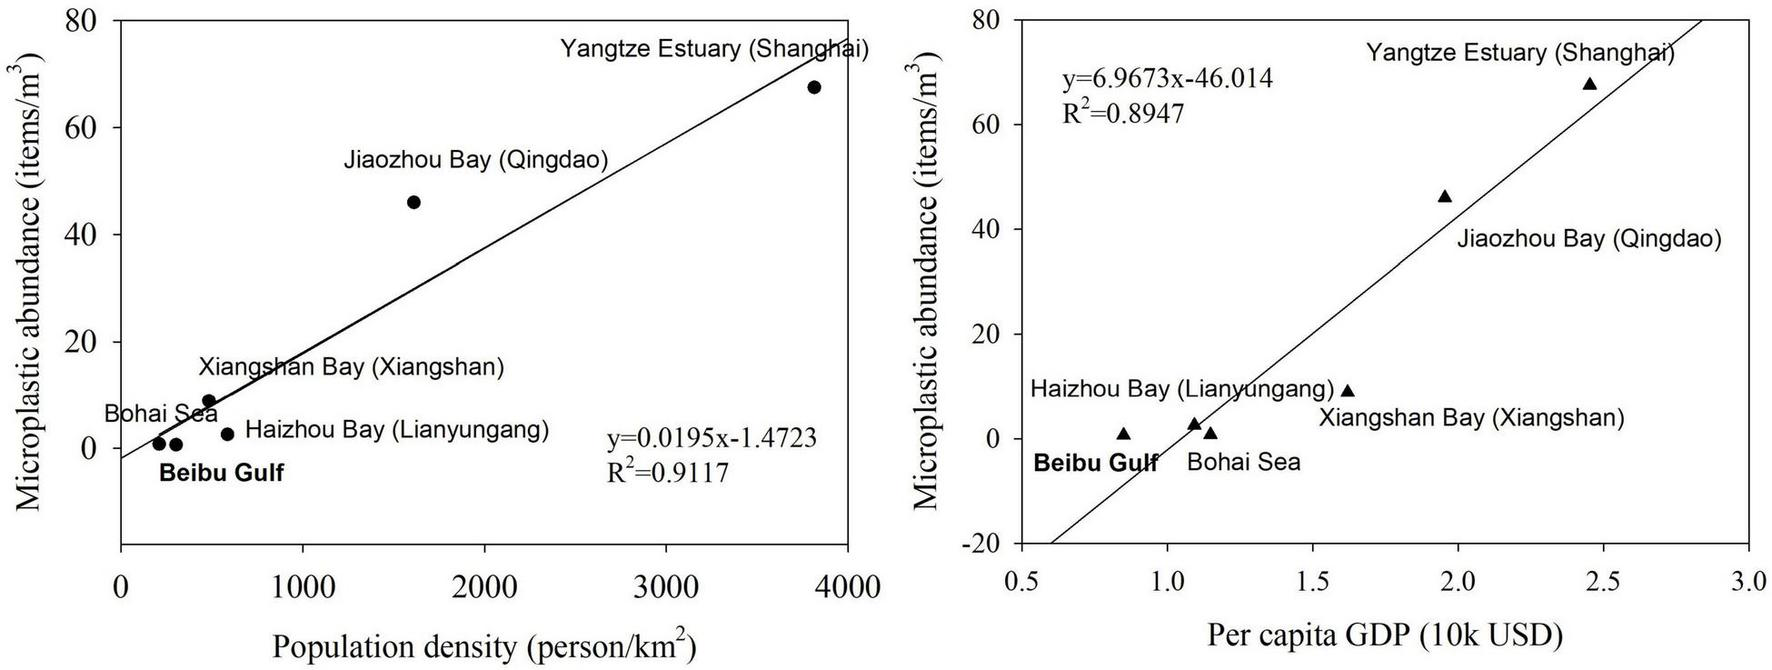
Correlation between microplastic abundance in seawater and population density and per capita gross domestic product. Comparable data were selected from Bohai Sea, Jiaozhou Bay, Haizhou, Bay, Yangtze Estuary, Xiangshan Bay, and Beibu Gulf.
Conclusion
In this study, microplastic distributions in seawaters and sediments in the Beibu Gulf were firstly investigated. Fiber and PE were the dominant microplastics in Chinese coastal seawater, while fragment and PS were the dominant microplastics in the seawater of Beibu Gulf. The abundances of microplastics in coastal seawater were much greater than that in far coastal seawater, indicating important contribution of human activities. In addition, a large amount of microplastics can be transported for long distance, and then sink down and bury in the sediment, since the microplastic abundances were comparable between coastal and far coastal sediments. Significant correlations between the microplastics abundance and population density and per capita GDP were found in Chinese coastal seawater, indicating that microplastics in the Beibu Gulf were at a low level. This study presented microplastics abundances and distributions in a semi-enclosed bay with increasing anthropogenic activities, which may provide reference methods and data for the microplastic research in the other ocean. Further studies need to be carried out to explain the transport and sink processes of microplastics in the water column of Beibu Gulf and SCS.
Publisher’s Note
All claims expressed in this article are solely those of the authors and do not necessarily represent those of their affiliated organizations, or those of the publisher, the editors and the reviewers. Any product that may be evaluated in this article, or claim that may be made by its manufacturer, is not guaranteed or endorsed by the publisher.
Statements
Data availability statement
The original contributions presented in the study are included in the article/Supplementary Material, further inquiries can be directed to the corresponding author/s.
Author contributions
ZZ contributed for conceptualization, sampling, and writing – original draft preparation. HW contributed for sample preparation, characterization, and data management. WH contributed for characterization and draft modification. XW contributed for sample preparation and characterization. YG contributed for data management and editing. QZ contributed for conceptualization. All authors contributed to the article and approved the submitted version.
Funding
This work was supported by the National Natural Science Foundation of China (U20A20103), Guangxi Funding Project (304024XM20N0006, 2019GXNSFBA185036, and 2018AD19280), and Beihai Science and Technology Project (201995037, 202082031, and 202082022).
Acknowledgments
The authors thank all the crews on the R/V Yueke 1 and R/V Yuexiayuzhi 20028 for the assistance of the microplastic sampling during the L and B cruises in the summer of 2020, and the reviewers for the revision of this manuscript.
Conflict of interest
XW is employed by Central Cycle Ecological Technology Co., Ltd. The remaining authors declare that the research was conducted in the absence of any commercial or financial relationships that could be construed as a potential conflict of interest.
Supplementary material
The Supplementary Material for this article can be found online at: https://www.frontiersin.org/articles/10.3389/fmars.2021.821008/full#supplementary-material
References
1
Boyle D. Catarino A. I. Clark N. J. Henry T. B. (2020). Polyvinyl chloride (PVC) plastic fragments release Pb additives that are bioavailable in zebrafish.Environ. Pollut.263(Pt A):114422. 10.1016/j.envpol.2020.114422
2
Cai M. He H. Liu M. Li S. Tang G. Wang W. et al (2018). Lost but can’t be neglected: huge quantities of small microplastics hide in the South China Sea.Sci. Total Environ.6331206–1216. 10.1016/j.scitotenv.2018.03.197
3
Cai Z. Y. (2013). Modelling Average Residence Time of the Waterbody in Bohai and its Seasonal Variation. Masteral dissertation.Qingdao: China Ocean University. (in Chinese).
4
Catarino A. I. Kramm J. Vlker C. Henry T. B. Everaert G. (2021). Risk posed by microplastics: scientific evidence and public perception.Curr. Opin. Green Sust.29:100467. 10.1016/j.cogsc.2021.100467
5
Cauwenberghe L. V. Vanreusel A. Mees J. Janssen C. R. (2013). Microplastic pollution in deep-sea sediments.Environ. Pollut.182495–499. 10.1016/j.envpol.2013.08.013
6
Chen B. Fan Y. Huang W. Rayhan A. Cai M. (2020). Observation of microplastics in mariculture water of longjiao bay, southeast china: influence by human activities.Mar. Pollut. Bull.1601–8.
7
Chen B. Xu Z. Ya H. Chen X. Xu M. (2019). Impact of the water input from the eastern qiongzhou strait to the beibu gulf on guangxi coastal circulation.Acta Oceanol. Sin.381–11. 10.1007/s13131-019-1472-2
8
Chen C. C. Zhu X. Xu H. Chen F. Ma J. Pan K. (2021). Copper adsorption to microplastics and natural particles in seawater: a comparison of kinetics, isotherms, and bioavailability.Environ. Sci. Tech.5513923–13931.
9
Chen H. Qin Y. Huang H. Xu W. (2020). A regional difference analysis of microplastic pollution in global freshwater bodies based on a regression model.Water12:1889.
10
Chen M. Jin M. Tao P. Wang Z. Xie W. Yu X. et al (2018). Assessment of microplastics derived from mariculture in Xiangshan Bay, China.Environ. Pollut.2421146–1156. 10.1016/j.envpol.2018.07.133
11
Cheung L. T. O. Lui C. Y. Fok L. (2018). Microplastic contamination of wild and captive Flathead Grey mullet (Mugil cephalus).Int. J. Environ. Res. Public Health15:597. 10.3390/ijerph15040597
12
Cheung P. K. Fok L. Hung P. L. Cheung L. (2018). Spatio-temporal comparison of neustonic microplastic density in Hong Kong waters under the influence of the Pearl River Estuary.Sci. Total Environ.628–629731–739. 10.1016/j.scitotenv.2018.01.338
13
Cordova M. R. Nurhati I. S. Riani E. Nurhasanah A. Iswari M. Y. (2021). Unprecedented plastic-made personal protective equipment (ppe) debris in river outlets into Jakarta Bay during covid-19 pandemic.Chemosphere268:129360. 10.1016/j.chemosphere.2020.129360
14
Cordova M. R. Purwiyanto A. Suteja Y. (2019). Abundance and characteristics of microplastics in the northern coastal waters of Surabaya, Indonesia.Mar. Pollut. Bull.142183–188. 10.1016/j.marpolbul.2019.03.040
15
Cózar A. Echevarría F. González-Gordillo J. I. Irigoien X. Ubeda B. Hernández-León S. et al (2014). Plastic debris in the open ocean.Proc. Natl. Acad. Sci. U.S.A.11110239–10244. 10.1073/pnas.1314705111
16
Dai Z. Zhang H. Zhou Q. Tian Y. Chen T. Tu C. et al (2018). Occurrence of microplastics in the water column and sediment in an inland sea affected by intensive anthropogenic activities.Environ. Pollut.2421557–1565. 10.1016/j.envpol.2018.07.131
17
De Falco F. Gullo M. P. Gentile G. Di Pace E. D. Cocca M. Gelabert L. et al (2018). Evaluation of microplastic release caused by textile washingprocesses of synthetic fabrics.Environ. Pollut.236916–925.
18
Enders K. Lenz R. (2015). How to Find the Small Plastic in the Big Sea – the Identification and Characterisation of Microplastic ≥10 μm from the Atlantic Ocean. Master thesis.Kgs. Lyngby: DTU Aqua.
19
Eriksen M. Maximenko N. Thiel M. Cummins A. Lattin G. Wilson S. et al (2013). Plastic pollution in the South Pacific subtropical gyre.Mar. Pollut. Bull.6871–76.
20
Everaert G. Van Cauwenberghe L. De Rijcke M. Koelmans A. A. Mees J. Vandegehuchte M. et al (2018). Risk assessment of microplastics in the ocean: modelling approach and first conclusions.Environ. Pollut.242(Pt B)1930–1938. 10.1016/j.envpol.2018.07.069
21
Fan Y. Zheng K. Zhu Z. Chen G. Peng X. (2019). Distribution, sedimentary record, and persistence of microplastics in the Pearl River catchment, China.Environ. Pollut.251862–870. 10.1016/j.envpol.2019.05.056
22
Fang X. Y. (2014). Numerical Simulation of Seasonally Circulation and Water Exchange in the Beibu Gulf. Masteral dissertation. Qingdao: China Ocean University. (in Chinese).
23
Gao J. Shi M. Chen B. Guo P. Zhao D. (2014). Responses of the circulation and water mass in the Beibu Gulf to the seasonal forcing regimes.Acta Oceanol. Sin.33:11.
24
Gebhardt C. Forster S. (2018). Size-selective feeding of Arenicola marina promotes long-term burial of microplastic particles in marinesediments.Environ. Pollut.2421777–1786. 10.1016/j.envpol.2018.07.090
25
Hossain K. B. Chen K. Chen P. Wang C. Cai M. (2021). Socioeconomic relation with plastic consumption on 61 countries classified by continent, income status and coastal regions.Bull. Environ. Contam. Toxicol.107786–792.
26
Isobe A. Uchiyama-Matsumoto K. Uchida K. Tokai T. (2017). Microplastics in the southern ocean.Mar. Pollut. Bull.114623–626.
27
Jambeck J. R. Geyer R. Wilcox C. Siegler T. R. Perryman M. Andrady A. et al (2015). Plastic waste inputs from land into the ocean.Science347768–771. 10.1126/science.1260352
28
Kataoka T. Nihei Y. Kudou K. Hinata H. (2019). Assessment of the sources and inflowprocesses of microplastics in the river environments of Japan.Environ. Pollut.244958–965. 10.1016/j.envpol.2018.10.111
29
Kauffman G. (1993). Rayon: the first semi-synthetic fiber product.J. Chem. Educ.70:887. 10.1021/ed070p887
30
Khan F. R. (2020). Prevalence, fate and effects of plastic in freshwater environments: new findings and next steps.Toxics8:72.
31
Lebreton L. Joost V. Damsteeg J. W. Slat B. Andrady A. Reisser J. (2017). River plastic emissions to the world’s oceans.Nat. Commun.8:15611.
32
Li R. Yu L. Chai M. Wu H. Zhu X. (2019). The distribution, characteristics and ecological risks of microplastics in the mangroves of southern China.Sci. Total Environ.708:135025. 10.1016/j.scitotenv.2019.135025
33
Li Y. Lu Z. Zheng H. Wang J. Chen C. (2020). Microplastics in surface water and sediments of Chongming island in the Yangtze Estuary, China.Environ. Sci. Eur.321–12. 10.1016/j.csr.2005.10.003
34
Li Y. Wolanski E. Dai Z. Lambrechts J. Tang C. Zhang H. (2018). Trapping of plastics in semi-enclosed seas: insights from the Bohai Sea, China. Mar. Pollut. Bull.137, 509–517. 10.1016/j.marpolbul.2018.10.038
35
Li Z. Gao C. Yang J. Wu L. Zhang S. Liu Y. et al (2020). Distribution characteristics of microplastics in surface water and sediments of Haizhou Bay, Lianyungang.Environ. Sci. J. Integr. Environ. Res.11–17. (in Chinese), 10.13227/j.hjkx.201910005
36
Liu Q. Xu X. D. Wei H. Xu X. Q. Shou L. Zeng J. N. (2017). Research advances on the ecological effects of microplastic pollution on the marine environment.Acta Ecol. Sin.377397–7409.
37
Liu T. Sun X. Zhu M. Liang J. Zhao Y. (2018). Distribution and composition of microplastics in the surface water of the East China Sea.Oceanol. Limnol. Sinica4962–69. (in Chinese),
38
Long M. Moriceau B. Gallinari M. Lambert C. Huvet A. Raffray J. et al (2015). Interactions between microplastics and phytoplankton aggregates: impact on their respective fates. Mar. Chem.175, 39–46. 10.1016/j.marchem.2015.04.003
39
Lusher A. Hollman P. Mendoza-Hill J. (2017). Microplastics in Fisheries and Aquaculture: Status of Knowledge on their Occurrence and Implications for Aquatic Organisms and Food Safety, FAO Fisheries and AquacultureTechnical Paper: No. 615. Rome: FAO.
40
Mai L. You S. He H. Bao L. Zeng E. (2019). Riverine microplastic pollution in the Pearl River Delta, China: are modeled estimates accurate?Environ. Sci. Tech.5311810–11817. 10.1021/acs.est.9b04838
41
Martin J. Lusher A. Thompson R. Morley A. (2017). The deposition and accumulation of microplastics in marine sediments and bottom water from the Irish continental shelf.Sci. Rep.7:10772.
42
Mecozzi M. Pietroletti M. Monhakova Y. B. (2016). FTIR spectroscopy supported by statistical techniques for the structural characterization of plastic debris in the marine environment: application to monitoring studies.Mar. Pollut. Bull.106155–161. 10.1016/j.marpolbul.2016.03.012
43
Naidoo T. Glassom D. Smit A. J. (2015). Plastic pollution in five urban estuaries of KwaZulu-Natal, South Africa.Mar. Pollut. Bull.101473–480. 10.1016/j.marpolbul.2015.09.044
44
Naji A. Azadkhah S. Farahani H. Uddin S. Khan F. R. (2020). Microplastics in wastewater outlets of Bandar Abbas city (Iran): a potential point source of microplastics into the Persian Gulf.Chemosphere262:128039.
45
Näkki P. Setälä O. Lehtiniemi M. (2019). Seafloor sediments asmicroplastic sinks in the northern Baltic Sea–negligible upwardtransport of buried microplastics by bioturbation.Environ. Pollut.24974–81. 10.1016/j.envpol.2019.02.099
46
NOAA Marine Debris Program (2015). Laboratory Methods for the Analysis of Microplastics in the Marine Environment: Recommendations for Quantifying Synthetic Particles in Waters and Sediments.Silver Spring, MD: NOAA Marine Debris Program.
47
Nurhasanah A. Cordova M. R. Riani E. (2021). Micro- and mesoplastics release from the indonesian municipal solid waste landfill leachate to the aquatic environment: case study in Galuga Landfill Area, Indonesia.Mar. Pollut. Bull.163:111986. 10.1016/j.marpolbul.2021.111986
48
Pan Z. Guo H. Chen H. Wang S. Sun X. Zou Q. (2019). Microplastics in the Northwestern Pacific: abundance, distribution, and characteristics. Sci. Total Environ.650, 1913–1922. 10.1016/j.scitotenv.2018.09.244
49
Pannetier P. Morin B. Le Bihanic F. Dubreil L. Clérandeau C. Chouvellon F. et al (2020). Environmental samples of microplastics inducesignificant toxic effects in fish larvae.Environ. Int.134:105047. 10.1016/j.envint.2019.105047
50
Philipp C. Unger B. Ehlers S. M. Koop J. H. E. Siebert U. (2021). First evidence of retrospective findings of microplastics in harbour porpoises (Phocoena phocoena) from German waters.Front. Mar. Sci.8:682532.
51
Rocha-Santos T. Duarte A. C. (2015). A critical overview of the analytical approaches to the occurrence, the fate and the behavior of microplastics in the environment.TRAC Trend Anal. Chem.6547–53. 10.1016/j.trac.2014.10.011
52
Rochman C. M. (2018). Microplastics research from sink to source.Science36028–29. 10.1126/science.aar7734
53
Sharma S. Sharma V. Chatterjee S. (2021). Microplastics in the Mediterranean Sea: sources, pollution intensity, sea health, and regulatory policies.Front. Mar. Sci.8:634934.
54
Song Y. K. Hong S. H. Jang M. Han G. M. Jung S. W. Shim W. J. (2017). Combined effects of UV exposure duration and mechanical abrasion on microplastic fragmentation by polymer type. Environ. Sci. Technol.52, 3831–3832. 10.1021/acs.est.6b06155
55
Suteja Y. Atmadipoera A. S. Riani E. Nurjaya I. W. Cordova M. R. (2021). Spatial and temporal distribution of microplastic in surface water of tropical estuary: case study in Benoa Bay, Bali, Indonesia.Mar. Pollut. Bull.163:111979. 10.1016/j.marpolbul.2021.111979
56
Tang G. Liu M. Zhou Q. He H. Chen K. Zhang H. et al (2018). Microplastics and polycyclic aromatic hydrocarbons (PAHs) in Xiamen coastal areas: implications for anthropogenic impacts.Sci. Total Environ.634811–820.
57
The People’s Government of Guangxi (2012). Marine Function Zoning of Gunagxi (2011–2020).
58
Vaughan R. Turner S. D. Rose N. L. (2017). Microplastics in the sediments of a UK urban lake.Environ. Pollut.22910–18. 10.1016/j.envpol.2017.05.057
59
Waller C. L. Griffiths H. J. Waluda C. M. Thorpe S. E. Loaiza I. Moreno B. et al (2017). Microplastics in the Antarctic marine system: an emerging area of research.Sci. Total Environ.598220–227. 10.1016/j.scitotenv.2017.03.283
60
Wang M. (2018). Research on prediction of GDP per capita in China based on semi-parametric time series model.Mark. Res.47623–25.
61
Wang T. Hu M. Song L. Yu J. Liu R. Wang S. et al (2020). Coastal zone use influences the spatial distribution of microplastics in Hangzhou Bay, China.Environ. Pollut.266:115137.
62
Wang T. Zou X. Li B. Yao Y. Li J. Hui H. et al (2018). Microplastics in a wind farm area: a case study at the Rudong Offshore Wind Farm, Yellow Sea, China.Mar. Pollut. Bull.128466–474. 10.1016/j.marpolbul.2018.01.050
63
Wu F. Wang Y. Leung S. Huang W. Cao L. (2020). Accumulation of microplastics in typical commercial aquatic species: a case study at a productive aquaculture site in China.Sci. Total Environ.708:135432. 10.1016/j.scitotenv.2019.135432
64
Wu N. Zhang Y. Zhang X. Zhao Z. He J. Li W. et al (2019). Occurrence and distribution of microplastics in the surface water and sediment of two typical estuaries in Bohai Bay, China. Environ. Sci.: Process. Impacts21, 1143–1152. 10.1039/C9EM00148D
65
Wu Q. Liu S. Chen P. Liu M. Cai M. (2021). Microplastics in seawater and two sides of the Taiwan Strait: reflection of the social-economic development.Mar. Pollut. Bull.269:112588. 10.1016/j.marpolbul.2021.112588
66
Xu L. Cao L. Huang W. Liu J. Dou S. (2021). Assessment of plastic pollution in the Bohai Sea: abundance, distribution, morphological characteristics and chemical components.Environ. Pollut.278:116874. 10.1016/j.envpol.2021.116874
67
Xu Y. Chan F. He J. Johnson M. Zhu Y. (2020). A critical review of microplastic pollution in urban freshwater environments and legislative progress in China: recommendations and insights.Crit. Rev. Environ. Sci. Tech.61–44. 10.1080/10643389.2020.1801308
68
Xue B. Zhang L. Li R. Wang Y. Wang S. (2020). Underestimated microplastic pollution derived from fishery activities and “hidden” in deep sediment.Environ. Sci. Tech.542210–2217. 10.1021/acs.est.9b04850
69
Yonkos L. T. Friedel E. A. Perez-Reyes A. C. Ghosal S. Arthur C. D. (2014). Microplastics in four estuarine rivers in the Chesapeake Bay, USA. Environ. Sci. Technol.48, 14195–14202. 10.1021/es5036317
70
Zhang C. Zhou H. Cui Y. Wang C. Li Y. Zhang D. (2019). Microplastics in offshore sediment in the yellow sea and East China Sea, China.Environ. Pollut.244827–833. 10.1016/j.envpol.2018.10.102
71
Zhang L. Liu J. Xie Y. Zhong S. Zhong Q. (2020). Distribution of microplastics in surface water and sediments of Qin river in Beibu Gulf, China.Sci. Total Environ.708:135176. 10.1016/j.scitotenv.2019.135176
72
Zhang W. Zhang S. Wang J. Wang Y. Mu J. Wang P. et al (2017). Microplastic pollution in the surface waters of the Bohai Sea, China.Environ. Pollut.231541–548.
73
Zhao J. Ran W. Teng J. Liu Y. Liu H. Yin X. et al (2018). Microplastic pollution in sediments from the Bohai Sea and the Yellow Sea, China.Sci. Total Environ.640637–645. 10.1016/j.scitotenv.2018.05.346
74
Zhao S. Zhu L. Li D. (2015). Microplastic in three urban estuaries, China.Environ. Pollut.206597–604. 10.1016/j.envpol.2015.08.027
75
Zheng Y. Li J. Cao W. Liu X. Jiang F. Ding J. et al (2019). Distribution characteristics of microplastics in the seawater and sediment: a case study in Jiaozhou Bay, China.Sci. Total Environ.67427–35. 10.1016/j.scitotenv.2019.04.008
76
Zhou Q. Tu C. Yang J. Fu C. Li Y. Waniek J. J. (2021). Trapping of microplastics in halocline and turbidity layers of the semi-enclosed Baltic Sea.Front. Mar. Sci.8:761566.
77
Zhu J. Zhang Q. Huang Y. Jiang Y. Lan W. (2021). Long-term trends of microplastics in seawater and farmed oysters in the Maowei Sea, China.Environ. Pollut.273:116450. 10.1016/j.envpol.2021.116450
78
Zhu J. Zhang Q. Li Y. Tan S. Kang Z. Yu X. et al (2019). Microplastic pollution in the Maowei Sea, a typical mariculture bay of China.Sci. Total Environ.65862–68. 10.1016/j.scitotenv.2018.12.192
79
Zhu L. Bai H. Y. Chen B. J. Sun X. M. Qu K. M. Xia B. (2018). Microplastic pollution in North Yellow Sea, China: observations on occurrence, distribution and identification.Sci. Total Environ.63620–29. 10.1016/j.scitotenv.2018.04.182
Summary
Keywords
microplastics, distribution, Beibu Gulf, long distance transportation, socioeconomic correlations
Citation
Zhu Z, Wei H, Huang W, Wu X, Guan Y and Zhang Q (2022) Occurrence of Microplastic Pollution in the Beibu Gulf, the Northern South China Sea. Front. Mar. Sci. 8:821008. doi: 10.3389/fmars.2021.821008
Received
23 November 2021
Accepted
17 December 2021
Published
03 February 2022
Volume
8 - 2021
Edited by
Xiaoshan Zhu, Tsinghua University, China
Reviewed by
Minggang Cai, Xiamen University, China; Muhammad Reza Cordova, Research Center for Oceanography, Indonesian Institute of Sciences, Indonesia
Updates
Copyright
© 2022 Zhu, Wei, Huang, Wu, Guan and Zhang.
This is an open-access article distributed under the terms of the Creative Commons Attribution License (CC BY). The use, distribution or reproduction in other forums is permitted, provided the original author(s) and the copyright owner(s) are credited and that the original publication in this journal is cited, in accordance with accepted academic practice. No use, distribution or reproduction is permitted which does not comply with these terms.
*Correspondence: Zuhao Zhu, zhuzuhao@4io.org.cn
This article was submitted to Marine Pollution, a section of the journal Frontiers in Marine Science
Disclaimer
All claims expressed in this article are solely those of the authors and do not necessarily represent those of their affiliated organizations, or those of the publisher, the editors and the reviewers. Any product that may be evaluated in this article or claim that may be made by its manufacturer is not guaranteed or endorsed by the publisher.