Abstract
Dissolved rare earth elements (REEs) and neodymium isotopes (ϵNd) have been jointly used to evaluate water mass mixing and lithogenic inputs in the ocean. As the largest marginal sea of the West Pacific, the South China Sea (SCS) is an ideal region for reconstructing past hydrological changes. However, its REE and ϵNd distributions and underlying controlling mechanisms remain poorly understood. On the basis of four seawater profiles spread across the SCS, this study presents dissolved REE concentrations and ϵNd data under summer condition to better understand the processes that potentially influence changes in these parameters and their marine cycling. The results show high concentrations of REEs and large variations in ϵNd (−6.7 to −2.8) in surface water, likely caused by the dissolution of riverine and marine particles. Comparison with published data from samples taken during the winter of different years in this and previous studies suggests a possible seasonal variability of middle REE enrichment. The SCS deep water shows a narrow ϵNd range from −4.3 to −3.4, confirming the dominant presence of the North Pacific Deep Water in the deep SCS. The intermediate water in the central SCS is characterized by a more negative ϵNd signal (–4.2 to –3.4) than that found in its counterpart in the West Pacific (–3.5 to –2.8), indicating alterations by deep water through three-dimensional overturning circulation from the northern to southern SCS below ~500 m. The contributions of external sources could be quantitatively estimated for the SCS in terms of Nd. The dissolution of particles from the SCS surrounding rivers (0.26–1.3 tons/yr in summer; 5.6–29 tons/yr in winter) and continental margins (2–12 tons/yr in summer; 23–44 tons/yr in winter) may play an important role in providing additional Nd to the SCS surface water.
1 Introduction
The rare earth elements (REEs) are a chemically coherent group of fourteen elements. Dissolved REE concentrations in the ocean are typically higher in deep water than in the upper layers because of vertical processes (e.g., reversible scavenging) (Elderfield, 1988; Nozaki and Alibo, 2003; Akagi, 2013; Garcia-Solsona et al., 2014; de Baar et al., 2018; Pham et al., 2019). Dissolved REEs in seawater are potentially influenced by the mixing of water masses (Osborne et al., 2015; Zheng et al., 2016; Behrens et al., 2020). In addition, river discharge, dust, hydrothermal inputs, and the dissolution of marine particles can also influence dissolved REE concentrations and patterns in the ocean (e.g., Chen et al., 2013; Grenier et al., 2013; Rousseau et al., 2015; Stichel et al., 2015; Yu et al., 2017; Grenier et al., 2018; Che et al., 2022). These external inputs have been shown to possibly cause relative enrichments of middle REEs (MREEs: Sm, Eu, Gd, Tb, and Dy) and less depletion of Ce in surface water (Greaves et al., 1994; Grenier et al., 2013; Grasse et al., 2017; Yu et al., 2017; Grenier et al., 2018; Hathorne et al., 2020). Submarine groundwater discharge could also be a significant contributor to the REE budget of coastal seawater (Johannesson and Burdige, 2007; Kim and Kim, 2014). In addition, the diffusive benthic flux of REEs from pore fluid to bottom water may account for the “missing” flux of REEs in the ocean, as predicted by modeling (Abbott et al., 2015; Haley et al., 2017).
The neodymium (Nd) isotopic composition (143Nd/144Nd) is expressed as εNd and defined as:
where CHUR (Chondritic Uniform Reservoir, 143Nd/144Nd = 0.512638) represents the average 143Nd/144Nd ratio of present-day Earth. Over the last decade, the accumulation of present-day Nd concentration and isotopic data – especially via the GEOTRACES Programme – has significantly improved our understanding of REE cycle in the ocean (van de Flierdt et al., 2016 and references therein; Tachikawa et al., 2017). On the basis of knowledge gained from the present-day ocean, ϵNd has been recognized as a quasi-conservative property of water masses, and widely used to track past changes in ocean circulation at different time scales (Piotrowski et al., 2012; Scher et al., 2015; Dubois-Dauphin et al., 2016; Hu et al., 2016; Le Houedec et al., 2016; Molina-Kescher et al., 2016; Tachikawa et al., 2017; Colin et al., 2019; Wu et al., 2019; Du et al., 2020; Colin et al., 2021). Nevertheless, the seawater-derived εNd signal extracted from authigenic phases is not always reliable for reconstructing ocean circulation (Osborne et al., 2014; Abbott et al., 2015; Tachikawa et al., 2017; Blaser et al., 2019; Patton et al., 2021). The main debate centers on whether the record of temporal seawater ϵNd can faithfully reflect the mixing of water masses, especially when ϵNd values of seawater endmembers have changed (Wilson et al., 2014; Tachikawa et al., 2017; Zhao et al., 2019; Du et al., 2020).
Continental inputs of REEs are able to modify seawater ϵNd, especially in surface water, where continental Nd signatures are distinct from those of upstream seawater (Singh et al., 2012; Fröllje et al., 2016). These inputs are part of a process referred as “boundary exchange”, which also integrates scavenging processes, and can alter the dissolved ϵNd without necessarily affecting Nd concentration (Lacan and Jeandel, 2005; Zieringer et al., 2019). Enhanced lithogenic inputs during interglacial periods could have markedly impacted seawater ϵNd, with εNd values offset by as much as 1- to 2-ϵ units (Noble et al., 2013; Yu et al., 2018; Zhao et al., 2019). Seasonal changes in seawater REE concentrations and ϵNd have been reported; these changes are generally attributed to the influence of biogeochemical cycling or seasonally variable terrigenous inputs (Crocket et al., 2018; Grenier et al., 2018; Hathorne et al., 2020). The Nd released from pore fluid can also act as a benthic source to bottom water, leading to the alteration of primary seawater εNd value (Abbott et al., 2016; Du et al., 2016; Haley et al., 2017). Therefore, evaluating the applicability of seawater-derived Nd isotopes in paleoceanographic studies is crucial, especially in various marginal seas that are significantly affected by terrigenous inputs.
The South China Sea (SCS) is the largest marginal sea of the West Pacific and receives substantial sediment discharges from numerous large Asian rivers, which are characterized by a larger range ϵNd (river sediments: –13.5 to +7) than the dissolved ϵNd of SCS water masses (–8.5 to –1.9) (Milliman and Farnsworth, 2011; Wei et al., 2012 and references therein; Figure 1). Therefore, the SCS is an ideal area to study the processes that control the marine REE cycle. Recent studies have shown that there is a decreasing trend in surface-water εNd from the northern to southern SCS, whereas the maximum of Nd concentration occurs in the central gyre (Alibo and Nozaki, 2000; Amakawa et al., 2000; Wu et al., 2015). This indicates that besides lateral water mass mixing, there might be inputs of REEs from local sources to the SCS (Amakawa et al., 2000). However, existing vertical profiles of dissolved εNd are mainly confined to the northern SCS, and seawater REE data have mostly been reported from the samples collected in winter (Alibo and Nozaki, 2000; Amakawa et al., 2000; Wu et al., 2015). To date, little is known about the geochemical cycling of seawater REEs and εNd in the central and southern SCS, in particular the potential seasonal changes in REE distribution.
Figure 1
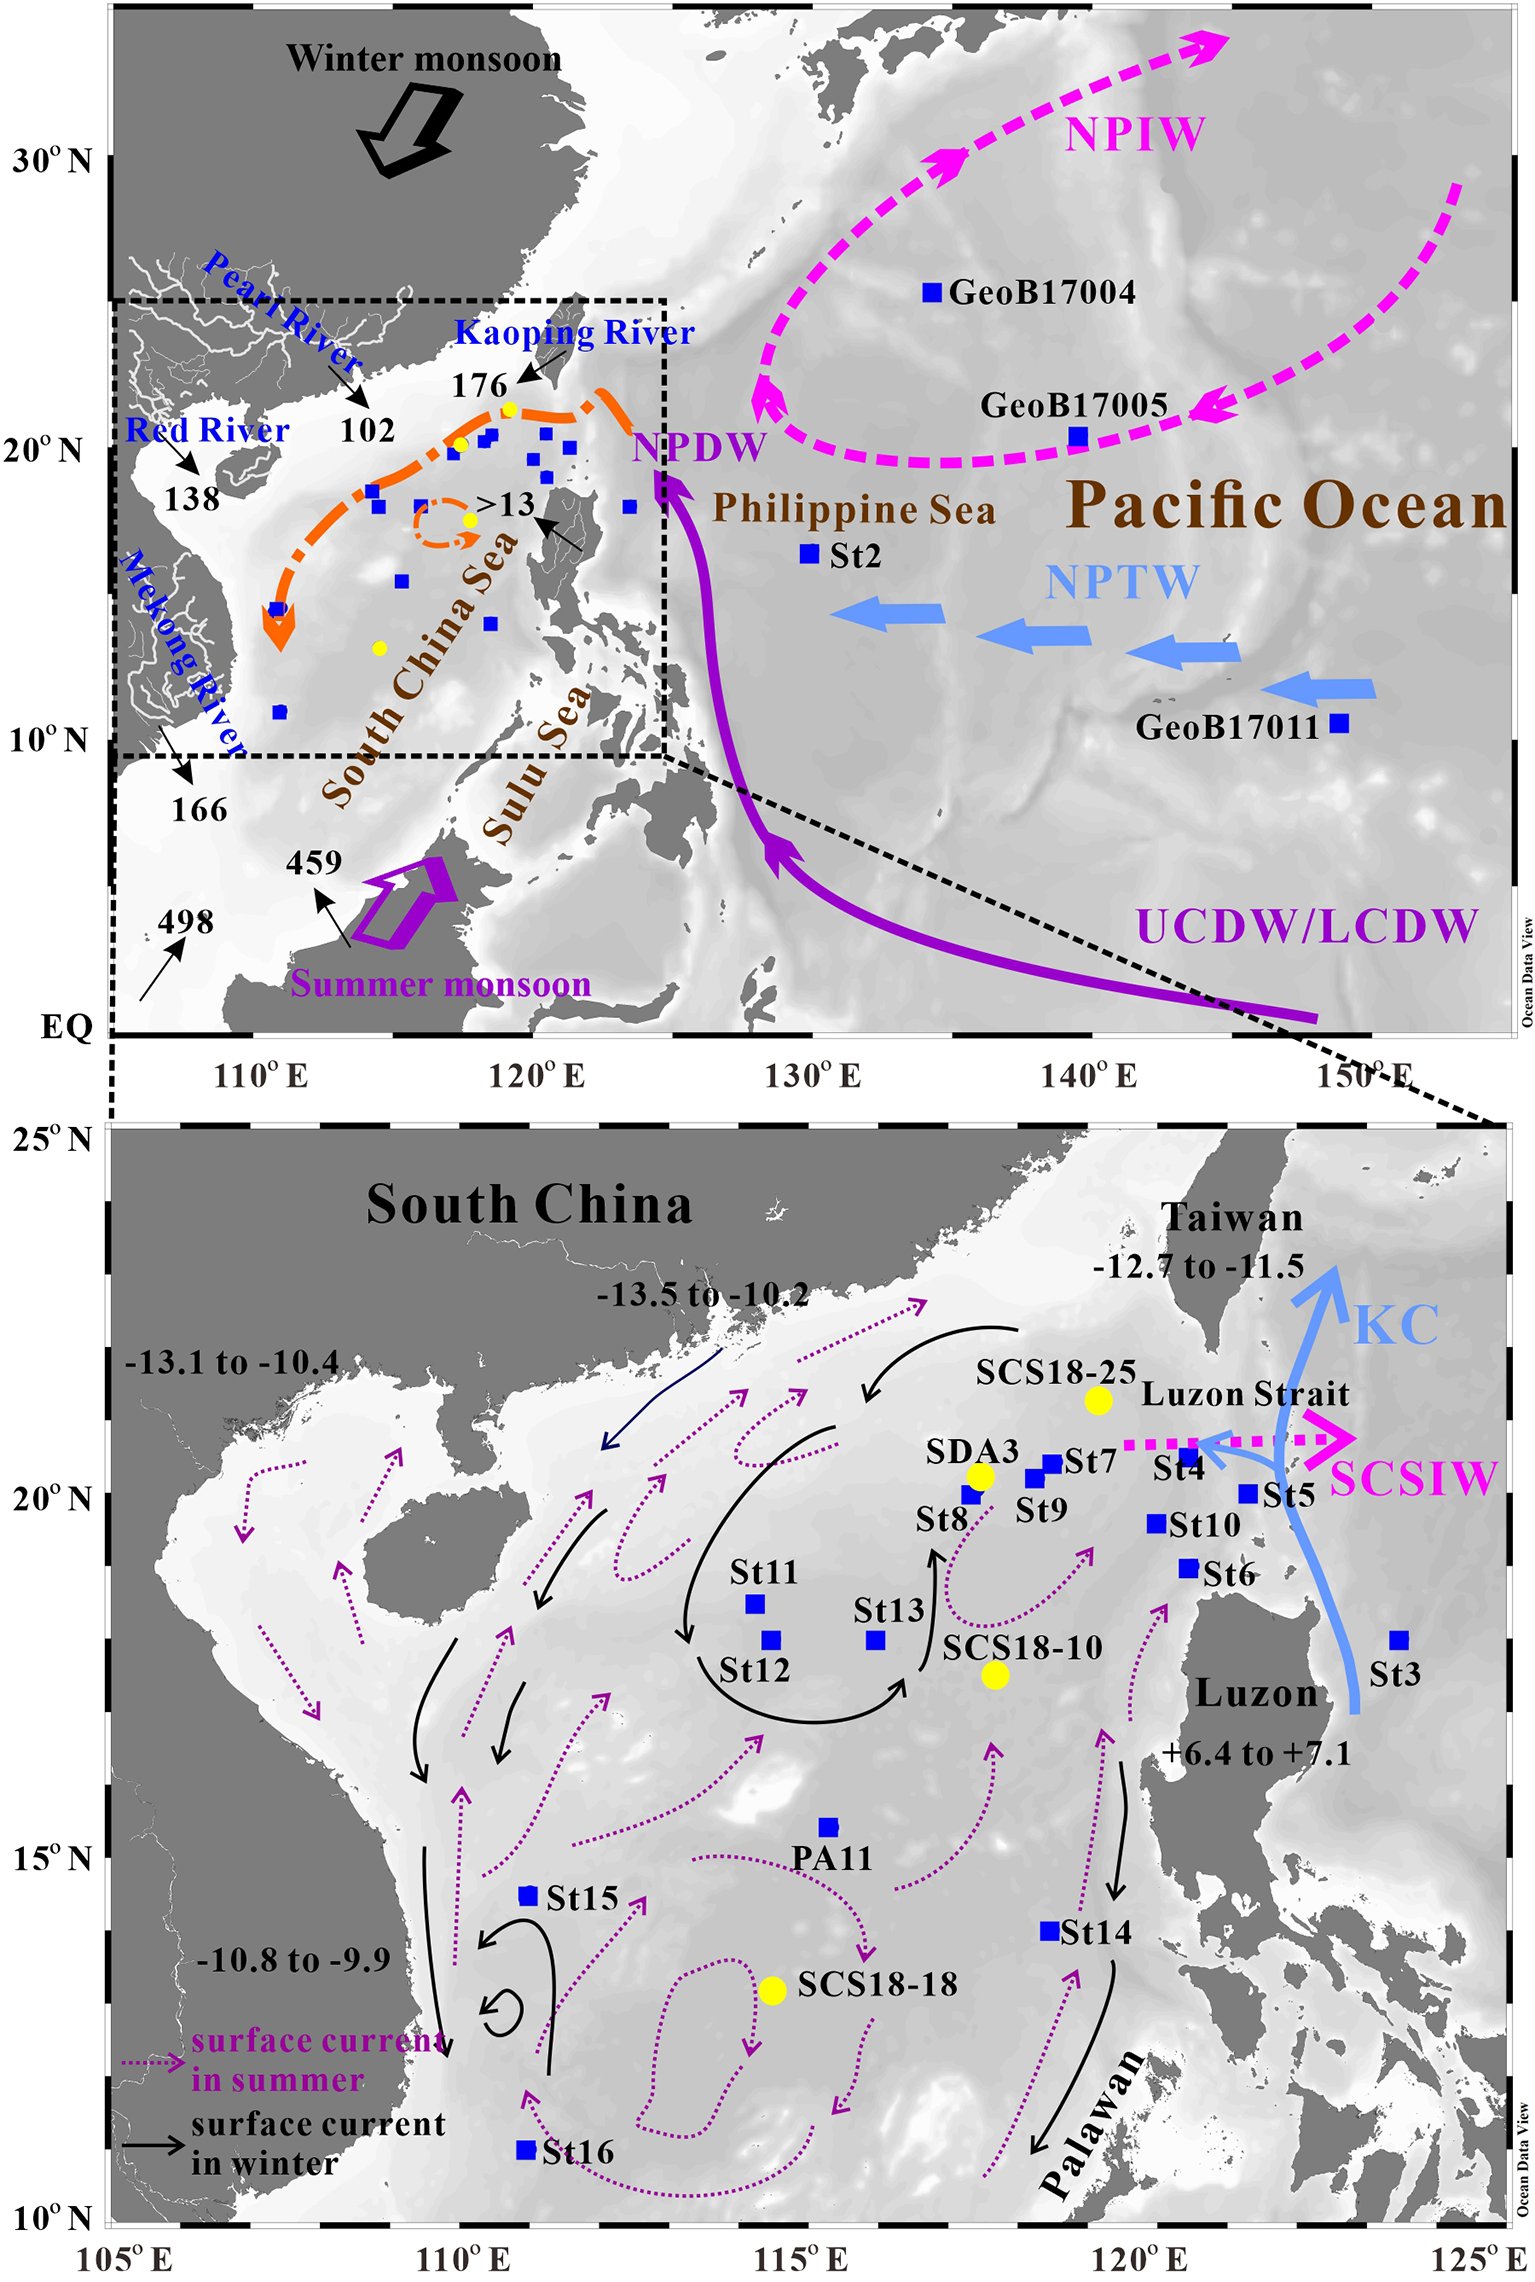
Sampling maps showing seawater stations mentioned in text and regional oceanic currents. Black arrows with numbers indicate fluvial sediment discharges from the surrounding continents (× 106 tons/yr; Milliman and Farnsworth, 2011; Liu et al., 2016, and references therein). Yellow dots represent the sampling stations in this study, while blue squares show the stations of published data (Alibo and Nozaki, 2000; Wu et al., 2015; Behrens et al., 2018a). The purple line denotes schematic pathway of the Upper/Lower Circumpolar Deep Water (UCDW/LCDW) in the western Pacific Ocean (modified after Kawabe and Fujio, 2010). The flow path of North Pacific Intermediate Water (NPIW) is indicated by the pink dashed line (after You, 2003). The North Pacific Tropical water (NPTW) is shown by the light blue arrows. The flow direction of North Pacific Deep Water (NPDW) in the South China Sea is shown by orange dashed lines. The local seasonal reversed monsoon directions are indicated by black and purple arrows. The black line and purple dashed line represent surface circulation in winter and summer, respectively. The map was produced using Ocean Data View (Schlitzer, 2014).
In this study, we present dissolved REE and εNd data from 56 samples, collected in April-May 2018 at four seawater stations spread across the SCS. The objectives of this work are (1) to better understand the sources and geochemical cycling of dissolved REEs, in particular Nd, from the northern to central SCS; and (2) to evaluate the relative importance of water-mass mixing and external inputs (riverine water/particles, atmospheric dust, and marine particles from continental margins) on the dissolved εNd distribution. Overall, this study examines the evolution of seawater εNd as it is transported from the West Pacific to the central SCS basin.
2 Regional oceanography
The SCS is a semi-enclosed marginal sea connecting the Pacific and Indian oceans. The Luzon Strait is the single deep channel between the SCS and Pacific Ocean (Figure 1). Previous studies have revealed a vertical sandwich-like structure of the Luzon Strait, with three layers of net SCS inflow-outflow-inflow in the upper, intermediate, and deep layers, respectively (Yuan, 2002; Tian et al., 2006; Shu et al., 2014; Gan et al., 2016; Zhu et al., 2016; Zhu et al., 2019; Wang et al., 2019).
The upper layer includes the South China Sea Tropical Water (SCSTW), characterized by a salinity maximum at a depth of ~150 m. The salinity maximum of the SCSTW is relatively low compared with its counterpart North Pacific Tropical Water (NPTW) in the Philippine Sea (Figure 2). The surface circulation of the SCS is mainly driven by a complex system including the seasonally reversed monsoon activity and tidal processes (Fang et al., 1998; Li and Qu, 2006; Wang et al., 2019). In general, in the southern SCS, surface circulation is essentially driven by the seasonal reversal of monsoon winds that induces a cyclonic gyre during the winter and anti-cyclonic gyre during the summer (Fang et al., 1998). In the northern SCS, forcing induced by reversal of monsoon winds and the intrusion of the Kuroshio branch generates more complex surface currents (Fang et al., 1998; Wang et al., 2013). In addition to the wind-driven gyres, mesoscale anti-cyclonic eddies and coastal currents also affect areas along the northern continental slope of the SCS (Hu et al., 2000; Yuan et al., 2007; Han et al., 2021; Wang et al., 2021).
Figure 2
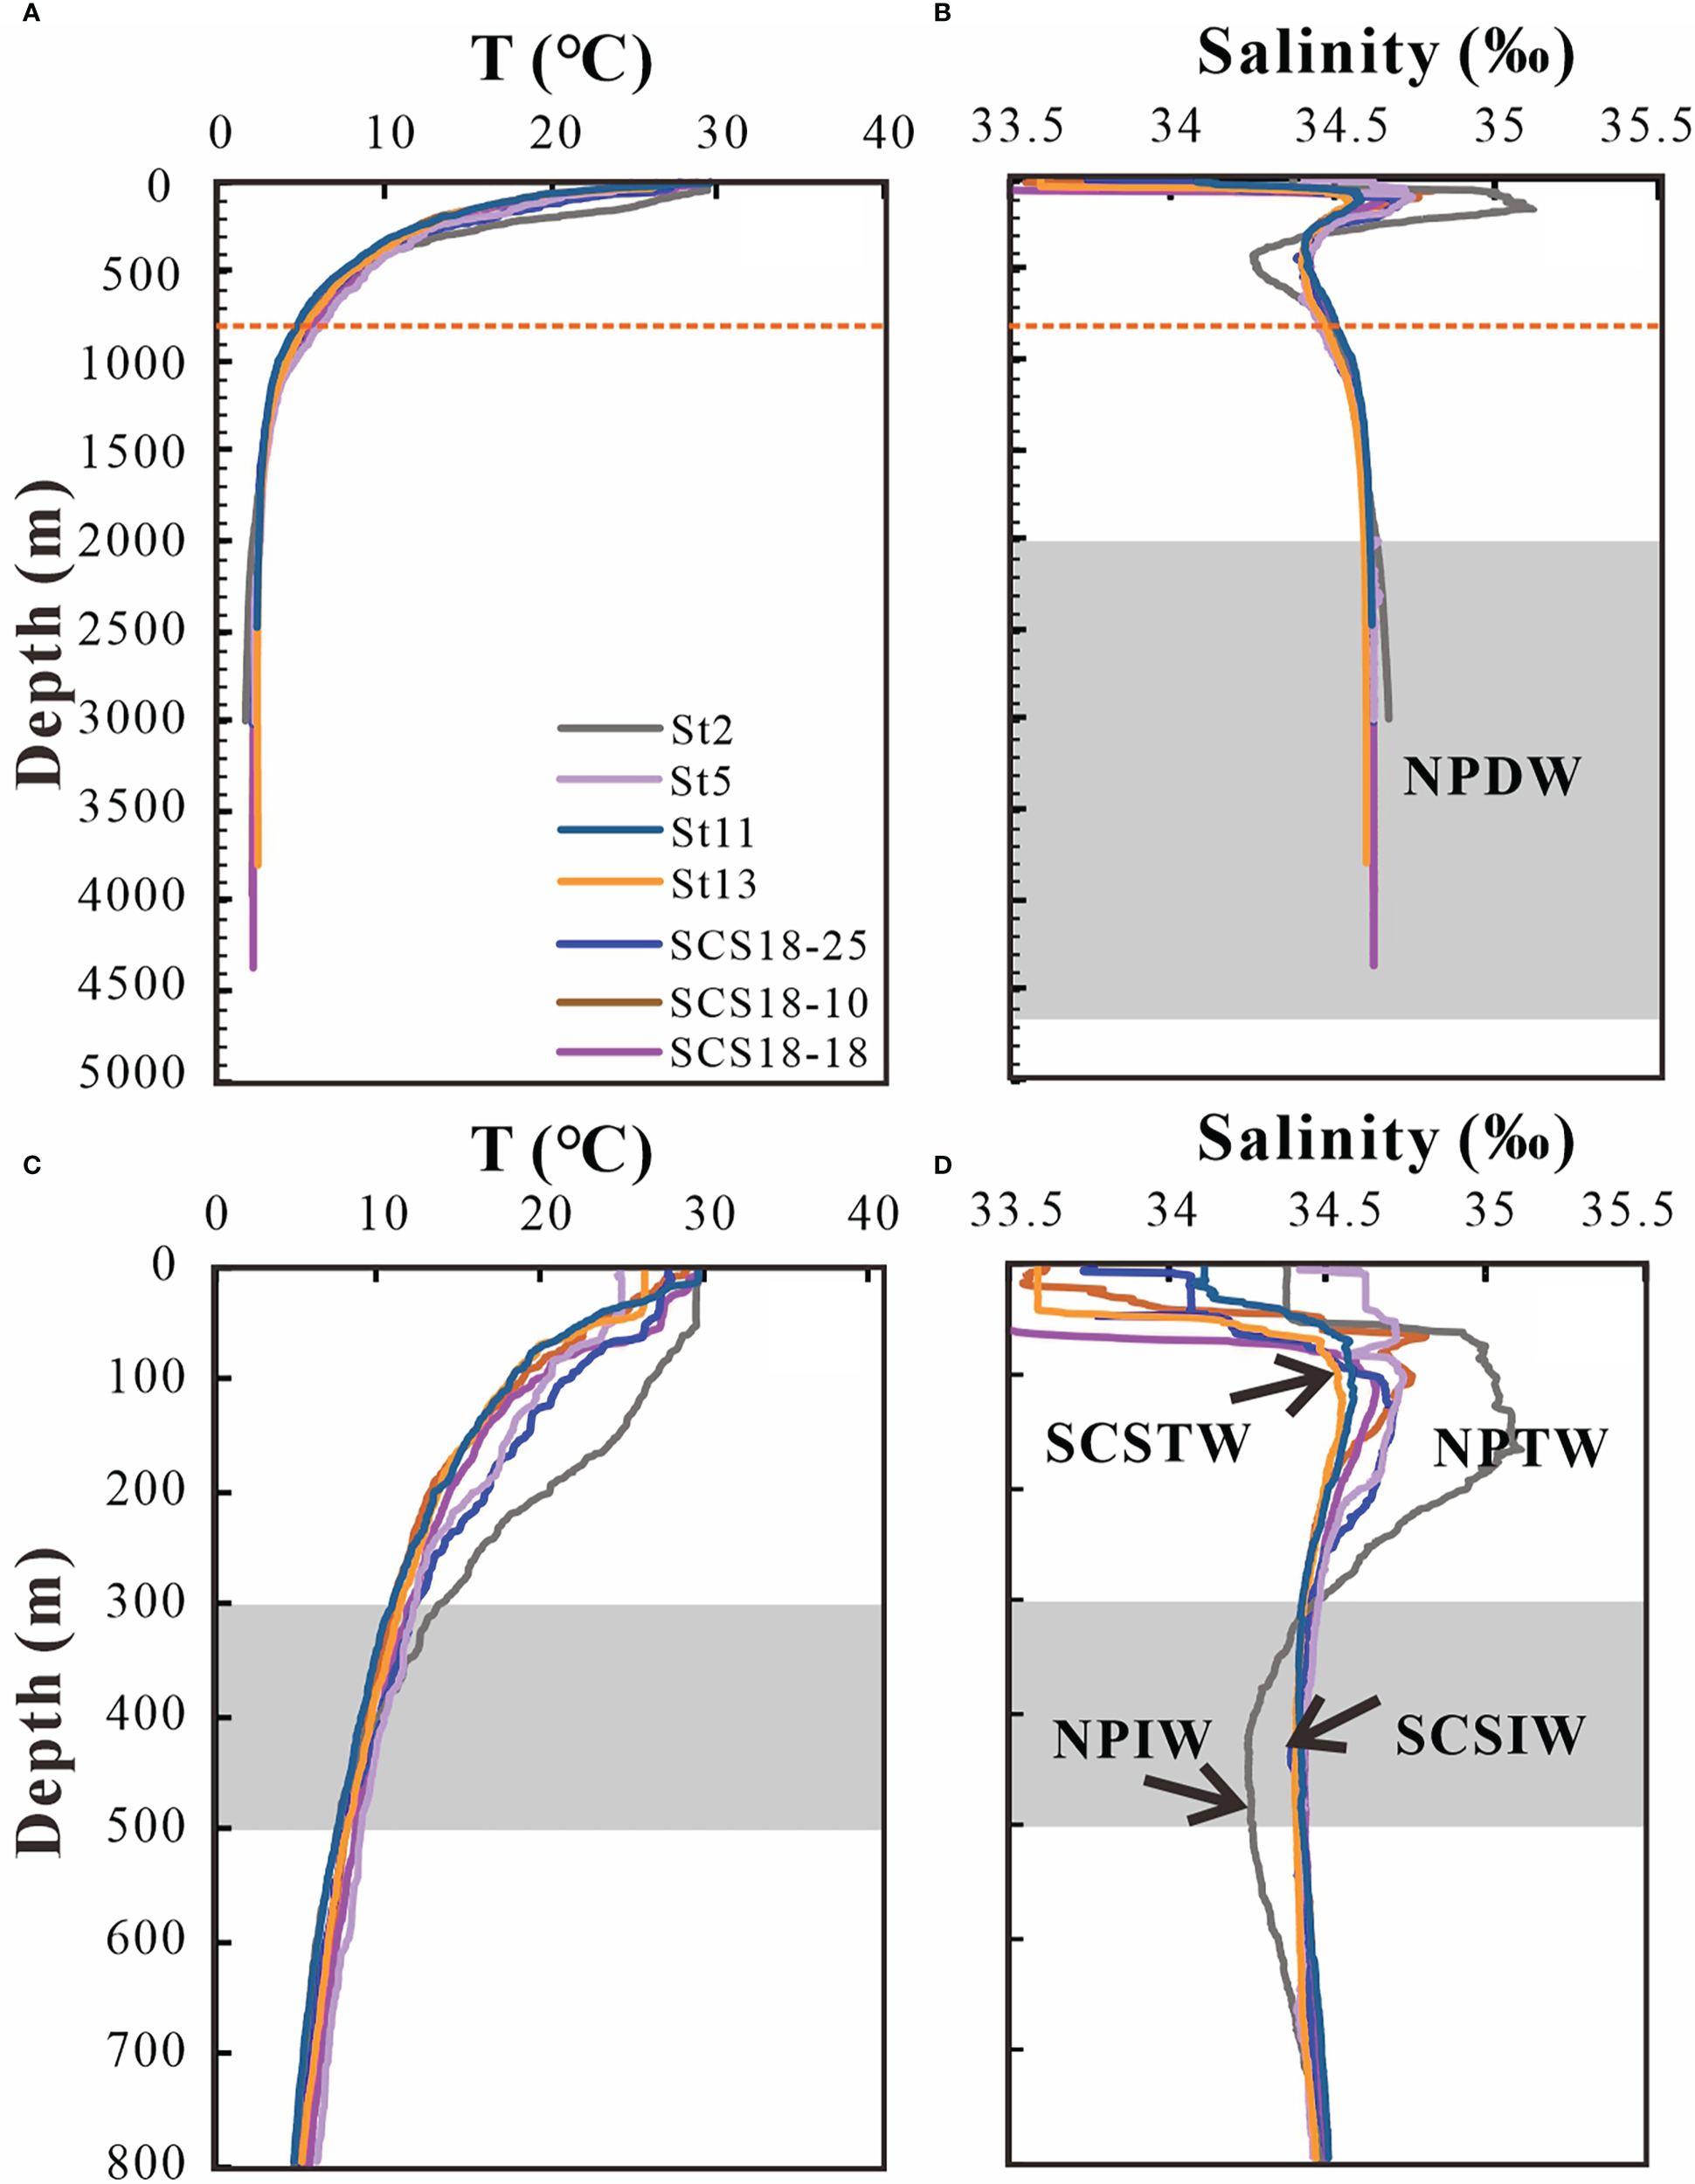
Physical water properties (A–D) at our sampling stations over the northern and central SCS. Data of St2, St5, St11, and St13 stations (Wu et al., 2015) are combined with our data and shown.
The South China Sea Intermediate Water (SCSIW), characterized by relatively low salinity with minimum value of ~ 34.38 between 300 and 500 m, plays an important role in the formation of meridional overturning circulation in the SCS (Tian et al., 2006; Yang et al., 2010; Gan et al., 2016; Zhu et al., 2016; Wang et al., 2019; Figure 2). The net transport of intermediate water is from the SCS to the West Pacific, balanced by a net inflow of both upper and deep water from the West Pacific (Tian et al., 2006; Tian et al., 2009). In addition, the outflow of intermediate water occurs in the northern part of the Luzon Strait in winter and the southern part in summer; while the westward flow of intermediate water into the SCS occurs in the southern part of the Luzon Strait in winter, and the northern part in summer (Tian et al., 2006; Yang et al., 2010; Xie et al., 2011; Zhu et al., 2016).
The deep water of the SCS is mainly fed by the North Pacific Deep Water (NPDW), which is derived from the Upper/Lower Circumpolar Water. With the deepest sill at ~2400 m in the Luzon Strait, the physical properties of the SCS deep water are relatively homogenous and similar to the NPDW in the Philippine Sea at ~2000 m (Broecker et al., 1986; Qu et al., 2006; Zhu et al., 2019). A basin-scale cyclonic deep current driven by the Luzon deep water overflow was observed based on density and oxygen distribution, and further supported by model results (Qu et al., 2006; Gan et al., 2016; Zhu et al., 2017). A deep western boundary current along the northern slope and a sub-basin-scale recirculation current have also been identified through modeling and mooring observations (Wang et al., 2011; Zhou et al., 2017; Zhou et al., 2020; Figure 1). In addition to these large scale currents, mesoscale eddy dissipation has been suggested to force the horizontal circulation and vertical diffusion in mid-deep layers, resulting in enhanced mid-deep overturning circulation (Tian et al., 2009; Chen et al., 2015; Wang et al., 2019).
3 Materials and methods
A total of 56 seawater samples were collected from four stations in the SCS during the KK1803 cruise carried out by R/V Jiageng from April to May, 2018 (Figure 1). The northernmost water station, SCS18-25, is located in the deep-water pathway close to the Luzon Strait. To our knowledge, station SCS18-18 is the southernmost station documenting the vertical profile of dissolved REE data in the SCS. Station SCS18-10 is located in the northeastern SCS between stations SCS18-25 and SCS18-18. Four seawater samples were collected at station SDA3, close to Dongsha Island, where a series of large drift sediments have been identified (Lüdmann et al., 2005).
For the SCS18-25, SCS18-10, and SCS18-18 stations, 10 L of seawater was collected per sample using Niskin bottles mounted on a 24-position Sea-Bird’s 911plus CTD-rosette. The sensor of the WetLabs C-Star transmissometer was also mounted on the CTD to measure the seawater transmissivity. Four additional intermediate-bottom water samples were collected at station SDA3 using 6 L Niskin bottles mounted on a ROV (ROPOS). Approximately 500 mL of seawater was subsampled for REE concentration measurements. All seawater samples were immediately filtered onboard using a 0.45 μm pore size filter (AcroPak™ 500 Capsules, Pall Laboratory) and acidified to pH ≤ 2 with ultraclean 6 N HCl.
At the land-based laboratory, seawater Nd was purified following the protocol described by Jeandel et al. (2013). In brief, the seawater was first preconcentrated on a C18 SepPak cartridge previously loaded with a REE complexant. REEs were separated from the matrix using Bio-Rad AG50W-X8 resin (200–400 μm mesh size); Nd was then purified using Eichrom Ln-Spec resin (100–150 μm mesh size). The Nd isotopes of the purified fractions were measured using a ThermoScientific Neptuneplus Multi-Collector Inductively Coupled Plasma Mass Spectrometer (MC-ICP-MS) at the Laboratoire des Sciences du Climat et de l’Environnement (LSCE) in Gif-sur-Yvette (France). The Neptuneplus was operated using a static mode with radio frequency ranging from 1200 to 1350 W. The sample and skimmer cones were Jet and X-shape cones, respectively. We used the Apex Omega system and ESI Apex-ST PFA 100 μL/min as the desolvating system and nebulizer, respectively. During the analytical sessions, every group of two samples was bracketed with analyses of the Nd standard solution JNdi-1 (143Nd/144Nd of 0.512115 ± 0.000006; Tanaka et al., 2000). Sample and standard concentrations were matched at 10 ppb. The 143Nd/144Nd ratios were corrected for mass-dependent fractionation using 146Nd/144Nd = 0.7219 and an exponential law. The offset value between the results and the certified value of JNdi-1 was 0.3 epsilon units for all the analyses presented in this study. The analytical errors reported herein correspond to the external two-sigma standard deviation (based on repeat analyses of the JNdi-1 during different analytical sessions). The analytical errors obtained ranged from 0.3 to 0.4 epsilon units. Procedural blanks corresponding to all analytical procedures, including the preconcentration of Nd from the seawater matrix, were less than 200 pg. This represents< 1.6% of the lowest Nd concentration of surface water in this study. As a result, no blank correction was applied.
Dissolved REE concentrations were measured in 250 mL seawater samples using the ThermoScientific XseriesII Inductively Coupled Plasma-Mass Spectrometer (ICP-MS) at the LSCE. Each sample was spiked with a Pr and Tm solution to correct for the recovery of REEs after the chemical extraction procedures. Rare earth elements were co-precipitated with ultra-pure iron hydroxide and then extracted by successive ion exchange procedures (AG1W-X8 resin) (Jeandel et al., 2013). The BCR-2 standard solution was diluted by 47,200 times. It was not put through the column chemistry and no spike was added. The diluted BCR-2 standard solution was analyzed (n = 6) together with the seawater samples and yielded uncertainties (%; RSD: internal error of relative standard deviation was derived from a measurement repeated 10 times) of ~2% for LREEs (La, Ce, Pr, and Nd), ~3% for MREEs (Sm, Eu, Gd, Tb, and Dy), and ~5% for HREEs (Ho, Er, Tm, Yb, and Lu). REE concentrations were corrected for sensitivity drift (if any) of the machine using In and Re as internal standards. Owing to the systematic impact of the Pr spike on Tb concentrations of seawater samples, the Tb data have high uncertainties. The analytical uncertainties (RSD) of our measurements ranged from ~5% for the lightest REE to ~10% for the heaviest REE, except for a few samples with analytical uncertainties of ~20% for Sm and Eu (Table S1). The total blank of REEs averaged ~15%, except for the HREEs Yb and Lu (which averaged ~36% and ~40%, respectively), and was subtracted for all seawater samples.
4 Results
4.1 Seawater Nd isotopes
Dissolved ϵNd values are reported in Table 1 and Figure 3A. There are significant variations in the εNd values of surface/subsurface water between the investigated stations. The most unradiogenic εNd value of –6.7 ± 0.3 was observed at the southernmost station (SCS18-18) at the surface (5 m), while the most radiogenic εNd value of –2.4 ± 0.3 was found at the northernmost station (SCS18-25) at 50 m. For station SCS18-10, εNd values were –5.8 ± 0.3 and –4.2 ± 0.4 at depths of 20 and 200 m, respectively.
Table 1
| Depth(m) | Salinity | Pot.Temp (°C) | 143Nd/144Nd ( ± 2SD) | εNd ( ± 2σ*) | Nd (pmol/kg) |
|---|---|---|---|---|---|
| 1. Site SCS18-25 (21.307° N, 119.198° E; 3005 m; May 2018) | |||||
| 5 | 33.935 | 27.511 | 0.512494 ± 0.000016 | –2.8 ± 0.4 | 9.75 |
| 50 | 34.052 | 26.623 | 0.512517 ± 0.000014 | –2.4 ± 0.3 | 11.09 |
| 150 | 34.671 | 18.518 | 0.512496 ± 0.000016 | –2.8 ± 0.4 | 6.63 |
| 300 | 34.427 | 11.864 | 0.512490 ± 0.000014 | –2.9 ± 0.3 | 7.92 |
| 450 | 34.398 | 8.462 | 0.512461 ± 0.000011 | –3.5 ± 0.3 | 11.24 |
| 600 | 34.427 | 6.661 | 0.512463 ± 0.000010 | –3.4 ± 0.3 | |
| 750 | 34.472 | 5.251 | 0.512462 ± 0.000009 | –3.4 ± 0.3 | 15.85 |
| 900 | 34.502 | 4.515 | 0.512446 ± 0.000008 | –3.8 ± 0.3 | 16.88 |
| 1050 | 34.536 | 3.738 | 0.512450 ± 0.000008 | –3.7 ± 0.3 | 17.18 |
| 1200 | 34.569 | 3.134 | 0.512443 ± 0.000008 | –3.8 ± 0.3 | 20.06 |
| 1350 | 34.584 | 2.821 | 0.512438 ± 0.000007 | –3.9 ± 0.3 | 20.36 |
| 1500 | 34.593 | 2.628 | 0.512443 ± 0.000009 | –3.8 ± 0.3 | 23.12 |
| 1650 | 34.601 | 2.473 | 0.512427 ± 0.000009 | –4.1 ± 0.3 | 24.75 |
| 1800 | 34.606 | 2.378 | 0.512440 ± 0.000008 | –3.9 ± 0.3 | 24.90 |
| 1950 | 34.611 | 2.286 | 0.512433 ± 0.000011 | –4.0 ± 0.3 | 25.74 |
| 2100 | 34.613 | 2.237 | 0.512427 ± 0.000009 | –4.1 ± 0.3 | 25.41 |
| 2250 | 34.615 | 2.199 | 0.512428 ± 0.000008 | –4.1 ± 0.3 | 25.22 |
| 2400 | 34.617 | 2.159 | 0.512434 ± 0.000008 | –4.0 ± 0.3 | 25.32 |
| 2550 | 34.619 | 2.129 | 0.512424 ± 0.000008 | –4.2 ± 0.3 | 25.64 |
| 2700 | 34.621 | 2.100 | 0.512424 ± 0.000007 | –4.2 ± 0.3 | 25.02 |
| 2850 | 34.622 | 2.086 | 0.512444 ± 0.000008 | –3.8 ± 0.3 | 25.97 |
| 2990 | 34.622 | 2.076 | 0.512439 ± 0.000009 | –3.9 ± 0.3 | 23.10 |
| 2. Site SCS18-10 (17.519° N, 117.744° E; 3960 m; April 2018) | |||||
| 20 | 33.638 | 26.905 | 0.512343 ± 0.000013 | –5.8 ± 0.3 | 8.46 |
| 200 | 34.486 | 13.075 | 0.512425 ± 0.000016 | –4.2 ± 0.4 | 9.07 |
| 500 | 34.414 | 8.176 | 0.512441 ± 0.000010 | –3.8 ± 0.3 | 11.32 |
| 800 | 34.489 | 5.365 | 0.512452 ± 0.000018 | –3.6 ± 0.5 | 15.15 |
| 1100 | 34.553 | 3.658 | 0.512383 ± 0.000008 | –5.0 ± 0.3 | 17.68 |
| 1400 | 34.605 | 2.498 | 0.512451 ± 0.000008 | –3.7 ± 0.3 | 20.57 |
| 1700 | 34.613 | 2.315 | 0.512448 ± 0.000007 | –3.7 ± 0.3 | 23.39 |
| 2000 | 34.614 | 2.311 | 0.512444 ± 0.000008 | –3.8 ± 0.3 | 24.26 |
| 2300 | 34.618 | 2.214 | 0.512443 ± 0.000008 | –3.8 ± 0.3 | 25.62 |
| 2600 | 34.621 | 2.154 | 0.512455 ± 0.000009 | –3.6 ± 0.3 | 26.78 |
| 2900 | 34.622 | 2.123 | 0.512459 ± 0.000008 | –3.5 ± 0.3 | 26.50 |
| 3200 | 34.623 | 2.098 | 0.512457 ± 0.000008 | –3.5 ± 0.3 | 26.47 |
| 3500 | 34.624 | 2.079 | 0.512449 ± 0.000010 | –3.7 ± 0.3 | 25.18 |
| 3800 | 34.625 | 2.061 | 0.512440 ± 0.000009 | –3.9 ± 0.3 | 24.30 |
| 3950 | 34.626 | 2.049 | 0.512449 ± 0.000009 | –3.7 ± 0.3 | 25.26 |
| 3. Site SCS18-18 (13.167° N, 114.498° E; 4250 m; May 2018) | |||||
| 5 | 33.416 | 26.668 | 0.512296 ± 0.000013 | –6.7 ± 0.3 | 9.93 |
| 50 | 34.507 | 13.896 | 0.512376 ± 0.000010 | –5.1 ± 0.3 | 7.39 |
| 100 | 34.425 | 8.420 | 0.512424 ± 0.000013 | –4.2 ± 0.3 | 10.83 |
| 300 | 34.488 | 5.509 | 0.512437 ± 0.000011 | –3.9 ± 0.3 | 12.91 |
| 800 | 34.556 | 3.763 | 0.512423 ± 0.000010 | –4.2 ± 0.3 | 15.99 |
| 1400 | 34.589 | 2.932 | 0.512424 ± 0.000010 | –4.2 ± 0.3 | 20.02 |
| 1700 | 34.606 | 2.522 | 0.512438 ± 0.000008 | –3.9 ± 0.3 | 23.14 |
| 2000 | 34.614 | 2.317 | 0.512451 ± 0.000009 | –3.7 ± 0.3 | 24.07 |
| 2300 | 34.618 | 2.228 | 0.512444 ± 0.000008 | –3.8 ± 0.3 | 25.32 |
| 2600 | 34.620 | 2.169 | 0.512464 ± 0.000009 | –3.4 ± 0.3 | |
| 2900 | 34.622 | 2.129 | 0.512453 ± 0.000008 | –3.6 ± 0.3 | |
| 3200 | 34.623 | 2.114 | 0.512450 ± 0.000007 | –3.7 ± 0.3 | |
| 3500 | 34.623 | 2.106 | 0.512460 ± 0.000008 | –3.5 ± 0.3 | 27.51 |
| 3800 | 34.624 | 2.101 | 0.512446 ± 0.000007 | –3.8 ± 0.3 | |
| 4200 | 34.624 | 2.095 | 0.512459 ± 0.000008 | –3.5 ± 0.3 | |
| 4. Site SDA3 (20.132°N, 117.473°E, May 2018) | |||||
| 1100 | 0.512450 ± 0.000013 | –3.7 ± 0.3 | |||
| 1400 | 0.512420 ± 0.000013 | –4.3 ± 0.3 | |||
| 1700 | 0.512442 ± 0.000012 | –3.8 ± 0.3 | |||
| 1850 | 0.512417 ± 0.000009 | –4.3 ± 0.3 | |||
Location, water depts, salinity, potential temperature, 143Nd/144Nd ratio, ϵNd value and Nd concentration of the seawater samples analyzed in this study.
*A combined error of was used when the internal error was larger than the external error.
Figure 3
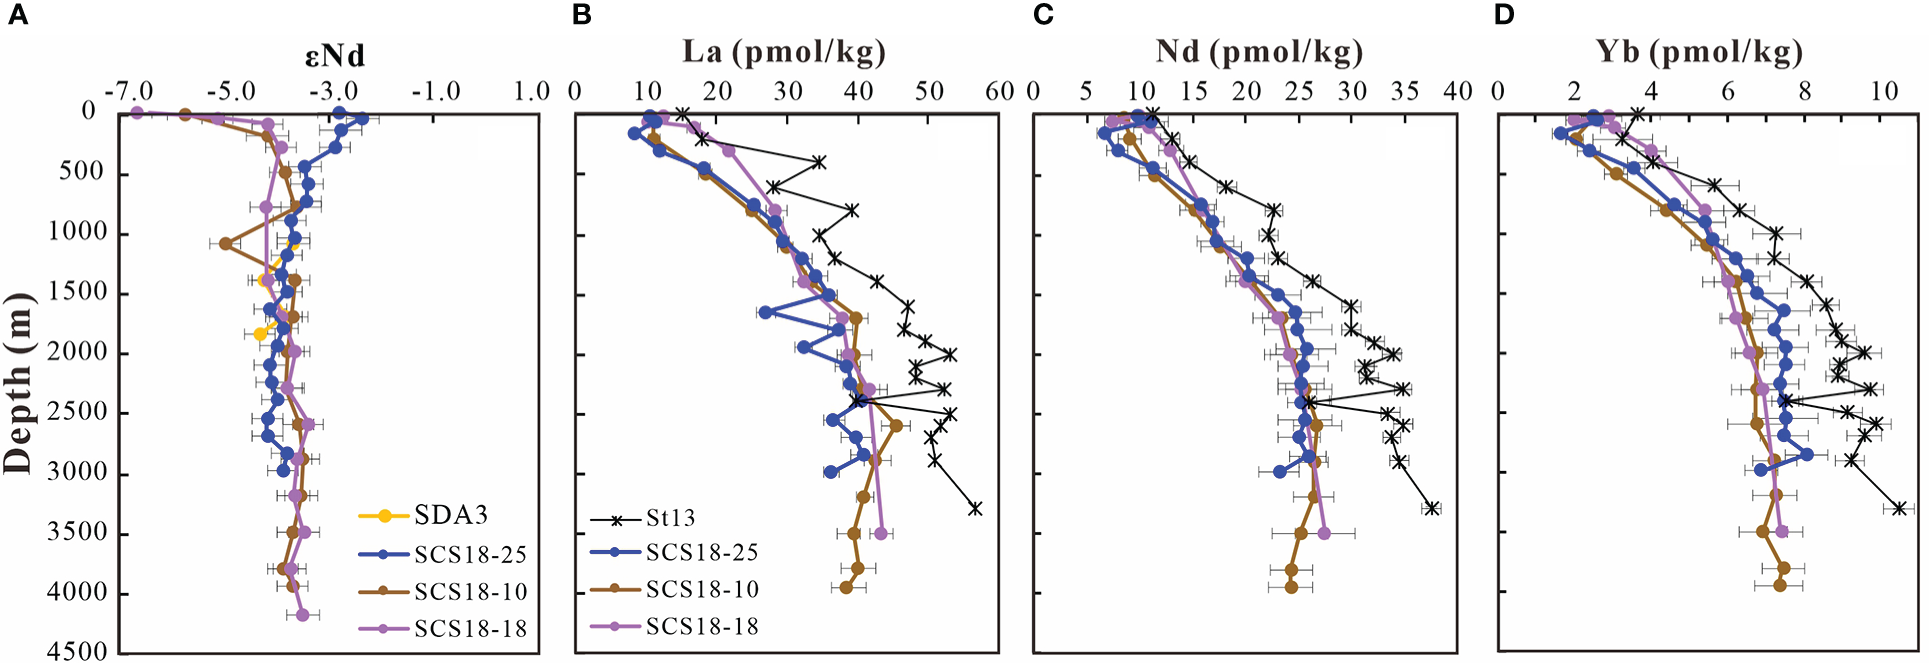
Vertical profiles of dissolved ϵNd (A) and dissolved concentrations of La (B), Nd (C), and Yb (D) reported in this study and by Wu et al. (2015; St13).
The εNd values of intermediate water ranged from –3.9 (1350 m) to –2.9 (300 m) at station SCS18-25. Intermediate-water εNd at station SCS18-18 was slightly lower (–4.2) than at stations SCS18-25 and SCS18-10 (–3.7), except for a more negative value of –5.0 ± 0.3 obtained at 1100 m at station SCS18-10. For deep water, εNd values exhibited a narrow range from –4.2 to –3.4 for the aforementioned stations. The four seawater samples from station SDA3 displayed εNd values (from –4.3 to –3.7) similar to those found at corresponding depths at other stations in the SCS (from –4.2 to –3.5) and slightly lower than those in the West Pacific (from –4.1 to –2.6) (Wu et al., 2015; Behrens et al., 2018b; Figure 3A).
4.2 Seawater REE concentrations and patterns
Rare earth element concentrations are reported in Table S1. The vertical distributions of La, Nd, and Yb concentrations are plotted in Figure 3. The ranges of La, Nd, and Yb concentrations were 8.48–45.55, 8.46–27.51, and 1.63–8.08 pmol/kg, respectively. Figure 3 shows that REE concentrations decreased from surface to subsurface water, except for a minimum Nd concentration at 5 m at station SCS18-10. The lowest concentrations of other REEs were observed at 150 m at SCS18-25, 200 m at SCS18-10, and 50 m at SCS18-18. Below these water depths, REE concentrations at stations SCS18-10 and SCS18-25 gradually increased with depth, except for several deep-bottom samples below ~2500 m, from where they generally decreased.
The REE concentrations of the upper ~300 m in our study (La: 8.5–21.9 pmol/kg; Nd: 6.6–12.9 pmol/kg; Yb: 1.6–4.0 pmol/kg) are similar to those of station St13 (La: 15.2–18.0 pmol/kg; Nd: 11.2–13.4 pmol/kg; Yb: 3.3–3.6 pmol/kg; Wu et al., 2015; Figure 3). However, below this depth, the REE concentrations of this study are generally lower compared to station St13 (Wu et al., 2015; Figure 3).
Post-Archean Australian Shale (PAAS)-normalized (Taylor and McLennan, 1985) REE patterns are shown in Supplementary Figure S1. Typical seawater REE patterns with a negative Ce anomaly and an enrichment in HREEs were observed for all seawater samples, which are similar to the findings of previous studies on the SCS and open West Pacific (Wu et al., 2015; Behrens et al., 2020). In most cases, the levels of HREE enrichment were more pronounced in deep-water samples than in surface-water samples.
5 Discussion
5.1 Continental sources supplying surface water of the SCS
Figure 4 presents the PAAS-normalized REE patterns of the SCS surface water (5–20 m), together with previous results obtained from the SCS, West Pacific and northeast Indian Ocean (Alibo and Nozaki, 2000; Nozaki and Alibo, 2003; Wu et al., 2015; Yu et al., 2017; Behrens et al., 2018a). The surface Nd concentrations in the SCS (8–15 pmol/kg) are considerably higher than those in the West Pacific (2–8 pmol/kg), but lower than those in the northeast Indian Ocean (18–51 pmol/kg) (Table 1; Alibo and Nozaki, 2000; Nozaki and Alibo, 2003; Wu et al., 2015; Yu et al., 2017; Behrens et al., 2018a). The higher Nd concentrations of surface water reported in the northeast Indian Ocean have been attributed to the immense sediment discharge (~2000 × 106 tons/yr) from large Asian rivers, such as the Ganges–Brahmaputra, Irrawaddy and Salween (Nozaki and Alibo, 2003; Yu et al., 2017; Hathorne et al., 2020). Similarly, the SCS also receives substantial sediment discharge from several large rivers owing to frequent tectonic activity and heavy monsoon rainfall (~300 × 106 tons/yr in the north and ~1200 × 106 tons/yr in the south; Milliman and Farnsworth, 2011; Liu et al., 2016, and references therein). The relatively high Nd concentrations in surface water in the SCS compared with the West Pacific are thus likely associated with REE inputs from external sources.
Figure 4
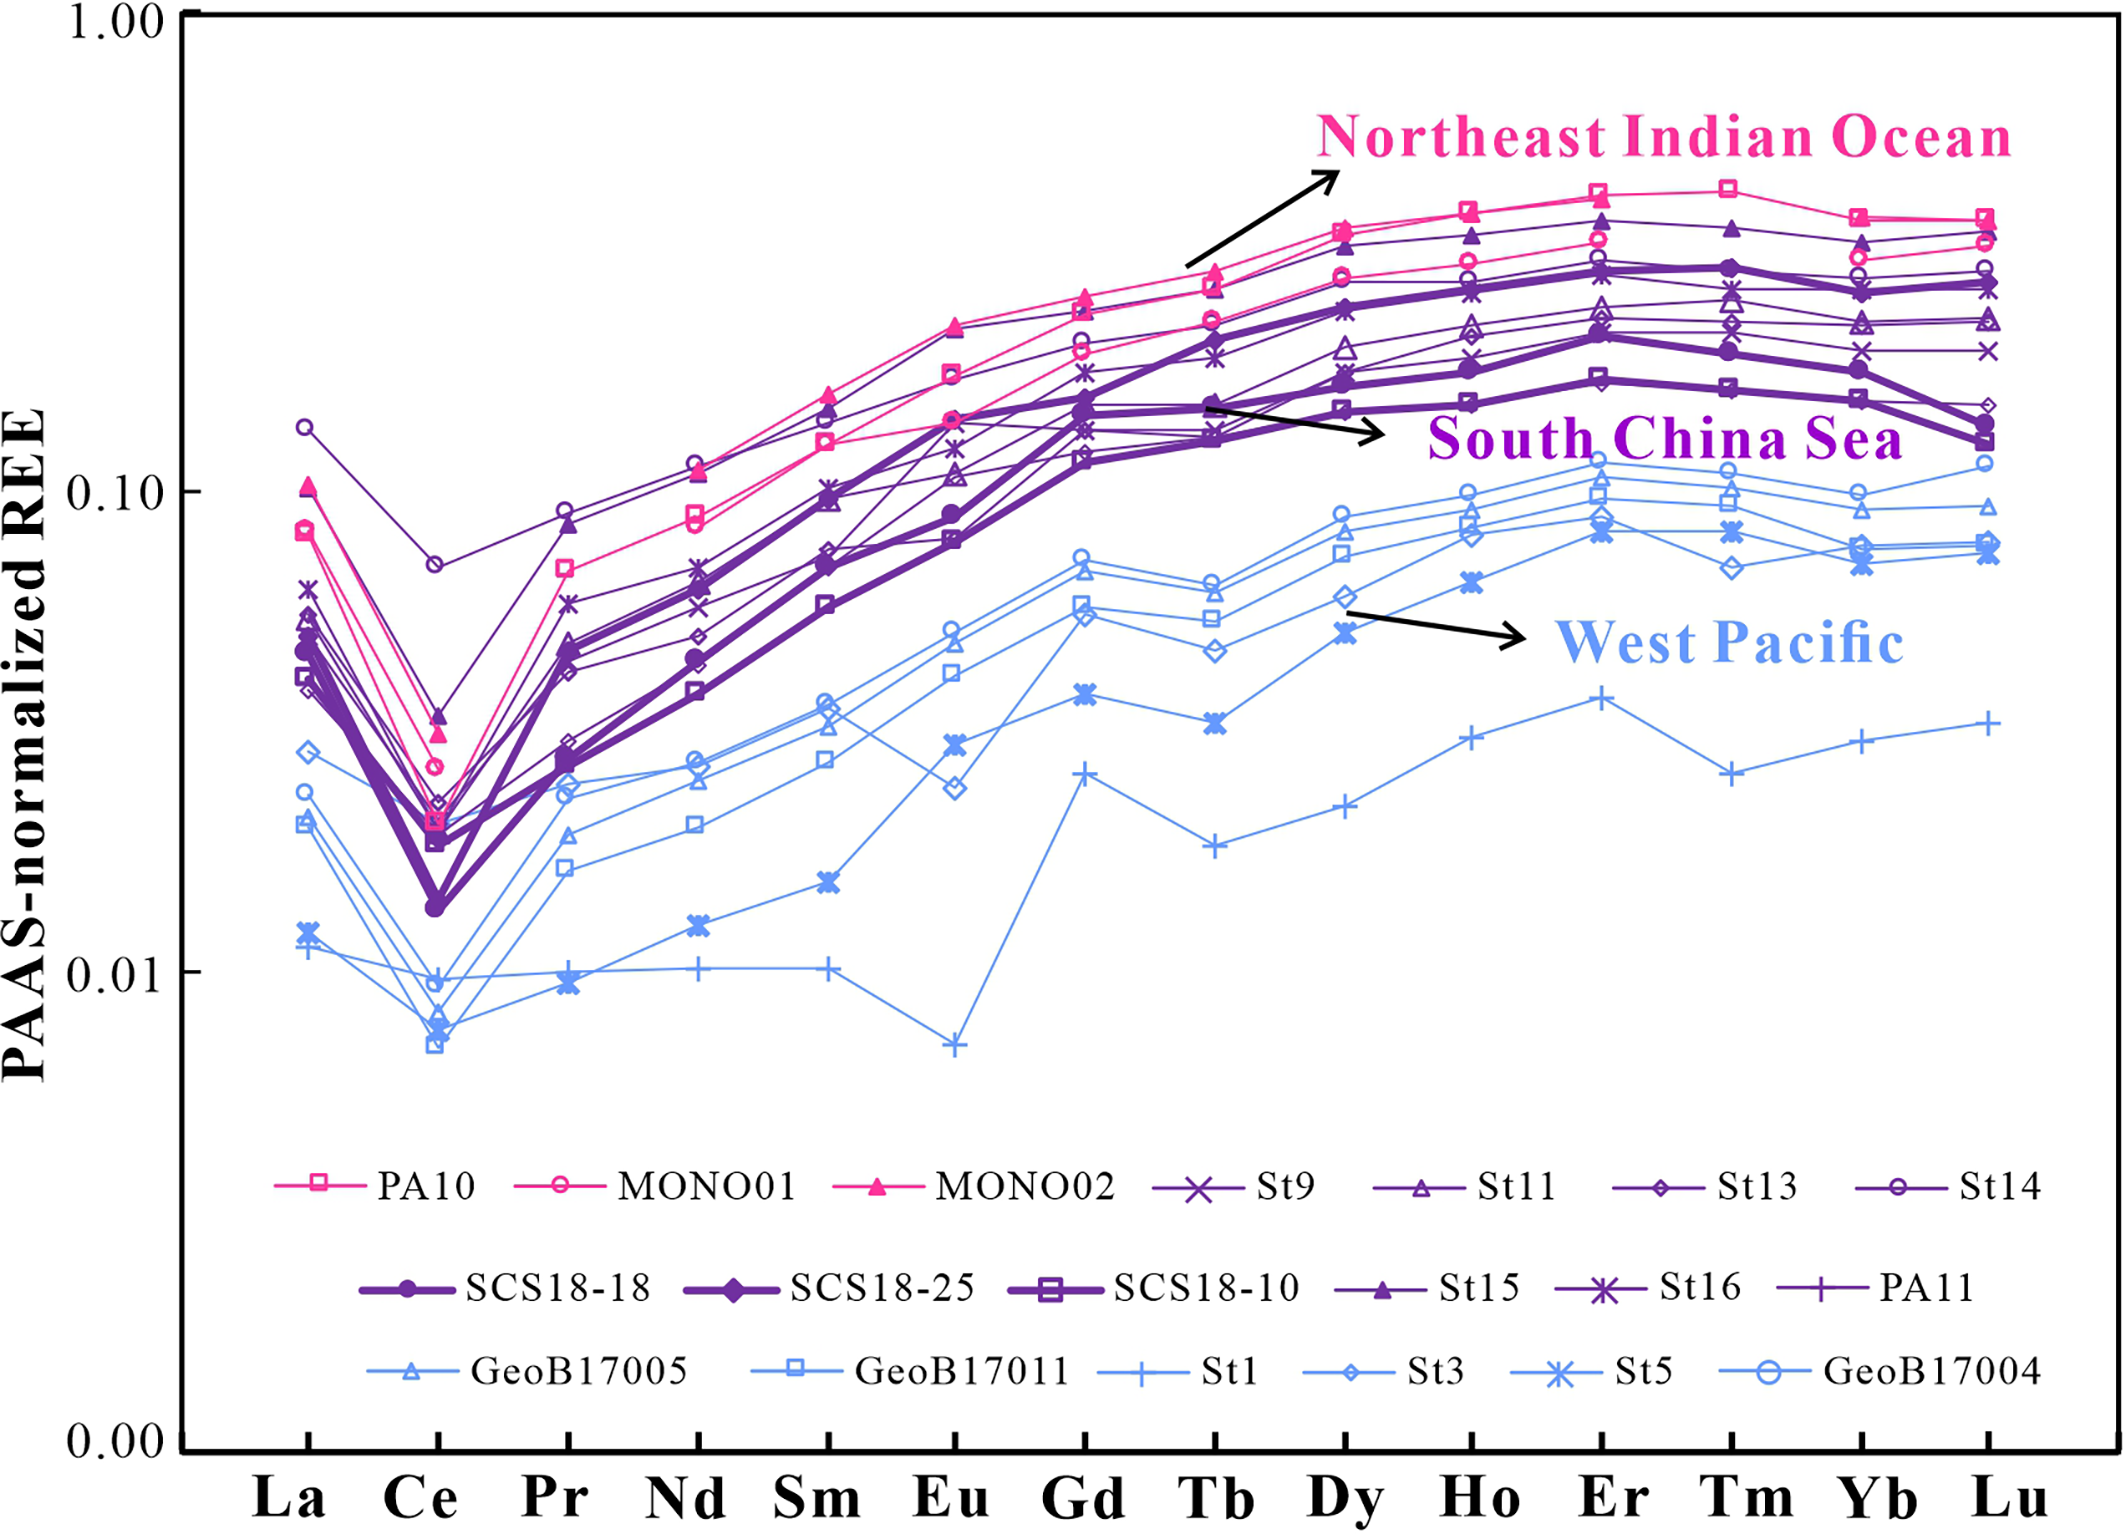
PAAS-normalized REE patterns of surface water in the SCS (this study; Alibo and Nozaki, 2000; Wu et al., 2015), the West Pacific (Wu et al., 2015; Behrens et al., 2018a), and the northeast Indian Ocean (Nozaki and Alibo, 2003; Yu et al., 2017). The locations of stations studied by Alibo and Nozaki (2000); Wu et al. (2015) and Behrens et al. (2018a) are shown in Figure 1. Stations PA10, MONO01, and MONO02 from the northeast Indian Ocean are located at 8° N, 89° E; 8° N, 89.4° E; and 11.8° N, 88.7° E, respectively (Nozaki and Alibo, 2003; Yu et al., 2017).
In order to assess which external sources could significantly contribute to the REE distributions in the SCS, we compiled REE data of filtered water, Asian dust (loess), marine particles, river sediments, and rock from the SCS and its surrounding continents (Ding et al., 2001; Chung et al., 2009; Bayon et al., 2015; Padrones et al., 2017; Liu et al., 2018; Ma et al., 2019; Figure 5). The REE pattern of the dissolved fraction of the Kaoping River exhibit negative Ce anomaly and relative MREE enrichment, similar to those of the SCS surface water (Figure 5). However, riverine dissolved REEs could be effectively removed in estuarine areas as a result of the salt-induced coagulation of riverine colloids (Goldstein and Jacobsen, 1987; Sholkovitz and Szymczak, 2000; Lawrence and Kamber, 2006; Rousseau et al., 2015; Adebayo et al., 2018). The average Nd concentrations in the Kaoping and Pearl rivers are ~ 12 and ~370 pmol/kg, respectively (Chung et al., 2009; Ma et al., 2019). If we assume that 50–90% of river-borne REEs would be removed in low salinity areas (S< ~5‰) (Rousseau et al., 2015; Adebayo et al., 2018; Grenier et al., 2022), the remaining Nd concentrations supplied by the Kaoping and Pearl rivers would range from 1.2 to 6, and from 37 to 185 pmol/kg, respectively. The total dissolved Nd inputs from these rivers to the SCS were calculated. The runoff in the regions of Taiwan Island and South China are ~16.5 × 10⁶ and ~355 × 106 tons/yr, respectively (Milliman and Farnsworth, 2011; Liu et al., 2016, and references therein). The result shows that the contributions of Nd from rivers after removal in estuarine areas range from 0.003 to 9 tons/yr, which are lower than the required Nd addition (53 ± 9 tons/yr) as estimated in section 5.3.1 (Table 2). In addition, the dissolved REE pattern of the Pearl River, characterized by significantly higher Nd concentration compared to the Kaoping River, does not show MREE enrichment as observed in the SCS surface water (Figure 5). This indicates that the effect of riverine dissolved Nd inputs on the SCS is possibly limited.
Figure 5
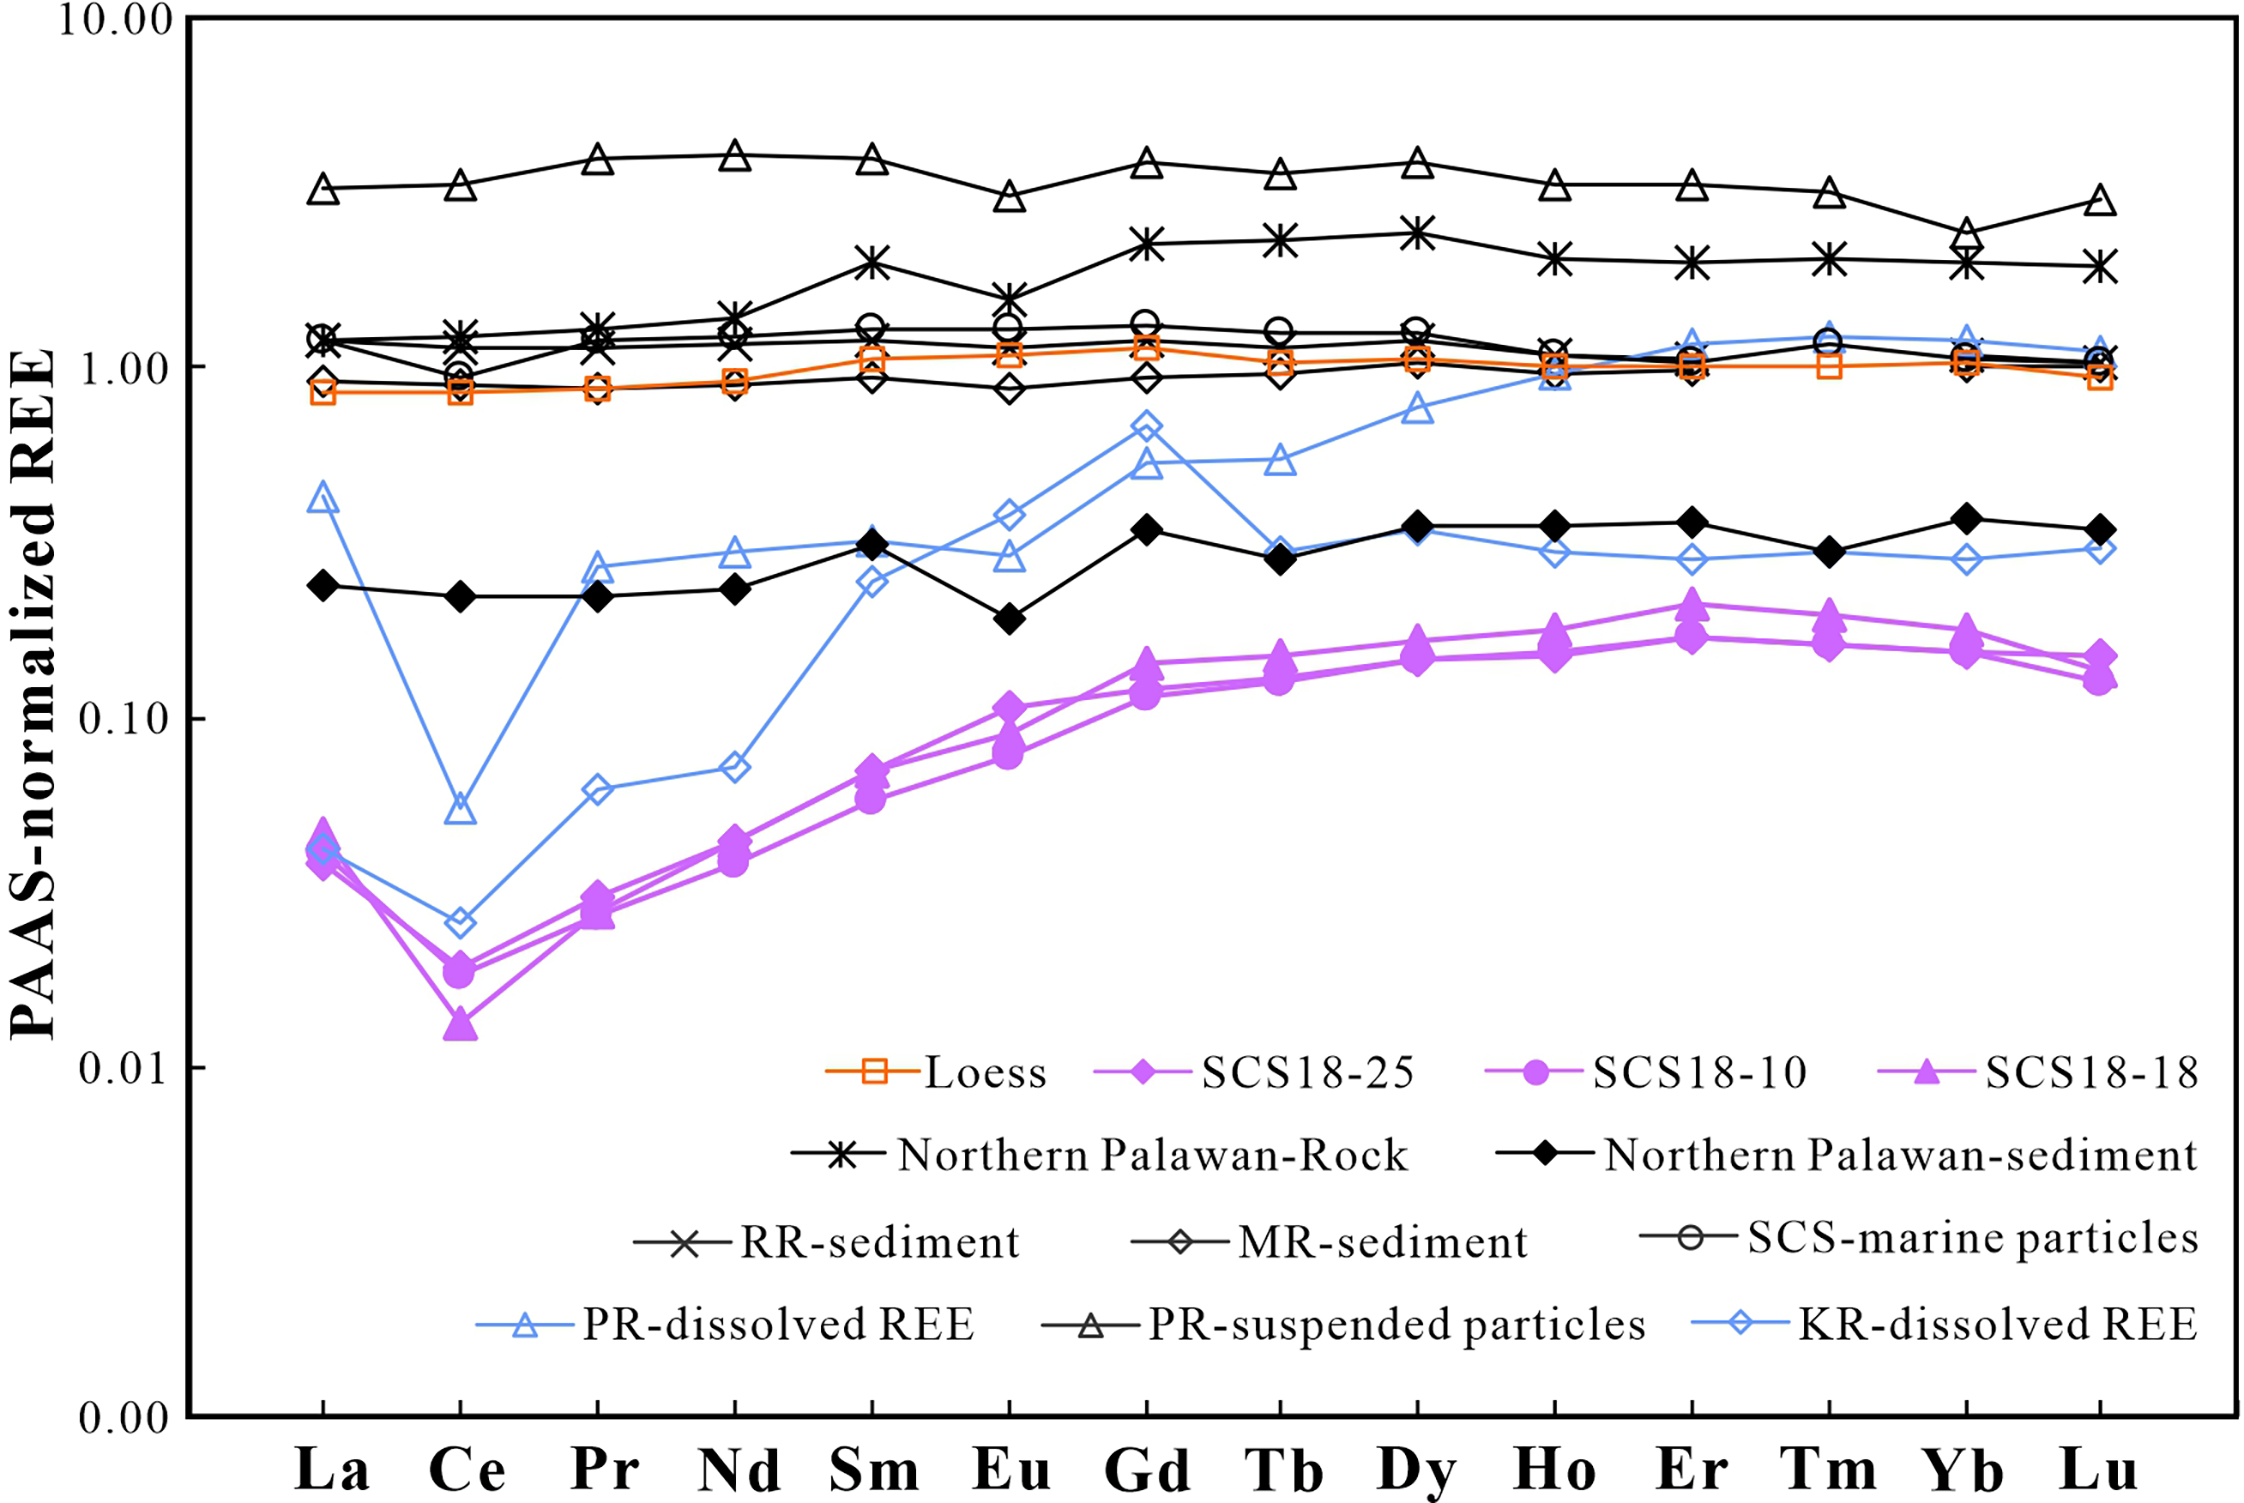
PAAS-normalized REE patterns of surface water in the SCS (× 106), Pearl River (PR) water (× 1; NA: 22.53° N, 113.49° E) and PR suspended particles (× 10−3; L7: 22.06° N, 113.50° E) (Ma et al., 2019), Kaoping River (KP) water (× 102; KP3) (Chung et al., 2009), Red River sediment (RR, × 10−3; 20: 20.26° N, 106.52° E) (Bayon et al., 2015), loess (× 10−3; Ding et al., 2001), northern Palawan rock (× 10−3) and sediment (× 10−3) (Padrones et al., 2017), Mekong River sediment (MR, × 10−3; 12: 10.96° N, 105.06° E) (Bayon et al., 2015), and northern SCS sinking particles (× 10−3; SCS-NW-1: 17.43° N, 110.67° E) (Liu et al., 2018).
Table 2
| Initial | Flow magnitude | Final | ϵNd of | FAddition | FRemoval | |||
|---|---|---|---|---|---|---|---|---|
| ϵNd (± 2δ) | [Nd] (± 2δ) | (106 m3/s) | ϵNd (± 2δ) | [Nd] (± 2δ) | source | (tons Nd/yr) | (tons Nd/yr) | |
| < 50 m (summer)a |
−6.7 ± 0.3 (SCS18-25) |
9.93 ± 0.32 (SCS18-25) |
0.3 | −2.8 ± 0.4 (SCS18-18) |
9.75 ± 0.45 (SCS18-18) |
0.6 | 15 ± 3 | 16 ± 3 |
| 7.1 | 5 ± 1 | 5 ± 1 | ||||||
| < 50 m (winter)b |
−2.9 ± 0.5 (St5) |
2.84 ± 1.1 (St5) |
1 | −7 ± 0.3 (St13) |
11.24 ± 0.66 (St13) |
−8 | 53 ± 9 | 15 ± 9 |
| > 1500 mc | −3.6 ± 0.4 (St3) |
27.19 ± 0.33 (St3) |
1.6 | −3.8 ± 0.3 (St13) |
32.84 ± 0.29 (St13) |
−4.3 | 81 ± 13 | 41 ± 14 |
Estimated Nd inputs from surrounding rivers.
Initial and final ϵNd and Nd concentration data are from this study. Flow magnitude of surface water from the Luzon Strait is from Gan et al. (2016). ϵNd values of river sediment sources are from Wei et al. (2012).
Initial and final ϵNd and Nd concentration data are from Wu et al. (2015). Flow magnitude of surface water from the Luzon Strait is from Gan et al. (2016). ϵNd values of river sediment sources are from Wei et al. (2012).
Initial and final ϵNd and Nd concentration data are from Wu et al. (2015). Flow magnitude of deep water from the Luzon Strait is from Zhao et al. (2014). ϵNd values of river sediment sources are from Wei et al. (2012).
Another potential factor that could influence the REE pattern of SCS surface water is the dissolution of deposited Asian dust. It has been suggested that the dust deposition flux decreases rapidly from the coastal area to open ocean in the North Pacific region (Uematsu et al., 2003). The estimated dry and wet depositions of dust to the SCS are ~1.3×10⁶ and ~0.6×10⁶ tons/yr, respectively (Uematsu et al., 2003). If the dissolution efficiency of the atmospheric particles (Nd concentration: ~29.5 μg/g; Ding et al., 2001) is similar to basaltic particulate materials (~0.4%; Pearce et al., 2013), the net Nd contributions of the total atmospheric deposits to the SCS surface water are from 0.02 to 0.1 tons/yr, which are negligible compared to the required Nd inputs (53 ± 9 tons/yr; Table 2).
Furthermore, a plot of MREE/MREE* versus ϵNd (Figure 6) was used to assess the extent to which these external sources could influence the surface-water REEs, particularly ϵNd, from the northern to southern SCS. The SCS surface data in this and previous studies were compared with those of surface water in the West Pacific, sediments offshore from southern Luzon, and sinking particles collected by sediment traps in the northern SCS (Amakawa et al., 2000; Wei et al., 2012; Wu et al., 2015; Behrens et al., 2018b; Liu et al., 2018). Clearly, the MREE/MREE* values of the SCS surface water are higher than those of the West Pacific surface water (Figure 6). MREE enrichment of seawater has been documented and linked to the chemical weathering of phosphate minerals and interaction with sediment and/or suspended particles (Sholkovitz et al., 1999; Pearce et al., 2013; Crocket et al., 2018; Molina-Kescher et al., 2018). The higher MREE/MREE* values in the SCS surface water compared with those in the West Pacific indicate that the addition of MREEs may be associated with lithogenic inputs, which could preferentially release MREEs into seawater. However, most MREE/MREE* values of the SCS are also higher than those of offshore Luzon sediments and the northern SCS sinking particles (Figure 6), the contributions from these external sources are possibly not sufficient to explain this difference. There might be other fractionation processes involved to generate MREE enrichments in the SCS surface water.
Figure 6
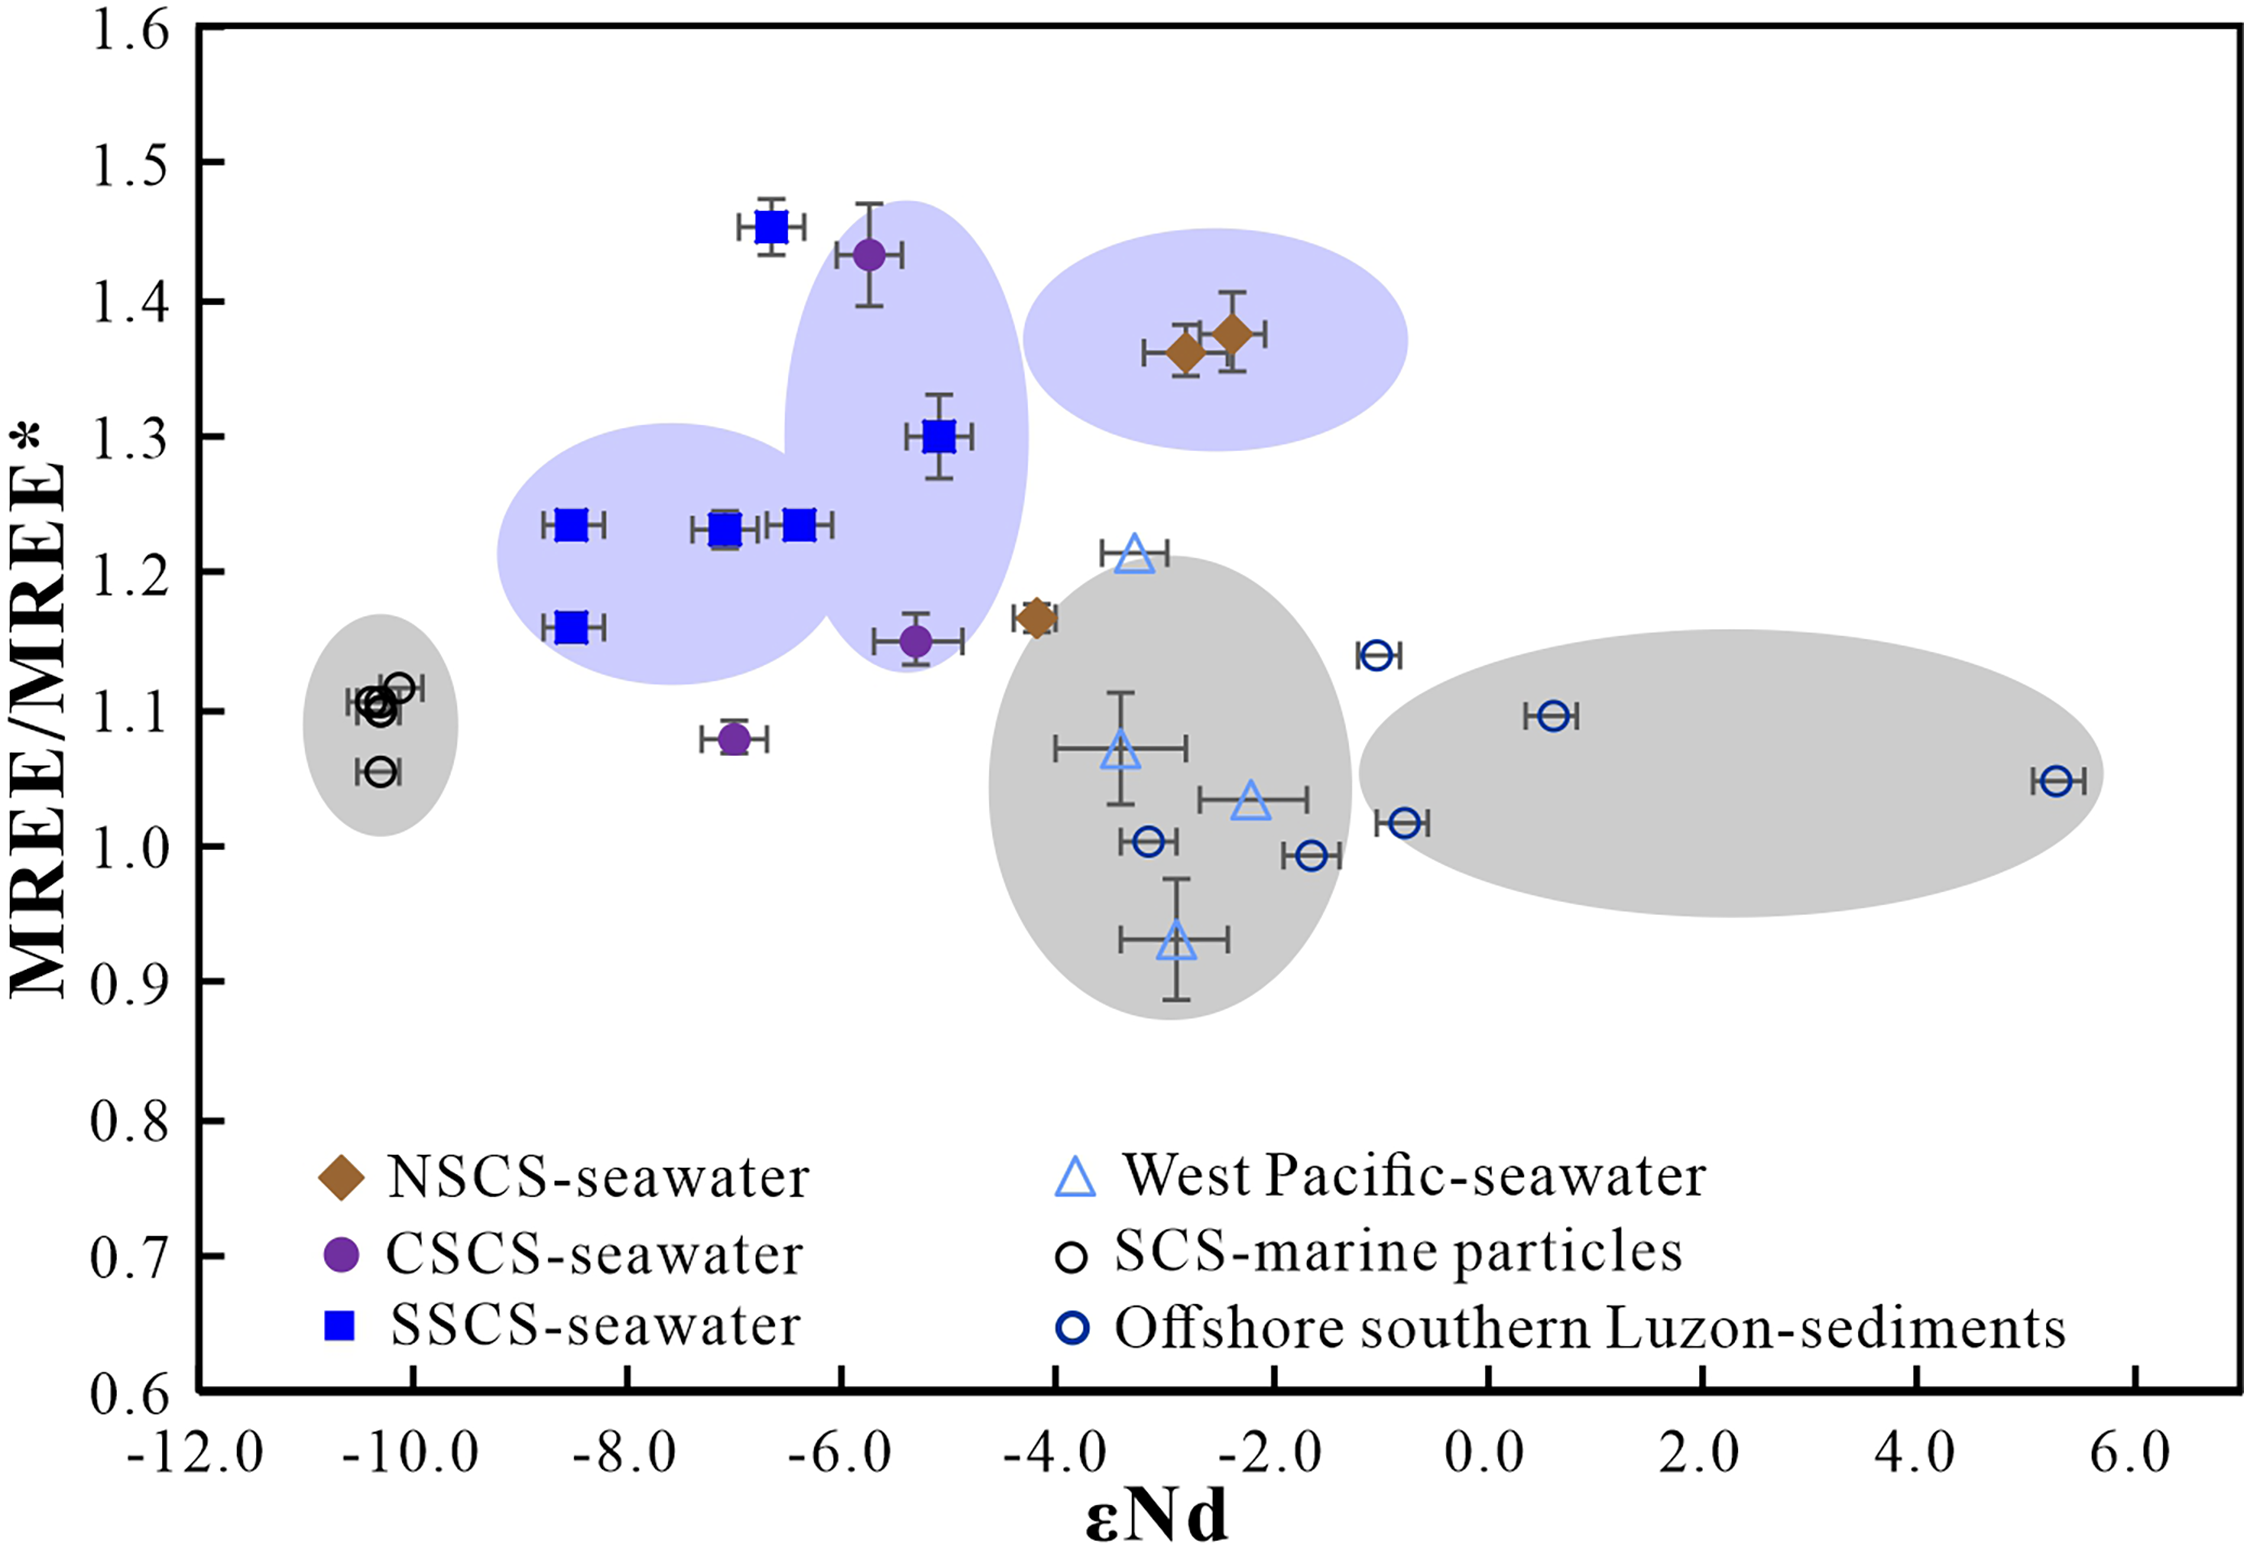
Plot of MREE/MREE* vs. ϵNd values for West Pacific seawater, SCS seawater, offshore southern Luzon sediments, and the SCS sinking particles (Amakawa et al., 2000; Wei et al., 2012; Wu et al., 2015; Behrens et al., 2018b; Liu et al., 2018). MREE/MREE* = 2 × (Gd + Tb + Dy)/(La + Pr + Nd + Tm + Yb + Lu) (All REEs are PAAS-normalized; Martin et al., 2010).
In terms of ϵNd, the SCS surface water are generally characterized by less radiogenic Nd than West Pacific surface water. In the West Pacific, the surface-water ϵNd values range from −3.5 to 1.6 owing to the influence of volcanic materials (Grenier et al., 2013; Behrens et al., 2018b). The SCS surface water is characterized by large variations in ϵNd (−7 to −3; Figure 6). Strongly negative ϵNd values of surface water (< −5) are mainly found in the central and southern SCS, and these are more negative than those in the northern SCS and West Pacific (> −3.5; Wu et al., 2015; Behrens et al., 2018b). As there is no dissolved ϵNd data reported for riverine inputs, we cannot assess the Nd contribution of river water to SCS surface water. However, river sediments surrounding the SCS have ϵNd values of −13.5 to −9.9, except for those of Luzon Island (ϵNd: 6.4−7.1; Goldstein and Jacobsen, 1988; Wei et al., 2012, and references therein). The sinking particles obtained from the northern SCS sediment trap are also characterized by negative ϵNd values of −10 (Liu et al., 2018). We suspect that there is a modification of the ϵNd of West Pacific surface inflow caused by terrigenous inputs, which are characterized by more positive ϵNd values of ~7 in Luzon Island and more negative ϵNd values of ~−10 in the northern SCS (Goldstein and Jacobsen, 1988; Wei et al., 2012, and references therein). This might also explain the observed southward decrease in surface-water ϵNd from the northern to southern SCS (Figure 7).
Figure 7
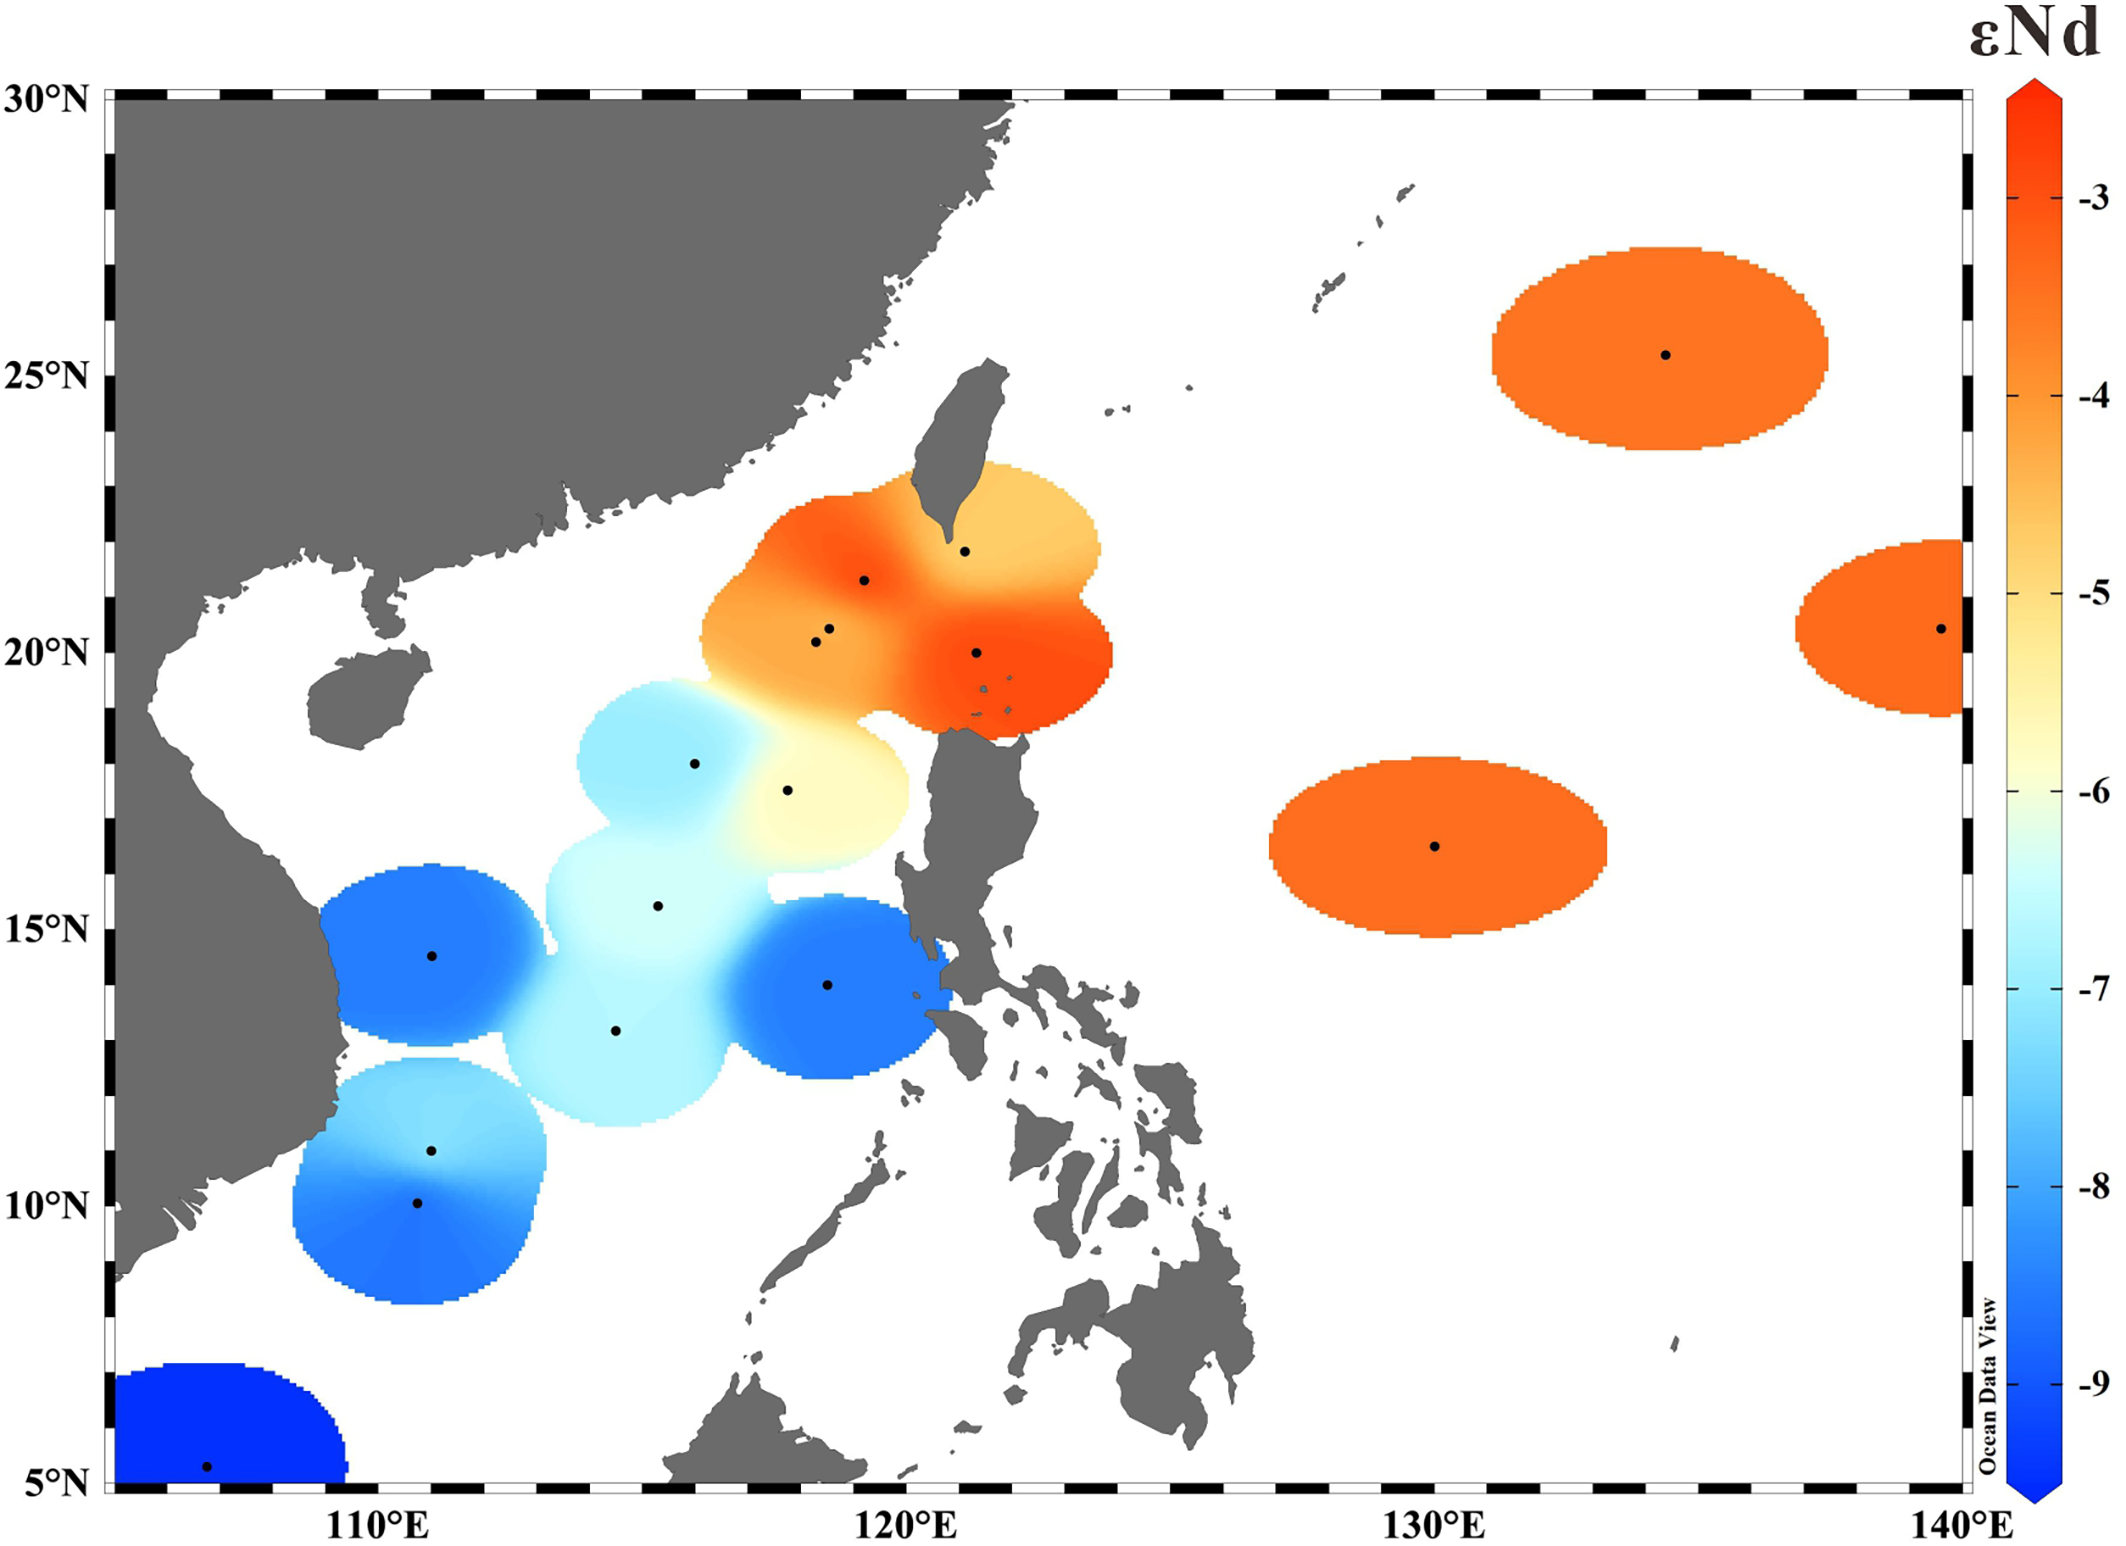
Distribution of surface water ϵNd in the SCS and West Pacific. Data sources: this study, Amakawa et al. (2000); Wu et al. (2015), and Behrens et al. (2018b). The figure was created using Ocean Data View (Schlitzer, 2014).
This spatial pattern agrees with previous studies showing the most negative ϵNd in the southern SCS and the most positive ϵNd in the vicinity of Luzon Island in the north (Amakawa et al., 2000; Wu et al., 2015; Figure 7). The less negative ϵNd in the northern SCS compared with the southern SCS possibly results from the influence of advection of the NPTW, which is characterized by ϵNd signatures of −3.1 to −1.7 (Behrens et al., 2018b). Meanwhile, the contribution of lithogenic inputs from Luzon Island, characterized by radiogenic Nd isotopic composition (ϵNd > 6) and relatively enriched MREEs, could also modify the ϵNd of surface water in the northern SCS (Goldstein and Jacobsen, 1988; Padrones et al., 2017; Figure 6). For the southern SCS, the negative ϵNd values are probably related to the dissolution of particles from the Pearl River, which mainly supplies sediments to the southwest of the northern SCS (Shao et al., 2009). Overall, the ϵNd values of SCS surface water become more negative with increased distance from the Luzon Strait (Figure 7). The northeast-southwest decreasing contribution of particle dissolution from Luzon Island (ϵNd: ~7) and the increasing contribution of the northern SCS river sediments (ϵNd: ~–10) might result in such persistent changes in SCS surface-water ϵNd.
Combining basin-wide surface-water MREE/MREE* values with our newly obtained SCS seawater ϵNd data, our results suggest an important role of terrigenous inputs in controlling surface-water ϵNd and emphasize the need for the investigation of whether such MREE enrichments can result from the dissolution of these particulate sources. Other possible explanations of MREE enrichments are explored below.
5.2 Seasonal variation in REEs in the SCS
We compiled published REE data from the SCS and West Pacific to better understand the exchange of REEs between the marginal sea and open ocean (Alibo and Nozaki, 2000; Wu et al., 2015; Behrens et al., 2018a). High-resolution vertical profiles of PAAS-normalized seawater MREE/MREE*, MREE/HREE, and Nd/Yb ratios for the SCS and West Pacific are shown in Figure 8. All seawater samples investigated in this study were collected in late April and May, 2018, when the southwest summer monsoon starts to prevail in the SCS, whereas seawater samples at stations St5, St13, and PA11 were collected during the period in which the northeast winter monsoon intensifies (Alibo and Nozaki, 2000; Wu et al., 2015). Accordingly, our data compilation allows potential seasonal variability to be assessed.
Figure 8
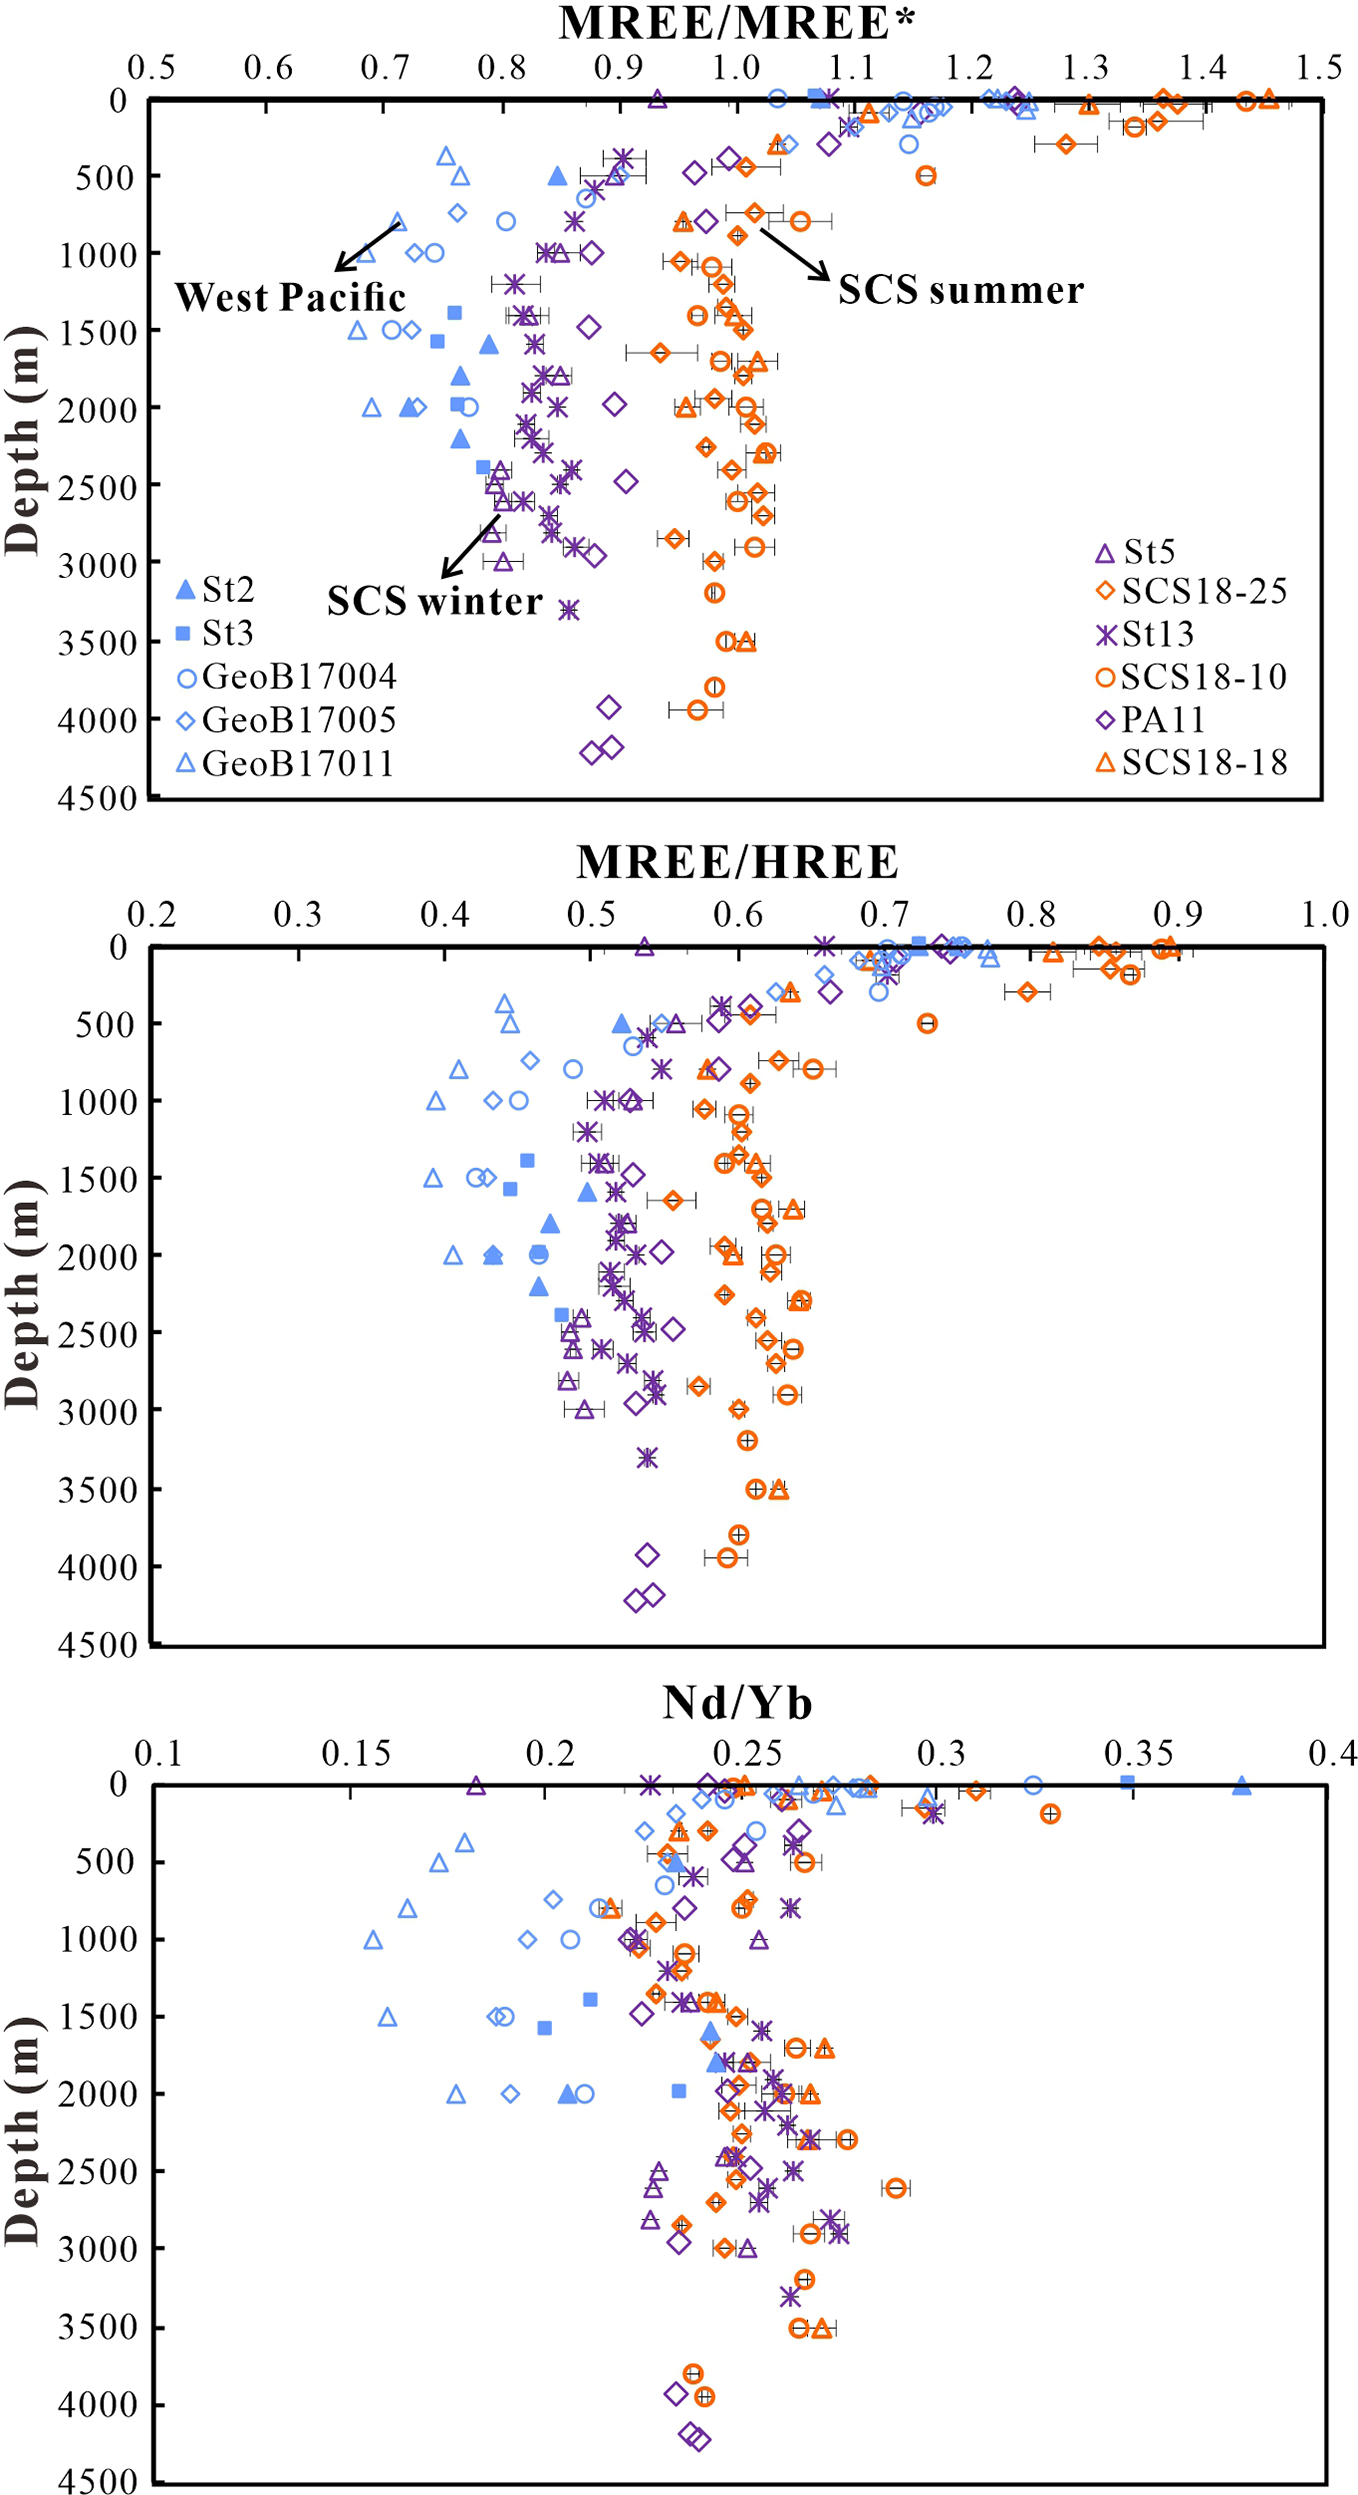
Vertical distribution of MREE/MREE*, MREE/HREE, and Nd/Yb ratios in the SCS (this study; Wu et al., 2015) and West Pacific (Behrens et al., 2018a). MREE/HREE is calculated using: MREE/HREE = (Gd + Tb + Dy)/(Tm + Yb + Lu).
Overall, the vertical profiles of MREE/MREE*, MREE/HREE, and Nd/Yb ratios show a decrease from a maximum at the surface to a minimum at approximately 1000 m depth, followed by an increase, reaching another maximum at approximately 2000−3000 m depth.
Of particular interest is a clear seasonal variability in the vertical distribution of MREE/MREE* and MREE/HREE ratios within the SCS (Figure 8), with higher values for the samples collected in summer (MREE/MREE*: 1.0 to 1.4) and lower values for those collected in winter (MREE/MREE*: 0.8 to 1.2) (Alibo and Nozaki, 2000; Wu et al., 2015). Notably, the SCS samples collected in winter show similar ratios of MREE/MREE* and MREE/HREE to those of the West Pacific. However, there is no discernable seasonal variation in Nd/Yb ratios, suggesting that LREEs vary similarly to HREEs between summer and winter (Figure 8). In the following, we attempt to explain the observed vertical distributions of MREE/MREE*, MREE/HREE, and Nd/Yb ratios in the SCS.
First, the seasonal variations may be associated with the enhanced inflow from the West Pacific to the SCS in winter, which is characterized by relatively low MREE/MREE* and MREE/HREE ratios compared with those found in the SCS in summer. Specifically, the upper layer of the SCS is strongly fed (3.5–10 Sv) by West Pacific water through the Luzon Strait when the northeast monsoon prevails over the SCS (i.e., in winter); while in summer, the upper layer water in the SCS outflows to the West Pacific (~5 Sv) (Tian et al., 2006; Yang et al., 2010; Gan et al., 2016). In this case, the seasonal variabilities in MREE/MREE* and MREE/HREE ratios might reflect the variations of the water-mass mixing between the West Pacific and SCS. However, Nd/Yb ratios in the SCS do not show significant changes between summer and winter, but are higher than those in the West Pacific, suggesting that the mixing of West Pacific and SCS water masses cannot be fully responsible for the seasonal MREE/MREE* variations in the SCS.
Second, the observed seasonal variations in MREE/MREE* and MREE/HREE ratios could be related to lithogenic inputs and the associated preferential removal of LREEs and MREEs by particles. Sediment trap data from the northwest SCS have shown three peaks of lithogenic flux during August 2012, October 2012, and February 2013, while the flux is relatively low in May (Zhang et al., 2018). A potential release of LREEs and MREEs from sediment to the water column has been suggested (Crocket et al., 2018; Molina-Kescher et al., 2018). If the higher lithogenic inputs in winter are sources of MREEs in the SCS, the results would be contrary to those observed for MREE/MREE* and MREE/HREE (i.e., lower values in winter compared with summer). In contrast, lithogenic inputs could also be a sink for LREEs and MREEs because these elements are more easily adsorbed to particles and surface coatings (i.e., iron-oxide) compared with HREEs (Elderfield, 1988; Sholkovitz et al., 1994). Various inorganic and biogenic phases can remove LREEs and MREEs in the Kerguelen Plateau area (Grenier et al., 2018). However, a preferential scavenging of LREEs and MREEs by lithogenic inputs is not supported by the similar distribution patterns of Nd/Yb ratios between summer and winter in the SCS.
A third possible explanation is the release of MREEs from surface coatings (i.e., iron-oxide) affiliated to particles caused by seasonal changes in dissolved oxygen content. Surface coatings, such as iron-oxides, can preferentially scavenge LREEs and MREEs in the surface ocean and preferentially release them in deep water layers (Sholkovitz et al., 1994). Meanwhile, the desorption of MREEs from iron-oxides is likely sensitive to environmental oxygen content (Haley et al., 2004). In the SCS, the water oxygen content in summer is lower than that in winter owing to the reduced inflow of deep water with a relatively high oxygen content from the West Pacific (Lin and Han, 1997; Li and Qu, 2006; Wang et al., 2018; Figure S2). Such an oxygen-depleted environment might favor the release of MREEs adsorbed to preformed iron-oxide into the water column, leading to higher MREE/MREE* and MREE/HREE ratios in summer compared with winter (Figure 8).
The inferred seasonal pattern in oxygen content may be strengthened by an enhanced primary productivity in summer compared with winter, as higher productivity would consume more dissolved oxygen for the degradation of organic matters settling down through the water column. However, the seasonal change in primary productivity remains a matter of debate. A higher productivity in summer has been attributed to increased river discharge and coastal upwelling related to the Asian summer monsoon (Song et al., 2012; Xie et al., 2020). In contrast, evidence from particulate organic carbon fluxes suggests a higher productivity in the central SCS in winter, rather than summer, owing to stronger vertical mixing induced by the northeast monsoon (Chen et al., 1998; Li et al., 2017). Besides, the seasonal changes in oxygen concentrations in the SCS are not significant (Figure S2), with respect to seasonality, further studies on the relationship between changes in dissolved MREEs and oxygen content are required.
Fourth, microbial activity may also affect the distribution of MREEs in the SCS. It was implied that microbes (e.g., microbial siderophores) can complex REEs and may affect the fractionation of REEs through iron cycling in the ocean (Haley et al., 2014). In the Gulf of Alaska, the “bio-reactive” REE group shows different REE patterns from those of “passive” REE group. The MREE/MREE* of “bio-reactive” group is ~1.2, which is higher than the latter group (~1.0) (Haley et al., 2014). The preferentially adsorption of HREEs by organically bound Fe, via microbial mediation, may result in the relative MREE enrichments in seawater.
Indeed, it has been suggested that relatively high temperature (~25 °C) and moderate pH (~7.5) would favor bacterial growth; when the pH is ~8.5, the bacterial growth decreased quickly (Sinha and Parli, 2020). A recent study on the Canadian Arctic Archipelago indicated that the pH and dissolved organic carbon concentration could partly influence the dissolved REE concentrations in rivers (Grenier et al., 2022).
In the SCS, bacterial production grew fast due to the increases in bacterial abundance and dissolved organic carbon inputs in summer (Xu et al., 2018). The surface water pH in summer (~7.6) is generally lower than in winter (~8.1) (Liu et al., 2014). The low pH in summer might also enhance bacterial growth including the siderophores production. It is likely that both lower pH and more dissolved organic carbon inputs in summer may result in the MREE enrichments of surface water as observed in this study. But note that, the available data are very scarce and mostly limited to the upper layer of the water column (Chen et al., 2021). The association between the MREE enrichment and microbial activity in the SCS requires to be better constrained.
As discussed above, although the seasonal variations in MREE/MREE* and MREE/HREE ratios in the SCS is clear, it could not be explained by a single factor alone. It seems that MREE/MREE* vary distinctly from LREEs and HREEs. However, as seawater samples in this and previous studies were collected in different years and the locations are slightly different (Alibo and Nozaki, 2000; Wu et al., 2015; Behrens et al., 2018b), it is uncertain that if the physical properties of seawater were changed in different years. Further investigations are highly required to unravel and better understand the underlying processes leading to the MREE enrichments observed for the SCS.
5.3 Processes influencing the εNd distribution in the SCS
5.3.1 Factors influencing the ϵNd of the SCS upper 200 m
Figure 9 presents the comparison of the ϵNd between the SCS and Northwest Pacific (Wu et al., 2015; Behrens et al., 2018b). For the upper 200 m, the ϵNd values of the central SCS (−6.7 to −4.2) are more negative than those in the Northwest Pacific (−3.5 to −2.2) and northern SCS (−2.8 to −2.4; Figures 9B, D). The subsurface-water ϵNd values in the central SCS are more negative compared to those of the northern SCS (Figures 9B, D).
Figure 9
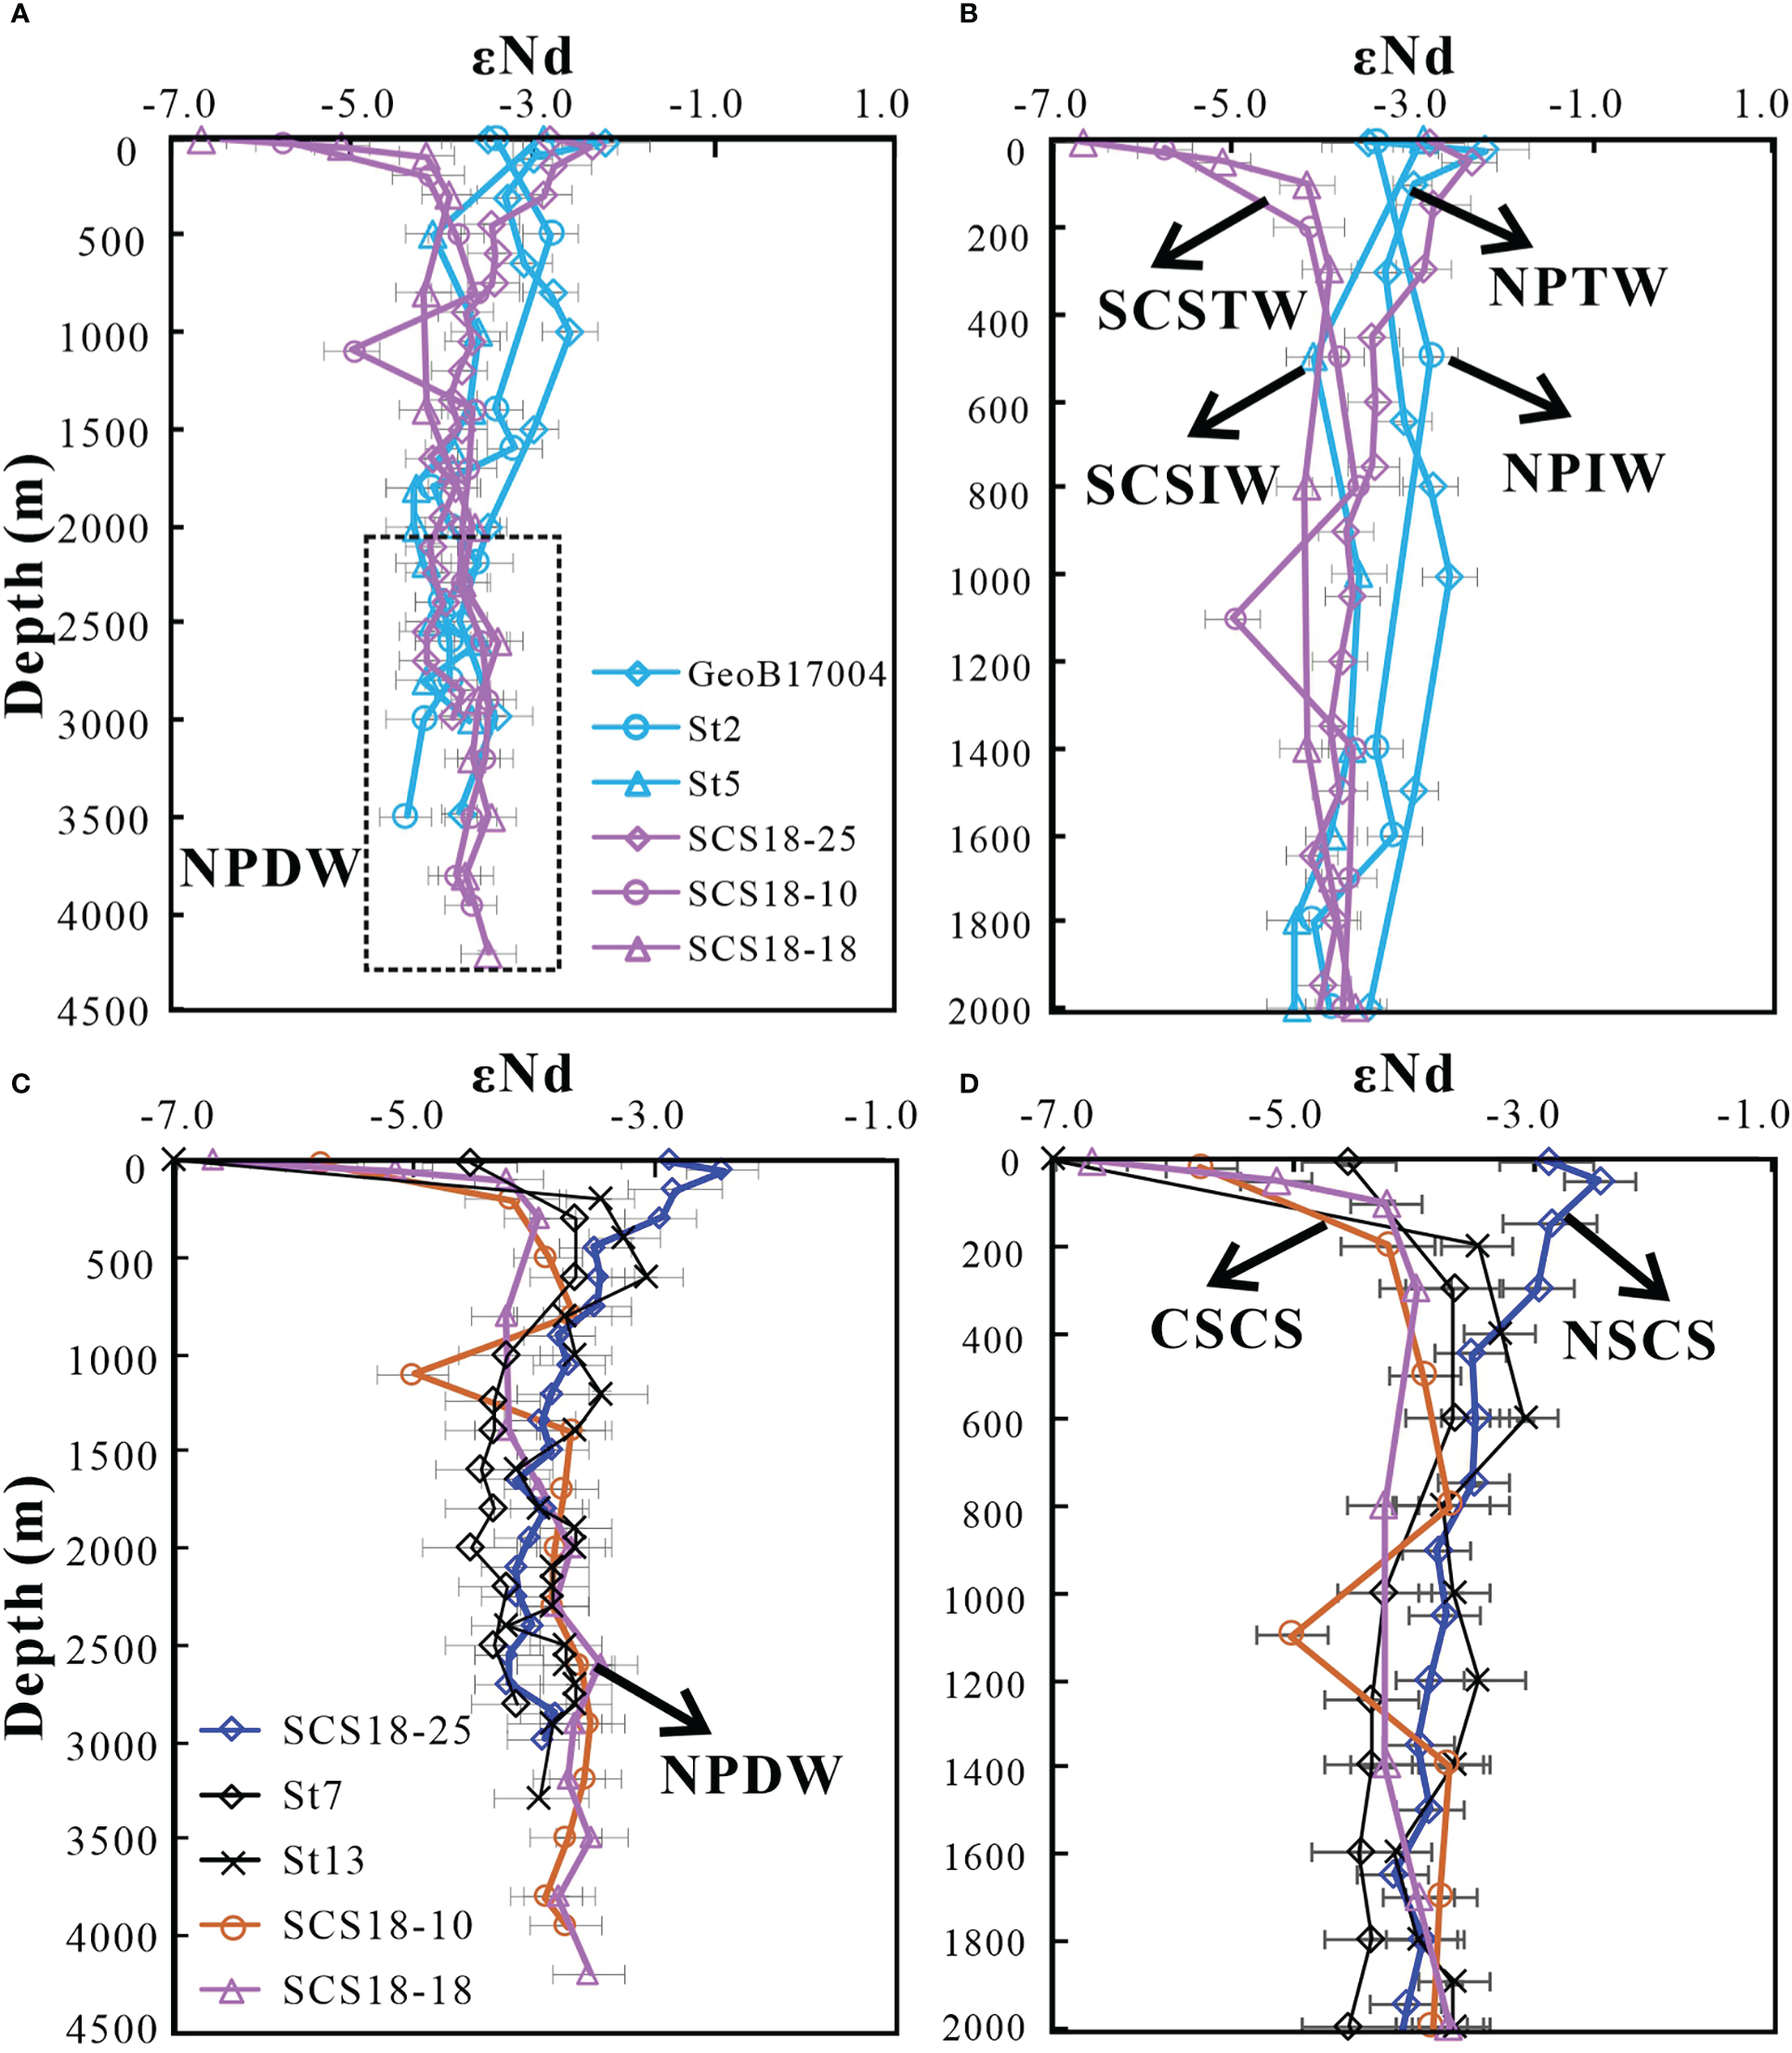
Comparisons of ϵNd vertical profiles between the SCS and the North Pacific (A, B), and within the SCS (C, D). ϵNd values of the North Pacific are from Wu et al. (2015); Behrens et al. (2018b).
Modifications of seawater Nd isotopic signatures through continental inputs have been observed in several oceanic regions, especially near basaltic continental margins (Grasse et al., 2012; Grenier et al., 2013; Yu et al., 2017; Behrens et al., 2018b). In the northern SCS, sedimentary ϵNd values of the surrounding rivers range from −13.5 to −10.2, except for the more positive values obtained from the Luzon Island (0.6–7.1; Goldstein and Jacobsen, 1988; Wei et al., 2012 and references therein). Assuming that the shift in ϵNd from the northern to southern SCS surface/subsurface water are associated with the Nd released from suspended and sinking particles supplied by continental margins and river discharge, we attempted to calculate the Nd fluxes in the SCS. The calculation was performed using the following equations (1) and (2), defined by Lacan and Jeandel (2005). Fw and FNd refer to the flow magnitude of current (Sv, 106 m3/s) and Nd flux, respectively. Initial and Final refer to measured parameters of upstream and downstream, respectively. Addition and Removal refer to fluxes from the external sources to the water mass and leaving the water mass, respectively.
The parameters were setup as follows: for the upper 50 m, the flow magnitude from the Luzon Strait to the SCS is approximately 0.3 Sv in summer and 1 Sv in winter. This setup is based on the simulated net transport and volume flux through the Luzon Strait (Gan et al., 2016). The flow magnitude of deep water across the Luzon Strait is ~1.6 Sv (Zhao et al., 2014).
Because there is no surface-water ϵNd data reported for the West Pacific in summer and the surface water outflow from the SCS to the West Pacific, we took the surface-water ϵNd and Nd concentrations from the southernmost (SCS18-18) and northernmost (SCS18-25) stations as the initial and final values, respectively (Table 2). The Nd from the Luzon Island (ϵNd: 0.6–7.1) is the only external source that could provide radiogenic Nd to the SCS (Goldstein and Jacobsen, 1988; Wei et al., 2012 and references therein). In the winter season, surface-water ϵNd and Nd concentrations from the Luzon Strait (St5, initial station) and central SCS (St13, final station) were used for calculation. To obtain the valid Nd addition and Nd removal (> 0) in the SCS, the ϵNd of external sources should range from –8.5 to –7.3 (average ~–8). This external ϵNd source is the result of mixing of ~75% of less radiogenic ϵNd (average ϵNd in Taiwanese and Pearl rivers sediments: ~–12) and ~25% of more radiogenic ϵNd (average ϵNd in Luzon Island sediments: +4) (Goldstein and Jacobsen, 1988; Wei et al., 2012 and references therein).
In summer, the Nd flux of the surface water from SCS18-25 to SCS18-18 was estimated as 5 to 15 tons/yr for Nd addition, and 5 to 16 tons/yr for Nd removal (Table 2). In winter, the estimated Nd flux from the stations St5 to St13 in the SCS suggests a Nd addition/removal of ~53/~15 tons/yr. To evaluate the relative Nd contributions of external sources to the SCS surface water, we further assessed the Nd inputs from the river-borne Nd and the dissolution of riverine and marine particles. The efficiency of particle dissolution (~0.4%) and Nd removal (50–90%) in low salinity areas were taken into account when calculating the Nd inputs from particle dissolution (Pearce et al., 2013; Rousseau et al., 2015; Adebayo et al., 2018; Grenier et al., 2022).
Sedimentary Nd concentrations and the river discharge from the Luzon Island are ~50 μg/g and ~13 tons/yr, respectively (Milliman and Farnsworth, 2011; Padrones et al., 2017), the calculated Nd inputs from the dissolution of riverine particles range from ~0.26 to ~1.3 tons/yr. These values are smaller than the required Nd addition in summer (5 to 15 tons/yr), suggesting more contributions from other external sources. The runoff from the Luzon Island are 72 × 106 tons/yr, assuming that the Nd concentrations of river water from Luzon Island could be as high as those of Pearl River water (~370 pmol/kg), the contributions of dissolved Nd from Luzon Island rivers to the SCS surface water could be no more than ~1.8 tons/yr (Milliman and Farnsworth, 2011). The total Nd inputs (< 3.1 tons/yr) from the Luzon Island are still not sufficient to explain the required Nd inputs. The “missing” Nd inputs range from 2 to 12 tons/yr. We suspect that this “missing” Nd inputs might be from the dissolution of re-suspended particles from continental margins of the Luzon Island.
In winter, the required Nd addition is ~53 tons/yr (Table 2). The estimated Nd addition from the unradiogenic (e.g., Taiwanese and Pearl rivers) and radiogenic Nd (e.g., Luzon Island) are ~39.75 and ~13.25 tons/yr, respectively. Nd concentrations of sediments from the Taiwanese (176 × 106 tons/yr) and Pearl (102 × 106 tons/yr) rivers are ~40 and ~70 μg/g, respectively (Chung et al., 2009; Bayon et al., 2015; Ma et al., 2019). Thus, the Nd inputs to the SCS surface water through particle dissolution range from 5.6 to 28 tons/yr. The contributions of the remaining river-borne Nd (0.003 to 9 tons/yr) were also integrated, the total Nd inputs from these two external sources could be 6–37 tons/yr, which are smaller than the expected Nd addition from unradiogenic Nd (~39.75 tons/yr), especially when the strong Nd removal (~90%) take place. There is also a gap of ~10 tons/yr between the total Nd inputs (< 3.1 tons/yr) and the expected Nd addition (~13.25 tons/yr) from the Luzon Island. Such results indicate that the Nd inputs from the dissolution of re-suspended particles from continental margins (23–44 tons/yr) are required.
Overall, the Nd fluxes to the SCS surface water in both summer and winter imply that the dissolution of lithogenic inputs, including particles supplied by river and continental margins, may play an important role in modifying the surface ϵNd within the SCS.
5.3.2 Factors influencing the ϵNd of the intermediate and deep water in the SCS
For the intermediate water (300–1500 m), the ϵNd values in the central SCS are generally lower (−4.2 to −3.9) than those in the northern SCS (−3.8 to −2.9) and Northwest Pacific (−3.3 to −2.6; Wu et al., 2015; Behrens et al., 2018b; Figures 9A, C). We observed a negative excursion of seawater ϵNd at station SCS18-10 (−5.0 ± 0.3; Figures 3A, C) that was not accompanied by any change in the Nd concentration (Table 1). This is probably related to particle−seawater exchanges that mainly impact seawater Nd isotopic composition without altering seawater Nd concentration. This interpretation is supported by the transmissivity data showing a rapid decrease at ~1000 m depth at station SCS18-10, which indicates the existence of a nepheloid layer that contains a large volume of suspended particles (Figure S3).
Nevertheless, the ϵNd values of intermediate water in the central SCS are generally similar to those obtained from deep water in the northern SCS (−4.2 to −3.8; Figures 9A, C). Diapycnal mixing in the mid−deep SCS can reach up to 10−3 m2/s, which is sufficient to maintain a three-dimensional circulation in the mid−deep layer of the SCS (Wang et al., 2019, and references therein). The generally low ϵNd values in the central SCS compared with the northern SCS appear to be related to the three-dimensional overturning circulation (below ~500 m) of the SCS (Wang et al., 2016; Wang et al., 2019, and references therein), permitting the Nd isotopic composition of deep water in the northern SCS to be mixed with intermediate water in the central SCS.
Below 2000 m in the SCS, the εNd values generally range from –4.2 to –3.4, similarly to those at ~2000 m in the North Pacific (–3.9 to –3.5). This result is consistent with physical oceanographic studies, showing the predominance of NPDW in the SCS (Tian et al., 2006; Tian et al., 2009; Wang et al., 2019).
While the ϵNd values of deep layer (> 1500 m) are similar between the SCS and West Pacific, the SCS has higher Nd concentrations than the West Pacific. To understand the evolution of the Nd concentration and ϵNd from the West Pacific to the SCS, we also calculated the Nd flux of deep water in the SCS. Averaged ϵNd and Nd concentrations from stations St3 (1600–2000 m) and St13 (1600–3300 m) were set as the initial and final values, respectively. The required ϵNd of external sources ranges from ~–4.7 to ~–3.9 (average ϵNd: ~–4.3), as a result of the mixing of less radiogenic (ϵNd: ~–12) and radiogenic Nd (ϵNd: ~+4) (Goldstein and Jacobsen, 1988; Wei et al., 2012 and references therein). The relative contributions from the unradiogenic and radiogenic Nd are ~52% and ~48%, respectively (Goldstein and Jacobsen, 1988; Wei et al., 2012 and references therein). The estimated Nd addition to the SCS deep water is ~81 tons/yr (Table 2). Thus, the expected Nd inputs from the unradiogenic and radiogenic Nd are ~42 tons/yr and ~39 tons/yr, respectively. These values are larger than the total Nd inputs from the unradiogenic (e.g., Taiwanese and Pearl rivers: 6–37 tons/yr) and radiogenic Nd (e.g., Luzon Island: ~3.1 tons/yr). Such results imply that the Nd input from the SCS surrounding continental margins is required. Meanwhile, the Nd removal from the SCS deep water is ~41 tons/yr (Table 2). The net Nd addition to the SCS deep water is ~ 40 tons/yr, which could be the explanation for increased deep water Nd concentrations from the West Pacific to the SCS.
Our results indicate that the limited modification of deep-water ϵNd is probably related to the similar ϵNd between the mixed external sources and the SCS deep water that could contribute to the increased Nd concentration without altering the ϵNd of deep water.
6 Conclusions
We present seawater REE and Nd isotope data from four stations collected in the South China Sea (SCS). Along with previous results, this study provides a better understanding of the behavior of dissolved REEs and Nd isotopes as they are transported from the West Pacific to SCS. The major conclusions drawn are as follows:
(1) Our data reveal a general increase in REE concentrations with depth, except for surface water and bottom water. The relatively high REE concentrations and low ϵNd values in surface water compared with subsurface water in the SCS are possibly linked to the dissolution of particles from surrounding rivers and continental margins. The relatively low ϵNd values in the SCS surface and subsurface water in the areas away from the Luzon Strait, when compared with those in the West Pacific, likely reflect the decreasing influence of the Luzon Island and increasing influence of the Taiwan Island and South China.
(2) Seasonal variations in the vertical distributions of MREE/MREE* and MREE/HREE are clearly observed, while the Nd/Yb ratios are similar between summer and winter. The features suggest that LREEs and HREEs vary similarly while MREEs vary distinctly from LREEs and HREEs. The fractionation processes affecting MREE enrichments in the SCS (e.g., particle dissolution/scavenge, oxygen content variation, and microbial activity) need to be further studied in future.
(3) The differences in intermediate-water εNd values between the northern and central SCS are most likely related to the basin-scale three-dimensional overturning circulation that introduces the deep-water ϵNd signature from the northern SCS to intermediate water in the central SCS. Our results show a relatively constant value of ~–3.8 for the SCS deep water, confirming the predominance of the NPDW in the deep SCS (Wu et al., 2015; Behrens et al., 2018b).
(4) Based on the present and previous data along with the relevant knowledge, we calculated the Nd contributions from major external sources, and the Nd exchanges between seawater and particles were quantitatively estimated for the SCS basin. We find that in addition to riverine particles, the dissolution of re-suspended particles from continental margins could be an important external source of Nd to the SCS. The limited modification of deep-water ϵNd by particle–seawater interaction during the propagation of deep water from the West Pacific to the SCS is likely related to the similar ϵNd between the mixed external sources and the SCS deep water.
Statements
Data availability statement
The datasets presented in this study can be found in online repositories. The names of the repository/repositories and accession number(s) can be found below: www.pangaea.de, https://doi.pangaea.de/10.1594/PANGAEA.943241.
Author contributions
QW, ZL, and CC designed the research and wrote the draft of the manuscript with contributions from ED and JW. YZ and PM collected seawater samples. QW, YH, AD, and LB performed Nd isotope and REE concentration analyses. All authors contributed to the data interpretation and writing the manuscript.
Funding
This research was supported by National Natural Science Foundation of China (Nos. 42176058, 42130407, and 41506057), Open Fund of the Key Laboratory of Marine Geology and Environment, Chinese Academy of Sciences (No. MGE2019KG12), and the Labex L-IPSL (No. ANR-10-LABX-0018).
Acknowledgments
We thank the scientific team, captain and crew of R/V Jiageng for their collaboration during sampling. We also thank Xiaodong Zhang for his assistance with seawater pretreatment in the laboratory. We are grateful to two reviewers who provided valuable views during our previous submission. We kindly thank the Editor Dr. Hathorne for his efforts to handle this manuscript and all the reviewers including two ones for their constructive suggestions that helped us to improve our present manuscript.
Conflict of interest
The authors declare that the research was conducted in the absence of any commercial or financial relationships that could be construed as a potential conflict of interest.
Publisher’s note
All claims expressed in this article are solely those of the authors and do not necessarily represent those of their affiliated organizations, or those of the publisher, the editors and the reviewers. Any product that may be evaluated in this article, or claim that may be made by its manufacturer, is not guaranteed or endorsed by the publisher.
Supplementary material
The Supplementary Material for this article can be found online at: https://www.frontiersin.org/articles/10.3389/fmars.2022.1003749/full#supplementary-material
References
1
Abbott A. Haley B. McManus J. (2016). The impact of sedimentary coatings on the diagenetic Nd flux. Earth Planet. Sci. Lett.449, 217–227. doi: 10.1016/j.epsl.2016.06.001
2
Abbott A. Haley B. McManus J. Reimers C. (2015). The sedimentary source of dissolved rare earth elements to the ocean. geochim. Cosmochim. Acta154, 186–200. doi: 10.1016/j.gca.2015.01.010
3
Adebayo S. Cui M. Hong T. White C. Martin E. Johannesson K. (2018). Rare earth elements geochemistry and Nd isotopes in the Mississippi river and gulf of Mexico mixing zone. Front. Mar. Sci.5. doi: 10.3389/fmars.2018.00166
4
Akagi T. (2013). Rare earth element (REE)–silicic acid complexes in seawater to explain the incorporation of REEs in opal and the “leftover” REEs in surface water: new interpretation of dissolved REE distribution profiles. Geochim. Cosmochim. Acta113, 174–192. doi: 10.1016/j.gca.2013.03.014
5
Alibo D. S. Nozaki Y. (2000). Dissolved rare earth elements in the south China Sea: Geochemical characterization of the water masses. J. Geophys. Res. Oceans105, 28771–28783. doi: 10.1029/1999JC000283
6
Amakawa H. Alibo D. S. Nozaki Y. (2000). Nd Isotopic composition and REE pattern in the surface waters of the eastern Indian ocean and its adjacent seas. Geochim. Cosmochim. Acta64, 1715–1727. doi: 10.1016/S0016-7037(00)00333-1
7
Bayon G. Toucanne S. Skonieczny C. André L. Bermell S. Cheron S. et al . (2015). Rare earth elements and neodymium isotopes in world river sediments revisited. Geochim. Cosmochim. Acta170, 17–38. doi: 10.1016/j.gca.2015.08.001
8
Behrens M. K. Pahnke K. Cravatte S. Marin F. Jeandel C. (2020). Rare earth element input and transport in the near-surface zonal current system of the tropical Western pacific. Earth Planet. Sci. Lett.549, 116496. doi: 10.1016/j.epsl.2020.116496
9
Behrens M. K. Pahnke K. Paffrath R. Schnetger B. Brumsack H. J. (2018a). Rare earth element distributions in the West pacific: trace element sources and conservative vs. non-conservative behavior. Earth Planet. Sci. Lett.486, 166–177. doi: 10.1016/j.epsl.2018.01.016
10
Behrens M. K. Pahnke K. Schnetger B. Brumsack H.-J. (2018b). Sources and processes affecting the distribution of dissolved Nd isotopes and concentrations in the West pacific. Geochim. Cosmochim. Acta222, 508–534. doi: 10.1016/j.gca.2017.11.008
11
Blaser P. Pöppelmeier F. Schulz H. Gutjahr M. Frank M. Lippold J. et al . (2019). The resilience and sensitivity of northeast Atlantic deep water ϵNd to overprinting by detrital fluxes over the past 30,000 years. Geochim. Cosmochim. Acta245, 79–97. doi: 10.1016/j.gca.2018.10.018
12
Broecker W. S. Patzert W. C. Toggweiler J. R. Stuive M. (1986). Hydrography, chemistry, and radioisotopes in the southeast Asian basins. J. Geophys. Res. Oceans91, 14345–14354. doi: 10.1029/JC091iC12p14345
13
Che H. Zhang J. Liu Q. He H. Zhao Z. (2022). Refining the contribution of riverine particulate release to the global marine Nd budget. Prog. Earth Planet. Sc.9:22. doi: 10.1186/s40645-022-00479-2
14
Chen T.-Y. Lai C.-C. Tai J.-H. Ko C.-Y. Shiah F.-K. (2021). Diel to seasonal variation of picoplankton in the tropical south China Sea. Front. Mar. Sci.8. doi: 10.3389/fmars.2021.732017
15
Chen T. Li G. Frank M. Ling H. (2013). Hafnium isotope fractionation during continental weathering: Implications for the generation of the seawater Nd-hf isotope relationships. Geophys. Res. Lett.40, 916–920. doi: 10.1002/grl.50217
16
Chen G. Wang D. Dong C. Zu T. Xue H. Shu Y. et al . (2015). Observed deep energetic eddies by seamount wake. Sci. Rep.5, 17416. doi: 10.1038/srep17416
17
Chen J. Zheng L. Wiesner M. Chen R. Zheng Y. Wong H. (1998). Estimations of primary production and export production in the south China Sea based on sediment trap experiments. Sci. China Earth Sci.43, 583–586. doi: 10.1007/BF02883645
18
Chung C.-H. You C.-F. Chu H.-Y. (2009). Weathering sources in the gaoping (Kaoping) river catchments, southwestern Taiwan: Insights from major elements SR isotopes, and rare earth elements. J. Mar. Syst.76, 433–443. doi: 10.1016/j.jmarsys.2007.09.013
19
Colin C. Duhamel M. Siani G. Dubois-Dauphin Q. Ducassou E. Liu Z. et al . (2021). Changes in the intermediate water masses of the Mediterranean Sea during the last climatic cycle - new constraints from neodymium isotopes in foraminifera, paleoceanogr. Paleoclimatol36 (4), 1–28. doi: 10.1029/2020PA004153
20
Colin C. Tisnérat-Laborde N. Mienis F. Collart T. Pons-Branchu E. Dubois-Dauphin Q. et al . (2019). Millennial-scale variations of the Holocene north Atlantic mid-depth gyre inferred from radiocarbon and neodymium isotopes in cold water corals. Quat. Sci. Rev.211, 93–106. doi: 10.1016/j.quascirev.2019.03.011
21
Crocket K. Hill E. Abell R. Johnson C. Gary S. Brand T. et al . (2018). Rare earth element distribution in the NE Atlantic: Evidence for benthic sources, longevity of the seawater signal, and biogeochemical cycling. Front. Mar. Sci.5. doi: 10.3389/fmars.2018.00147
22
de Baar H. J. W. Bruland K. W. Schijf J. van Heuven S. M. A. C. Behrens M. K. (2018). Low cerium among the dissolved rare earth elements in the central north pacific ocean, geochim. Cosmochim. Acta236, 5–40. doi: 10.1016/j.gca.2018.03.003
23
Ding Z. Sun J. Yang S. Liu T. (2001). Geochemistry of the pliocene red clay formation in the Chinese loess plateau and implications for its origin, source provenance and paleoclimate change. Geochim. Cosmochim. Acta65, 901–913. doi: 10.1016/S0016-7037(00)00571-8
24
Dubois-Dauphin Q. Bonneau L. Colin C. Montero-Serrano J.-C. Montagna P. Blamart D. et al . (2016). South Atlantic intermediate water advances into the north-east Atlantic with reduced Atlantic meridional overturning circulation during the last glacial period. Geochem. Geophys. Geosyst.17, 2336–2353. doi: 10.1002/2016GC006281
25
Du J. Haley B. A. Mix A. C. (2016). Neodymium isotopes in authigenic phases, bottom waters and detrital sediments in the gulf of Alaska and their implications for paleocirculation reconstruction. Geochim. Cosmochim. Acta193, 14–35. doi: 10.1016/j.gca.2016.08.005
26
Du J. Haley B. A. Mix. A. C. (2020). Evolution of the global overturning circulation since the last glacial maximum based on marine authigenic neodymium isotopes. Quat. Sci. Rev193, 14–35. doi: 10.1016/j.quascirev.2020.106396
27
Elderfield H. (1988). The oceanic chemistry of the rare-earth elements. Philos. Trans. R. Soc A325, 105–126. doi: 10.1098/rsta.1988.0046
28
Fang W. Guo Z. Huang Y. (1998). Observational study of the circulation in the southern south China Sea, chin. Sci. Bull.43, 898–905. doi: 10.1007/BF02884607
29
Fröllje H. Pahnke K. Schnetger B. Brumsack H.-J. Dulai H. Fitzsimmons J. N. (2016). Hawaiian Imprint on dissolved Nd and Ra isotopes and rare earth elements in the central north pacific: local survey and seasonal variability. Geochim. Cosmochim. Acta189, 110–131. doi: 10.1016/j.gca.2016.06.001
30
Gan J. Liu Z. Hui R. (2016). A three-layer alternating spinning circulation in the south China Sea. J. Phys. Oceanogr.46, 2309–2315. doi: 10.1175/JPO-D-16-0044.1
31
Garcia-Solsona E. Jeandel C. Labatut M. Lacan F. Vance D. Chavagnac V. et al . (2014). Rare earth elements and Nd isotopes tracing water mass mixing and particle– seawater interactions in the SE Atlantic. Geochim. Cosmochim. Acta125, 351–372. doi: 10.1016/j.gca.2013.10.009
32
Goldstein S. Jacobsen S. (1987). The Nd and Sr isotopic systematics of river-water dissolved material: implications for the sources of Nd and Sr in seawater. Chem. Geol.66, 245–272. doi: 10.1016/0168-9622(87)90045-5
33
Goldstein S. J. Jacobsen S. B. (1988). Nd And Sr isotopic systematics of river water suspended material — implications for crustal evolution. Earth Planet. Sci. Lett.87, 249–265. doi: 10.1016/0012-821X(88)90013-1
34
Grasse P. Bosse L. Hathorne E. C. Böning P. Pahnke K. Frank M. (2017). Short-term variability of dissolved rare earth elements and neodymium isotopes in the entire water column of the Panama basin. Earth Planet. Sci. Lett.475, 242–253. doi: 10.1016/j.epsl.2017.07.022
35
Grasse P. Stichel T. Stumpf R. Stramma L. Frank M. (2012). The distribution of neodymium isotopes and concentrations in the Eastern equatorial pacific: water mass advection versus particle exchange. Earth Planet. Sci. Lett.353–354, 198–207. doi: 10.1016/j.epsl.2012.07.044
36
Greaves M. J. Statham P. J. Elderfield H. (1994). Rare earth element mobilization from marine atmospheric dust into seawater. Mar. Chem.46, 255–260. doi: 10.1016/0304-4203(94)90081-7
37
Grenier M. Brown K. A. Colombo M. Belhadj M. Baconnais I. Pham V. et al . (2022). Controlling factors and impacts of river-borne neodymium isotope signatures and rare earth element concentrations supplied to the Canadian Arctic archipelago. Earth Planet. Sci. Lett.578, 117341. doi: 10.1016/j.epsl.2021.117341
38
Grenier M. Garcia-Solsona E. Lemaitre N. Trull T. W. Bouvier V. Jeandel C. (2018). Differentiating lithogenic supplies, water mass transport and biological processes on and off the kerguelen plateau using rare earth element concentrations and neodymium isotopic compositions. Front. Mar. Sci.5. doi: 10.3389/fmars.2018.00147
39
Grenier M. Jeandel C. Lacan F. Vance D. Venchiarutti C. Cros A. et al . (2013). From the subtropics to the central equatorial pacific ocean: neodymium isotopic composition and rare earth element concentration variations. J. Geophys. Res. Oceans118, 592–618. doi: 10.1029/2012jc008239
40
Haley B. A. Du J. Abbott A. N. McManus J. (2017). The impact of benthic processes on rare earth element and neodymium isotope distributions in the oceans. Front. Mar. Sci.4. doi: 10.3389/fmars.2017.00426
41
Haley B. A. Frank M. Hathorne E. Pisias N. (2014). Biogeochemical implications from dissolved rare earth element and Nd isotope distributions in the gulf of Alaska. Geochim. Cosmochim. Acta126, 455–474. doi: 10.1016/j.gca.2013.11.012
42
Haley B. A. Klinkhammer G. McManus J. (2004). Rare earth elements in pore waters of marine sediments. Geochim. Cosmochim. Acta68, 1265–1279. doi: 10.1016/j.gca.2003.09.012
43
Han A. Gan J. Dai M. Lu Z. Liang L. Zhao X. (2021). Intensification of downslope nutrient transport and associated biological responses over the northeastern south China Sea during wind-driven downwelling: a modeling study. Front. Mar. Sci.8. doi: 10.3389/fmars.2021.772586
44
Hathorne E. C. Frank M. Mohan P. M. (2020). Rare earth elements in Andaman island surface seawater: Geochemical tracers for the monsoon? Front. Mar. Sci.6. doi: 10.3389/fmars.2019.00767
45
Hu J. Kawamura H. Hong H. Qi Y. (2000). A review on the currents in the south China Sea: Seasonal circulation, south China Sea warm current and kuroshio intrusion. J. Oceanogr.56, 607–624. doi: 10.1023/A:1011117531252
46
Hu R. Noble T. Piotrowski A. McCve N. Bostock H. Neil H. (2016). Neodymium isotopic evidence for linked changes in southeast Atlantic and southwest pacific circulation over the last 200 kyr. Earth Planet. Sci. Lett.455, 106–114. doi: 10.1016/j.epsl.2016.09.027
47
Jeandel C. Delattre H. Grenier M. Pradoux C. Lacan F. (2013). Rare earth element concentrations and Nd isotopes in the south East pacific ocean. Geochem. Geophys. Geosyst.14, 328–341. doi: 10.1029/2012GC004309
48
Johannesson K. Burdige D. (2007). Balancing the global oceanic neodymium budget: evaluating the role of groundwater. Earth Planet. Sci. Lett.253 (1–2), 129–142. doi: 10.1016/j.epsl.2006.10.021
49
Kawabe M. Fujio S. (2010). Pacific ocean circulation based on observation. J. Oceanogr.66, 389–403. doi: 10.1007/s10872-010-0034-8
50
Kim I. Kim G. (2014). Submarine groundwater discharge as a main source of rare earth elements in coastal waters. Mar. Chem.160, 11–17. doi: 10.1016/j.marchem.2014.01.003
51
Lacan F. Jeandel C. (2005). Neodymium isotopes as a new tool for quantifying exchange fluxes at the continent-ocean interface. Earth Planet. Sci. Lett.232, 245–257. doi: 10.1016/j.epsl.2005.01.004
52
Lawrence M. Kamber B. (2006). The behaviour of the rare earth elements during estuarine mixing–revisited. Mar. Chem.100, 147–161. doi: 10.1016/j.marchem.2005.11.007
53
Le Houedec S. Meynadier L. Allègre C. J. (2016). Seawater Nd isotope variation in the Western pacific ocean since 80 ma (ODP 807, ontong Java plateau). Mar. Geol.380, 138–147. doi: 10.1016/j.margeo.2016.07.005
54
Lin H. Han W. (1997). Study on the dissolved oxygen flux in the south China Sea. Chin. J. Oceanol. Limnol.15, 19–24. doi: 10.1007/BF02850577
55
Li L. Qu T. (2006). Thermohaline circulation in the deep south China Sea basin inferred from oxygen distributions. J. Geophys. Res. Oceans111, C05017. doi: 10.1029/2005JC003164
56
Liu Y. Peng Z. Zhou R. Song S. Liu W. You C.-F. et al . (2014). Acceleration of modern acidification in the south China Sea driven by anthropogenic CO2. Sci. Rep.5, 5148. doi: 10.1038/srep05148
57
Liu X. Wei G. Zou J. Guo Y. Ma J. Chen X. et al . (2018). Elemental and Sr-Nd isotope geochemistry of sinking particles in the northern south China Sea: implications for provenance and transportation. J. Geophys. Res. Oceans123, 9137–9155. doi: 10.1029/2018JC014312
58
Liu Z. Zhao Y. Colin C. Stattegger K. Wiesner M. G. Huh C.-A. et al . (2016). Source-to-sink transport processes of fluvial sediments in the south China Sea. Earth Sci. Rev.153, 238–273. doi: 10.1016/j.earscirev.2015.08.005
59
Li H. Wiesner M. Chen J. Lin Z. Zhang J. Ran L. (2017). Long-term variation of mesopelagic biogenic flux in the central south China Sea: Impact of monsoonal seasonality and mesoscale eddy. Deep-sea Res. I126, 62–72. doi: 10.1016/j.dsr.2017.05.012
60
Lüdmann T. Wong H. K. Berglar K. (2005). Upward flow of north pacific deep water in the northern south China Sea as deduced from the occurrence of drift sediments. Geophys. Res. Lett.32, L05614. doi: 10.1029/2004GL021967
61
Ma L. Dang D. Wang W. Evans R. D. Wang. W.-X. (2019). Rare earth elements in the pearl river delta of China: Potential impacts of the REE industry on water, suspended particles and oysters. Environ. pollut.244, 190–201. doi: 10.1016/j.envpol.2018.10.015
62
Martin E. Blair W. Kamenov D. Scher D. Bourbon E. Basak C. et al . (2010). Extraction of Nd isotopes from bulk deep sea sediments for paleoceanographic studies on Cenozoic time scales. Chem. Geol.269, 414–431. doi: 10.1016/j.chemgeo.2009.10.016
63
Milliman J. D. Farnsworth K. L. (2011). River discharge to the coastal ocean: A global synthesis (Cambridge: Cambridge University Press), 384.
64
Molina-Kescher M. Frank M. Tapia R. Ronge T. A. Dirk Nürnberg D. Tiedemann R. (2016). Reduced admixture of north Atlantic deep water to the deep central south pacific during the last two glacial periods. Paleoceanogr. Paleoclimatol.31, 651–668. doi: 10.1002/2015PA002863
65
Molina-Kescher M. Hathorne E. Osborne A. Behrens M. Kölling M. Pahnke K. et al . (2018). The influence of basaltic islands on the oceanic REE distribution: A case study from the tropical south pacific. Front. Mar. Sci.5. doi: 10.3389/fmars.2018.00050
66
Noble T. L. Piotrowski A. M. McCave I. N. (2013). Neodymium isotopic composition of intermediate and deep waters in the glacial southwest pacific. Earth Planet. Sci. Lett.384, 27–36. doi: 10.1016/j.epsl.2013.10.010
67
Nozaki Y. Alibo D. S. (2003). Importance of vertical geochemical processes in controlling the oceanic profiles of dissolved rare earth elements in the northeastern Indian ocean. Earth Planet. Sci. Lett.205, 155–172. doi: 10.1016/S0012-821X(02)01027-0
68
Osborne A. H. Haley B. A. Hathorne E. C. Flögel S. Frank M. (2014). Neodymium isotopes and concentrations in Caribbean seawater: tracing water mass mixing and continental input in a semi-enclosed ocean basin. Earth Planet. Sci. Lett.406, 174–186. doi: 10.1016/j.epsl.2014.09.011
69
Osborne A. H. Haley B. A. Hathorne E. C. Plancherel Y. Frank M. (2015). Rare earth element distribution in Caribbean seawater: Continental inputs versus lateral transport of distinct REE compositions in subsurface water masses. Mar. Chem.177, 172–183. doi: 10.1016/j.marchem.2015.03.013
70
Padrones J. Iami A. Takahashi R. (2017). Geochemical behavior of rare earth elements in weathered graniticrocks in northern palawan, Philippines. Resour. Geol.67, 231–253. doi: 10.1111/rge.12123
71
Patton G. Francois R. Weis D. Hathorne E. Gutjahr M. Frank M. et al . (2021). An experimental investigation of the acquisition of Nd by authigenic phases of marine sediments. Geochim. Cosmochim. Acta301, 1–29. doi: 10.1016/j.gca.2021.02.010
72
Pearce C. Jones M. Oelkers E. Pradoux C. Jeandel C. (2013). The effect of particulate dissolution on the neodymium (Nd) isotope and rare earth element (REE) composition of seawater. Earth Planet. Sci. Lett.369, 138–147. doi: 10.1016/j.epsl.2013.03.023
73
Pham V. Grenier M. Cravatte S. Michael S. Jacquet S. Belhadj M. et al . (2019). Dissolved rare earth elements distribution in the Solomon Sea. Chem. Geol.524, 11–36. doi: 10.1016/j.chemgeo.2019.05.012
74
Piotrowski A. M. Galy A. Nicholl J. A. L. Roberts N. Wilson D. J. Clegg J. A. et al . (2012). Reconstructing deglacial north and south Atlantic deep water sourcing using foraminiferal Nd isotopes. Earth Planet. Sci. Lett.357–358, 289–297. doi: 10.1016/j.epsl.2012.09.036
75
Qu T. Girton J. B. Whitehead J. A. (2006). Deepwater overflow through Luzon strait. J. Geophys. Res. Oceans111, C01002. doi: 10.1029/2005JC003139
76
Rousseau T. C. C. Sonke J. E. Chmeleff J. Van Beek P. Souhaut M. Boaventura G. et al . (2015). Rapid neodymium release to marine waters from lithogenic sediments in the Amazon estuary. Nat. Commun.6, 7592. doi: 10.1038/ncomms8592
77
Scher H. Whittaker J. William S. Latimer J. Kordesch W. Delaney M. (2015). On-set of Antarctic circumpolar current 30 million years ago as Tasmanian gateway aligned with westerlies. Nature523, 580–583. doi: 10.1038/nature14598
78
Schlitzer R. (2014) Ocean data view. Available at: http://odv.awi.de.
79
Shao L. Qiao P. Pang X. Wei G. Li Q. Miao W. et al . (2009). Nd Isotopic variations and its implications in the recent sediments from the northern south China Sea. Chin. Sci. Bull.54, 311–317. doi: 10.1007/s11434-008-0453-8
80
Sholkovitz R. Elderfield H. Szymczak R. Casey K. (1999). Island weathering: river sources of rare earth elements to the Western pacific ocean. Mar. Chem.68, 39–57. doi: 10.1016/S0304-4203(99)00064-X
81
Sholkovitz R. Landing M. Lewis L. (1994). Ocean particle chemistry: the fractionation of rare earth elements between suspended particles and seawater. geochim. Cosmochim. Acta58, 1567–1580. doi: 10.1016/0016-7037(94)90559-2
82
Sholkovitz E. Szymczak R. . (2000). The estuarine chemistry of rare earth elements: comparison of the Amazon, Fly, Sepik and the Gulf of Papua systems. Earth Planet. Sci. Lett.179, 299–309. doi: 10.1016/S0012-821X(00)00112-6
83
Shu Y. Xue H. Wang D. Chai F. Xie Q. Yao J. L. et al . (2014). Meridional overturning circulation in the south China Sea envisioned from the high-resolution global reanalysis data GLBa0.08. J. Geophys. Res.119, 3012–3028. doi: 10.1002/2013JC009583
84
Singh P. Singh K. Goswami V. Bhushan R. Rai K. (2012). Spatial distribution of dissolved neodymium and eNd in the bay of Bengal: role of particulate matter and mixing of water masses. Geochim. Cosmochim. Acta94, 38–56. doi: 10.1016/j.gca.2012.07.017
85
Sinha A. K. Parli B. V. (2020). Siderophore production by bacteria isolated from mangrove sediments: A microcosm study. J. Exp. Mar. Biol. Ecol.524, 151290. doi: 10.1016/j.jembe.2019.151290
86
Song X. Lai Z. Ji R. Chen C. Zhang J. Huang L. et al . (2012). Summer time primary production in northwest south China Sea: Interaction of coastal eddy, upwelling and biological processes. Cont Shelf Res.48, 110–121. doi: 10.1016/j.csr.2012.07.016
87
Stichel T. Hartman A. E. Duggan B. Goldstein S. L. Scher H. Pahnke K. (2015). Separating biogeochemical cycling of neodymium from water mass mixing in the eastern north Atlantic. Earth Planet. Sci. Lett.412, 245–260. doi: 10.1016/j.epsl.2014.12.008
88
Tachikawa K. Arsouze T. Bayon G. Bory A. Colin C. Dutay J.-C. et al . (2017). The large-scale evolution of neodymium isotopic composition in the global modern and Holocene ocean revealed from seawater and archive data. Chem. Geol.457, 131–148. doi: 10.1016/j.chemgeo.2017.03.018
89
Tanaka T. Togashi S. Kamioka H. Amakawa H. Kagami H. Hamamoto T. et al . (2000). JNdi-1: A neodymium isotopic reference in consistency with LaJolla neodymium. Chem. Geol.168, 279–281. doi: 10.1016/S0009-2541(00)00198-4
90
Taylor S. McLennan S. (1985). The continental crust: Its composition and evolution (Palo Alto, CA: Blackwell Scientific Publisher).
91
Tian J. Yang Q. Liang X. Xie L. Hu D. Wang F. et al . (2006). Observation of Luzon strait transport. Geophys. Res. Lett.33, L19607. doi: 10.1029/2006GL026272
92
Tian J. Yang Q. Zhao W. (2009). Enhanced diapycnal mixing in the south China Sea. J. Phys. Oceanogr.39, 3191–3203. doi: 10.1175/2009JPO3899.1
93
Uematsu M. Wang Z. Uno I. (2003). Atmospheric input of mineral dust to the western north pacific region based on direct measurements and a regional chemical transport model. Geophys. Res. Lett.30 (6), 1342. doi: 10.1029/2002GL016645
94
van de Flierdt T. Griffiths A. M. Lambelet M. Little S. H. Stichel T. Wilson D. J. (2016). Neodymium in the oceans: a global database, a regional comparison and implications for palaeoceanographic research. philos. Trans. R. Soc A374, 20150293. doi: 10.1098/rsta.2015.0293
95
Wang A. Du Y. Peng S. Liu K. Huang R. (2018). Deep water characteristics and circulation in the south China Sea. Deep Sea Res. Part I134, 55–63. doi: 10.1016/j.dsr.2018.02.003
96
Wang J. Shu Y. Wang D. Xie Q. Wang Q. Chen J. et al . (2021). Observed variability of bottom-trapped topographic rossby waves along the slope of the northern south China Sea. J. Geophys. Res. Oceans126, e2021JC017746. doi: 10.1029/2021JC017746
97
Wang D. Wang Q. Cai S. Shang X. Peng S. Shu Y. et al . (2019). Advances in research of the mid-deep south China Sea circulation. Sci. China Earth Sci.62. doi: 10.1007/s11430-019-9546-3
98
Wang D. Wang Q. Zhou W. Cai S. Li L. Hong B. (2013). An analysis of the current deflection around dongsha islands in the northern south China Sea. J. Geophys. Res. Oceans118, 490–501. doi: 10.1029/2012JC008429
99
Wang D. Xiao J. Shu Y. Xie Q. Chen J. Wang Q. (2016). Progress on deep circulation and meridional overturning circulation in the south China Sea. Sci. China Earth Sci.59, 1827–1833. doi: 10.1007/s11430-016-5324-6
100
Wang G. Xie S. Qu T. Huang R. (2011). Deep south China Sea circulation. Geophys. Res. Lett.38, L05601. doi: 10.1029/2010GL046626
101
Wei G. Liu Y. Ma J. Xie L. Chen J. Deng W. et al . (2012). Nd S.R. isotopes and elemental geochemistry of surface sediments from the south China Sea: implications for provenance tracing. Mar. Geol.319–322, 21–34. doi: 10.1016/j.margeo.2012.05.007
102
Wilson D. Crocket K. van de Flierdt T. Robinson L. Adkins J. (2014). Dynamic intermediate ocean circulation in the north Atlantic during Heinrich stadial 1: a radiocarbon and neodymium isotope perspective. Paleoceanography29, 1072–1093. doi: 10.1002/2014PA002674
103
Wu Q. Colin C. Liu Z. Douville E. Dubois-Dauphin Q. Frank N. (2015). New insights into hydrological exchange between the south China Sea and the Western pacific ocean based on the Nd isotopic composition of seawater. Deep Sea Res. Part II122, 25–40. doi: 10.1016/j.dsr2.2015.11.005
104
Wu J. Pahnke K. Böning P. Wu L. Michard A. de Lange G. J. (2019). Divergent Mediterranean seawater circulation during Holocene sapropel formation – reconstructed using Nd isotopes in fish debris and foraminifera. Earth Planet. Sci. Lett.511, 141–153. doi: 10.1016/j.epsl.2019.01.036
105
Xie Y. Lin L. Xiao W. Yu W. Lan X. Huang B. (2020). Striking seasonal pattern of primary production in the river-dominated ocean margin of the northern south China Sea (NSCS-RiOMar) revealed by new field and remotely sensed data. Prog. Oceanogr.1021, 2470. doi: 10.1016/j.pocean.2020.102470
106
Xie L. Tian J. Zhang S. Zhang Y. Yang. Q. (2011). An anticyclonic eddy in the intermediate layer of the Luzon strait in Autumn2002, 005. J. Oceanogr.67, 37–46. doi: 10.1007/s10872-011-0004-9
107
Xu J. Li X. Shi Z. Li R. Li Q. (2018). Bacterial carbon cycling in the river plume in the northern south China Sea during summer. J. Geophys. Res. Oceans123, 8106–8121. doi: 10.1029/2018JC014277
108
Yang Q. Tian J. Zhao W. (2010). Observation of Luzon strait transport in summer2002, 007. Deep Sea Res. Part I57, 670–676. doi: 10.1016/j.dsr.2010.02.004
109
You Y. (2003). The pathway and circulation of north pacific intermediate water. Geophys. Res. Lett.30, 2291. doi: 10.1029/2003GL018561
110
Yuan D. (2002). A numerical study of the south China Sea deep circulation and its relation to the Luzon strait transport. Acta Oceanol. Sin.21, 187–202.
111
Yuan D. Han W. Hu D. (2007). Anti-cyclonic eddies northwest of Luzon in summer-fall observed by satellite altimeters. Geophys. Res. Lett.34, L13610. doi: 10.1029/2007GL029401
112
Yu Z. Colin C. Douville E. Meynadier L. Duchamp-Alphonse S. Sepulcre S. et al . (2017). Yttrium and rare earth element partitioning in seawaters from the bay of Bengal. Geochem. Geophys. Geosyst.18, 1388–1403. doi: 10.1002/2016GC006749
113
Yu Z. Colin C. Ma R. Meynadier L. Wan S. Wu Q. et al . (2018). Northward invasion of Antarctic intermediate water in the northern Indian ocean during the last deglaciation. Earth Planet. Sci. Lett.500, 67–75. doi: 10.1016/j.epsl.2018.08.006
114
Zhang J. Li H. Xuan J. Wu Z. Yang Z. Wiesner M. et al . (2018). Enhancement of mesopelagic sinking particle fluxes due to upwelling, aerosol deposition, and monsoonal influences in the northwestern south China Sea. J. Geophys. Res. Oceans124, 99–112. doi: 10.1029/2018JC014704
115
Zhao N. Oppo D. Huang K. Howe J. Blusztajn J. Keigwin L. (2019). Glacial–interglacial Nd isotope variability of north Atlantic deep water modulated by north American ice sheet. Nat. Commun.10, 5773. doi: 10.1038/s41467-01913707-z
116
Zhao W. Zhou C. Tian J. Yang Q. Wang B. Xie L. et al . (2014). Deep water circulation in the Luzon strait. J. Geophys. Res. Oceans119, 790–804. doi: 10.1002/2013JC009587
117
Zheng X. Plancherel Y. Saito M. A. Scott P. M. Henderson G. M. (2016). Rare earth elements (REEs) in the tropical south Atlantic and quantitative deconvolution of their non-conservative behavior. Geochim. Cosmochim. Acta177, 217–237. doi: 10.1016/j.gca.2016.01.018
118
Zhou M. Wang G. Liu W. Chen C. (2020). Variability of the observed deep western boundary current in the south China Sea. J. Geophys. Res. Oceans50, 2953–2963. doi: 10.1175/JPO-D-20-0013.1
119
Zhou C. Zhao W. Tian J. Zhao X. Zhu Y. Yang Q. et al . (2017). Deep western boundary current in the south china sea. Sci. Rep.7, 9303. doi: 10.1038/s41598-017-09436-2
120
Zhu Y. Fang G. Wei Z. Wang Y. Teng F. Qu T. (2016). Seasonal variability of the meridional overturning circulation in the south China Sea and its connection with inter-ocean transport based on SODA2.2.4. J. Geophys. Res. Oceans121, 3090–3105. doi: 10.1002/2015JC011443
121
Zhu Y. Sun J. Wang Y. Li S. Xu T. Wei Z. et al . (2019). Overview of the multi-layer circulation in the south China Sea. Prog. Oceanogr.175, 171–182. doi: 10.1016/j.pocean.2019.04.001
122
Zhu Y. Sun J. Wang Y. Wei Z. Yang D. Qu T. (2017). Effect of potential vorticity flux on the circulation in the south China Sea. J. Geophys. Res. Oceans122, 6454–6469. doi: 10.1002/2016JC012375
123
Zieringer M. Frank M. Stumpf R. Hathorne E. C. (2019). The distribution of neodymium isotopes and concentrations in the eastern tropical north Atlantic. Chem. Geol.511, 265–278. doi: 10.1016/j.chemgeo.2018.11.024
Summary
Keywords
rare earth elements, neodymium isotopes, South China Sea, West Pacific, particle dissolution
Citation
Wu Q, Liu Z, Colin C, Douville E, Zhao Y, Wu J, Dapoigny A, Bordier L, Ma P and Huang Y (2022) Dissolved rare earth element and neodymium isotope distributions in the South China Sea: Water mass source versus particle dissolution. Front. Mar. Sci. 9:1003749. doi: 10.3389/fmars.2022.1003749
Received
26 July 2022
Accepted
13 December 2022
Published
28 December 2022
Volume
9 - 2022
Edited by
Ed Hathorne, GEOMAR Helmholtz Center for Ocean Research Kiel (HZ), Germany
Reviewed by
Howie Daniel Scher, University of South Carolina, United States; Hajime Obata, The University of Tokyo, Japan
Updates
Copyright
© 2022 Wu, Liu, Colin, Douville, Zhao, Wu, Dapoigny, Bordier, Ma and Huang.
This is an open-access article distributed under the terms of the Creative Commons Attribution License (CC BY). The use, distribution or reproduction in other forums is permitted, provided the original author(s) and the copyright owner(s) are credited and that the original publication in this journal is cited, in accordance with accepted academic practice. No use, distribution or reproduction is permitted which does not comply with these terms.
*Correspondence: Qiong Wu, qiongwu@hhu.edu.cn
This article was submitted to Marine Biogeochemistry, a section of the journal Frontiers in Marine Science
Disclaimer
All claims expressed in this article are solely those of the authors and do not necessarily represent those of their affiliated organizations, or those of the publisher, the editors and the reviewers. Any product that may be evaluated in this article or claim that may be made by its manufacturer is not guaranteed or endorsed by the publisher.