Abstract
Climate change is expected to alter the intensity and frequency of upwelling in high productive coastal regions, thus impacting nutrient fluxes, primary productivity and consequently carbon cycling. However, it is unknown how these changes will impact the planktonic (phytoplankton and bacteria) community structure, which affects community respiration (CR) and hence the carbon available for sequestration or transfer to upper trophic levels. Here we present results from a 37-day mesocosm experiment where we examined the response of CR to nutrient additions by simulating upwelling events at different intensities (low, medium, high and extreme) and modes (singular and recurring additions). We also analysed the potential contribution of different plankton size classes and functional groups to CR. The trend in accumulated CR with respect to nutrient fertilisation (total nitrogen added during the experiment) was linear in the two modes. Microplankton (mostly diatoms) and nanoplankton (small flagellates) dominated under extreme upwelling intensities and high CR in both singular and recurring upwelling modes, explaining >65% of the observed variability in CR. In contrast, prokaryotic picoplankton (heterotrophic bacteria and autotrophic cyanobacteria) explained <43% of the variance in CR under the rest of the upwelling intensities and modes tested. Changes in planktonic community structure, while modulating CR variability, would regulate the metabolic balance of the ecosystem, shifting it towards net-heterotrophy when the community is dominated by small heterotrophs and to net-autotrophy when large autotrophs prevail; although depending on the mode in which nutrients are supplied to the system. This shift in the dominance of planktonic organism will hence affect not only CR but also carbon sequestration in upwelling regions
1 Introduction
Coastal upwelling regions are among the most productive ecosystems in the ocean (Ryther, 1969). Biological productivity in upwelling systems responds to nutrient inputs from deep layers, which can be highly variable among different regions, depending on wind intensity and frequency, as well as other physical drivers such as wind curl or coastal bathymetry (Kämpf and Chapman, 2016). Overall, nutrient inputs are the main drivers of phytoplankton blooms and organic matter accumulation (Hutchings et al., 1995), which in turn trigger changes in community respiration (CR) rates influencing the amount of carbon available for deep ocean sequestration or transfer to upper trophic levels (Williams and Del Giorgio, 2005; Azam and Malfatti, 2007; Capone and Hutchins, 2013). Climate change is expected to alter coastal wind regimes, impacting upwelling intensity and frequency, and the associated pumping of nutrients to the surface layers (Bakun, 1990; García-Reyes et al., 2015; Basu and Mackey, 2018). These alterations can profoundly impact planktonic community structure and productivity, modifying carbon fluxes at a regional level (Legrende and Michaud, 1998; Tamigneaux et al., 1999; Montero et al., 2007). The balance between the production and the respiratory loss of photosynthetically produced organic matter sets CR as an effective index of the movements of organic matter through ecosystems (Williams and Del Giorgio, 2005). Therefore, CR represents a critical parameter for assessing the metabolic balance of aquatic ecosystems (Basu and Mackey, 2018). However, how perturbations in upwelling intensity and frequency will impact CR in upwelling regions is still unclear.
Mesocosm approaches have been widely used over the last decade to simulate climate change scenarios and assess the effects of multiple stressors such as warming or acidification on marine planktonic communities (e.g., Sommer et al., 2007; Riebesell et al., 2008; Schulz et al., 2017; Taucher et al., 2018). To the best of our knowledge, only one study has previously addressed the effect of different intensities of a simulated upwelling on CR (McAndrew et al., 2007). However, this study lasted only four days, being a very short period to assess stressor responses in planktonic community structure and metabolism (e.g., Filella et al., 2018). Moreover, the study focuses exclusively on the response of the autotrophic component of the community to nutrient fertilisation. Here we use a mesocosm approach to simulate changes in upwelling at different intensities and modes and assess their impact on CR over 37-days. The goal of the study was first to look at the short term variability of CR under nutrient pulses of different intensity and duration, and second to see how the autotrophic vs heterotrophic planktonic community structure contributed to this variability. Our results may therefore help predicting present and future changes in the metabolic balance of upwelling regions due to natural or anthropogenic-induced variability.
2 Materials and methods
2.1 Experimental setup and sampling
Between November and December 2018 (37 days in total) a mesocosms experiment was conducted in Gando Bay (Canary Islands, 27°55.673´ N, 15°21.870´ W) as part of the Ocean artUp project. Nine ~44 m3 mesocosms (Kiel Off-Shore Mesocosms for future Ocean Simulations or KOSMOS; Riebesell et al., 2013) were moored and filled with in situ oligotrophic water. Unfortunately, the planned deep water collection to a depth of ~600m could not be achieved due to technical limitations. Instead, deep water was collected between 28°00′N, 15°18′E and 27°57′N, 15°10′E from 330 m depth (day -10) and from 280 m depth (day 23), respectively, using a custom-built collector with a carrying capacity of 100 m3 (for technical details see Taucher et al., 2017). Subsequently, deep water was enriched with nitrate (NO3-), phosphate (PO43-), and silicate [(Si(OH)4] to a final concentration of 25, 1.4, and 12.1 µmol L-1, respectively, necessary to achieve the planned simulated upwelling. Deep water was then added to the mesocosms to simulate different upwelling modes (singular and recurring additions) and intensities (low, medium, high and extreme additions), the latter defined according to the total amount of water volume replaced by deep water (Figure 1). In the recurring mode, four mesocosms (M2, M4, M6, M8) received an addition of deep water every four days starting on day 4, and until the end of the experiment. In the singular mode, another four mesocosms (M1, M3, M7, M9) received a singular deep-water pulse on day 4 and were not further fertilised throughout the experiment. The amount of nutrients added in each of the four intensity levels (low, medium, high and extreme) was similar for both upwelling modes (Figure 1B). No deep water addition was carried out for M5 (Control). 152 samples (19 samplings from each of the 8 mesocosms) were obtained from the entire water column (0-13m) using a depth-integrated water sampler (IWS, Hydro-Bios, Kiel). In the present study, M9 was not sampled due to logistical issues in the supply of the glass bottles. For more details on the experimental setup and sampling procedures see Baumann et al. (2021).
Figure 1
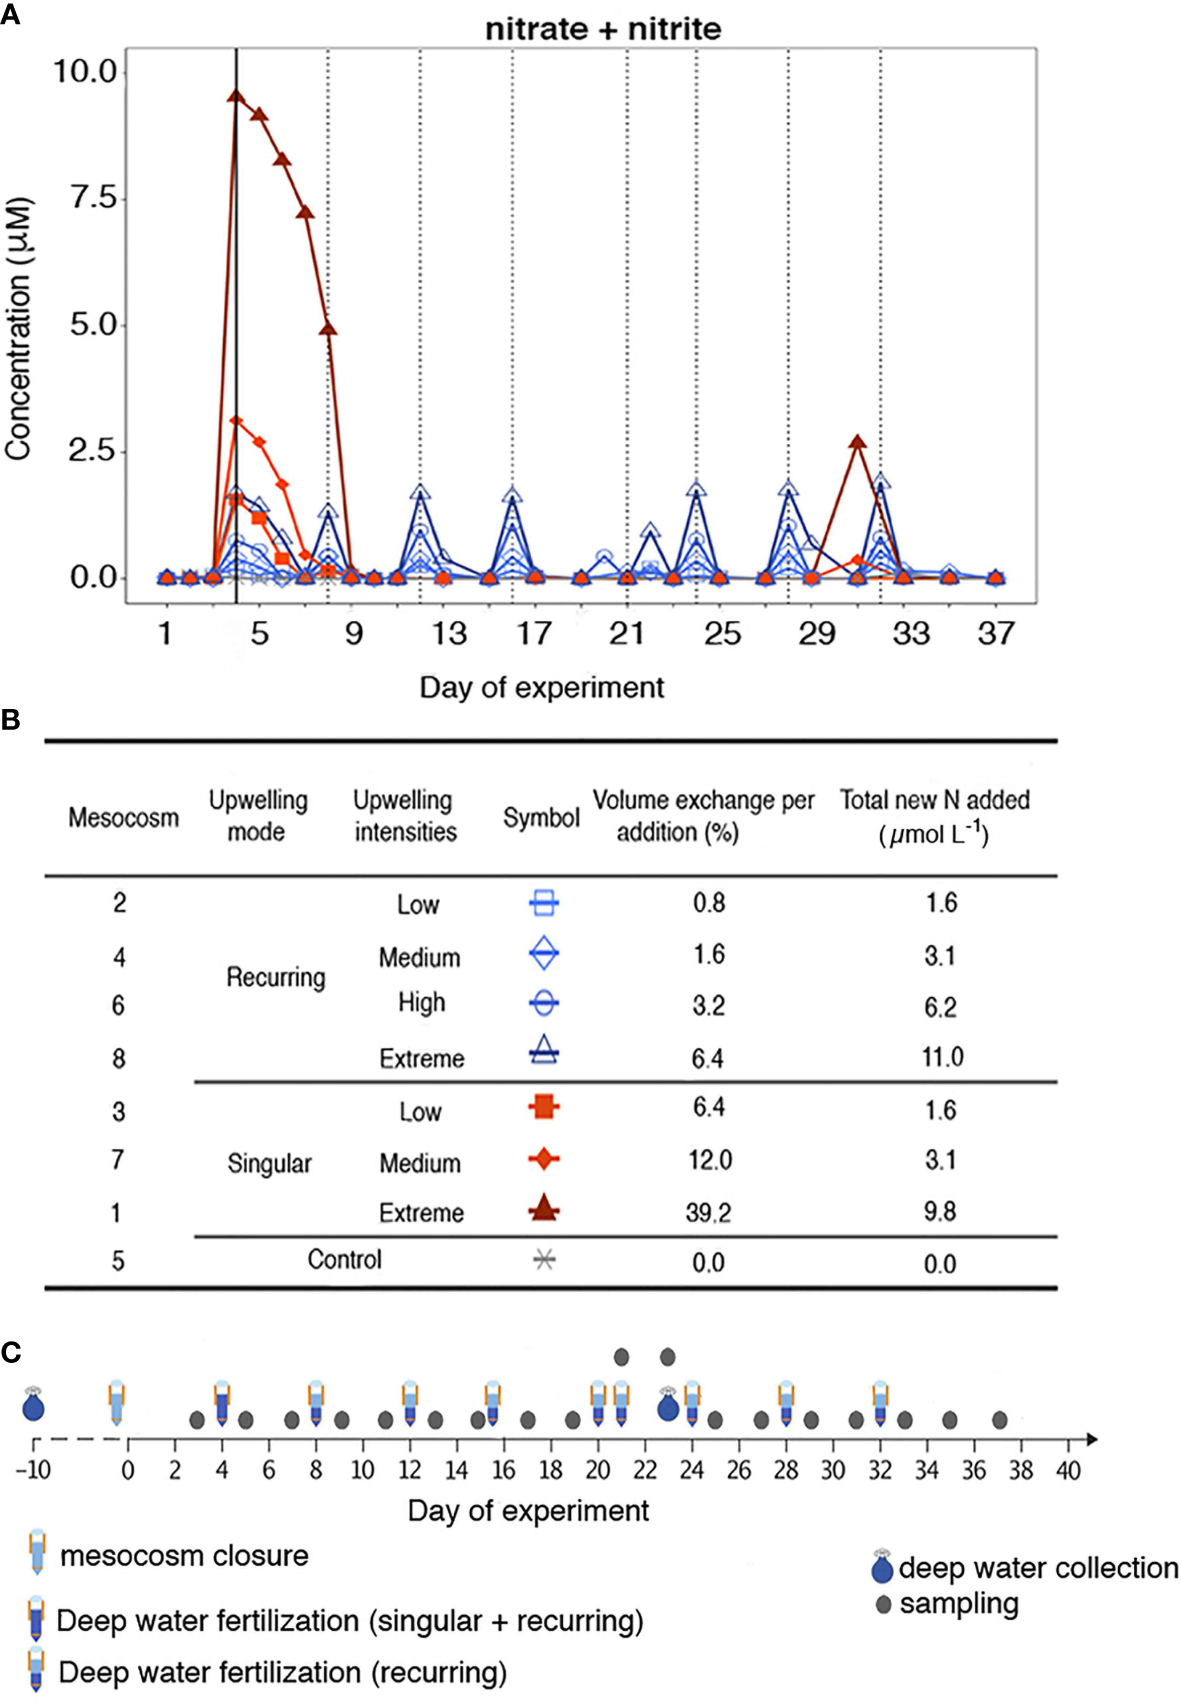
(A) Nitrate + nitrite evolution during the experiment. The solid black line indicates the first deep-water addition (except in the control). The dotted black lines indicate the addition made only to the recurring treatment. (B) Types of treatment, symbol encoded, mesocosms, volume exchange per addition (%) and total new N added (μmol L-1). (C) Mesocosms sampling timeline adapted from Baumann et al. (2021).
2.2 Community respiration
Mesocosm water samples for community respiration measurements were pre-filtered through a 250 µm mesh and carefully siphoned using a silicone tube into four replicate “time-zero” and four replicate “dark” 125 mL borosilicate bottles. Dark bottles were incubated in an outdoor pool at seawater temperature (~20.7-21.5°C) for ~24 h. CR was determined by oxygen consumption measured by the Winkler technique, following the recommendations of Carritt and Carpenter (1966); Bryan et al. (1976) and Grasshoff (1983). The entire content of the bottles was titrated during ~3 min by means of an automated, precise titration system with colorimetric end-point detection (Williams and Jenkinson, 1982). The precision achieved in replicates was %CV < 0.07. CR was estimated from the difference in oxygen concentration between the mean of the four time-zero and the mean of the four dark bottles.
2.3 Phytoplankton community composition and biomass
Samples for phytoplankton community composition were filtered onto 0.7 μm pore size glass fiber filters under low pressure (200 mbar, Whatman GF/F, Maidstone, UK). Filters were immediately frozen in liquid nitrogen and subsequently stored at -80°C until analysis. Prior to analysis, samples were mixed with 0.5 mm glass beads and 1.3 mL of 100% high-performance liquid chromatography (HPLC) grade acetone and extracted in a homogenizer. Then, they were centrifuged (10 min, 4°C, 10000 rpm) and the supernatant removed with a syringe and filtered through a PTFE filter (0.2 μm pore size). Photosynthetic pigments were analyzed through reverse-phase HPLC (Thermo Scientific). The relative contribution to Chla of different phytoplankton classes was calculated using the CHEMTAX algorithm developed by Mackey et al. (1996), applying pigment ratios typically found in the waters off Gran Canaria (Taucher et al., 2018).
The biomass of different phytoplankton groups was estimated by transforming their estimated individual chlorophyll a (Chl-a) concentration to carbon using conversion ratios (g/g) from Sathyendranath et al. (2009): 141 (Prasinophytes and Chlorophytes), 53 (Dinoflagellates), 64 (Diatoms), 88 (Cryptophytes, Chrysophytes and Prymnesiophytes), 140 (Cyanobacteria).
2.4 Heterotrophic bacteria biomass
Seawater samples were fixed with 50 μL of 20% paraformaldehyde (2% final concentration), kept in darkness at 4°C for 30 min and subsequently preserved at -80°C. Heterotrophic bacterial abundance was determined using a FACSCalibur flow cytometer (Becton Dickinson) equipped with an air cooled blue (488nm) argon laser. Briefly, frozen samples were thawed and a 400 μL subsample stained with SYBR Green I (Invitrogen) at room temperature for 15 min. Heterotrophic bacteria were identified in a plot of side scatter (SSC) versus green fluorescence (FL1). Samples were run at low flow rate (22 μL min-1). A suspension of yellow-green 1 μm latex beads (~105 - 106 beads mL-1) was added as an internal standard (Polysciences, Inc., Warrington, PA, Unites States). Heterotrophic bacterial biomass was estimated by multiplying their abundance by a conversion factor (18 fgC cell-1) obtained empirically in coastal waters off Gran Canaria (Montero et al. unpublished).
2.5 Statistics
To assess the effect of upwelling intensity and mode on CR rates a linear mixed-effects (LME) model was applied using “treatment” and “day of experiment” as categorical variables, and “treatment” as a random factor. CR rates were compared by the Dunnet´s test after inspection of normality and homogeneity of the variance. LME models were applied using the nlme package in R (v. 3.1-153; Pinheiro et al., 2007). In order to evaluate the variables (biomass of plankton groups) influencing CR during the experiment, multivariate regression models were fitted via Stepwise Multiple Linear regressions (SMLR). The contribution of every statistically significant predictor variable to the explained variance was quantified calculating the Relative Importance (%) using the relaimpo package in R (v 2.2-6; Grömping, 2006). All statistical analyses were performed in R Statistical Environment (v. 4.1.2; R Core Team, 2021).
3 Results
3.1 Temporal variability in plankton community respiration
CR rates ranged between 19.6 (on average for all mesocosms at the beginning of the experiment) to 292.2 mg O2 m-3 d-1 in the singular addition extreme treatment (day 13) and 229.5 mg O2 m-3 d-1 in the recurring addition extreme treatment (day 35) (Figure 2). These rates were slightly lower than those previously reported from the Canary Current and NW Africa upwelling (Arístegui and Montero, 1995; Robinson et al., 2002) and Benguela upwelling (Robinson et al., 2002), but higher than those observed in other coastal upwelling systems like the NW Iberian (Moncoiffé et al., 2000) or the Chilean upwelling systems (Daneri et al., 2000).
Figure 2
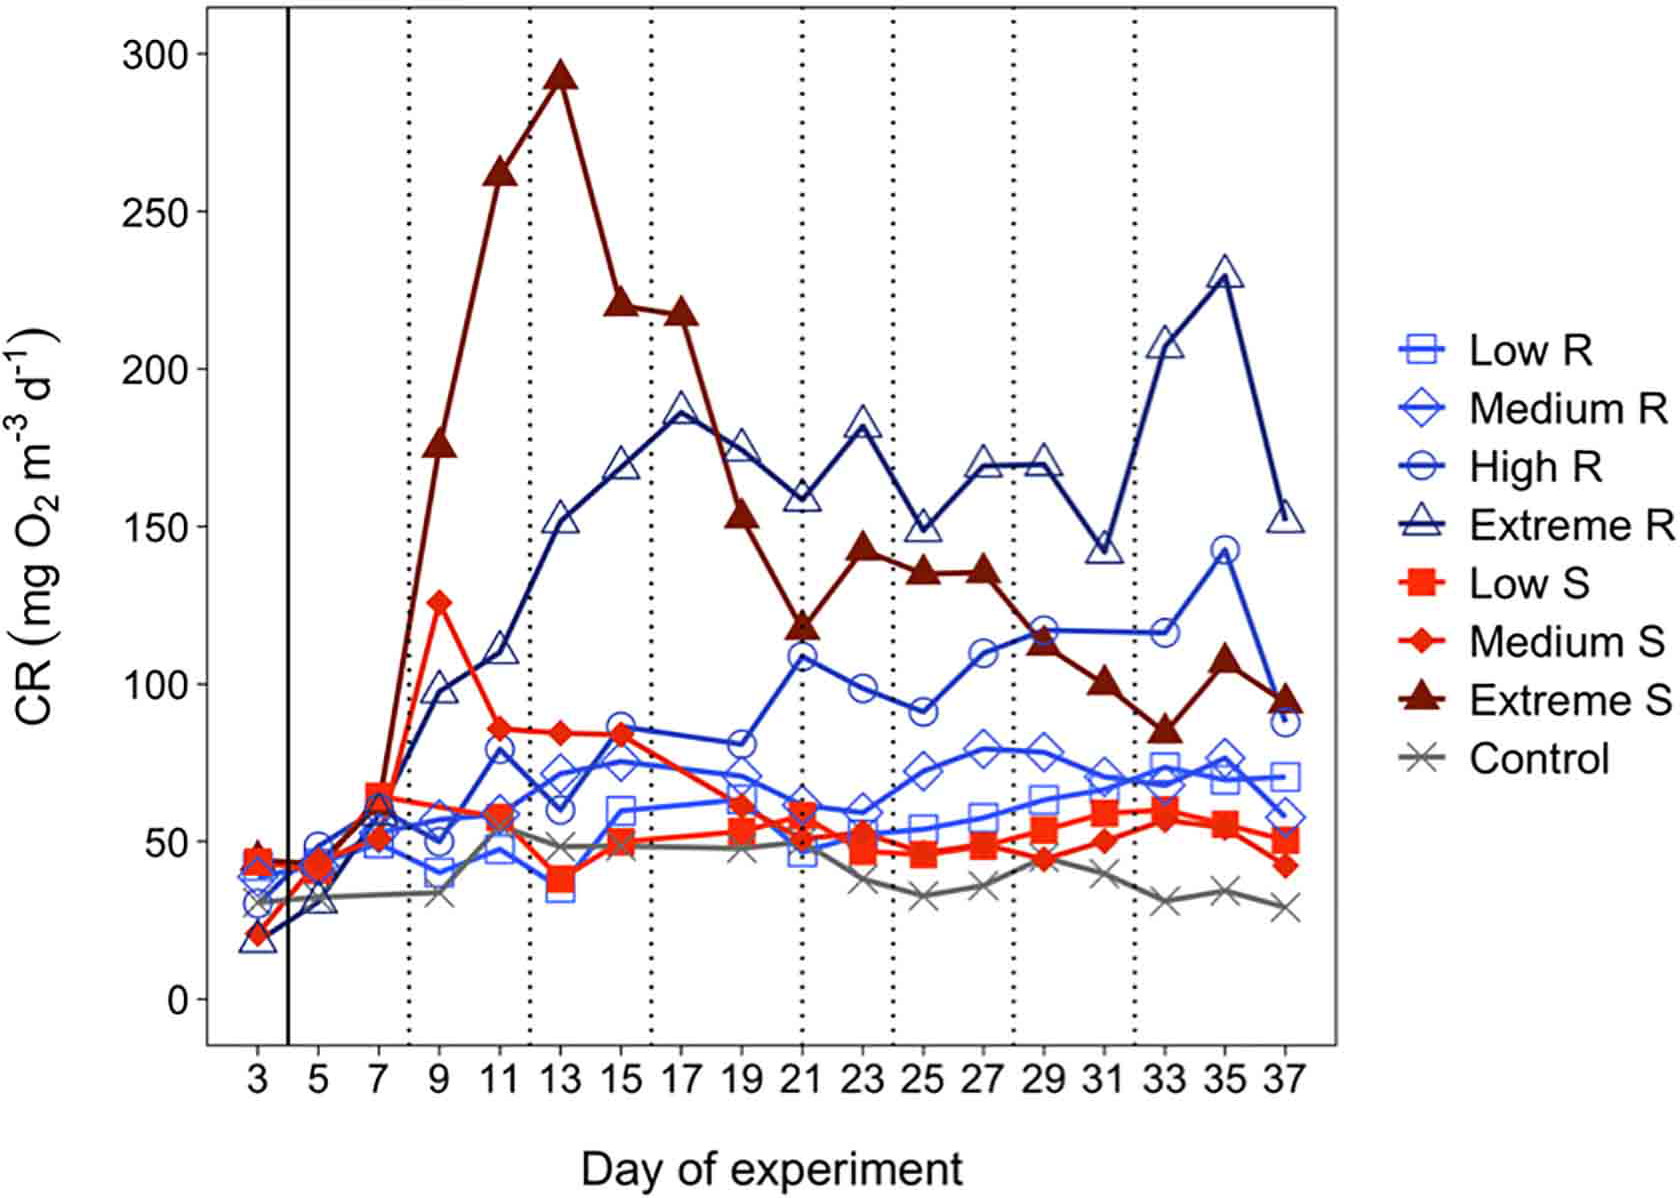
Temporal development of plankton community respiration (CR). The solid black line indicates the first deep-water addition (except in the control). The dotted black lines indicate the addition made only to the recurring treatment.
CR rates differed significantly among upwelling modes and intensities (LME model, p<0.005), reaching the highest values in the extreme intensity treatments. In the singular upwelling mode, CR rates increased after day 4 and peaked on day 7, 9 and 13 for low, medium and extreme intensities, respectively. The magnitude of this response increased with upwelling intensity. Following the peak, CR rates decreased and remained relatively constant until the end of the experiment. In contrast, the recurring mode showed a gradual rise in CR rates according to the intensity of the simulated upwelling with some fluctuations until the end of the experiment. In the extreme treatment of the recurring mode, CR rates dropped on day 19 and remained fairly constant until day 31 and increased again from day 33 to day 35, due to the development of a Prymnesiophyceae bloom (see section 3.2). Overall, maximum CR rates were observed on day 35 in all recurring intensities, diminishing at the end of the experiment (day 37), except in the low recurring mode treatment where it remained rather constant.
Cumulative community respiration (CRcum) evolved differently in the various treatments from day 7 onwards (Figure 3A). The CRcum of the singular extreme treatment increased faster than in the rest of the treatments, although it reached similar values to the recurring extreme treatment at the end of the experiment. From day 9 to day 25, CRcum in the low and medium singular mode treatments were higher than those reported in the recurring mode treatments. However, this pattern shifted from day 25 onwards, when CRcum became higher in the low and medium recurring mode treatments than in the singular mode counterparts. CRcum displayed a positive relationship with upwelling intensity (Figure 3B), with a similar effect for both upwelling modes after the last deep water addition to the recurring treatment.
Figure 3
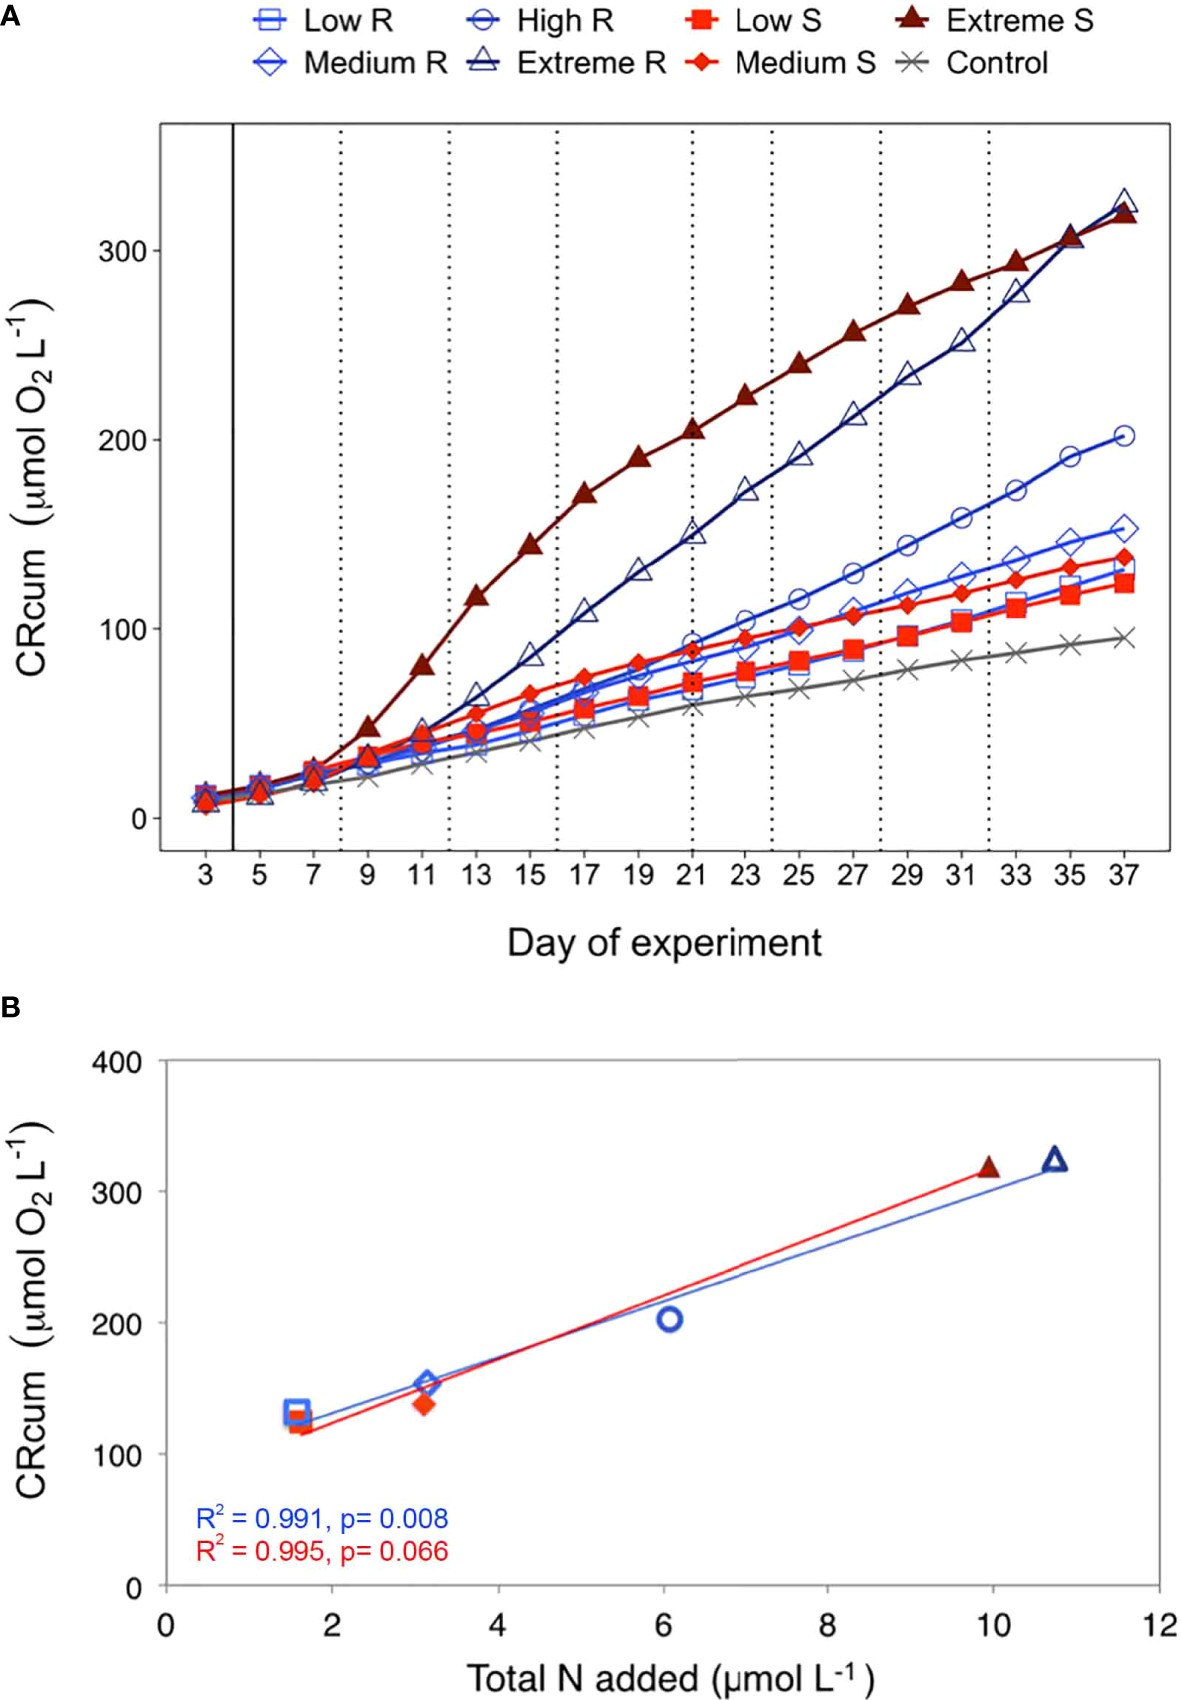
(A) Temporal development of plankton community respiration as accumulated rates (CRcum) over the course of the experiment in the control and in the two treatments: singular and recurring. The solid black line indicates the first deepwater addition (except the control). The dotted black lines indicate the additions made only during the recurring treatment. (B) Accumulated community respiration (CRcum) at the end of the experiment (day 37) per µmol of nutrients added.
3.2 Contribution of different planktonic groups to total community biomass and respiration
The different upwelling modes and intensities impacted the contribution of different planktonic groups to total community biomass (Figure 4). Microplankton was favoured under extreme upwelling intensities (Figures 4F, G), contributing up to 75% and 50% of the biomass in the singular and recurring modes, respectively. The contribution of nanoplankton to total community biomass was relatively high throughout the experiment in the low treatments of both upwelling modes (Figures 4A, B), as well as in the control (Figure 4H), ranging from 24 to 54%. In the high and extreme recurring mode treatments (Figures 4E–G) the contribution of nanoplankton increased at the end of the experiment (from day 31 onwards), due in large part to the development of a Prymnesiophyceae bloom, representing up to 55% and 60% respectively, but only after the last nutrient addition made on day 32.
Figure 4
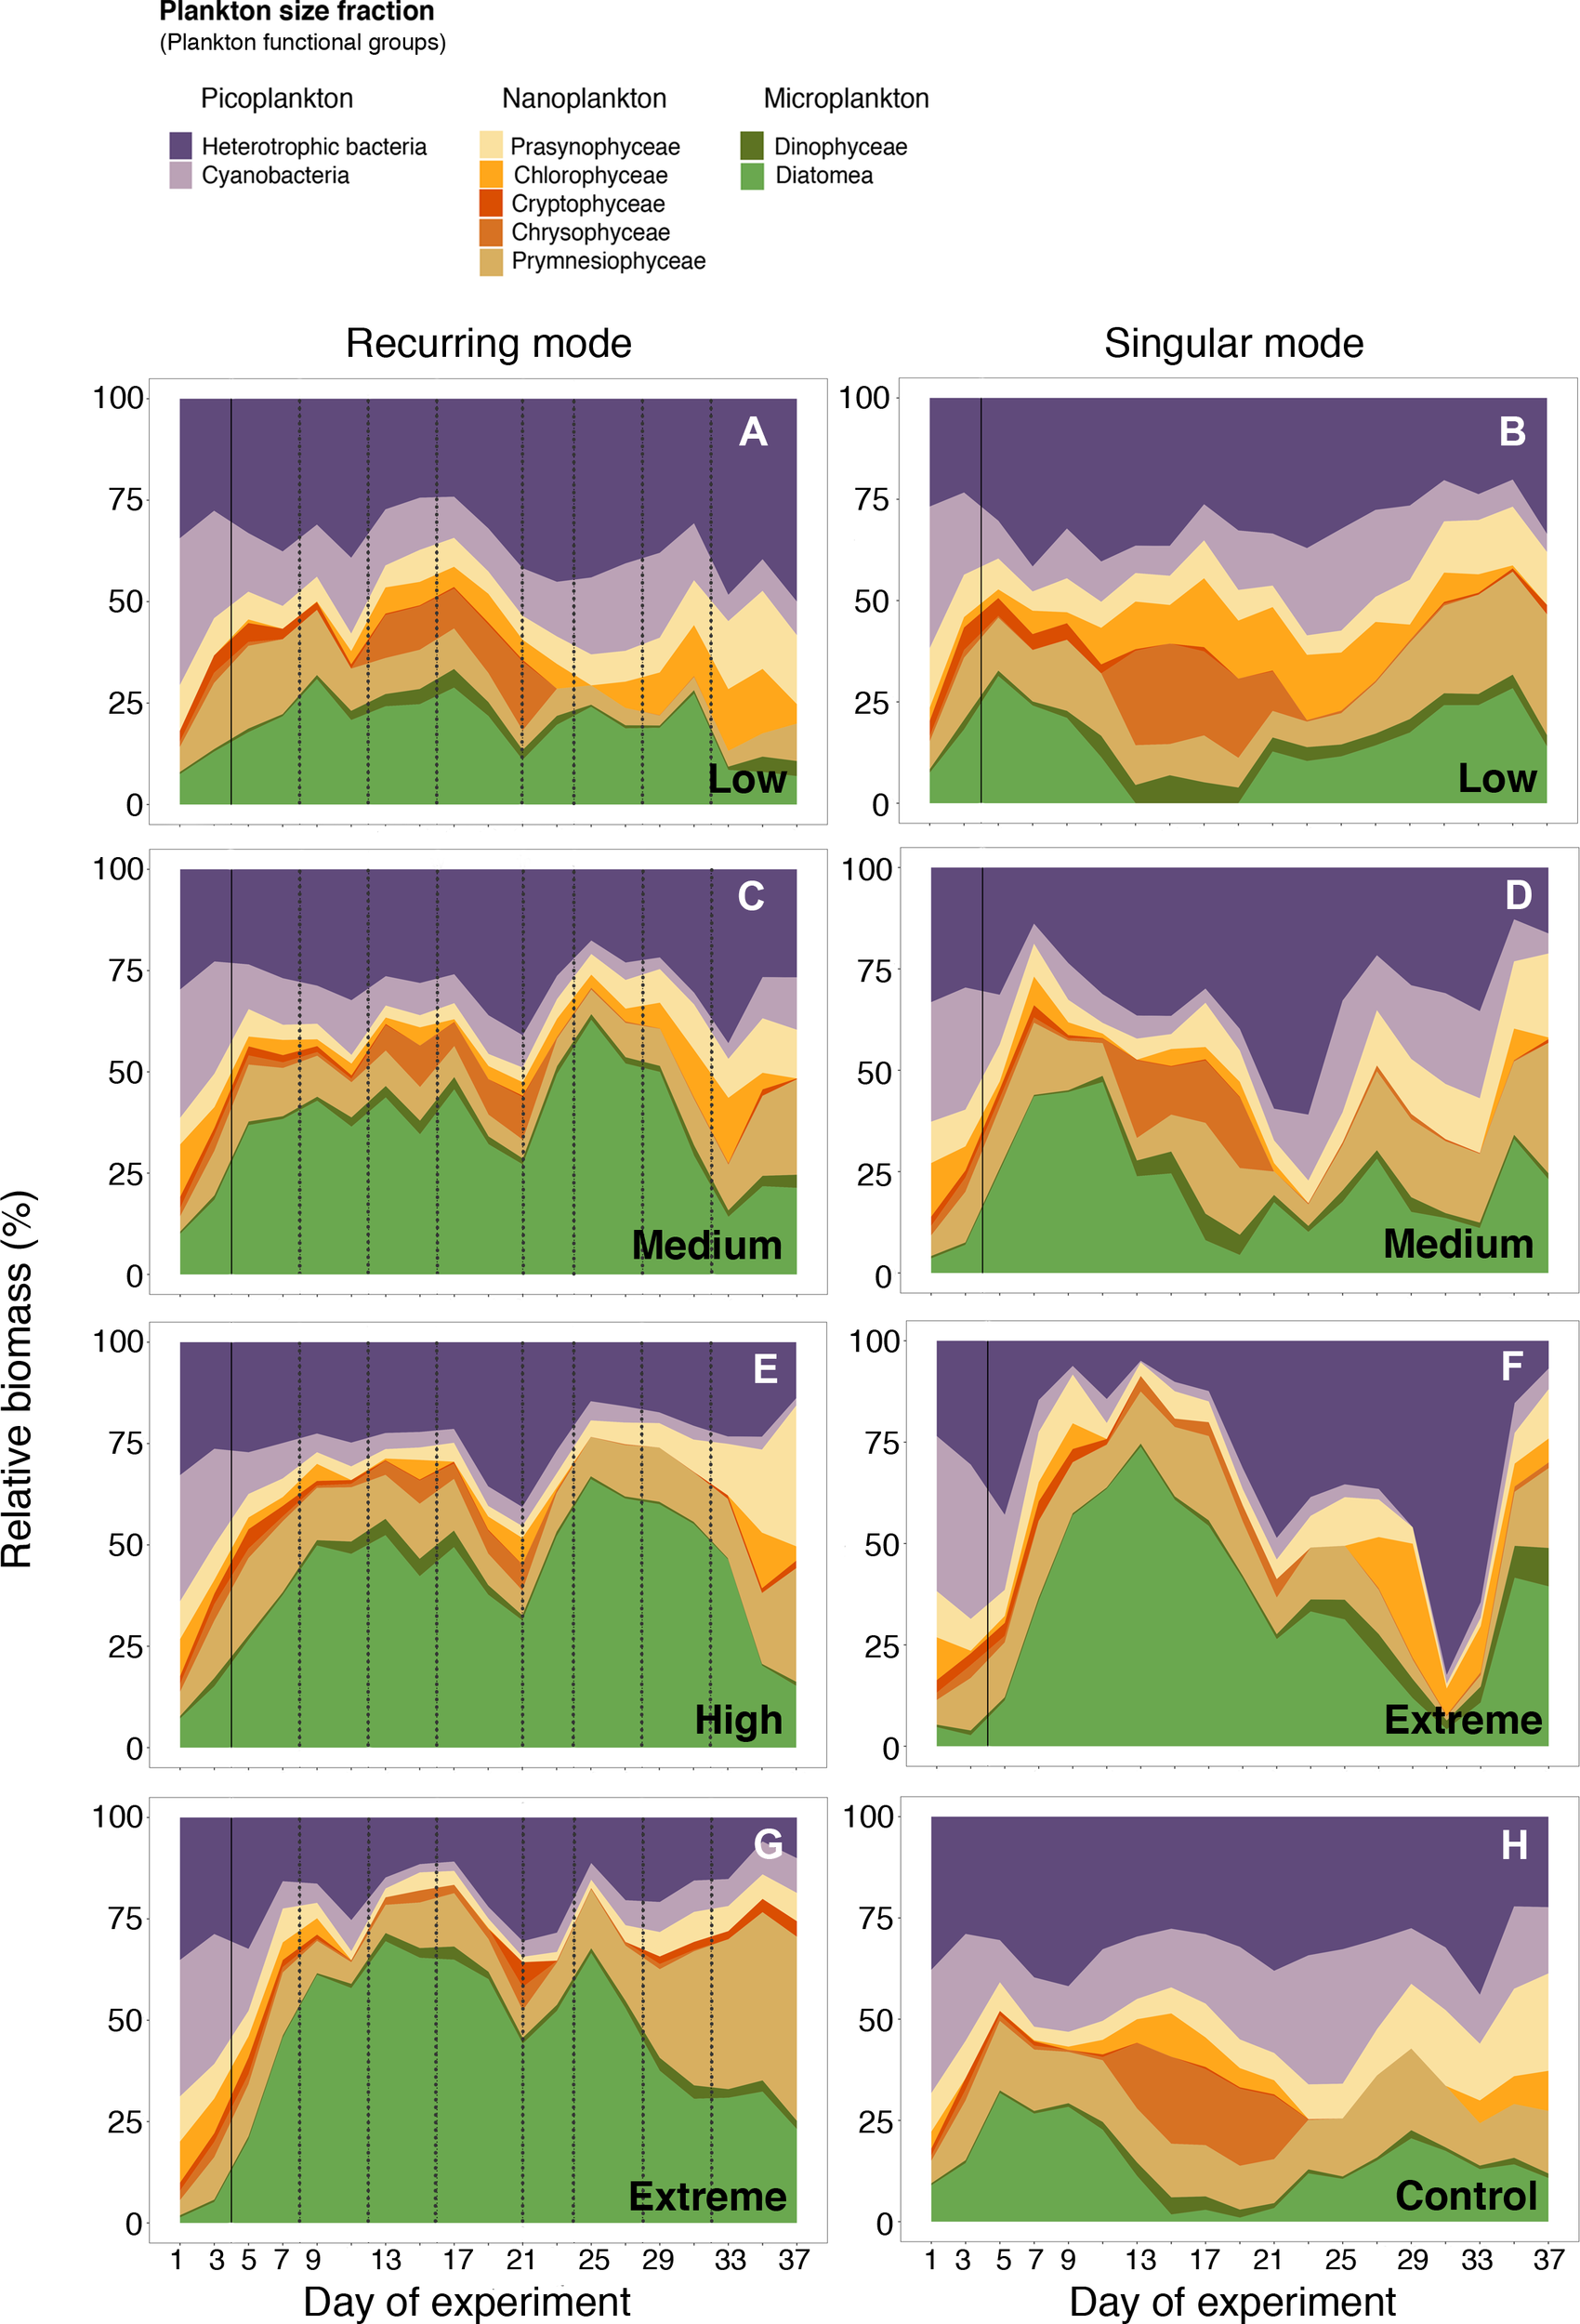
Relative contribution of plankton community composition (represented as size fractions: Pico-, Nano- and Microplankton) over the course of the experiment. Picoplankton: heterotrophic bacteria and cyanobacteria; Nanoplankton: prasynophyceae, chlorophyceae, cryptophyceae, chrysophyceae and prymnesiophyceae; Microplankton: dinophyceae and diatomea. The solid black line indicates the first deep-water addition (except in the control). The dotted black lines indicate the addition made only to the recurring treatment. Panels (A, C, E, G) refer to recurring mode, and panels (B, D, F) to singular mode from low to extreme upwelling intensities (respectively). Panel (H) is the control.
The contribution of picoplankton to total community biomass was higher in the control and in the low and medium recurring treatments (Figures 4A, C, H) than in the rest of the treatments. In the low recurring treatment, cyanobacteria represented between 10 and 20% of the biomass, whereas heterotrophic bacteria represented from 25 to 50% of the biomass (Figure 4A). In the low singular treatment, cyanobacteria ranged between 4 and 18%, and heterotrophic bacteria between 25 and 40% (Figure 4B). From day 21 to 31, the contribution of heterotrophic bacteria increased in the extreme singular mode treatment, exceeding the contribution of microplankton to total biomass with values up to 75% (Figure 4F).
Different plankton groups contributed to explaining the variance observed in CR, as revealed by the stepwise multiple regression analysis performed with the biomass of plankton groups and CR during the experiment (Table 1). Particularly, large phytoplankton cells (i.e., microplankton and nanoplankton) were the most important variables explaining the variance in CR during extreme recurring and singular treatments, respectively, but also a notable proportion of the variance in the rest of the treatments, ranging from 57% in the medium recurrent treatment to 87% in the low recurrent treatment. In the case of picoplankton, their contributions to CR turned out to be relevant depending on the upwelling mode intensities. For example, in the recurring mode cyanobacteria explained 22 and 26% of the variance in the high and medium simulated-upwelling treatments, whereas heterotrophic bacteria explained 12 and 16% respectively. However, in the singular mode, heterotrophic bacteria explained 24% and 32% of the CR variance in the medium and low treatments respectively, whereas cyanobacteria did not appear as an explanatory variable.
Table 1
| Upwelling mode | Upwelling intensity | Xi | R2 adjust | pvalue | F statistic | RI(%) |
|---|---|---|---|---|---|---|
| Recurring | Extreme | DiatomsChlorophyceaeCryptophyceae | 0.747 | <0.001 | 17.72 | 46.6239.9113.47 |
| High | CryptophyceaeCyanobacteriaDinoflagellatesPrymnesiophyceaeHet.bacteriaChlorophyceae | 0.790 | <0.001 | 10.4 | 25.9622.4914.7112.5712.2612.01 | |
| Medium | DinoflagellatesCyanobacteriaDiatomsHet. bacteria | 0.647 | <0.01 | 8.32 | 36.0526.612116.33 | |
| Low | ChlorophyceaePrymnesiophyceaeCyanobacteriaChrysophyceae | 0.578 | <0.01 | 6.48 | 44.7836.1912.696.34 | |
| Control | DinoflagellatesHet.bacteriaChlorophyceaePrymnesiophyceaeDiatoms | 0.598 | <0.05 | 4.72 | 48.3017.1817.138.718.66 | |
| Singular | Extreme | DiatomsCryptophyceaePrymnesiophyceae | 0.923 | <0.0001 | 69.26 | 36.8037.8025.41 |
| Medium | DiatomsHet.bacteriaDinoflagellatesCryptophyceaeChlorophyceae | 0.876 | <0.0001 | 23.71 | 41.6624.5013.9713.526.34 | |
| Low | PrymnesiophyceaeHet.bacteriaDinoflagellatesCryptophyceae | 0.484 | <0.05 | 4.51 | 48.4632.5012.047 | |
Stepwise multiple linear regression statistics between plankton community respiration (CR) with the biomasses of heterotrophic bacteria (Het. bacteria) and the different phytoplankton groups (Cyanobacteria, Prasynophyceae, Chlorophyceae, Cryptophyceae, Chrysophyceae and Prymnesiophyceae, Diatoms and Dinoflagellates), under the different upwelling modes and intensities, compared to the control (no upwelling).
Xi, statistically significant predictor variables; R2 adjust, adjusted correlation coefficient; RI(%), percentage of the variance explained by each group.
4 Discussion
4.1 Variability in community respiration in the different simulated-upwelling intensity and modes
Here, we tested the effects of different simulated-upwelling modes and intensities in a longer (37-day) experiment and found that CR varied significantly among upwelling modes and intensities (LME model, p<0.005, Figure 2), driven by changes in the planktonic community structure.
Following the initial nutrient fertilization on day 4, the temporal variability in CR displayed two distinguishable patterns according to the upwelling modes. Singular treatments induced an abrupt increase in CR rates, reaching their maximum values between days 7 and 13, a few days after the deep-water addition. In contrast, recurring treatments provoked a gradual boost in CR, which reached its maximum rates towards the end of the experiment (day 35). The mode in which upwelling events release nutrients into oligotrophic waters, either through singular or recurring pulses, can consequently modulate CR in the short- or long-term, respectively.
Interestingly, a different timing in the response of CR to nutrient fertilisation was observed under the singular treatments, showing a lag of between 5 and 9 days depending on the simulated-upwelling intensity. These results were also observed in another mesocosm experiment conducted at the same location (Filella et al., 2018). In that study, it took around 5 days for CR to be significantly stimulated after the singular deep-water fertilisation. This could explain the discrepancy between our study and the short-term (4 days) study carried out by McAndrew et al. (2007), as 4 days may not be sufficient to fully detect the CR response. Consequently, we stress that longer experiments (at least > 5 days) are needed to adequately assess the impact of variable upwelling events on CR and thus, to better understand their role within coastal upwelling systems.
The effect of upwelling modes and intensities on CR are also evident from the trend of CRcum along the experiment (Figure 3A). A closer look at the slope of CRcum plotted for each treatment revealed changes throughout the experiment, which could be mainly explained by shifts in the planktonic community structure. For instance, the phytoplankton community under the extreme singular treatment shifted from a microplankton-dominated (between day 7 and day 15) to a pico- (heterotrophic bacteria) and nanoplankton-dominated community (between day 17 and day 29) and finally, was dominated by nano- and microplankton (from day 31 until the end of the experiment). Similarly, the observed changes in CRcum slope under the extreme recurring treatment corresponded to a shift from a microplankton-dominated (from day 13 to day 31) to a nano- and microplankton-dominated community (from day 33 onwards). In contrast, the slope of CRcum in the low and medium singular treatments was only higher than that in the recurring ones coinciding with the incipient microplankton bloom triggered by the nutrient fertilization on day 4 until its vanishing on day 25 (Ortiz et al., 2022), before falling below the slope of the recurring treatments as picoplankton dominated the community. A similar size-related pattern has been described in other coastal upwelling systems (Sherr et al., 2005; Lassiter et al., 2006; Wilkerson et al., 2006; Smayda and Trainer, 2010; Anabalón et al., 2014). Looking into the trend of CRcum relative to nutrient fertilisation (as total nitrogen added until the end of the experiment) (Figure 3B), increases in the intensity of both upwelling modes resulted in a linear rise in CRcum, consequently affecting the amount of carbon cycling.
Our results reveal that changes in CRcum during different simulated upwelling events could therefore be attributed to the ways different plankton community structures responded to changes of upwelling modes and intensities. In the following sections, we describe the plankton functional groups that potentially accounted for the observed variance in CR and how these can affect the metabolic balance and therefore, carbon sequestration of upwelling regions.
4.2 Contribution of plankton functional groups to community respiration and metabolic balance
Diatoms bloomed in the extreme treatments, accounting for up to 75% of the total biomass (Figures 4F ,G). Similar increases in diatom biomass have been previously reported in oceanic regions after inorganic nutrient pulses via mixing, eddies, fronts and upwelling events (e.g., Hutchings et al., 1995; Arístegui et al., 2004; Edwards and Richardson, 2004; Arístegui and Montero, 2005; Clayton et al., 2014; Tréguer et al., 2018) as well as in experimental manipulations (Mahaffey et al., 2012; Anil et al., 2021). Temporal variations in CR matched shifts in community structure. Thus, the early rise in diatom biomass (75% on day 13 in the extreme singular treatment and 62% on day 17 in the recurring treatment) coincided with high CR rates (293 and 183 mg O2 m-3 d-1, respectively), meaning that a meaningful fraction of the intracellular carbon pool newly fixed through photosynthesis was potentially lost by autotrophic respiration. Multiple stepwise linear regressions further revealed that diatoms explained between 37% and 47% of the variance in CR, in the extreme singular and recurring treatments, respectively (Table 1). Following nutrient depletion (day 9 and beyond day 32 onwards in the singular and extreme recurring treatment, respectively, Figure 1A), diatoms were outcompeted by nanoplankton (Böttjer et al., 2007). Our results revealed that diatoms and nanoplankton were the main contributors to explaining the variance in CR under extreme upwelling intensities.
Contrary to expectations (e.g., Edwards and Richardson, 2004; Du and Peterson, 2014; Bode et al., 2015), dinoflagellates did not thrive under low upwelling intensities (Figures 4A,B). On the other hand, picoplanktonic organisms (heterotrophic bacteria and cyanobacteria) are usually recognized as extremely efficient in nutrient acquisition at low concentrations due to their small size (i.e., higher surface/volume ratio). Hence, they are deemed to contribute more importantly to carbon fluxes in nutrient deplete rather than in nutrient replete regions (Del Giorgio et al., 1997; Gasol and Duarte, 2000; Zubkov 2014). In our study, heterotrophic bacteria displayed contrasting patterns between upwelling modes, decreasing in relative biomass as the upwelling intensities increased in the recurring mode (from ~40% in the low to 25% in the extreme treatment; Figures 4A-G) and increasing in the singular ones (from ~40% in the low to >80% in the extreme treatment; Figures 4B-F) with a posterior drop (between 25 – 10%) when nutrients were exhausted. Given that large blooms were induced in the extreme treatments (Ortiz et al., 2022) we expected that heterotrophic bacteria would be stimulated by the DOC released and would actively contribute to CR (Blight et al., 1995). Nonetheless, DOC remarkably accumulated in the extreme treatments (Gómez-Letona et al., 2022) suggesting that a major part of this DOC was not utilized by heterotrophic bacteria, which would explain the low contribution to CR in these treatments. A variable contribution of heterotrophic bacteria to the variance in CR was found in the other upwelling intensities (16% and 12% under medium and high recurring treatments and 33% and 25% under low and medium singular treatments). The fact that heterotrophic bacteria explained less than 33% of the CR variance in these singular treatments was surprising, given their high relative biomass. This points to a variable metabolic activity of bacteria, that does not depend only on the accumulated biomass.
A previous study carried out along two latitudinal transects from 50°N to 44°S in the Atlantic Ocean showed that the contribution of bacteria to CR is highly variable (4-77%), suggesting that Chl-a and other factors rather than those assessed in that study (such as nutrient availability and temperature) must be driving such variability (García-Martín et al., 2017). Flagellate grazing is recognized as one of the main factors controlling marine bacterial communities (Böttjer and Morales, 2007; Bunse and Pinhassi, 2017). Accordingly, we observed declines in the relative biomass of heterotrophic bacteria coinciding with the enhancement of nanoplankton biomass, suggesting a strong predation pressure and, therefore, a potential top-down control over heterotrophic bacteria. Such drops in biomass contribution can be observed through the experiment in the different upwelling intensities and modes. Grazing could also affect cyanobacterial populations, which were only identified as predictors of the variance in CR in the singular mode. Nevertheless, we do not discard that other factors external to our observations may be acting. For example, there might be heterogeneity in the respiration rates dynamics of different bacterioplankton groups, derived from the strong metabolic heterogeneity among the different components of bacterial communities (Cottrell and Kirchman, 2000; Alonso-Sáez et al., 2012). Furthermore, viral lysis (not taken into account in this study) may play a significant role in controlling the abundance of different bacterioplankton groups (Breitbart et al., 2008), causing bacterial mortality and thus could affect the patterns observed here.
The planktonic community structure, while modulating CR variability, would display a key role in regulating the metabolic balance of the ecosystem, shifting it towards net-heterotrophy when the planktonic community is dominated by small heterotrophs and to net-autotrophy when large autotrophs prevail (Ortiz et al., 2022). Altogether, our results suggest that upwelling regions subject to low upwelling intensities will tend to display a heterotrophic metabolism dominance during relaxation or low-intensity upwelling episodes, thus decreasing the carbon sequestration capacity. On the contrary, the metabolic balance in upwelling regions subjected to extreme upwelling intensities will depend on the mode in which nutrients are supplied to the system. Thus, in natural systems where upwelling pulses are markedly separated in time or under sudden dust deposition events (similar to our extreme singular treatment), upwelling regions could support a high CR, but decoupled in time from primary production. This would be followed by an increase in net heterotrophy as primary production decreases after the initial bloom. On the other hand, periods of recurring upwelling intensities would lead to a net-autotrophic system, potentially increasing the carbon sequestration of the system.
5 Conclusions
We studied the link between the variability in community respiration rates and shifts in the planktonic community structure under different modes and intensities of simulated upwelling over a long term (37 days) mesocosm experiment. Our results suggest that CR is particularly sensitive to changes in the upwelling intensities but more significantly to the mode in which nutrients are supplied to the oligotrophic waters. The simulated upwelling events in this study were responsible for profound modifications in planktonic community structure, which in turn acted as a strong driver of CR variability, modulating the carbon respired through the different microbial functional groups. Thus, as upwelling intensity became extreme, planktonic communities were entirely dominated by microplankton (mainly diatoms) and nanoplankton. Particularly in the singular mode, the extreme simulated-upwelling intensity reported the highest CR rates coinciding with a bloom of diatoms, giving evidence of the strong link between the autotrophic component and the observed variance in CR.
On the contrary, less pronounced intensities favoured smaller cells (heterotrophic bacteria and cyanobacteria) identified as better predictors of the variance in CR, potentially channelling a more significant fraction of carbon through the microbial food web. Nonetheless, the contribution to biomass of picoplankton was variable, presumably due to grazing or viral pressure, affecting their contribution to CR.
Our results offer insights into how future alterations in the modes and intensities of upwelling systems can potentially shift the planktonic community structure, affecting CR and therefore, the metabolic balance of the system. Thus, when the type of planktonic community is dominated by small heterotrophs the system shifts toward net-heterotrophy while net-autotrophy is observed when autotrophic-based communities prevailed. This highlights the importance of such changes in the carbon sequestration of upwelling regions. Understanding the link between respiratory losses and planktonic communities is a fundamental requisite to improving our predictive capacity of how these ecosystems will respond to future global change scenarios.
Funding
This study was carried out within the framework of the Ocean Artificial Upwelling project (Ocean artUp, No. 695094), funded by an Advanced Grant of the European Research Council (ERC). Additional support was provided through projects TRIATLAS (AMD-817578-5) from the European Union’s Horizon 2020, FONIAC 2019 (Fundación Caja Canarias and Fundación Bancaria La Caixa), and e-IMPACT (PID2019-109084RB-C2) funded by the Spanish National Science Plan. IB is supported by a FPI fellowship (BES-2016-078407) from the Spanish Ministry of Economy, Industry and Competitiveness (MINECO). MGL is supported by the Ministerio de Ciencia, Innovación y Universidades, Gobierno de España (FPU17-01435) during his PhD. JA was supported by a Helmholtz International Fellow Award, 2015 (Helmholtz Association, Germany). JA also acknowledges support from the United States National Science Foundation grant OCE-1840868 to the Scientific Committee on Oceanic Research (SCOR, United States) WG 155.
Acknowledgments
We would like to thank the Oceanic Platform of the Canary Islands (Plataforma Oceánica de Canarias, PLOCAN) for their support throughout the experiment. We would like to thank the captain and crew of RV James Cook for the deployment of the mesocosms and the deep water collection, and the captain and crew of the vessel J. SOCAS for helping with the second deep water collection and the recovery of the mesocosms. Another special thanks goes to the whole KOSMOS team (GEOMAR) for their invaluable effort, organization and logistical support necessary to conduct the mesocosms experiment. Finally, we would like to thank to Minerva Espino and Acorayda González for their contribution to the CR measurements.
Publisher’s note
All claims expressed in this article are solely those of the authors and do not necessarily represent those of their affiliated organizations, or those of the publisher, the editors and the reviewers. Any product that may be evaluated in this article, or claim that may be made by its manufacturer, is not guaranteed or endorsed by the publisher.
Statements
Data availability statement
The raw data supporting the conclusions of this article will be made available by the authors, without undue reservation.
Author contributions
Conceived and designed the study: UR and JA. Execution of the experiment: all authors. Data analysis: IB, JA, MB, JO and KS. Manuscript writing: IB and JA with input from all co-authors. All authors contributed to the article and approved the submitted version.
Conflict of interest
The authors declare that the research was conducted in the absence of any commercial or financial relationships that could be construed as a potential conflict of interest.
References
1
Alonso-Sáez L. Sánchez O. Gasol J. M. (2012). Bacterial uptake of low molecular weight organics in the subtropical Atlantic: Are major phylogenetic groups functionally different? Limnology Oceanography57 (3), 798–808. doi: 10.4319/lo.2012.57.3.0798
2
Anabalón V. Arístegui J. Morales C. E. Andrade I. Benavides M. Correa-Ramírez M. A. et al . (2014). The structure of planktonic communities under variable coastal upwelling conditions off cape ghir (31 n) in the canary current system (NW Africa). Prog. Oceanography120, 320–339. doi: 10.1016/j.pocean.2013.10.015
3
Anil A. C. Desai D. V. Khandeparker L. Krishnamurthy V. Mapari K. Mitbavkar S. et al . (2021). Short term response of plankton community to nutrient enrichment in central eastern Arabian Sea: Elucidation through mesocosm experiments. J. Environ. Manage.288, 112390. doi: 10.1016/j.jenvman.2021.112390
4
Arístegui J. Barton E. D. Tett P. Montero M. F. García-Muñoz M. Basterretxea G. et al . (2004). Variability in plankton community structure, metabolism, and vertical carbon fluxes along an upwelling filament (Cape juby, NW Africa). Prog. Oceanography62 (2-4), 95–113. doi: 10.1016/j.pocean.2004.07.004
5
Arístegui J. Montero M. F. (1995). The relationship between community respiration rate and ETS activity in the ocean. J. Plankton Res.17, 1563–1571. doi: 10.1093/plankt/17.7.1563
6
Arístegui J. Montero M. F. (2005). Temporal and spatial changes in plankton respiration and biomass in the canary islands region: The effect of mesoscale variability. J. Mar. System54, 65–82. doi: 10.1016/j.jmarsys.2004.07.004
7
Azam F. Malfatti F. (2007). Microbial structuring of marine ecosystems. Nat. Rev. Microbiol.5 (10), 782–791. doi: 10.1038/nrmicro1747
8
Bakun A. (1990). Global climate change and intensification of coastal ocean upwelling. Science247 (4939), 198–201. doi: 10.1126/science.247.4939.198
9
Basu S. Mackey K. R. (2018). Phytoplankton as key mediators of the biological carbon pump: Their responses to a changing climate. Sustainability10 (3), 869. doi: 10.3390/su10030869
10
Baumann M. Taucher J. Paul A. J. Heinemann M. Vanharanta M. Bach L. T. et al . (2021). Effect of intensity and mode of artificial upwelling on particle flux and carbon export. Front. Mar. Sci.8, 742142. doi: 10.3389/fmars.2021.742142
11
Blight S. P. Bentley T. L. Lefevre D. Robinson C. Rodrigues R. Rowlands J. et al . (1995). Phasing of autotrophic and heterotrophic plankton metabolism in a temperate coastal ecosystem. Mar. Ecol. Prog. Ser.128, 61–75. doi: 10.3354/meps128061
12
Bode A. Estévez M. G. Varela M. Vilar J. A. (2015). Annual trend patterns of phytoplankton species abundance belie homogeneous taxonomical group responses to climate in the NE Atlantic upwelling. Mar. Environ. Res.110, 81–91. doi: 10.1016/j.marenvres.2015.07.017
13
Böttjer D. Morales C. E. (2007). Nanoplanktonic assemblages in the upwelling area off concepción (36S), central Chile: Abundance, biomass, and grazing potential during the annual cycle. Prog. Oceanography75 (3), 415–434. doi: 10.1016/j.pocean.2007.08.024
14
Breitbart M. Middelboe M. Rohwer F. (2008). “Marine viruses: community dynamics, diversity and impact on microbial processes,” in Microbial ecology of the oceans. Ed. KirchmamD. L. (Hoboken, NJ, USA: John Wiley & Sons Inc), 443–479.
15
Bryan J. R. Rlley J. P. Williams P. L. (1976). A winkler procedure for making precise measurements of oxygen concentration for productivity and related studies. J. Exp. Mar. Biol. Ecol.21 (3), 191–197. doi: 10.1016/0022-0981(76)90114-3
16
Bunse C. Pinhassi J. (2017). Marine bacterioplankton seasonal succession dynamics. Trends Microbiol.25 (6), 494–505. doi: 10.1016/j.tim.2016.12.013
17
Capone D. G. Hutchins D. A. (2013). Microbial biogeochemistry of coastal upwelling regimes in a changing ocean. Nat. Geosci.6 (9), 711–717. doi: 10.1038/ngeo1916
18
Carritt D. E. Carpenter J. H. (1966). Comparison and evaluation of currently employed modifications of the winkler method for determining dissolved oxygen in seawater; a NASCO report. J. Mar. Res.24, 286–318.
19
Clayton S. Nagai T. Follows M. J. (2014). Fine scale phytoplankton community structure across the kuroshio front. J. Plankton Res.36 (4), 1017–1030. doi: 10.1093/plankt/fbu020
20
Cottrell M. T. Kirchman D. L. (2000). Natural assemblages of marine proteobacteria and members of the cytophaga-flavobacter cluster consuming low-and high-molecular-weight dissolved organic matter. Appl. Environ. Microbiol.66 (4), 1692–1697. doi: 10.1128/AEM.66.4.1692-1697.2000
21
Daneri G. Dellarossa V. Quiñones R. Jacob B. Montero P. Ulloa O. (2000). Primary production and community respiration in the Humboldt current system off Chile and associated oceanic areas. Mar. Ecol. Prog. Ser.197, 41–49. doi: 10.3354/meps197041
22
Del Giorgio P. A. Cole J. J. Cimbleris A. (1997). Respiration rates in bacteria exceed phytoplankton production in unproductive aquatic systems. Nature385 (6612), 148–151. doi: 10.1038/385148a0
23
Du X. Peterson W. T. (2014). Seasonal cycle of phytoplankton community composition in the coastal upwelling system off central Oregon in 2009. Estuaries Coasts37 (2), 299–311. doi: 10.1007/s12237-013-9679-z
24
Edwards M. Richardson A. J. (2004). Impact of climate change on marine pelagic phenology and trophic mismatch. Nature430, 881–884. doi: 10.1038/nature02808
25
Filella A. Baños I. Montero M. F. Hernández-Hernández N. Rodríguez-Santos A. Ludwig A. et al . (2018). Plankton community respiration and ETS activity under variable CO2 and nutrient fertilization during a mesocosm study in the subtropical north Atlantic. Front. Mar. Sci.5. doi: 10.3389/fmars.2018.00310
26
García-Martín E. E. Aranguren-Gassis M. Hartmann M. Zubkov M. V. Serret P. (2017). Contribution of bacterial respiration to plankton respiration from 50 n to 44 s in the Atlantic ocean. Prog. oceanography158, 99–108. doi: 10.1016/j.pocean.2016.11.006
27
García-Reyes M. Sydeman W. J. Schoeman D. S. Rykaczewski R. R. Black B. A. Smit A. J. et al . (2015). Under pressure: Climate change, upwelling, and eastern boundary upwelling ecosystems. Front. Mar. Sci.2. doi: 10.3389/fmars.2015.00109
28
Gasol J. M. Duarte C. M. (2000). Comparative analyses in aquatic microbial ecology: how far do they go? FEMS Microbiol. Ecol.31 (2), 99–106. doi: 10.1111/j.1574-6941.2000.tb00675.x
29
Gómez-Letona M. Sebastian M. Baños I. Montero M. F. Barrancos C. P. Baumann M. et al . (2022). Artificial upwelling leads to a large increase in surface dissolved organic matter concentrations. bioRxiv. doi: 10.1101/2022.06.27.496799
30
Grasshoff K. (1983). Determination of oxygen. Methods seawater Anal., 61–72.
31
Grömping U. (2006). Relative importance for linear regression in r: The package relaimpo. J. Stat. Software17 (1), 1–27. doi: 10.18637/jss.v017.i01
32
Hutchings L. Pitcher G. C. Probyn T. A. Bailey G. W. (1995). The chemical and biological consequences of coastal upwelling. Environ. Sci. Res. Rep. Es18, 65–82.
33
Kämpf J. Chapman P. (2016). Upwelling systems of the world (Switzerland:Springer International Publishing), 31–42.
34
Lassiter A. M. Wilkerson F. P. Dugdale R. C. Hogue V. E. (2006). Phytoplankton assemblages in the CoOP-WEST coastal upwelling area. Deep Sea Res. Part II: Topical Stud. Oceanography53 (25-26), 3063–3077. doi: 10.1016/j.dsr2.2006.07.013
35
Legendre L. Michaud J. (1998). Flux of biogenic carbon in oceans: Size-dependent regulation by pelagic food webs. Mar. Ecol. Prog. Ser.164, 1–11. doi: 10.3354/meps164001
36
Mackey M. D. Mackey D. J. Higgins H. W. Wright S. W. (1996). CHEMTAX-a program for estimating class abundances from chemical markers: application to HPLC measurements of phytoplankton. Mar. Ecol. Prog. Ser.144, 265–283. doi: 10.3354/meps144265
37
Mahaffey C. Björkman K. M. Karl D. M. (2012). Phytoplankton response to deep seawater nutrient addition in the north pacific subtropical gyre. Mar. Ecol. Prog. Ser.460, 13–34. doi: 10.3354/meps09699
38
McAndrew P. M. Björkman K. M. Church M. J. Morris P. J. Jachowski N. Williams P. J. L. B. et al . (2007). Metabolic response of oligotrophic plankton communities to deep water nutrient enrichment. Mar. Ecol. Prog. Ser.332, 63–75. doi: 10.3354/meps332063
39
Moncoiffé G. Alvarez-Salgado X. A. Figueiras F. G. Savidge G. (2000). Seasonal and short-time-scale dynamics of microplankton community production and respiration in an inshore upwelling system. Mar. Ecol. Prog. Ser196, 111–126. doi: 10.3354/meps196111
40
Montero P. Daneri G. Cuevas L. A. González H. E. Jacob B. Lizárraga L. et al . (2007). Productivity cycles in the coastal upwelling area off concepción: The importance of diatoms and bacterioplankton in the organic carbon flux. Prog. Oceanography75 (3), 518–530. doi: 10.1016/j.pocean.2007.08.013
41
Ortiz J. Arístegui J. Taucher J. Riebesell U. (2022). Artificial upwelling in singular and recurring mode: Consequences for net community production and metabolic balance. Front. Mar. Sci8, 743105. doi: 10.3389/fmars.2021.743105
42
Pinheiro J. Bates D. DebRoy S. Sarkar D. Team R. C. (2007). Linear and nonlinear mixed effects models. R Package versions3 (57), 1–89.
43
Riebesell U. Bellerby R. G. J. Grossart H. P. Thingstad F. (2008). Mesocosm CO 2 perturbation studies: from organism to community level. Biogeosciences5 (4), 1157–1164. doi: 10.5194/bg-5-1157-2008
44
Riebesell U. Czerny J. von Bröckel K. Boxhammer T. Büdenbender J. Deckelnick M. et al . (2013). A mobile sea-going mesocosm system–new opportunities for ocean change research. Biogeosciences10 (3), 1835–1847. doi: 10.5194/bg-10-1835-2013
45
Robinson C. Serret P. Tilstone G. Teira E. Zubkov M. V. Rees A. P. et al . (2002). Plankton respiration in the eastern Atlantic ocean. Deep Sea Res. Part I: Oceanographic Res. Papers49 (5), 787–813. doi: 10.1016/S0967-0637(01)00083-8
46
Ryther J. H. (1969). Photosynthesis and fish production in the sea. Science166 (3901), 72–76. doi: 10.1126/science.166.3901.72
47
Sathyendranath S. Stuart V. Nair A. Oka K. Nakane T. Bouman H. et al . (2009). Carbon-to-chlorophyll ratio and growth rate of phytoplankton in the sea. Mar. Ecol. Prog. Ser.383, 73–84. doi: 10.3354/meps07998
48
Schulz K. G. Bach L. T. Bellerby R. G. J. Bermúdez R. Büdenbender J. Boxhammer T. et al . (2017). Phytoplankton blooms at increasing levels of atmospheric carbon dioxide: Experimental evidence for negative effects on prymnesiophytes and positive on small picoeukaryotes. Front. Mar. Sci.4. doi: 10.3389/fmars.2017.00064
49
Sherr E. B. Sherr B. F. Wheeler P. A. (2005). Distribution of coccoid cyanobacteria and small eukaryotic phytoplankton in the upwelling ecosystem off the Oregon coast during 2001 and 2002. Deep Sea Res. Part II: Topical Stud. Oceanography52 (1-2), 317–330. doi: 10.1016/j.dsr2.2004.09.020
50
Smayda T. J. Trainer V. L. (2010). Dinoflagellate blooms in upwelling systems: Seeding, variability, and contrasts with diatom bloom behaviour. Prog. Oceanography85, 92–107. doi: 10.1016/j.pocean.2010.02.006
51
Sommer U. Aberle N. Engel A. Hansen T. Lengfellner K. Sandow M. et al . (2007). An indoor mesocosm system to study the effect of climate change on the late winter and spring succession of Baltic Sea phyto- and zooplankton. Oecologia150 (4), 655–667. doi: 10.1007/s00442-006-0539-4
52
Tamigneaux E. Legendre L. Klein B. Mingelbier M. (1999). Seasonal dynamics and potential fate of size-fractionated phytoplankton in a temperate nearshore environment (Western gulf of St Lawrence, Canada). Estuarine Coast. Shelf Sci.48 (2), 253–269. doi: 10.1006/ecss.1999.0416
53
Taucher J. Arístegui J. Bach L. T. Guan W. Montero M. F. Nauendorf A. et al . (2018). Response of subtropical phytoplankton communities to ocean acidification under oligotrophic conditions and during nutrient fertilization. Front. Mar. Sci.5. doi: 10.3389/fmars.2018.00330
54
Taucher J. Bach L. T. Boxhammer T. Nauendorf A. Achterberg E. P. Algueró-Muñiz M. et al . (2017). Influence of ocean acidification and deep water upwelling on oligotrophic plankton communities in the subtropical north Atlantic: insights from an in situ mesocosm study. Front. Mar. Sci.4. doi: 10.3389/fmars.2017.00085
55
Tréguer P. Bowler C. Moriceau B. Dutkiewicz S. Gehlen M. Aumont O. et al . (2018). Influence of diatom diversity on the ocean biological carbon pump. Nat. Geosci.11, 27–37. doi: 10.1038/s41561-017-0028-x
56
Wilkerson F. P. Lassiter A. M. Dugdale R. C. Marchi A. Hogue V. E. (2006). The phytoplankton bloom response to wind events and upwelled nutrients during the CoOP WEST study. Deep Sea Res. Part II: Topical Stud. Oceanography53 (25-26), 3023–3048. doi: 10.1016/j.dsr2.2006.07.007
57
Williams P. L. B. Del Giorgio P. A. (2005). Respiration in aquatic ecosystems: history and background. Respiration Aquat. Ecosyst., 1–17. doi: 10.1093/acprof:oso/9780198527084.003.0001
58
Williams P. L. Jenkinson N. W. (1982). A transportable microprocessor controlled precise winkler titration suitable for field station and shipboard use 1. Limnology Oceanography27 (3), 576–584. doi: 10.4319/lo.1982.27.3.0576
59
Zubkov M. V. (2014). Faster growth of the major prokaryotic versus eukaryotic CO2 fixers in the oligotrophic ocean. Nat.Commun.5 (1), 1–6. doi: org/10.1038/ncomms4776
Summary
Keywords
nutrient availability, artificial upwelling, carbon export, EBUS, mesocosm, climate change
Citation
Baños I, Arístegui J, Benavides M, Gómez-Letona M, Montero MF, Ortiz J, Schulz KG, Ludwig A and Riebesell U (2022) Response of plankton community respiration under variable simulated upwelling events. Front. Mar. Sci. 9:1006010. doi: 10.3389/fmars.2022.1006010
Received
28 July 2022
Accepted
27 September 2022
Published
14 October 2022
Volume
9 - 2022
Edited by
Jun Sun, China University of Geosciences Wuhan, China
Reviewed by
Oscar E. Romero, University of Bremen, Germany; Haocai Huang, Zhejiang University, China
Updates
Copyright
© 2022 Baños, Arístegui, Benavides, Gómez-Letona, Montero, Ortiz, Schulz, Ludwig and Riebesell.
This is an open-access article distributed under the terms of the Creative Commons Attribution License (CC BY). The use, distribution or reproduction in other forums is permitted, provided the original author(s) and the copyright owner(s) are credited and that the original publication in this journal is cited, in accordance with accepted academic practice. No use, distribution or reproduction is permitted which does not comply with these terms.
*Correspondence: Isabel Baños, isabel.banos@ieo.csic.es; Javier Arístegui, javier.aristegui@ulpgc.es
This article was submitted to Marine Biogeochemistry, a section of the journal Frontiers in Marine Science
Disclaimer
All claims expressed in this article are solely those of the authors and do not necessarily represent those of their affiliated organizations, or those of the publisher, the editors and the reviewers. Any product that may be evaluated in this article or claim that may be made by its manufacturer is not guaranteed or endorsed by the publisher.