Abstract
Marine microplastics are widely distributed in deep-sea sedimentary environments and are altering sediment compositions and ecological conditions on the seafloor. However, the relation between the distribution of microplastics in deep-sea sediments and the sedimentary dynamic conditions is poorly understood. In this study, we collected surface sediments from some typical geomorphological units (sand dune, sediment drift, and submarine canyon channel/levee) in the northern South China Sea to study composition and distribution of the deep-sea microplastics and their controlling factors. The results show that the microplastic abundance in surface sediments ranges from 19 to 347 p·kg–1, and the identified microplastics consist of 10 types, including dominant polycarbonate (29%), polyethylene (27%), polyester fiber (16%), polyvinyl chloride (13%), and polypropylene (7%), and minor polyethylene terephthalate resin, acrylonitrile-butadiene-styrene, epoxy resin, hydrocarbon resin, and acrylic. The source analysis shows that the deep-sea microplastics may be influenced by riverine inputs from Taiwan and South China. In addition, the microplastic spatial distribution shows that the sand dune and canyon channel contain the highest abundances (136–347 p·kg–1) and more types (4–6 types) of microplastics, which are dominated by relatively high-density polycarbonate or polyvinyl chloride. The canyon levee contains the lowest abundances (19–132 p·kg–1) and less types (1–3 types) of microplastics, which are dominated by relatively low-density polyester fiber or polyethylene. Nevertheless, the microplastic composition of the sediment drift is between those of the canyon channel and the canyon levee. The abundance and polymer type (density) of microplastics all increase with the increased mean grain size of detrital sediments, which represents the progressively enhanced intensity of sedimentary dynamic conditions. We therefore infer that the sedimentary dynamic conditions control the composition and distribution of microplastics in the deep-sea sediments. This study highlights that some deep-sea environments with stronger sedimentary dynamic conditions may accumulate more microplastics, which is of great significance for evaluating the storage and ecological damage of deep-sea microplastics.
1 Introduction
Microplastics (plastic debris with size smaller than 5 mm) have been found throughout the world’s oceans and are changing the marine ecological conditions and the global material cycles (Galloway et al., 2017; Rochman, 2018; MacLeo et al., 2021; Stubbins et al., 2021). The global production of plastics has expanded dramatically in the past half a century, from 1.5 Mt (million tons) in 1950s to 335 Mt in 2016 (Alimba and Faggio, 2019). About 0.16–2.31 Mt of microplastics are transferred from land to ocean annually, and most of microplastics are transported by ocean currents and settled down to the seafloor (Schmidt et al., 2017; Martin et al., 2017; Tekman et al., 2020). Benthic microplastics are distributed in deep-sea sediments spreading all over global oceans, such as Pacific Ocean, Atlantic Ocean, Indian Ocean, Southern Ocean, and Arctic Ocean (van Cauwenberghe et al., 2013; Woodall et al., 2014; Fischer et al., 2015; Kanhai et al., 2019; Cunningham et al., 2020). They have been even detected in the world’s deepest Mariana Trench (Peng X. et al., 2018; Peng et al., 2020). This shows that microplastics have been largely distributed all over the global deep seafloor.
Studies on the distribution of microplastics in deep-sea sediments have achieved remarkable results in recent years. The temporal variations of microplastic abundance from sediment cores in the Xisha Trough of the South China Sea show a great increase, from average 34 p·kg–1 in 1980s to 224 p·kg–1 in 2018 (Chen M. et al., 2020). The abundance of microplastics investigated from a sediment drift in the Mediterranean Sea reaches 3820 p·kg–1, which is one of the highest values reported for world’s deep-sea sedimentary environments, and this is attributed to the transport of near-bottom thermohaline currents (contour currents) (Kane et al., 2020). Although the Arctic Ocean is far from large human activities, its sediments contain microplastics with abundances of 0–200 p·kg–1 in the central basin and of 42–6595 p·kg–1 in the Fram Strait sediments (Bergmann et al., 2017; Kanhai et al., 2019), which could be associated with the transport process of floating sea ice (Peeken et al., 2018). Sediments in the Antarctica marginal seas and nearby Southern Ocean also show average 1300 p·kg–1 microplastics, and the abundance is positively correlated with the clay content of the sediments (Cunningham et al., 2020). These studies have undoubtedly shown that the microplastics are rapidly deposited in various deep-sea sediments, and the seafloor is assumed to be the ultimate sink for the microplastics. However, the correlation between the distribution of microplastics in deep-sea sediments and the sedimentary environments has not been noticed, which hinders our further understanding of the sedimentary conditions and controlling factors of microplastics.
The South China Sea is the largest marginal sea in the western Pacific Ocean, and it is also one of the world’s highest microplastic input areas from surrounding countries (~ 2.65−7.08 Mt/y or 0.61 Mt/y) (Jambeck et al., 2015; Meijer et al., 2021). The sea has complex and diverse deep-sea geomorphological units, such as submarine canyons, sand dunes, sediment drifts, and seamounts (Lüdmann et al., 2005; Reeder et al., 2011; Wang et al., 2016; Chiang et al., 2020). It develops multiscale hydrodynamic processes, like turbidity currents, internal waves, contour currents, and mesoscale eddies (Xiu et al., 2010; Reeder et al., 2011; Zhang et al., 2014; Zhao et al., 2015). This provides us with a natural laboratory to study the microplastic distribution and its interaction with sedimentary dynamic environments. In this study, we investigate the microplastics preserved in surface sediments collected from some contrasted deep-sea geomorphological units in the northern South China Sea, including sand dune, sediment drift, and submarine canyon channel/levee system. The objectives of this study are (1) to determine the composition and abundance of microplastics in the deep-sea sediments and identify their potential sources, and (2) to evaluate relations between microplastic distribution and sedimentary dynamic conditions in the typical geomorphological units of the South China Sea.
2 Materials and methods
2.1 Study area and sample collection
The study area is located on the continental slope between the Dongsha Islands and Taiwan in the northern South China Sea (Figure 1). This area is bounded by the Manila Trench, and its west is the tectonically stable South China slope, while its east is the tectonically active Taiwan accretionary prism (Liu et al., 2008). Three large submarine canyons, namely Formosa Canyon, Penghu Canyon, and Gaoping Canyon, start on the continental shelf and converge into the northern end of the Manila Trench. The Formosa Canyon is located on the stable South China slope, while the Penghu Canyon and the Gaoping Canyon are located on the active Taiwan accretionary prism (Figure 1). Multiscale deep-sea sedimentary dynamic processes have created a diversity of geomorphological units in this area, including bottom currents-controlled sediment drifts (Shao et al., 2007; Zhao et al., 2015), large-scale internal waves-generated sand dunes (Reeder et al., 2011; Tian et al., 2021), and turbidity currents-controlled submarine canyons (Liu et al., 2016; Zhang et al., 2018).
Figure 1
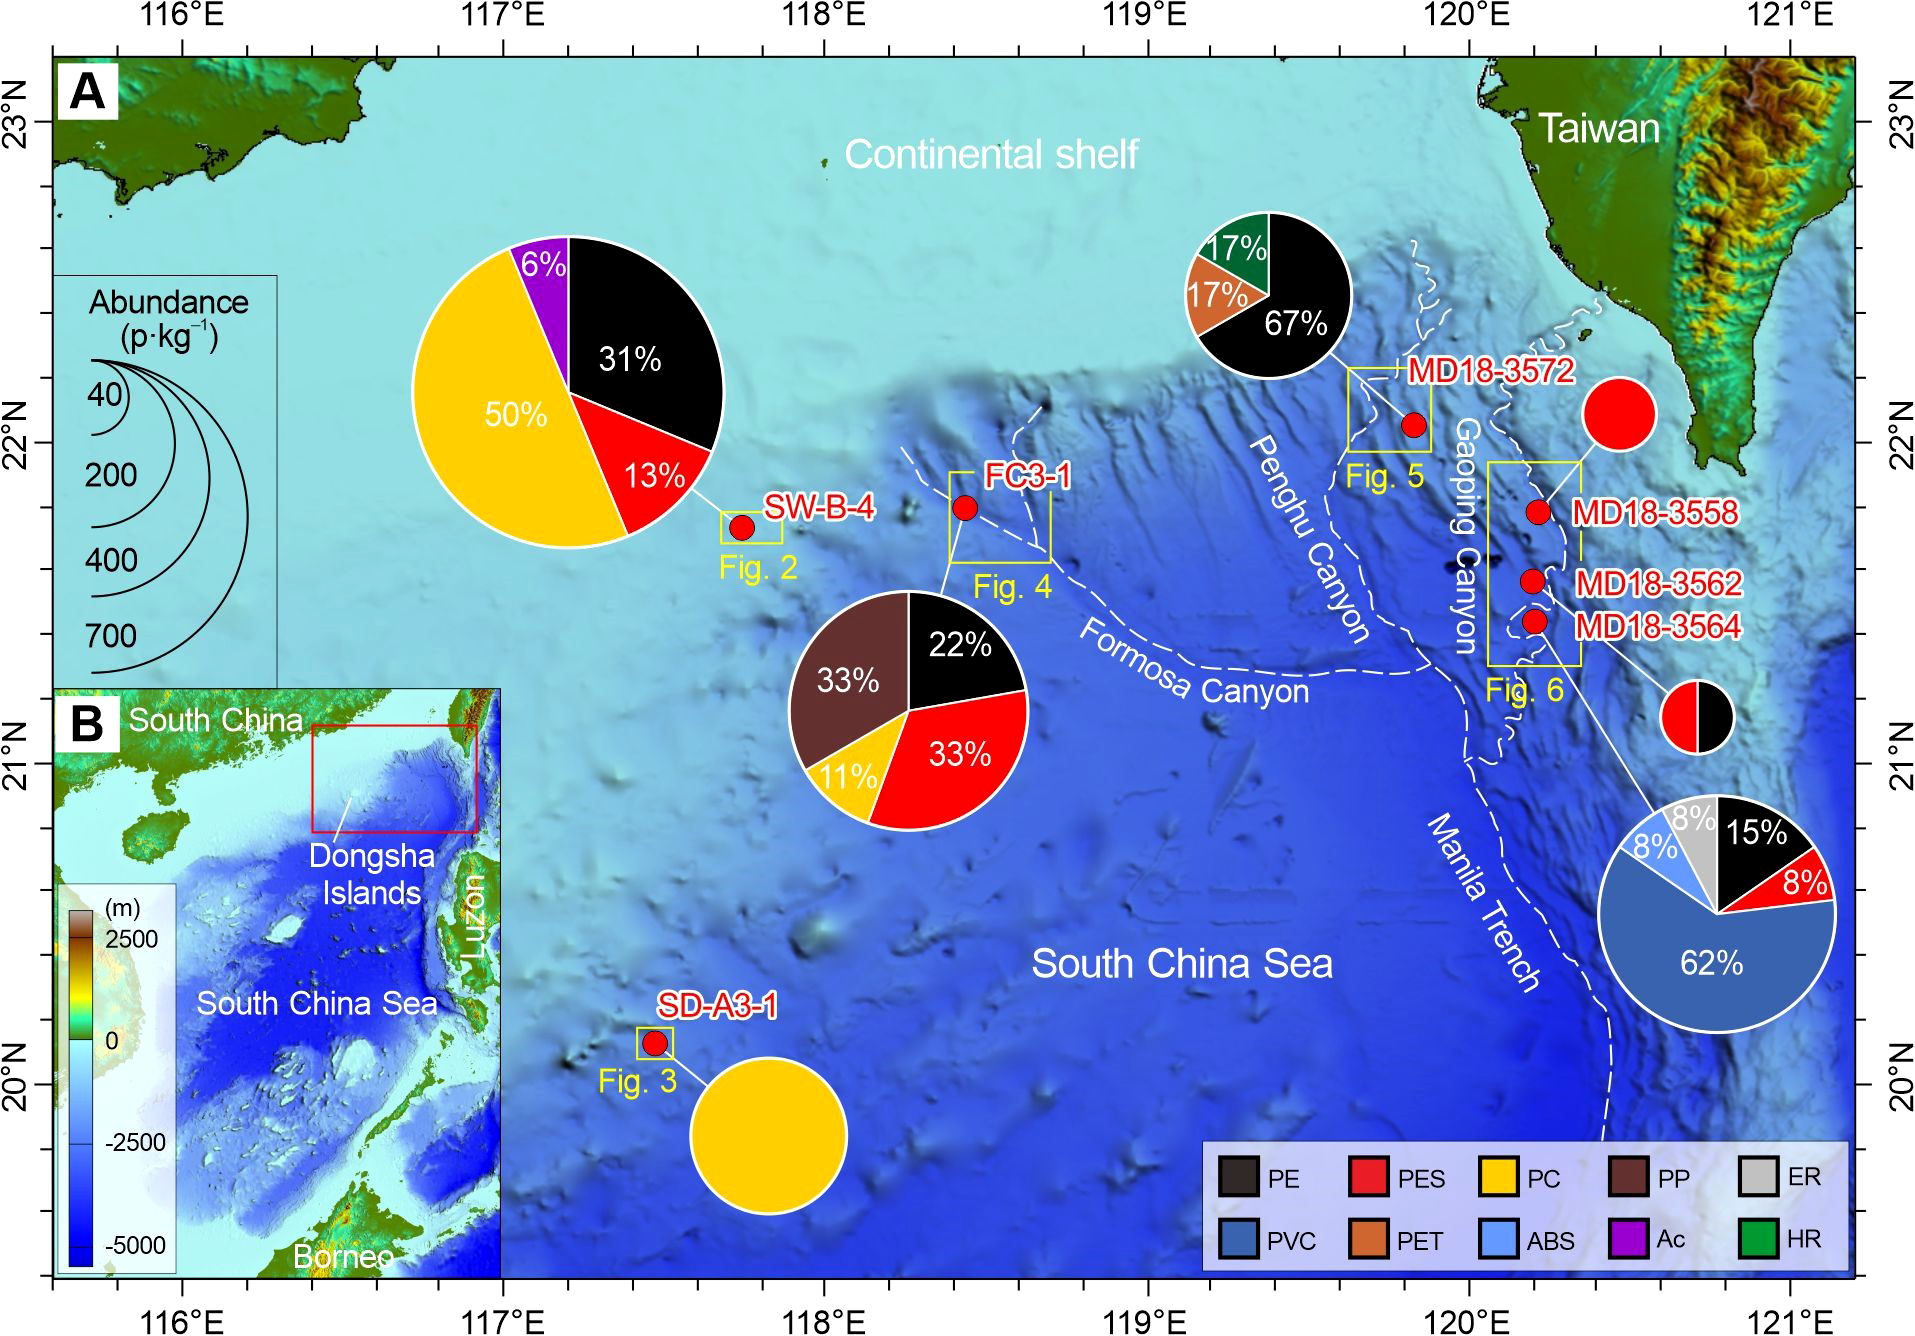
(A) Deep-sea geomorphology of the northern South China Sea showing the locations of surface sediment samples in sand dune (SW-B-4), sediment drift (SD-A3-1), Formosa Canyon (FC3-1), Penghu Canyon (MD18-3572), and Gaoping Canyon (MD18-3558/3562/3564). Detailed GPS positions of these samples are included in Table 1. Pie charts display the spatial distribution of microplastic compositions in sediment samples. The area of the pie chart represents the total abundance of microplastics in p·kg–1 (particles per kilogram). Abbreviations for polymers are polyethylene (PE), polyester fiber (PES), polycarbonate (PC), polypropylene (PP), epoxy resin (ER), polyvinyl chloride (PVC), polyethylene terephthalate (PET), acrylonitrile-butadiene-styrene (ABS), acrylic (Ac), and hydrocarbon resin (HR). The detailed data are shown in Table 2. (B) Bathymetry of the South China Sea and adjacent continents and islands. The red box shows the location of the map (A).
To represent dramatically different sedimentary environments and dynamic conditions, three surface sediment samples on the west of the Manila Trench were collected from the sand dune on the upper continental slope (SW-B-4, water depth 457 m), from the sediment drift on the lower continental slope (SD-A3-1, water depth 1858 m), and from the Formosa Canyon channel (FC3-1, water depth 2250 m), while four surface sediment samples on the east of the Manila Trench were collected from the Penghu Canyon levee (MD18-3572, water depth 2727 m), the Gaoping Canyon levee (MD18-3558, water depth 1793 m; MD18-3562, water depth 2712 m) and the Gaoping Canyon sandbar (MD18-3564, water depth 2727 m) (Figure 1; Table 1). The three samples on the west of the trench were collected by a push-core sampler of ROV ROPOS during the South China Sea Remotely Operated Diving Cruise (R/V TAN KAH KEE, April 2018), and the four samples on the east of the trench were sampled by a CASQ corer (long gravity-piston corer) during the HydroSed (MD215) Cruise (R/V Marion Dufresne, June-July 2018). We obtained only one core at each sampling site for this microplastic study, since deep-sea sediment sampling is extremely challenging and ROPOS push cores and HYDROSED CASQ cores are valuable. The sediment cores were immediately sealed with caps on the ship and stored in the dark at 3−5°C until laboratory analysis. The top 2 cm materials of each core were used for this study because these gave the most comparable time range among different sampling sites in the area. The highest sedimentation rate in the deep northern South China Sea is ~0.057 cm·y–1 at the Ocean Drilling Program (ODP) Site 1144 (20°3.18′N, 117°25.14′E, water depth 2037 m; Bühring et al., 2004), giving a period of ~35 years for the top 2 cm. This allows a relevant comparison among all studied sites for the recent time range (~35 years or slightly longer).
Table 1
| Sample | Location | Geomorphological unit | Latitude (N) | Longitude (E) | Water depth (m) |
|---|---|---|---|---|---|
| SW-B-4 | Upper slope | Sand dune | 21°44.18′ | 117°45.04’ | 457 |
| SD-A3-1 | Lower slope | Sediment drift | 20°07.97’ | 117°28.42’ | 1858 |
| FC3-1 | Formosa Canyon | Channel | 21°47.83’ | 118°26.16’ | 2250 |
| MD18-3558 | Gaoping Canyon | Levee | 21°46.99’ | 120°13.17’ | 1793 |
| MD18-3562 | Gaoping Canyon | Levee | 21°34.13’ | 120°11.98’ | 2712 |
| MD18-3564 | Gaoping Canyon | Sandbar | 21°26.48’ | 120°12.57’ | 2727 |
| MD18-3572 | Penghu Canyon | Levee | 22°03.29’ | 119°50.04’ | 2727 |
Locations of deep-sea surface sediments for the microplastic study in the northern South China Sea.
2.2 Extraction and identification of microplastics
Laboratory procedures of sediment samples mainly followed the U.S. National Oceanic and Atmospheric Administration (NOAA) laboratory procedure (Masura et al., 2015), but with minor modifications according to Mu et al. (2019). Preparation and analysis of the samples were performed at the Key Laboratory for Ecological Environment in Coastal Areas, National Marine Environmental Monitoring Center (Dalian, China). Briefly, the top 2 cm materials of each core were homogenized and dried at 60°C. The materials of each sample, totally 27−53 g in dry weight, were fully used for this study to obtain reliable, adequate amounts of microplastic compositions (Kanhai et al., 2019; Barrett et al., 2020; Reineccius et al., 2021). Dried sample was treated with 30% H2O2 at room temperature (~20°C) for seven days to decompose sedimentary organic matter (Nuelle et al., 2014).
Microplastics were extracted from deep-sea sediments by density separation, depending on the density difference between microplastics and sediments. Density values for microplastics range from 0.80 to 1.40 g·cm–3, while general densities for sediments are 2.65 g·cm–3 (Hidalgo-Ruz et al., 2012). This difference is exploited to separate the lighter microplastic particles from the heavier sediment grains by blending a sediment sample with a saturated solution. The sample in this study was blended with 100 ml saturated sodium iodide solution (NaI, density 1.73 g·cm–3) and forcefully stirred for 3 min with a glass rod. Then, the sample was left undisturbed for 12 h, facilitating buoyant particles to float to the surface and non-buoyant sediments to settle on the bottom. The supernatant containing all floating particles was carefully transferred to another beaker after the separation. However, the extraction efficiency of microplastics decreased with reduced particle size, needing repetitive density separation steps (Claessens et al., 2013; Nuelle et al., 2014; Peng et al., 2020). To extract microplastic particles of all sizes, the separation process with the NaI solution was repeated for six times, and all supernatants were then mixed. The mixed supernatant was vacuum-filtered and rinsed with Milli-Q water through a cellulose nitrate membrane filter (pore size 0.2 µm). The filter was placed in a covered petri dish and dried overnight for further inspection and identification.
The suspected microplastic particles were visually inspected under an optical stereomicroscope (Leica S9D, 10–50 magnification). Based on the shape, color, and surface appearance of particles, the microplastics on the filter membrane were visually distinguished by the following criteria: (1) no cellular or organic structures; (2) in the shape of fragment, fiber, bead, or film; (3) in a clear and homogeneous color, like white or transparent; (4) in equal thickness for fibers (Norén, 2007). However, the microscopic detection accuracy decreased with reduced particle size owing to the limited microscope resolution (minimum size ~50 µm) and fewer visual clues (Ballent et al., 2016; Reineccius et al., 2020). A micro-Fourier transform infrared spectrometer (µ-FTIR, Thermo Fisher Nicolet iN10 MX) was required to identify the microplastic polymers. The suspected microplastic particles (total number 303) were cautiously picked up using fine tipped tweezers or needle pins under the microscope and then transferred to the Type 11a diamond windows of the Micro Compression Cell. Such diamond windows offer excellent transmission from the UV through far-IR spectral regions. The µ-FTIR transmission mode was used to detect the suspected particles after they were photographed and measured under the optical microscope. The spectrum of microplastic particles was recorded as an average of eight scans in the spectral range of 675–4000 cm–1 with a resolution of 8 cm–1. The OMNIC Picta Version 9.6 spectroscopic software was used to process all obtained spectra, which were subsequently compared to the OMNIC polymer spectrum database for identification. Microplastic polymers were confirmed based on the library comparison results with >70% confidence.
2.3 Quality control and method validation
The experimental process adopts standard steps to eliminate any possible contamination. All laboratory wares were made of glass or stainless steel and were carefully cleaned with Milli-Q water. Plastic-based utensils were rinsed three times and inspected to ensure that no plastic debris was generated. The NaI solution was filtered using a cellulose nitrate membrane filter (pore size 0.2 µm) to remove particle impurities. To avoid airborne contamination, all separation and filtration procedures were performed in a laminar flow cabinet. Sample beakers were wrapped in tin foil to reduce the possibility of exposure. A cotton lab coat and latex gloves were worn to protect against synthetic textile contamination.
Despite the elaborate contamination precautions, procedural blank samples were prepared and analyzed to eliminate the possibility of airborne contamination. Two clean and empty beakers were set as blank samples and treated in the same way along with the sediment processing, as described in section 2.2. As a result, an amount of 11 fibers was found in the blank samples, which consisted of cellulose (64%) and rayon (36%). Rayon is a semi-synthetic fiber manufactured from cellulose, which is a common natural fiber (Gago et al., 2018). Although rayon has been widely reported in previous microplastic investigations (e.g., Bergmann et al., 2017), it is technically inaccurate to differentiate between cellulose-based rayon and natural cellulose from the FTIR transmission spectra (Comnea-Stancu et al., 2017). Therefore, both cellulose and rayon found in this study should not be counted as microplastics (Park et al., 2020). The presence of cellulose and rayon in our blank samples also suggested that laboratory airborne fibers might contaminate the sediment samples (Barrett et al., 2020). Therefore, cellulose and rayon were excluded in the final microplastic results of deep-sea sediment samples. This might lead to a relatively low fiber content in this study compared with other studies.
Experimental method validation is necessary to ensure the reliability of microplastic data through parallelly testing the microplastic recovery rates. Plastic-removed sediment samples were quantitatively spiked with laboratory-made microplastic grains to test the recovery rates of the experimental method. Three muddy sediment samples (~30 g each) as testing samples were used for burning at 600°C for 6 h to eliminate plastic material. Laboratory-made polyvinyl chloride (PVC) fragments, polystyrene (PS) beads, and polyethylene (PE) beads, were spiked into the three testing samples. The testing samples were treated with the exactly same experimental procedure as the deep-sea sediment samples, from hydrogen peroxide oxidation, density separation, to microscope inspection. After the extraction and identification of microplastics, the spiked grains were gathered and counted. The recovery rates of spiked grains were >95% for the three testing samples, indicating the reliable applicability of method for the microplastic extraction and identification (Supplementary materials Table S1).
2.4 Grain size analysis of detrital sediments
The grain size of deep-sea sediment samples was analyzed by laser particle size analysis. The sample (2–3 g) was firstly treated with 10% H2O2 for 3 days to eliminate organic matter. Then, a Beckman Coulter LS-230 laser particle size analyzer with a measuring range of 0.4–2000 µm was used to test the grain size of the detrital sediments. Replicate analysis of the sample gave a precision of ±1%. The sediment grains were divided into a number of size fractions, and a grain size distribution was constructed from the volume percentage of grains in each size fraction. Based on the mid-point of each size class and the frequency of grain size distribution, the mean grain size was calculated using the mathematical method of moments (Blott and Pye, 2001) to represent the relative intensity of sedimentary dynamic conditions of a specific geomorphological unit.
2.5 Statistical analysis
The microplastic abundance of each sample was calculated and calibrated based on the number of microplastic particles in per kilogram dry sediments (p·kg–1). We analyzed the Pearson correlations between the total abundance, abundance of polymers, abundance of shapes, and particle size of microplastics and the mean grain size of detrital sediments (transformed to logarithmic data) after establishing the normal distributions of the data using Shapiro-Wilk tests (P value >0.05) (Kim, 2013; Mishra et al., 2019). Pearson correlation analyses and Shapiro-Wilk tests were performed using the SPSSAU statistical analysis platform (a web version of SPSS).
3 Results and discussions
3.1 Composition and spatial distribution of microplastics
An amount of 50 microplastic particles (~17% of all suspected particles) is detected in the surface sediment samples from all seven geomorphological units, and they belong to 10 types of polymers, including polyethylene (PE), polyester fiber (PES), polypropylene (PP), polycarbonate (PC), polyvinyl chloride (PVC), polyethylene terephthalate (PET), acrylonitrile-butadiene-styrene (ABS), epoxy resin (ER), hydrocarbon resin (HR), and acrylic (Ac) (Supplementary materials Figures S1–S3). In this study, PES (polyester fiber) was counted as a category of synthetic fibers with ester groups on the main chain, e.g., polyethylene terephthalate fiber (Ward and Wilding, 1977; Piccinini et al., 2014; Käppler et al., 2015). The synthetic fiber was identified as PES if it chemically contained the ester group, methylene, and benzene ring (Figure S2B) (Piccinini et al., 2014). No special attention was paid to distinguish the specific type of polyester fiber (Peng G. et al., 2018). PET stands for the polyethylene terephthalate resin that appears as a bead. It was chemically distinguished by a typical trans conformer of the O-C-H bond (Figure S2C) (Piccinini et al., 2014). Component and abundance of microplastics identified in each sediment sample are reported in Table 2. In terms of quantity, PC, PE, PES, PVC, and PP are the most abundant and widespread polymers. PC makes up the largest proportion (29%) of all microplastics, followed by PE (27%), PES (16%), PVC (13%), and PP (7%).
Table 2
| Composition | SW-B-4 | SD-A3-1 | FC3-1 | MD18-3558 | MD18-3562 | MD18-3564 | MD18-3572 |
|---|---|---|---|---|---|---|---|
| PE | 217 | 91 | 19 | 62 | 132 | ||
| PES | 87 | 136 | 39 | 19 | 31 | ||
| PET | 33 | ||||||
| PC | 347 | 174 | 45 | ||||
| PVC | 247 | ||||||
| PP | 136 | ||||||
| Ac | 43 | ||||||
| ABS | 31 | ||||||
| ER | 31 | ||||||
| HR | 33 | ||||||
| Total | 694 | 174 | 408 | 39 | 38 | 402 | 198 |
Compositions and abundances (p·kg–1) of microplastics in deep-sea surface sediment samples of the northern South China Sea.
The spatial distribution of microplastics shows differences in composition and abundance among the deep-sea geomorphological units (Figures 1–6). The microplastics in the sand dune (SW-B-4) on the upper continental slope are dominated by PC (50%), PE (31%), and PES (13%), with minor acrylic (6%). The abundances of these microplastics are comparatively high, ranging from 43 to 347 p·kg–1 (Figure 2). The sediment drift (SD-A3-1) on the lower continental slope exclusively contains PC with an abundance of 174 p·kg–1 (Figure 3). The microplastics in the Formosa Canyon channel (FC3-1) consist of PES (33%), PP (33%), PE (22%), and PC (11%), which have the abundances of 45–136 p·kg–1 (Figure 4). The Penghu Canyon levee (MD18-3572) contains a high content of PE (67%), but much less PET (17%) and HR (17%), with abundances ranging from 33 to 132 p·kg–1 (Figure 5). The Gaoping Canyon levees have simple compositions and low abundances of microplastics, with sole PES at an abundance of 39 p·kg–1 on the middle reach levee (MD18-3558) and PE and PES at the same abundance of 19 p·kg–1 on the lower reach levee (MD18-3562) (Figure 6). However, the Gaoping Canyon channel (sandbar) (MD18-3564) contains multiple microplastics of PVC (62%), PE (15%), PES (8%), ABS (8%), and ER (8%), with their abundances ranging in 31–247 p·kg–1, which is 2–6 times higher than those of the Gaoping Canyon levee.
Figure 2
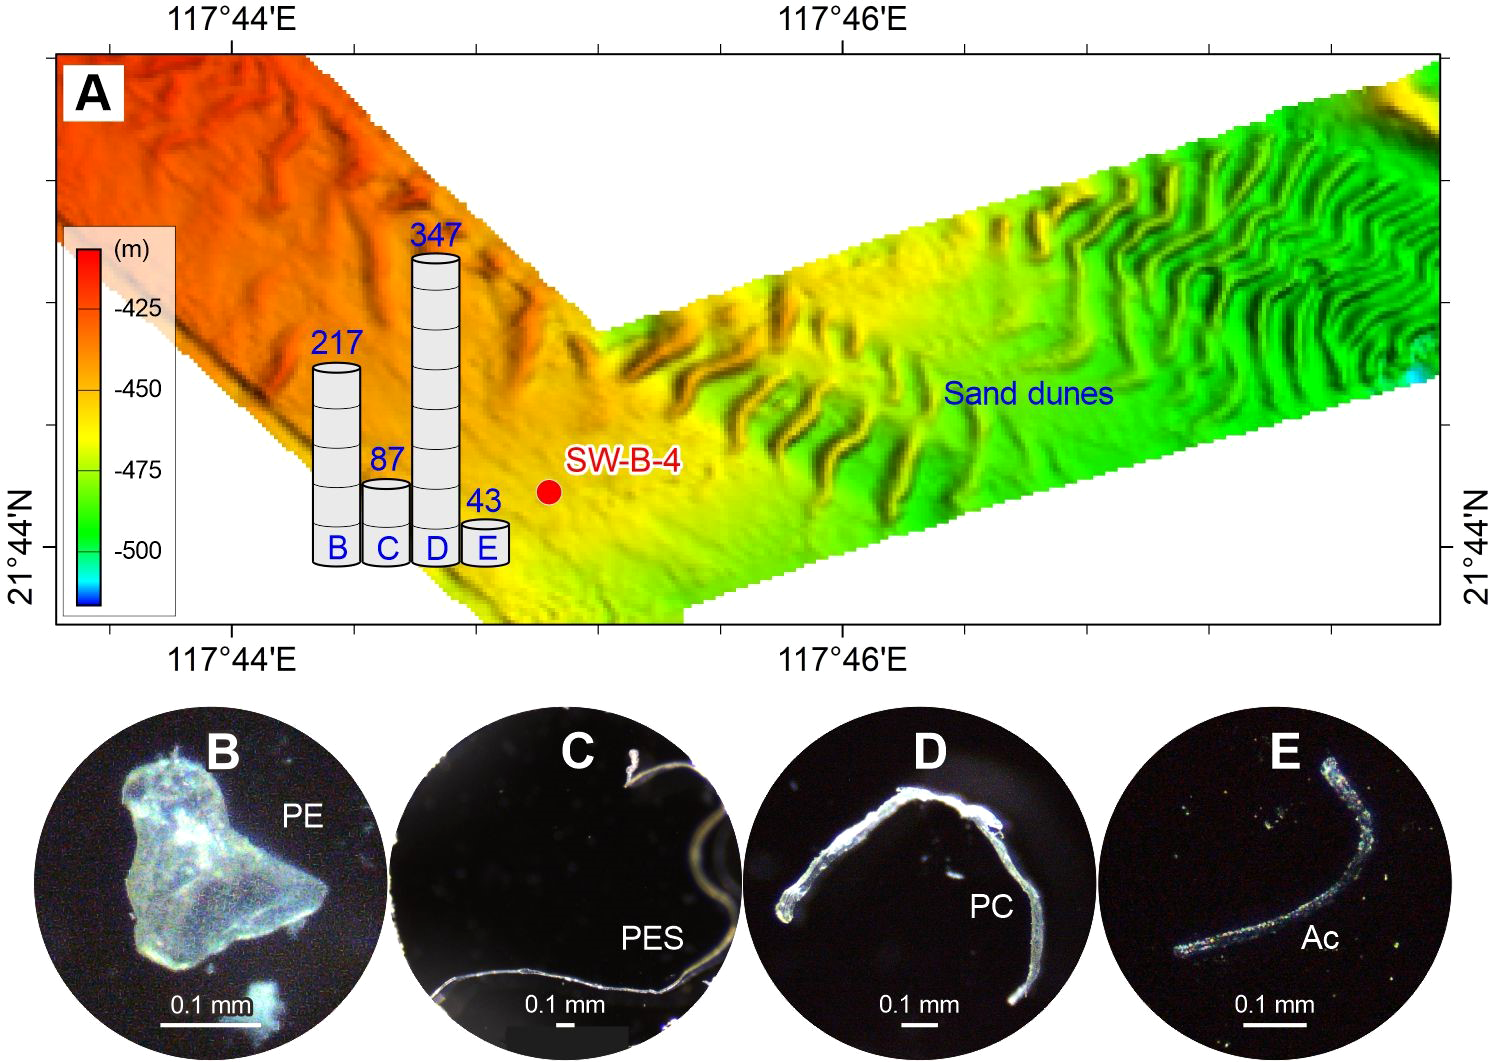
Abundance (A) and typical photographs (B–E) of microplastics in the surface sediment sample of sand dune on the upper continental slope of the northern South China Sea. The numbers above the histogram show the abundance (p·kg–1) of microplastic compositions (panels B–E). The detailed data are shown in Table 2. See Figure 1 for the location of sample SW-B-4 and related sand dune.
Figure 3
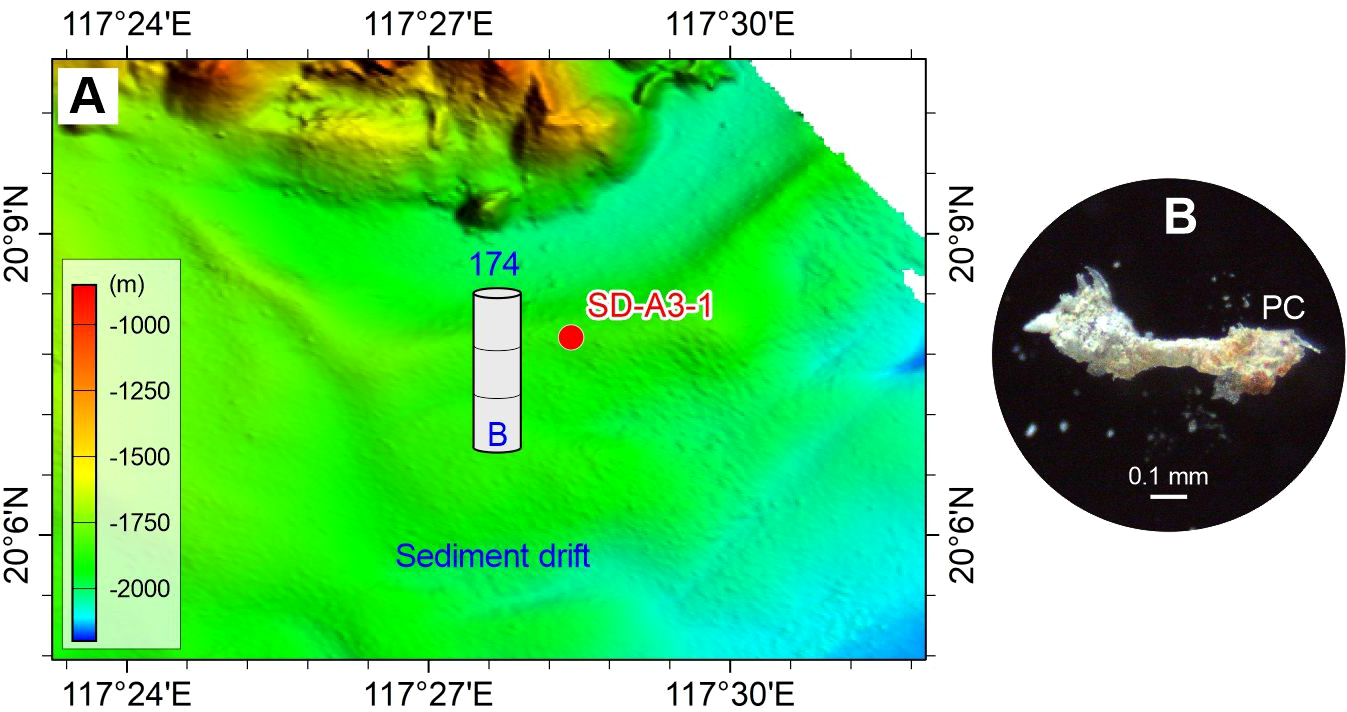
Abundance (A) and typical photograph (B) of microplastics in the surface sediment sample of sediment drift on the lower continental slope of the northern South China Sea. The number above the histogram shows the abundance (p·kg–1) of microplastics (panel B). The detailed data are shown in Table 2. See Figure 1 for the location of sample SD-A3-1 and related sediment drift.
Figure 4
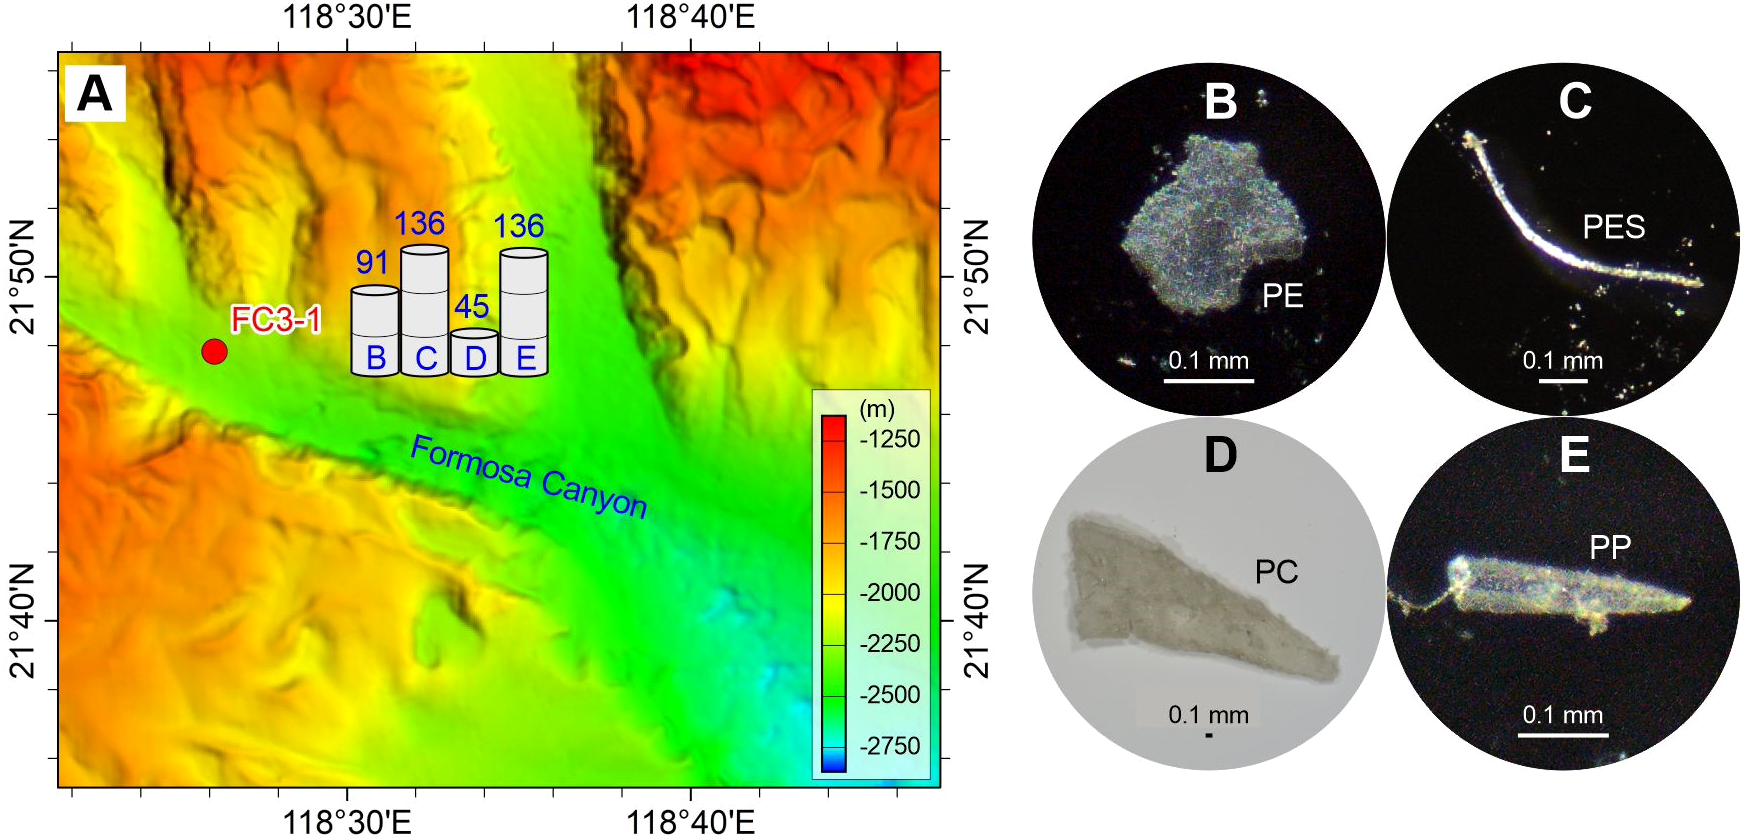
Abundance (A) and typical photographs (B–E) of microplastics in the surface sediment sample in the Formosa Canyon channel. The numbers above the histograms show the abundance (p·kg–1) of microplastic compositions (panels B–E). The detailed data are shown in Table 2. See Figure 1 for the location of sample FC3-1 and related Formosa Canyon.
Figure 5
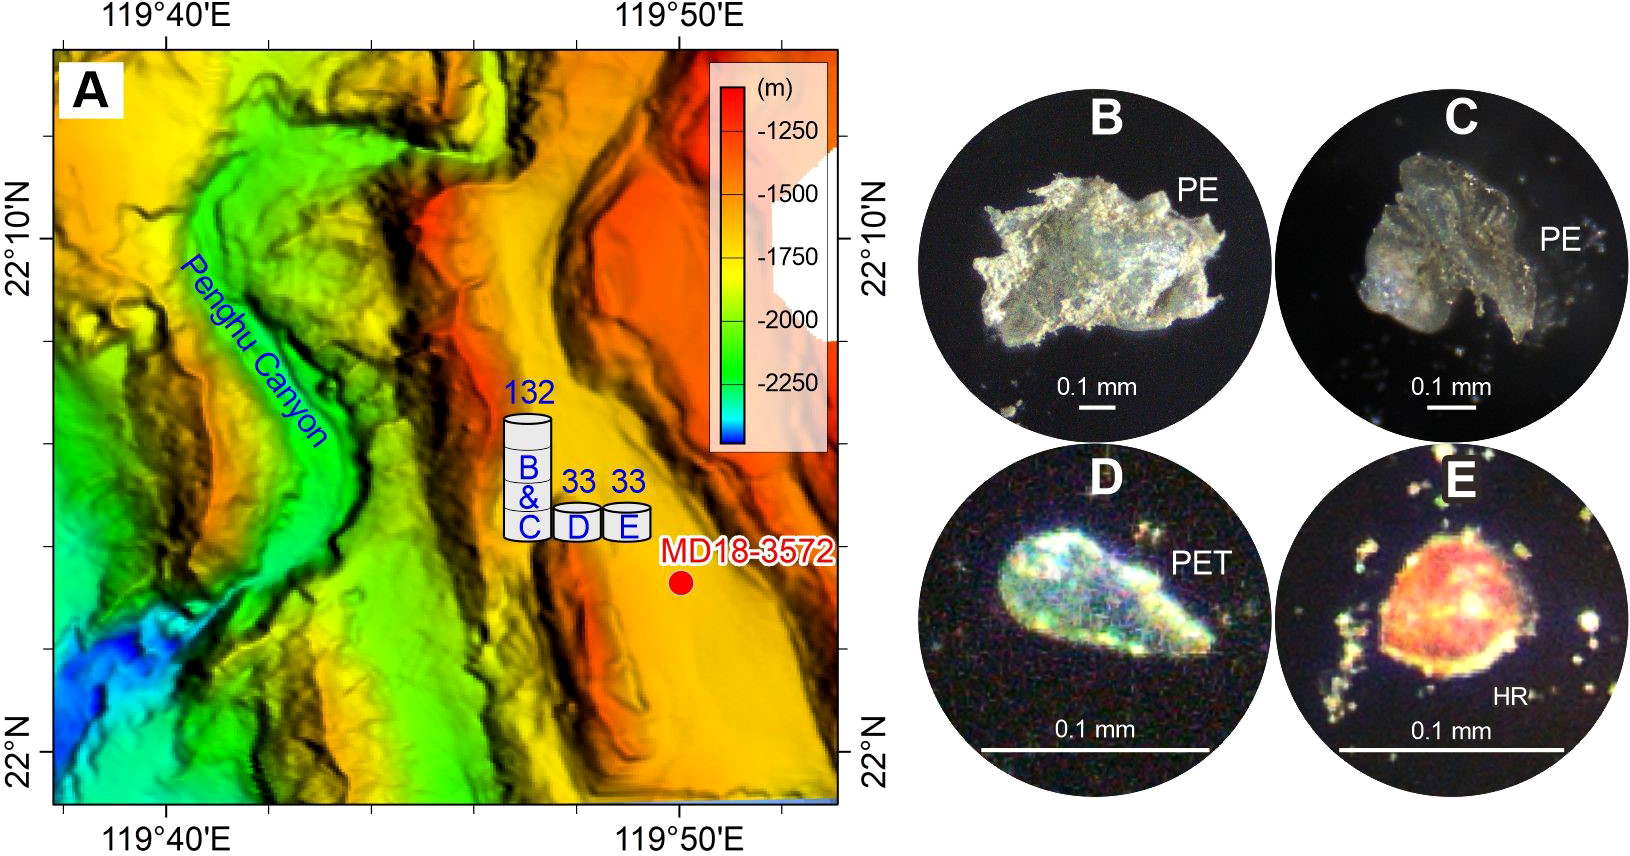
Abundance (A) and typical photographs (B–E) of microplastics in the surface sediment sample on the Penghu Canyon levee. The numbers above the histograms show the abundance (p·kg–1) of microplastic compositions (panels B–E). The detailed data are shown in Table 2. See Figure 1 for the location of sample MD18-3572 and related Penghu Canyon.
Figure 6
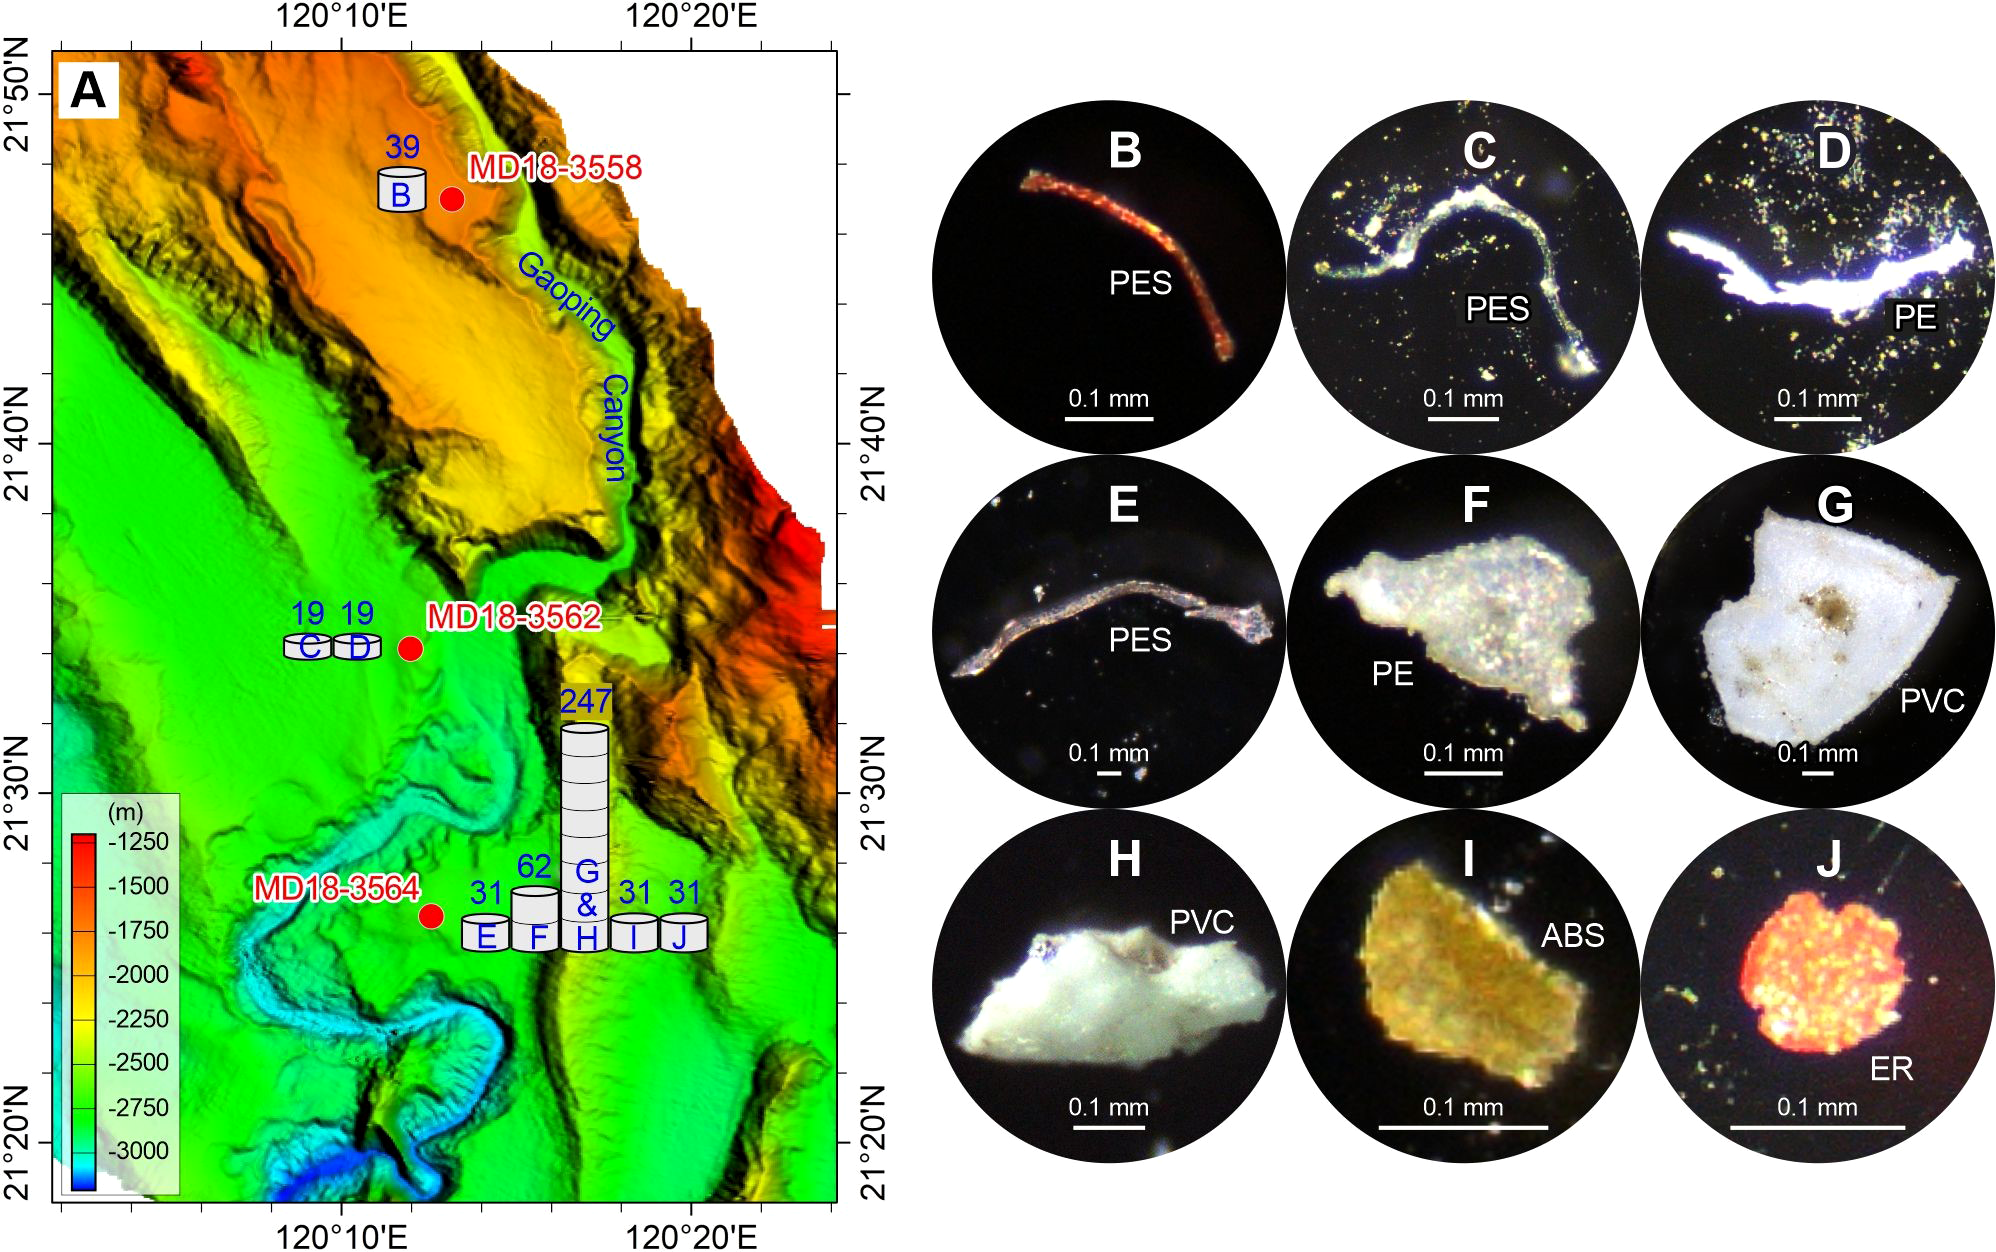
Abundance (A) and typical photographs (B–J) of microplastics in the surface sediment sample on the Gaoping Canyon levees and sandbar. The numbers above the histograms show the abundance (p·kg–1) of microplastic compositions (panels B–J). The detailed data are shown in Table 2. See Figure 1 for the locations of samples MD18-3558, MD18-3562, and MD18-3564, and related Gaoping Canyon.
The overall distribution of microplastics shows that the sand dune, the Formosa Canyon channel, and the Gaoping Canyon sandbar contain the highest abundances (136–347 p·kg–1) and more types (4–6 types) of microplastics, which are dominated by PC or PVC (Figures 2, 4, 6). The Penghu/Gaoping Canyon levee contain the lowest abundances (19–132 p·kg–1) and less types (1–3 types) of microplastics, which are dominated by PES or PE (Figures 5, 6). The microplastic composition of the sediment drift is between those of the canyon channel and the canyon levee (Figure 3).
3.2 Physical properties of microplastics
The physical properties of microplastics, such as shape, size, and density, play important roles in the suspension and deposition of microplastic particles. In the deep-sea geomorphological units, the microplastic shapes include mainly fragment (72%), fiber (22%), and bead (6%). These results resemble those of deep-sea sediments from the Great Australian Bight and the Southern Ocean (Barrett et al., 2020; Cunningham et al., 2020). However, the percentage of fibers detected in the sediments is lower than expected, as fibers are known to be ubiquitous and therefore dominate microplastic shape composition (Gago et al., 2018). This might result from two reasons: (1) we excluded the semi-synthetic fiber (rayon) from the count of microplastics, as mentioned in section 2.3; (2) the differential sorting of various microplastic shapes may occur during the vertical settlement through the water column. The particle sizes of all microplastics in this study range from 0.07 to 4.61 mm, among which fragment sizes are in 0.15–4.61 mm (average 0.69 mm), fiber sizes are in 0.26–4.32 mm (average 1.52 mm), and bead sizes are in 0.07–0.11 mm (average 0.09 mm) (Figure 7). According to frequency distributions of microplastic particle size, 92% fragments and 64% fibers are smaller than 1.00 mm. The density of microplastic particles depends mainly on the compositions of polymers, and the values are in the range of 0.80–1.40 g·cm–3 (GESAMP, 2019). In this study, high-density microplastics (PC and PVC) are 42%, low-density microplastics (PE and PP) are 30%, and lightweight fibers (PES) are 18%. The shape, size, and density of microplastics are strongly related to the settling velocity, which can affect the transport and deposition of microplastics. According to the flume experiments about how turbidity currents transport microplastics, the fragments are somewhat concentrated within the base of turbidity currents, but the fibers are homogeneously distributed throughout the flow (Pohl et al., 2020). This is explained by the settling velocity difference between fragments and fibers. In general, the settling velocity of dense and regular fragments is relatively fast, while that of light and irregular fibers is slow (Ballent et al., 2012; Kowalski et al., 2016; Khatmullina and Isachenko, 2017).
Figure 7
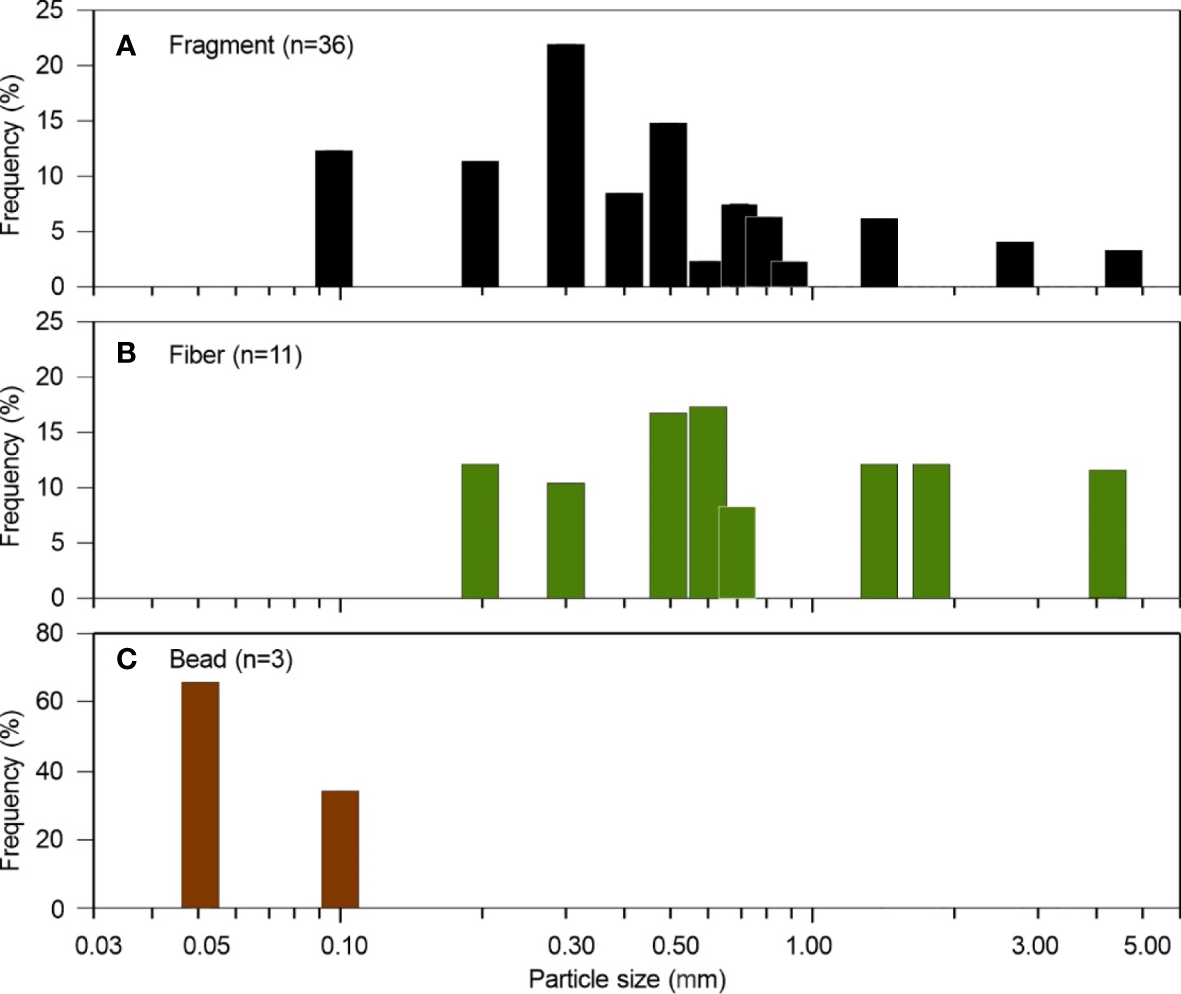
Frequency histograms of the microplastic particle size of (A) fragment, (B) fiber, and (C) bead in surface sediments of the northern South China Sea. n = number of microplastic particles.
In the northern South China Sea, sand dune, canyon sandbar, and canyon channel from our study contain relatively large-size (0.15–4.61 mm) and high-density (PC 50%, PVC 62%) microplastic fragments. Canyon levee contains relatively small-size (0.31–0.82 mm) and low-density (PE 67%, PES 50%) microplastic fragments or fibers. Sediment drift contains moderate-size (0.17–2.72 mm) but high-density (PC 100%) microplastic fragments. These physical properties may determine the settling velocities of microplastics in the deep sea. The large-size and high-density microplastics in sand dune and canyon channel suggest relatively higher settling velocities. In contrast, the small-size and low-density microplastics in canyon levee and sediment drift suggest relatively lower settling velocities. This applies for the dynamic conditions of specific sedimentary environments.
3.3 Potential sources of microplastics
South China and Taiwan are the directly adjacent source areas for microplastics in the northern South China Sea. The Pearl River is the largest river in South China, and it contributes 66 tons of microplastics (~3.9×10¹⁰ particles) into the sea annually (Mai et al., 2019), affecting the microplastic compositions in surface seawater and continental shelf/slope sediments off South China (Zhou et al., 2011; Cai et al., 2018; Chen et al., 2020). Thus, the Pearl River, as a representative of South China, is regarded as the largest source of microplastics in the northern South China Sea (Fok and Cheung, 2015; Lin et al., 2018; Yan et al., 2019). The microplastics in the Pearl River water are dominated by PE (0–80%) and PP (0–80%), followed by PVC (0–56%) and PES (0–3%) (Tan et al., 2019; Mai et al., 2019; Wu et al., 2020; Li et al., 2021; Huang et al., 2021). Meanwhile, the microplastic compositions in the surface sediments of the Pearl River estuary are similar to the river water, also mainly containing PE and PP, followed by PES, PVC, and PC (Lo et al., 2018; Lo et al., 2020; Li et al., 2020; Lo et al., 2021). Taiwan is the second important source of microplastics in the northern South China Sea, with multiple contributions from its mountain rivers, including Erren River, Agongdian River, Dianbao River, Houjin River, and Gaoping River (Chen et al., 2020). The microplastics in the surface water of Taiwan river estuaries and coasts are composed of dominate PE (48−57%) and PP (36−46%), with minor PVC (0−5%), PS (0−9%), and PA (2−8%) (Chen C. F. et al., 2020). Similarly, the microplastics in the surface sediments of Taiwan river estuaries and coasts are also dominated by PP (10–55%), PE (0–23%), PES (0–30%), and PS (0–30%), with minor PVC (0–5%) and PA (0−9%) (Chen et al., 2021). All polymers detected in the river water and sediments of South China and Taiwan have been also found in surface sediments of the deep-sea geomorphological units. This indicates that the rivers of South China and Taiwan are the main potential sources for microplastics in the deep-sea sediments. The polymer, shape, color, and abundance distribution of microplastics all provide useful information for the microplastic source analysis, among which the polymer in this study is the essential factor because of notable variations among the different geomorphological units and the potential source areas (Figure 1).
A ternary diagram, PE+PP – PC+PVC – PES+PET (in relative percentage), is designed for microplastic source analysis in terms of polymer density and shape (Figure 8). The major microplastics are divided into three groups, i.e., PE+PP group with densities lower than seawater and in fragment shapes, PC+PVC group with densities higher than seawater and in fragment shapes, and PES+PET group in fiber shapes (some studies have identified polyester fiber as PET, e.g., Huang et al., 2021). In this way, the difference of microplastic composition, not only in polymer type, but also in polymer density and shape, is distinguished in all the deep-sea geomorphological units and enables the comparison with the potential source areas. The plotting of our microplastic results in the diagram shows that the source of microplastics in the sediments of typical deep-sea geomorphological units is jointly influenced by South China and Taiwan (Figure 8). The microplastics of the Gaoping/Penghu Canyon levee are plotted along the axis line between PE+PP and PES+PET endmembers, overlapping with Taiwan river water and sediments. Considering that the Gaoping Canyon and the Penghu Canyon are geographically close to Taiwan (Figure 1), we infer that the microplastics on the Gaoping/Penghu Canyon levees are derived from Taiwan rivers. The microplastics of the Formosa Canyon channel overlap with the South China river sediments (represented by the Pearl River), while the microplastics of the sand dune and the Gaoping Canyon sandbar are plotted gradually closer to the South China river water (Figure 8). In addition, the microplastics of the sediment drift are plotted at the PC+PVC endmember. Considering that the Formosa Canyon, the sand dune, and the sediment drift are geographically far away from Taiwan and close to South China (Figure 1), we infer that South China is progressively replacing Taiwan as the main source of the microplastics in these units. Consequently, the riverine microplastics of Taiwan and South China jointly affect the microplastic compositions in the typical deep-sea geomorphological units.
Figure 8
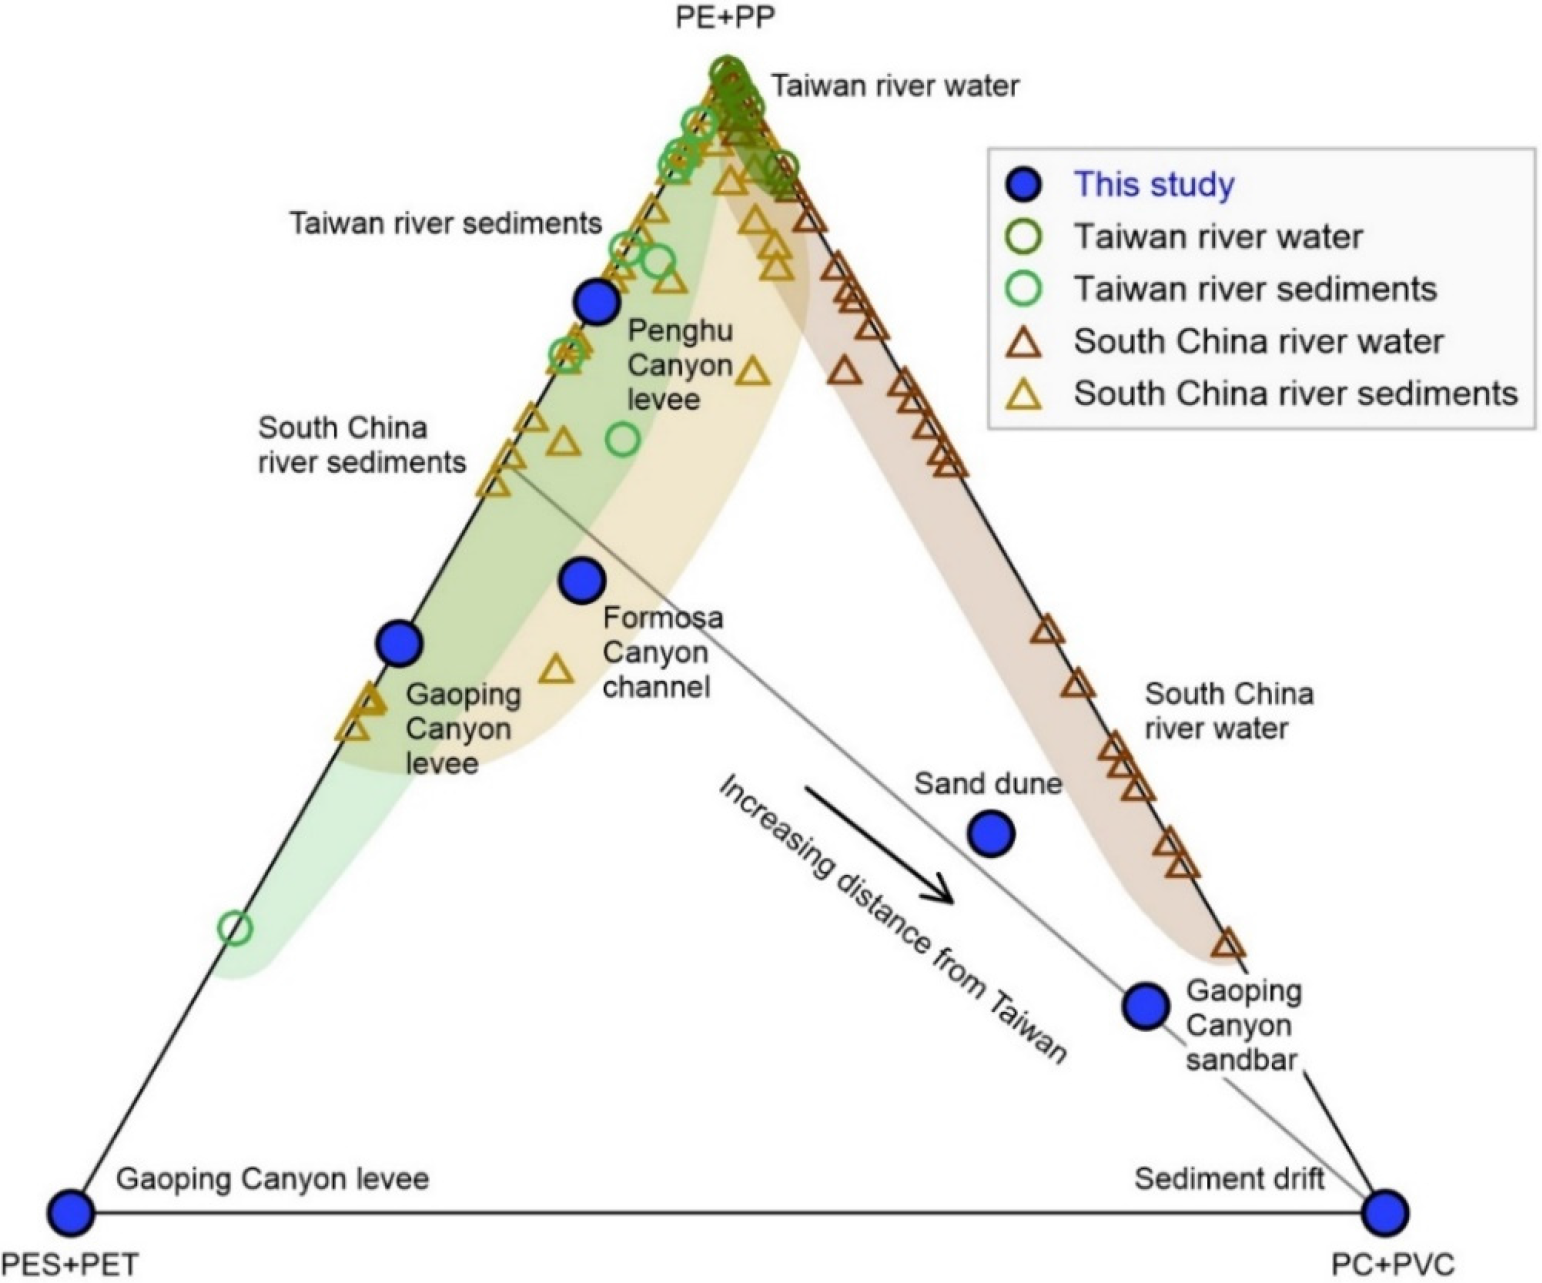
Ternary diagram of major microplastic groups of PE+PP, PC+PVC, and PES+PET. PE+PP represents the low-density group with densities less than seawater and in fragment shapes. PC+PVC represents the high-density group with densities greater than seawater and in fragment shapes. PES+PET represents the group in fiber shapes (some studies have identified PES as PET). Surrounding river samples for potential microplastic sources are indicated for comparison, including Taiwan river water and sediments (Chen C. F. et al., 2020; Chen et al., 2021), South China river water (represented by the Pearl River) (Tan et al., 2019; Mai et al., 2019; Wu et al., 2020; Li et al., 2021; Huang et al., 2021), and South China river sediments (represented by the Pearl River) (Lo et al., 2018; Lo et al., 2020; Li et al., 2020; Lo et al., 2021).
There might be other sources for marine microplastics except the terrestrial sources via river inputs, such as direct release through maritime activities and air transport from distant sources. Novel microplastic sources also supply new microplastic types into the marine environment, such as the epoxy resins (plastic paints) for the painting and coating (Turner, 2010; Jin et al., 2015). Epoxy resins are characterized as compounds that contain one or more epoxide (or oxirane) groups. Due to the exceptional properties, such as excellent solvent and chemical resistance, mechanical and corrosion resistance, and excellent adhesion to many substrates, epoxy resins are widely used as heavy-duty anticorrosion coatings (Jin et al., 2015). High proportion of epoxy resin (>20%) has been reported in suspended atmospheric particles and deposited desert sediments, suggesting that the epoxy resin could go through a long-distance atmospheric transport and deposition (Liu et al., 2019; Wang et al., 2021). However, the content of epoxy resin in marine environments is relatively low, so it has been largely neglected in the past (Castillo et al., 2020). It is worth mentioning that an epoxy resin was found in the Gaoping Canyon sandbar (Figure 6). The epoxy resin is bead-shaped and has a small diameter of 0.09 mm. We can’t determinate the exact source of epoxy resin from the individual particle, but the tiny size of epoxy resin suggests a long-distance transport from distant source. Further research on this novel microplastic source needs to be performed in the future.
3.4 Sedimentary dynamic conditions of the geomorphological units
The grain size of detrital sediments presents obvious difference among the typical geomorphological units, indicating the relative intensity of deep-sea sedimentary dynamic conditions. The principal peak range of sediment grain size is 100–800 µm in the sand dune, 30–200 µm in the canyon sandbar, 8–50 µm on the sediment drift, and 4–20 µm on the canyon levee (Figure S4). Additionally, the mean grain size of detrital sediments is 350 µm in the sand dune, 70 µm in the canyon sandbar, 25 µm on the sediment drift, and 12 µm on the canyon levee (Table S2). Deep-sea detrital sediments in the sand dune, submarine canyon, and sediment drift are all controlled by intense deep-sea dynamic processes, like internal waves, turbidity currents, and bottom currents (Reeder et al., 2011; Zhao et al., 2015; Liu et al., 2016). These deep-sea processes regulate the transport and deposition of detrital sediments, and the related dynamic conditions control the grain size components in the sediments (Wynn and Stow, 2002; Oliveira et al., 2007). The sediment grain size has a close, positive relationship with the dynamic condition. In general, an intense dynamic condition can transport coarser-grained sediments, whereas a weak dynamic condition usually only transport finer-grained sediments (Folk and Ward, 1957; Visher, 1969). Consequently, the sediment grain size can be used to indicate the intensity of sedimentary dynamic conditions (McCave and Hall, 2006; Zhong et al., 2017). A greater sediment grain size indicates a more intensive dynamic condition. As mentioned above, the detrital sediments in the sand dune have the largest mean grain size, followed by those in the canyon sandbar, on the sediment drift, and on the canyon levee (Figure S4). The decrease of mean grain size indicates that the sedimentary dynamic conditions are progressively weakened from the sand dune, the canyon sandbar, the sediment drift, to the canyon levee.
The spatial distribution of microplastics in deep-sea sediments shows that the sand dune and the canyon channel, as previously mentioned, contain microplastic fragments of high abundance, variety, and density (Figures 2, 4, 6). The canyon levee contains microplastic fragments or fibers of low abundance, variety, and density (Figures 5, 6). The microplastic compositions of the sediment drift fall between the canyon channel and canyon levee (Figure 3).
The relationship between microplastic compositions and sedimentary dynamic conditions of the relevant geomorphological units is visualized by using the mean grain size of detrital sediments as the horizontal coordinate (Figure 9). The typical deep-sea geomorphological units are arranged along the horizontal coordinate based on the gradual increase of mean grain size. The increase of mean grain size indicates that the sedimentary dynamic conditions progressively increase from the canyon levee, the sediment drift, the canyon channel (sandbar), to the sand dune. Meanwhile, the increasing trends are visible for all the total abundance, abundance of polymer types, and abundance of shapes (Figures 9A–C). In addition, the PC+PVC in (Figure 9B) represents the high-density group, while the PE+PP represents the low-density group. The abundance of microplastic composition, not only in polymer type, but also in polymer density, shows an increasing trend. The Pearson correlation analyses reveal statistically positive relationships between the total abundance, abundance of polymers, and abundance of shapes and the mean grain size of sediments (Logarithmic data) (r2 ≥0.663, P ≤0.026 in Figure S5A–C). The positive relationships clearly show that the abundance and polymer type (density) of microplastics all increase with the increased mean grain size of sediments, which represents the progressively enhanced intensity of sedimentary dynamic conditions (Figures 9A–C). This suggests that the sedimentary dynamic conditions have controlled the composition and distribution of microplastics in the deep-sea geomorphological units. However, the insignificant correlation (P ≥0.050) for microplastic particle size doesn’t show the increasing trend with the sediment grain size (Figures S6, S7). This may result from the large size range of microplastic shapes in each sample and the small number of samples used in the present study. Thus, more deep-sea sediment samples should be analyzed in the future to study the relationship between microplastic particle size and sedimentary dynamic conditions.
Figure 9
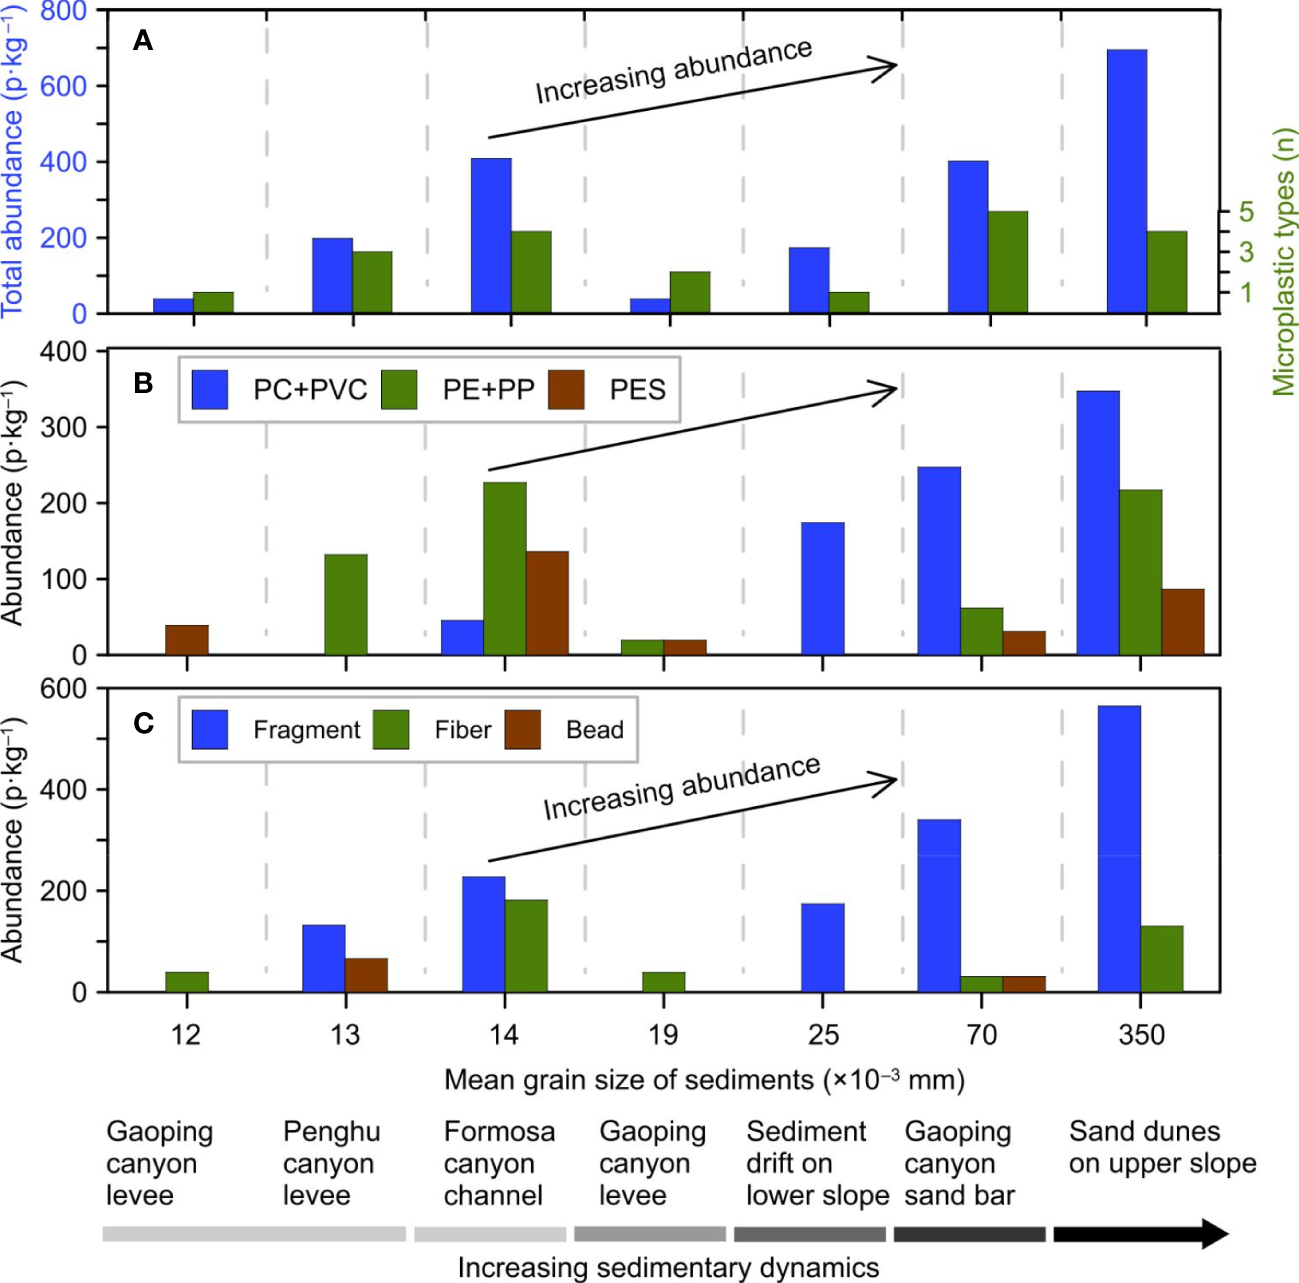
Correlation between the abundance of microplastics and the sedimentary dynamic conditions of deep-sea geomorphological units in the northern South China Sea. (A) Histograms of the total abundance and type of microplastics. (B) Abundance histograms of PC+PVC (high-density group in Figure 8), PE+PP (low-density group in Figure 8), and PES (synthetic fiber in Figure 8). (C) Abundance histograms of microplastic fragments, fibers, and beads. Deep-sea geomorphological units are arranged along the horizontal axis based on the mean grain size of detrital sediments, representing gradual increasing sedimentary dynamic intensity of the geomorphological units.
4 Conclusion
In this study, we analyzed the composition and distribution of microplastics in surface sediments collected from typical deep-sea geomorphological units (sand dune, sediment drift, and submarine canyon) in the northern South China Sea. Combining with the grain size analysis of detrital sediments, the controlling factors of microplastic distribution in the deep-sea sedimentary environments are explored. The microplastic abundance ranges from 19 to 347 p·kg–1, which consists mainly of PC (29%), PE (27%), PES (16%), PVC (13%), and PP (7%), and minor PET, ABS, ER, HR, and Ac. The microplastic shapes include mainly fragment (72%), fiber (22%), and bead (6%), with particle sizes ranging from 0.07 to 4.61 mm. The result of microplastic source analysis shows that the deep-sea microplastics may be influenced by riverine inputs from Taiwan and South China.
The spatial distribution of microplastics shows that the sand dune and canyon channel contain the highest abundances (136–347 p·kg–1) and more types (4–6 types) of microplastics, which are dominated by high-density microplastic fragments (PC, PVC). The canyon levee contains the lowest abundances (19–132 p·kg–1) and less types (1–3 types) of microplastics, which are dominated by low-density microplastic fragments and fibers (PE, PES). The microplastic composition of the sediment drift is between those of the canyon channel and the canyon levee. The abundance and polymer type (density) of microplastics in deep-sea sediments all increase with the increased mean grain size of detrital sediments, suggesting that the sedimentary dynamic conditions could control the microplastic deposition and distribution in the deep-sea geomorphological units. The deposition of microplastics have important influences on the deep-sea sediment compositions, natural ecosystems, and material cycles. This study highlights that some deep-sea sedimentary environments characterized by strong deep-sea currents, like sand dune and submarine canyon, could accumulate more microplastics, which are regulated by the stronger sedimentary dynamic conditions. This is of great value for evaluating the storage and ecological damage of deep-sea microplastics. However, we have to acknowledge the shortcomings of the present study: (1) only one sample was collected at each site, (2) the absence of replicate sediment samples, and (3) small volume of analyzed material (~30 g dry weight). Further work is necessary in the future to collect more deep-sea sediment samples for the comparison of microplastic distribution among different geomorphological units.
Statements
Data availability statement
The original contributions presented in the study are included in the article/Supplementary Material. Further inquiries can be directed to the corresponding author.
Author contributions
ZL designed the study and obtained the funding. ZL, YZ, PM, CC, and AL carried out the fieldwork. XZ carried out the measurements and wrote the original draft. All authors contributed to the article and approved the submitted version.
Funding
This study is supported by the National Natural Science Foundation of China (42188102, 91528304).
Acknowledgments
We are grateful to the R/V Marion Dufresne HydroSed-MD215 Cruise (2018) and the R/V TAN KAN KEE South China Sea Remotely Operated Diving Cruise (2018) for providing deep-sea sediment samples for this study. We also thank the National Marine Environmental Monitoring Center for providing facilities for the microplastic analysis. We especially thank SE (Editor) and three reviewers for their constructive reviews on the early version of this paper.
Conflict of interest
The authors declare that the research was conducted in the absence of any commercial or financial relationships that could be construed as a potential conflict of interest.
Publisher’s note
All claims expressed in this article are solely those of the authors and do not necessarily represent those of their affiliated organizations, or those of the publisher, the editors and the reviewers. Any product that may be evaluated in this article, or claim that may be made by its manufacturer, is not guaranteed or endorsed by the publisher.
Supplementary material
The Supplementary Material for this article can be found online at: https://www.frontiersin.org/articles/10.3389/fmars.2022.1047078/full#supplementary-material
References
1
Alimba C. G. Faggio C. (2019). Microplastics in the marine environment: Current trends in environmental pollution and mechanisms of toxicological profile. Environ. Toxicol. Pharmacol.68, 61–74. doi: 10.1016/j.etap.2019.03.001
2
Ballent A. Corcoran P. L. Madden O. Helm P. A. Longstaffe F. J. (2016). Sources and sinks of microplastics in Canadian lake Ontario nearshore, tributary and beach sediments. Mar. pollut. Bull.110, 383–395. doi: 10.1016/j.marpolbul.2016.06.037
3
Ballent A. Purser A. Mendes P. D. J. Pando S. (2012). Physical transport properties of marine microplastic pollution. Biogeosci Discuss9, 18755–18798. doi: 10.5194/bgd-9-18755-2012
4
Barrett J. Chase Z. Zhang J. Holl M. M. B. Willis K. Williams A. et al . (2020). Microplastic pollution in deep-sea sediments from the great Australian bight. Front. Mar. Sci.7. doi: 10.3389/fmars.2020.576170
5
Bergmann M. Wirzberger V. Krumpen T. Lorenz C. Primpke S. Tekman M. B. et al . (2017). High quantities of microplastic in Arctic deep-sea sediments from the HAUSGARTEN observatory. Environ. Sci. Technol.51, 11000–11010. doi: 10.1021/acs.est.7b03331
6
Blott S. J. Pye K. (2001). GRADISTAT: A grain size distribution and statistics package for the analysis of unconsolidated sediments. Earth Surface Processes Landforms26, 1237–1248. doi: 10.1002/esp.261
7
Bühring C. Sarnthein M. Erlenkeuser H. (2004). “Toward a high-resolution stable isotope stratigraphy of the last 1.1 million years: Site 1144, south China Sea,” in Proceedings of the ocean drilling program, scientific results, vol. 184 . Eds. PrellW. L.WangP.BlumP.ReaD. K.ClemensS. C., 1–29. Available at: http://www-odp.tamu.edu/publications/184_SR/VOLUME/CHAPTERS/205.PDF.
8
Cai M. He H. Liu M. Li S. Tang G. Wang W. et al . (2018). Lost but can't be neglected: Huge quantities of small microplastics hide in the south China Sea. Sci. Total Environ.633, 1206–1216. doi: 10.1016/j.scitotenv.2018.03.197
9
Castillo C. Fernández C. Gutiérrez M. H. Aranda M. Urbina M. A. Yáñez J. et al . (2020). Water column circulation drives microplastic distribution in the martínez-baker channels; a large fjord ecosystem in Chilean Patagonia. Mar. pollut. Bull.160, 111591. doi: 10.1016/j.marpolbul.2020.111591
10
Chen M. Du M. Jin A. Chen S. Dasgupta S. Li J. et al . (2020). Forty-year pollution history of microplastics in the largest marginal sea of the western pacific. Geochemical Perspect. Lett.13, 42–47. doi: 10.7185/geochemlet.2012
11
Chen C. F. Ju Y. R. Lim Y. C. Chen C. W. Dong C. D. (2021). Seasonal variation of diversity, weathering, and inventory of microplastics in coast and harbor sediments. Sci. Total Environ.781, 146610. doi: 10.1016/j.scitotenv.2021.146610
12
Chen C. F. Ju Y. R. Lim Y. C. Hsu N. H. Lu K. T. Hsieh S. L. et al . (2020). Microplastics and their affiliated PAHs in the sea surface connected to the southwest coast of Taiwan. Chemosphere254, 126818. doi: 10.1016/j.chemosphere.2020.126818
13
Chiang C.-S. Hsiung K.-H. Yu H.-S. Chen S.-C. (2020). Three types of modern submarine canyons on the tectonically active continental margin offshore southwestern Taiwan. Mar. Geophysical Res.41, 4. doi: 10.1007/s11001-020-09403-z
14
Claessens M. Van Cauwenberghe L. Vandegehuchte M. B. Janssen C. R. (2013). New techniques for the detection of microplastics in sediments and field collected organisms. Mar. pollut. Bull.70, 227–233. doi: 10.1016/j.marpolbul.2013.03.009
15
Comnea-Stancu I. R. Wieland K. Ramer G. Schwaighofer A. Lendl B. (2017). On the identification of rayon/viscose as a major fraction of microplastics in the marine environment: Discrimination between natural and manmade cellulosic fibers using Fourier transform infrared spectroscopy. Appl. Spectrosc.71, 939–950. doi: 10.1177/0003702816660725
16
Cunningham E. M. Ehlers S. M. Dick J. T. A. Sigwart J. D. Linse K. Dick J. J. et al . (2020). High abundances of microplastic pollution in deep-sea sediments: Evidence from Antarctica and the southern ocean. Environ. Sci. Technol.54, 13661–13671. doi: 10.1021/acs.est.0c03441
17
Fischer V. Elsner N. O. Brenke N. Schwabe E. Brandt A. (2015). Plastic pollution of the kuril–kamchatka trench area (NW pacific). Deep Sea Res. Part II: Topical Stud. Oceanography111, 399–405. doi: 10.1016/j.dsr2.2014.08.012
18
Fok L. Cheung P. K. (2015). Hong Kong At the pearl river estuary: A hotspot of microplastic pollution. Mar. pollut. Bull.99, 112–118. doi: 10.1016/j.marpolbul.2015.07.050
19
Folk R. L. Ward W. C. (1957). Brazos river bar [Texas]: A study in the significance of grain size parameters. J. Sedimentary Res.27, 3–26. doi: 10.1306/74D70646-2B21-11D7-8648000102C1865D
20
Gago J. Carretero O. Filgueiras A. V. Viñas L. (2018). Synthetic microfibers in the marine environment: A review on their occurrence in seawater and sediments. Mar. pollut. Bull.127, 365–376. doi: 10.1016/j.marpolbul.2017.11.070
21
Galloway T. S. Cole M. Lewis C. (2017). Interactions of microplastic debris throughout the marine ecosystem. Nat. Ecol. Evol.1, 116. doi: 10.1038/s41559-017-0116
22
GESAMP (2019). Guidelines for the monitoring and assessment of plastic litter and microplastics in the ocean(Reports and studies of GESAMP No.99) (Nairobi: United Nations Environment Programme), 130.
23
Hidalgo-Ruz V. Gutow L. Thompson R. C. Thiel M. (2012). Microplastics in the marine environment: A review of the methods used for identification and quantification. Environ. Sci. Technol.46, 3060–3075. doi: 10.1021/es2031505
24
Huang D. Li X. Ouyang Z. Zhao X. Wu R. Zhang C. et al . (2021). The occurrence and abundance of microplastics in surface water and sediment of the West river downstream, in the south of China. Sci. Total Environ.756, 143857. doi: 10.1016/j.scitotenv.2020.143857
25
Jambeck ,. J. Geyer R. Wilcox R. Siegler C. Perryman T. R. Andrady M. et al . (2015). Plastic waste inputs from land into the ocean. Science347, 768–771. doi: 10.1126/science.1260352
26
Jin F.-L. Li X. Park S.-J. (2015). Synthesis and application of epoxy resins: A review. J. Ind. Eng. Chem.29, 1–11. doi: 10.1016/j.jiec.2015.03.026
27
Kane I. A. Clare M. A. Miramontes E. Wogelius R. Rothwell J. J. Garreau P. et al . (2020). Seafloor microplastic hotspots controlled by deep-sea circulation. Science368. doi: 10.3389/feart.2019.00080
28
Kanhai L. D. K. Johansson C. Frias J. P. G. L. Gardfeldt K. Thompson R. C. O’Connor I. (2019). Deep sea sediments of the Arctic central basin: A potential sink for microplastics. Deep Sea Res. Part I: Oceanographic Res. Papers145, 137–142. doi: 10.1016/j.marpolbul.2018.03.011
29
Käppler A. Windrich F. Löder M. G. J. Malanin M. Fischer D. Labrenz M. et al . (2015). Identification of microplastics by FTIR and raman microscopy: A novel silicon filter substrate opens the important spectral range below 1300 cm–1 for FTIR transmission measurements. Analytical Bioanalytical Chem.407, 6791–6801. doi: 10.1007/s00216-015-8850-8
30
Khatmullina L. Isachenko I. (2017). Settling velocity of microplastic particles of regular shapes. Mar. pollut. Bull.114, 871–880. doi: 10.1016/j.marpolbul.2016.11.024
31
Kim H.-Y. (2013). Statistical notes for clinical researchers: assessing normal distribution (2) using skewness and kurtosis. Restorative Dentistry Endodontics38, 52–54. doi: 10.5395/rde.2013.38.1.52
32
Kowalski N. Reichardt A. M. Waniek J. J. (2016). Sinking rates of microplastics and potential implications of their alteration by physical, biological, and chemical factors. Mar. pollut. Bull.109, 310–319. doi: 10.1016/j.marpolbul.2016.05.064
33
Li W. Lo H.-S. Wong H.-M. Zhou M. Wong C.-Y. Tam N. F.-Y. et al . (2020). Heavy metals contamination of sedimentary microplastics in Hong Kong. Mar. pollut. Bull.153, 110977. doi: 10.1016/j.marpolbul.2020.110977
34
Lin L. Zuo L.-Z. Peng J.-P. Cai L.-Q. Fok L. Yan Y. et al . (2018). Occurrence and distribution of microplastics in an urban river: A case study in the pearl river along guangzhou city, China. Sci. Total Environ.644, 375–381. doi: 10.1016/j.scitotenv.2018.06.327
35
Liu J. T. Hsu R. T. Hung J.-J. Chang Y.-P. Wang Y.-H. Rendle-Bühring R. H. et al . (2016). From the highest to the deepest: The gaoping river–gaoping submarine canyon dispersal system. Earth-Science Rev.153, 274–300. doi: 10.1016/S0025-3227(01)00219-5
36
Liu Z. Tuo S. Colin C. Liu J. T. Huang C.-Y. Selvaraj K. et al . (2008). Detrital fine-grained sediment contribution from Taiwan to the northern south China Sea and its relation to regional ocean circulation. Mar. Geology255, 149–155. doi: 10.1016/j.margeo.2008.08.003
37
Liu K. Wang X. Fang T. Xu P. Zhu L. Li D. (2019). Source and potential risk assessment of suspended atmospheric microplastics in shanghai. Sci. Total Environ.675, 462–471. doi: 10.1016/j.scitotenv.2019.04.110
38
Li S. Wang Y. Liu L. Lai H. Zeng X. Chen J. et al . (2021). Temporal and spatial distribution of microplastics in a coastal region of the pearl river estuary, China. Water13, 1618. doi: 10.3390/w13121618
39
Lo H.-S. Lee Y.-K. Po B. H.-K. Wong L.-C. Xu X. Wong C.-F. et al . (2020). Impacts of typhoon mangkhut in 2018 on the deposition of marine debris and microplastics on beaches in Hong Kong. Sci. Total Environ.716, 137172. doi: 10.1016/j.scitotenv.2020.137172
40
Lo H.-S. Po B. H.-K. Li L. Wong A. Y. M. Kong R. Y. C. Li L. et al . (2021). Bisphenol a and its analogues in sedimentary microplastics of Hong Kong. Mar. pollut. Bull.164, 112090. doi: 10.1016/j.marpolbul.2021.112090
41
Lo H.-S. Xu X. Wong C.-Y. Cheung S.-G. (2018). Comparisons of microplastic pollution between mudflats and sandy beaches in Hong Kong. Environ. pollut.236, 208–217. doi: 10.1016/j.envpol.2018.01.031
42
Lüdmann T. Wong H. K. Berglar K. (2005). Upward flow of north pacific deep water in the northern south China Sea as deduced from the occurrence of drift sediments. Geophysical Res. Lett.32, L05614. doi: 10.1029/2004GL021967
43
MacLeo M. Arp H. P. H. Tekman M. B. Jahnkeet A. (2021). The global threat from plastic pollution. Science373, 61–65. doi: 10.1126/science.abg5433
44
Mai L. You S. N. He H. Bao L. J. Liu L. Y. Zeng E. Y. (2019). Riverine microplastic pollution in the pearl river delta, China: Are modeled estimates accurate? Environ. Sci. Technol.53, 11810–11817. doi: 10.1021/acs.est.9b04838
45
Martin J. Lusher A. Thompson R. C. Morley A. (2017). The deposition and accumulation of microplastics in marine sediments and bottom water from the Irish continental shelf. Sci. Rep.7, 10772–11079. doi: 10.1038/s41598-017-11079-2
46
Masura J. Baker J. Foster G. Arthur C. (2015). Laboratory methods for the analysis of microplastics in the marine environment: Recommendations for quantifying synthetic particles in waters and sediments (NOAA Technical Memorandum). NOS-OR&R-48.
47
McCave I. N. Hall I. R. (2006). Size sorting in marine muds: Processes, pitfalls, and prospects for paleoflow-speed proxies. Geochemistry Geophysics Geosystems7, Q10N05. doi: 10.1029/2006GC001284
48
Meijer L. J. J. van Emmerik T. van der Ent R. Schmidt C. Lebreton L. (2021). More than 1000 rivers account for 80% of global riverine plastic emissions into the ocean. Sci. Adv.7, eaaz5803. doi: 10.1126/sciadv.aaz5803
49
Mishra P. Pandey C. M. Singh U. Gupta A. Sahu C. Keshri A. (2019). Descriptive statistics and normality tests for statistical data. Ann. Cardiac Anaesthesia22, 67–72. doi: 10.4103/aca.ACA_157_18
50
Mu J. Qu L. Jin F. Zhang S. Fang C. Ma X. et al . (2019). Abundance and distribution of microplastics in the surface sediments from the northern Bering and chukchi seas. Environ. pollut.245, 122–130. doi: 10.1016/j.envpol.2018.10.097
51
Norén F. (2007). Small plastic particles in coastal Swedish waters (Sweden: KIMO Report), 11.
52
Nuelle M.-T. Dekiff J. H. Remy D. Fries E. (2014). A new analytical approach for monitoring microplastics in marine sediments. Environ. pollut.184, 161–169. doi: 10.1016/j.envpol.2013.07.027
53
Oliveira A. Santos A. I. Rodrigues A. Vitorino J. (2007). Sedimentary particle distribution and dynamics on the nazaré canyon system and adjacent shelf (Portugal). Mar. Geology246, 105–122. doi: 10.1016/j.margeo.2007.04.017
54
Park H.-J. Oh M.-J. Kim P.-G. Kim G. Jeong D.-H. Ju B.-K. et al . (2020). National reconnaissance survey of microplastics in municipal wastewater treatment plants in Korea. Environ. Sci. Technol.54, 1503–1512. doi: 10.1021/acs.est.9b04929
55
Peeken I. Primpke S. Beyer B. Gütermann J. Katlein C. Krumpen T. et al . (2018). Arctic Sea ice is an important temporal sink and means of transport for microplastic. Nat. Commun.9, 1505. doi: 10.1038/s41467-018-03825-5
56
Peng G. Bellerby R. Zhang F. Sun X. Li D. (2020). The ocean’s ultimate trashcan: Hadal trenches as major depositories for plastic pollution. Water Res.168, 115121. doi: 10.1016/j.watres.2019.115121
57
Peng X. Chen M. Chen S. Dasgupta S. Xu H. Ta K. et al . (2018). Microplastics contaminate the deepest part of the world’s ocean. Geochemical Perspect. Lett.9, 1–5. doi: 10.7185/geochemlet.1829
58
Peng G. Xu P. Zhu B. Bai M. Li D. (2018). Microplastics in freshwater river sediments in shanghai, China: A case study of risk assessment in mega-cities. Environ. pollut.234, 448–456. doi: 10.1016/j.envpol.2017.11.034
59
Piccinini P. Senaldi C. Alberto Lopes J. F. (2014). Fibre labelling: Polytrimethylene terephthalate – PTT – DuPont: Final report. JRC Sci. Policy Rep.JRC89087, 342. doi: 10.2788/34915
60
Pohl F. Eggenhuisen J. T. Kane I. A. Clare M. A. (2020). Transport and burial of microplastics in deep-marine sediments by turbidity currents. Environ. Sci. Technol.54, 4180–4189. doi: 10.1021/acs.est.9b07527
61
Reeder D. B. Ma B. Yang Y. J. (2011). Very large subaqueous sand dunes on the upper continental slope in the south China Sea generated by episodic, shoaling deep-water internal solitary waves. Mar. Geology279, 12–18. doi: 10.1016/j.margeo.2010.10.009
62
Reineccius J. Appelt J.-S. Hinrichs T. Kaiser D. Stern J. Prien R. D. et al . (2020). Abundance and characteristics of microfibers detected in sediment trap material from the deep subtropical north Atlantic ocean. Sci. Total Environ.738, 140354. doi: 10.1016/j.scitotenv.2020.140354
63
Reineccius J. Bresien J. Waniek J. J. (2021). Separation of microplastics from mass-limited samples by an effective adsorption technique. Sci. Total Environ.788, 147881. doi: 10.1016/j.scitotenv.2021.147881
64
Rochman C. M. (2018). Microplastics research–from sink to source. Science360, 28–29. doi: 10.1126/science.aar7734
65
Schmidt C. Krauth T. Wagner S. (2017). Export of plastic debris by rivers into the sea. Environ. Sci. Technol.51, 12246–12253. doi: 10.1021/acs.est.7b06377
66
Shao L. Li X. Geng J. Pang X. Lei Y. Qiao P. et al . (2007). Deep water bottom current deposition in the northern south China Sea. Sci. China Ser. D: Earth Sci.50, 1060–1066. doi: 10.1007/s11430-007-0015-y
67
Stubbins A. Law K. L. Munoz S. E. Bianchi T. S. Zhu L. (2021). Plastics in the earth system. Science373, 51–55. doi: 10.1126/science.abb0354
68
Tan X. Yu X. Cai L. Wang J. Peng J. (2019). Microplastics and associated PAHs in surface water from the feilaixia reservoir in the beijiang river, China. Chemosphere221, 834–840. doi: 10.1016/j.chemosphere.2019.01.022
69
Tekman M. B. Wekerle C. Lorenz C. Primpke S. Hasemann C. Gerdts G. et al . (2020). Tying up loose ends of microplastic pollution in the Arctic: Distribution from the sea surface through the water column to deep-sea sediments at the HAUSGARTEN observatory. Environ. Sci. Technol.54, 4079–4090. doi: 10.1021/acs.est.9b06981
70
Tian Z. Jia Y. Chen J. Liu J. P. Zhang S. Ji C. et al . (2021). Internal solitary waves induced deep-water nepheloid layers and seafloor geomorphic changes on the continental slope of the northern south China Sea. Phys. Fluids33, 053312. doi: 10.1063/5.0045124
71
Turner A. (2010). Marine pollution from antifouling paint particles. Mar. pollut. Bull.60, 159–171. doi: 10.1016/j.marpolbul.2009.12.004
72
van Cauwenberghe L. Vanreusel A. Mees J. Janssen C. R. (2013). Microplastic pollution in deep-sea sediments. Environ. pollut.182, 495–499. doi: 10.1016/j.envpol.2013.08.013
73
Visher G. S. (1969). Grain size distributions and depositional processes. J. Sedimentary Res.39, 1074–1106.
74
Wang F. Lai Z. Peng G. Luo L. Liu K. Huang X. et al . (2021). Microplastic abundance and distribution in a central Asian desert. Sci. Total Environ.800, 149529. doi: 10.1016/j.scitotenv.2021.149529
75
Wang J. Zhao M. Qiu X. Sibuet J.-C. He E. Zhang J. et al . (2016). 3D seismic structure of the zhenbei-huangyan seamounts chain in the East Sub-basin of the south China Sea and its mechanism of formation. Geological J.51, 448–463. doi: 10.1002/gj.2781
76
Ward I. M. Wilding M. A. (1977). Infra-red and raman spectra of poly (m-methylene terephthalate) polymers. Polymer18, 327–335. doi: 10.1016/0032-3861(77)90077-5
77
Woodall L. C. Sanchez-Vidal A. Canals M. Paterson G. L. J. Coppock R. Sleight V. et al . (2014). The deep sea is a major sink for microplastic debris. R. Soc. Open Sci.1, 140317. doi: 10.1098/rsos.140317
78
Wu P. Tang Y. Dang M. Wang S. Jin H. Liu Y. et al . (2020). Spatial-temporal distribution of microplastics in surface water and sediments of maozhou river within guangdong-Hong Kong-Macao greater bay area. Sci. Total Environ.717, 135187. doi: 10.1016/j.scitotenv.2019.135187
79
Wynn R. B. Stow D. A. V. (2002). Classification and characterisation of deep-water sediment waves. Mar. Geology192, 7–22. doi: 10.1016/S0025-3227(02)00547-9
80
Xiu P. Chai F. Shi L. Xue H. Chao Y. (2010). A census of eddy activities in the south China Sea during 1993–2007. J. Geophysical Research: Oceans115, C03012. doi: 10.1029/2009JC005657
81
Yan M. Nie H. Xu K. He Y. Hu Y. Huang Y. et al . (2019). Microplastic abundance, distribution and composition in the pearl river along guangzhou city and pearl river estuary, China. Chemosphere217, 879–886. doi: 10.1016/j.chemosphere.2018.11.093
82
Zhang Y. Liu Z. Zhao Y. Colin C. Zhang X. Wang M. et al . (2018). Long-term in situ observations on typhoon-triggered turbidity currents in the deep sea. Geology46, 675–678. doi: 10.1130/G45178.1
83
Zhang Y. Liu Z. Zhao Y. Wang W. Li J. Xu J. (2014). Mesoscale eddies transport deep-sea sediments. Sci. Rep.4, 5937. doi: 10.1038/srep05937
84
Zhao Y. Liu Z. Zhang Y. Li J. Wang M. Wang W. et al . (2015). In situ observation of contour currents in the northern south China Sea: Applications for deepwater sediment transport. Earth Planetary Sci. Lett.430, 477–485. doi: 10.1016/j.epsl.2015.09.008
85
Zhong Y. Chen Z. Li L. Liu J. Li G. Zheng X. et al . (2017). Bottom water hydrodynamic provinces and transport patterns of the northern south China Sea: Evidence from grain size of the terrigenous sediments. Continental Shelf Res.140, 11–26. doi: 10.1016/j.csr.2017.01.023
86
Zhou P. Huang C. Fang H. Cai W. Li D. Li X. et al . (2011). The abundance, composition and sources of marine debris in coastal seawaters or beaches around the northern south China Sea (China). Mar. pollut. Bull.62, 1998–2007. doi: 10.1016/j.marpolbul.2011.06.018
Summary
Keywords
microplastics, deep-sea sediments, submarine canyon, sedimentary dynamics, South China Sea
Citation
Zhang X, Liu Z, Zhao Y, Ma P, Colin C and Lin AT-S (2022) Distribution and controlling factors of microplastics in surface sediments of typical deep-sea geomorphological units in the northern South China Sea. Front. Mar. Sci. 9:1047078. doi: 10.3389/fmars.2022.1047078
Received
17 September 2022
Accepted
22 November 2022
Published
08 December 2022
Volume
9 - 2022
Edited by
Sonja M. Ehlers, Bundesanstalt für Gewässerkunde (BFG), Germany
Reviewed by
Mohamed Mohsen, Institute of Oceanology, China; Suneel V., Council of Scientific and Industrial Research (CSIR), India
Updates
Copyright
© 2022 Zhang, Liu, Zhao, Ma, Colin and Lin.
This is an open-access article distributed under the terms of the Creative Commons Attribution License (CC BY). The use, distribution or reproduction in other forums is permitted, provided the original author(s) and the copyright owner(s) are credited and that the original publication in this journal is cited, in accordance with accepted academic practice. No use, distribution or reproduction is permitted which does not comply with these terms.
*Correspondence: Zhifei Liu, lzhifei@tongji.edu.cn
This article was submitted to Marine Pollution, a section of the journal Frontiers in Marine Science
Disclaimer
All claims expressed in this article are solely those of the authors and do not necessarily represent those of their affiliated organizations, or those of the publisher, the editors and the reviewers. Any product that may be evaluated in this article or claim that may be made by its manufacturer is not guaranteed or endorsed by the publisher.