 Junfeng Gao
 Qiang Su
- College of Earth and Planetary Sciences (CEPS), University of Chinese Academy of Sciences (UCAS), Beijing, China
The relationships between the inorganic nutrients and diversity of dinoflagellate cysts (the N-Dc relationships) are one of the most central issues in coastal ecology. It is not only an important pathway to explore the ecological processes of plankton, but also a key element for assessing eutrophication in marine ecosystems. Although the N-Dc relationships have been studied for many years, they have remained controversial, which may be attributed to (1) using samples collected from a single source (2) considering an insufficient range of nutrient concentrations (3) rarely taking into account species abundance distributions (SAD) that could better represent diversity. In this study, the N-Dc relationships are evaluated according to a compiled dataset, which cover the wide range of nutrient concentrations. Species diversity of cysts are estimated by four common diversity metrics and a new SAD parameter. Results show that all diversity metrics are negative with nutrients, which supports that low diversity of cysts could be considered as a signal of eutrophication. Additionally, this study finds a new pattern that SAD of cysts (Nr/N1, Nr and N1 is the abundance of the r-th and the first species in descending order) with decreasing nutrients appears to gradually approach 1: 1/2: 1/3…. In the future, if this pattern can be verified by more investigations, understanding the negative N-Dc relationships is more likely to provide new direction for assessing and managing eutrophication in coastal ecosystem, and even for exploring the general mechanisms determining diversity.
Introduction
The dinoflagellate is an important component of the food chain in the coastal ecosystem (Penaud et al., 2018; Rodrigues et al., 2019; Keskes et al., 2020). It can not only use inorganic nutrients for primary production, but also produces harmful algal blooms in eutrophic waters (Liu et al., 2012; Price et al., 2017; Rodrigues et al., 2022). Thus, understanding the relationships between marine dinoflagellate and inorganic nutrients is highly valuable in exploring the ecological processes of plankton and environmental changes of the coastal ecosystems (Baula et al., 2011; Price et al., 2017; Gurdebeke et al., 2018; Rodrigues et al., 2022).
Many dinoflagellates produce the resting cyst that settles on the sediment bottom (Ellegaard et al., 2017; Gurdebeke et al., 2018). Previous studies suggested that species diversity of cysts could characterize diversity of living dinoflagellates, and even could reflect the nutrient status of waters (Dale, 2009; Gurdebeke et al., 2018; Rodrigues et al., 2022). For example, Marret and Zonneveld (Marret and Zonneveld, 2003) encoded information about diversity of dinoflagellates according to diversity of cysts. Sangiorgi and Donders (Sangiorgi and Donders, 2004) used diversity of cysts to explore the history and trends of eutrophication in coastal ecosystem. Thus, understanding the relationships between nutrients and diversity of cysts is one of the keys to study how diversity of dinoflagellates responds to nutrient conditions (Dale, 2009; Gurdebeke et al., 2018; Rodrigues et al., 2022), which will help to maintain the safe and sustainable management of coastal waters (Price et al., 2017; Penaud et al., 2018; Keskes et al., 2020; Rodrigues et al., 2022).
Although the relationships between main nutrients (such as NO3 and PO4) and diversity of cysts (hereafter referred to as the N-Dc relationships) have been discussed for many years (Pospelova et al., 2002; Ellegaard et al., 2017; Gurdebeke et al., 2018), they has remained controversial (Ellegaard et al., 2017; Price et al., 2017; Rodrigues et al., 2022). Most studies showed that the N-Dc relationships were negative (Tsirtsis and Karydis, 1998; Wang et al., 2004; Rodrigues et al., 2019; Keskes et al., 2020), which indicated that the diversity of cysts could be used as an indicator of eutrophication (Penaud et al., 2018; Rodrigues et al., 2019; Keskes et al., 2020). However, some studies suggested that their relationships were not always negative (Liu et al., 2012; Price et al., 2017; Rodrigues et al., 2022). For example, Rodrigues et al. (Rodrigues et al., 2022) found that the diversity of cysts was highest in highly eutrophicated condition followed by medium and low eutrophicated condition. Price et al. (Price et al., 2017) investigated the effect of nutrients on dinoflagellate cysts assemblages across estuaries of the Northwest Atlantic, and indicated that the N-Dc relationships were not very significant.
These inconsistent findings may be attributed to the following reasons. (1) Most studies sampled from a single water or cruise, which made their investigations potentially unrepresentative (Baula et al., 2011; Liu et al., 2012; Rodrigues et al., 2022). (2) The range of nutrient concentrations in some studies might be insufficient to present the complete N-Dc relationships (Baula et al., 2011; Price et al., 2017). (3) Only species richness or Shannon - Wiener index was used as diversity metric (Chen et al., 2011; Liu et al., 2012), which could not reflect other aspects of diversity, such as evenness and dominance. (4) Although species abundance distribution (SAD), as an important diversity surrogate, had been widely used to study the relationships between nutrients and diversity in terrestrial ecosystem (Arellano et al., 2017; Villa et al., 2019; Feng et al., 2021), few studies of the N-Dc relationships considered SAD of cysts (Penaud et al., 2018; Rodrigues et al., 2019; Keskes et al., 2020). Thus, there is still a need for the analysis that take into account the wide range of nutrient concentrations and multiple aspects of diversity, especially SAD (Dale, 2009; Gurdebeke et al., 2018; Rodrigues et al., 2022).
The main purpose of this study is to seek a more comprehensive understanding of how diversity of cysts responds to changing nutrient condition. To this end, 602 quantitative samples of marine dinoflagellate cysts that are compiled from six datasets (Marret and Zonneveld, 2003; Orlova et al., 2004; Wang et al., 2004; Esper and Zonneveld, 2007; Vásquez-Bedoya et al., 2008; Bouimetarhan et al., 2009) are used to explore the N-Dc relationships. PO4 and NO3 are used as representatives of inorganic nutrients, which are considered to be the main contributing nutrient of eutrophication in coastal waters (Elser et al., 2007). The diversity of cysts are estimated by four common metrics of diversity (Pielou, 1975) and a new SAD parameter (Su, 2016).
Methods
The diversity of cysts are measured by Species richness (S), Shannon’s index (H’), Simpson’s index (D) and Pielou’s evenness (J) (Pielou, 1975), which are the most common metrics in the studies of species diversity (Baula et al., 2011; Liu et al., 2012; Price et al., 2017; Rodrigues et al., 2022). Additionally, a new SAD parameter is also calculated as the diversity surrogate.
Diversity metrics
H’, D and J are calculated based on the cyst taxon composition and their abundances, they can be expressed as:
where pi is the relative abundance of the i-th species (i = 1, 2, 3,…S). As diversity increases, H’ and J increase and D decreases.
The SAD parameter
The parameter p is generated from a new fractal model of SAD (Su, 2016). According to the fractal hypothesis (when K more species appear at each step of the accumulation process, their abundance are k times less abundant and K = k d, where d is a fractal dimension (Su, 2016)), SAD is
where r (= 1, 2, 3,… S) is the rank of species sorted down by species abundance; Nr and N1 are the abundance of the r-th and the first species in descending order; p (= 1/d) is the fractal parameter that determines SAD. The lower p, the higher species diversity. For example, when p = 1 and S = 3, Nr/N1 is 1: 1/2: 1/3; when p = 3 and S = 3, Nr/N1 is 1: 1/8: 1/27.
Let Fr = ln (Nr/N1) and Dr = ln (r). By minimizing the sum of squared error () p can be calculated as (Su, 2016)
The goodness of fit is estimated by the coefficient of determination (R2), which denotes how well the fractal model (Eq. 4) fits the samples of dinoflagellate cysts. R2 is closer to 1, the goodness of fit is better.
Datasets
602 quantitative samples of dinoflagellate cysts are compiled from six published datasets, which are taken from modern sediments in coastal and outer ocean areas (Marret and Zonneveld, 2003; Orlova et al., 2004; Wang et al., 2004; Esper and Zonneveld, 2007; Vásquez-Bedoya et al., 2008; Bouimetarhan et al., 2009). These datasets are selected because (1) the sedimented cysts offer more comprehensive sample coverage, which is seldom attainable from living dinoflagellates records (Dale, 2009); (2) they contain the abundance of each species, by which SAD of cysts can be calculated; (3) there are NO3 and PO4 records matched with these datasets (Zonneveld et al., 2013); (4) the N-Dc relationships can be evaluated over a wider range (51.2°N-69.3°S); (5) they can give the comparable results, as these datasets have been standardized by excluding the samples that contained less than 50 individual numbers and 3 species numbers (Zonneveld et al., 2013); (6) the published datasets are easy to recheck. More background information of these datasets are given in the Table 1 of Supplementary Files and the corresponding literatures (Marret and Zonneveld, 2003; Orlova et al., 2004; Wang et al., 2004; Esper and Zonneveld, 2007; Vásquez-Bedoya et al., 2008; Bouimetarhan et al., 2009).
The relationship between nutrient concentrations and species diversity
S, H’, D and J are calculated by the vegan packages (Oksanen et al., 2020). The fractal p are calculated by Eq. 5. The frequency distribution patterns of each diversity metric are established using the histogram of 8 bins. Nutrient concentrations are divided equally into 50 segments, and all diversity metrics are standardized by taking the average of each segment. General linear regressions are used to fit the relationships between nutrient concentrations and each diversity metric, and the directions of the N-Dc relationships are marked by the slops of regressions (m). The relationships between nutrient concentrations and p are also fitted by non-linear regressions. All statistical analyses in this paper are performed in R ver. 4.0.4 (www.r-project.org), and code can be archived in figshare (Gao and Su, 2022).
Results
The analytical results of the compiled dataset show that PO4 ranges from 0.08 ± 0.00 to 2.08 ± 0.01 μmol/L and NO3 ranges from 0.35 ± 0.16 to 30.31 ± 0.00 μmol/L. The ranges of S, H’, D, J and p after segmenting PO4 are from 3.00 ± 0.00 to 20.66 ± 7.57, 0.22 ± 0.00 to 1.98 ± 0.47, 0.22 ± 0.00 to 0.91 ± 0.13, 0.13 ± 0.00 to 0.82 ± 0.07 and 1.31 ± 0.00 to 4.16 ± 0.21, respectively. Their ranges after segmenting NO3 are from 3.00 ± 0.00 to 19.86 ± 4.37, 0.09 ± 0.00 to 1.96 ± 0.35, 0.22 ± 0.00 to 0.97 ± 0.10, 0.05 ± 0.00 to 0.74 ± 0.08 and 1.32 ± 0.00 to 4.77 ± 0.19, respectively. The relationships between diversity metrics and two inorganic nutrients show the similar patterns (Figures 1, 2). S, H’ and J are negative with PO4 and NO3 (PO4: mS = -5.97, mH’ = -0.69, mJ = -0.15; NO3: mS = -0.44, mH’ = -0.05, mJ = -0.01). D and p are positive with PO4 and NO3 (PO4: mD = 0.24, mp = 0.74; NO3: mD = 0.02, mp = 0.05). Their relationships are all significant (P< 0.01, Table 1). The non-liner regression also shows that p decrease pronouncedly with decreasing PO4 and NO3 (PO4: R2 = 0.47, P< 0.01; NO3: R2 = 0.48, P< 0.01; please see the legend of Figure 2 for the fitting formula).
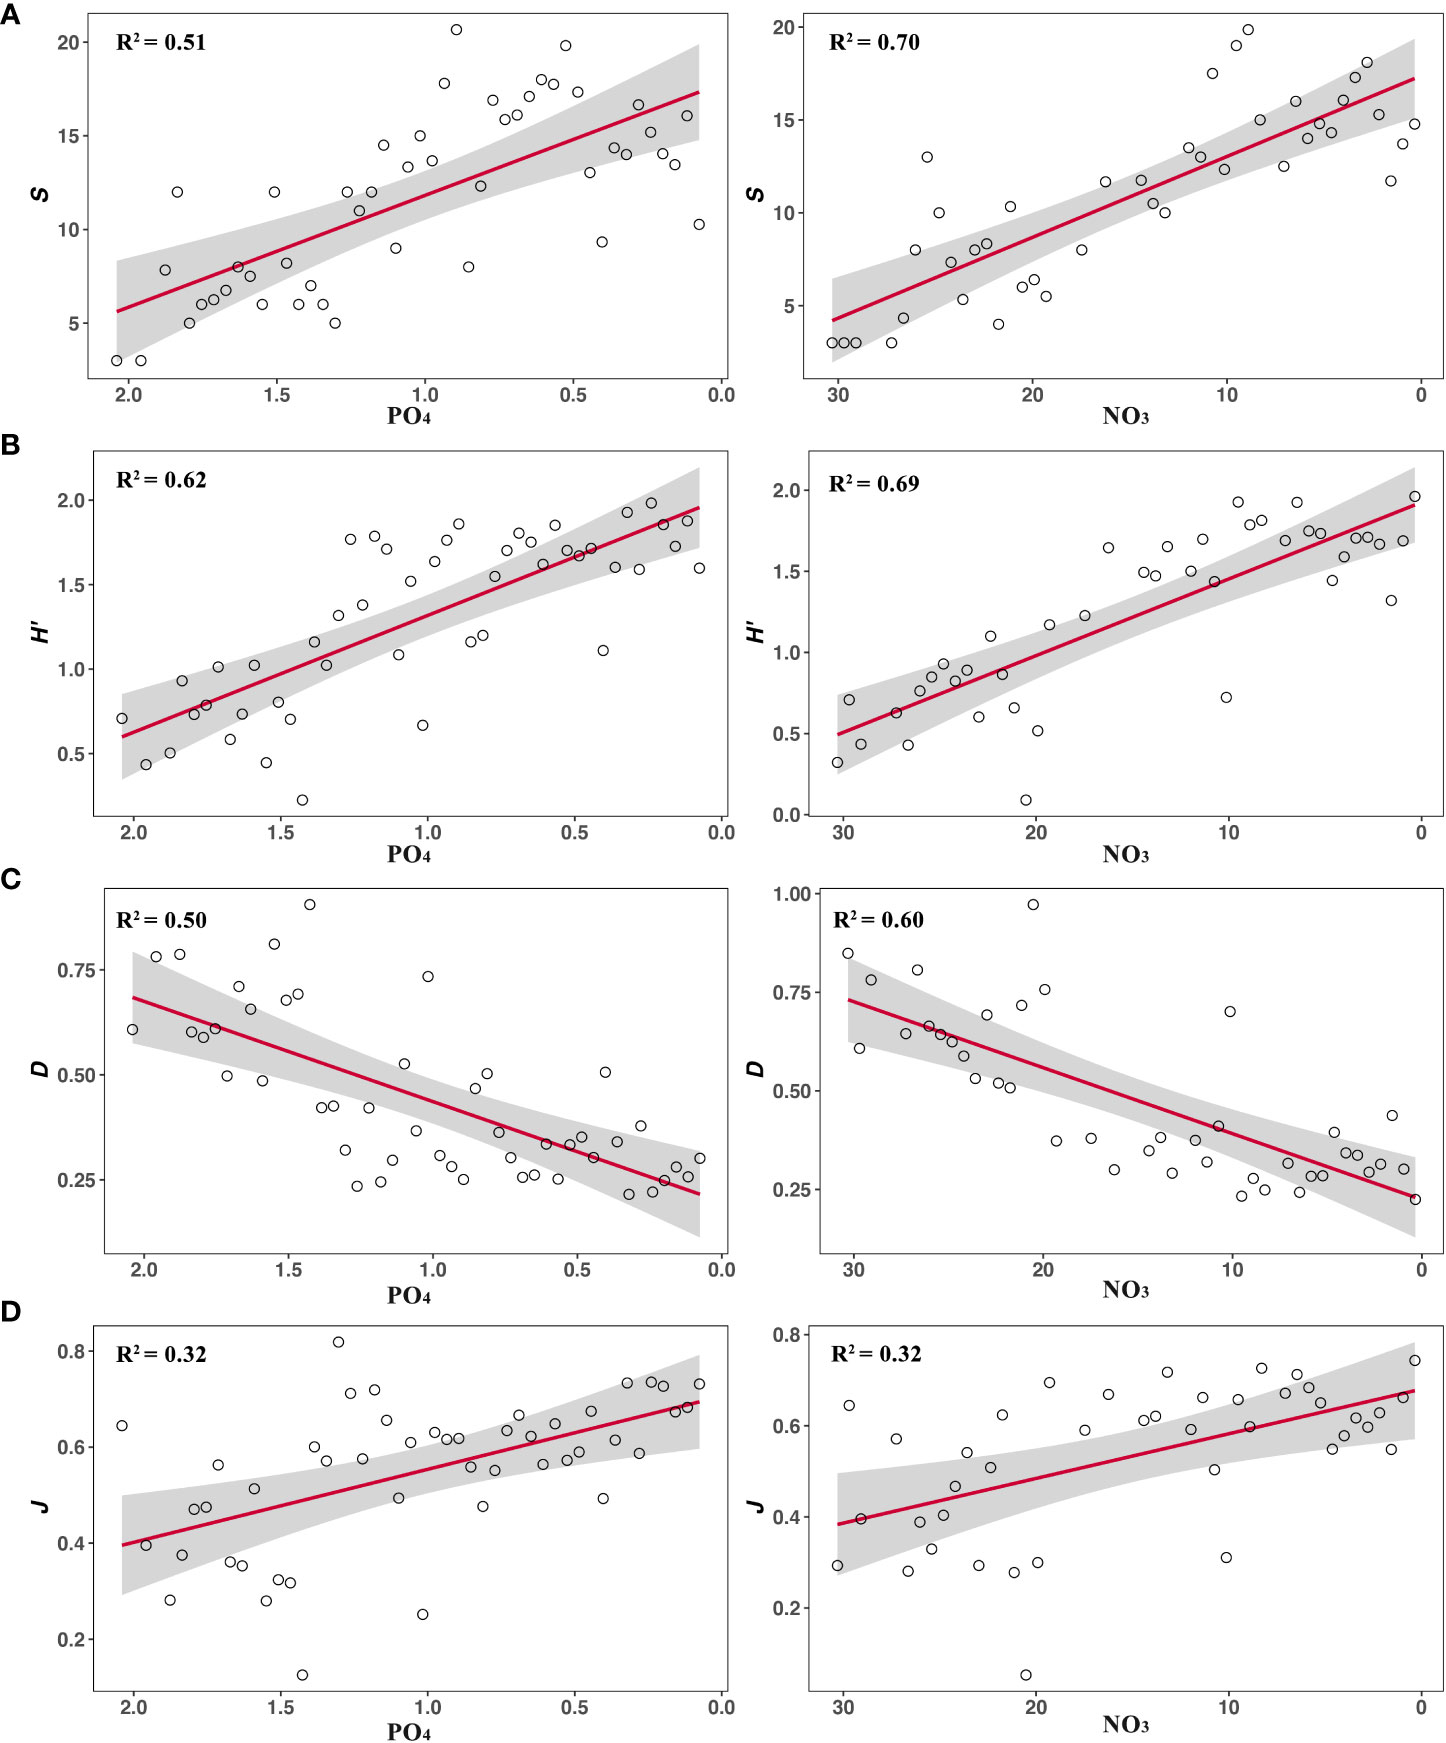
Figure 1 The N-Dc relationships are measured by (A) Species Richness (S), (B) Shannon’s index (H’), (C) Simpson’s index (D), (D) Pielou’s evenness (J). All metrics show the similar patterns with changes in PO4 and NO3. The red line represents the regression result and the gray shading represents the 95% confidence limits.
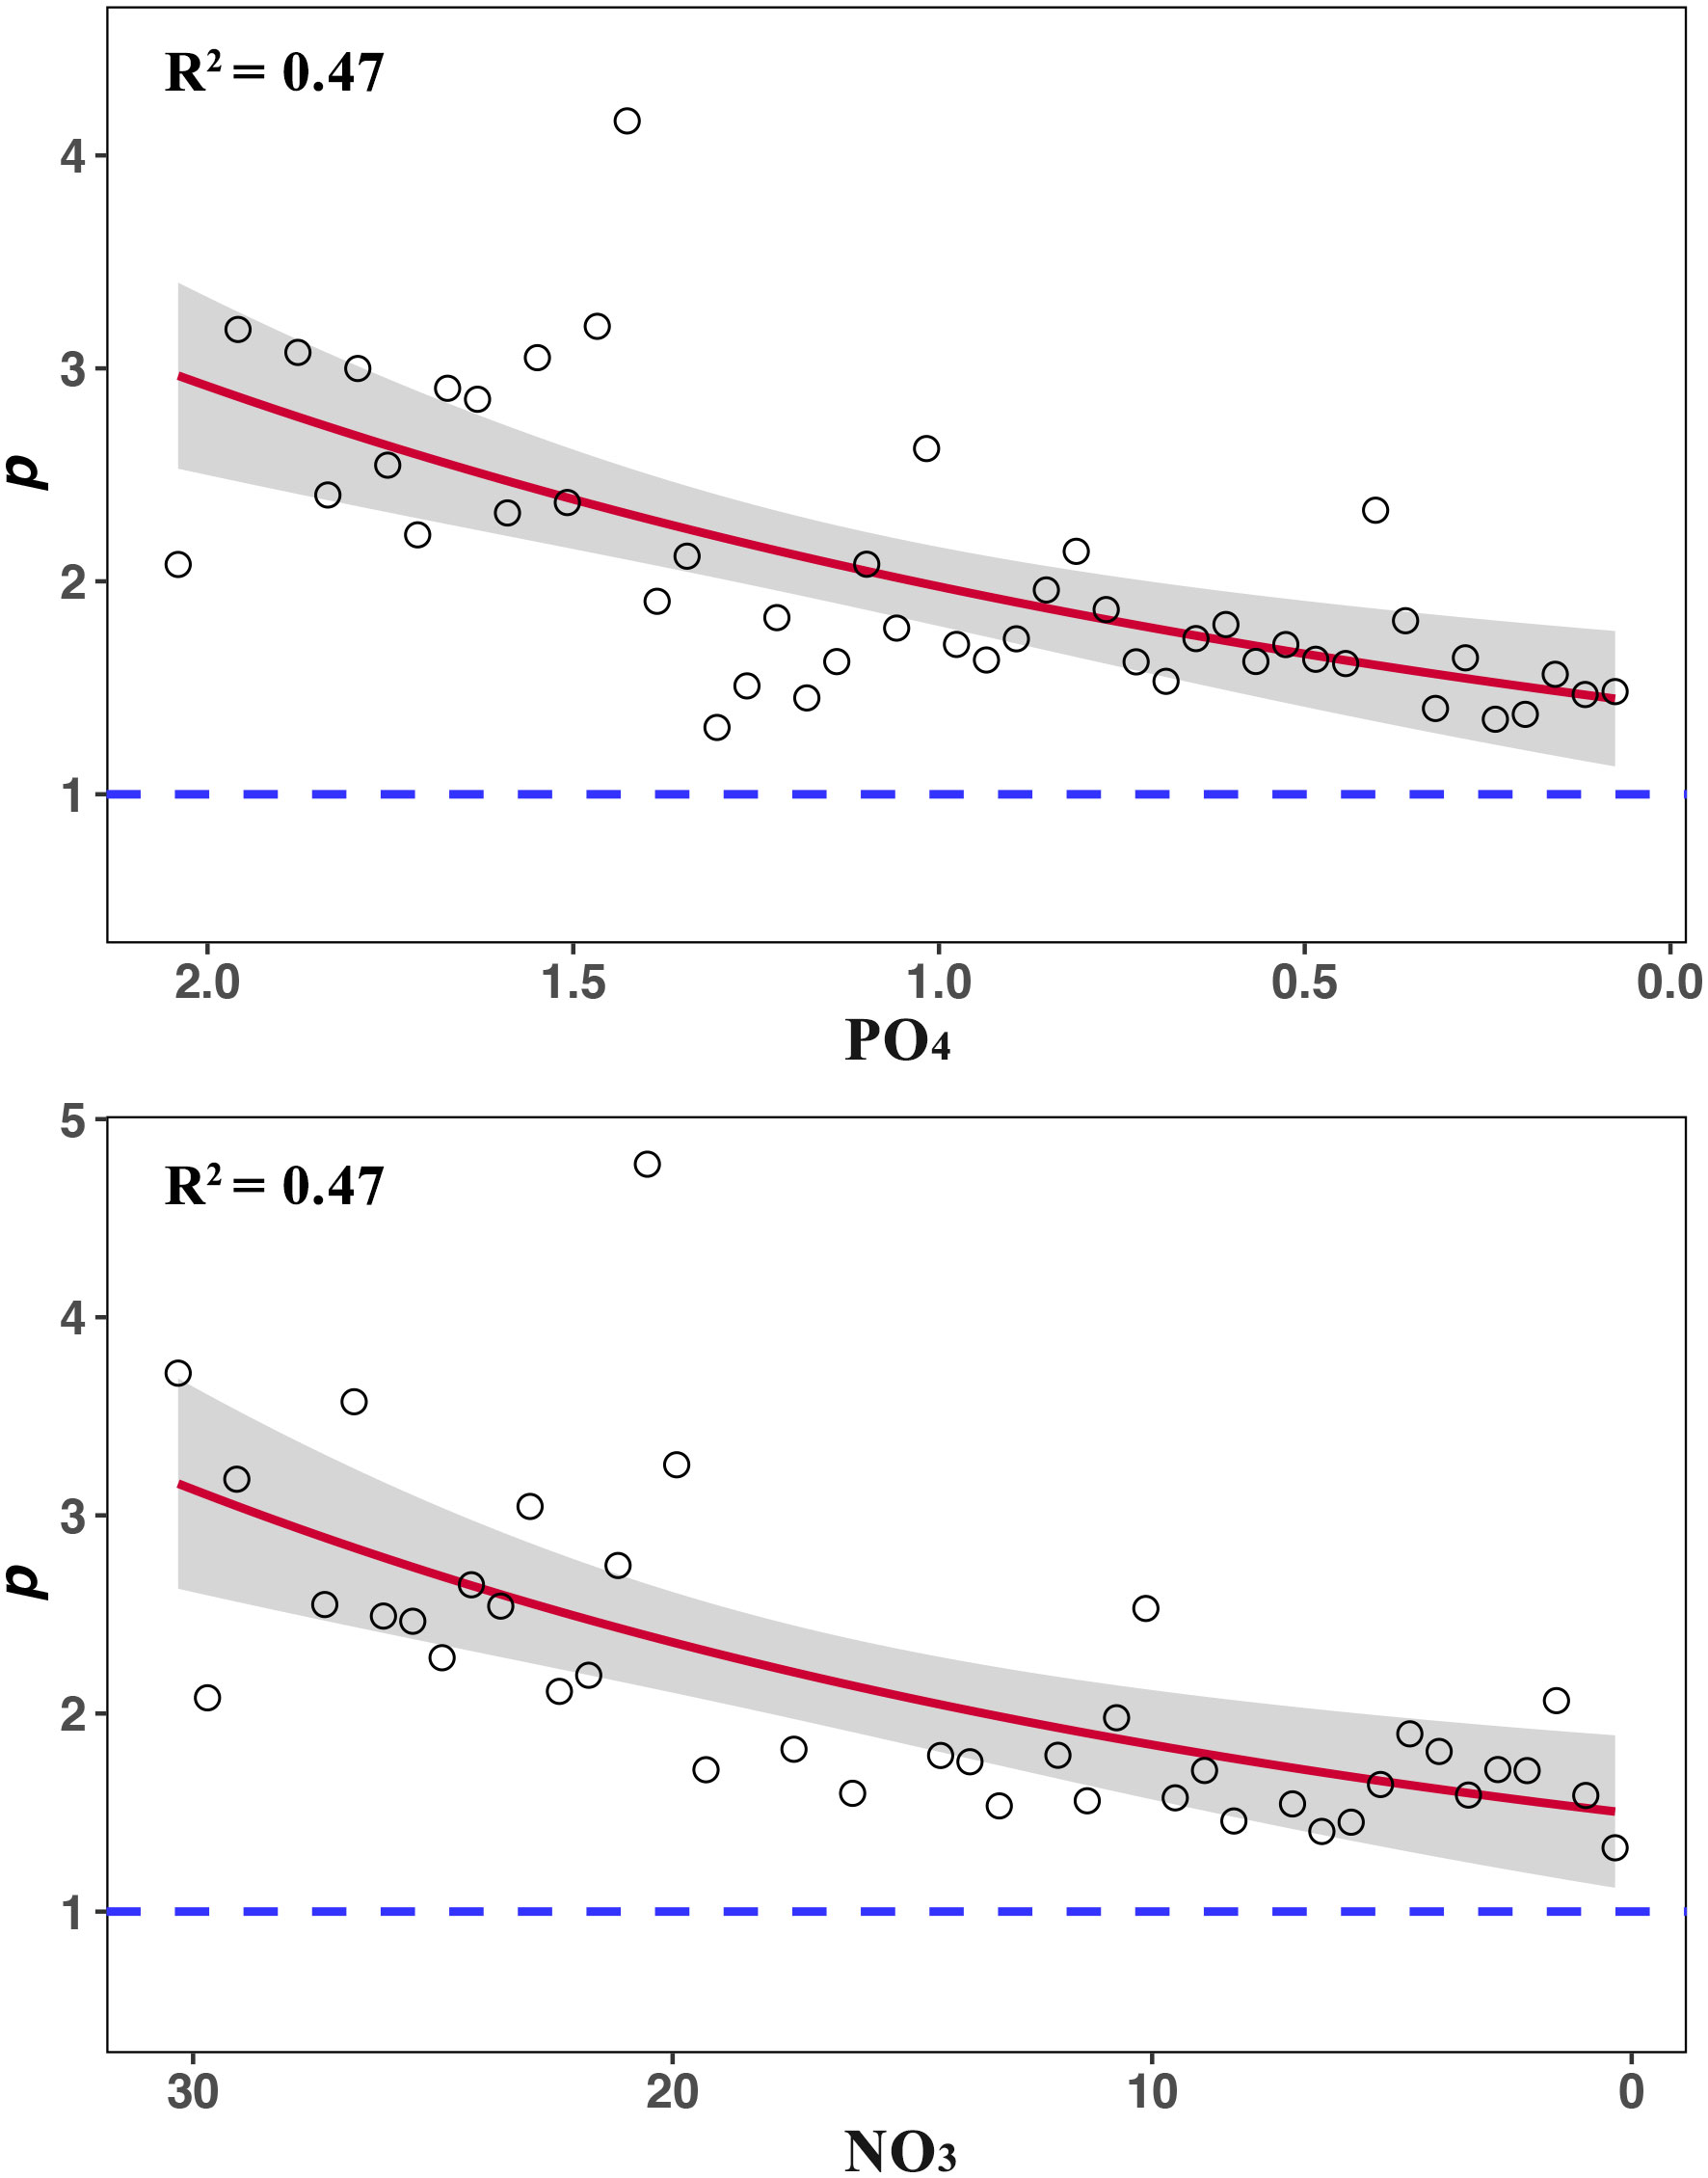
Figure 2 The relationships between nutrient concentrations (µmol/L) and fractal p. The red line represents the result of non-line regression and the gray shading represents the 95% confidence limits (PO4: y = 0.81e0.52x + 0.61, R2 = 0.47, P< 0.01; NO3: y = 0.72e0.04x+0.77, R2 = 0.47, P< 0.01).
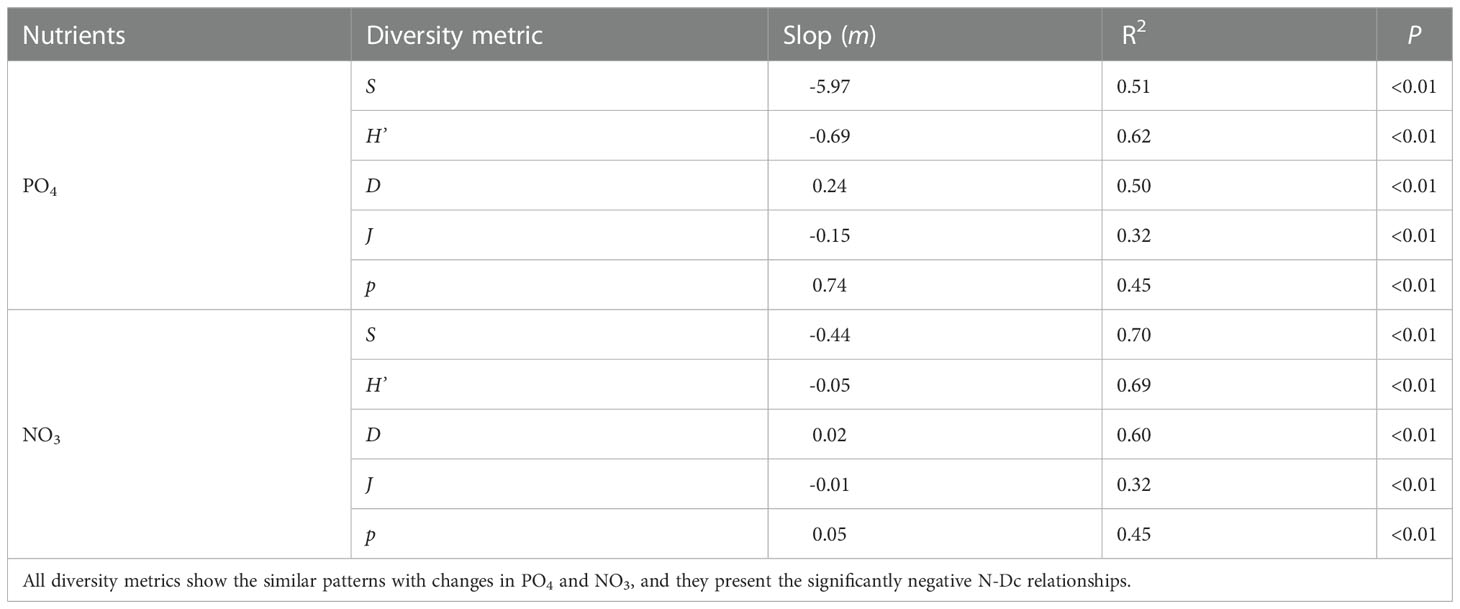
Table 1 The liner regressions between nutrient concentrations and diversity metrics.
The average values of S, H’, D, J and p are 13.75 ± 5.37, 1.60 ± 0.55, 0.34 ± 0.19, 0.63 ± 0.16 and 1.73 ± 0.62, and their median values are 14, 1.70, 0.28, 0.66 and 1.58, respectively. The percentage distributions of diversity metrics show that the interval with the highest percentage of S, H’, D and J are (12.50 16.07], (1.73, 2.11], (0.19, 0.32] and (0.68, 0.80], and they account for 26.08%, 29.90%, 35.04% and 33.55%, respectively (please see Figure 1 of Supplemental Files). [1.03 1.71) is the interval with the highest percentage of p, accounting for 55.48% (Figure 3). It is rare that p is far greater than 1 or very near 0. R2 of the fractal model to the samples of dinoflagellate cysts is from 0.3 to 1 (please see Table 2 of Supplemental Files). R2 of over 82% samples are above 0.8.
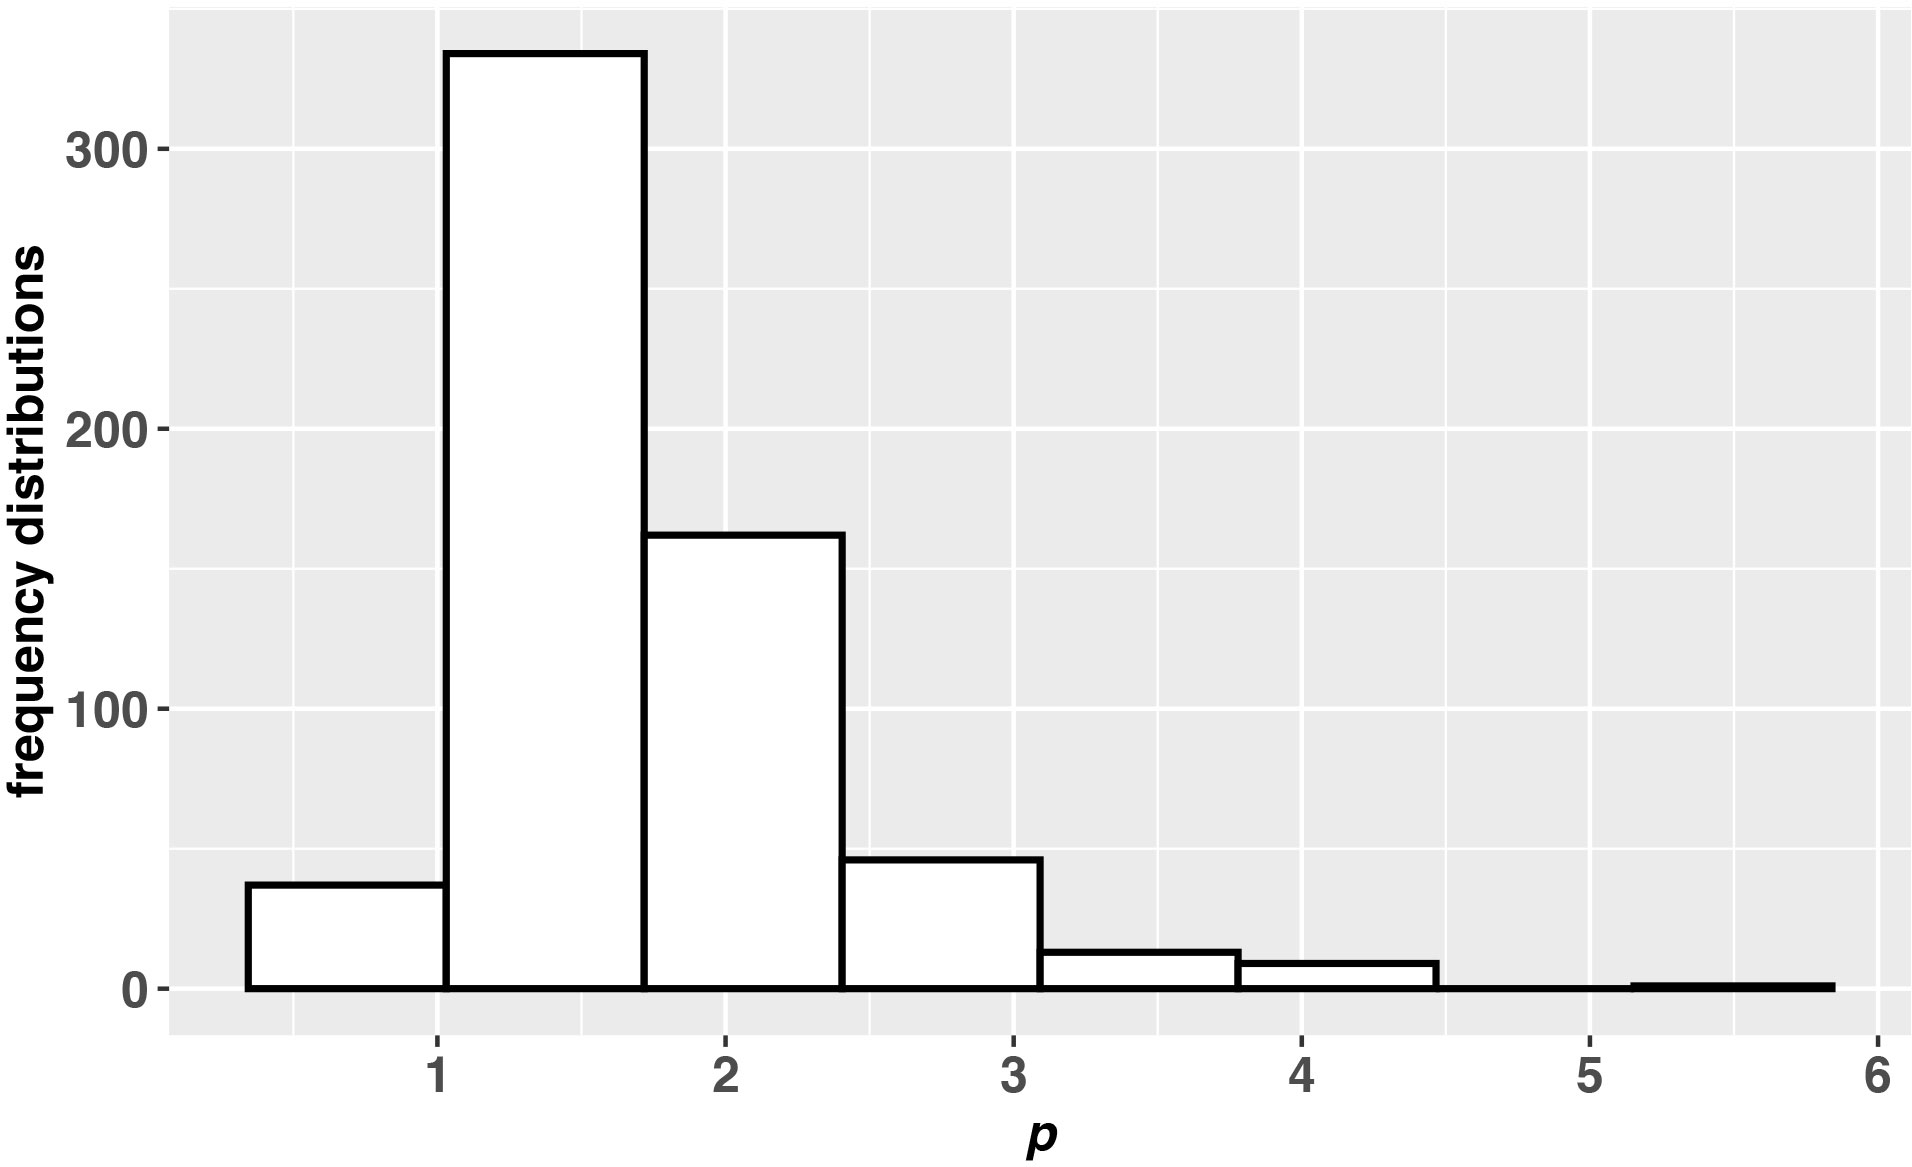
Figure 3 The frequency distribution of the fractal p. The interval with the highest percentage of p is [1.03 1.71) and its percentage is 55.58%.
Discussion
With increasing urbanization and growth of agriculture, inorganic nutrient discharge has become a major problem in most coastal regions (Liu et al., 2012; Price et al., 2017; Rodrigues et al., 2022). Dinoflagellate is one of the most sensitive plankton to the nutrition condition (Ellegaard et al., 2017; Gurdebeke et al., 2018), and the diversity of dinoflagellate cysts are usually used for describing their responses (Baula et al., 2011; Price et al., 2017). Thus, understanding the relationships between nutrients and diversity of cysts (the N-Dc relationships) will help to develop information crucial for the identification of eutrophication in the coastal ecosystem (Penaud et al., 2018; Rodrigues et al., 2019; Keskes et al., 2020). However, although many studies have surrounded the N-Dc relationships over decades (Pospelova et al., 2002; Ellegaard et al., 2017; Gurdebeke et al., 2018), a further analysis is still needed, because (1) the samples of some studies were collected from a single source; (2) the ranges of nutrient concentrations might be insufficient; (3) SAD was rarely considered (Ellegaard et al., 2017; Price et al., 2017; Rodrigues et al., 2022). The biggest difference of this study is that the N-Dc relationships are evaluated by multiple aspects of diversity (including SAD) over a wide range of nutrient concentrations according to the compiled dataset (Marret and Zonneveld, 2003; Orlova et al., 2004; Wang et al., 2004; Esper and Zonneveld, 2007; Vásquez-Bedoya et al., 2008; Bouimetarhan et al., 2009).
In this study, all diversity metrics show the similar patterns with changes in PO4 and NO3 (Figures 1, 2). S, H’ and J significantly decrease with nutrients (Figure 1). D and p significantly increase with nutrients (Figures 1, 2). The lower D and p, the higher species diversity (Pielou, 1975; Su, 2016). Thus, all five metrics are negative with nutrient concentrations. These results echo most of the empirical studies, noting that diversity of cysts was usually negative with nutrients, and it could be considered as an ecological indicator of eutrophication (Tsirtsis and Karydis, 1998; Wang et al., 2004; Rodrigues et al., 2019; Keskes et al., 2020). However, they are inconsistent with the expectation of traditional theories, noting that the link between nutrients and diversity of phytoplankton is considered as the effect of nutrient enrichment on productivity or biomass, and then their relationships will be unimodal (Bedford et al., 1999; Irigoien et al., 2004; Adjou et al., 2012).
Such contradictions between the empirical investigations and the theoretical expectations are apparently worth discussing. Firstly, the negative N-Dc relationships similar to this study have been frequently observed (Wang et al., 2004; Rodrigues et al., 2019; Keskes et al., 2020). For example, Wang et al. (Wang et al., 2004) found that diversity of cysts in Daya Bay dramatically declined when the marine system enriched with nutrients. Keskes et al. (Keskes et al., 2020) suggested cyst diversity of South-Western Mediterranean were lower in the water with higher nutrients. Secondly, the decrease in diversity of cysts has been widely used as warning signs of eutrophication (Tsirtsis and Karydis, 1998; Wang et al., 2004; Rodrigues et al., 2019), which is based entirely on the negative N-Dc relationships. For example, Baula et al. (Baula et al., 2011) have used S of cysts to reflect the changes in nutrients caused by maricultural activities. Keskes et al. (Keskes et al., 2020) have evaluated the eutrophication in coastal ecosystem using to H’ of cysts. Pospelova et al. (Pospelova et al., 2002; Pospelova et al., 2005) used S and Fisher’s α of cysts as indicators of environmental conditions in estuarine systems. Finally, some studies have shown the very weak relationships between diversity and biomass (Currie and Fritz, 1993; Gough et al., 1994; Bedford et al., 1999; Enquist and Niklas, 2001; Currie et al., 2004), which indicates that species diversity may not be determined by the effect of nutrient enrichment on productivity or biomass. Accordingly, the negative N-Dc relationships repeatedly found by empirical investigations imply the possibility that traditional theories of the relationships between nutrients and phytoplankton diversity are still need to be further discussed, or at least the links of diversity with productivity (or biomass) are need to be carefully reconsidered (Currie et al., 2004; Brown, 2014).
Although the negative N-Dc relationships have been supported by many studies (Wang et al., 2004; Rodrigues et al., 2019; Keskes et al., 2020), the explanations for their intrinsic causes were rarely concerned (Liu et al., 2012; Price et al., 2017; Rodrigues et al., 2022). Previous studies mostly focused on the application of diversity as the indicator of eutrophication (Baula et al., 2011; Rodrigues et al., 2022; Shen et al., 2023), such as the comparison of usefulness between diversity and other ecological indicators for assessing eutrophication (Kitsiou and Karydis, 2011; Garmendia et al., 2013) and the evaluation of the efficiency of different diversity metrics to describe trophic levels (Tsirtsis and Karydis, 1998; Danilov and Ekelund, 2001; Spatharis and Tsirtsis, 2010). Actually, it is interesting to note that the negative relationships between nutrients and diversity have also been found in many taxa of marine and terrestrial systems (Morris, 1991; Vitousek, 1994; Elser et al., 2009; Cleland and Harpole, 2010; Kitsiou and Karydis, 2011). For example, Borer et al. (Borer et al., 2014) have manipulated a factorial experiment on herbaceous plants and found that nutrient addition caused declines in diversity. Soons et al. (Soons et al., 2017) compared effects of NO3 and PO4 on diversity of terrestrial ecosystems, and they suggested that nutrients enrichment had widespread and strong negative effects on plant diversity. Therefore, it seems reasonable to speculate that such negative relationships may be caused by some general concepts of ecology, such as resource competition or allometric scaling laws (West et al., 1997; Adjou et al., 2012; Borer et al., 2014). If this speculation holds true, the analysis of the N-Dc relationships according to these concepts will be useful to understand the mechanisms determining species diversity.
The frequency distributions of diversity show that the interval with the highest percentage of p is [1.03 1.71), and its average and median value are 1.73 ± 0.62 and 1.58, respectively. In previous studies, Su (Su, 2018) found very similar results using eight datasets that represented bird, mammal, insect, plant and plankton taxa. His study showed that the interval with the highest percentage of p mostly appeared close to 1, and the average and median value for all taxa were 1.11 ± 0.00 and 1.03, respectively (Su, 2018). Although dinoflagellate cysts and other taxa are from very different ecosystems, their frequency distributions of p all aggregate around 1 [Figure 3 and (Su, 2018)]. According to Eq. 4, when p approaches 1, SAD (Nr/N1) will be 1: 1/2: 1/3… that is consistent with Zipf’s law (Zipf, 1949). Accordingly, diversity of dinoflagellate cysts, as many other taxa, is more likely to appear 1: 1/2: 1/3…, which means that there may be a similar mechanism that structures SAD in the community.
To elucidate this pattern, Su (Su, 2018) proposed two hypotheses (hereafter called the entropy hypothesis). H1: The total energy (ET) in a community was finite; H2: Species diversity was determined by the entropy that increased with the energy transformation. According to H1, NT/N1 (NT is the total abundance in a community) is finite, as NT is usually equivalent to ET (Su, 2018). The finiteness of NT/N1 determines that p ought to be higher than 1 (NT/N1 = converges only when p > 1) (Su, 2018). Since a lower p represents a higher species diversity, p = 1 (Nr/N1 is 1: 1/2: 1/3…) will be the theoretical maximum of diversity presented by the fractal model (Su, 2016). On the one hand, the p distribution of dinoflagellate cysts mostly appears close to 1 (Figure 3). On the other hand, the nonlinear regressions of the relationships between nutrients and p tend to be flat and do not exceed 1 (Figure 2). Thus, this study supposes that diversity of cysts with decreasing nutrients is more likely to approach the maximum 1: 1/2: 1/3….
The frequency distributions of S, H’, D and J also indicate that they are mainly aggregated in the particular intervals that are (12.50 16.07], (1.73, 2.11], (0.19, 0.32] and (0.68, 0.80]. However, previous studies rarely focused on the frequency distributions of these metrics, and almost none of them proposed that these intervals had any particular significance of ecology (Liu et al., 2012; Price et al., 2017; Rodrigues et al., 2022). Thus, it is hard to conclude that S, H’, D and J with decreasing nutrient concentrations will converge to an extreme value similar to p. This is the difference between the N-Dc relationships presented by p and the other metrics, noting that p = 1 is the special case of the fractal model (Su, 2018), while such particular values for other metrics have not been demonstrated by previous studies (Liu et al., 2012; Price et al., 2017; Rodrigues et al., 2022).
Finally, when the samples of cysts are used to explore the relationships between nutrients and diversity of dinoflagellates, there are some influences that are not taken into account by this study. (1) The cyst-producing species include autotrophs, heterotrophs and mixotrophs (Baula et al., 2011; Price et al., 2017). (2) Diversity of dinoflagellates are also affected by other factors including, sea surface salinity, temperature and coastal upwelling events (Dale, 2009; Chen et al., 2011). (3) The cysts record at some site usually represents 30-40% of the species included in local plankton (Pospelova et al., 2002; Dale, 2009). Thus, the results and conclusions of this study may be affected by these points. Additionally, some other algas (such as diatoms) were also frequently used as indictor of eutrophication (Kitsiou and Karydis, 2011; Blanco et al., 2012). In the future, it is very necessary to further test and verify the negative relationships between nutrients and diversity (especially the maximum 1: 1/2: 1/3…) using the dinoflagellate and other algae samples.
Conclusion
This study suggests that the relationships between inorganic nutrient concentrations and diversity of dinoflagellate cysts (including richness, dominance, evenness and SAD) are negative over a wide range of nutrient concentrations (Table 1 and Figures 1, 2). This is consistent with the most previous empirical studies, which further supports that low diversity indices could be considered as a signal of eutrophication (Tsirtsis and Karydis, 1998; Wang et al., 2004; Rodrigues et al., 2019; Keskes et al., 2020). Different from previous studies of dinoflagellate cysts, this study finds a new pattern of the N-Dc relationship that diversity of cysts with decreasing nutrient concentrations appear to gradually approach the maximum 1: 1/2: 1/3…. This is a general SAD presented by fractal model that is supported by many taxa (Su, 2018). Thus, if this new pattern can be verified by more investigations, maintaining diversity at nearly this maximum value can be one of the goals of coastal management. Additionally, analyzing the N-Dc relationship according to their intrinsic mechanism is expected to help quantitative identification of the quality of the coastal environment and even understand the general mechanisms determining diversity.
Data availability statement
The datasets presented in this study can be found in online repositories. The names of the repository/repositories and accession number(s) can be found in the article/Supplementary Material. The code supporting the results in the paper have been archived in Figshare (https://doi.org/10.6084/m9.figshare.21437694.v2).
Author contributions
QS conceived, designed this study. JG developed the mathematical models and performed statistical analyses. JG and QS wrote the manuscript. All authors contributed to the article and approved the submitted version.
Funding
This work was supported by the National Natural Science Foundation of China (Grant Nos. 42071137 and 41676113). The funders had no role in study design, data collection and analysis, decision to publish, or preparation of the manuscript.
Conflict of interest
The authors declare that the research was conducted in the absence of any commercial or financial relationships that could be construed as a potential conflict of interest.
Publisher’s note
All claims expressed in this article are solely those of the authors and do not necessarily represent those of their affiliated organizations, or those of the publisher, the editors and the reviewers. Any product that may be evaluated in this article, or claim that may be made by its manufacturer, is not guaranteed or endorsed by the publisher.
Supplementary material
The Supplementary Material for this article can be found online at: https://www.frontiersin.org/articles/10.3389/fmars.2022.1089331/full#supplementary-material
References
Adjou M., Bendtsen J., Richardson K. (2012). Modeling the influence from ocean transport, mixing and grazing on phytoplankton diversity. Ecol. Model. 225, 19–27. doi: 10.1016/j.ecolmodel.2011.11.005
Arellano G., Umaña M. N., Macía M. J., Loza M. I., Fuentes A., Cala V., et al. (2017). The role of niche overlap, environmental heterogeneity, landscape roughness and productivity in shaping species abundance distributions along the Amazon–Andes gradient. Global Ecol. Biogeogr 26 (2), 191–202. doi: 10.1111/geb.12531
Baula I. U., Azanza R. V., Fukuyo Y., Siringan F. P. (2011). Dinoflagellate cyst composition, abundance and horizontal distribution in bolinao, pangasinan, northern Philippines. Harmful Algae 11, 33–44. doi: 10.1016/j.hal.2011.07.002
Bedford B. L., Walbridge M. R., Aldous A. (1999). Patterns in nutrient availability and plant diversity of temperate north American wetlands. Ecology 80 (7), 2151–2169. doi: 10.1890/0012-9658(1999)080[2151:PINAAP]2.0.CO;2
Blanco S., Cejudo-Figueiras C., Tudesque L., Bécares E., Hoffmann L., Ector L. (2012). Are diatom diversity indices reliable monitoring metrics? Hydrobiologia 695 (1), 199–206. doi: 10.1007/s10750-012-1113-1
Borer E. T., Seabloom E. W., Gruner D. S., Harpole W. S., Hillebrand H., Lind E. M., et al. (2014). Herbivores and nutrients control grassland plant diversity via light limitation. Nature 508 (7497), 517–520. doi: 10.1038/nature13144
Bouimetarhan I., Marret F., Dupont L., Zonneveld K. (2009). Dinoflagellate cyst distribution in marine surface sediments off West Africa (17–6 n) in relation to sea-surface conditions, freshwater input and seasonal coastal upwelling. Mar. Micropaleontol 71 (3-4), 113–130. doi: 10.1016/j.marmicro.2009.02.001
Brown J. H. (2014). Why are there so many species in the tropics? J. biogeogr 41 (1), 8–22. doi: 10.1111/jbi.12228
Chen B., Irwin A. J., Finkel Z. V. (2011). Biogeographic distribution of diversity and size-structure of organic-walled dinoflagellate cysts. Mar. Ecol. Prog. Ser. 425, 35–45. doi: 10.3354/meps08985
Cleland E. E., Harpole W. S. (2010). Nitrogen enrichment and plant communities. Ann. New York Acad. Sci. 1195 (1), 46–61. doi: 10.1111/j.1749-6632.2010.05458.x
Currie D. J., Fritz J. T. (1993). Global patterns of animal abundance and species energy use. Oikos 67, 56–68. doi: 10.2307/3545095
Currie D., Mittelbach G., Cornell H., Field R., Guégan J.-F., Hawkins B., et al. (2004). Predictions and tests of climate-based hypotheses broad-scale variation in taxonomic richness. Ecol. Lett. 7, 1121–1134. doi: 10.1111/j.1461-0248.2004.00671.x
Dale B. (2009). Eutrophication signals in the sedimentary record of dinoflagellate cysts in coastal waters. J. Sea Res. 61 (1-2), 103–113. doi: 10.1016/j.seares.2008.06.007
Danilov R. A., Ekelund N. G. A. (2001). Comparative studies on the usefulness of seven ecological indices for the marine coastal monitoring close to the shore on the Swedish East coast. Environ. Monit. Assess. 66 (3), 265–279. doi: 10.1023/A:1006364317956
Ellegaard M., Dale B., Mertens K. N., Pospelova V., Ribeiro S. (2017). “Dinoflagellate cysts as proxies for Holocene environmental change in estuaries: Diversity, abundance and morphology,” in Applications of paleoenvironmental techniques in estuarine studies. Eds. Weckström K., Saunders K. M., Gell P. A., Skilbeck C. G. (Dordrecht: Springer Netherlands), 295–312.
Elser J. J., Bracken M. E. S., Cleland E. E., Gruner D. S., Harpole W. S., Hillebrand H., et al. (2007). Global analysis of nitrogen and phosphorus limitation of primary producers in freshwater, marine and terrestrial ecosystems. Ecol. Lett. 10 (12), 1135–1142. doi: 10.1111/j.1461-0248.2007.01113.x
Elser J. J., Kyle M., Steger L., Nydick K. R., Baron J. S. (2009). Nutrient availability and phytoplankton nutrient limitation across a gradient of atmospheric nitrogen deposition. Ecology 90 (11), 3062–3073. doi: 10.1890/08-1742.1
Enquist B. J., Niklas K. J. (2001). Invariant scaling relations across tree-dominated communities. Nature 410 (6829), 655–660. doi: 10.1038/35070500
Esper O., Zonneveld K. A. (2007). The potential of organic-walled dinoflagellate cysts for the reconstruction of past sea-surface conditions in the southern ocean. Mar. Micropaleontol 65 (3-4), 185–212. doi: 10.1016/j.marmicro.2007.07.002
Feng G., Huang J., Xu Y., Li J., Zang R. (2021). Disentangling environmental effects on the tree species abundance distribution and richness in a subtropical forest. Front. Plant Sci. 12. doi: 10.3389/fpls.2021.622043
Gao J., Su Q. (2022). The relationship between diversity and nutrient concentrations. doi: 10.6084/m9.figshare.21437694.v2
Garmendia M., Borja Á., Franco J., Revilla M. (2013). Phytoplankton composition indicators for the assessment of eutrophication in marine waters: Present state and challenges within the European directives. Mar. pollut. Bull. 66 (1-2), 7–16. doi: 10.1016/j.marpolbul.2012.10.005
Gough L., Grace J. B., Taylor K. L. (1994). The relationship between species richness and community biomass: the importance of environmental variables. Oikos 70 (2), 271–279. doi: 10.2307/3545638
Gurdebeke P. R., Pospelova V., Mertens K. N., Dallimore A., Chana J., Louwye S. (2018). Diversity and distribution of dinoflagellate cysts in surface sediments from fjords of western Vancouver island (British Columbia, Canada). Mar. Micropaleontol 143, 12–29. doi: 10.1016/j.marmicro.2018.07.005
Irigoien X., Huisman J., Harris R. P. (2004). Global biodiversity patterns of marine phytoplankton and zooplankton. Nature 429 (6994), 863–867. doi: 10.1038/nature02593
Keskes F. A., Ayadi N., Atoui A., Mahfoudi M., Abdennadher M., Walha L. D., et al. (2020). Dinoflagellates encystment with emphasis on blooms in boughrara lagoon (South-Western mediterranean): Combined effects of trace metal concentration and environmental context. Estuarine Coast. Shelf Sci. 237, 106648. doi: 10.1016/j.ecss.2020.106648
Kitsiou D., Karydis M. (2011). Coastal marine eutrophication assessment: a review on data analysis. Environ. Int. 37 (4), 778–801. doi: 10.1016/j.envint.2011.02.004
Liu D., Shi Y., Di B., Sun Q., Wang Y., Dong Z., et al. (2012). The impact of different pollution sources on modern dinoflagellate cysts in sishili bay, yellow Sea, China. Mar. Micropaleontol 84, 1–13. doi: 10.1016/j.marmicro.2011.11.001
Marret F., Zonneveld K. A. (2003). Atlas of modern organic-walled dinoflagellate cyst distribution. Rev. Palaeobotany Palynology 125 (1-2), 1–200. doi: 10.1016/S0034-6667(02)00229-4
Morris J. T. (1991). Effects of nitrogen loading on wetland ecosystems with particular reference to atmospheric deposition (San Mateo, California: Annual Reviews).
Oksanen J., Blanchet F. G., Friendly M., Kindt R., Legendre P., McGlinn D., et al. (2020) Vegan: Community ecology package. r package version 2.5-6. 2019. Available at: https://scholar.google.com/scholar?cluster=11712188988930644900&hl=en&oi=scholarr.
Orlova T. Y., Morozova T. V., Gribble K. E., Kulis D. M., Anderson D. M. (2004). Dinoflagellate cysts in recent marine sediments from the east coast of Russia. Botanica Marina 47 (3), 184–201. doi: 10.1515/BOT.2004.019
Penaud A., Hardy W., Lambert C., Marret F., Masure E., Servais T., et al. (2018). Dinoflagellate fossils: Geological and biological applications. Rev. Micropaléontologie 61 (3-4), 235–254. doi: 10.1016/j.revmic.2018.09.003
Pospelova V., Chmura G. L., Boothman W. S., Latimer J. S. (2002). Dinoflagellate cyst records and human disturbance in two neighboring estuaries, new Bedford harbor and apponagansett bay, Massachusetts (USA). Sci. Total Environ. 298 (1-3), 81–102. doi: 10.1016/S0048-9697(02)00195-X
Pospelova V., Chmura G. L., Boothman W. S., Latimer J. S. (2005). Spatial distribution of modern dinoflagellate cysts in polluted estuarine sediments from buzzards bay (Massachusetts, USA) embayments. Mar. Ecol. Prog. Ser. 292, 23–40. doi: 10.3354/meps292023
Price A. M., Coffin M. R., Pospelova V., Latimer J. S., Chmura G. L. (2017). Effect of nutrient pollution on dinoflagellate cyst assemblages across estuaries of the NW Atlantic. Mar. Pollut. Bull. 121 (1-2), 339–351. doi: 10.1016/j.marpolbul.2017.06.024
Rodrigues R., Patil J., Anil A. (2022). Dinoflagellates cyst assemblage concerning trophic index for eutrophication from major ports along the west coast of India. Mar. Pollut. Bull. 176, 113423. doi: 10.1016/j.marpolbul.2022.113423
Rodrigues R., Patil J., Sathish K., Anil A. (2019). Dinoflagellate planktonic-motile-stage and benthic-cyst assemblages from a monsoon-influenced tropical harbour: Elucidating the role of environmental conditions. Estuarine Coast. Shelf Sci. 226, 106253. doi: 10.1016/j.ecss.2019.106253
Sangiorgi F., Donders T. H. (2004). Reconstructing 150 years of eutrophication in the north-western Adriatic Sea (Italy) using dinoflagellate cysts, pollen and spores. Estuarine Coast. Shelf Sci. 60 (1), 69–79. doi: 10.1016/j.ecss.2003.12.001
Shen P.-P., Li Y., Tang Y.-N., Song Q.-S., Xue Y. (2023). Sedimentary dinoflagellate cyst records of human-induced environmental changes in daya bay, the northern south China Sea. J. Mar. Syst. 237, 103823. doi: 10.1016/j.jmarsys.2022.103823
Soons M. B., Hefting M. M., Dorland E., Lamers L. P., Versteeg C., Bobbink R. (2017). Nitrogen effects on plant species richness in herbaceous communities are more widespread and stronger than those of phosphorus. Biol. Conserv. 212, 390–397. doi: 10.1016/j.biocon.2016.12.006
Spatharis S., Tsirtsis G. (2010). Ecological quality scales based on phytoplankton for the implementation of water framework directive in the Eastern Mediterranean. Ecol. Indic. 10 (4), 840–847. doi: 10.1016/j.ecolind.2010.01.005
Su Q. (2016). Analyzing fractal property of species abundance distribution and diversity indexes. J. Theor. Biol. 392, 107–112. doi: 10.1016/j.jtbi.2015.12.010
Su Q. (2018). A general pattern of the species abundance distribution. PeerJ 6, 1–11. doi: 10.7717/peerj.5928
Tsirtsis G., Karydis M. (1998). Evaluation of phytoplankton community indices for detecting eutrophic trends in the marine environment. Environ. Monit. Assess. 50 (3), 255–269. doi: 10.1023/A:1005883015373
Vásquez-Bedoya L., Radi T., Ruiz-Fernández A., De Vernal A., Machain-Castillo M., Kielt J., et al. (2008). Organic-walled dinoflagellate cysts and benthic foraminifera in coastal sediments of the last century from the gulf of tehuantepec, south pacific coast of Mexico. Mar. Micropaleontol 68 (1-2), 49–65. doi: 10.1016/j.marmicro.2008.03.002
Villa P. M., Martins S. V., Rodrigues A. C., Safar N. V. H., Bonilla M. A. C., Ali A. (2019). Testing species abundance distribution models in tropical forest successions: implications for fine-scale passive restoration. Ecol. Eng. 135, 28–35. doi: 10.1016/j.ecoleng.2019.05.015
Vitousek P. M. (1994). Beyond global warming: ecology and global change. Ecology 75 (7), 1861–1876. doi: 10.2307/1941591
Wang Z., Matsuoka K., Qi Y., Chen J., Lu S. (2004). Dinoflagellate cyst records in recent sediments from daya bay, south China Sea. Phycol Res. 52 (4), 396–407. doi: 10.1111/j.1440-183.2004.00357.x
West G. B., Brown J. H., Enquist B. J. (1997). A general model for the origin of allometric scaling laws in biology. Science 276 (5309), 122–126. doi: 10.1126/science.276.5309.122
Keywords: dinoflagellate cysts, inorganic nutrients, coastal ecosystem, species abundance distribution, fractal model, Zipf’s law
Citation: Gao J and Su Q (2023) The relationship between inorganic nutrients and diversity of dinoflagellate cysts: An evaluation from the perspective of species abundance distribution. Front. Mar. Sci. 9:1089331. doi: 10.3389/fmars.2022.1089331
Received: 04 November 2022; Accepted: 15 December 2022;
Published: 12 January 2023.
Edited by:
Qiuying Han, Hainan Tropical Ocean University, ChinaReviewed by:
Peng Zhang, Guangdong Ocean University, ChinaZhenming Lv, Zhejiang Ocean University, China
Copyright © 2023 Gao and Su. This is an open-access article distributed under the terms of the Creative Commons Attribution License (CC BY). The use, distribution or reproduction in other forums is permitted, provided the original author(s) and the copyright owner(s) are credited and that the original publication in this journal is cited, in accordance with accepted academic practice. No use, distribution or reproduction is permitted which does not comply with these terms.
*Correspondence: Qiang Su, c3FpYW5nQHVjYXMuYWMuY24=