Abstract
The compositions of hydrothermal fluids in back-arc basins (BABs) can be affected by the influx of magmatic fluids into systems that are dominated by reactions between basement rocks and seawater-derived fluids. The East Scotia Ridge (ESR) in the Scotia Sea hosts such hydrothermal systems where the role of magmatic fluid influx has not yet been addressed. During expedition PS119 in 2019, three chimneys were sampled from the E2 segment. These samples were analysed for their chemical and isotopic composition along with fluid inclusions in corresponding precipitates. Our data provide evidence for the temporal evolution of hydrothermal fluids in this remote back-arc system. Salinity variations in anhydrite-hosted fluid inclusions indicate that phase separation takes place in the subseafloor. Moderate-temperature (<53°C) fluids from the newly discovered E2-West hydrothermal vent field and high-temperature (>320°C) fluids from the E2-South area were sampled. Depletions in fluid-mobile elements, ΣREE and low δ18OH2O show that the basement in this root zone has been leached since the previous sampling in 2010. The results indicate that high-temperature fluid-rock interactions are key in setting the composition of the fluids with cation-to-chloride ratios suggesting a common root zone for both vent sites. The concentrations of dissolved gases provide new insights in the connection between magmatic degassing and its influence on endmember vent fluid composition. Specifically, stable isotope (O, H) data and elevated CO2 concentrations point to a minor influx of magmatic vapour. Stable sulphur isotopes provide no evidence for SO2 disproportionation suggesting a H2O-CO2 dominated nature of these vapours. The concentrations of conservative elements in the E2-W fluid reflects subseafloor mixing between E2-S endmember fluid and seawater. In contrast, non-conservative behaviour, and depletion of Fe, H2, and H2S point to a combination of sub-surface abiotic and biotic reactions affecting these fluids. Similarly, E2-W fluids show evidence for H2S and CH4 being metabolized in the subseafloor. Thermodynamic computations confirm that the E2 system is dominated by sulphide oxidation as a major catabolic pathway. Our results indicate that the conditions at E2 are favourable to hosting a robust subseafloor biosphere.
Introduction
Back-arc basin (BAB) hydrothermal systems emit fluids with compositions that can be distinct from their mid-oceanic ridge (MOR) counterparts. Besides being affected by fluid-rock interactions and phase separation, they are often influenced by the addition of gases and volatile elements from magmatic fluid influx (e.g., De Ronde and Jambor, 1995; Ishibashi and Urabe, 1995; Yang and Scott, 2006; Reeves et al., 2011; Seewald et al., 2015; Seewald et al., 2019). Magma degassing typically adds H2O and CO2 to the circulating seawater-derived fluids (e.g., Lupton et al., 2006; Reeves et al., 2011), but may also deliver acid-sulphate components such as SO2, HCl and HF (Butterfield et al., 2011; Seewald et al., 2015; Seewald et al., 2019). This addition of magmatic components can influence fluid-rock interactions and also have an effect on dissolved metal concentrations (Reeves et al., 2011; Seewald et al., 2015; Seewald et al., 2019).
The majority of BAB hydrothermal systems are situated in the western Pacific, e.g., Manus Basin, Okinawa Trough, Lau Basin (Takai et al., 2008; Mottl et al., 2011; Reeves et al., 2011; Seewald et al., 2015; Seewald et al., 2019). The East Scotia Ridge (ESR) in the Southern Ocean is the only known BAB to host active hydrothermal systems outside the Pacific (Diehl and Bach, 2020b; Diehl and Bach, 2021). Located in an area where the Atlantic, Pacific and Indian oceans merge, hydrothermal vent sites of the ESR may be important biogeographic stepping stones for vent fauna (Rogers et al., 2012; Herrera et al., 2015). Like in other hydrothermal areas in the deep sea, the foundation of life around the ESR vents are chemosynthetic microorganisms that metabolize reduced gases and metals dissolved in the vent fluids (Rogers et al., 2012; Linse et al., 2019). Establishing the most important catabolic energy sources brought into these ecosystems by hydrothermal venting is hence vital. Existing vent fluid data for the E2-segment of the ESR system (James et al., 2014) shows that the composition of the fluids venting in 2010 were affected by fluid-rock interactions, phase separation and conductive cooling prior to venting at the seafloor, but the contents of dissolved gases (CO2, H2 and CH4) were not determined in previous studies (Cole et al., 2014; James et al., 2014).
During the RV Polarstern expedition PS119 (Bohrmann, 2019) a total of three chimneys were sampled from the known E2-South (E2-S) vent site (James et al., 2014) and a newly discovered vent site (E2-West) to the northwest. The use of gas-tight fluid samplers facilitated measuring the contents of dissolved gases, which is critical for constraining magmatic degassing (e.g., Reeves et al., 2011), and in situ pH, vital for examining fluid-rock reactions (e.g., McDermott et al., 2018). Dissolved gases are also a key source of energy for catabolic reactions that control chemolithoautotrophic biomass production in these ecosystems (e.g., McCollom and Shock, 1997; Amend et al., 2011; Dahle et al., 2015; Dahle et al., 2018).
The goal of this study is to provide constraints on gas concentrations, as they hold clues about magma-hydrothermal interactions and are important for the bioenergetic landscape of the vent system. Also, the first re-sampling of the vents at E2-S since 2010 (Cole et al., 2014; James et al., 2014), allowed us to determine if vent fluid composition had changed between then and 2019.
Geological Setting
The East Scotia Ridge (ESR) is a back-arc spreading centre hosted in the Scotia Sea at the northernmost edge of the Southern Ocean (Figure 1). The spreading activity is a result of the subduction of the South American plate under the Sandwich plate (German et al., 2000). The ESR is spreading at a rate of 62-70 mm/yr and separates the Scotia plate from the Sandwich plate (Livermore et al., 1997; Larter et al., 2003). The spreading centre can be broadly divided into sub segments E1 to E9 from north to south, respectively (Livermore et al., 1997). The central part of the ESR has a distinct axial valley graben, and features rocks with a composition similar to mid-oceanic ridge basalts (MORBs, Fretzdorff et al., 2002; Leat et al., 2004). The northern and southern parts of the ESR have axial volcanic ridges (AVRs), that likely reflect a higher magma budget and may relate to mantle inflow into the back-arc due to a roll-back induced corner flow of mantle material around the subducting slab (Livermore et al., 1997; Leat et al., 2000; Bruguier and Livermore, 2001). Seismic reflectors at the E2 segment show evidence for the presence of an axial magma chamber at ca. 3 km below seafloor (Livermore et al., 1997) and corroborate enhanced magma supply rates and high crustal heat flux. Indeed, hydrothermal activity was found at the E2 segment with hydrothermal vent sites hosted on one such axial volcanic ridge (German et al., 2000; James et al., 2014). The basement is primarily composed of basaltic andesite with increased Pb concentrations compared to MORBs, suggesting an influx of slab-derived components (Leat et al., 2000; Fretzdorff et al., 2002; Leat et al., 2004).
Figure 1
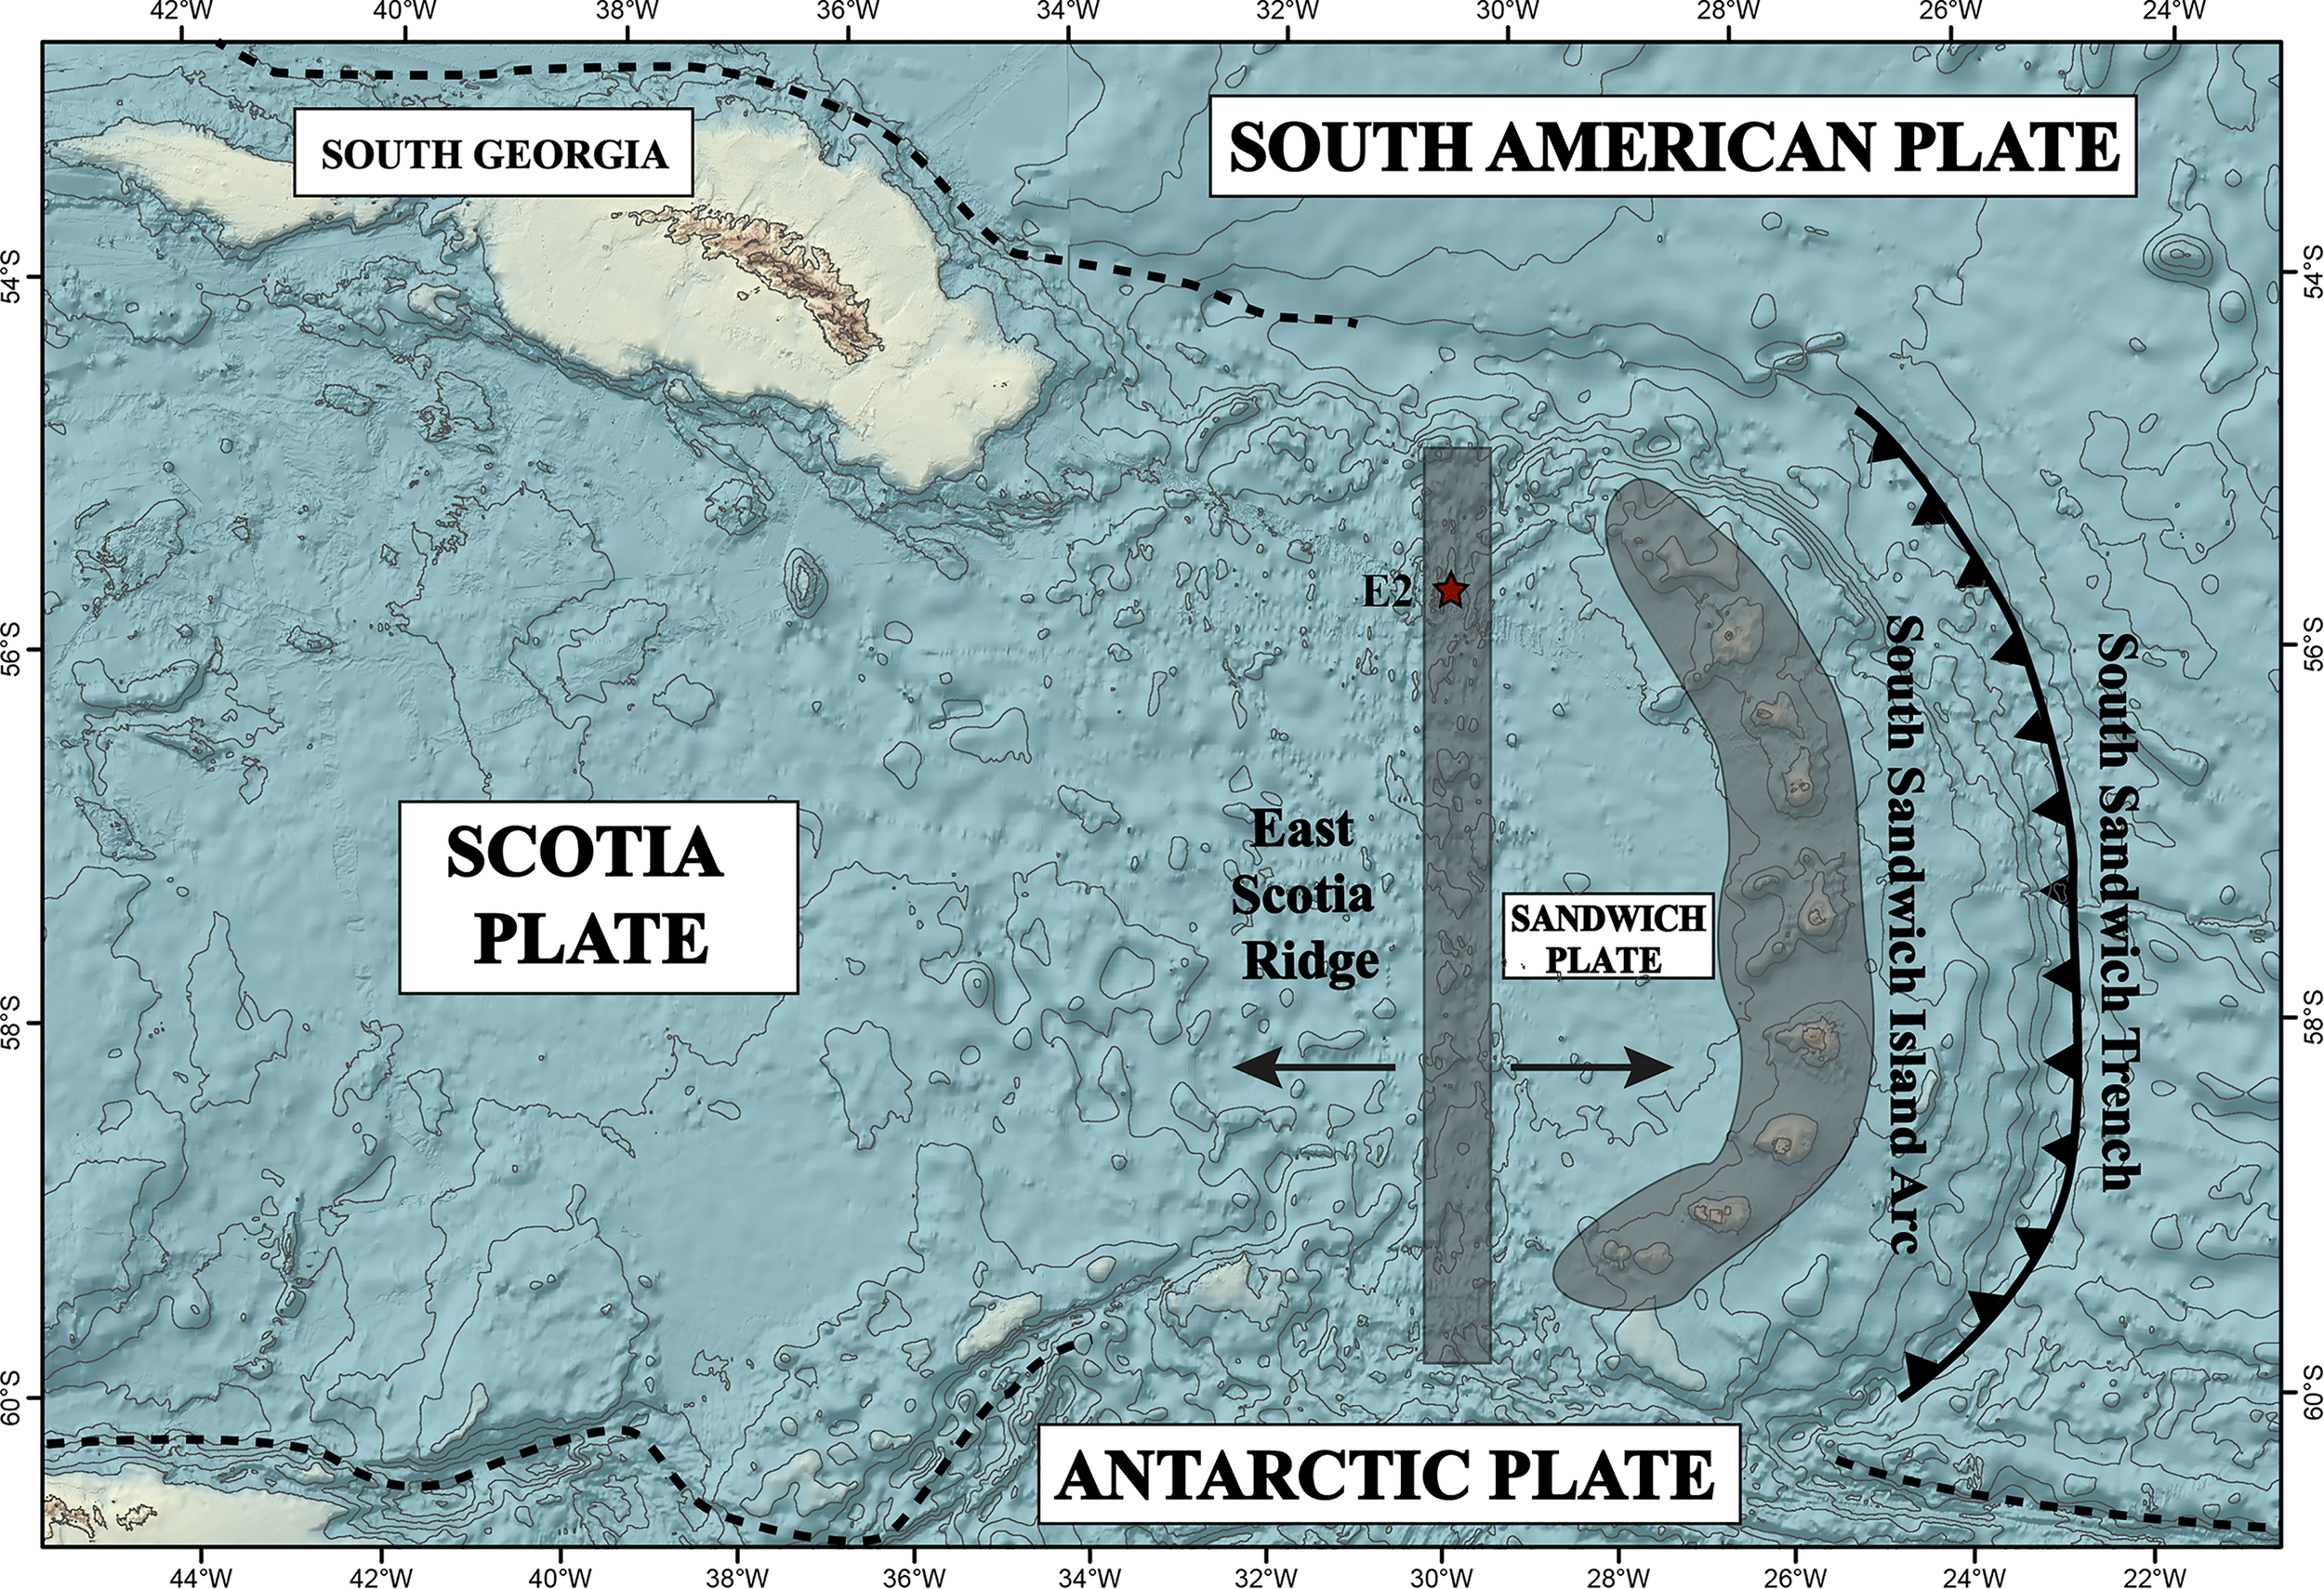
Regional map showing the East Scotia Ridge – back-arc basin (ESR), South Sandwich Island arc (SSIA), associated plate tectonics and the location of E2 hydrothermal vent field (red star) in the Scotia Sea. Adapted after Leat et al. (2016).
The E2-S hydrothermal vent field was discovered in 2009 (Rogers et al., 2012) and low (<20°C) and high (>310°C) temperature fluids were first sampled in 2010 (James et al., 2014). It is situated between 56°05.2’ to 56°05.4’S and 30°19.0’ to 30°19.35’W in 2600 m water depth between two N-S-striking AVRs exposing pillow lavas of basaltic andesite composition. Two vent sites were sampled in 2010: (1) Dog’s Head, a small cluster of ~12-m tall chimneys venting black-smoker type fluids with temperatures as high as 351°C, and (2) Sepia, which is 75 m southwest of Dog’s Head, and had fluids (up to 353°C) venting from a 11-m tall bulbous chimney with several flanges, underneath which hot (311°C) fluids pooled (James et al., 2014).
Materials and Methods
High and low-temperature hydrothermal fluid samples were collected during expedition PS119 with RV Polarstern in April-May 2019. We found hydrothermal activity to the northwest of the sites visited by James et al. (2014). We hence distinguish between E2-S vent area (which includes the Dog’s Head and Iced Bun sites) and E2-W (‘Alexander von Humboldt’ hydrothermal vent field) which is a newly discovered site (Figure 2).
Figure 2
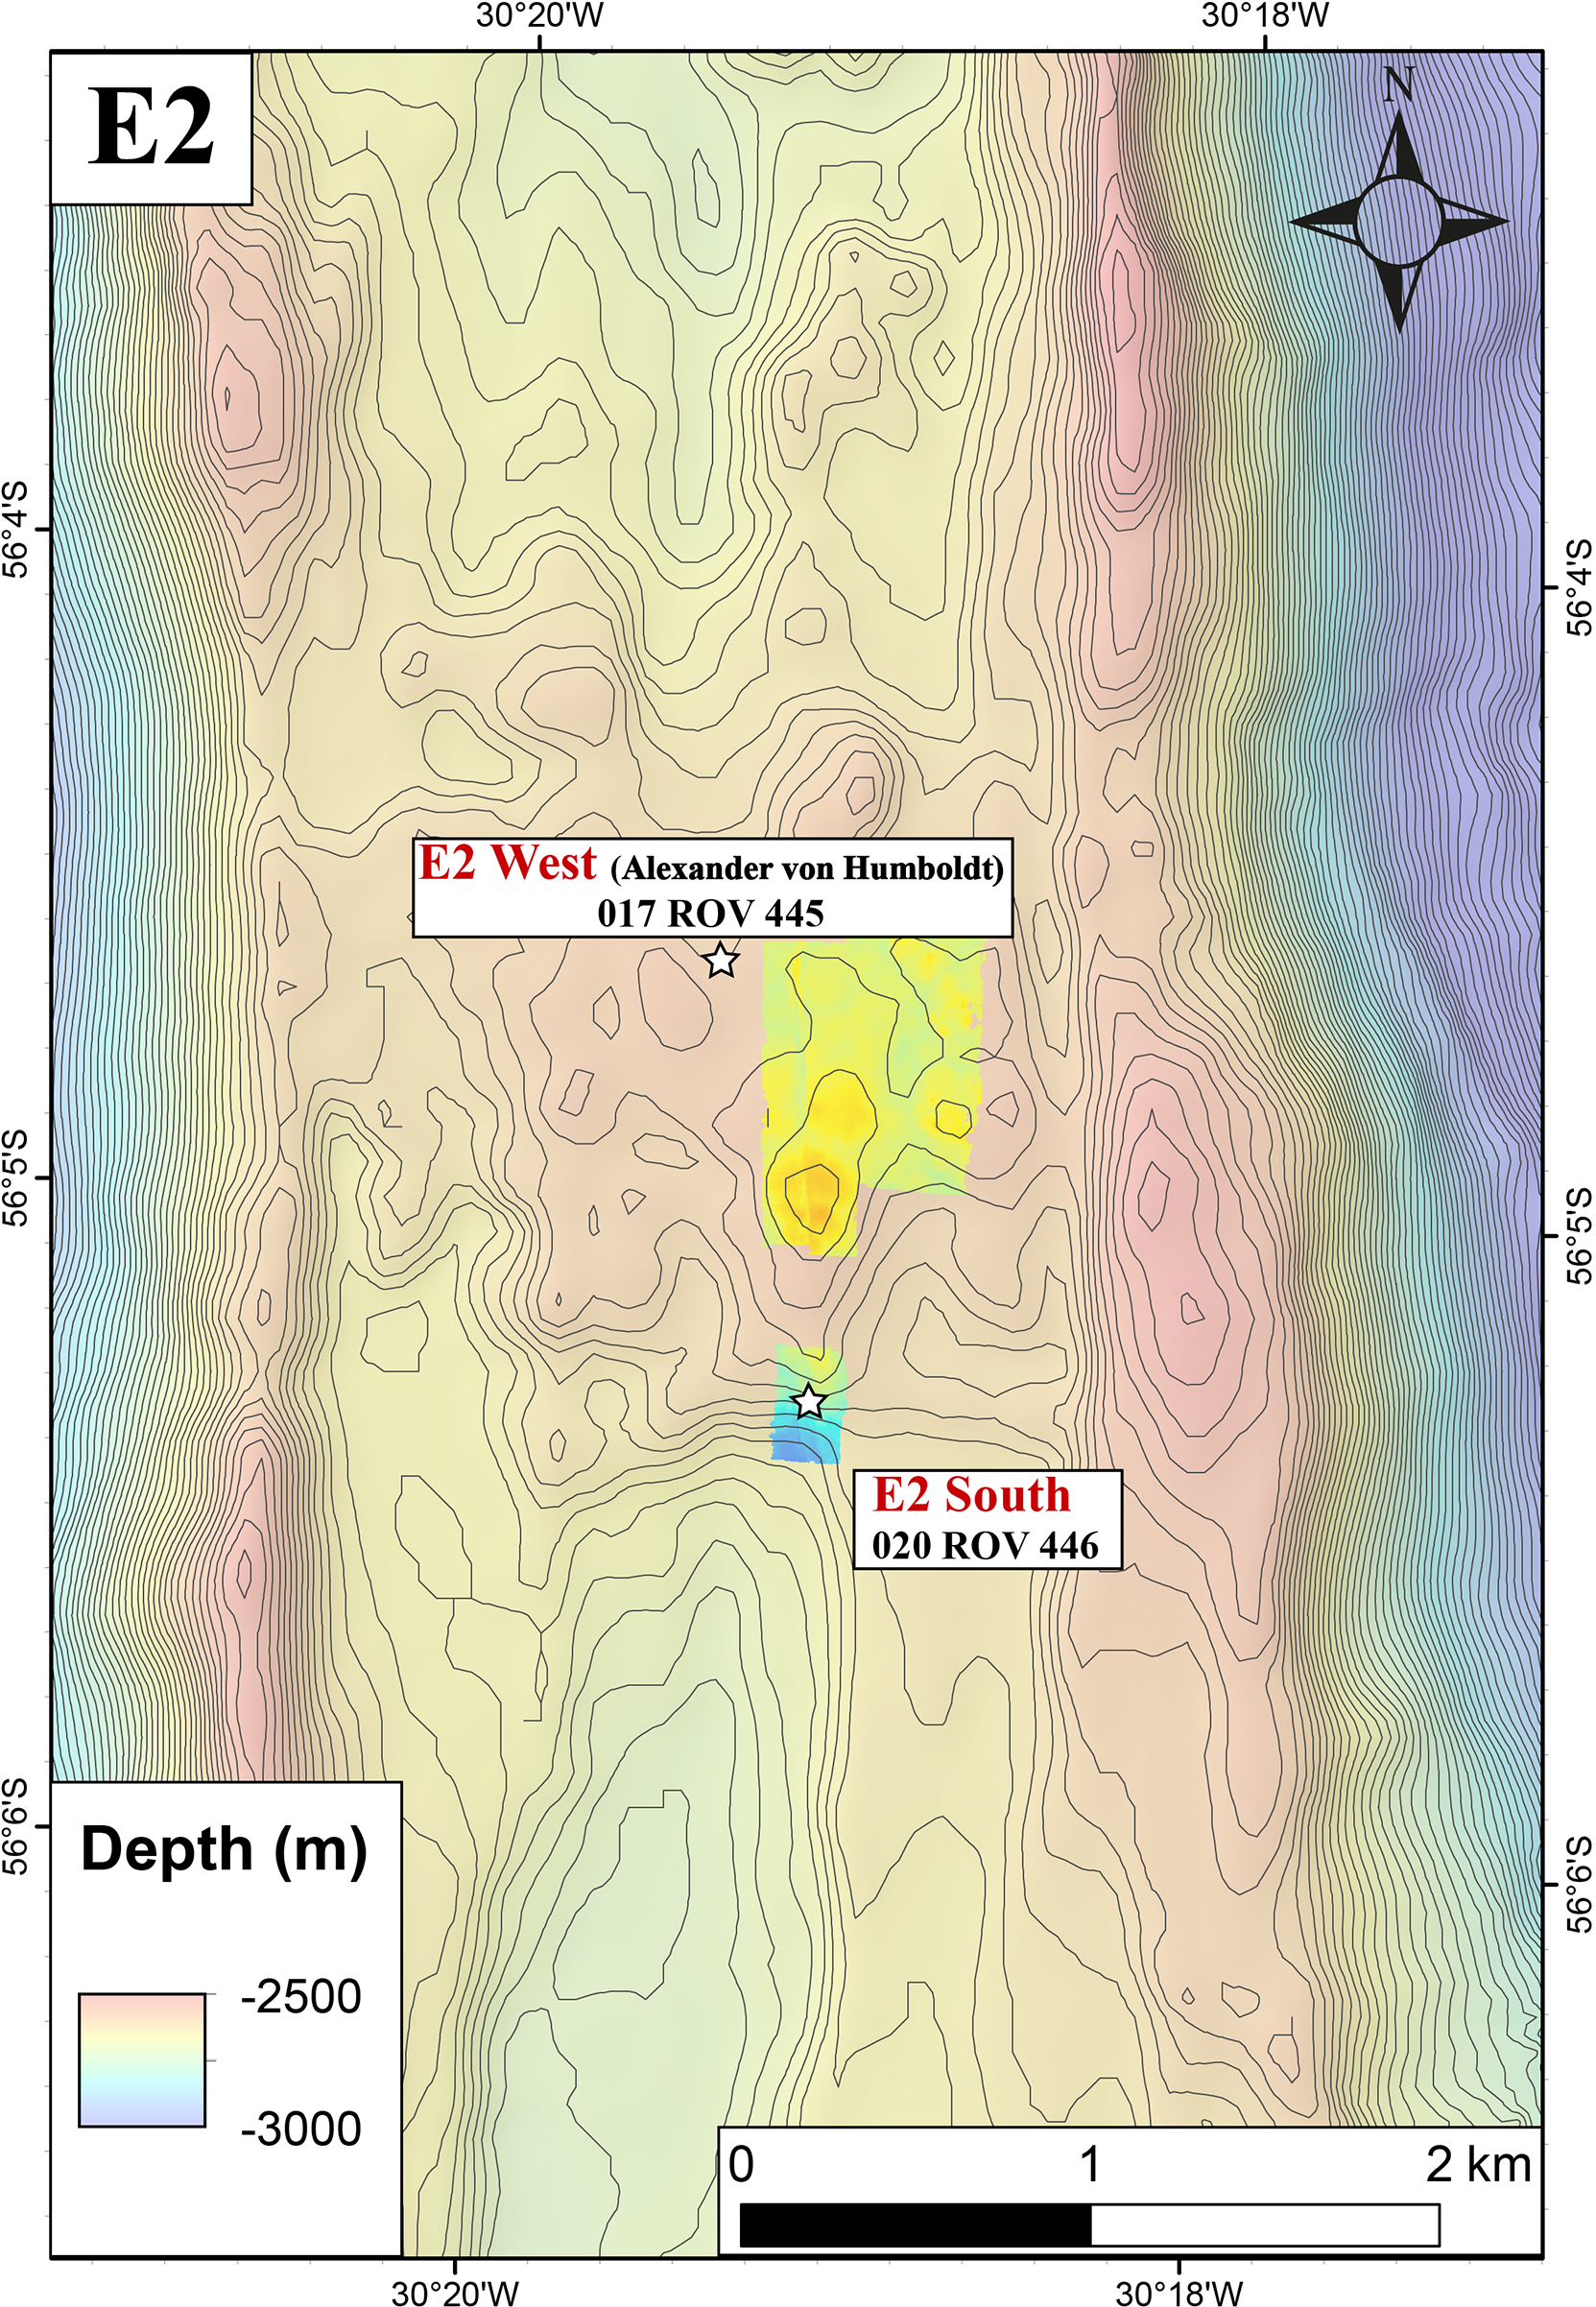
Ship based bathymetry of E2-Segment of the ESR along with the indicated two sites E2-West and E2-South.
The Iced Bun site had not been sampled previously and was actively venting black smoker-type fluid (Tmax = 320°C, Figure 3A). It is in the southern part of the E2-S vent area (56°05.30’S and 30°19.12’W) at a water depth of 2700 m, 20 m west of the Sepia sites and ca. 60 m southeast of the Dog’s Head site, both of which were sampled by James et al. (2014). Dog’s Head in the northern part of the E2-S vent area (56°05.28’S and 30°19.14’W) is a small cluster of chimneys with several orifices emitting black smoker-type fluid (Figure 3B). We recorded a maximum temperature (Tmax) of 344°C which was lower than the Tmax of 351°C measured in 2010 (James et al., 2014).
Figure 3
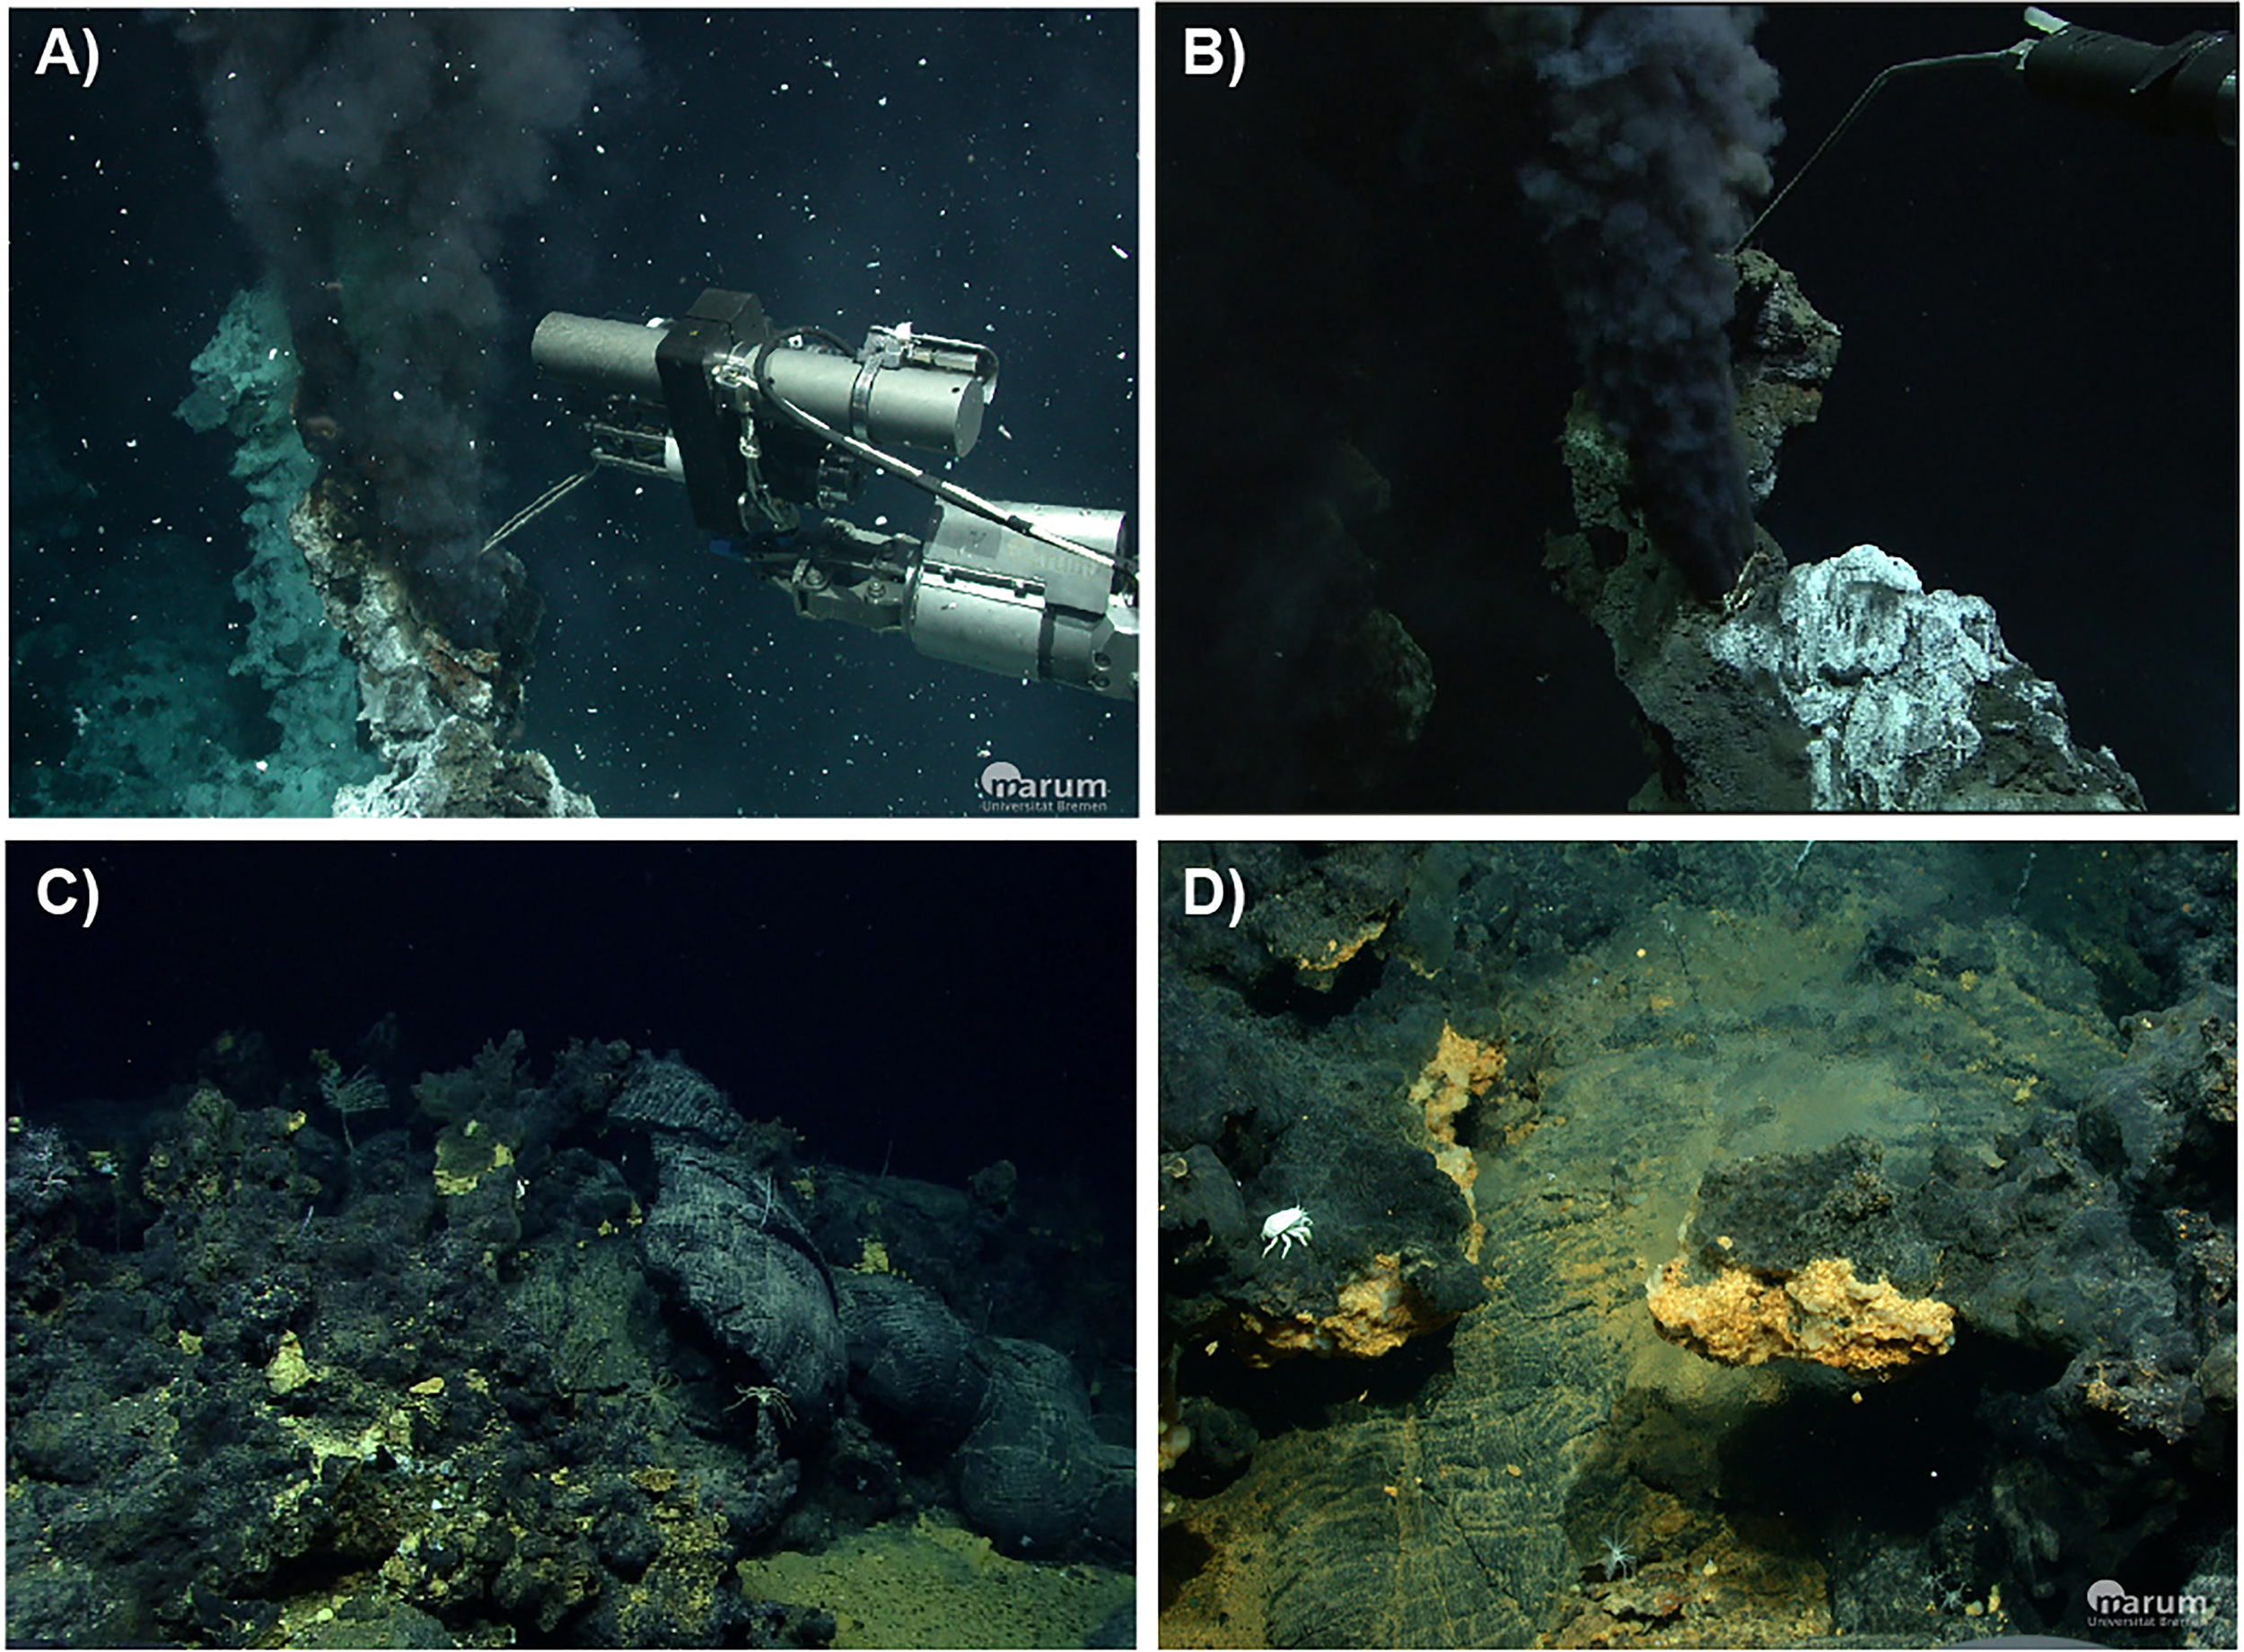
Images of hydrothermal orifices at E2: (A) Iced Bun chimney; (B) Dog’s Head Chimney; (C) Diffuse flows escaping from pillow basalts at E2-W (D) E2-W tube structure.
E2-W is situated between 56°04.57’ to 56°04.63’S and 30°19.42’ to 30°19.33’W (ca. 1.2 km north-northwest of the E2-S system) at a water depth of 2500 m and covers an area of ca. 1600 m2 (Figure 2). The entire area was venting diffuse fluids evident from shimmering water and distributions of Hoff crabs (Bohrmann, 2019). No venting of high temperature fluids was observed during the dives. In the sampled area, 30 – 50°C warm fluids were diffusely venting out of a prominent broken pillow tube structures (Figure 3C, Bohrmann, 2019). This structure was yellowish in colour and at places extensively covered by microbial mats (Figure 3D). A fluid sample at E2-W was collected after a flocculent mat and the pale-yellow precipitates surrounding the orifice were removed by the submersible arm.
Sample Collection and Preparation
Fluids were recovered using 150ml titanium isobaric gas tight (IGT) samplers (Seewald et al., 2002) operated with the Remotely Operated Vehicle (ROV) MARUM-Quest4000m. Two fluid samples were collected at the orifices of Dog’s Head and Iced Bun at the E2-S segment and one sample was recovered at the newly discovered site called ‘E2-West’ (Bohrmann, 2019, Table 1). The fluids were sampled after breaking off the tip of the chimney structure to allow for better flow of fluid. The temperature of the fluids collected with IGTs were monitored in real-time using a thermocouple attached to the IGT or with the ROV’s temperature sensor immediately after fluid sampling. After recovery of the ROV, the IGTs were processed onboard to obtain the fluid as soon as possible (within 12 hours of sampling). The samples were extracted from the IGTs using a HPLC pump and analysed for concentrations of dissolved gases (H2, CH4 and H2S) and pH(25°C).
Table 1
| Edifice | Sample | Tmax [°C](in situ) | pHMIN(25°C) | pH(in situ) | MgmM | NaMeasmM | NaCBmM | KmM | LiµM | RbµM | CsnM | CamM | SrµM | BaµM | BµM | ClmM | BrµM | ||
|---|---|---|---|---|---|---|---|---|---|---|---|---|---|---|---|---|---|---|---|
| LOQ | – | – | – | – | – | – | – | 7.2 | 0.003 | 1.94 | – | – | 0.04 | 9.25 | – | – | |||
| BSW | CTD10-01 | 0.5 | 7.7 | 7.9 | 51.6 | 460 | 463 | 10.0 | 25.1 | 1.26 | 2.0 | 9.56 | 82.6 | 0.29 | 399 | 540 | 820 | ||
| E2-West | |||||||||||||||||||
| Flange | 445-17ROV 03F | 53 | 6.7 | 6.6 | 42.6 | 446 | 468 | 13.4 | 78.4 | 6.8 | 63.5 | 13.2 | 85.0 | 1.26 | 410 | 543 | 823 | ||
| E2- South | |||||||||||||||||||
| Iced Bun | 446-20ROV 07F | 320 | 3.3 | 4.8 | 4.45 | 412 | 410 | 33.0 | 500 | 51.0 | 492 | 29.9 | 94.4 | 37.5 | 574 | 515 | 810 | ||
| Dog’s Head | 446-20ROV 10F | 344 | 3.2 | 5.3 | 10.5 | 402 | 407 | 28.9 | 383 | 42.1 | 373 | 23.3 | 80.5 | 13.7 | 480 | 501 | 767 | ||
| E2-Southa | |||||||||||||||||||
| Dog’s Heada | JC42-132-Y1-07 | 351 | 3.1 | nd | 1.05 | 434 | nd | 39.8 | 614 | nd | 609 | 30.8 | 106 | 23.6 | 548 | 528 | 837 | ||
| Sepiaa | JC42-135-Y2-04 | 353 | 3.1 | nd | 2.04 | 430 | nd | 38.1 | 603 | nd | 590 | 31.8 | 105 | 15.2 | 537 | 528 | 848 | ||
| Sepia Flangea | JC42-132-B1-02 | 313 | 2.9 | nd | 4.15 | 420 | nd | 35.8 | 557 | nd | 561 | 28.9 | 95.9 | 19.9 | 555 | 521 | 837 | ||
|
Edifice
|
Sample |
F
µM |
Si
mM |
SO4
mM |
Fe
µM |
Mn
µM |
Al
µM |
H2
µM |
H2S
mM |
δ34SH2S
‰ |
CH4
µM |
δ13CCH4
‰ |
δ2HCH4
‰ |
CO2
mm |
δ13CCO2
‰ |
δ18O
‰ |
δD
‰ |
||
| LOQ | – | – | – | 0.9 | – | 1.85 | – | 0.0002 | – | – | – | – | – | – | – | – | |||
| BSW | CTD10-01 | 72.5 | 0.104 | 28.0 | 0.0 | 0.0 | 0.0 | 0.0 | 0.0 | – | 0.0 | – | – | 2.3c | 0.3b | 0a | -0.1a | ||
| E2-West | |||||||||||||||||||
| Flange | 445-17ROV 03F | 61.2 | 2.12 | 25.4 | 12.1 | 61.8 | bdl | 0.66 | bdl | nd | 1.59 | bdl | bdl | 3.40 | -10.8 | -0.3 | -2.3 | ||
| E2- South | |||||||||||||||||||
| Iced Bun | 446-20ROV 07F | 47.5 | 15.0 | 2.56 | 570 | 1301 | 8.67 | 59.5 | 3.3 | 4.0 | 48.9 | -7.6 | -99.9 | 8.10 | -3.7 | 0.6 | -1.2 | ||
| Dog’s Head | 446-20ROV 10F | 59.4 | 14.1 | 6.12 | 856 | 1450 | 8.04 | 36.0 | 4.0 | 6.7 | 25.6 | -7.0 | -98.7 | 10.4 | -4.4 | 0.3 | -1.6 | ||
| E2-Southa | |||||||||||||||||||
| Dog’s Heada | JC42-132-Y1-07 | 42.8 | 17.2 | 3.7 | 1387 | 2075 | nd | nd | 6.9 | nd | nd | nd | nd | nd | nd | 1.2 | 1.8 | ||
| Sepiaa | JC42-135-Y2-04 | 38.8 | 21.2 | 1.9 | 1003 | 2034 | nd | nd | 6.8 | nd | nd | nd | nd | nd | nd | 0.9 | -0.2 | ||
| Sepia Flangea | JC42-132-B1-02 | 40.2 | 4.06 | 3.6 | 748 | 2095 | nd | nd | 6.5 | nd | nd | nd | nd | nd | nd | 0.9 | -0.6 | ||
Measured concentrations and isotopic composition of aqueous species from the fluids recovered at E2-South and E2-West hydrothermal vent fields. Lowest Mg fluids sampled in 2010 were added for comparison.
mM, mmol/L fluid; μM, μmol/L fluid; nM, nmol/L fluid; mm, mmol/Kg fluid; nd, not determined; bdl, below detection limits; LOQ, Limit of quantification; TMAX, maximum temperature measured; BSW, Bottom seawater; NaMeas, Na measured; NaCB, Na charge balanced (see text).
pHMIN = lowest pH measured at 25°C; pH (in situ) = pH at measured temperature and 250 bar.
a, Data from James et al. (2014); b, data from Craig (1970); c, data from Reeves et al. (2011).
Filtered (0.45 µm) fluid aliquots for major and trace elemental analysis were collected in acid-cleansed high density-polyethylene (HDPE) Nalgene™ bottles and acidified using 200 μL of concentrated sub-boiled HNO3. Filtered and unacidified aliquots were collected for anion analysis and for stable hydrogen (δDH2O) and oxygen (δ18OH2O) water isotope analysis in sealed glass ampoules. To determine the total dissolved inorganic carbon (ΣCO2, abbreviated as CO2 hereafter), fluid aliquots were injected from gas-tight syringes into pre-weighed He-filled and subsequently evacuated glass serum vials to prevent atmospheric CO2 contamination. The serum vials were stored upside down to seal the septa and prevent diffuse gas loss. For determination of δ13C and δD in CH4 and δ13CCO2, 12-15 ml of gas at standard pressure (STP) were injected into 20 ml glass serum vials containing concentrated NaCl solution. Atmospheric contact of the sample gas was prevented.
Analytical Methods: Fluid Chemistry
Concentrations of H2 and CH4 were determined onboard using a 7820A Agilent gas chromatograph (GC). A syringe headspace extraction was done first and the H2 and CH4 in the headspace gas was measured using different detectors (Reeves et al., 2011). H2 was quantified using a thermal conductivity detector (TCD), while CH4 was determined using a flame ionization detector (FID). The GC was equipped with a Molsieve 60/80 column (Sigma-Aldrich, St Louis, MO) and was operated with N2 as a carrier gas at 90°C. The analytical uncertainties (2s) are considered as ±5% for H2 and CH4. pH (at 25°C and 1 atm) was measured potentiometrically using a ‘seven2go’ pH electrode (Mettler Toledo, USA) instantly after the fluid was removed from the gas-tight syringe to minimize the effect of degassing. The electrode was calibrated daily using a 4-point calibration with reference solutions of pH 2, 4, 7 and 11. The uncertainty for pH values can be considered within ±0.1 unit.
Concentrations of major and minor elements were determined using inductively coupled plasma optical emission spectroscopy (ICP-OES, Varian Vista Pro, radial plasma observation) and ion chromatography (IC, Metrohm CompactIC) with a ‘METROSEP A Supp 5-150/4.0’ column at MARUM, University of Bremen. Trace elements including rare earth elements (REEs), were determined using inductively coupled plasma mass spectroscopy (ICP-MS, Perkin Elmer NexION) at Jacobs University, Bremen. The REEs were determined following a matrix separation and a pre-enrichment method (Schmidt et al., 2010). An ion-exchange column (Sep-Pak C18 cartridge™) was used for the matrix separation. The accuracy of major and minor elements was monitored using IAPSO standard seawater (supplied by Ocean Scientific International Ltd., UK). The quality of the trace element concentration measurements was monitored using the certified reference material NASS-7 (seawater) from the National Research Council of Canada. The analytical uncertainties (2s) are ±2% for dissolved Na, Si, Mg, Cl, Br and SO4, ±5% for dissolved Ca, F, Li, Sr, Ba, Al, Fe, Mn and K, ±8% for dissolved B, Rb, Cs and <±10% for REEs.
Total dissolved sulphide (ΣH2S, hereafter abbreviated as H2S) was determined gravimetrically at the Faculty of Geosciences, University of Bremen, following shipboard precipitation as Ag2S in a 5 wt.% AgNO3 solution (prepared on a daily basis) in a method adapted from Seewald et al. (2015). The estimated working range for the gravimetric method is >1mM. Low H2S concentrations (0.2μM to 1mM) were determined photometrically using the methylene blue method by Cline (1969). CO2 concentrations were determined onshore after the fluid samples were acidified with 25 wt.% phosphoric acid into the aliquots directing the headspace gas directly into the GC (Thermo Scientific Trace GC Ultra), which was equipped with a Haysep 80/100 column (Sigma-Aldrich, St Louis, MO) and was operated with He as a carrier gas at 50°C. This method was adapted after Reeves et al. (2011). The analytical uncertainties (2s) are considered as ±10% for CO2 and ±15% for H2S relative to measured values.
Stable oxygen and hydrogen isotope compositions of vent fluid H2O were analysed using cavity ring-down spectrometry (CRDS, Picarro L-2130i) at MARUM. The measurement consisted of nine injections of 7 μL each and the result is an average of the last three injections out of nine. The isotope ratios were normalized to VSMOW seawater material. For water isotopes the analytical uncertainties are ∼0.09‰ and ∼0.25‰ for δ18OH2O and δDH2O, respectively.
Stable carbon and hydrogen isotope ratios (13C/12C and 2H/1H) of CH4 and CO2 were determined using GC‐isotope ratio mass spectrometry (GC-IRMS) at MARUM as detailed in Pape et al. (2020a). CH4 and CO2 were separated by gas chromatography. Subsequently, CH4 was either combusted (1,030°C) or pyrolyzed (1,440°C) to generate CO2 or H2, respectively. CO2 or H2 were then transferred to the IRMS for analysis of 13C/12C or 2H/1H. All gas samples were injected at room temperature by manual syringe injection. Reported isotope ratios are arithmetic means of at least triplicate measurements and are given in the δ-notation relative to Vienna Pee Dee Belemnite (VPDB) and Vienna Standard Mean Ocean Water (VSMOW; for carbon and hydrogen, respectively). Reproducibility was proved using commercial CH4 and CO2 standards (Isometric Instruments, Canada; Air Liquide GmbH, Germany). Standard deviations of triplicate stable isotope measurements were <0.5‰ (δ13CCH4). Because CH4 concentrations were below the calibrated range of the GC-IRMS at the MARUM, samples were re-analysed for δ13CCH4 by GC–IRMS at GEO‐data Gesellschaft für Logging‐Service mbH, Germany (see Pape et al., 2020b).
Sulphur isotopes (δ34SH2S) were measured using an EA-IRMS (elemental analyser isotope ratio mass spectrometry) using a Flash EA isolink interfaced to a ThermoFisher Scientific Data V Advantage mass spectrometer. Analysis was conducted at the Institute of Geology and Palaeontology at the University of Münster. Results are reported in the δ-notation relative to Vienna Canon Diablo Troilite (VCDT). Reproducibility of the measurement was determined by replicate measurements and was better than ±0.3‰. Analytical performance was monitored using international reference materials IAEA S1, S2, S3 and NBS 127 as well as lab internal standards.
Analytical Methods: Fluid Inclusions
Microthermometry was carried out on anhydrite-hosted fluid inclusions from a chimney sample at the vent orifice of Dog’s Head. A Linkam heating/freezing stage in combination with a LNP2 flow regulator and a Zeiss Axioskop was used to observe phase transitions in two-phase liquid-vapour fluid inclusions. The temperature of the heating/freezing stage was calibrated using FLINC® synthetic fluid inclusions hosted in quartz. Phase transitions in the H2O system (freezing point: 0.0°C, critical temperature: 374.1°C) were used to calibrate the temperature sensor of the Linkam stage. The calibration procedure yielded temperatures of -0.1°C and 373.4°C for the freezing point and critical temperature, respectively. These values agree with the range of 15 long term control measurements of 0.04 ±0.07°C and 373.6 ±0.75 °C and show that the temperature sensor provided accurate and precise temperatures. Both accuracy and precision are within ±0.1°C at temperatures around the freezing point of pure H2O and are better than ±1°C in the high-temperature regime (>>100°C).
Calculation of Endmember Composition
Sampled hydrothermal vent fluids inadvertently contain a fraction of seawater that was entrained naturally in the subseafloor immediately prior to sampling or accidently during sampling, due to the dead volume of the inlet snorkel. This typically results in a two-component mixture of seawater and hydrothermal fluid. We have used the Mg concentrations in the vent fluid samples at E2-S and E2-W to calculate the chemical composition of hydrothermal endmember solution for all elements by extrapolating to zero Mg.
Endmember temperatures were calculated using isenthalpic-isobaric mixing, by considering a temperature and salinity-dependent heat capacity of the fluid. This dependence of salinity and temperature was calculated using the scheme by Driesner (2007), which calculates the thermodynamic data of H2O-NaCl fluids using thermodynamic data of pure water (Haar et al., 1985).
Salinities and Entrapment Temperatures (Te) in Fluid Inclusions
Fluid inclusions in hydrothermal precipitates can be used for tracing salinity and temperature in hydrothermal fluids. When crystals grow from hydrothermal solutions, they tend to incorporate microscopic volumes of the hydrothermal fluid, called fluid inclusions. The study of phase-transitions in these inclusions allows for the reconstruction of physio-chemical conditions in active and fossil hydrothermal systems (Peter and Scott, 1988; Xu, 2000; Baker and Lang, 2001; Bieseler et al., 2018; Diehl et al., 2020a). Measurements of ice-melting temperatures (Tm) and homogenization temperatures (Thom) in two-phased fluid inclusions enable the calculation of salinities and entrapment temperatures (Te) (Vityk et al., 1994). Both measurements represent the properties of the hydrothermal fluid during crystal growth if the inclusions have not changed in composition or volume since they were incorporated (Roedder, 1984; Bodnar, 2003) they provide key information on temperature and salinity of hydrothermal fluids during crystal growth. Fluid inclusions in anhydrite are known to re-equilibrate easily and may increase in volume (stretching) during the microthermometric measurement itself. We used the procedure proposed by Vanko and Bach (2005) to avoid inclusions being affected by stretching.
Using thermodynamic relationships in the H2O-NaCl system, salinities were calculated from ice-melting temperatures (Tm) while entrapment temperatures (Te) were calculated from the homogenization temperatures (Thom) and salinities using empirical relationships (Vityk et al., 1994; Atkinson, 2002). The uncertainties in the determination of these two parameters is based on the uncertainty of the temperature determination during the microthermometric work. The accuracy and precision are ±0.1°C and ±1°C for the freezing point and the homogenization temperature (Thom) determinations, respectively, and result in maximum uncertainties of <±0.2 wt.% NaCl eq. and <±2°C for entrapment temperatures (Te). The pressure correction for entrapment at seafloor conditions (250 bar) corresponds to a 15-17°C adjustment.
Thermodynamic Modelling
The use of IGTs facilitated the measurement of concentrations of gases dissolved in the fluids, and hence the reconstruction of in-situ pH and redox, which are key parameters controlling speciation of elements and solubility of minerals in the hydrothermal fluids prior to venting. The H2 and H2S concentration data were plotted in activity-activity plots, constructed using the R based software package CHNOSZ (Dick, 2019). We assumed unity activity coefficients for both gases.
Sub-surface processes in hydrothermal systems can be examined using thermodynamic reaction-path models. Reaction-path models were constructed using the Geochemists Workbench™ (GWB) software package and a tailor-made 400 bar database assembled by SUPCRT92 (Johnson et al., 1992). For these models, measured bottom seawater (BSW) was heated to hydrothermal temperatures while allowing minerals to precipitate. Using the REACT module of GWB, the heated fluid was then allowed to react with the host rock till the fluid became rock-buffered i.e., attained quartz saturation. Host rock data for samples taken in close vicinity to the vent sites (Sample ID: WX.30, 29, 28, 27, 2 & 1) were utilized from Leat et al. (2000). All major elements were considered for the reaction path models (except P). Ba, Cu and Zn concentrations were formally recalculated and added to the system as barite, chalcopyrite, and sphalerite.
Catabolic energy landscape computations were carried out as described in Amend et al. (2011). The REACT module of GWB was used along with a 250 bar database assembled using SUPCRT92 (Johnson et al., 1992) to simulate mixing of cold BSW with hot hydrothermal fluid represented by the Iced Bun site endmember composition. Minerals were not allowed to precipitate during mixing and redox reactions were also suppressed. Acid-base reactions were allowed to equilibrate. For this model 8 catabolic reactions were considered (Table 2). Five of the reactions represented aerobic respirations using different inorganic electron donors and three denoted anaerobic respiration.
Table 2
| Aerobic sulphide oxidation (ASO) | (1) |
| Aerobic methane oxidation (AMO) | CH4 + 2O2 → CO2 + 2H2O (2) |
| Aerobic iron oxidation (AFeO) | 4Fe2+ + O2 + 10H2O → 4Fe(OH)3 + 8H+ (3) |
| Aerobic manganese oxidation (AMnO) | 6Mn2+ + O2 + 10H2O → 6MnO2 + 20H+ (4) |
| Aerobic hydrogen oxidation (AHO) | 2H2 + O2 → 2H2O (5) |
| Hydrogenotrophic sulphate reduction | (6) |
| Hydrogenotrophic methanogenesis | 4H2 + CO2 → CH4 + 2H2O (7) |
| Anaerobic oxidation of methane (AOM) | CO2+H2S+2H2O (8) |
Inorganic redox reactions.
All compounds represent aqueous species. Fe(OH)3 represents ferrihydrite.
Values of Gibbs energy (ΔGr) for catabolic reactions were computed using the relation:
where ΔrGo denotes the standard Gibbs energy of reaction, R and T represent the gas constant and temperature in Kelvin, respectively, and Qr stands for the activity product of reaction r, which is evaluated with the relation.
where ai denotes the activity of species i raised to the stoichiometric reaction coefficient vi,r. The B-dot equation was used to calculate activity coefficients needed to convert species concentrations to activities. The Q-term accounts for the chemical composition of the mixed hydrothermal fluid, it also accounts for intracellular concentrations for building blocks of cells. Values of ΔrGo were calculated at 250 bar and the temperatures of interest with the computer code SUPCRT92 (Johnson et al., 1992), which relies on the relation of
where represents the apparent standard Gibbs energy of formation of the ith species in reaction r.
For catabolic reactions the amount of energy available was then calculated as a function of either temperature or mixing ratios. This was done by multiplying the calculated Gibbs energy for the reaction at each temperature with the concentrations of reactants (in the mixed fluid). The stoichiometry of the reaction and the reactant present in limiting supply were taken into account and then multiplied with the amount of mixed fluid at that specific temperature (McCollom, 2007; Amend et al., 2011).
Results
Temperature, pH, and Mg Contents
Focused venting of black smoker-type fluids at Dog’s Head and Iced Bun in the E2-S area took place at maximum temperatures of 344°C and 320°C, respectively (Table 1). The fluids have a measured pH (25°C, 1bar) of 3.3 at Iced Bun and 3.2 at Dog’s Head. Calculated pH (in-situ) values for these fluids were 4.8 for Iced Bun and 5.3 for Dog’s Head (Table 1). Isenthalpic-isobaric mixing models indicate endmember temperatures of 386°C and 342°C for Dog’s Head and Iced Bun, respectively (Supplementary Figure 1). These temperatures are accurate if all the Mg measured was contributed from entrainment of ambient seawater upon sampling.
The fluid at E2-W was characterized by a maximum measured temperature of 53°C (Table 1) and a relatively high Mg concentration (42.6 mM). An isenthalpic-isobaric mixing model indicates an endmember temperature of 273°C (Supplementary Figure 1). The fluid had a pH (25°C) of 6.7 and a pH (in-situ) of 6.6 (Table 1).
Dissolved Gases
The dissolved gases investigated in the fluids at E2-S (H2, H2S, CO2 and CH4) show variable concentrations and isotopic compositions (Table 1). The fluids at Dog’s Head and Iced Bun have endmember H2 concentration of 45.2 and 65.1 μM, respectively (Figure 4A). Endmember concentrations of CO2 are 8.65 and 12.5 mM, respectively. CH4 concentrations are 32.0 μM at Dog’s Head and 53.5 μM at Iced Bun (Figures 4B, C). The endmember fluids at E2-S have δ13CCO2 values of -4.1 and -5.6‰ (Table 3A) and δ13CCH4 values of -7.0 and -7.6‰. H2S concentrations in the endmember fluids are 3.3 and 4.0 mM (Figure 4D) and δ34SH2S values are between +4.0 and +6.7‰.
Figure 4
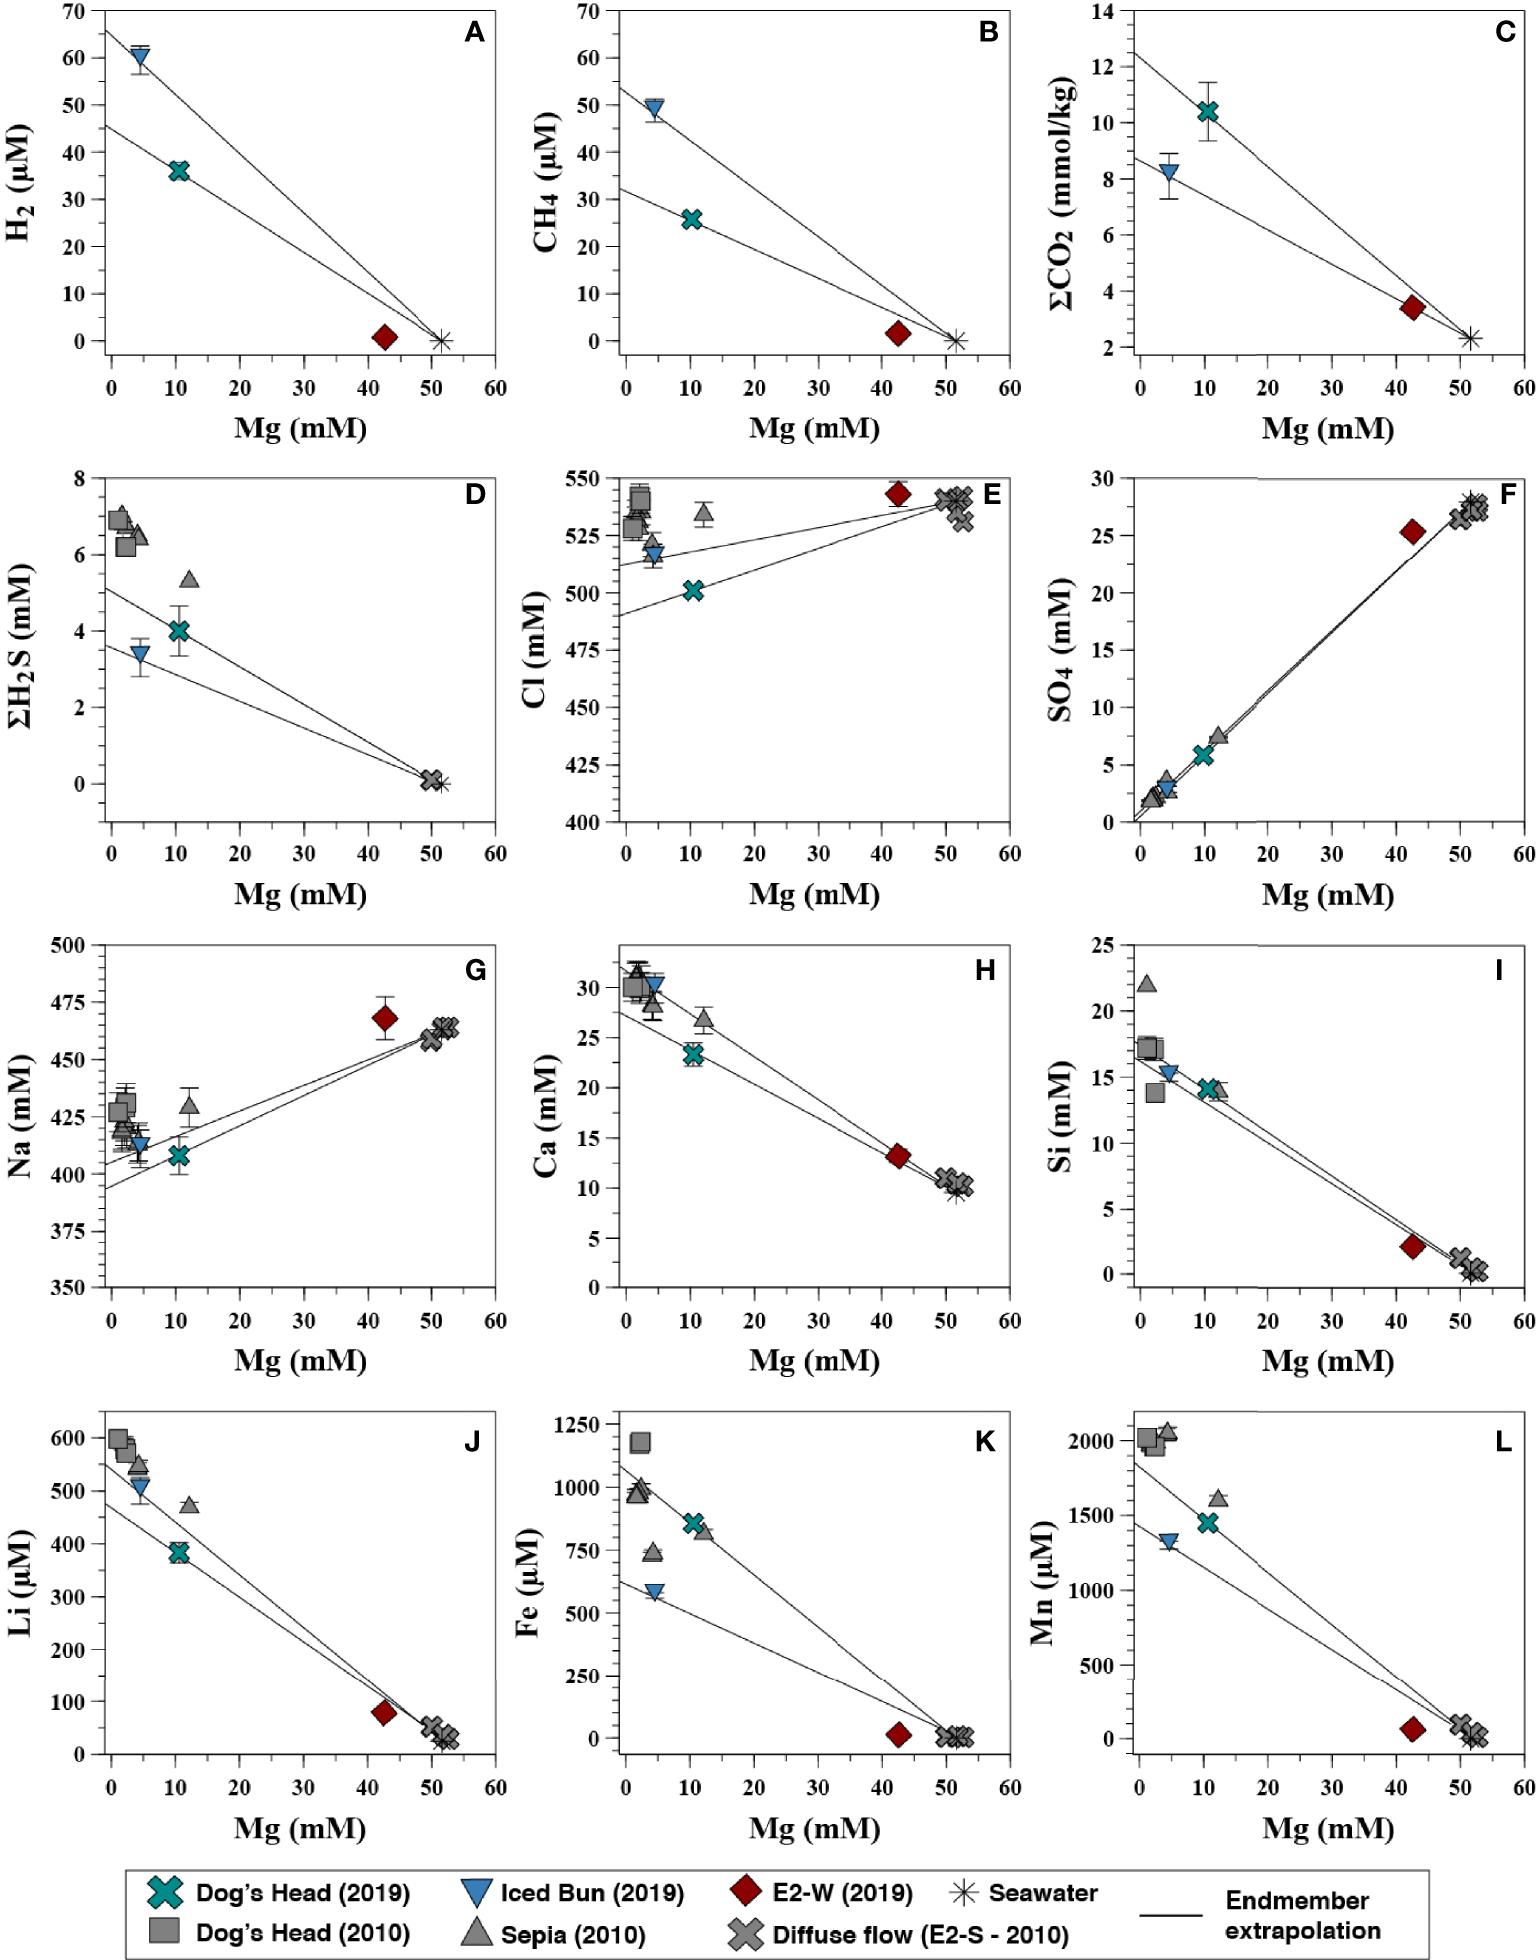
Concentrations of dissolved volatiles, major and minor elements in the fluids recovered from E2 in 2019 (coloured) v/s Mg concentrations of the hydrothermal fluids. Concentrations of fluids sampled in 2010 by James et al. (2014) (Grey) are shown for comparison. The solid lines indicate linear regression to endmember composition. The analytical error bars are shown or are smaller than the symbols. (A) H2 vs Mg, (B) CH4 vs Mg, (C) CO2 vs Mg, (D) H2S vs Mg, (E) Cl vs Mg, (F) SO4 vs Mg, (G) Na vs Mg, (H) Ca vs Mg, (I) Si vs Mg, (J) Li vs Mg, (K) Fe vs Mg, (L) Mn vs Mg.
Table 3A
| Edifice | Tmax [°C] | Tcalc(°C) | pHMIN(25°C) | NaMeasmM | NaCBmM | KmM | LiµM | RbµM | CsnM | CamM | SrµM | ClmM | BrµM | FµM | SimM | SO4mM | FeµM | MnµM | AlµM | H2µM | H2SmM | CH4µM | CO2mm | δ13CCO2 ‰ | δ18O‰ | δD‰ |
|---|---|---|---|---|---|---|---|---|---|---|---|---|---|---|---|---|---|---|---|---|---|---|---|---|---|---|
| BSW | 0.5 | – | 7.7 | 460 | 463 | 10.0 | 25.1 | 1.26 | 2.0 | 9.56 | 82.6 | 540 | 820 | 72.5 | 0 | 28 | 0 | 0 | 0 | 0 | 0 | 0 | 2.3c | 0.3b | 0.0a | -0.1a |
| E2-West | ||||||||||||||||||||||||||
| Flange | 53 | 273 | 6.7 | nd | nd | 29.3 | 328 | 32.5 | 351 | 30.2 | 96.1 | nd | nd | 8.36 | 11.5 | 13 | 69.0 | 351 | – | 3.75 | 0 | 9.03 | 8.55 | nd | -1.7 | -12.5 |
| E2- South | ||||||||||||||||||||||||||
| Iced Bun | 320 | 342 | 3.3 | 406 | 418 | 35.1 | 545 | 55.7 | 538 | 31.8 | 95.5 | 513 | 809 | 47.5 | 16.4 | 0 | 624 | 1424 | 9.50 | 65.1 | 3.61 | 53.5 | 8.65 | -4.1 | 0.6 | -1.2 |
| Dog’s Head | 344 | 386 | 3.2 | 394 | 413 | 33.7 | 474 | 52.6 | 468 | 26.8 | 79.9 | 491 | 754 | 59.4 | 17.2 | 1 | 1074 | 1821 | 10.1 | 45.2 | 5.02 | 32.07 | 12.5 | -5.6 | 0.4 | -2.0 |
| E2-Southa | ||||||||||||||||||||||||||
| Dog’s Heada | 351 | nd | 3.0 | 435 | nd | 40.3 | 618 | nd | 618 | 31.5 | 105 | 536 | 842 | 39.1 | 17.7 | 0 | 1315 | 2106 | nd | nd | 6.7 | nd | nd | nd | 1.1 | 1.5 |
| Sepiaa | 353 | nd | 3.1 | 426 | nd | 39.1 | 623 | nd | 623 | 32.5 | 105 | 532 | 838 | 38.4 | 22.6 | 0 | 1038 | 2116 | nd | nd | 7.6 | nd | nd | nd | 1.1 | 1.4 |
| Sepia Flangea | 313 | nd | 2.9 | 416 | nd | 38.0 | 604 | nd | 604 | 30.5 | 96.1 | 517 | 838 | 39.8 | 22.6 | 0 | 816 | 2280 | nd | nd | 7.1 | nd | nd | nd | 1.0 | -0.8 |
Endmember concentrations and isotopic compositions of aqueous species from fluids recovered from E2-South and E2-West hydrothermal vent fields.
Table 3B
| Edifice | Tmax [°C](In situ) | MgmM | LanM | CenM | PrnM | NdnM | SmnM | EunM | GdnM | TbnM | DynM | HonM | ErnM | TmnM | YbnM | LunM | ΣREEnM |
|---|---|---|---|---|---|---|---|---|---|---|---|---|---|---|---|---|---|
| LOQ | - | - | 0.0035 | 0.0013 | 0.0004 | 0.0036 | 0.0050 | 0.0002 | 0.0005 | 0.0004 | 0.0007 | 0.0005 | 0.0004 | 0.0001 | 0.0003 | 0.0002 | - |
| BSW*100d | 0 | 54.3 | 4.2 | 0.62 | 0.63 | 2.7 | 0.5 | 0.12 | 0.68 | 0.1 | 0.77 | 0.21 | 0.72 | 0.1 | 0.7 | 0.14 | – |
| E2-West | |||||||||||||||||
| Flange | 53 | 42.6 | bdl | bdl | bdl | bdl | 0.68 | 0.41 | bdl | bdl | bdl | bdl | 0.05 | nd | 0.04 | bdl | 1.2 |
| E2- South | |||||||||||||||||
| Iced Bun | 320 | 4.45 | 7.05 | 9.56 | 1.07 | 3.99 | 0.87 | 1.46 | 0.67 | 0.1 | 0.41 | 0.09 | 0.24 | nd | 0.2 | 0.03 | 26 |
| E.M | 7.71 | 10.46 | 1.17 | 4.36 | 0.95 | 1.60 | 0.73 | 0.11 | 0.45 | 0.10 | 0.26 | nd | 0.22 | 0.03 | 27 | ||
| Dog’s Head | 344 | 10.5 | 5.71 | 9.22 | 0.88 | 2.89 | 0.63 | 2.39 | 0.57 | 0.07 | 0.33 | 0.05 | 0.14 | nd | 0.10 | 0.01 | 23 |
| E.M | 7.16 | 11.57 | 1.10 | 3.62 | 0.78 | 3.00 | 0.71 | 0.09 | 0.41 | 0.07 | 0.18 | nd | 0.12 | 0.02 | 29 | ||
| E2-Southd | |||||||||||||||||
| Dog’s Headd | 351 | 1.02 | 6.28 | 11.6 | 1.36 | 5.26 | 1.06 | 1.27 | 1.61 | 0.19 | 0.56 | 0.09 | 0.21 | 0.02 | 0.13 | 0.01 | 30 |
| 323 | 2.11 | 8.67 | 16 | 2 | 8.12 | 1.8 | 2.29 | 1.8 | 0.2 | 0.95 | 0.15 | 0.32 | 0.03 | 0.17 | 0.02 | 42 | |
| 323 | 2.28 | 8.06 | 17.4 | 2.2 | 9.14 | 2.06 | 1.88 | 1.9 | 0.23 | 1.1 | 0.17 | 0.37 | 0.03 | 0.19 | 0.02 | 45 | |
| E.M | 7.92 | 15.5 | 1.9 | 7.75 | 1.7 | 1.87 | 1.61 | 0.19 | 0.9 | 0.14 | 0.31 | 0.03 | 0.17 | 0.02 | 40 | ||
| Sepiad | 347 | 1.61 | 6.58 | 11.9 | 1.34 | 5.1 | 0.97 | 1.21 | 0.98 | 0.11 | 0.53 | 0.08 | 0.2 | 0.02 | 0.11 | 0.015 | 29 |
| E.M | 6.8 | 12.2 | 1.38 | 5.25 | 1.01 | 1.25 | 0.98 | 0.11 | 0.55 | 0.09 | 0.2 | 0.02 | 0.12 | 0.01 | 30 |
Rare-earth element concentrations of the fluids from E2-S and E2-W hydrothermal vent fields.
mM, mmol/L fluid; μM, μmol/L fluid; nM, nmol/L fluid; mm, mmol/Kg fluid; nd, not determined; bdl, below detection limits; LOQ, Limit of quantification; TMAX, maximum temperature measured; BSW, Bottom seawater; NaMeas, Na measured; NaCB, Na charge balanced (see text).
pHMIN = lowest pH measured at 25°C and 1 atm; pH (in situ) = pH at measured temperature and 400 bar.
a, Data from James et al. (2014); b, data from Craig (1970); c, data from Reeves et al. (2011); d, data from Cole et al. (2014).
The endmember concentrations for H2 and CH4 at E2-W were 3.75 and 9.03 μM, respectively (Figures 4A, B). The H2S concentration in this fluid was below the detection limit (<0.2 μM). The CO2 endmember concentration is 8.55 mM (Figure 4C). These concentrations of dissolved gases at E2-W are lower than that at E2-S. The δ13CCO2 value of -10.8‰ is lower than for the fluid at E2-S. Endmember values were not calculated for δ13CCO2 due to processes affecting the CO2 concentrations of the fluid in the mixing zone (cf. Formation of fluid at E2-West).
Other Dissolved Species
The high-temperature fluid feeding E2-S is depleted in Cl by ∼9% relative to seawater with the lowest Cl endmember measuring 491 mM (Figure 4E). Sulphate is depleted in the Iced Bun and Dog’s Head fluids with endmember concentration of ≤1 mM (Figure 4F). The NaCB (Na calculated based on charge balance of the endmember) endmember concentration is depleted by ∼10% relative to seawater (Figure 4G). Endmember Ca concentrations in the fluids are 31.8 and 26.8 mM (Figure 4H). Endmember Br and F is depleted relative to seawater with 809 – 754 μM and 47.5 - 59.4 μM, respectively (Table 3A). Endmember Sr concentrations show both, depletion and enrichment relative to seawater at Dog’s Head and Iced Bun, respectively (Table 3A). The endmember concentrations of alkali metals K, Li, Rb and Cs (33.7 – 35.1 mM, 383 – 545 μM, 52.6 – 55.7μM, 468 – 538 nM) are higher than those of seawater (Table 3A).
Fluids sampled at E2-W have seawater-like concentrations of Na, Cl and Br. Endmember concentrations of K, Ca and Li are 29.3 mM, 30.2 mM and 328 μM, respectively, and are like endmember E2-S concentrations. However, SO4, F and Si have endmember concentrations of 13 mM, 8.36 μM and 11.5 mM, respectively. These concentrations are markedly different from the endmember concentrations of the E2-S fluids.
The K/Cl, Sr/Cl, Li/Cl, Cs/Cl, Rb/Cl and Br/Cl are elevated in the fluids venting at E2-S and E2-W, except for Br/Cl at E2-W, which is seawater-like (Table 4). F/Cl ratios in all fluids are lower than in seawater. The E2-S element-to-Cl ratios measured in this study show deviations to those reported by James et al. (2014) (Table 4). Dog’s Head fluids have lower Ca/Cl, K/Cl, Sr/Cl, Li/Cl, Cs/Cl and Br/Cl ratios than those sampled in 2010, whereas NaCB/Cl ratios are slightly higher compared to the 2010 ratios.
Table 4
| Edifice | NaCB/Cl | Ca/Cl | K/Cl | Sr/Clx10-3 | Li/Clx10-3 | Rb/Clx 10-3 | Cs/Clx10-3 | Br/Clx10-3 | F/Clx10-3 | Fe/Clx10-3 | Mn/Clx10-3 | Fe/Mn | Sr/Clx10-3 |
|---|---|---|---|---|---|---|---|---|---|---|---|---|---|
| BSW | 0.86 | 0.02 | 0.02 | 0.15 | 0.05 | 0.002 | 0.004 | 1.52 | 0.13 | 0.00 | 0.00 | – | 8.64 |
| E2- West | |||||||||||||
| Flange | 0.86 | 0.02 | 0.03 | 0.16 | 0.14 | 0.01 | 0.12 | 1.52 | 0.11 | 0.02 | 0.11 | 0.20 | 6.44 |
| E2- South | |||||||||||||
| Iced Bun | 0.82 | 0.06 | 0.07 | 0.19 | 1.06 | 0.11 | 1.05 | 1.58 | 0.09 | 1.22 | 2.78 | 0.44 | 3.00 |
| Dog’s Head | 0.84 | 0.05 | 0.07 | 0.16 | 0.97 | 0.11 | 0.95 | 1.54 | 0.11 | 2.19 | 3.71 | 0.59 | 2.98 |
| E2- Southa | |||||||||||||
| Dog’s Heada | 0.80 | 0.06 | 0.07 | 0.19 | 1.12 | nd | 1.13 | 1.57 | 0.07 | 2.40 | 3.80 | 0.62 | 3.33 |
| Sepiaa | 0.79 | 0.06 | 0.07 | 0.19 | 1.14 | nd | 1.12 | 1.58 | 0.07 | 1.90 | 3.90 | 0.49 | 3.24 |
| Sepia Flangea | 0.79 | 0.06 | 0.07 | 0.18 | 1.14 | nd | 1.15 | 1.62 | 0.08 | 1.50 | 4.30 | 0.36 | 3.14 |
Molar element/Cl ratios for fluids from ESR. E2-West ratios are calculated from measured concentrations, while E2-S are calculated from EM values.
BSW, bottom seawater; NaCB, Na charge balanced (see text).
a = Data from James et al. (2014).
E2-S endmember fluids are characterized by concentrations of Fe and Mn of 624 – 1074 μM and 1424 – 1821 μM, respectively. The metal concentrations in the endmember fluids from E2-S are lower than in the endmembers calculated from the 2010 samples (Figures 4K, L). E2-W has an endmember Fe and Mn concentrations of 69.0 and 351 μM (Table 3A; Figures 4K, L).
The total endmember REE (ΣREE) concentrations in the fluids from E2-S are 27 nmol/kg and 29 nmol/kg at Iced Bun and Dog’s Head, respectively (Table 3B). Chondrite-normalized REEN distribution pattern shows the characteristic light REE (La-Nd) enrichment and a positive Eu anomaly (Douville et al., 1999; Douville et al., 2002; Craddock et al., 2010, Figure 5).
Figure 5
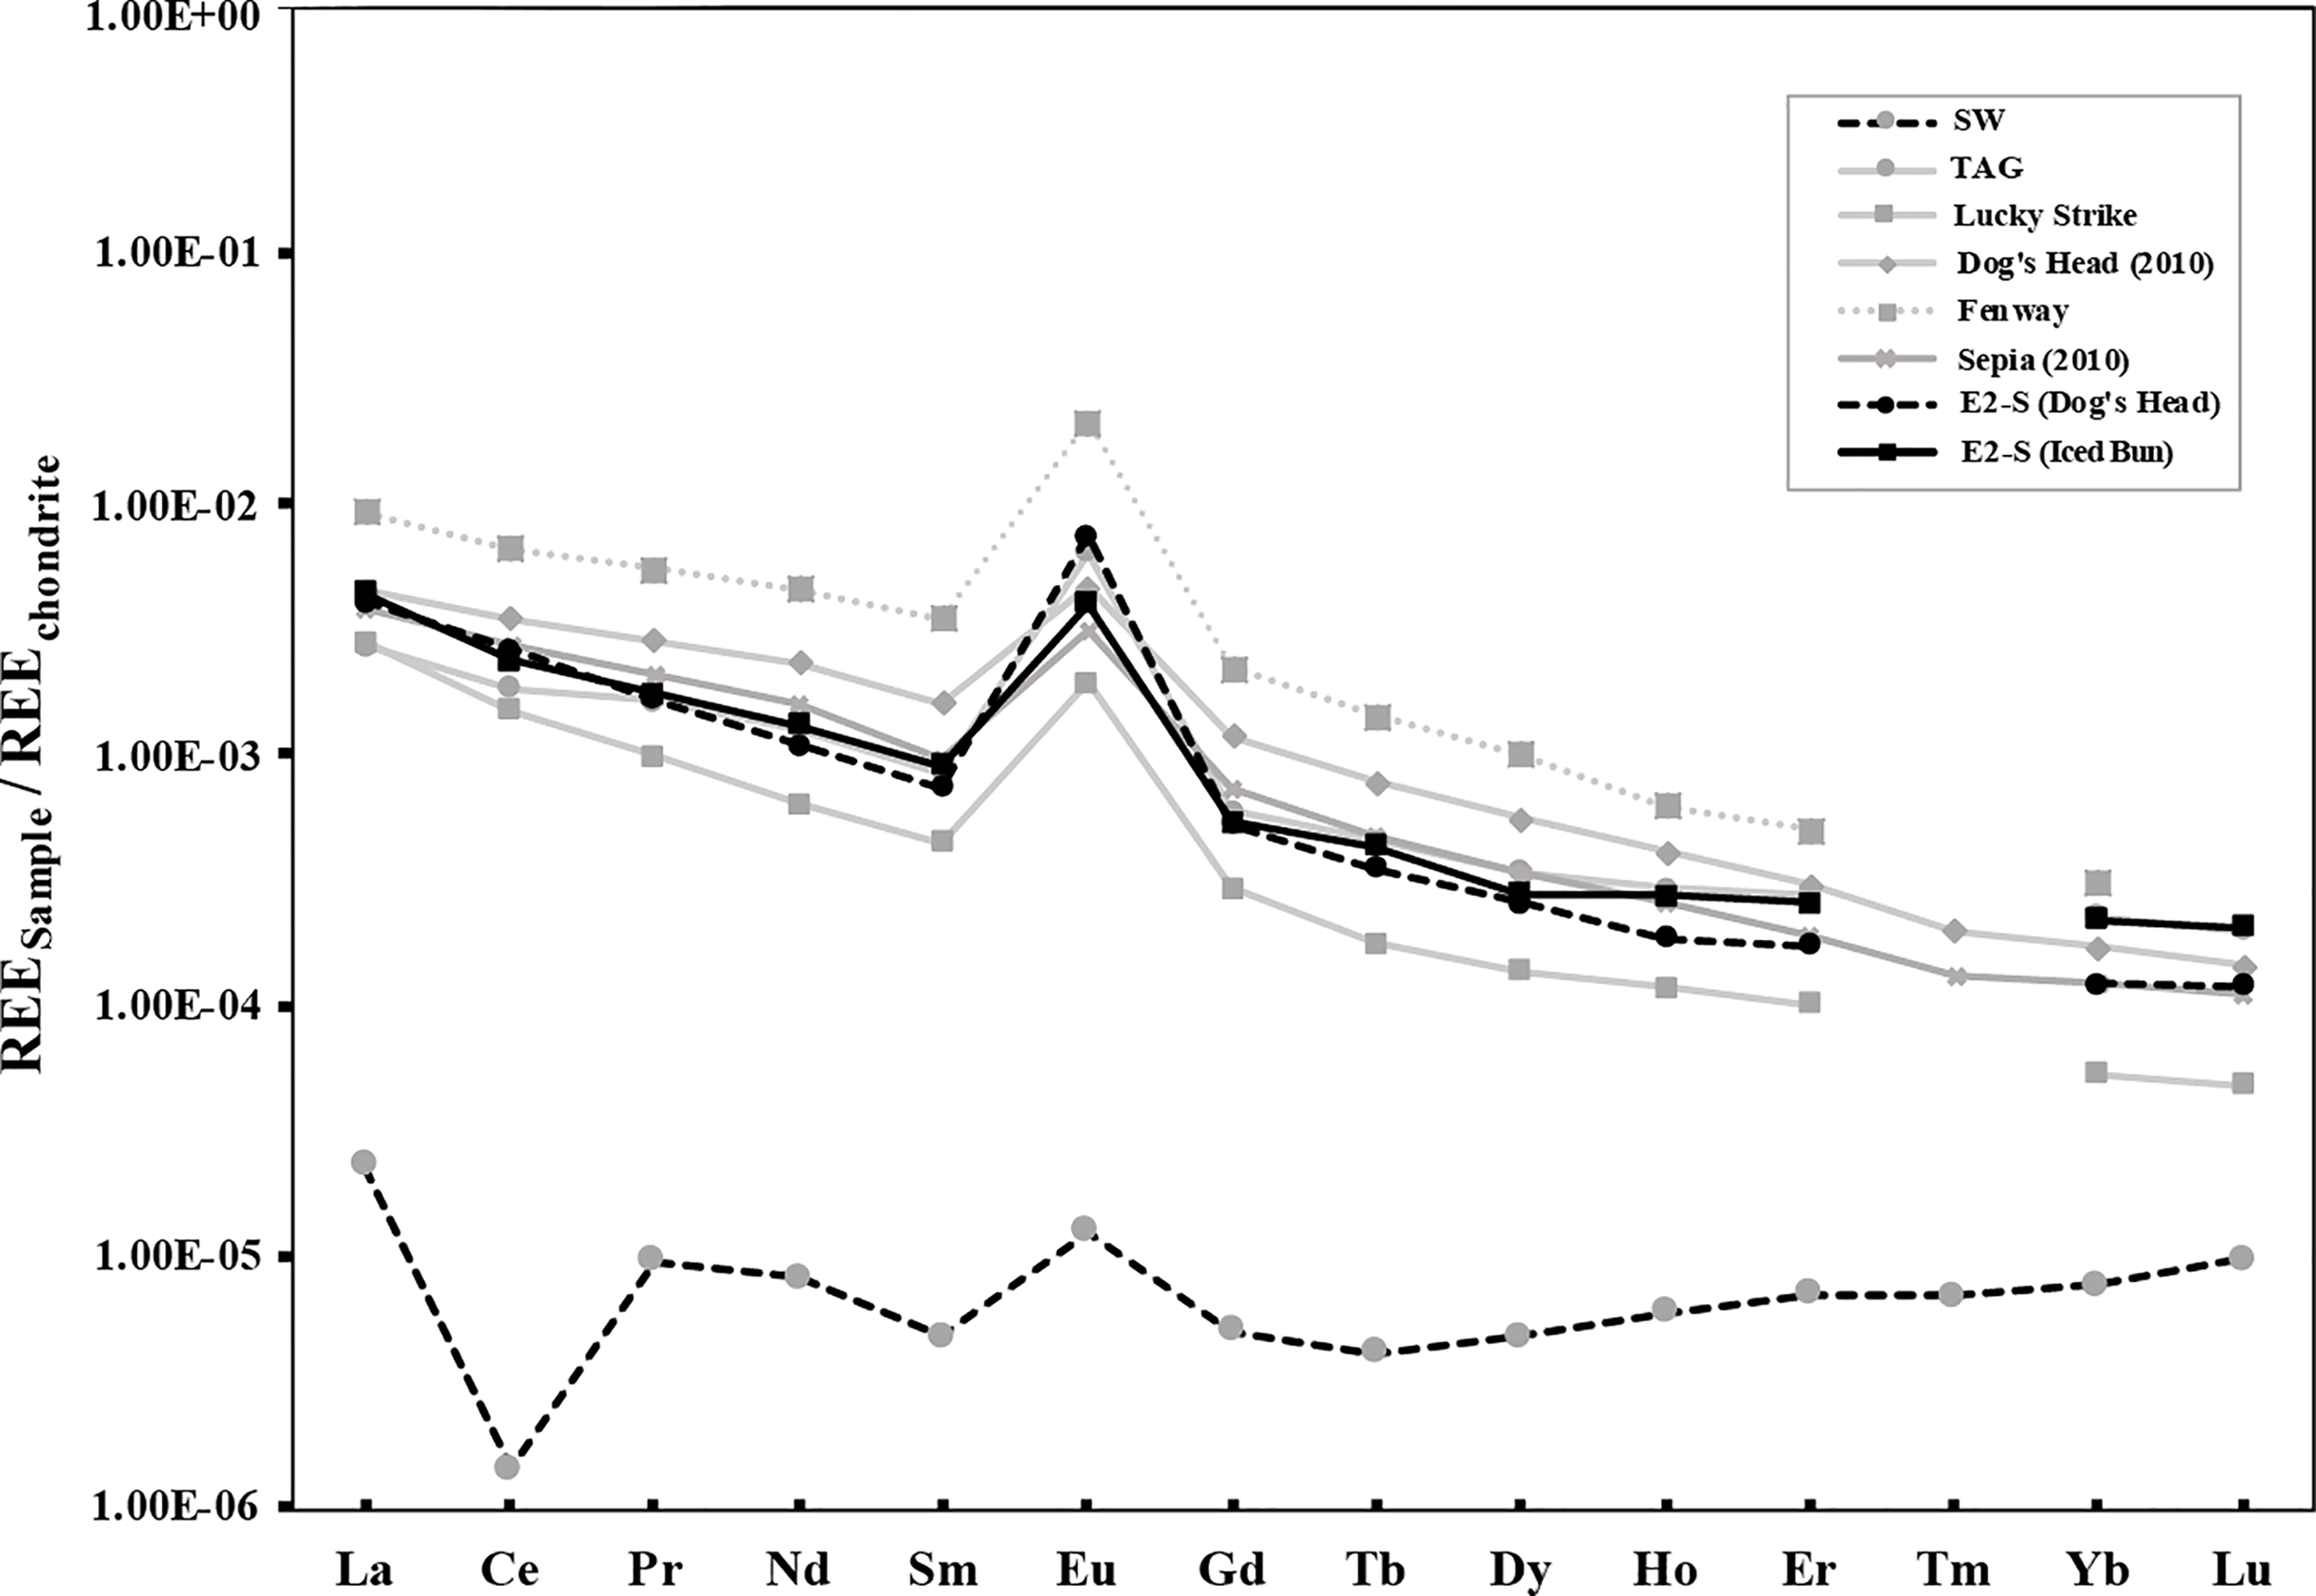
Chondrite normalized REE pattern for endmember fluids from East Scotia ridge (Dog’s Head and Iced Bun) compared with endmember fluids from other mid-oceanic ridge systems and back-arc basins that show similar patterns. The data represented here is from Douville et al. (1999) (TAG and Lucky Strike), Cole et al. (2014) (Dog’s Head, Sepia), Craddock et al. (2010) (Fenway). The seawater (SW) values are taken from Cole et al. (2014).
Stable Oxygen and Hydrogen Isotopes
The δ18OH2O endmember value of +0.4 and +0.6‰ for fluids from E2-S are 18O-enriched compared to the endmember ratio for the fluid sample at E2-W (-1.7‰, Table 3A). The δDH2O values for all fluids are lower than seawater, with the lowest values in the fluid at E2-W (-2.3‰). The endmember δDH2O and δ18OH2O values recorded in this study are lower than those of the fluids sampled in 2010 (Table 3A).
Fluid Inclusions
Microthermometry of 26 fluid inclusions was conducted in anhydrite precipitates from a chimney sample of Dog’s Head (Supplementary Table 1). Two fluid inclusion types were identified during the investigation: Inclusion Type I is single phased and was not analysed. Inclusion Type II contains two-phases, with vapour-liquid inclusions and can be subdivided into Type IIa (<50 vol.% vapour) and Type IIb (≥50 vol.% vapour). Type IIa is the dominant inclusion type with 22 out of 26 measured inclusions. The remaining of 4 inclusions is classified as Type IIb. All Type II inclusions exclusively homogenize into the liquid phase suggesting a similar origin. Tm (ice-melting temperature) in individual inclusions ranged from -1.6 to -2.1°C. The corresponding calculated salinities range between 2.7 wt.% NaCl eq. (minimum) and 3.6 wt.% NaCl eq. (maximum). The average Tm of -1.8°C corresponds to a mean salinity of 3.1 wt.% NaCl eq., just slightly below seawater, for all inclusions. Calculated salinities (mean) for different inclusion types (Type IIa and Type IIb) are 3.1 and 3.2 wt.% NaCl eq. According to measured salinities, the inclusions can be grouped into two populations (Supplementary Figure 3A): 9 inclusions were determined to contain fluids with salinities significantly below seawater (<3.0 wt.% NaCl eq.) and 22 inclusions contained fluids with near-seawater salinities (3.0-3.6).
Thom were determined between 211°C and 316°C (Supplementary Figures 3B, C). The calculated Te range between 226-333°C with 9 of 22 Te determinations above 300°C. The highest Te was determined as 333°C, just 11°C lower than the measured temperature of 344°C during fluid sampling. Both these temperatures are significantly below the boiling temperature of 386°C at seafloor pressure.
Discussion
The high-temperature fluids at E2-S have low Mg and SO4 concentrations typical for black smoker type vent fluids. They are enriched in dissolved gases (CO2, H2, CH4 and H2S) and are depleted in Cl relative to seawater values. The fluids are enriched in alkalis, alkaline earth and transition metals as a result of high-temperature fluid-rock interactions in the sub-surface. Furthermore, the fluids have high Na/Cl and low Ca/Cl ratios and lower concentrations of Li, Rb, and REEs than the fluids sampled in 2010 (Cole et al., 2014; James et al., 2014). The low-temperature fluid sampled at E2-W have lower concentrations of dissolved gases, alkalis, alkaline earth, and transition metals than the fluid at E2-S. The high Mg and SO4 contents of E2-W fluid indicates sub-surface mixing with entrained seawater.
In the following discussion we present evidence for the temporal variation of the E2 vent field, provide evidence for a single sourced fluid feeding the E2 system and imply the depth of the root zone as well as phase separation processes. We discuss the origin of dissolved gases at E2 by magmatic degassing and constrain sinks for the gases both in terms of abiotic and biotic processes taking place in the sub-surface. Important catabolic reactions responsible for supporting the chemosynthetic ecosystem at E2 are also discussed.
Fluid Mineral Equilibria
Chloride is the dominant anion in hydrothermal fluids, it ranges in concentration due to phase separation and plays a key role in complexing dissolved metals. Hydrothermal vent fluids commonly show a tight correlation between the concentrations of cations and chloride. Metal concentrations in vent fluids can therefore be normalized to Cl for a comparison of fluids affected by different degrees of phase separation. It is known that partitioning of cations in the low-salinity fluid and the brine phase is not uniform during supercritical phase separation. Thus Cl normalization allows a better understanding of the dissolved species (Table 4, Berndt and Seyfried, 1990; Foustoukos and Seyfried, 2007a). Na/Cl and Ca/Cl ratios at E2-S are in the range for unsedimented mafic-hosted hydrothermal systems (Gallant and Von Damm, 2006; McDermott et al., 2018; Diehl and Bach, 2020b; Diehl and Bach, 2021). E2-W has a seawater like Na/Cl and Ca/Cl ratios, which are a result of excessive mixing of hydrothermal fluid with seawater. Theoretical studies and laboratory experiments have shown that thermodynamic equilibrium between plagioclase and epidote solid solutions in basalt hosted hydrothermal systems control the Na and Ca concentrations of the fluids (Berndt et al., 1989; Seyfried et al., 1991; Berndt and Seyfried, 1993; Seyfried and Ding, 1995). Higher temperature conditions favour the stability of anorthite, clinozoisite of the plagioclase and epidote solid solutions respectively, due to the following reactions:
These reactions result in Ca fixation and decrease in Ca/Cl ratios in hydrothermal systems. The Na/Cl ratios are lower and the Ca/Cl ratios are higher than seawater, indicating that albitization and Ca-release occur in the root zone of E2-S. However, in 2019 the fluids at Dog’s Head had higher Na/Cl and lower Ca/Cl ratios than in 2010 (Table 4). This may indicate a subtle switch to less albitization and more Ca fixation. Likewise, the Li/Cl and Cs/Cl ratios were noticeably lower in 2019 than in 2010. These ratios are proxies for water/rock mass ratios (w/r). Field and experimental data have shown that alkalis are highly fluid mobile and get leached from basalt during fluid-rock interactions at high temperatures (Mottl and Holland, 1978; Seyfried et al., 1984; Von Damm et al., 1985a; Von Damm, 1990). The high mobility results in higher concentrations of dissolved alkalis in the fluids that have interacted with large masses of rock (Table 3A). Assuming that Li, Rb and Cs are fully leached from the rocks in the root zone w/r ratios can be calculated (e.g., Von Damm et al., 1985a). The glassy lava from the E2 segment contains ca. 0.15 ppm of Cs, ca. 8 ppm of Rb (Leat et al., 2000). Basaltic andesites commonly contain ca. 8 ppm of Li (Ryan and Langmuir, 1987). Using endmember compositions for Li, Rb and Cs at E2-S and assuming 100% extraction of the elements the w/r ratios were ca. 2 for Cs and ca. 2 for Rb at both Iced Bun and Dog’s head. The w/r ratios of ca. 2 for Iced Bun and ca. 3 for Dog’s Head were calculated using Li. Moreover, the ratios in this study are higher compared to that calculated in 2010 (ca. 1.9) because of lower alkali abundances in these fluids.
Dog’s Head and Iced Bun have very similar vent fluid compositions in terms of Na/Cl, K/Cl, Br/Cl, Si and predicted w/r ratios, indicating that the high-temperature fluids venting at E2-S are fed by a common root zone. Likewise, back in 2010, Dog’s Head and Sepia had identical Na/Cl, K/Cl, Ca/Cl, Li/Cl and Cs/Cl which also points to a single sourced fluid at E2-S. We next discuss how the composition of the Dog’s Head fluids has evolved between 2010 and 2019 and how this variation may indicate changes in the common root zone of the E2-S vents.
Temporal Variability of the E2 Vent Field
Continuous alteration of fresh rock over time can result in the loss of elements from the rock, thereby reducing the amount of fresh rock available for w/r interactions (high Na/Cl ratios). This results in higher w/r ratios and decrease in concentration of mobile elements. Higher Na/Cl ratios coupled with higher w/r ratios in 2019 as compared to 2010 provide evidence that the root zone at E2-S has undergone effective alteration over the duration of the past 9 years. Furthermore, the fluids sampled in 2019 have low δDH2O and δ18OH2O compared to the fluids sampled in 2010 (Table 3A). While the low δDH2O at E2 may be related to magmatic water input, the low δ18OH2O cannot be explained by this process (cf. Magmatic water input). The fluid sampled at Dog’s Head in 2010 had an endmember δ18OH2O value of 1.1‰ while the fluid from 2019 has a lower value of 0.4‰. Hydrothermal alteration of the igneous crust by circulating seawater-derived fluids at high temperature will have the δ18OH2O values of the altered rocks decrease with time (Shanks, 2001 and references therein). The lower δ18OH2O values of the 2019 vent fluid may indicate that the rocks in the root zone are more altered, which is consistent with the higher w/r ratios derived from the decreased concentration of fluid mobile elements (Rb, Li).
Experimental work has shown that REE concentrations are also affected by the intensity of hydrothermal alteration: the REE concentrations decrease and the positive Eu anomaly becomes more pronounced as the extent of hydrothermal alteration of mafic rocks increase (Beermann et al., 2017). REECN (chondrite normalised) pattern observed in the fluids from E2-S are typical for mature mafic hosted hydrothermal systems (Figure 5). ΣREE measured in this study is lower than 2010 (Cole et al., 2014). This decrease in total REE content would be consistent with an increased extent of rock alteration in the root zone. However, REE solubility in hydrothermal fluids is also controlled by temperature, pH and redox conditions during high-temperature fluid-rock interactions (Craddock et al., 2010). A lower temperature in the root zone could therefore also explain the observed drop in ΣREE.
Our fluid inclusion study provides insights into the temporal evolution of salinity and phase separation processes taking place at E2. The fluid inclusion data at E2-S show that the fluids salinity was either slightly lower than or close to that of seawater (Supplementary Figure 3C). Although the time of entrapment of these inclusions was not determined, the low salinity in most of the inclusions in the young top of the chimney sample provide evidence for low Cl venting fluid at E2 during the past years. In addition to the low Cl concentrations measured in the fluids in 2019 and 2010, the fluid inclusion salinities indicate that phase separation has been affecting fluid compositions at E2-S for a prolonged period, despite the apparent changes in the extent of alteration in the root zone.
In summary, the root zone of E2-S may have changed slightly towards a more altered basement and slightly lower temperatures, but it appears that the process of phase separation (supercritical) taking place at E2 is constant and has not changed significantly.
Depth of the Root Zone
The concentration of dissolved Si in hydrothermal vent fluids can be used to estimate the depth (pressure) and temperature in the hydrothermal root zone (Bischoff and Rosenbauer, 1985; Von Damm et al., 1991; Foustoukos and Seyfried, 2007c). This thermobarometer is calibrated for quartz which is commonly present in hydrothermally altered mafic rocks. Since quartz solubility is a function of temperature and pressure, either one can be estimated if the other one is known. Using this relation, sub-surface conditions of fluid-quartz equilibration at E2-S was calculated (Figure 6). With the calculated endmember Si concentrations and the measured temperature at E2-S, the equilibrium pressure was calculated at ∼300 bar and ∼500 bar at Dog’s Head and Iced Bun, respectively. Silica concentrations at Dog’s Head in this study is slightly lower than in 2010. Silica concentration in the Sepia fluids was high (22.3 mM, James et al., 2014), corresponding to unreasonably high 800-900 bar pressure. James et al. (2014) argued that the root zone temperatures at ‘Sepia’ were probably higher than the measured 353°C and that cooling (but no quartz precipitation) in the upflow zone gave rise to the high apparent pressures. The low pressures (300- 350 bar in 2019) obtained for Dog’s Head may indicate that quartz did precipitate. At Iced Bun, the estimated depth of quartz equilibria is 500 bar. It is highly unlikely that the depth of the hydrothermal root zone for vent orifices that are in such proximity [ca. 60 m of each other, Tyler, (2012)] have such a huge variability. More plausibly, the estimated pressures are an artefact of conductive cooling (James et al., 2014). When conductive cooling takes place, silica precipitation may or may not take place. The shallow pressures obtained for Dog’s Head indicate some quartz precipitation in the upflow zone. In contrast, the high silica concentrations in the Sepia vent fluids in 2010 (James et al., 2014) indicate that quartz did not precipitate upon cooling. The effect of conductive cooling and quartz precipitation kinetics on the Si concentrations of the fluids makes it difficult to obtain a realistic depth of the reaction zone from quartz equilibrium pressures at E2-S.
Figure 6
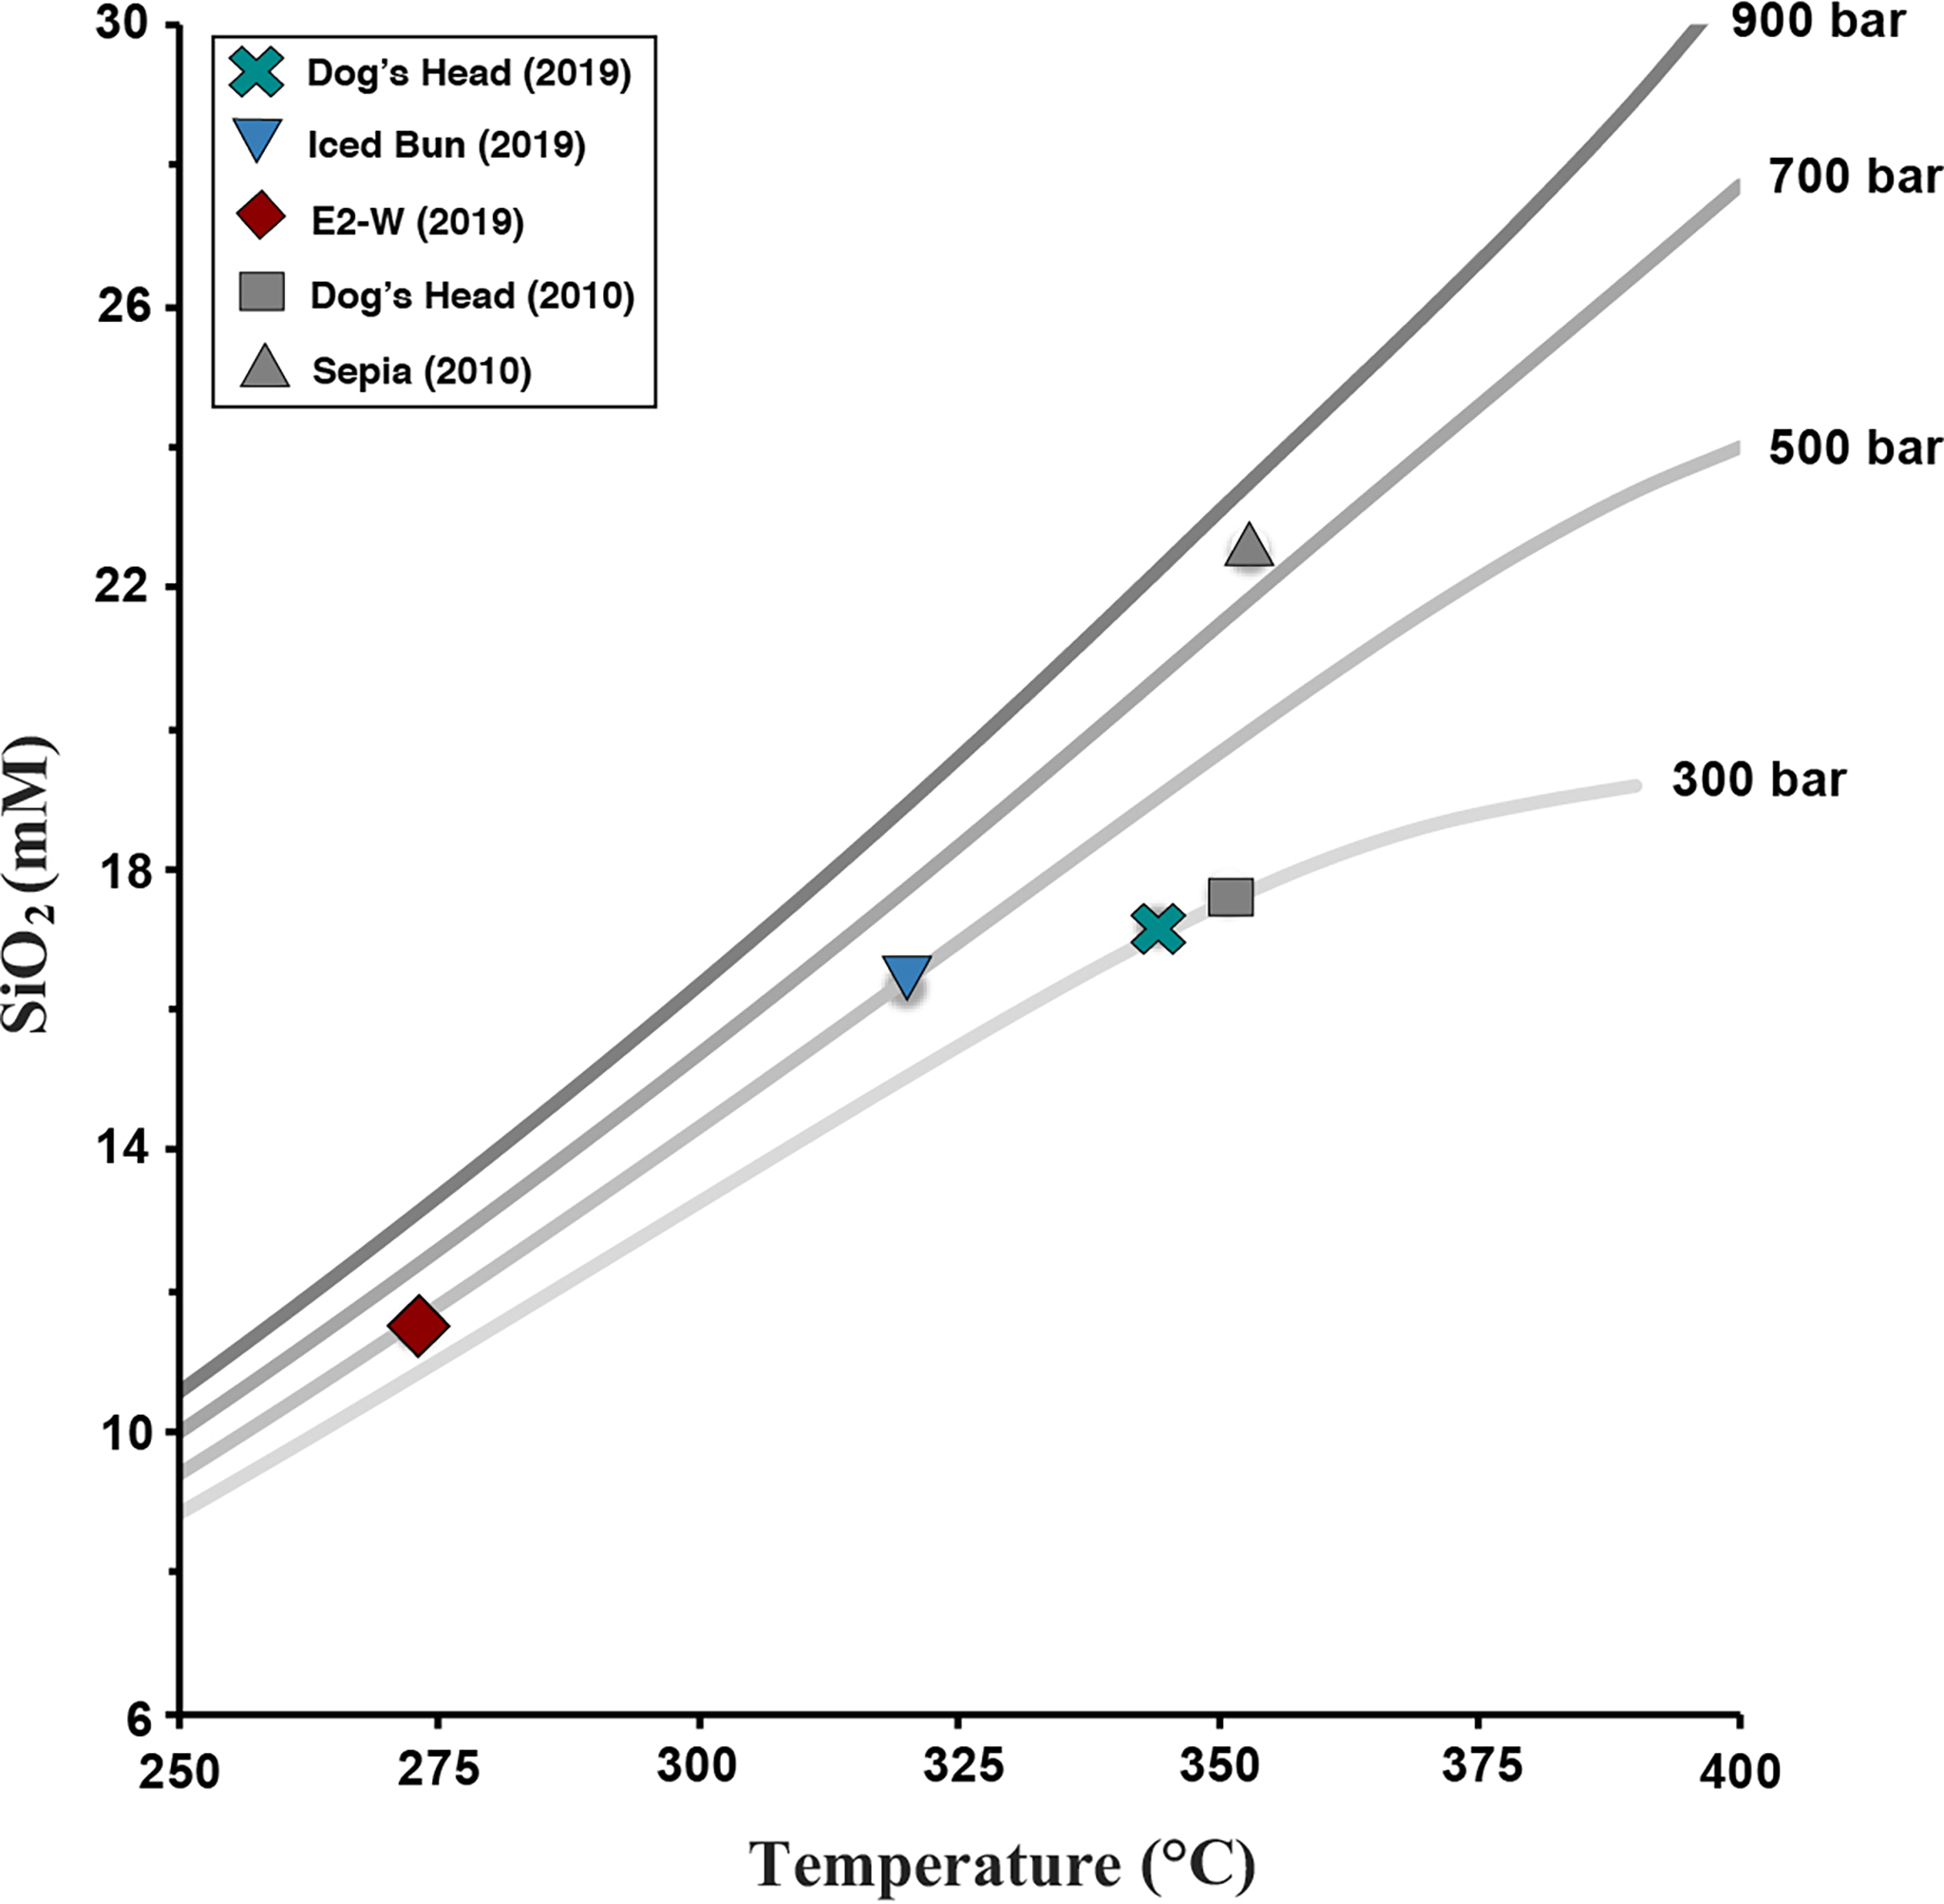
Endmember aqueous SiO2 concentrations plotted against Tmax of the vent fluids at E2-S and zero Mg extrapolated temperature for E2-W. The colored symbols represent the samples analysed in this study compared with the samples measured in 2010 (grey). The quartz saturation curves were taken from Foustoukos and Seyfried (2007c) and are represented as a function of pressure from 300 to 900 bar and temperatures.
Phase Separation
The high-temperature fluids venting at E2-S have a Cl concentration that is significantly lower than that of seawater. The lowest endmember concentration was 491 mM (Figure 4E). No major Cl sink is known to exist in mafic-hosted hydrothermal systems and therefore Cl depletions observed in such systems are typically attributed to phase separation (Von Damm, 1990; Von Damm, 1995; Foustoukos and Seyfried, 2007b). Seafloor pressure of ∼260 bar places the two-phase boundary at 386°C (Supplementary Figure 2; Driesner and Heinrich 2007), while the critical point of seawater is 407°C at 298 bars (Bischoff, 1991). Our investigation shows that the observed variability in salinities and temperatures in hydrothermal fluid samples and fluid inclusions cannot be produced by subcritical phase separation (Supplementary Figure 3). The Cl concentrations lower than seawater in the hydrothermal fluids at E2-S are therefore likely a result of phase separation at supercritical conditions. Subcritically phase separated fluids would produce mixing lines with considerably lower Cl concentrations when mixing with cold seawater. The temperature-salinity plane observed for fluid samples and inclusion data is characteristic for fluids produced by phase separation at pressures of at least over 300 bar. Elevated Br/Cl ratios at E2-S relative to seawater corroborate the idea of phase separation under supercritical conditions (cf. McDermott et al., 2018). Laboratory experiments have shown that Br partitions preferentially into the low salinity phase under supercritical conditions, resulting in increased Br/Cl ratios (Berndt and Seyfried, 1990; Foustoukos and Seyfried, 2007a). Using the Cl normalized partition coefficients and the following formula:
where and represents the molal concentration of Br/Cl in the low salinity and high salinity phase, respectively (Berndt and Seyfried, 1990; Foustoukos and Seyfried, 2007a). It is known that vapour-brine partition coefficients for Br increases with decreasing fluid density and can be related with the following expression:
where pw = density of pure seawater (Foustoukos and Seyfried, 2007a).
Endmember Br/Cl ratios at E2-S are 1.54 and 1.58 (Table 4), which are higher relative to seawater value of 1.52. These Br/Cl ratios give values of DBr/Cl of 1.01 and 1.04. Values of D >1 is known to be a result from the formation of a low salinity phase (Foustoukos and Seyfried, 2007a). Moreover, the calculated D values correspond to densities of ∼0.25 g/ml for the fluid at E2-S. This fluid density allows us to confine the conditions of phase separation to a pressure and temperature range of 320 to 390 bar and 420 to 450°C. The Cl-depleted nature of the fluids from E2-S represents a supercritical phase separated fluid owing to their depleted Cl concentrations relative to seawater and density constraints (Bischoff and Pitzer, 1989; Bischoff, 1991). The cooler temperatures of 320 to 344°C measured at seafloor conditions suggest that the fluids have been undergoing conductive cooling prior to venting.
Phase separation is known to affect the concentrations of dissolved gases in hydrothermal fluids. Cl-depleted fluids have a higher concentration of dissolved gases relative to conjugate brine phases. This is also true for the fluids at E2-S. Fluids with low concentration of Cl show the highest concentration of CO2 and H2S (Figures 4C–E), while concentrations of dissolved H2 and CH4 do not show similar trends. CH4 abundances likely represent a CH4-Cl rich fluid (brine phase) mixing with the vapour rich fluid at E2-S.
Sub-Surface Processes and Consequences for Concentrations of Dissolved Metals and Gases
The pH of the fluid and metal-chloro complexes (under the effect of pressure and temperature) play a key role for the concentrations of dissolved metals in hydrothermal fluids. The temperatures required to have high concentrations of metals stable in seawater-like solutions decrease in the order Cu>Fe>Zn>Mn (Seewald and Seyfried, 1990). It is therefore expected that a cooled hydrothermal fluid will lose Cu and Fe by mineral precipitation faster than Zn and Mn. The fluids at E2-S have a relatively high endmember Mn concentration but low Fe concentrations (Table 3A). The low Fe/Mn ratios at E2-S (0.20 to 0.59) may represent the loss of Fe relative to Mn because of extensive conductive cooling of the fluid. To test this hypothesis, we applied the Fe/Mn geothermometer by Pester et al. (2012), derived from an empirical relation between the Fe/Mn ratios of hydrothermal fluids and temperature. The calculated temperatures (e.g., 305°C for Dog’s Head) are lower than the measured temperatures (here: 344°C). The same applies for the Dog’s Head fluids analysed in 2010 (Table 3A), which give Fe/Mn temperatures of 308°C (at measured 351°C). Sepia and Sepia Flange show even lower Fe/Mn ratios indicative of even more cooling-related Fe-precipitation there. These overall low Fe/Mn ratios are a clear indication that the fluids venting at E2-S undergo extensive cooling and pyrite precipitation prior to venting at the seafloor (Figure 8). The 40°C cooling of Sepia Flange relative to Sepia vent (James et al., 2014) come with a drop in Fe concentrations of >200 µM. The associated changes in H2S concentrations (drop by 500 µM) and pH (drop from 3.1 to 2.9) are consistent with the idea of pyrite precipitation.
The low concentrations of dissolved H2 in the fluids at E2-S (<1 mM) are typical for unsedimented mafic hosted hydrothermal systems (e.g., Welhan and Craig, 1983; Merlivat et al., 1987; Evans et al., 1988; Proskurowski et al., 2008; Diehl and Bach, 2020b; Diehl and Bach, 2021). Dissolved H2 in hydrothermal fluids are known to be controlled as a result of fluid-mineral equilibria and phase separation processes, where H2 abundances are buffered as a result of equilibration of Fe-bearing sulphide, oxides and aluminosilicate minerals (Seyfried and Ding, 1995; Seyfried et al., 2003). Phase separation can also affect the concentration of dissolved gases such as H2. Cl-depleted vapour phases are usually associated with high concentration of dissolved gases. However, phase separation alone at E2-S is likely unable to explain the concentration of H2 in these fluids.
High-temperature fluid-rock interaction in the sub-surface root zone results in buffering the H2 concentration of these fluids. Experimental basalt alteration studies have shown that pyrite-pyrrhotite-magnetite (PPM) and hematite-magnetite (HM) assemblages are predicted to exist in the range of redox conditions for natural hydrothermal systems (Seewald and Seyfried, 1990; Seyfried et al., 1991; Seyfried and Ding, 1995). The stability of these buffers can be predicted using thermodynamic data at various sets of temperature and pressure conditions. The known endmember H2 concentrations for the fluids at Iced Bun and Dog’s Head, predict H2 concentrations that are consistent with the HM buffer at temperatures of ∼358 and ∼340°C at 300 bar (Figure 7). The higher degree of conductive cooling at Iced Bun relative to Dog’s Head results in the offset of the data from the predicted HM buffer. The measured concentrations of H2 at Iced Bun correspond to an equilibrium fluid temperature of ∼358°C (Figure 7), while the fluid at Dog’s Head is predicted to have a temperature of ∼340°C. The fluid temperature predicted at Dog’s Head are close to the measured temperatures of 344°C. The higher temperature predicted for fluids emitting at Iced Bun could be a result of addition of H2 from rapid pyrite precipitation after equilibration with the HM buffer, during fluid upflow. However, we cannot rule out the fact that the fluid venting at Iced Bun underwent a higher degree of conductive cooling compared to Dog’s Head, and therefore the H2 concentrations could also be the result of higher equilibration temperatures (>320°C).
Figure 7
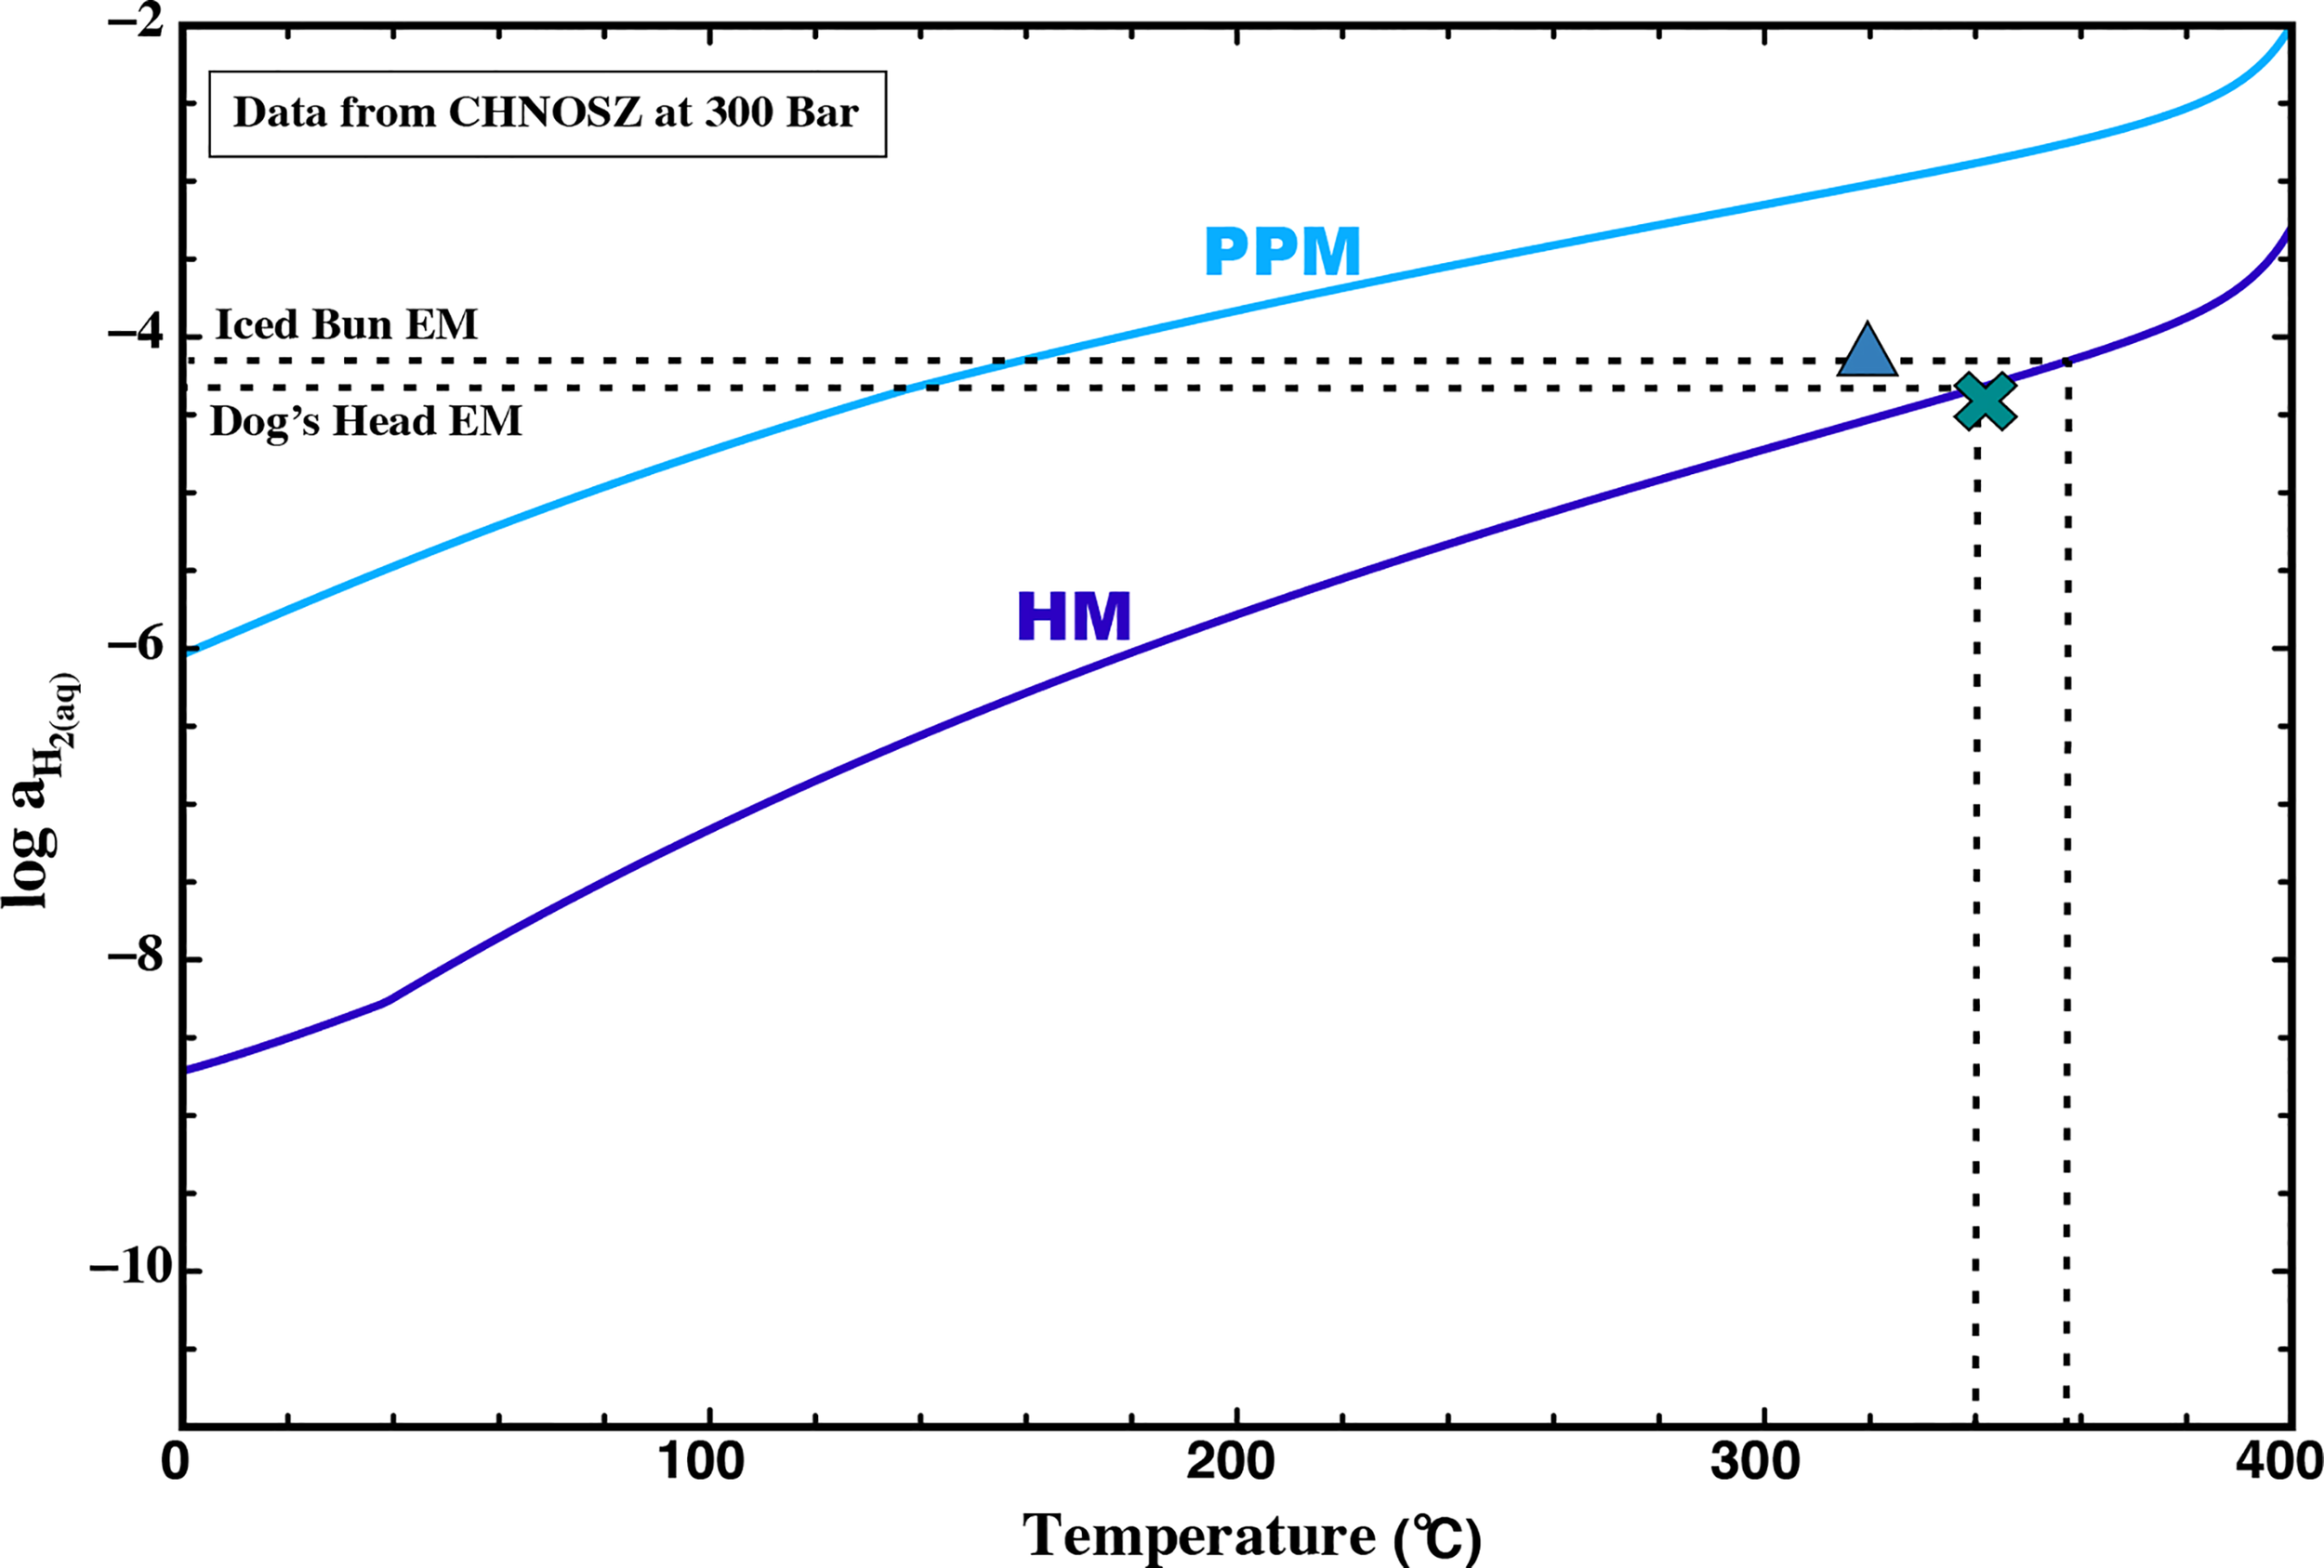
Activity diagram showing aqueous H2 abundances in equilibrium with pyrite-pyrrhotite-magnetite (PPM, blue line) and heamatite-magnetite (HM, purple line) at 300 bar and corresponding temperatures. The lines were drawn using thermodynamic data from CHNOSZ and references therein (Dick, 2019). Endmember H2 concentrations and Tmax for E2 is shown as Dog’s Head (cross) and Iced Bun (triangle). The dashed line indicates endmember H2 extrapolated to its associated temperature as a function of the HM buffer.
Endmember concentrations of dissolved H2S of 3.61 and 5.02 mM in the fluids emitted at E2-S are within the known range of basalt-hosted hydrothermal systems (Diehl and Bach, 2020b; Diehl and Bach, 2021). δ34SH2S values of fluids from E2-S range from +4.0 to +6.7‰. Such δ34SH2S values have been previously reported from the Lau Basin (McDermott et al., 2015a). The H2S in unsedimented basalt hosted hydrothermal systems can be either a result of mantle derived sulphide present in rocks in the form of pyrite and pyrrhotite with δ34SH2S values of +0.1 ±0.5‰ (Sakai et al., 1984) and/or reduced seawater SO4, with a δ34SH2S value of +21.0 ±0.2 ‰ (Rees et al., 1978). At E2-S the δ34SH2S values are a result of mantle derived sulphur that varies from 81 and 69% relative to seawater derived sulphur of about 19 and 31% in these fluids.
Conductive cooling of fluids during ascend to the seafloor can result in pyrite precipitation, which can in turn affect the concentration of H2, H2S and Fe in the fluid (McDermott et al., 2018). Pyrite precipitation produces H2 and acidity, while consuming dissolved Fe and H2S:
Indeed, the fluid venting at Iced Bun appears to be affected by pyrite precipitation as its fluid is characterized by low concentrations of Fe and H2S, a higher concentration of H2, and lower pH (in-situ) relative to Dog’s Head (Table 1, 3A). Fluid venting at Dog’s Head could also be affected by pyrite precipitation in the subsurface (low Fe/Mn ratios), but it appears that the pyrite precipitation at Iced Bun is more pronounced than at Dog’s Head. Activity-activity diagrams for H2S and H2 indicate that Dog’s Head and Iced Bun plot near the hematite-magnetite-pyrite invariant point in the Fe-S-O-H system (Figure 8). Deviations from the invariant point can be accounted for by the facts that (1) the natural system is compositionally more complex than the Fe-O-H-S system for which the diagram is representative of and (2) there is considerable uncertainties in concentration-activity relations (Scheuermann et al., 2019). H2S concentrations at E2-S may also have been influenced by phase separation, because Dog’s Head fluid (low Cl) have higher concentration of H2S than the high-Cl fluids venting at Iced Bun (Table 3A). As shown, the dissolved H2 and H2S concentrations at E2-S are mainly a result of fluid-mineral equilibria, but phase separation and cooling-induced pyrite precipitation are additional influences.
Figure 8
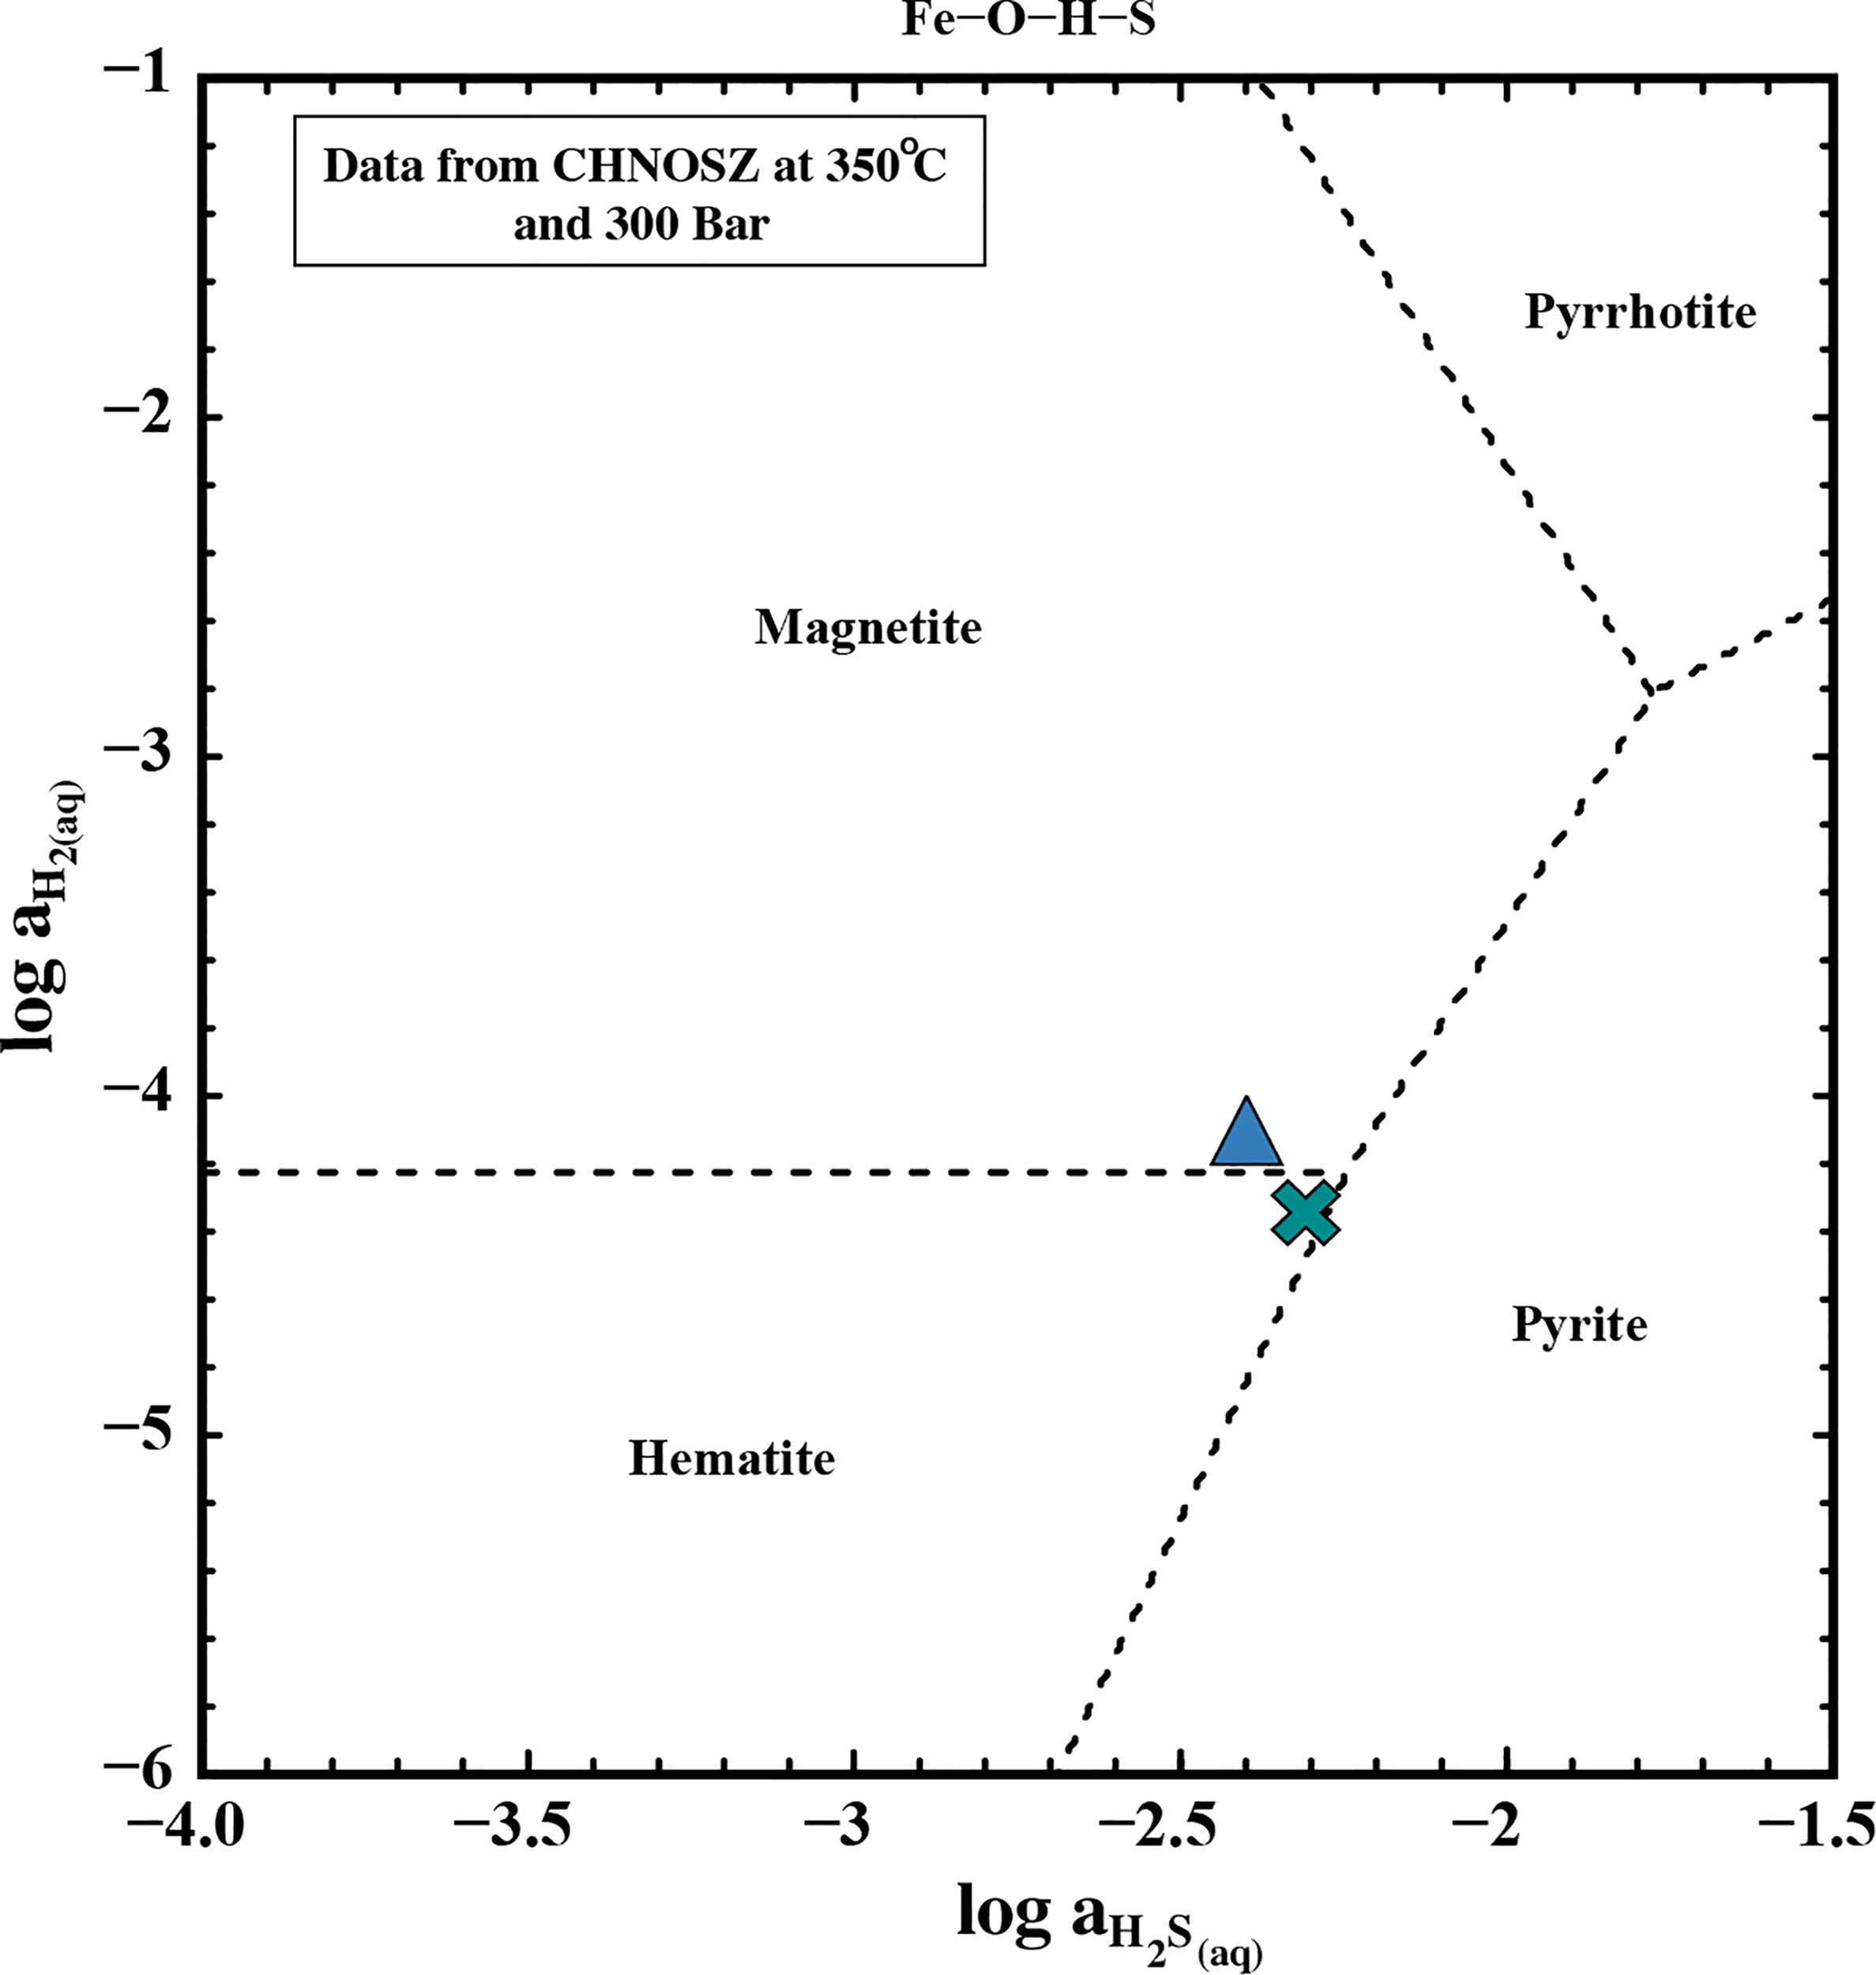
Activity diagram showing the phase relations in a Fe-O-H-S system at 350°C and 300 bar. The data to plot the mineral fields were acquired using CHNOSZ (Dick, 2019). The blue triangle represents endmember data from the fluid at Iced Bun and the green cross represents endmember data from Dog’s Head.
Dissolved Carbon Species
Elevated concentrations of dissolved CO2 relative to seawater in BAB-hosted hydrothermal systems result from magmatic degassing (Takai et al., 2008; Reeves et al., 2011; Seewald et al., 2015; Seewald et al., 2019). However, a small fraction of CO2 in the fluids could also result from leaching of CO2 trapped in rocks as inclusions. Basaltic glasses from the ESR have a CO2 concentration of <200 ppm (Mattey et al., 1984). Assuming a w/r of 2 (calculated for E2-S in this study), complete leaching of CO2 from the rocks would contribute a CO2 concentration of no more than 4 mmol/kg CO2. Therefore, the higher abundances of dissolved CO2 (Figure 4C) at E2-S are primarily a result of magmatic degassing with a minor possible contribution of CO2 leached from basalts.
The carbon isotopic signatures of fluids from E2-S reveal endmember δ13CCO2 values of -4.1 and -5.6‰, which are within the known range of BAB hosted hydrothermal system (Reeves et al., 2011; Seewald et al., 2015; Diehl and Bach, 2020b; Diehl and Bach, 2021). In contrast, basaltic glass at ESR has more negative δ13CCO2 values of -15.0 to -19.9‰ (Mattey et al., 1984). Degassed CO2 from basaltic melts at MOR have more positive δ13CCO2 values, such as those at Lucky Strike hydrothermal system (-3.9 to -5.6‰) that are interpreted to reflect replenishing of the magmatic reservoir (Javoy et al., 1978; Mattey, 1991; Pester et al., 2012; Holloway and Blank, 1994). The high abundance and 13C-enriched nature of CO2 in the fluids at E2-S relative to the basaltic glass at ESR are likely a result of degassing from a magma reservoir that has undergone replenishment.
The endmember CH4 concentrations (25.6 and 48.9 μM) are low relative to other BAB-hosted hydrothermal systems (Reeves et al., 2011; Seewald et al., 2015; Seewald et al., 2019). A variety of processes can contribute towards the CH4 concentrations in hydrothermal systems that can range from abiotic sources, microbial activity and thermogenesis of sediments and/or organic matter (Von Damm et al., 1985b; Welhan, 1988; Seewald and Seyfried, 1990; Seewald et al., 1994; Von Damm et al., 2005; Cruse and Seewald, 2006; Proskurowski et al., 2008; McDermott et al., 2018; Fiebig et al., 2019). Low concentrations of CH4 at E2-S coupled to a relatively 13C-enriched δ13CCH4 isotopic composition of -7.0 and -7.6‰ rule out the influences of sediment thermogenesis and microbial derived CH4 which would be expected to impart more 13C-depleted signatures. Such 13C-enriched δ13CCH4 in combination with 2H-enriched δDCH4 values (here: -98.7 and -99.9‰) have previously been associated to a ‘potentially abiotic source’ of origin (Kelley, 1996; Kelley and Früh-Green, 1999; Wang et al., 2018; McDermott et al., 2018; Klein et al., 2019). However, recent studies indicate that similar values can also be produced as a result of thermogenesis of seawater derived DOM – ‘volcanic thermogenesis’ (Fiebig et al., 2019; Reeves and Fiebig, 2020). As a result, the CH4 abundances at E2-S could be a combination of volcanic thermogenesis with a possible contribution from an abiotic source.
An inverse relationship in CO2 and CH4 concentrations is observed in the fluids at E2-S such that high concentrations of CO2 are matched with low CH4 abundances. High CO2 abundances are found in the most Cl-depleted fluid, while CH4 concentrations are highest in the fluid containing with Cl concentrations. This relationship could result from mixing of CH4- and Cl-bearing hydrothermal fluids and a CO2-enriched and Cl-poor magmatic vapour in the sub-surface of the E2-S vent site.
Magmatic Water Input
Stable oxygen and hydrogen isotopes in water in hydrothermal systems are mainly affected by three factors: i) interaction between the hydrothermal fluid and the host rock and/or sediments in the sub-surface, ii) phase separation and/or iii) contribution of mantle derived magmatic water. Hydration reactions between the hydrothermal fluids and the oceanic igneous crust yields increasing δDH2O and δ18OH2O values with decreasing w/r ratios (Supplementary Figure 4, Bowers and Taylor, 1985; Bowers, 1989; Shanks et al., 1995; Shanks, 2001). The δDH2O values in fluids from E2-S are depleted in 2H relative to seawater (-2.0 to -1.2‰; Supplementary Figure 4). These low δDH2O values are an indication that factors other than w/r interactions affect the H isotopic composition of these fluids.
Experimental work has shown that phase separation can affect the H and O isotope ratios of hydrothermal fluids (Horita et al., 1995; Berndt et al., 1996; Shmulovich et al., 1999; Foustoukos and Seyfried, 2007b). Vapours are slightly elevated in δDH2O values relative to the brine phase (Von Damm et al., 2003). Oxygen isotopes show the opposite fractionation direction: brines have higher δ18OH2O values than vapours (Berndt et al., 1996; Foustoukos and Seyfried, 2007b). The low chlorinity fluids analysed in this study show low δDH2O and high δ18OH2O values (0.4 to 0.6‰), which is opposite of what would be expected for a vapour phase produced by phase separation. An influence of sediments on the fluid chemistry can also explain low δDH2O combined with high δ18OH2O values (Baumberger et al., 2016; Toki et al., 2016). No sediment was observed at E2-S, and therefore sediment-fluid interactions are likely not responsible for the observed δDH2O and δ18OH2O data.
The negative δDH2O (-2.0 to -1.2‰) and positive δ18OH2O values (+0.4 to +0.6‰) in the E2-S hydrothermal vent fluids may indicate that a small fraction of the venting H2O is derived from magmatic degassing. A constricted range of δDH2O (-65.0 ± 20‰) and δ18OH2O (+6 ± 1‰, Taylor, 1979; Ohmoto, 1986) has been estimated to be of mantle derived magmatic water. Whereas water resulting from subduction related volcanic vapours (SRVV) have δDH2O values ranging from -10 to -30‰ and δ18OH2O of +6 to +10‰ (Giggenbach, 1992; Hedenquist and Lowenstern, 1994). Fractionation related to degassing and slab-derived input of water can result in an increase in δDH2O of magmatic waters at convergent margins (Taylor, 1986; Giggenbach, 1992; Hedenquist and Lowenstern, 1994; Taylor, 1997). Linear extrapolation of the fluids at E2-S indicate a possible small input of SRVV component into the fluids (Figure 9). Such an SRVV component input has been previously suggested to affect the PACMANUS hydrothermal vent fluids, Manus spreading centre, Papua New Guinea (Reeves et al., 2011), which show CO2, δ13CCO2, δDH2O and δ18OH2O characteristics similar to those found at E2-S. The most plausible explanation for the δDH2O and δ18OH2O data of the fluids venting at E2-S is that seawater-derived hydrothermal fluids underwent extensive water/rock interactions and mixing with small fractions of magmatic water vapour with a SRVV isotopic signature. Moreover, it appears that the fluid in 2010 did not have any involvement of an SRVV component as no highly negative δDH2O values were reported (Table 3A). These variations seen at E2 in 2019 further provide a temporal evolution into the ESR systems.
Figure 9
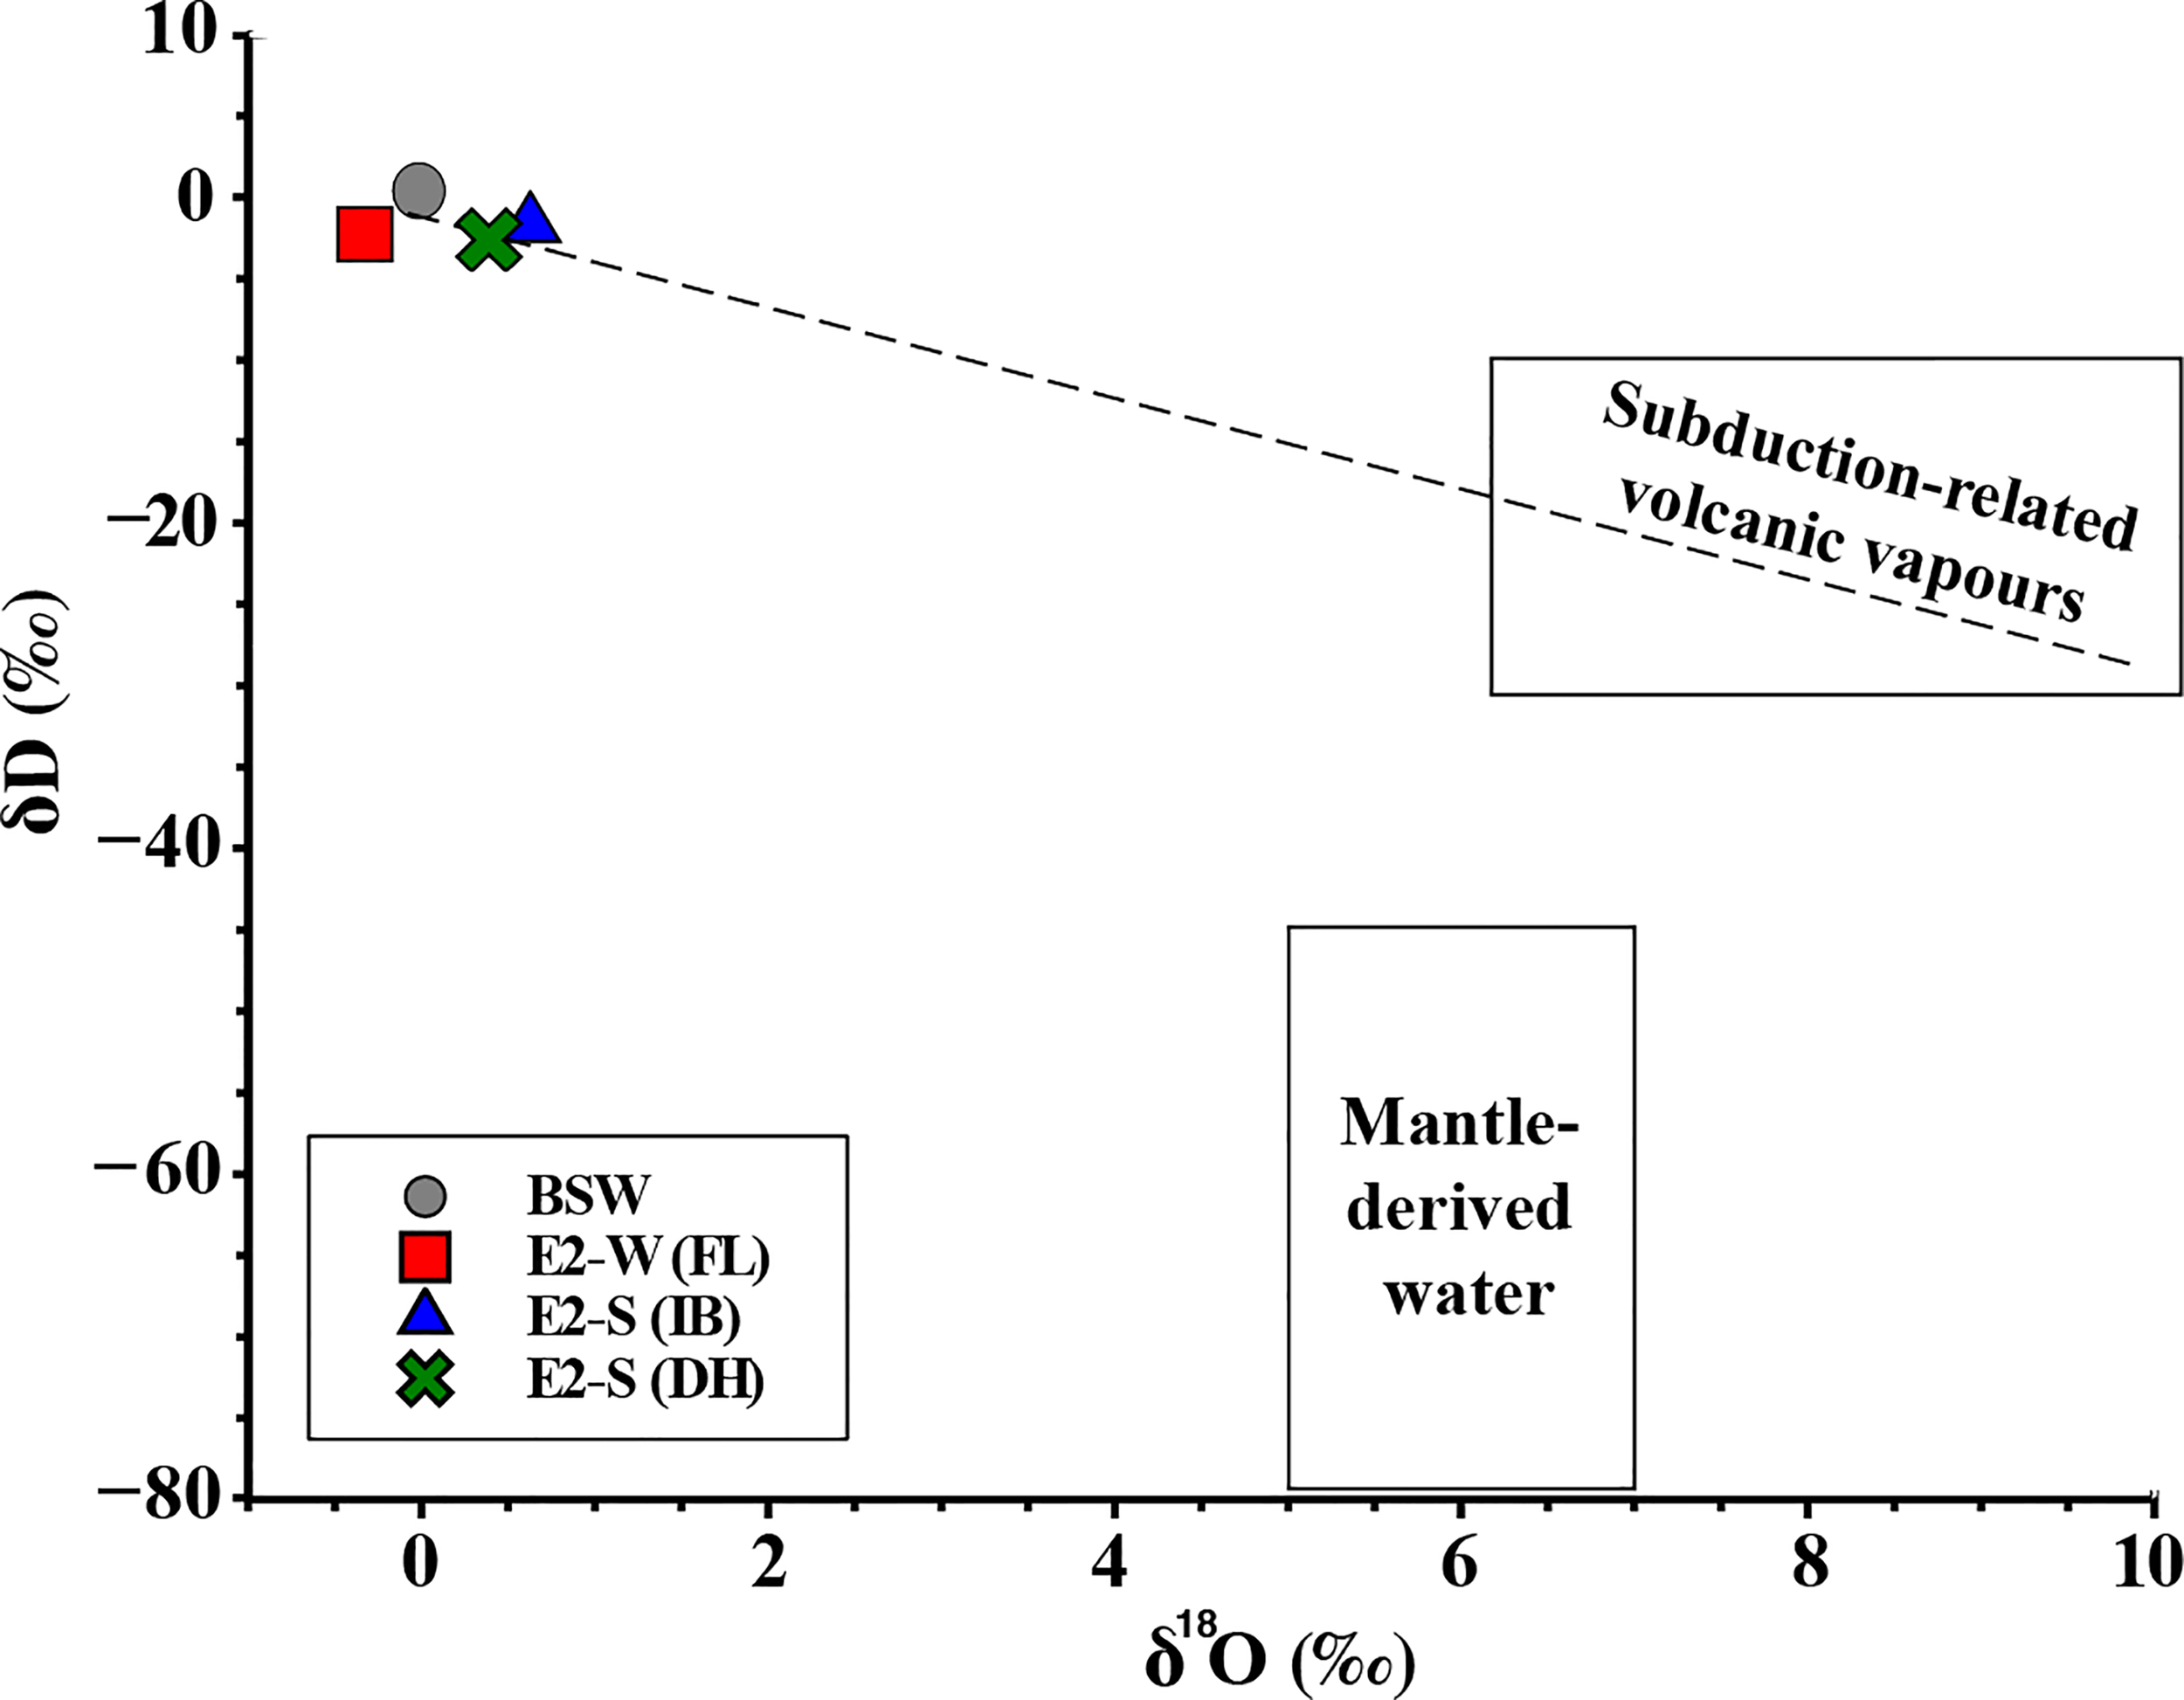
Endmember water isotopic composition for E2-S and measured values for E2-W fluids. The dashed line is the least square regression line for the E2-S fluids and BSW. Data for subduction related volcanic vapours and mantle derived water were taken from Taylor, (1979; Ohmoto (1986) and Giggenbach (1992); Hedenquist and Lowenstern (1994), respectively.
Formation of Fluid at E2-W: Influence of Abiotic and Biotic Processes
The fluids diffusively venting at E2-W are low in temperature (53°C) relative to those emitted at E2-S (320°C, 344°C). Such diffuse low- to moderate-temperature fluids can be a result of either subseafloor mixing of high-temperature fluid with entrained seawater or they can represent conductively heated seawater (Cooper et al., 2000; McDermott et al., 2015b). The Mg depletion (42.6 mM) and K enrichment (13.4 mM) relative to seawater are a clear indication that the fluid at E2-W is a result of a high-temperature fluid that has undergone mixing with seawater prior to venting.
The E2-W hydrothermal system is located about ca. 1.25 km north of the E2-S system. and the two vents investigated at E2-S, Dog’s Head and Iced Bun, are fed by a single source fluid. E2-W is proximal enough to E2-S to be fed by fluids from the same root zone. To investigate the plausibility of the idea that a single deeply sourced fluid supplies all the E2 systems sampled in this study, an average composition of the endmember fluid (EF) for E2-S was computed and mixed with seawater (SW) until the Mg measured for the fluid at E2-W, was met (Supplementary Table 2). The Mg concentrations of the E2-W fluid reveal an EF: SW mixing ratio of 1:5. Enrichments and depletions of dissolved species in this hypothetical E2-W fluid (E2-Wcalc) were then compared with the measured E2-W fluid (Supplementary Table 2). The excellent correspondence of calculated and measured data indicate that the E2-W fluid could indeed result from mixing of E2-S hydrothermal fluid with seawater. Na, Cl, Br, K, Ca and CO2 values estimated are either within the analytical errors of the measurements (K, Ca and CO2) or have seawater-like concentrations (Na, Cl and Br) indicating the fluid may derive from mixing between seawater and the common source fluid that feeds the E2-S vent sites.
Whereas most elements in the fluid at E2-W fit the conservative mixing model, enrichments (SO4 and Sr) and depletions (H2, CH4, H2S, Si and Fe) relative to the E2-Wcalc are observed. Si in hydrothermal systems is believed to behave conservatively and has been extensively used to constrain sub-surface conditions in these systems (Von Damm et al., 1991; Reeves et al., 2011; McDermott et al., 2018). However, depletions in Si relative to calculated E2-Wcalc observed is likely a result of sub-surface precipitation of silica. Janecky and Seyfried (1984) have shown that removal of silica through precipitation is only possible with the fluids that have undergone extensive cooling, which is also likely the case for the fluid at E2-W. Reaction path models further indicate this loss of Si in the modelled fluid because of quartz precipitation (Supplementary Figure 5).
The fluids at E2-W are enriched in SO4 (by 2.27 mM) and Sr (by 1.98 μM) relative to the conservative mixing line. Sr in hydrothermal systems is known to substitute Ca in anhydrite precipitation (Kuhn et al., 2003). Therefore, the observed enrichments in Sr and SO4 can be directly attributed to sub-seafloor dissolution of anhydrite. Endmember extrapolation of SO4 at E2-W reveals a concentration of 13 mM. These strong SO4 excesses have commonly been interpreted as evidence of anhydrite dissolution (e.g., Reeves et al., 2011).
Aerobic sulphide oxidation (equation 1) is another possible source of excess sulphate. Indeed, thermodynamic computations indicate that the major source of catabolic energy in the E2-W subseafloor is aerobic sulphide oxidation (Figure 10). Furthermore, non-sedimented hydrothermal systems are known to host a variety of sulphide oxidizing microorganisms (Dahle et al., 2015; Dahle et al., 2018). Microbial sulphide oxidation could also further help explain the depletion of H2S in the fluid (<0.2 μM, below limit of quantification) compared to the calculated 0.81 mM abundance that would be expected if conservative mixing were occurring. However, even if 0.8 mM of H2S were oxidized to sulphate, the sulphate enrichments of 2.27 mM cannot be fully explained by this process. Moreover, abiotic precipitation of pyrite is another possible sink for H2S. Indeed, depletion of H2S is matched by a loss of >90% of the dissolved Fe, which could point to pyrite precipitation. While Fe is likely only affected by abiotic reactions, SO4 and H2S concentrations at E2-W could be a result of both biotic as well as abiotic reactions taking place in the sub-surface. We suggest that most of the sulphate excess is due to anhydrite dissolution, whereas H2S is lost as consequence of pyrite precipitation as well as aerobic sulphide oxidation.
Figure 10
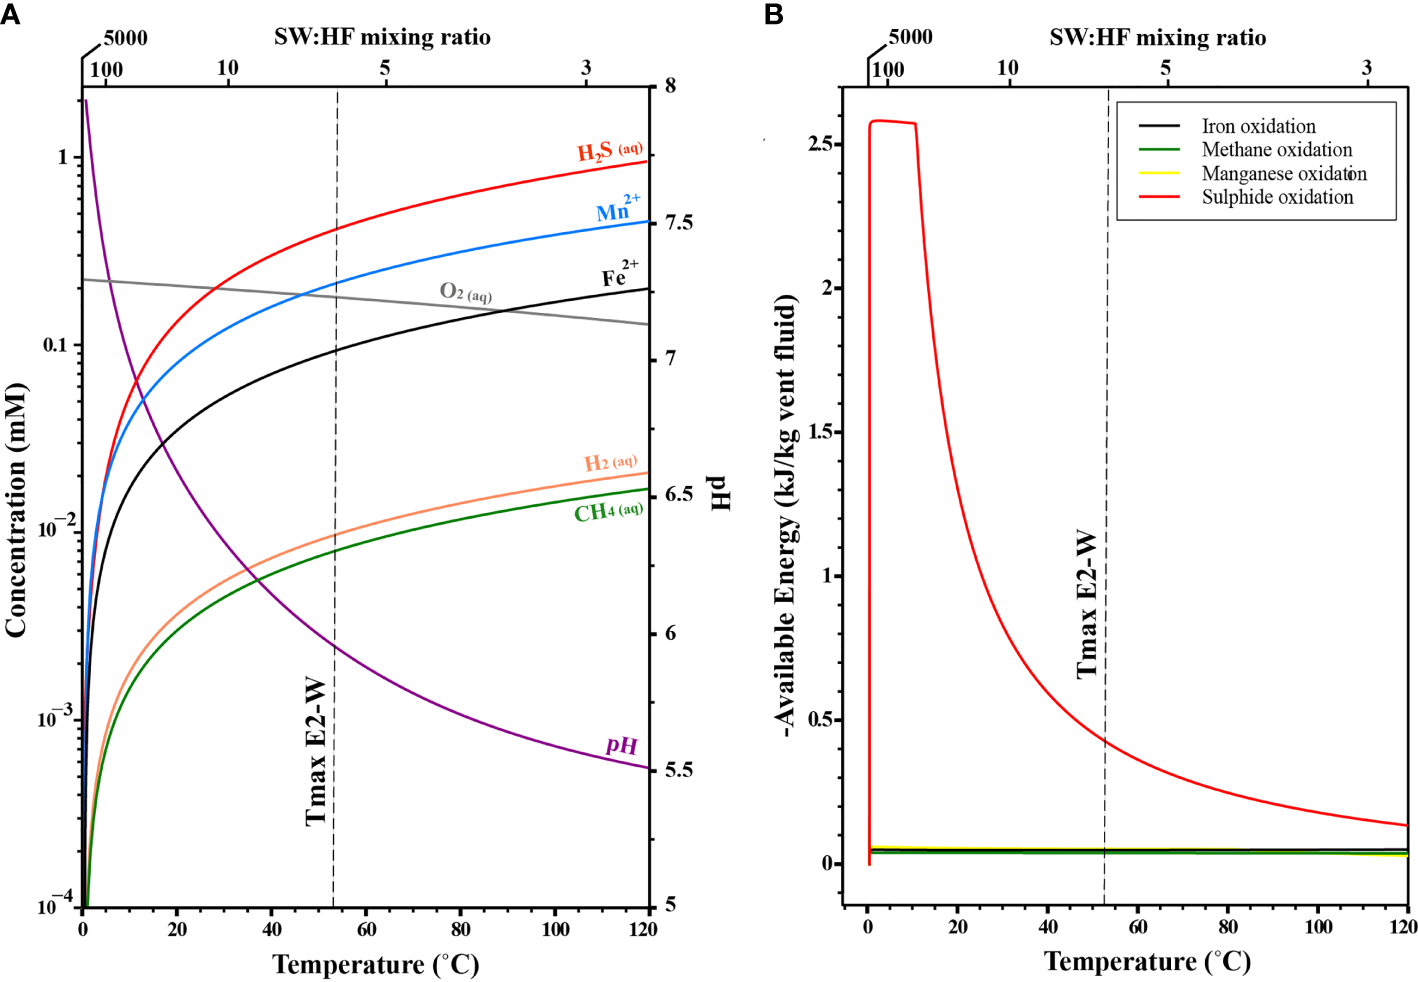
Thermodynamic models for chemical gradient and associated energy landscape at E2. (A) Modelled concentration of various species as a function of temperature and mixing ratios. (B) Modelled energy available for the various reactions as a function of temperature and mixing ratios.
A strong depletion of H2 relative to the conservative mixing line is also observed in the fluids at E2-W (Supplementary Table 2). H2 in mixing zones in hydrothermal systems can be consumed by the reduction of CO2 to formic species (McDermott et al., 2015b). If CH4 was a metabolic product of CO2 reduction, CH4 concentrations in the fluids should be higher than predicted from conservative mixing. This is not the case, as the fluid at E2-W is depleted in CH4 relative to the mixing line by 5.27 μM (Supplementary Table 2). Such a depletion of CH4 at E2-W is likely the result of aerobic oxidation of CH4 (Figure 10). CO2 and H2 concentrations of the fluids are inconclusive in this regard, as a H2 consumption of 8 µM would deplete CO2 only by 2 µM, which is small relative to the 300 µM mismatch between measured and calculated composition (Supplementary Table 2). Moreover, CO2 could be produced by oxidation of CH4 by microorganisms. δ13CCO2 at E2-W is -10.8‰ and is more 13C-depleted than the measured δ13CO2 values at E2-S of -3.7‰ and -4.4‰. If the CO2 at E2-S is a result of magmatic degassing and the entire E2 system is fed by a common root zone, then a range of δ13CCO2 between -4.4‰ to 0.3‰ would be predicted at E2-W if it simply reflects mixing between the E2-S endmember and seawater. The far more 13C-depleted values of δ13CCO2 at E2-W suggest an additional, non-magmatic source of CO2 in the vent fluids. Such more negative values of δ13CCO2 relative to the high-temperature fluid have been previously observed at EPR and have been attributed to methanotrophy (Proskurowski et al., 2008). The idea that methane oxidation may contribute to the dissolved CO2 pool is further supported by catabolic landscape models, which indicate that this aerobic methane oxidation is indeed exergonic at E2-W (Figure 10). It is likely that the δ13CCO2 at E2-W represents a combination of the endmember fluid mixed with seawater with contributions from microbial metabolism.
Implications for Surface and Sub-Surface Ecology at E2
A more general assessment of the catabolic energy landscape at E2 is warranted as endmember fluids at E2-S are enriched in H2S, CH4, CO2, H2, Fe and Mn relative to seawater. The enrichments of these components are a result of high-temperature fluid-rock interaction and magmatic degassing taking place in the sub-surface. A combination of these processes creates an energy gradient representing an appropriate environment for life in the deep-sea at E2 to thrive on.
Just like we established for the E2-W site, this reduced fluid can mix with the oxic seawater entrained in the subseafloor and create an energy rich environment for catabolic reactions to take place (Figure 10A, McCollom and Shock, 1997; Amend et al., 2011). These reactions (Table 2) help support a chemosynthetic ecosystem at E2. The catabolic energy computations we conducted indicate that aerobic sulphide oxidation (ASO) is clearly the dominant energy source at both low and high temperatures (Figure 10B). Between 120 and 60°C (i.e., at low SW: HF mixing ratios) ASO has an energy yield between -0.2 and -0.4 kJ/kg of vent fluid. At temperatures <60°C (i.e., high SW: HF mixing ratios), the models predict a higher energy yield as high as -2.6 kJ/kg of vent fluid.
Aerobic methane oxidation (AMO) is the next most abundant energy source predicted at E2 (Figure 10B). At high temperatures (120 to 60°C), AMeO has an energy yield of ∼ -0.03 kJ/kg of vent fluid, and the energy yield may approach -0.8 kJ/kg for vent fluid at lower temperature. Aerobic iron oxidation (AFeO) and aerobic manganese oxidation (AMnO) account for the lowest energy availability at E2.
The modelling results presented are valid for conservative mixing of hydrothermal fluids with seawater. Conductive cooling, mixing with entrained seawater and related abiotic processes at E2 can greatly affect the composition of the hydrothermal fluids. Studies have shown that abiotic reactions can indeed reduce the energy available for catabolic reactions (McDermott et al., 2020).
The effect of mixing on the energy availability is evident at E2-W, where the fluids have been extensively mixed with BSW prior to venting and have a SW: HF mixing ratio of 5:1. Although the H2S in the fluid was below <0.8 mM, large microbial mats were observed that covered the flange. In contrast, such features were not evident in the E2-S system. Thermodynamic models predict that these H2S-depleted and O2-enriched fluid-seawater mixtures coincide with peak energy availabity to chemosynthetic microbial communities (Figures 10A, B).
ASO and AMO are the dominant energy source for all the E2 vents. Large areas of the E2-S have been known to be inhabited by biota that are dependent on mainly ASO for their metabolic pathways (Rogers et al., 2012). The temperature range, extensive mixing with BSW, fluid chemistry and predicted thermodynamic modelling indicate that the conditions at E2-W are suitable to host a robust sub-surface biosphere.
Summary
The chemical and isotopic compositions of hydrothermal fluids from the E2 segment of the ESR are useful guides to subseafloor processes of phase separation, water-rock reactions, and mixing with entrained seawater, followed by pyrite precipitation. Depletion in Cl in the high-temperature fluid at E2-S is attributed to phase separation. Low Fe/Mn ratios and pyrite precipitation indicate that the fluids have undergone excessive conductive cooling in the sub-seafloor prior to venting. The H2 concentration in the fluids at E2-S are likely a result of equilibration with the hematite-magnetite buffer. The H2S concentrations in the fluid represents mantle derived sulphur contribution that varies from 81 and 69% relative to seawater derived sulphur of about 19 and 31% in these fluids. CH4 formation in the fluid can be either from a volcanic thermogenesis of seawater-sourced DOM and/or leaching of abiotic CH4 from fluid inclusions. The high CO2 abundances and δ13CCO2 and δDH2O values are evidence that the fluid at E2-S is affected by magmatic components.
The lower temperatures and higher water-rock ratios, along with lower REE, higher Na/Cl and lower Ca/Cl, Li/Cl and Cs/Cl ratios in this study compared to the fluids sampled in 2010 indicate that the root zone has undergone changes towards a slightly more altered basement over the past 9 years. The enriched dissolved gases present in the circulating fluid are a result of combination of fluid-rock interactions and magmatic degassing taking place in the sub-surface. Our data hence indicates progressive alteration of basement in the root zone along with evidence for magmatic degassing taking place at E2. Moreover, mixing of magmatic vapour and elevated δ13CCO2 could reflect replenishing of the magma chamber at E2.
The mixed fluid at E2-W and E2-S appear to originate from a single source fluid at depth (>300 bar). The fluid at E2-W shows enrichments in Sr and SO4 that can be attributed to anhydrite dissolution. However, aerobic sulphide oxidation could be an additional source for SO4 and a sink for H2S. Depletion of H2S and Fe observed in the fluid at E2-W is a result of pyrite precipitation taking place in the sub-surface. Depleted Si relative to the conservative mixing models reflect loss of Si due to precipitation of amorphous silica. CH4 depletions in the fluid are likely a result of aerobic methane oxidation. H2 depletions in the fluid can be either a result of microbial respiration in the sub-seafloor (aerobic hydrogen oxidation) or by reactions involving O2 and in the mixing zones. Geochemical reaction path models for E2 indicate that mixing of hydrothermal fluids with entrained seawater can support subseafloor microbial life, with aerobic oxidation of sulphide and methane being potent catabolic energy sources.
Our study provides novel insights into the temporal evolution of the E2-S hydrothermal system that may expand our understanding of hydrothermal systems hosted in BABs. Bioenergetics calculations indicate that H2S is the main provider of catabolic energy followed by CH4, Fe and H2. Our findings at E2-W further suggest that these energy sources may indeed be utilized by subseafloor microbial communities.
Funding
The expedition was funded by German Federal Ministry of Education and Research (grant number 03G0880A) and by the German Research Foundation (Deutsche Forschungsgemeinschaft, DFG) within the Cluster of Excellence (EXC-2077, project number 390741603 “The Ocean Floor –Earth’s Uncharted Interface”) at MARUM – Center for Marine and Environmental Sciences, University of Bremen. This work was further supported by the Trond Mohn Foundation and University of Bergen through Centre for Deep Sea research (grant #TMS2020TMT13).
Publisher’s Note
All claims expressed in this article are solely those of the authors and do not necessarily represent those of their affiliated organizations, or those of the publisher, the editors and the reviewers. Any product that may be evaluated in this article, or claim that may be made by its manufacturer, is not guaranteed or endorsed by the publisher.
Statements
Data availability statement
The original contributions presented in the study are included in the article/Supplementary Material. Further inquiries can be directed to the corresponding author.
Author contributions
SP and AD collected the samples during the cruise in 2019. GB led the expedition. JM provided the samplers. WB, AD, and SP designed research. SP, AD, TP, LK, and HS analysed the samples. SP, AD, and WB wrote the paper, but all authors contributed to writing. All authors contributed to the article and approved the submitted version.
Acknowledgments
We would like to thank the captain and the crew of RV Polarstern and the ROV team of MARUM-Quest4000m for their support in collection of the samples during PS119. Janice Malnati (Faculty of Geoscience, Bremen) is thanked for her assistance with CH4 and CO2 isotope analysis. Miriam Römer and Paul Wintersteller are thanked for the bathymetric maps. The study was undertaken under permit RAP 2018/064 issued by the South Georgia and South Sandwich Government.
Conflict of interest
The authors declare that the research was conducted in the absence of any commercial or financial relationships that could be construed as a potential conflict of interest.
Supplementary material
The Supplementary Material for this article can be found online at: https://www.frontiersin.org/articles/10.3389/fmars.2022.765648/full#supplementary-material
References
1
Amend J. P. McCollom T. M. Hentscher M. Bach W. (2011). Catabolic and Anabolic Energy for Chemolithoautotrophs in Deep-Sea Hydrothermal Systems Hosted in Different Rock Types. Geochim. Cosmochim. Acta75 (19), 5736–5748. doi: 10.1016/j.gca.2011.07.041
2
Atkinson A. B. Jr (2002). A Model for the PTX Properties of H2O-NaCl (Doctoral dissertation, Virginia Tech). MSc. Thesis. Virgin. Tech, 133pp
3
Baker T. Lang J. R. (2001). Fluid Inclusion Characteristics of Intrusion-Related Gold Mineralization, Tombstone-Tungsten Magmatic Belt, Yukon Territory, Canada. Mineral. Deposit.36 (6), 563–582. doi: 10.1007/s001260100189
4
Baumberger T. Früh-Green G. L. Thorseth I. H. Lilley M. D. Hamelin C. Bernasconi S. M. et al . (2016). Fluid Composition of the Sediment-Influenced Loki’s Castle Vent Field at the Ultra-Slow Spreading Arctic Mid-Ocean Ridge. Geochim. Cosmochim. Acta187, 156–178. doi: 10.1016/j.gca.2016.05.017
5
Beermann O. Garbe-Schönberg D. Bach W. Holzheid A. (2017). Time-Resolved Interaction of Seawater With Gabbro: An Experimental Study of Rare-Earth Element Behavior Up to 475 °C, 100 Mpa. Geochim. Cosmochim. Acta197, 167–192. doi: 10.1016/j.gca.2016.10.016
6
Berndt M. E. Seal R. R. Shanks W. C. Seyfried W. E. (1996). Hydrogen Isotope Systematics of Phase Separation in Submarine Hydrothermal Systems: Experimental Calibration and Theoretical Models. Geochim. Cosmochim. Acta60 (9), 1595–1604. doi: 10.1016/0016-7037(96)00033-6
7
Berndt M. E. Seyfried W. E. (1990). Boron, Bromine, and Other Trace Elements as Clues to the Fate of Chlorine in Mid-Ocean Ridge Vent Fluids. Geochim. Cosmochim. Acta54 (8), 2235–2245. doi: 10.1016/0016-7037(90)90048-P
8
Berndt M. E. Seyfried W. E. (1993). Calcium and Sodium Exchange During Hydrothermal Alteration of Calcic Plagioclase at 400°C and 400 Bars. Geochim. Cosmochim. Acta57 (18), 4445–4451. doi: 10.1016/0016-7037(93)90494-H
9
Berndt M. E. Seyfried W. E. Janecky D. R. (1989). Plagioclase and Epidote Buffering of Cation Ratios in Mid-Ocean Ridge Hydrothermal Fluids: Experimental Results in and Near the Supercritical Region. Geochim. Cosmochim. Acta53 (9), 2283–2300. doi: 10.1016/0016-7037(89)90351-7
10
Bieseler B. Diehl A. Jöns N. Lucassen F. Bach W. (2018). Constraints on Cooling of the Lower Ocean Crust From Epidote Veins in the Wadi Gideah Section, Oman Ophiolite. Geochem. Geophys. Geosyst.19 (11), 4195–4217. doi: 10.1029/2018GC007679
11
Bischoff J. L. (1991). Densities of Liquids and Vapors in Boiling NaCl-H2O Solutions: A Pvtx Summary From 300° to 500°C. Am. J. Sci. 291(4), pp.309–338. doi: 10.2475/ajs.291.4.309
12
Bischoff J. L. Pitzer K. S. (1989). Liquid-Vapor Relations for the System NaCl-H2O: Summary of the P-T- X Surface From 300° to 500°C. Am. J. Sci.289(3), pp.217–248. doi: 10.2475/ajs.289.3.217
13
Bischoff J. L. Rosenbauer R. J. (1985). An Empirical Equation of State for Hydrothermal Seawater (3.2 Percent Nacl). Am. J. Sci.285 (8), 725–763. doi: 10.2475/ajs.285.8.725
14
Bodnar R. J. Samson I. Anderson A. Marshall D. (2003). Reequilibration of Fluid Inclusions.” Fluid Inclusions: Analysis and Interpretation. 32, 213–230
15
Bohrmann G. (2019). The Expedition PS119 of the Research Vessel POLARSTERN to the Eastern Scotia in 2019. Reports on Polar and Marine Research, Alfred-Wegener-Institut, Helmholtz-Zentrum für Polar- und Meeresforschung, Bremerhaven, Germany, 736. doi: 10.2312/BzPM_0736_2019
16
Bowers T. S. (1989). Stable Isotope Signatures of Water-Rock Interaction in Mid-Ocean Ridge Hydrothermal Systems: Sulfur, Oxygen, and Hydrogen. J. Geophys. Res.94 (B5), 5775–5786. doi: 10.1029/JB094iB05p05775
17
Bowers T. S. Taylor H. P. (1985). An Integrated Chemical and Stable-Isotope Model of the Origin of Midocean Ridge Hot Spring Systems. J. Geophys. Res: Solid Earth90(B14),pp.12583–12606. doi: 10.1029/jb090ib14p12583
18
Bruguier N. J. Livermore R. A. (2001). Enhanced Magma Supply at the Southern East Scotia Ridge: Evidence for Mantle Flow Around the Subducting Slab? Earth Planet. Sci. Lett.191 (1–2), 129–144. doi: 10.1016/S0012-821X(01)00408-3
19
Butterfield D. A. Nakamura K. I. Takano B. Lilley M. D. Lupton J. E. Resing J. A. et al . (2011). High SO2 Flux, Sulfur Accumulation, and Gas Fractionation at an Erupting Submarine Volcano. Geology39 (9), 803–806. doi: 10.1130/G31901.1
20
Cline J. D. (1969). Spectrophotometric Determination of Hydrogen Sulfide in Natural Waters. Limnol. Oceanog.14 (3), 454–458. doi: 10.4319/lo.1969.14.3.0454
21
Cole C. S. James R. H. Connelly D. P. Hathorne E. C. (2014). Rare Earth Elements as Indicators of Hydrothermal Processes Within the East Scotia Subduction Zone System. Geochim. Cosmochim. Acta140, 20–38. doi: 10.1016/j.gca.2014.05.018
22
Cooper M. J. Elderfield H. Schultz A. (2000). Diffuse Hydrothermal Fluids From Lucky Strike Hydrothermal Vent Field: Evidence for a Shallow Conductively Heated System. J. Geophys. Res.: Solid. Earth105 (B8), 19369–19375. doi: 10.1029/2000jb900138
23
Craddock P. R. Bach W. Seewald J. S. Rouxel O. J. Reeves E. Tivey M. K. (2010). Rare Earth Element Abundances in Hydrothermal Fluids From the Manus Basin, Papua New Guinea: Indicators of Sub-Seafloor Hydrothermal Processes in Back-Arc Basins. Geochim. Cosmochim. Acta74 (19), 5494–5513. doi: 10.1016/j.gca.2010.07.003
24
Craig H. (1970). Abyssal Carbon 13 in the South Pacific. J. Geophys. Res.75 (3), 691–695. doi: 10.1029/jc075i003p00691
25
Cruse A. M. Seewald J. S. (2006). Geochemistry of Low-Molecular Weight Hydrocarbons in Hydrothermal Fluids From Middle Valley, Northern Juan De Fuca Ridge. Geochim. Cosmochim. Acta70 (8), 2073–2092. doi: 10.1016/j.gca.2006.01.015
26
Dahle H. Økland I. Thorseth I. H. Pederesen R. B. Steen I. H. (2015). Energy Landscapes Shape Microbial Communities in Hydrothermal Systems on the Arctic Mid-Ocean Ridge. ISME. J.9 (7), 1593–1606. doi: 10.1038/ismej.2014.247
27
Dahle H. Le Moine Bauer S Baumberger T. Stokke R. Pedersen R. B. Thorseth I. H. et al . (2018). Energy Landscapes in Hydrothermal Chimneys Shape Distributions of Primary Producers. Front. Microbiol.9. doi: 10.3389/fmicb.2018.01570
28
De Ronde C. E. Jambor J. L. (1995). Fluid Chemistry and Isotopic Characteristics of Seafloor Hydrothermal Systems and Associated Vms Deposits: Potential for Magmatic Contributions. Magma. Fluid. Ore. Deposit.23 (1), 479–509.
29
Dick J. M. (2019). Chnosz: Thermodynamic Calculations and Diagrams for Geochemistry. Front. Earth Sci.7, 150. doi: 10.3389/feart.2019.00180
30
Diehl A. Bach W. (2020b). MARHYS (Marine HYdrothermal Solutions) Database: A Global Compilation of Marine Hydrothermal Vent Fluid, End Member and Seawater Compositions. Geochem. Geophys. Geosyst. 21(12), p.e2020GC009385. doi: 10.1029/2020GC009385
31
Diehl A. Bach W. (2021). Marhys Database 2.0. Pangaea. doi 10.1594/PANGAEA.935649.
32
Diehl A. De Ronde C. E. J. Bach W. (2020a). Subcritical phase separation and occurrence of deep-seated brines at the NW Caldera vent field, Brothers volcano: evidence from fluid inclusions in Hydrothermal Precipitates. Geofluids. doi: 10.1155/2020/8868259
33
Douville E. Bienvenu P. Charlou J. P. Donval J. P. Fouquet Y. Appriou P. et al . (1999). Yttrium and Rare Earth Elements in Fluids From Various Deep-Sea Hydrothermal Systems - Evidence for Heat Extraction From Magma Chambers or Cracking Fronts? Geochim. Cosmochim. Acta63 (5), 627–643. doi: 10.1016/S0016-7037(99)00024-1
34
Douville E. Charlou J. L. Oelkers E. H. Bienvenu P. Jove Colon C. F. Donval J. P. et al . (2002). The Rainbow Vent Fluids (36°14′N, MAR): The Influence of Ultramafic Rocks and Phase Separation on Trace Metal Content in Mid-Atlantic Ridge Hydrothermal Fluids. Chem. Geolog.184 (1–2), 37–48. doi: 10.1016/S0009-2541(01)00351-5
35
Driesner T. (2007). The System H2O-NaCl. Part II: Correlations for Molar Volume, Enthalpy, and Isobaric Heat Capacity From 0 to 1000°C, 1 to 5000 Bar, and 0 to 1 Xnacl. Geochim. Cosmochim. Acta71 (20), 4902–4919. doi: 10.1016/j.gca.2007.05.026
36
Driesner T. Heinrich C. A. (2007). The System H2O-NaCl. Part I: Correlation Formulae for Phase Relations in Temperature-Pressure-Composition Space From 0 to 1000 °C, 0 to 5000 Bar, and 0 to 1 XNaCl. Geochim. Cosmochim. Acta71 (20), 4880–4901. doi: 10.1016/j.gca.2006.01.033
37
Evans W. C. White L. D. Rapp J. B. (1988). Geochemistry of Some Gases in Hydrothermal Fluids From the Southern Juan De Fuca Ridge. J. Geophys. Res93(B12), pp.15305–15313. doi: 10.1029/jb093ib12p15305
38
Fiebig J. Stefánsson A. Ricci A. Tassi F. Viveiros F. Silva C. et al . (2019). Abiogenesis Not Required to Explain the Origin of Volcanic-Hydrothermal Hydrocarbons. Geochem. Perspect. Lett.11, 23–27. doi: 10.7185/geochemlet.1920
39
Foustoukos D. I. Seyfried W. E. (2007a). Trace Element Partitioning Between Vapor, Brine and Halite Under Extreme Phase Separation Conditions. Geochim. Cosmochim. Acta71 (8), 2056–2071. doi: 10.1016/j.gca.2007.01.024
40
Foustoukos D. I. Seyfried W. E. (2007b). Fluid Phase Separation Processes in Submarine Hydrothermal Systems. Rev. Mineral. Geochem.65, 213–239. doi: 10.2138/rmg.2007.65.7
41
Foustoukos D. I. Seyfried W. E. (2007c). Quartz Solubility in the Two-Phase and Critical Region of the NaCl-KCl-H2O System: Implications for Submarine Hydrothermal Vent Systems at 9°50′N East Pacific Rise. Geochim. Cosmochim. Acta71 (1), 186–201. doi: 10.1016/j.gca.2006.08.038
42
Fretzdorff S. Livermore R. A. Devey C. W. Leat P. T. Stoffers P. (2002). Petrogenesis of the Back-Arc East Scotia Ridge, South Atlantic Ocean. J. Petrolog.43 (8), 1435–1467. doi: 10.1093/petrology/43.8.1435
43
Gallant R. M. Von Damm K. L. (2006). Geochemical Controls on Hydrothermal Fluids From the Kairei and Edmond Vent Fields, 23°-25°S, Central Indian Ridge. Geochem. Geophys. Geosyst.7 (6), 1–24. doi: 10.1029/2005GC001067
44
German C. R. Livermore R. A. Baker E. T. Bruguier N. I. Connelly D. P. Cunningham A. P. et al . (2000). Hydrothermal Activity on the East Scotia Ridge: An Isolated High-Latitude Back-Ark Spreading Centre. Earth Planet. Sci. Lett., 184(1) 241–250. doi: 10.1016/S0012-821X(00)00319-8
45
Giggenbach W. F. (1992). Isotopic Shifts in Waters From Geothermal and Volcanic Systems Along Convergent Plate Boundaries and Their Origin. Earth Planet. Sci. Lett.113 (4), 495–510. doi: 10.1016/0012-821X(92)90127-H
46
Haar L. (1984). NBS/NRC Steam Tables. CRC Press
47
Haar V. L. Gallagher J. S. Kell G. S. (1985). NBS/NRC Steam Tables. Chem. Ing. Tech.57, 812–812. doi: 10.1002/cite.330570931
48
Hedenquist J. W. Lowenstern J. B. (1994). The Role of Magmas in the Formation of Hydrothermal Ore Deposits. Nature370 (August), 519–527. doi: 10.1038/370519a0
49
Herrera S. Watanabe H. Shank T. M. (2015). Evolutionary and Biogeographical Patterns of Barnacles From Deep-Sea Hydrothermal Vents. Mol. Ecol.24 (3), 673–689. doi: 10.1111/mec.13054
50
Holloway J. R. Blank J. G. (1994). “Application of Experimental Results to C-O-H Species in Natural Melts,” in Rev. Mineral Geochem. 30 (1), 187–230
51
Horita J. Cole D. R. Wesolowski D. J. (1995). The Activity-Composition Relationship of Oxygen and Hydrogen Isotopes in Aqueous Salt Solutions: Iii. Vapor-Liquid Water Equilibration of NaCl Solutions to 350°C. Geochim. Cosmochim. Acta59 (6), 1139–1151. doi: 10.1016/0016-7037(95)00031-T
52
Ishibashi J. Urabe T. (1995). Hydrothermal Activity Related to Arc-Backarc Magmatism in the Western Pacific. In: Backarc Basins. Boston, MA: Springer, 451–495. doi: 10.1007/978-1-4615-1843-3_13
53
James R. H. Green D. R. H. Stock M. J. Alker B. J. Banerjee N. R. Cole C. et al . (2014). Composition of Hydrothermal Fluids and Mineralogy of Associated Chimney Material on the East Scotia Ridge Back-Arc Spreading Centre. Geochim. Cosmochim. Acta139, 47–71. doi: 10.1016/j.gca.2014.04.024
54
Janecky D. R. Seyfried W. E. (1984). Formation of Massive Sulfide Deposits on Oceanic Ridge Crests: Incremental Reaction Models for Mixing Between Hydrothermal Solutions and Seawater. Geochim. Cosmochim. Acta48 (12), 2723–2738. doi: 10.1016/0016-7037(84)90319-3
55
Javoy M. Pineau F. Iiyama I. (1978). Experimental Determination of the Isotopic Fractionation Between Gaseous CO2 and Carbon Dissolved in Tholeiitic Magma. Contrib. Mineral. Petrol.67 (1), 35–39. doi: 10.1007/BF00371631
56
Johnson J. W. Oelkers E. H. Helgeson H. C. (1992). Supcrt92: A Software Package for Calculating the Standard Molal Thermodynamic Properties of Minerals, Gases, Aqueous Species, and Reactions From 1 to 5000 Bar and 0 to 1000°C. Comput. Geosci.Vol. 18 (7), pp.899–947. doi: 10.1016/0098-3004(92)90029-Q
57
Kelley D. S. (1996). Methane-Rich Fluids in the Oceanic Crust. J. Geophys. Res. B.: Solid. Earth101 (2), 2943–2962. doi: 10.1029/95JB02252
58
Kelley D. S. Früh-Green G. L. (1999). Abiogenic Methane in Deep-Seated Mid-Ocean Ridge Environments: Insights From Stable Isotope Analyses. J. Geophys. Res.: Solid. Earth104 (B5), 10439–10460. doi: 10.1029/1999jb900058
59
Klein F. Grozeva N. G. Seewald J. S. (2019). Abiotic Methane Synthesis and Serpentinization in Olivine-Hosted Fluid Inclusions. Proc. Natl. Acad. Sci. Unite. States America116 (36), 17666–17672. doi: 10.1073/pnas.1907871116
60
Kuhn T. Herzig P. M. Hannington M. D. Garbe-Schönberg D. Stoffers P. (2003). Origin of Fluids and Anhydrite Precipitation in the Sediment-Hosted Grimsey Hydrothermal Field North of Iceland. Chem. Geolog.202 (1–2), 5–21. doi: 10.1016/S0009-2541(03)00207-9
61
Larter R. D. Vanneste L. E. Morris P. Smythe D. K. (2003). Structure and Tectonic Evolution of the South Sandwich Arc. Geolog. Soc. Special. Publ.219 (1), 255–284. doi: 10.1144/GSL.SP.2003.219.01.13
62
Leat P. T. Fretwell P. T. Tate A. J. Larter R. D. Martin T. J. Smellie J. L et al (2016). Bathymetry and Geological Setting of the South Sandwich Islands Volcanic Arc.. Antarct. Sci28 (4), 293–303
63
Leat P. T. Livermore R. A. Millar I. L. Pearce J. A. (2000). Magma Supply in Back-Arc Spreading. J. Petrolog.41 (6), 845–866. doi: 10.1093/petrology/41.6.845
64
Leat P. T. Pearce J. A. Barker P. F. Millar I. L. Barry T. L. Larter R. D. (2004). Magma Genesis and Mantle Flow at a Subducting Slab Edge : The South Sandwich Arc-Basin System. Earth Planet. Sci. Lett.227, 17–35. doi: 10.1016/j.epsl.2004.08.016
65
Linse K. Copley J. T. Connelly D. P. Larter R. D. Pearce D. A. Polunin N. V. C. et al . (2019). Fauna of the Kemp Caldera and Its Upper Bathyal Hydrothermal Vents (South Sandwich Arc, Antarctica). R. Soc. Open Sci.6, (11). doi: 10.1098/rsos.191501
66
Livermore R. Cunningham A. Vanneste L. Larter R. (1997). Subduction Influence on Magma Supply at the East Scotia Ridge. Earth Planet. Sci. Lett.150 (3–4), 261–275. doi: 10.1016/s0012-821x(97)00074-5
67
Lupton J. Butterfield D. Lilley M. Evans L. Nakamura K. I. Chadwick W. et al . (2006). Submarine Venting of Liquid Carbon Dioxide on a Mariana Arc Volcano. Geochem. Geophys. Geosyst.7, (8). doi: 10.1029/2005GC001152
68
Mattey D. P. (1991). Carbon Dioxide Solubility and Carbon Isotope Fractionation in Basaltic Melt. Geochim. Cosmochim. Acta55 (11), 3467–3473. doi: 10.1016/0016-7037(91)90508-3
69
Mattey D. P. Carr R. H. Wright I. P. Pillinger C. T. (1984). Carbon Isotopes in Submarine Basalts. Earth Planet. Sci. Lett.70 (2), 196–206. doi: 10.1016/0012-821X(84)90005-0
70
McCollom T. M. (2007). Geochemical Constraints on Sources of Metabolic Energy for Chemolithoautotrophy in Ultramafic-Hosted Deep-Sea Hydrothermal Systems. Astrobiology7 (6), 933–950. doi: 10.1089/ast.2006.0119
71
McCollom T. M. Shock E. L. (1997). Geochemical Constraints on Chemolithoautotrophic Metabolism by Microorganisms in Seafloor Hydrothermal Systems. Geochim. Cosmochim. Acta61 (20), 4375–4391. doi: 10.1016/S0016-7037(97)00241-X
72
McDermott J. M. Ono S. Tivey M. K. Seewald J. S. Shanks W. C. Solow A. R. (2015a). Identification of Sulfur Sources and Isotopic Equilibria in Submarine Hot-Springs Using Multiple Sulfur Isotopes. Geochim. Cosmochim. Acta160, 169–187. doi: 10.1016/j.gca.2015.02.016
73
McDermott J. M. Seewald J. S. German C. R. Sylva S. P. (2015b). Pathways for Abiotic Organic Synthesis at Submarine Hydrothermal Fields. Proc. Natl. Acad. Sci. Unite. States America112 (25), 7668–7672. doi: 10.1073/pnas.1506295112
74
McDermott J. M. Sylva S. P. Ono S. German C. R. Seewald J. S. (2018). Geochemistry of Fluids From Earth’s Deepest Ridge-Crest Hot-Springs: Piccard Hydrothermal Field, Mid-Cayman Rise. Geochim. Cosmochim. Acta228, 95–118. doi: 10.1016/j.gca.2018.01.021
75
McDermott J. M. Sylva S. P. Ono S. German C. R. Seewald J. S. (2020). Abiotic Redox Reactions in Hydrothermal Mixing Zones: Decreased Energy Availability for the Subsurface Biosphere. Proc. Natl. Acad. Sci., 117 (34), 20453–20461. doi: 10.1073/pnas.2003108117
76
Merlivat L. Pineau F. Javoy M. (1987). Hydrothermal Vent Waters at 13°N on the East Pacific Rise: Isotopic Composition and Gas Concentration. Earth Planet. Sci. Lett.84 (1), 100–108. doi: 10.1016/0012-821X(87)90180-4
77
Mottl M. J. Holland H. D. (1978). Chemical Exchange During Hydrothermal Alteration of Basalt by Seawater-I. Experimental Results for Major and Minor Components of Seawater. Geochim. Cosmochim. Acta42 (8), 1103–1115. doi: 10.1016/0016-7037(78)90107-2
78
Mottl M. J. Seewald J. S. Wheat C. G. Tivey M. K. Michael P. J. Proskurowski G. et al . (2011). Chemistry of Hot Springs Along the Eastern Lau Spreading Center. Geochim. Cosmochim. Acta75 (4), 1013–1038. doi: 10.1016/j.gca.2010.12.008
79
Ohmoto H. (1986). "Stable Isotope Geochemistry of Ore Deposits.” in Stable Isotopes in High Temperature Geological Processes De Gruyter. 491–560. doi: 10.1515/9781501508936-019
80
Pape T. Bünz S. Hong W. L. Torres M. E. Riedel M. Panieri G. et al . (2020a). Origin and Transformation of Light Hydrocarbons Ascending at an Active Pockmark on Vestnesa Ridge, Arctic Ocean. J. Geophys. Res.: Solid. Earth125, (1). doi: 10.1029/2018JB016679
81
Pape T. Haeckel M. Riedel M. Kölling M. Schmidt M. Wallmann K. et al . (2020b). Formation Pathways of Light Hydrocarbons in Deep Sediments of the Danube Deep-Sea Fan, Western Black Sea. Mar. Petrol. Geolog.122, 104627. doi: 10.1016/j.marpetgeo.2020.104627
82
Pester N. J. Reeves E. P. Rough M. E. Ding K. Seewald J. S. Seyfried W. E. (2012). Subseafloor Phase Equilibria in High-Temperature Hydrothermal Fluids of the Lucky Strike Seamount (Mid-Atlantic Ridge, 37°17’n). Geochim. Cosmochim. Acta90, 303–322. doi: 10.1016/j.gca.2012.05.018
83
Peter J.M. Scott S. D. (1988). Mineralogy, Composition, and Fluid Inclusion Microthermometry of Sea-Floor Hydrothermal Deposits in the Southern Trough of Guaymas Basin, Gulf of California. Can. Mineral. 26(3)567–587
84
Proskurowski G. Lilley M. D. Olson E. J. (2008). Stable Isotopic Evidence in Support of Active Microbial Methane Cycling in Low-Temperature Diffuse Flow Vents at 9°50′N East Pacific Rise. Geochim. Cosmochim. Acta72 (8), 2005–2023. doi: 10.1016/j.gca.2008.01.025
85
Rees C. E. Jenkins W. J. Monster J. (1978). The Sulphur Isotopic Composition. Geochim. Cosmochim. Acta42 (65), 377–381. doi: 10.1016/0016-7037(78)90268-5
86
Reeves E. P. Fiebig J. (2020). Abiotic Synthesis of Methane and Organic Compounds in Earth’s Lithosphere. Elements: An Int. Magaz of Mineral., Geochem., and Petrol.. 16(1), pp.25–31.doi: 10.2138/gselements.16.1.25
87
Reeves E. P. Seewald J. S. Saccocia P. Bach W. Craddock P. Shanks W. C. et al . (2011). Geochemistry of Hydrothermal Fluids From the PACMANUS, Northeast Pual and Vienna Woods Hydrothermal Fields, Manus Basin, Papua New Guinea. Geochim. Cosmochim. Acta75 (4), 1088–1123. doi: 10.1016/j.gca.2010.11.008
88
Roedder E. (1984). “Introduction to Fluid Inclusions.” Reviews in Mineralogy, Volume 12: Fluid Inclusions (Mineralogical Society of America).
89
Rogers A. D. Tyler P. A. Connelly D. P. Copley J. T. James R. Larter R. D. et al . (2012). The Discovery of New Deep-Sea Hydrothermal Vent Communities in the Southern Ocean and Implications for Biogeography. PloS Biol.10 (1),e1001234. doi: 10.1371/journal.pbio.1001234
90
Ryan J. G. Langmuir C. H. (1987). The Systematics of Lithium Abundances in Young Volcanic Rocks. Geochim. Cosmochim. Acta51 (6), 1727–1741. doi: 10.1016/0016-7037(87)90351-6
91
Sakai H. Des Marais D. J. Ueda A. Moore J. G. (1984). Concentrations and Isotope Ratios of Carbon, Nitrogen and Sulfur in Ocean-Floor Basalts. Geochim. Cosmochim. Acta48 (12), 2433–2441. doi: 10.1016/0016-7037(84)90295-3
92
Scheuermann P. P. Tutolo B. M. Seyfried W. E. (2019). Anhydrite Solubility in Low-Density Hydrothermal Fluids: Experimental Measurements and Thermodynamic Calculations. Chem. Geolog.524 (June), 184–195. doi: 10.1016/j.chemgeo.2019.06.018
93
Schmidt K. Garbe-Schönberg D. Bau M. Koschinsky A. (2010). Rare Earth Element Distribution in <400°C Hot Hydrothermal Fluids From 5°S, MAR: The Role of Anhydrite in Controlling Highly Variable Distribution Patterns. Geochim. Cosmochim. Acta74 (14), 4058–4077. doi: 10.1016/j.gca.2010.04.007
94
Seewald J. S. Doherty K. W. Hammar T. R. Liberatore S. P. (2002). Instruments and Methods A New Gas-Tight Isobaric Sampler for Hydrothermal Fluids. Deep-Sea. Res. I.49, 189–196. doi: 10.1016/S0967-0637(01)00046-2
95
Seewald J. S. Reeves E. P. Bach W. Saccocia P. J. Craddock P. R. Shanks W. C. et al . (2015). Submarine Venting of Magmatic Volatiles in the Eastern Manus Basin, Papua New Guinea. Geochim. Cosmochim. Acta163, 178–199. doi: 10.1016/j.gca.2015.04.023
96
Seewald J. S. Reeves E. P. Bach W. Saccocia P. J. Craddock P. R. Walsh W. et al . (2019). Geochemistry of Hot-Springs at the SuSu Knolls Hydrothermal Field, Eastern Manus Basin: Advanced Argillic Alteration and Vent Fluid Acidity. Geochim. Cosmochim. Acta255, 25–48. doi: 10.1016/j.gca.2019.03.034
97
Seewald J. S. Seyfried W. E. (1990). The Effect of Temperature on Metal Mobility in Subseafloor Hydrothermal Systems: Constraints From Basalt Alteration Experiments. Earth Planet. Sci. Lett.101 (2–4), 388–403. doi: 10.1016/0012-821X(90)90168-W
98
Seewald J. S. Seyfried W. E. Shanks W. C. (1994). Variations in the Chemical and Stable Isotope Composition of Carbon and Sulfur Species During Organic-Rich Sediment Alteration: An Experimental and Theoretical Study of Hydrothermal Activity at Guaymas Basin, Gulf of California. Geochim. Cosmochim. Acta58 (22), 5065–5082. doi: 10.1016/0016-7037(94)90232-1
99
Seyfried W. E. Ding K. (1995). “Phase Equilibria in Subseafloor Hydrothermal Systems: A Review of the Role of Redox, Temperature, PH and Dissolved Cl on the Chemistry of Hot Spring Fluids at Mid-Ocean Ridges,” in Geophy. Monogr. Ser.248–272. doi: 10.1029/GM091p0248.
100
Seyfried W. E. Ding K. Berndt M. E. (1991). Phase Equilibria Constraints on the Chemistry of Hot Spring Fluids at Mid-Ocean Ridges. Geochim. Cosmochim. Acta55 (12), 3559–3580. doi: 10.1016/0016-7037(91)90056-B
101
Seyfried W. E. Janecky D. R. Mottl M. J. (1984). Alteration of the Oceanic Crust: Implications for Geochemical Cycles of Lithium and Boron. Geochim. Cosmochim. Acta48 (3), 557–569. doi: 10.1016/0016-7037(84)90284-9
102
Seyfried W. E. Seewald J. S. Berndt M. E. Ding K. Foustoukos D. I. (2003). Chemistry of Hydrothermal Vent Fluids From the Main Endeavour Field, Northern Juan De Fuca Ridge: Geochemical Controls in the Aftermath of June 1999 Seismic Events. J. Geophys. Res.: Solid. Earth108 (B9), 1–23. doi: 10.1029/2002jb001957
103
Shanks W. C. (2001). Stable Isotopes in Seafloor Hydrothermal Systems. Rev. Mineral. Geochem.43, 469–526. doi: 10.2138/gsrmg.43.1.469
104
Shanks W. C. Böhlke J. K. Seal R. R. (1995). Stable Isotopes in Mid-Ocean Ridge Hydrothermal Systems: Interactions between Fluids, Minerals, and Organisms. Geophys. Monogr. Ser.91), 194–221. doi: 10.1029/GM091p0194
105
Shmulovich K. I. Landwehr D. Simon K. Heinrich W. (1999). Stable Isotope Fractionation between Liquid and Vapour in Water-Salt Systems up to 600°C. Chem. Geolog.157 (3–4), 343–354. doi: 10.1016/S0009-2541(98)00202-2
106
Takai K. Nunoura T. Ishibashi J. I. Lupton J. Suzuki R. Hamasaki H. et al . (2008). Variability in the Microbial Communities and Hydrothermal Fluid Chemistry at the Newly Discovered Mariner Hydrothermal Field, Southern Lau Basin. J. Geophys. Res.: Biogeosci.113 (G2). doi: 10.1029/2007JG000636
107
Taylor B. (1979). Bismarck Sea: Evolution of a Back-Arc Basin. Geology7 (4), 171–174. doi: 10.1130/0091-7613(1979)7<171:BSEOAB>2.0.CO;2
108
Taylor B. E. (1986). “Magmatic Volatiles: Isotopic Variation of C, H, and S.”, in Stable Isotopes in High Temperature Geological Processes. 16 (1), 185–225
109
Taylor H. (1997). “Oxygen and Hydrogen Isotope Relationships in Hydrothermal Mineral Deposits.”, in Geochemistry of Hydrothermal Ore Deposits.229–302
110
Toki T. Itoh M. Iwata D. Ohshima S. Shinjo R. Ishibashi J. I. et al . (2016). Geochemical Characteristics of Hydrothermal Fluids at Hatoma Knoll in the Southern Okinawa Trough. Geochem. J.50 (6), 493–525. doi: 10.2343/geochemj.2.0449
111
Tyler P. A. (2012). RRS James Cook cruise JC80, 2nd Dec-30 Dec 2012. The East Scotia Ridge and Kemp Seamount Caldera, Cruise 4 of the NERC Consortium Grant 'Chemosynthetically driven ecosystems in the Southern Ocean. Ecology and Biogeography' (ChEsSo) (Southampton, UK: National Oceanography Centre Southampton).
112
Vanko D. A. Bach W. (2005). Heating and Freezing Experiments on Aqueous Fluid Inclusions in Anhydrite: Recognition and Effects of Stretching and the Low-Temperature Formation of Gypsum. Chem. Geolog.223 (1–3), 35–45. doi: 10.1016/j.chemgeo.2004.11.021
113
Vityk M. O. Bodnar R. J. Schmidt C. S. (1994). Fluid Inclusions as Tectonothermobarometers: Relation between Pressure-Temperature History and Reequilibration Morphology during Crustal Thickening. Geology22 (8), 731–734. doi: 10.1130/0091-7613(1994)022<0731:FIATRB>2.3.CO;2
114
Von Damm K. L. Bischoff J. L. Rosenbauer R. J. (1991). Quartz Solubility in Hydrothermal Seawater: An Experimental Study and Equation Describing Quartz Solubility for up to 0.5 M NaCl Solutions. Am. J. Sci291(10), pp.977–1007.. doi: 10.2475/ajs.291.10.977
115
Von Damm K. L. (1990). Seafloor Hydrothermal Activity: Black Smoker Chemistry and Chimneys. Annu. Rev. Earth Planet. Sci.18, 173–204. doi: 10.1146/annurev.ea.18.050190.001133
116
Von Damm K. L. (1995) Controls on the Chemistry and Temporal Variability of Seafloor Hydrothermal Fluids. Seafloor Hydrothermal Systems: Physical, Chemical, Biological, and Geological Interactions91, 222–247.
117
Von Damm K. L. Edmond J. M. Grant B. Measures C. I. Walden B. Weiss R. F. (1985a). Chemistry of Submarine Hydrothermal Solutions at 21 °N, East Pacific Rise. Geochim. Cosmochim. Acta49 (11), 2197–2220. doi: 10.1016/0016-7037(85)90222-4
118
Von Damm K. L. Edmond J. M. Measures C. I. Grant B. (1985b). Chemistry of Submarine Hydrothermal Solutions at Guaymas Basin, Gulf of California. Geochim. Cosmochim. Acta49 (11), 2221–2237. doi: 10.1016/0016-7037(85)90223-6
119
Von Damm K. L. Lilley M. D. Shanks lii W. C. Brockington M. Bray A. M. O’Grady K. M. et al . (2003). Extraordinary Phase Separation and Segregation in Vent Fluids from the Southern East Pacific Rise. Earth Planet. Sci. Lett.206 (3–4), 365–378. doi: 10.1016/S0012-821X(02)01081-6
120
Von Damm K. L. Parker C. M. Zierenberg R. A. Lilley M. D. Olson E. J. Clague D. A. et al . (2005). The Escanaba Trough, Gorda Ridge Hydrothermal System: Temporal Stability and Subseafloor Complexity. Geochim. Cosmochim. Acta69 (21), 4971–4984. doi: 10.1016/j.gca.2005.04.018
121
Wang D. T. Reeves E. P. McDermott J. M. Seewald J. S. Ono S. (2018). Clumped Isotopologue Constraints on the Origin of Methane at Seafloor Hot Springs. Geochim. Cosmochim. Acta223, 141–158. doi: 10.1016/j.gca.2017.11.030
122
Welhan J. A. (1988). Origins of Methane in Hydrothermal Systems. Chem. Geolog.71 (1–3), 183–198. doi: 10.1016/0009-2541(88)90114-3
123
Welhan J. A. Craig H. (1983). “Methane, Hydrogen and Helium in Hydrothermal Fluids at 21°N on the East Pacific Rise.”, in Hydrothermal Processes at Seafloor Spreading Centers. Boston, MA: Springer). 391–409. doi: 10.1007/978-1-4899-0402-7_17.
124
Xu G. (2000). Fluid Inclusions with NaCl-CaCl2-H2O Composition from the Cloncurry Hydrothermal System, NW Queensland, Australia. Lithos53 (1), 21–35. doi: 10.1016/S0024-4937(00)00008-6
125
Yang K. Scott S. D. (2006). Magmatic Fluids as a Source of Metals in Arc/Back-Arc Hydrothermal Systems: Evidence from Melt Inclusions and Vesicles. Back. Arc. Spread. Syst.: Geolog. Biologic. Chem. Phys. Interact. Geophys.1), 163–184.
Summary
Keywords
hydrothermal vents, East Scotia Ridge, back-arc basin, conductive cooling, magmatic water, bioenergetics, Southern Ocean
Citation
Pereira SI, Diehl A, McDermott JM, Pape T, Klose L, Strauss H, Bohrmann G and Bach W (2022) Geochemistry of Hydrothermal Fluids From the E2-Segment of the East Scotia Ridge: Magmatic Input, Reaction Zone Processes, Fluid Mixing Regimes and Bioenergetic Landscapes. Front. Mar. Sci. 9:765648. doi: 10.3389/fmars.2022.765648
Received
27 August 2021
Accepted
13 April 2022
Published
15 June 2022
Volume
9 - 2022
Edited by
Jozee Sarrazin, Institut Français de Recherche pour l’Exploitation de la Mer (IFREMER), France
Reviewed by
Domenico Borello, Sapienza University of Rome, Italy; Mustafa Yucel, Middle East Technical University, Turkey
Updates
Copyright
© 2022 Pereira, Diehl, McDermott, Pape, Klose, Strauss, Bohrmann and Bach.
This is an open-access article distributed under the terms of the Creative Commons Attribution License (CC BY). The use, distribution or reproduction in other forums is permitted, provided the original author(s) and the copyright owner(s) are credited and that the original publication in this journal is cited, in accordance with accepted academic practice. No use, distribution or reproduction is permitted which does not comply with these terms.
*Correspondence: Samuel I. Pereira, Samuel.Pereira@uib.no
This article was submitted to Deep-Sea Environments and Ecology, a section of the journal Frontiers in Marine Science
Disclaimer
All claims expressed in this article are solely those of the authors and do not necessarily represent those of their affiliated organizations, or those of the publisher, the editors and the reviewers. Any product that may be evaluated in this article or claim that may be made by its manufacturer is not guaranteed or endorsed by the publisher.