 Wenzhi Lin1†
 Ruiqiang Zheng2,3†
 Binshuai Liu1,4
 Shenglan Chen1,4
 Mingli Lin1
 Mingming Liu1
 Wenhua Liu2*
 Songhai Li1*
- 1Marine Mammal and Marine Bioacoustics Laboratory, Institute of Deep-sea Science and Engineering, Chinese Academy of Sciences, Sanya, China
- 2Guangdong Provincial Key Laboratory of Marine Biotechnology, Institute of Marine Sciences, Shantou University, Shantou, China
- 3China Blue Sustainability Institute, Haikou, China
- 4University of Chinese Academy of Sciences, Beijing, China
Beibu Gulf’s (BBG) Indo-Pacific humpback dolphins present both a genetic differentiation and phenotypical differences from conspecifics from other areas of the South China Sea. Given the recent urbanization and industrialization in southern China, humpback dolphins from the BBG warrant conservation attention. However, this population’s demographic trend is unclear, making it hard to take conservation measures. To assess the population status of humpback dolphins in the BBG, photo-identification surveys were conducted between 2015 and 2019 in the inshore region surrounding the Dafeng River Estuary, which represents the most urbanized and industrialized coastal area of the BBG region. Robust design modeling suggested a constant survival for the female adults (0.89, 95% CI: 0.83–0.94). In comparison, the survival of the juvenile and sex-undetermined adults dropped from 0.92 (95% CI: 0.75–0.98) in 2015 to 0.86 (95% CI: 0.71–0.94) in 2016 and bounced back to 0.89 (95% CI: 0.80–0.94) in 2018. The low level of survival may justify the rapid decline in the annual population size from 156 (95% CI: 133–184) in 2015 to 102 (95% CI: 98–107) in 2019. We found little impact of emigration on the dolphin demographic process. Instead, the low and fluctuating survivals, although with overlapping confidence intervals, seemingly suggested a presence of strong marine stressor(s). Our study highlighted that obtaining high-resolution data is essential to improving our understanding of the demographic dynamics. Moreover, the anthropogenic stress in the BBG region should be quantitatively studied in both temporal and spatial perspectives, to help depict the ecological response of the dolphins to anthropogenic activities.
Introduction
Survival probability is generally measured to assess the fitness of wildlife populations. As widely reported for terrestrial mammals and many other marine mammal species, survival can vary substantially among demographic classes due to the sex-selective cost for reproduction and size-selective pressure (Promislow, 1992; Lemaître et al., 2020). For instance, the adult males of polygamous pinniped species fight to monopolize the mating during the breeding season (Cassini, 1999), leading to higher mortalities among males than females (Hastings et al., 2012). Sex- and age-specific mortality leads to modulated population dynamics, which can be reinforced and complicated by social factors and/or environmental conditions (Rochelle et al., 2015). However, due to the difficulty in determining the gender or age of individuals, sex- or age-specific survival/mortalities have not yet been examined for most delphinid species (Caswell et al., 1999; Currey et al., 2009).
The Indo-Pacific humpback dolphin (Sousa chinensis, hereafter referred to as the humpback dolphin) is a small cetacean species with high fidelity to the estuarine and inshore waters in southern China and Southeast Asia (Jefferson and Curry, 2015). Given its proximity with humans, this species has been susceptible to human development since the pre-industrial period (Lin et al., 2016; Zhang et al., 2020). The humpback dolphin first gained research and conservation attention in the late 1990s, due to the large-scale land reclamation in the waters off the north Lantau Island in Hong Kong (Jefferson, 2000). Field studies have not been conducted throughout most of the species’ range until recently (Chen et al., 2016; Chan and Karczmarski, 2017; Zeng et al., 2020), which brought better understanding of the ecological process of this species. For instance, a life table study proposed an annual declining rate of 2.5% for humpback dolphins in the Lingding Bay of the Pearl River Delta region (including Hong Kong waters, Huang et al., 2012). The population decline may have recently accelerated, as the female adults are approaching the age at which their fecundity is reduced and the population recruitment slows down (Guo et al., 2020). Population reduction was also reported for humpback dolphins in the Xiamen Bay, which has long been the focal area of local development (Chen et al., 2008; Zeng et al., 2020). Oppositely, in the less developed coastal regions where human impacts were considered less diverse and/or intensive, the humpback dolphins, even though demographic information is limited, were thought to be less impacted by anthropogenic activities (Chen et al., 2016).
Humpback dolphin populations located in waters within the Beibu Gulf (BBG), northern South China Sea, are small in the population size with no individual exchange observed among populations (Chen et al., 2016). An increasing number of studies suggested that the BBG humpback dolphins present both genetic differentiation and phenotypic differences with their counterparts from the rest of the South China Sea (Chen et al., 2018; Tang et al., 2021; Zhao et al., 2021). These characteristics make them an ideal population for in-depth demographic studies, as it will be relatively easier to collect high-resolution mark-recapture data of a small and geographically isolated population with no impact of migration. Within the BBG region, the humpback dolphins are found year-round in the inshore waters surrounding the Dafeng River Estuary (DRE), where it is the only dolphin-watching ground in mainland China. The rise of ecotourism in the past two decades, coupled with other human disturbances, raises concern about behavioral disturbance and reduced fitness of the local humpback dolphins (Chen et al., 2016; Wu et al., 2017). However, understanding of the ecological responses of dolphins to the recent human development was suppressed by the uncertainty about its demographic trend.
Prior to the present study, two independent research groups have conducted photo-identification (photo-ID) surveys on the DRE humpback dolphins (Chen et al., 2016; Peng et al., 2020) which resulted in incongruent findings on the demographics of this population. For example, Chen et al. (2016) firstly reported a population size of 261 (95% CI: 254–280, from 2011 to 2014) using the POPAN model. However, a more recent study using the same technique proposed a much higher estimate of 389 (95% CI: 353–430, from 2013 to 2016, Peng et al., 2020). Given the absence of migration (Chen et al., 2016), the deteriorating coastal ecosystem, and the recent coastal development in the DRE region (e.g., marine reclamation, coastal alteration, bycatch and ecotourism, Chen et al., 2016; Wu et al., 2017; Peng et al., 2020), an increase in population size is unlikely to have occurred. In other words, the difference between the estimates from the two later studies unlikely reflects the demographic trend of the population.
Here, we examined the fidelity/residency of the DRE humpback dolphins using a photo-ID catalogue collected over a 5-year period. By using a robust design modeling algorithm that incorporates the likely impact of migration (Pollock, 1982), we calculated the unbiased estimates of survival and other demographic parameters, including the capture/recapture probabilities, immigration/emigration rate, and population size. Finally, we investigated whether the survival varies between humpback dolphins’ sex and age groups in this population.
Materials and Methods
Study Area and Fieldwork Protocol
Similar to Chen et al. (2016) and Peng et al. (2020), the present study area is located in inshore waters surrounding the DRE in the northern apex of BBG, northern South China Sea (Figure 1). The present datasets were collected by a joint effort of two independent teams from the Institute of Deep-sea Science and Engineering, Chinese Academy of Science (IDSSE), and Shantou University (STU). IDSSE’s surveys followed predetermined zigzag survey routes to ensure consistent coverage across the study area. STU’s surveys were conducted by searching along the coast back and forth at different distances from the coastline. Given the small range of the DRE humpback dolphins, the whole study area could be well covered within 1 day regardless of the field methods adopted. For both teams, regular surveys were carried out year-round using a small boat powered by a 60-HP engine. Dolphins were searched by naked eyes; once encountered, photos of both sides of their dorsal fins and upper bodies were photographed with digital SLR cameras (Canon EOS 7D, Olympus E-M1 Mark II) equipped with either 100–400- or 100–200-mm-zoom lenses, irrespective of their distinctiveness, age, or behavior. Each encounter was followed for a minimum of 10 min or until all group members were covered by the photographer. Geographic locations were recorded using GARMIN 78s.
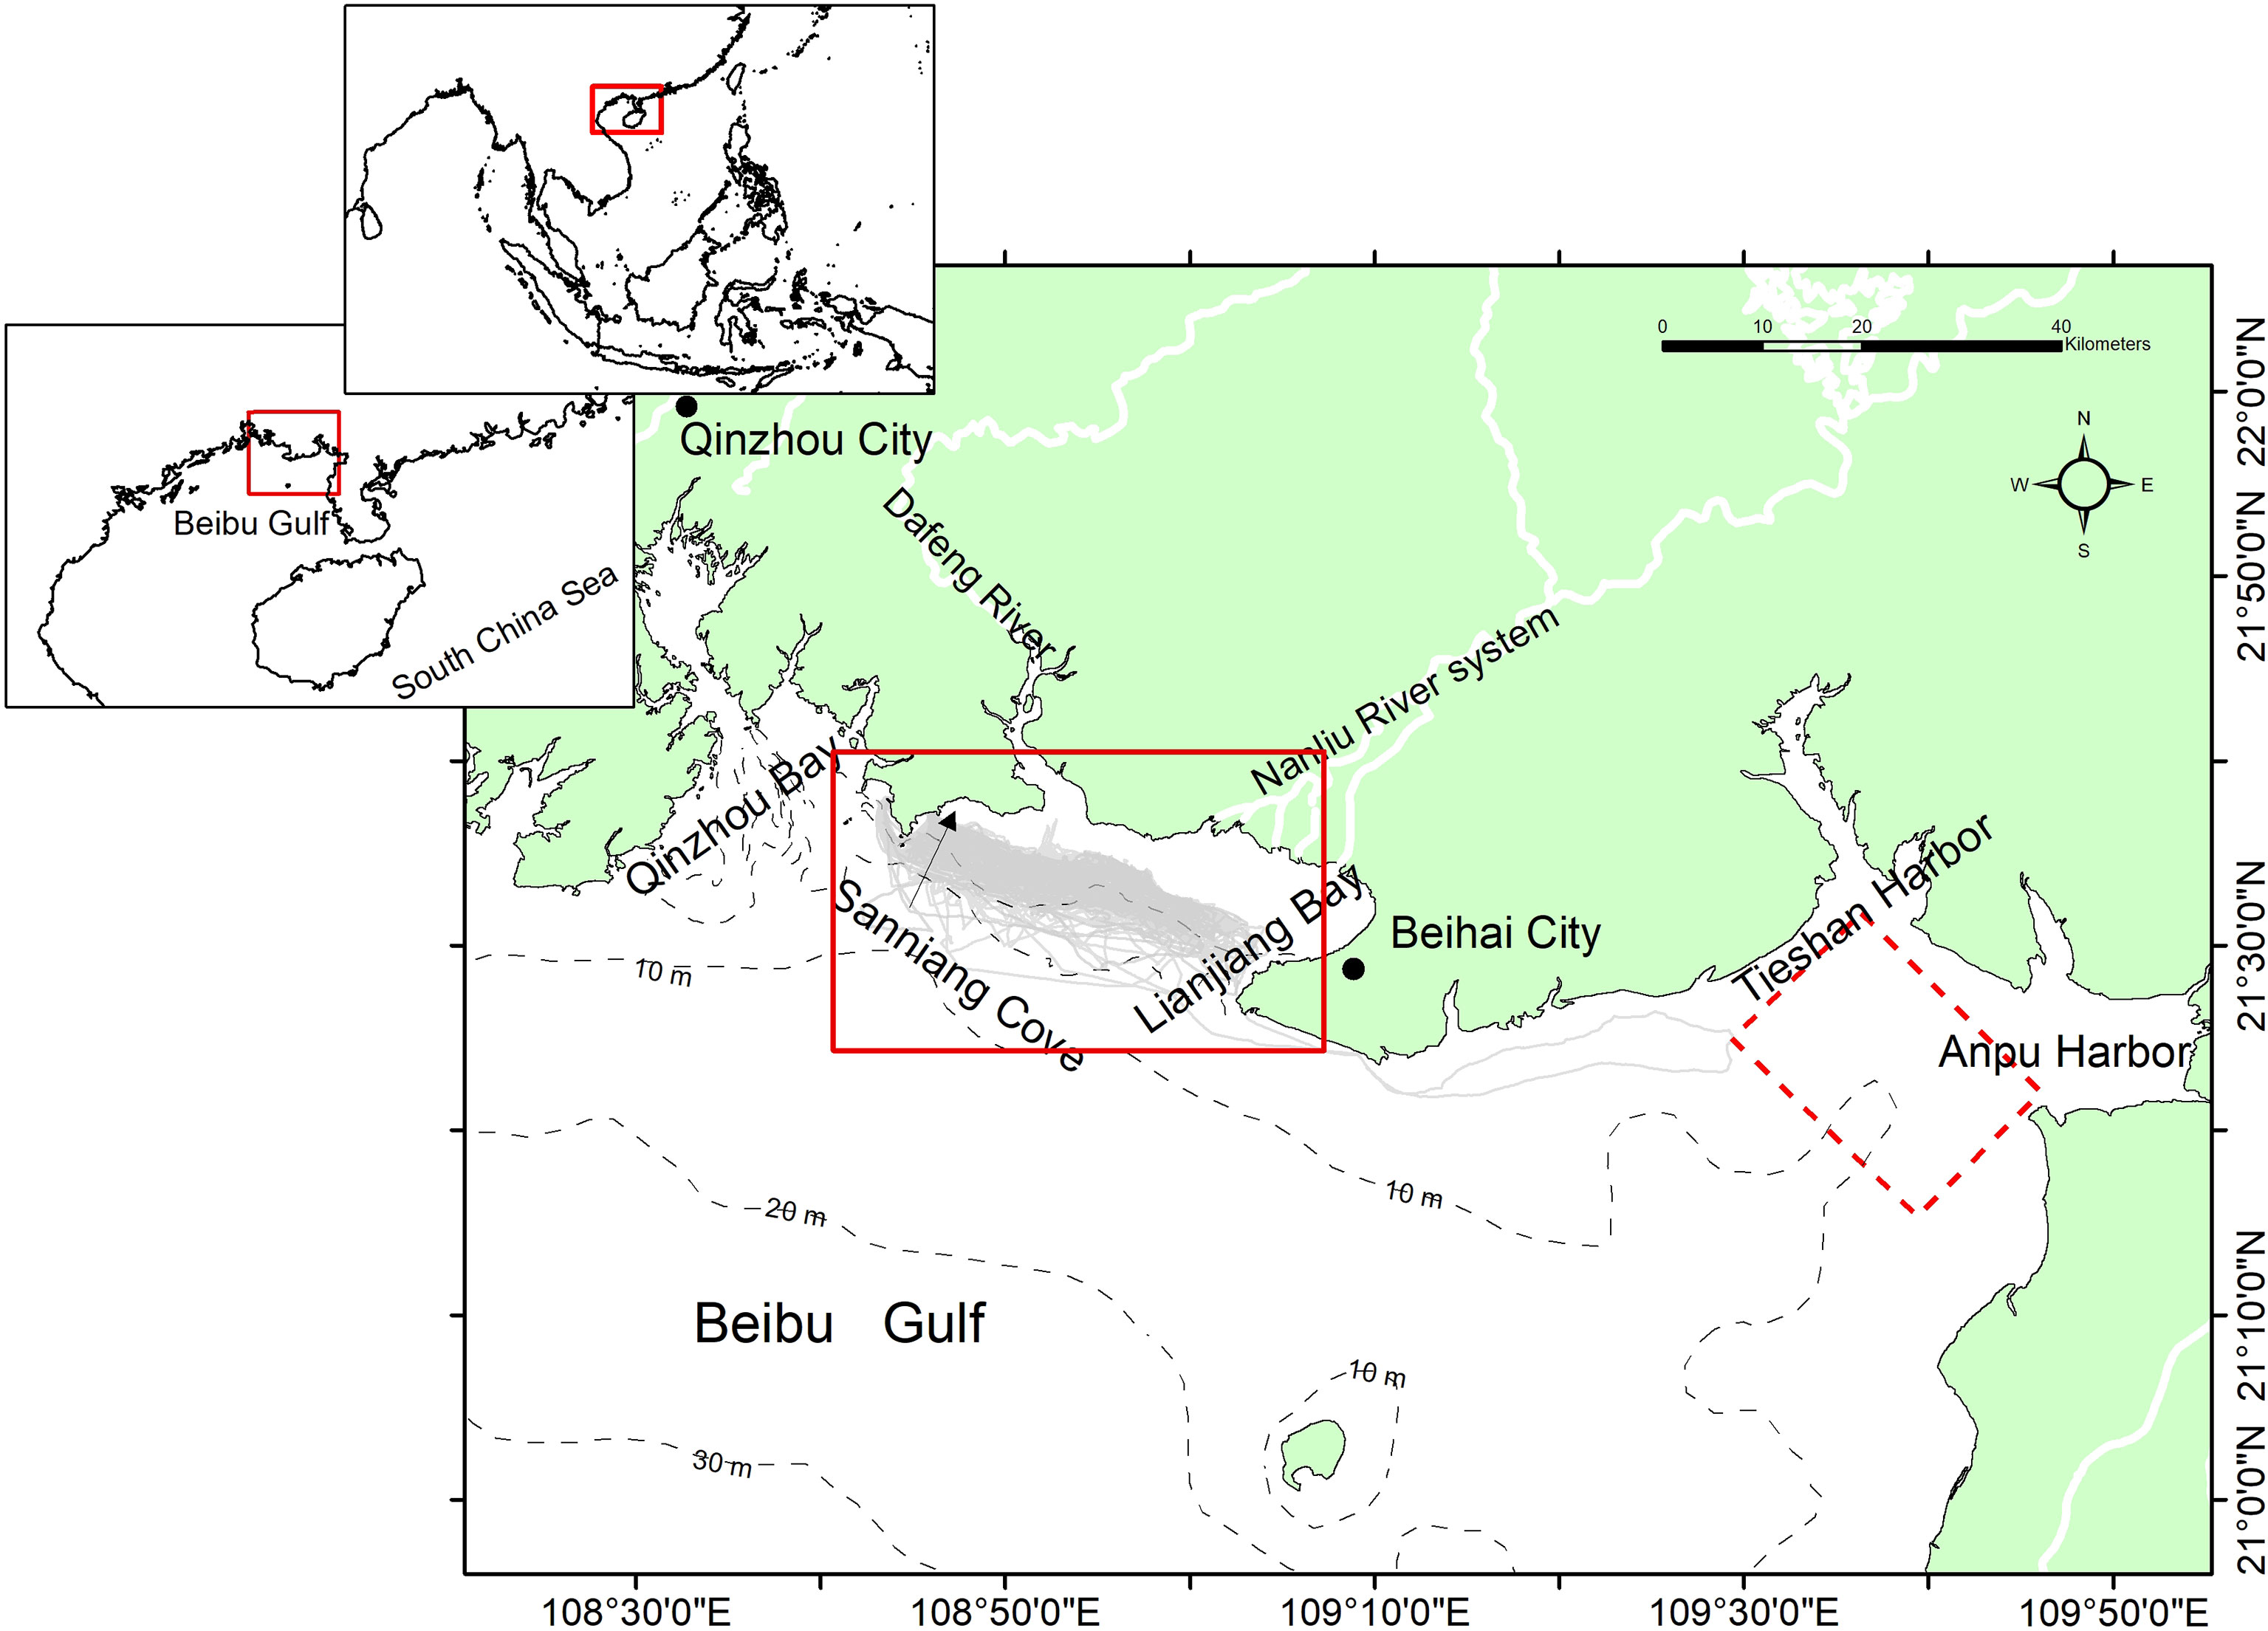
Figure 1 Study area in the Dafeng River Estuary (DRE), which locates at the northern apex of the Beibu Gulf (BBG), northern South China Sea. The gray lines represent the survey routes of the present study from 2015 to 2020. The major cities in this region were indicated by their names, and the nearest conspecific population living the inshore waters between the Tieshan Harbor and Anpu Harbor (Chen et al., 2016) is indicated in the polygon with dashed line.
Photos were processed and filtered using the program DISCOVERY (Gailey and Karczmarski, 2012) according to their qualities (1 ≤ Q ≤ 100) concerning the focus, the contrast from the background, the angle of the animal to the camera, and the proportion of the body region used for identification (Karczmarski et al., 2005). Each dorsal image was scored from 0 (not marked) to 5 (highly marked) according to its distinctiveness (Friday et al., 2000) including the fin shape, notches on the trailing edge of the dorsal fin, pigmentation, and permanent injuries on the upper body region (Karczmarski et al., 2005; Lin et al., 2018). Moreover, the DRE humpback dolphins were categorized into three age groups, the calves, juveniles, and adults (Table 1). Calves were excluded from the following analyses regardless of their distinctiveness as they generally have different demographic dynamics compared to the juveniles/adults.

Table 1 Definitions of the three age classes of the DRE Indo-Pacific humpback dolphins.
Goodness-of-Fit Test
Mark-recapture models assume no individual heterogeneity in their demographic perspectives; the violation of this assumption may lead to biased estimates of parameters (Sandercock, 2006). Unfortunately, there is no goodness-of-fit test available for the robust design model used in the present study, so the model fit could not be evaluated or adjusted. Instead, over-dispersion of sighting data was assessed by calculating the variance inflation factors of a saturated Cormack–Jolly–Seber (CJS) model (Cormack, 1964; Jolly, 1965; Seber, 1965) using the median- method (Anderson et al., 1994). As a rule of thumb, < 3 indicates adequate fit to the data and the impact of data over-dispersion is negligible. Test2.CT and Test3.SR embedded in the program U-CARE (Choquet et al., 2009) were also used to test for “trap effect” and “transient impact”, respectively.
Robust Design Modeling
We applied the Huggins robust design model framework (Pollock, 1982) embedded in the program MARK (White and Burnham, 1999) to infer the demographic parameters of a subset of the present dataset. The robust design model gives estimates of five parameters, including φt (the probability that individuals survive from primary occasion t to t+1), γ′ and γ″ (the probability of being off the study area/unobservable during primary occasion t given that the individual was unobservable or observable at time t-1, respectively, and survives to time t), and pts and cts (the probability that the individual is captured or recaptured in secondary occasion s of the primary occasion t, respectively).
The robust design consists of two levels of sampling occasions. The first or primary sampling occasions are separated by a relatively long period, and therefore the population can be geographically (through migration) and demographically (through birth/death) open. The primary occasions consist of multiple secondary sampling occasions during which the population is considered closed. The other major assumptions made by robust design include: 1) marked individuals that do not lose their marks and whose marks are not overlooked; 2) no individual heterogeneity in capture/recapture within each sampling session; 3) no individual heterogeneity in survival between primary occasions; and 4) the fate of individuals, including the probabilities of being captured and surviving to the next occasion, being independent.
In the present study, the sighting histories were pooled into secondary sampling occasions every 2 months from 2015 to 2019 (Silva et al., 2009; Chan and Karczmarski, 2017), which should be short enough to consider such a small population closed (Zeng et al., 2020), but sufficient to reach a high capture rate. The bimonthly sighting data with <40 records were discarded as the low sighting rate would result in imprecise estimates of parameters, with the rest bimonthly data collapsed into the year as primary occasions (Table 2). Effort was also made to reduce the bias due to other assumption violations. For assumption 1, we used only the images with high quality (Q ≥ 70) and moderate-to-high distinctiveness (Q ≥ 3) in the subsequent analysis (Friday et al., 2000; Karczmarski et al., 2005), to reduce the bias associated with mismatch. For assumptions 2 and 3, we reduced the difference in survival by excluding neonate/calf data and also divided the other individuals into different age/sex groups which may present different demographic dynamics. Assumption 4 has to be violated for dolphins as they live in social groups, which may lead to overdispersion of the sighting data.

Table 2 Data summary and sampling structure of the robust design analysis.
Robust Design: Modeling the Fidelity
Both “fidelity” and “residency” reflect the tendency of animals to return to or remain in a specific site, but the usage of these two terms might differ regarding a relatively short or long time unit, respectively. In the present study, the residency was estimated by calculating the lagged identification rate (LIR) which reflects the amount of time (scaled in the daily unit) that individuals reside within the study area, while rates of movement out or into the study area on a yearly basis (fidelity) were estimated using the robust design modeling.
We assessed the model robustness under different movement hypotheses by manipulating the parameters γ′ and γ″, including the following: (1) no movement (γ′ = 1 and γ″ = 0)—the survey effort covered the most, if not the entire, range of the population (every individual has a chance to be captured) and no individual exchange between the DRE humpback dolphin and its putative neighboring population(s) in either its eastern or western waters; (2) even flow (γ″ = 1-γ′)—the immigration rate is equal to the emigration rate, which suggests the animal movement is independent of their early stages (observable or unobservable); (3) random movement (γ′ = γ″)—the individuals present the same probability of staying unobservable (permanent emigration before the sampling interval) and becoming unobservable (temporal emigration during the sampling interval); (4) Markovian movement (γ′k = γ′k-1 and γ″k = γ″k-1)—the movement rate differs as a function of individuals’ early stage (observable or unobservable); and (5) no emigration (γ′ = γ″ = 0).
Robust Design: Modeling the Survival and Capture/Recapture Probabilities
We evaluated the time effect (“t”: time-dependent; and “.”: constant or time-independent) on both survival (φ) and capture/recapture probability (p/c). The effect of the survey effort (survey days) on the capture/recapture probabilities was taken into account by assuming that the higher survey effort may lead to higher probabilities of animals being sighted.
We further assessed the effect of age and sex in driving the demographic process of the DRE humpback dolphins. The juveniles and adults were defined as previously described in Table 1. The sex of individuals was identified by the opportunistic observation of the dolphin genital region. Females were also identified by the prolonged (more than 2 independent encounters) tight association with neonate/dependent calf. If a neonate/dependent calf was seen only once, the mom would be defined based on the most consistent association with the neonate/calf. Of the 119 adult individuals, we identified 39 females and 8 males, while only one out of the 28 juveniles was identified as female. To reduce the uncertainty or bias associated with the limited sample size of males, we categorized the juveniles (J), the female adults (FA), and the male adults and the rest of adults (UA) into three separate age–sex groups. Models considering group-specific survivals were then built and tested.
Robust Design: Modeling Procedures
The robust design analysis was started with the most saturated model. In the first round of modeling, the presence/absence of behavioral response to the survey boat was first assessed by setting the recapture probability (c) equal to the capture probability (p). The group-specific capture probability was then removed, and the effect of survey effort (number of survey days) was finally incorporated using a linear function. In the second round of modeling, time- and age-specific survivals were tested with a no-emigration model (γ′ = γ″ = 0). Finally, a series of hypotheses considering different dolphin movement patterns were tested by manipulating the parameter γ as previously stated. The most parsimonious model was selected using Akaike’s information criterion (AICc) (Burnham and Anderson, 2002). The model with the lowest AICc value was selected as the best-fit model. The statistical significance in model fitness improvement was evaluated using Quasi-AICc (QAICc), with ΔQAICc <2 suggesting little improvement. When the data could be described by multiple models with comparable fitness, weighted averages of parameters were calculated according to Akaike’s weight (wi) of models (Buckland et al., 1997).
Reconstructing the Total Population Size
The marked ID-ratio was calculated as the proportion of moderately-to-highly marked dorsal fins (D ≥ 3) over the total captured dorsal fins in each sampling year (excluding the calves), as we assumed no difference between the capture probabilities of marked and unmarked individuals. The total population size (including non-marked, low and highly-marked individuals, ) was then reconstructed by correcting the marked population size (N) by the marked ID ratio following: . The variance of was calculated following Urian et al. (2015) as:
The upper and lower bounds of were estimated with and where:
Fidelity of the DRE Humpback Dolphins
Site fidelity of the DRE humpback dolphins was measured by calculating the lagged identification rate (LIR), which represents the probability of individuals identified within the study area to be identified again t time units later. The LIR is expected to be constant if the population is closed. A reducing LIR with time lag indicates that the probability of recapturing individuals in the study area drops due to either emigration or mortality (Whitehead, 2001). If the LIR drops but remains at a level above zero or bounces back after a certain time point, it indicates that some individuals reside in or re-immigrate to the study area. Models assuming closed population, emigration or mortality, and emigration + mortality were subsequently fitted to the observed LIR using SOCPROG (Whitehead, 2009), and the 95% CI of model parameters was calculated using 1,000 bootstrap replications. The QAIC criterion was used to rank and identify the optimal models (see Results for details).
Results
Summary of the Field Data
During the 5 years of study (2015-2019), a total of 27,915 images were collected through 112 days of field survey. Of these photos, 198 individuals were successfully identified, including 147 highly marked individuals (D ≥3). The cumulative discovery curve sharply increased at the early stage (April 2015–March 2016) of fieldwork but slowed down in the 2nd year and reached a plateau in early 2017 (Figure 2A). Seventeen new IDs captured after April 2017 were exclusively young juveniles or calves entering the marked population with emerging identifiable marks. Individual dolphins were sighted an average of 13.9 times (range from 1 to 48, Figure 2B). Individuals with only one sighting record (n = 22) comprised 12.2% of the dataset, while 123 individuals (83.7%) were sighted more than five times.
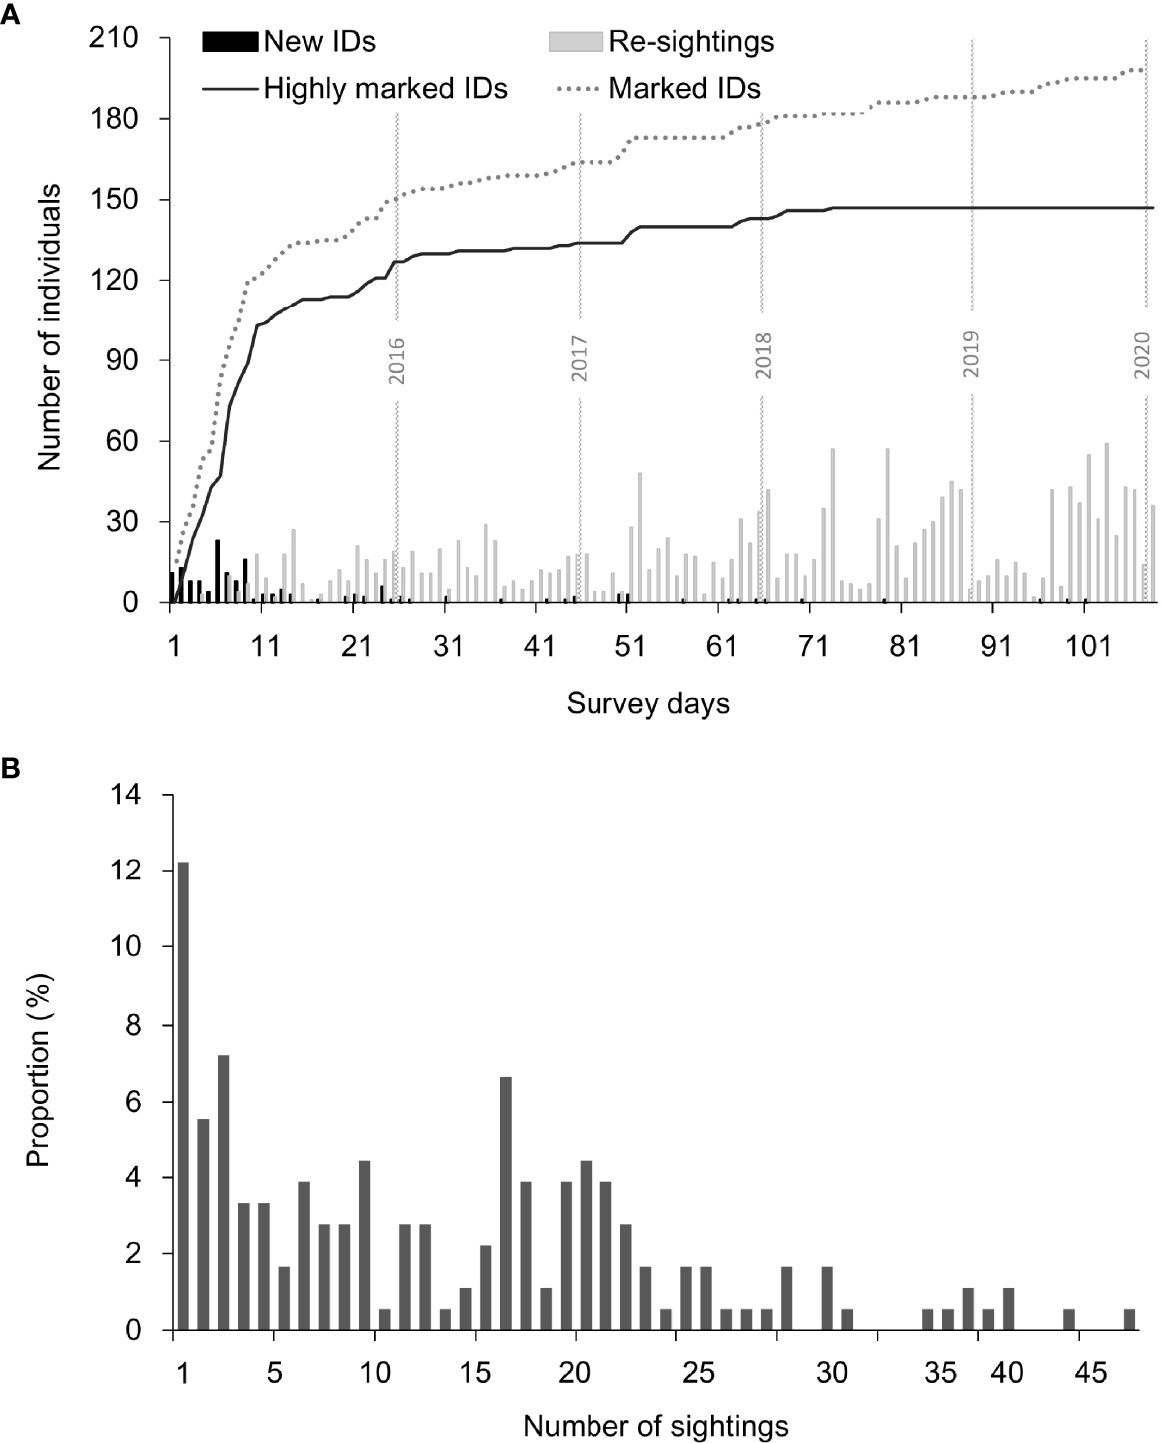
Figure 2 Evaluating the photo-identification data robustness for the DRE Indo-Pacific humpback dolphins collected during 2015 and 2019 in the measurement of (A) cumulative discovery curves, in which the curves were presented for both all individuals (dotted line) and highly marked individuals (distinctiveness/D ≥3, dark line), and the number of individuals sighted for the first time (New ID) or re-sightings during each survey day shown as histogram in the bottom; the horizontal lines in gray indicated the 5 sampling years of the present study. (B) The distribution of sighting frequencies for highly marked individuals.
Goodness-of-Fit Test and Mark Ratio
U-CARE showed some evidence of the “transient impact” (Test3.SR, χ2 = 26.90, p < 0.01), which was primarily contributed by the sex-undetermined adults (χ2 = 23.21, p < 0.01) rather than the juveniles (χ2 = 5.72, p = 0.06) or female adults (χ2 = 2.72, p = 0.44). Test2.CT provided no evidence of “trap effect” (χ2 < 0.001, p = 1.00). The signed square root of the χ2 statistic (z) was estimated as zero, suggesting that the difference between the capture probabilities between newly captured and recaptured individuals was particularly small. The median was estimated as 1.68 (SE = 0.25), indicating a limited impact of data over-dispersion. Given the fact that CJS and robust design models are built on different mathematics frameworks, and that the γ of the robust design model should account for the “transient impact,” we did not adjust the robust design modeling results with the value.
The annual mark ratios ranged from 0.921 to 0.958 during the present study period, with a mean value of 0.934 (SE = 0.005) for the DRE humpback dolphin (Table 3).

Table 3 Mark-ratio for the DRE Indo-Pacific humpback dolphins.
Robust Design Modeling
The full model received the least statistical support (model #27 in Table 4). No evidence was detected for trap effect (model #26 vs. #27, ΔQAICC = 40.5) or group-specific capture probability (model #24 vs. #27 , ΔQAICC = 68.5). There was little improvement in model fit when the survey effort was incorporated as covariate (model #25 vs. #24, ΔQAICC =1.1). Therefore, only time effect on the capture probabilities (p = c(t)) was used for all the subsequent analyses.
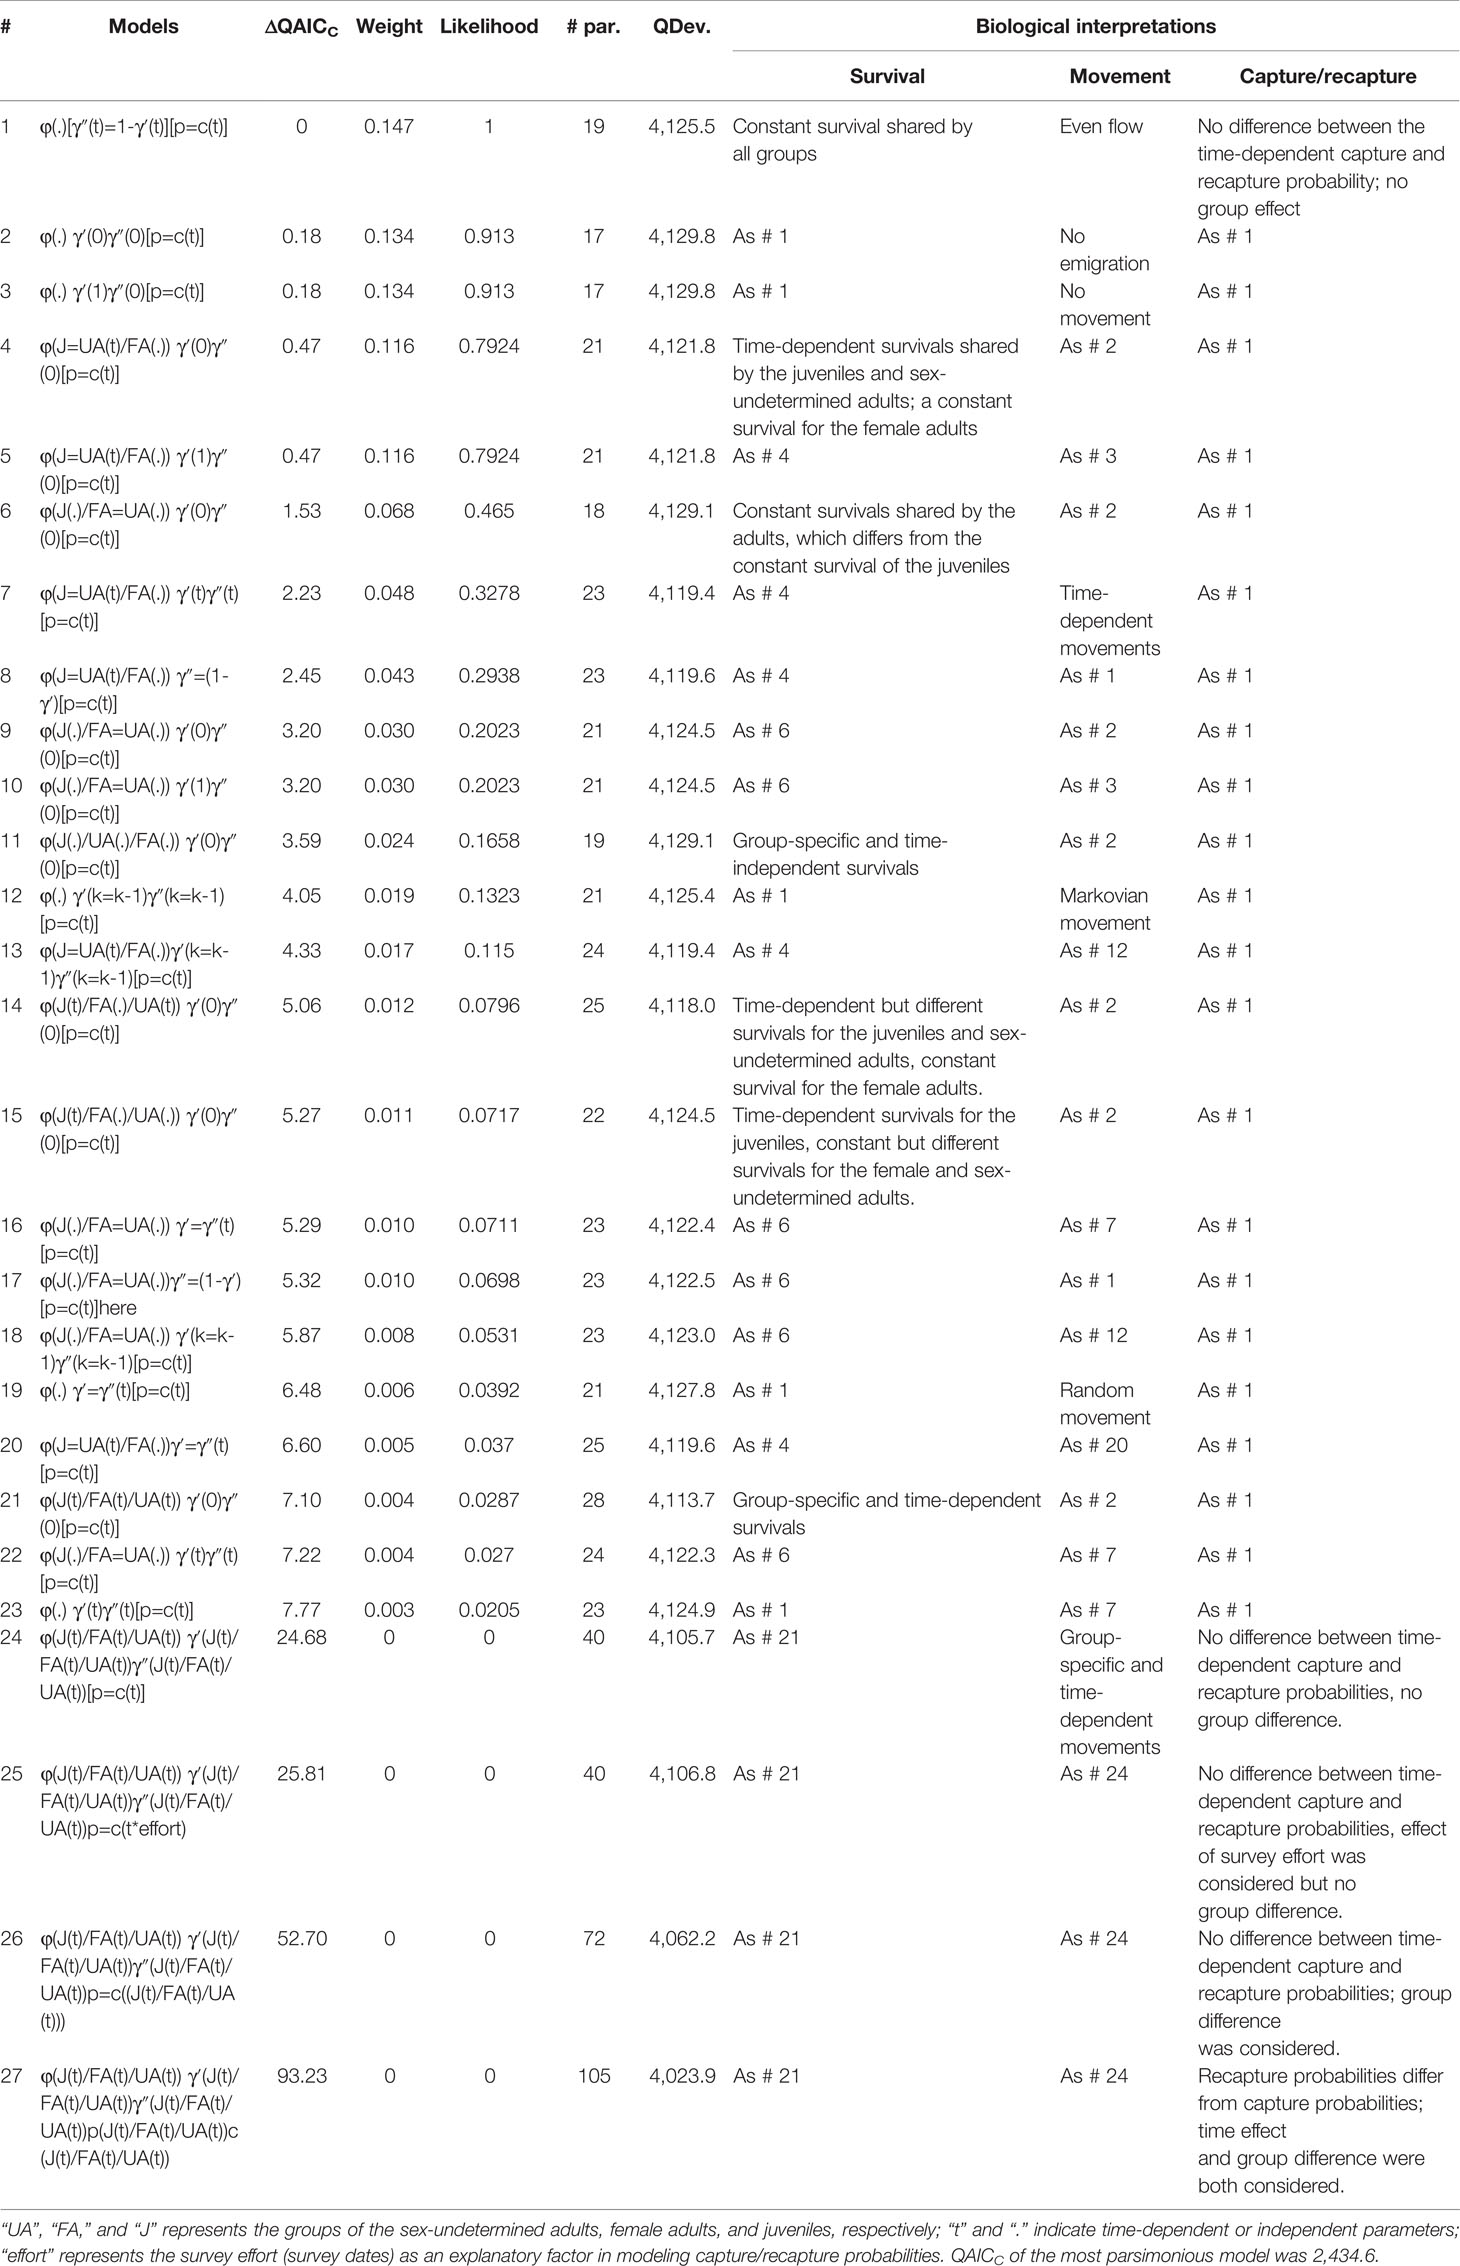
Table 4 Model selection of 27 robust design models in estimating the survival (φ), movement (γ), and capture/recapture probabilities (p/c) of the Dafeng River estuary (DRE) Indo-Pacific humpback dolphins.
During the second round of modeling, the model considering both time and group effects received no statistical support (model #21 in Table 4). The model considering a constant survival (φ(.)) best fit the data (model #2). The model in which a constant survival was attributed to female adults and a time-dependent survival was attributed to sex-undetermined adults and juveniles (φ(J=UA(t))/FA(.)), model #4) received a very close statistical support to the one of model #2 (ΔQAICC = 0.29), followed by the ones assuming age-specific and constant survivals (φ(J(.)/FA=UA(.)) in model #6, ΔQAICC = 1.35 compared to model #2). Based on these three model structures on survival, a series of models were further built to test for seven movement hypotheses. As shown in Table 4, there was no specific movement hypothesis that best described our data. However, the model fit was generally improved when the movement parameter number was reduced by adding constraints to γ (e.g., even flow), especially when either γ′ or γ″ was set to specific values (e.g., no emigration and no movement).
The averaged estimates of capture probabilities ranged from 0.36 to 0.90, with the mean value as 0.60. Eleven out of the sixteen secondary occasions presented capture probabilities > 0.5 (Figure 3B). Survival presented a similar temporal pattern for the juveniles (0.92, SE = 0.05; 0.86, SE = 0.06; 0.88, SE = 0.03; 0.89, SE = 0.03 from 2015 to 2018, respectively) and sex-undetermined adults (0.92, SE = 0.05; 0.86, SE = 0.06; 0.88, SE = 0.03; 0.89, SE = 0.03 from 2015 to 2018, respectively), with a drop in 2016 followed by a slight increase in 2017 and 2018 (Figure 3A). A constant survival was recorded for the female adults (0.89, SE = 0.03).
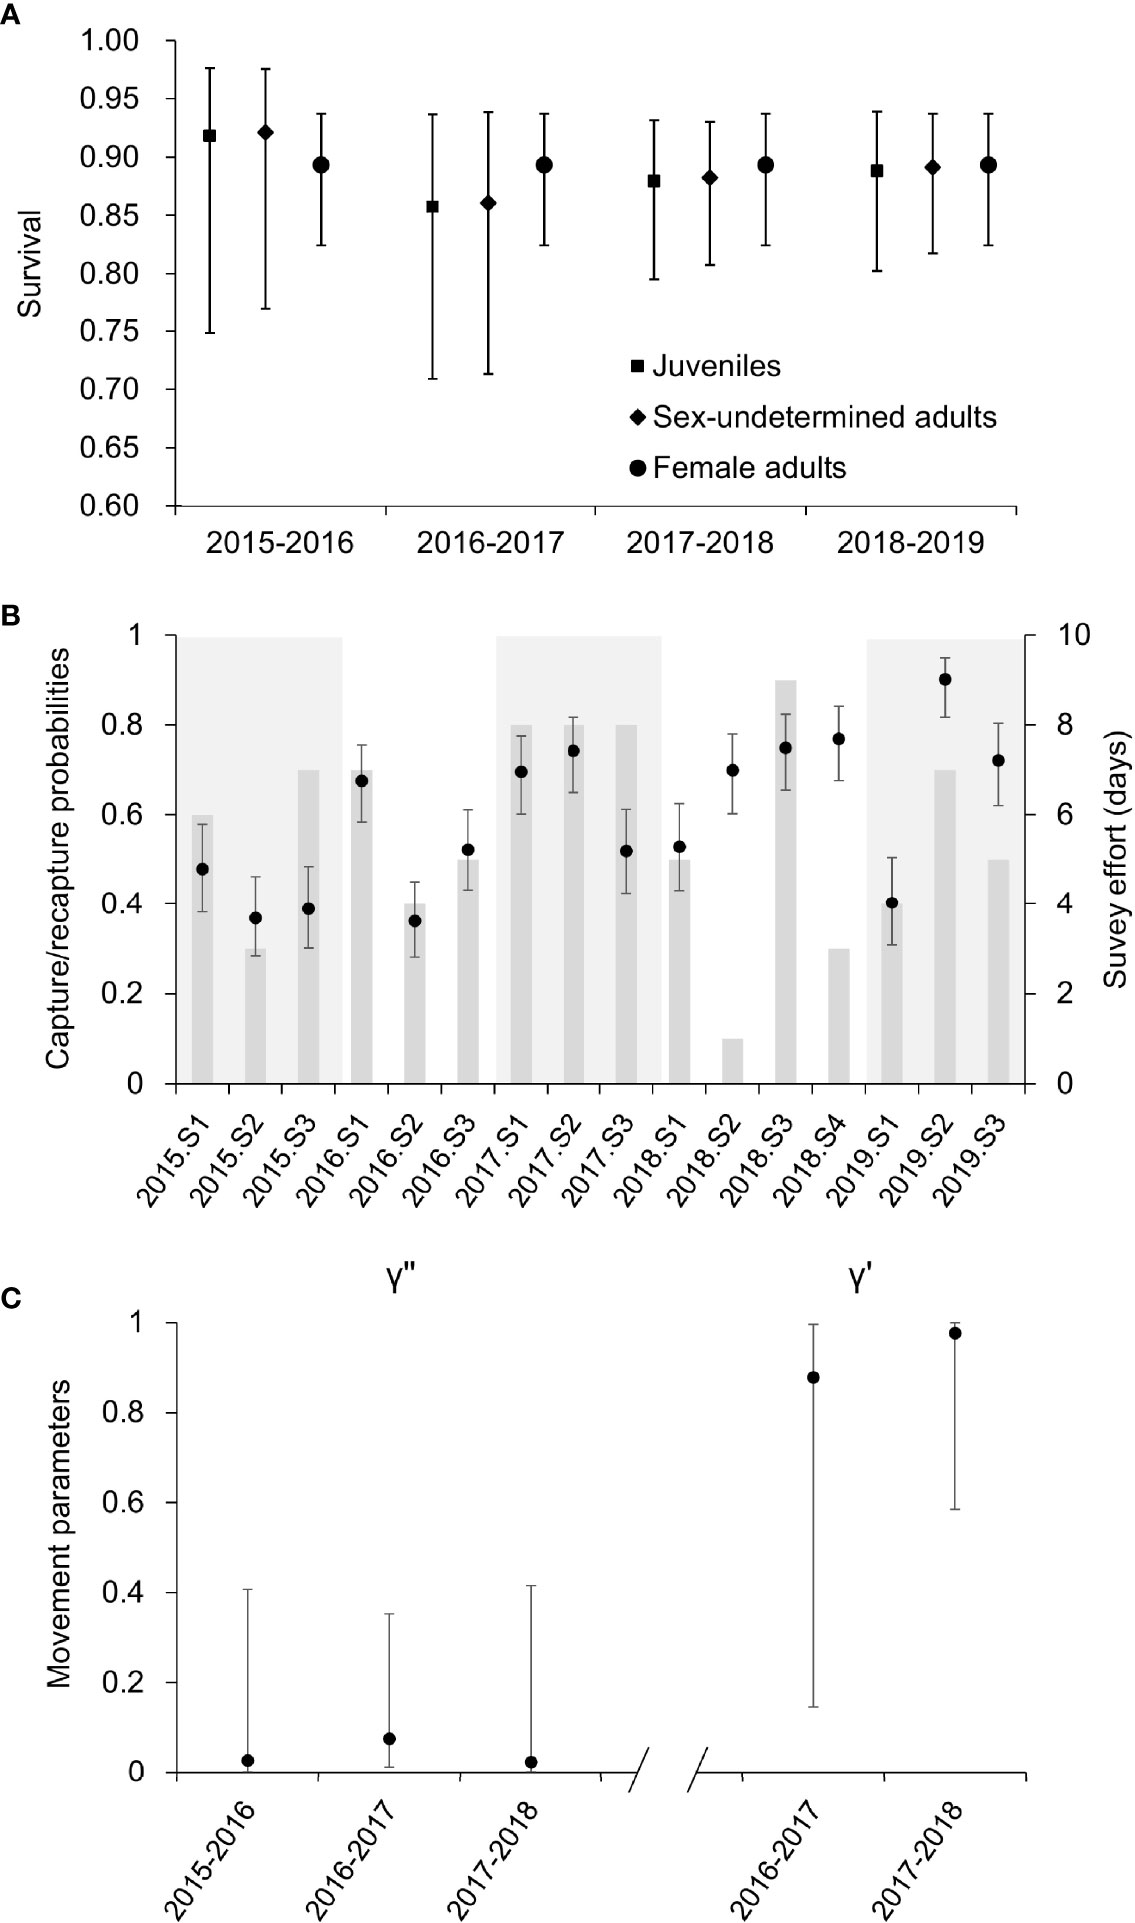
Figure 3 Estimates for the (A) survivals, (B) capture probabilities, and (C) movement parameters of the DRE Indo-Pacific humpback dolphins during 2015–2019. The error bars indicate the 95% confident intervals of estimates. In the middle panel, the capture probabilities of each session within a primary occasion were highlighted in different colors, while the survey effort (measured in the number of survey days) was presented in histogram according to the secondary axis.
γ was fixed in five out of the eight optimal models (model #2~6). The values averaged over the rest optimal models suggested a small γ″ (γ″2015 = 0.03, SE = 0.04; γ″2016 = 0.08, SE = 0.07; γ″2017 = 0.02, SE = 0.04) and a large γ′ (γ′2016 = 0.88, SE = 0.20; γ″2017 = 0.97, SE = 0.04, Figure 3C), while the last γ′ and γ″ were not estimable.
After being corrected by the mark ratio, the optimal robust design models suggested an annual population size of 156 (95% CI: 133–184), 133 (95% CI: 120–148), 114 (95% CI: 107–122), 105 (95% CI: 102–108), and 102 (95% CI: 98-107) from 2015 to 2019, respectively (Figure 4). The population change parameter (Nt/Nt+1) varied from 0.853 to 0.973, with a mean estimate of 0.901 (SE = 0.06).
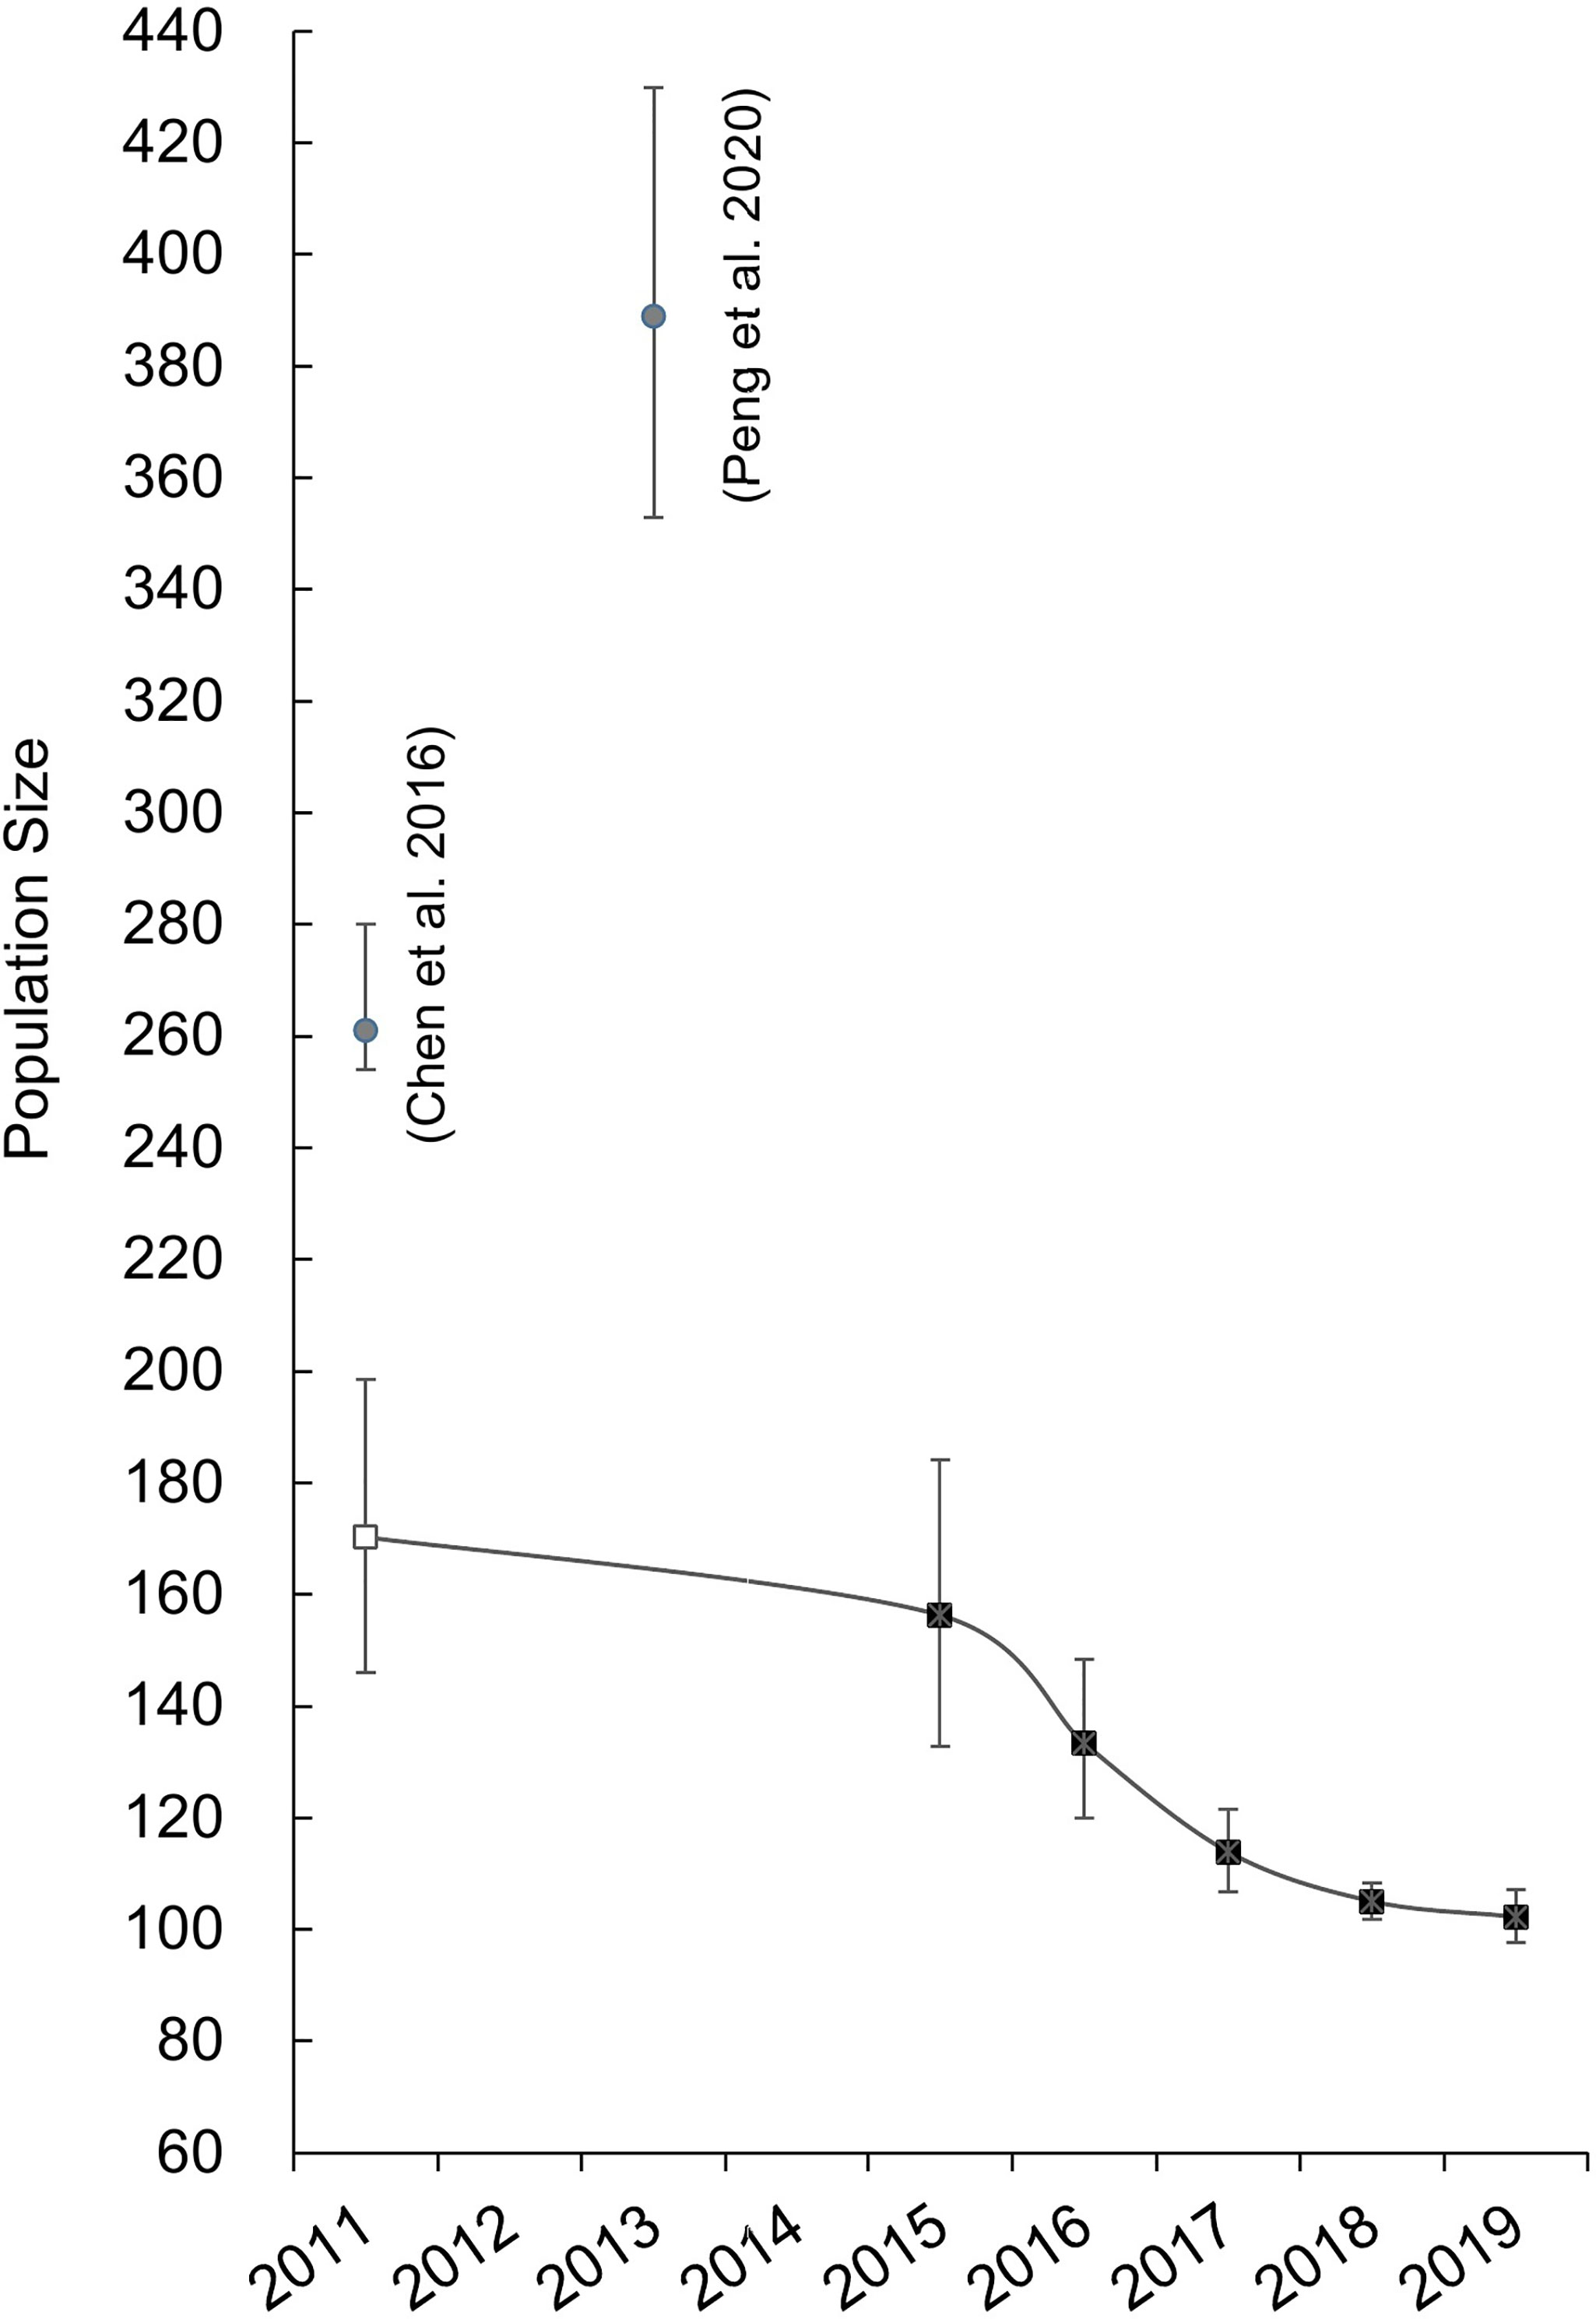
Figure 4 Estimates of the total population size of the DRE Indo-Pacific humpback dolphins (squares). The estimates of two previous studies (solid circles) were also presented here for comparison (Chen et al., 2016; Peng et al., 2020). The one provided by Chen et al. (2016) was readjusted (hollow square) using the overall mark ratio of the present study (see main text for detailed information).
Residency
The QAIC criteria suggested the “Emigration + re-immigration” as the optimal model to fit the observed LIRs of the DRE humpback dolphins (Supplementary Table 1). The best-fit model suggested a mean value of 2556.8 days (95% CI = 85.2–8519.8) and 263.8 days (95% CI = 12.7–10993.8) for the rest time in and outside the study area, respectively.
When different age and sex groups were examined separately, the hypothetical model considering mortality and emigration received the best support in fitting the juvenile LIRs (Supplementary Table 1 and Figure 5), with the mean residence estimated as 2,899.3 days (95% CI = 1549.1–9530.0); the QAIC provided comparable support for most of the hypothetical models in fitting the sex-undetermined adults’ LIRs (ΔQAICC < 2, Supplementary Table 1 and Figure 5), and the mean residency varied from 332.8 days (95% CI = 0.4–8095.1) under the “Emigration + re-immigration” hypothesis to 2,2306.7 (95% CI = 5401.9–8.4 × 10¹³) under the “Emigration/mortality” model. For the female adults, the “Closed” population model and “Emigration + re-immigration + mortality” model received comparable statistical support (ΔQAICC = 0.68), with the latter suggesting a rapid turnover of dolphins using the study area (mean time in = 33.2 days, 95% CI = 29.6–632.9; mean time out = 3.2 days, 95% CI = 0.1–116.2).
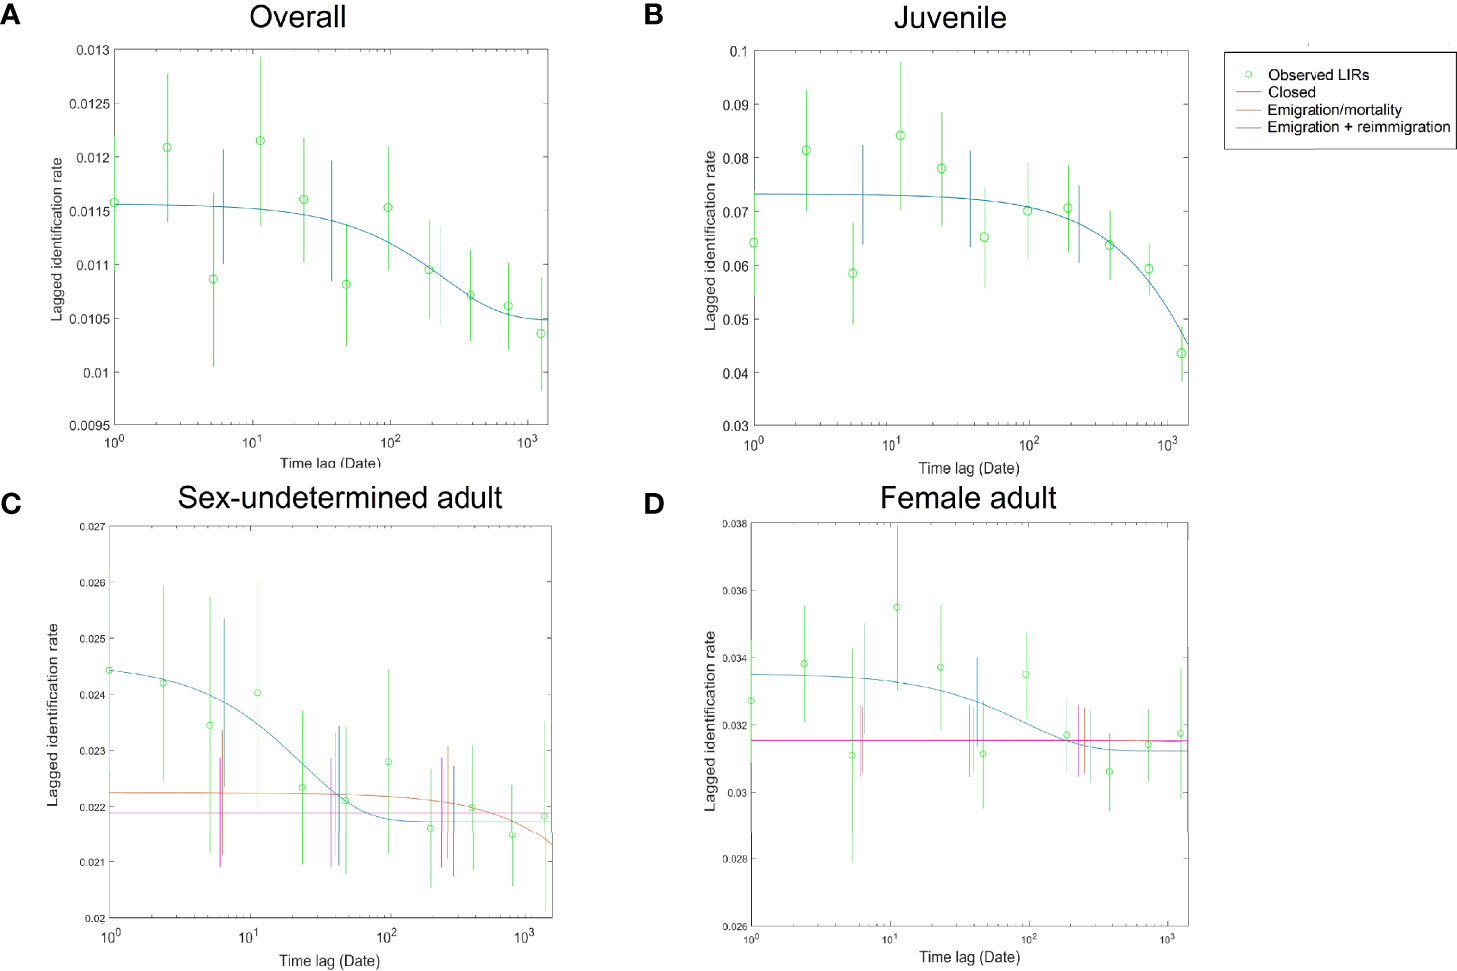
Figure 5 Lagged identification rate (LIR) and the best-fitted hypothetical models for (A) the overall DRE Indo-Pacific humpback dolphins; (B) the juveniles; (C) the sex-undetermined adults; and (D) the female adults. The less favored models with ΔQAIC ≤2 (see details in Supplementary Data S1) are also shown for the sex-undetermined and female adults.
Discussion
High-quality field data and robust analytical methods are fundamental in understanding the ecological processes of wildlife. Methodological problems may cause conflicting and misleading conclusions, which may affect the scientific process and compromise the conservation/management efficiency (Huang and Karczmarski, 2014; Hayward et al., 2015). However, it is not uncommon to find debates within ecological studies. Therefore, it is critically important to validate the conclusions among independent studies and update knowledge with the most recent data.
Data Robustness
Two major indexes are used to assess the robustness of the photo-ID dataset, including the population coverage and the capture probability. First, sufficiently high coverage of the population is particularly important for the population size estimation; otherwise, the mark-recapture model will underestimate the population size since part of the population members do not have a chance to be captured. Second, low capture probabilities, which are generally associated with insufficient sampling effort, may reduce the accuracy and precision in the population size and other parameter estimates (Tyne et al., 2016). Lin et al. (2018) simulated a sighting matrix data with a series combination of different population sizes and capture probabilities and showed that capture probabilities <0.5 will lead to >10% bias in the N estimate and capture probabilities <0.3 will lead to over 5% uncertainty (relative standard error) in the parameter estimate for small populations (~100 in population size).
Since the cumulative discovery curves of both of the two previous studies (Chen et al., 2016; Peng et al., 2020) and the present study reached the plateaus, the DRE humpback dolphins were expected to be covered by all the three independent studies. Of these, Chen et al.’s (2016) study reported a highly comparable catalogue size (N = 151) to the present study (N = 147 highly marked individuals), while Peng et al.’s (2020) catalogue was notably larger (N = 230, >50% larger compared to the former two studies). It is noteworthy that these three studies covered the same area in a consecutive time frame from 2011 to 2019. Therefore, the difference in catalogue sizes was unlikely caused by the natural demographic process (e.g., birth or immigration) for two major reasons: 1) long-lived marine mammals like the humpback dolphin cannot experience over 50% expansion through birth within such a short time; and 2) the DRE humpback dolphins were generally considered geographically closed (see Residency/Fidelity), and the transience, if any, should be encompassed by the present study based on a much larger dataset with longer sampling duration (60 months) compared to Peng et al.’s (2020) research (31 months).
Alternatively, artificial error, i.e., the false reidentification of individuals (re-sighted individuals have been added as new members), seems to be the most plausible explanation. The humpback dolphins in Chinese waters are well-known for their skin discoloration process (Jefferson and Leatherwood, 1997), which provides an excess of recognizable features for individual identification. Nevertheless, given that these features may change fast (Guo et al., 2020), it raises the risk of false reidentification, especially when the sighting interval is too long due to an insufficient survey effort (Lin et al., 2018; Guo et al., 2020). False reidentification may lead to a low capture probability and an overestimated population size. Unfortunately, neither Chen et al. (2016) nor Peng et al. (2020) reported their capture probability estimates. Considering that over half of their sighting data was composed of individuals ≤2 sightings (17% of the present dataset for comparison), a bias associated with low capture probabilities and/or insufficient survey effort is probable.
Population Size
Ns derived from different mathematical frameworks differ in their biological meanings. Specifically, the N of robust design or POPAN represents the number of individuals using the study area during the primary occasion (annual population size in the present study) or throughout the entire sampling period (2011–2014 in Chen et al., 2016), respectively. If the population is demographically constant (birth rate was equal to mortality rate), the N of POPAN should be [number of annual births × (number of sampling years -1)] larger than the N of robust design. If the population was declining through increasing mortalities, the difference in N estimates will further include the increasing number of deaths. Therefore, the Ns of different studies cannot be compared directly (Sandercock, 2006).
As expected, the present study proposed slightly smaller, yet comparable, Nm estimates (annual marked population size: 95–144) in comparison to Chen et al.’s (2016) Nm (total marked population size: 159). However, the difference in Nt estimates (102–156 in the present study vs. 261 in Chen et al. (2016) is too large to be justified by the difference of their biological meanings. Instead, this difference should be primarily due to the mark ratio used for Nm correction. For instance, the mark ratio used by Chen et al. (0.61, 2016) was substantially smaller than the range repeatedly calibrated by most of the other conspecific studies, including the humpback dolphins from the Xiamen Bay (0.94, Zeng et al., 2020), Hong Kong waters (0.86, Chan and Karczmarski, 2017), the east Taiwan Strait (0.86-0.94, Wang et al., 2012), and the present study (0.92–0.96). The cause of the low mark ratio in Chen et al.’s study is unknown. When readjusted with the average mark ratio of the present study, it would result in a total population size (Nt) of 170 (SE = 13, 95% CI = 146–199). If taking this readjusted Nt as the closest, albeit overestimated, estimate of the initial population size during Chen et al.’s (2016) study period in 2011, it would suggest 8.2% of individual loss from 2011 to 2015, which might be further accelerated (34.6% of individual loss) from 2015 to 2019.
Survival
The adults’ survival of DRE humpback dolphins was strikingly low. One may argue that the survival was underestimated due to models underestimating the emigration rate, implying that the models failed to distinguish the effect of mortality and emigration. However, independent photo-ID studies reported no individual exchange between the DRE and the neighboring populations since the early 2000s (Chen et al., 2016; Tang et al., 2021), which received support from the genetic differentiation recently confirmed by using microsatellite loci and Hi-C data (Zhang et al., 2020; Zhao et al., 2021). Therefore, long-distance migration, if any, should not affect the demographic process of this population. In other words, the loss of individuals of the DRE humpback dolphins should primarily represent mortality.
The survival of the DRE humpback dolphins was substantially lower than the range reported for conspecific populations inhabiting the highly urbanized Xiamen Bay (0.976, Zeng et al., 2020), west Taiwan coast (0.985, Wang et al., 2012), and Hong Kong waters (0.980, Chan and Karczmarski, 2017). Consistent with this low survival, an abnormally high carcass encounter rate was recorded during our field study. For instance, three fresh carcasses were spotted in a single month in 2015. Although the stranding or mortality information was not systematically collected, there is no doubt that most of the deaths went unobserved. To our knowledge, such low survival was rarely reported for delphinid populations, e.g., spinner dolphin (Stenella longirostris) in Hawaii (0.97), bottlenose dolphins (Tursiops truncatus) in the Azores archipelago (0.97), and Sarasota (0.92-0.99) (Silva et al., 2009; Tyne et al., 2014). One exception is the bottlenose dolphin in Barataria Bay, whose survival dropped from 0.95–0.96 to 0.87 after the Deepwater Horizon oil spill in 2010 (Lane et al., 2015). Unfortunately, the cause(s) of death remained undetermined for the carcasses recovered in the DRE region (Zhu et al., 2019), preventing us from identifying the major threat(s) to the population. However, these potential threats may be considered severe and intense since they caused acute mortality as suggested by the fluctuating survivals.
Survivals differed between the age/sex groups of the DRE humpback dolphins. In general, the juveniles and the male adults present lower survival compared to the female adults (Fruet et al., 2015; Arso Civil et al., 2019), which was generally explained by the size or sex selective pressures. For the DRE humpback dolphins, however, the survival of the juveniles and sex-undetermined adults fluctuated around the value of female adults, suggesting that the dominant pressure not only varied on different age groups but also presented a rapid temporal change.
Of all the candidate threats, that associated with dolphin-watching activities which occur primarily within the administrative boundary of the Qinzhou City is of particular concern (Wu et al., 2020). On the other hand, dolphin ranging patterns may vary between sex and age groups. For instance, female bottlenose dolphins in Shark Bay presented strong locational philopatry (Tsai and Mann, 2013), as the female calving success may benefit from staying in the familiar habitats and associates (Rendell et al., 2019). Female-biased philopatry might also exist in the DRE humpback dolphins (see Residency/Fidelity), which would account well for the relatively constant survivals observed for the female adults in the present study. In comparison, the point estimates of the juvenile and sex-undetermined adult survivals, although with overlapping confidence intervals, seem to imply an improving survival, which was consistent with the reducing population decline rate of the DRE humpback dolphins.
Residency/Fidelity
The robust design model incorporates the effect of temporary emigration and therefore is expected to provide a more accurate estimate of survival. However, the residency of female adults, which presented the lowest level of survival, was best described by no movement (“closed population”). Although the robust design modeling detected certain evidence for the temporary emigration, the emigration probability was estimated not higher than 0.08, i.e., only a few individuals. Consequently, it should not provide sufficient supply for the re-immigrants. Thus, the emigration of the present study is likely to be artifact, and the reducing identification/sighting probability of individuals is most likely determined by mortality instead of animal movement.
To date, two studies compared the photo-ID catalogues of the six humpback dolphin populations in China, which are usually separated by over 150 km, and found no match (Wang et al., 2016; Tang et al., 2021). The lack of permanent or temporal migration was also reported in smaller geographic scales. For instance, Guo et al. (2020) found no individual overlap between the two flanking zones of the Pearl River Delta region (ca. 50 km in linear distance). An absence of individual exchange was also reported between DRE humpback dolphins and the neighboring population in its eastern waters (ca. 60 km in linear distance, Chen et al., 2016). These findings, albeit based on relatively short survey periods, support the lack of long-distance travel or high levels of site fidelity and residency of the humpback dolphins in Chinese waters. Therefore, the movement outside the study area as revealed by LIRs is most likely to be explained by the temporary use of the edge of the population range, rather than the migration between populations.
Conservation Implications
The present study presented a robust photo-ID dataset to assess the movement and demographics of the DRE humpback dolphins. By reviewing and comparing with the previous demographic parameters, it was suggested that the DRE humpback dolphins have experienced a rapid decline in abundance in the mid-2010s, with the latest estimate of 102 (95% CI: 98–107) in 2019. The population remains unsustainable with the present survival rates, especially considering the small size of population. Therefore, it is urgent to identify the major threat(s) and design conservation/management programs accordingly in the near future.
Eco-tourism has been proposed to be one of the major threats to the DRE humpback dolphins (Chen et al., 2016; Wu et al., 2020). Dolphin–boat interaction has been suggested to alter the dolphin behavior budget (Constantine et al., 2004). If the behavior harassment is intense, it may further cause the displacement of animals (Shannon et al., 2017). An ongoing study suggests that the core habitat of the DRE humpback dolphin had shifted from the waters off Sanniang Cove (where it is also the dolphin watching site) during the 2000s to the shallow waters off the Liangjiang Bay in the early 2010s (Lin et al. in prep.). Although the dolphin–boat interaction is generally not considered a lethal factor, the risk associated with living in an un-preferred area may increase. Therefore, the indirect impact of dolphin–boat interaction, especially from a demographic perspective, should be included in conservation plans and dolphin-watching activities should be regulated in the future.
Data Availability Statement
The raw data supporting the conclusions of this article will be made available by the authors, without undue reservation.
Ethics Statement
The animal study was reviewed and approved by the Institute of Deep-sea Science and Engineering, Chinese Academy of Science.
Author Contributions
WzL: conceptualization, data curation, funding acquisition, formal analysis, and writing. RZ: funding acquisition, data curation, review and editing. BL and SC: data curation, formal analysis, review and editing. MlL and MmL: data curation. WhL and SL: project administration, funding acquisition, resources, review, and editing. All authors contributed to the article and approved the submitted version.
Funding
This study was funded by the National Natural Science Foundation of China (41406182, 41306169, and 41422604), the Biodiversity Investigation, Observation and Assessment Program (2019-2023) of the Ministry of Ecology and Environment of China, the Alashan Society of Entrepreneurs and Ecology (SEE), Natural Science Foundation of Guangdong Province, China (2018A030313870), the Ocean Park Conservation Foundation Hong Kong (AW02-1920, MM01-1920), and the “One Belt and One Road” Science and Technology Cooperation Special Program of the International Partnership Program of Chinese Academy of Sciences (Grant number 183446KYSB20200016). This work is part of a larger-scale study supported with funding from the Ministry of Agriculture and Rural Affairs of the People’s Republic of China (Chinese White Dolphin Action Plan 2017-2026), with auxiliary support from the Ocean Park Conservation Foundation Hong Kong (OPCFHK) and the Paradise International Foundation (PFI).
Conflict of Interest
The authors declare that the research was conducted in the absence of any commercial or financial relationships that could be construed as a potential conflict of interest.
Publisher’s Note
All claims expressed in this article are solely those of the authors and do not necessarily represent those of their affiliated organizations, or those of the publisher, the editors and the reviewers. Any product that may be evaluated in this article, or claim that may be made by its manufacturer, is not guaranteed or endorsed by the publisher.
Acknowledgments
We thank other staff and students from the Marine Mammal and Marine Bioacoustics Laboratory, Haiping Wu and her group, Jingzhen Wang, and Xiaopeng Lin for their contribution and help during data collection in the field. We thank Agathe Serres for her help in improving the manuscript. WzL would like to give his thanks to Ms. Ruilian Zhou, Ye Lin, and Ge Lin for their indispensable support to his work.
Supplementary Material
The Supplementary Material for this article can be found online at: https://www.frontiersin.org/articles/10.3389/fmars.2022.782680/full#supplementary-material
References
Anderson D. R., Burnham K. P., White G. C. (1994). AIC Model Selection in Overdispersed Capture-Recapture Data. Ecology 75, 1780–1793. doi: 10.2307/1939637
Arso Civil M., Cheney B., Quick N. J., Islas-Villanueva V., Graves J. A., Janik V. M., et al. (2019). Variations in Age- and Sex-Specific Survival Rates Help Explain Population Trend in a Discrete Marine Mammal Population. Ecol. Evol. 9, 533–544. doi: 10.1002/ece3.4772
Burnham K. P., Anderson D. R., White G. C., Brownie C., Pollock K. H. (1987). Design and Analysis of Fish Survival Experiments Based on Release-Recapture Data. Am. Fish. Soc. Monogr. 5, 1–437.
Buckland S. T., Burnham K. P., Augustin N. H. (1997). Model Selection: An Integral Part of Inference. Biometrics, 53, 603–618. doi: 10.2307/2533961
Burnham K. P., Anderson D. R. (2002). Model Selection and Multimodel Inference. A Practical Information - Theoretic Approach, Second Ed (New York: Springer-Verlag).
Cassini M. H. (1999). The Evolution of Reproductive Systems in Pinnipeds. Behav. Ecol. 10, 612–616. doi: 10.1093/beheco/10.5.612
Caswell H., Fujiwara M., Brault S. (1999). Declining Survival Probability Threatens the North Atlantic Right Whale. Proc. Natl. Acad. Sci. U.S.A. 96, 3308. doi: 10.1073/pnas.96.6.3308
Chang W. L., Karczmarski L., Huang S. L., Gailey G., Chou L. S. (2016). Reproductive Parameters of the Taiwanese Humpback Dolphin (Sousa Chinensis Taiwanensis). Region. Stud. Mar. Sci. 8, 459–465. doi: 10.1016/j.rsma.2016.08.001
Chan S. C. Y., Karczmarski L. (2017). Indo-Pacific Humpback Dolphins (Sousa Chinensis) in Hong Kong: Modelling Demographic Parameters With Mark-Recapture Techniques. PloS One 12, e0174029. doi: 10.1371/journal.pone.0174029
Chen B., Jefferson T. A., Wang L., Gao H., Zhang H., Zhou Y., et al. (2018). Geographic Variation in Pigmentation Patterns of Indo-Pacific Humpback Dolphins (Sousa Chinensis) in Chinese Waters. J. Mammal. 99, 915–922. doi: 10.1093/jmammal/gyy068
Chen B., Xu X., Jefferson T. A., Olson P. A., Qin Q., Zhang H., et al. (2016). Conservation Status of the Indo-Pacific Humpback Dolphin (Sousa Chinensis) in the Northern Beibu Gulf, China. Adv. Mar. Biol. 73, 119–139. doi: 10.1016/bs.amb.2015.10.001
Chen B., Zheng D., Zhai F., Xu X., Sun P., Wang Q., et al. (2008). Abundance, Distribution and Conservation of Chinese White Dolphins (Sousa Chinensis) in Xiamen, China. Mamm. Biol. - Z. Für. Säugetierkunde. 73, 156–164. doi: 10.1016/j.mambio.2006.12.002
Choquet R., Lebreton J.-D., Gimenez O., Reboulet A.-M., Pradel R. (2009). U-CARE: Utilities for Performing Goodness of Fit Tests and Manipulating CApture–REcapture Data. Ecography 32, 1071–1074. doi: 10.1111/j.1600-0587.2009.05968.x
Constantine R., Brunton D. H., Dennis T. (2004). Dolphin-Watching Tour Boats Change Bottlenose Dolphin (Tursiops Truncatus) Behaviour. Biol. Conserv. 117, 299–307. doi: 10.1016/j.biocon.2003.12.009
Cormack R. M. (1964). Estimates of Survival From the Sighting of Marked Animals. Biometrika 51, 429–438. doi: 10.1093/biomet/51.3-4.429
Currey R. J. C., Dawson S. M., Slooten E., Schneider K., Lusseau D., Boisseau O. J., et al. (2009). Survival Rates for a Declining Population of Bottlenose Dolphins in Doubtful Sound, New Zealand: An Information Theoretic Approach to Assessing the Role of Human Impacts. Aquat. Conserv.: Mar. Freshwat. Ecosyst. 19, 658–670. doi: 10.1002/aqc.1015
Friday N., Smith T. D., Stevick P. T., Allen J. (2000). Measurement of Photographic Quality and Individual Distinctiveness for the Photographic Identification of Humpback Whales, Megaptera Novaeangliae. Mar. Mammal. Sci. 16, 355–374. doi: 10.1111/j.1748-7692.2000.tb00930.x
Fruet P. F., Daura-Jorge F. G., Möller L. M., Genoves R. C., Secchi E. R. (2015). Abundance and Demography of Bottlenose Dolphins Inhabiting a Subtropical Estuary in the Southwestern Atlantic Ocean. J. Mammal. 96, 332–343. doi: 10.1093/jmammal/gyv035
Gailey G., Karczmarski L. (2012). Discovery: Photo-Identification Data-Management System for Individually Recognizable Animals. Available at: http://www.biosch.hku.hk/ecology/staffhp/lk/Discovery.
Guo L., Lin W., Zeng C., Luo D., Wu Y. (2020). Investigating the Age Composition of Indo-Pacific Humpback Dolphins in the Pearl River Estuary Based on Their Pigmentation Pattern. Mar. Biol. 167, 50. doi: 10.1007/s00227-020-3650-x
Hastings K. K., Small R. J., Pendleton G. W. (2012). Sex- and Age-Specific Survival of Harbor Seals (Phoca Vitulina) From Tugidak Island, Alaska. J. Mammal. 93, 1368–1379. doi: 10.1644/11-MAMM-A-291.1
Hayward M. W., Boitani L., Burrows N. D., Funston P. J., Karanth K. U., Mackenzie D. I., et al. (2015). Ecologists Need Robust Survey Designs, Sampling and Analytical Methods. J. Appl. Ecol. 52, 286–290. doi: 10.1111/1365-2664.12408
Huang S. L., Karczmarski L. (2014). Indo-Pacific Humpback Dolphin: A Demographic Perspective of a Threatened Species. Primatol. Monogr. 9, 249–272. doi: 10.1007/978-4-431-54523-1_13
Huang S. L., Karczmarski L., Chen J., Zhou R., Lin W., Zhang H., et al. (2012). Demography and Population Trends of the Largest Population of Indo-Pacific Humpback Dolphins. Biol. Conserv. 147, 234–242. doi: 10.1016/j.biocon.2012.01.004
Jefferson T. A. (2000). Population Biology of the Indo-Pacific Hump-Backed Dolphin in Hong Kong Waters. Wildlife. Monogr. 64, 1–65.
Jefferson T. A., Curry B. E. (2015). Humpback Dolphins: A Brief Introduction to the Genus Sousa. Adv. Mar. Biol. 72, 1–16. doi: 10.1016/bs.amb.2015.04.001
Jefferson T. A., Leatherwood S. (1997). Distribution and Abundance of Indo-Pacific Hump-Backed Dolphins (Sousa Chinensis Osbec) in Hong Kong Waters. Asian Mar. Biol. 14, 93–110.
Jolly G. (1965). Explicit Estimates From Capture±Recapture Data With Both Death and Immigration-Stochastic Models. Biometrika 52, 225–247. doi: 10.1093/biomet/52.1-2.225
Karczmarski L. (1999). Group Dynamics of Humpback Dolphins (Sousa Chinensis) in the Algoa Bay Region, South Africa. J. Zool. 249, 283–293. doi: 10.1111/j.1469-7998.1999.tb00765.x
Karczmarski L., Würsig B., Gailey G., Larson K. W., Vanderlip C. (2005). Spinner Dolphins in a Remote Hawaiian Atoll: Social Grouping and Population Structure. Behav. Ecol. 16, 675–685. doi: 10.1093/beheco/ari028
Lane S. M., Smith C. R., Mitchell J., Balmer B. C., Barry K. P., Mcdonald T., et al. (2015). Reproductive Outcome and Survival of Common Bottlenose Dolphins Sampled in Barataria Bay, Louisiana, USA, Following the Deepwater Horizon Oil Spill. Proc. R. Soc. B.: Biol. Sci. 282, 20151944. doi: 10.1098/rspb.2015.1944
Lemaître J.-F., Ronget V., Tidière M., Allainé D., Berger V., Cohas A., et al. (2020). Sex Differences in Adult Lifespan and Aging Rates of Mortality Across Wild Mammals. Proc. Natl. Acad. Sci. 117, 8546. doi: 10.1073/pnas.1911999117
Lin W., Chan S. C. Y., Zeng C., Karczmarski L., Wu Y. (2018). Mark-Recapture Technique for Demographic Studies of Chinese White Dolphins - Applications and Suggestions. Acta Theriol. Sin. 38, 586–596. doi: 10.16829/j.slxb.150171
Lin W., Karczmarski L., Xia J., Zhang X., Yu X., Wu Y. (2016). Increased Human Occupation and Agricultural Development Accelerates the Population Contraction of an Estuarine Delphinid. Sci. Rep. 6, 35713. doi: 10.1038/srep35713
Peng C., Wu H., Wang X., Zhu Q., Jefferson T. A., Wang C.-C., et al. (2020). Abundance and Residency Dynamics of the Indo-Pacific Humpback Dolphin, Sousa Chinensis, in the Dafengjiang River Estuary, China. Mar. Mammal. Sci. 36, 623–637. doi: 10.1111/mms.12663
Pollock K. H. (1982). A Capture-Recapture Design Robust to Unequal Probability of Capture. J. Wildlife. Manage. 46, 752–757. doi: 10.2307/3808568
Promislow D. E. L. (1992). Costs of Sexual Selection in Natural Populations of Mammals. Proc. R. Soc. London. Ser. B.: Biol. Sci. 247, 203–210. doi: 10.1098/rspb.1992.0030
Rendell L., Cantor M., Gero S., Whitehead H., Mann J. (2019). Causes and Consequences of Female Centrality in Cetacean Societies. Philos. Trans. R. Soc. B.: Biol. Sci. 374, 20180066. doi: 10.1098/rstb.2018.0066
Rochelle T. L., Yeung D. K. Y., Bond M. H., Li L. M. W. (2015). Predictors of the Gender Gap in Life Expectancy Across 54 Nations. Psychol. Health Med. 20, 129–138. doi: 10.1080/13548506.2014.936884
Sandercock B. K. (2006). Estimation of Demographic Parameters From Live-Encounter Data: A Summary Review. J. Wildlife. Manage. 70, 1504–1520. doi: 10.2193/0022-541X(2006)70[1504:EODPFL]2.0.CO;2
Seber G. (1965). A Note on the Multiple±Recapture Census. Biometrika 52, 249–259. doi: 10.1093/biomet/52.1-2.249
Shannon G., Larson C. L., Reed S. E., Crooks K. R., Angeloni L. M. (2017). “Ecological Consequences of Ecotourism for Wildlife Populations and Communities,” in Ecotourism’s Promise and Peril: A Biological Evaluation. Eds. Blumstein D. T., Geffroy B., Samia D. S. M., Bessa E. (Cham: Springer International Publishing), 29–46.
Silva M. A., Magalhaes S., Rui P., Santos R. S., Hammond P. S. (2009). Estimating Survival and Abundance in a Bottlenose Dolphin Population Taking Into Account Transience and Temporary Emigration. Mar. Ecol. Prog. 392, 263–276. doi: 10.3354/meps08233
Tang X., Lin W., Karczmarski L., Lin M., Chan S. C. Y., Liu M., et al. (2021). Photo-Identification Comparison of Four Indo-Pacific Humpback Dolphin Populations Off Southeast China. Integr. Zool. 16, 586–593. doi: 10.1111/1749-4877.12537
Tsai Y.-J. J., Mann J. (2013). Dispersal, Philopatry, and the Role of Fission-Fusion Dynamics in Bottlenose Dolphins. Mar. Mammal. Sci. 29, 261–279. doi: 10.1111/j.1748-7692.2011.00559.x
Tyne J. A., Loneragan N. R., Johnston D. W., Pollock K. H., Williams R., Bejder L. (2016). Evaluating Monitoring Methods for Cetaceans. Biol. Conserv. 201, 252–260. doi: 10.1016/j.biocon.2016.07.024
Tyne J. A., Pollock K. H., Johnston D. W., Bejder L. (2014). Abundance and Survival Rates of the Hawai’i Island Associated Spinner Dolphin (Stenella Longirostris) Stock. PloS One 9, e86132. doi: 10.1371/journal.pone.0086132
Urian K., Gorgone A., Read A., Balmer B., Wells R. S., Berggren P., et al. (2015). Recommendations for Photo-Identification Methods Used in Capture-Recapture Models with Cetaceans. Mar. Mamm. Sci. 31, 298–321. doi: 10.1111/mms.12141
Wang X., Wu F., Chang W. L., Hou W., Chou L. S., Zhu Q. (2016). Two Separated Populations of the Indo-Pacific Humpback Dolphin (Sousa Chinensis) on Opposite Sides of the Taiwan Strait: Evidence From a Larger-Scale Photo-Identification Comparison. Mar. Mammal. Sci. 32, 390–399. doi: 10.1111/mms.12257
Wang J. Y., Yang S. C., Fruet P. F., Daura-Jorge F. G., Secchi E. R. (2012). Mark-Recapture Analysis of the Critically Endangered Eastern Taiwan Strait Population of Indo-Pacific Humpback Dolphins (Sousa Chinensis): Implications for Conservation. Bull. Mar. Sci. 88, 885–902. doi: 10.5343/bms.2010.1097
White G., Burnham K. (1999). Program MARK: Survival Estimation From Populations of Marked Animals. Bird. Stud. 46, S120–S139. doi: 10.1080/00063659909477239
Whitehead H. (2001). Analysis of Animal Movement Using Opportunistic Indivdiual Identifications: Application to Sperm Whales. Ecology 82, 1417–1432. doi: 10.1890/0012-9658(2001)082[1417:AOAMUO]2.0.CO;2
Whitehead H. (2009). SOCPROG Programs: Analysing Animal Social Structures. Behav. Ecol. Sociobiol. 63, 765–778. doi: 10.1007/s00265-008-0697-y
Wu H., Peng C., Huang H., Jefferson T. A., Huang S. L., Chen M., et al. (2020). Dolphin-Watching Tourism and Indo-Pacific Humpback Dolphins (Sousa Chinensis) in Sanniang Bay, China: Impacts and Solutions. Eur. J. Wildlife. Res. 66, 17. doi: 10.1007/s10344-019-1355-6
Wu H., Xu Y., Peng C., Liao Y., Wang X., Jefferson T. A., et al. (2017). Long-Term Habitat Loss in a Lightly-Disturbed Population of the Indo-Pacific Humpback Dolphin, Sousa Chinensis. Aquat. Conserv. Mar. Freshwat. Ecosyst. 27, 1–11. doi: 10.1002/aqc.2778
Zeng Q., Lin W., Dai Y., Zhong M., Wang X., Zhu Q. (2020). Modeling Demographic Parameters of an Edge-of-Range Population of Indo-Pacific Humpback Dolphin in Xiamen Bay, China. Region. Stud. Mar. Sci. 40, 101462. doi: 10.1016/j.rsma.2020.101462
Zhang P., Zhao Y., Li C., Lin M., Dong L., Zhang R., et al. (2020). An Indo-Pacific Humpback Dolphin Genome Reveals Insights Into Chromosome Evolution and the Demography of a Vulnerable Species. iScience 23, 101640. doi: 10.1016/j.isci.2020.101640
Zhao L., Sakornwimon W., Lin W., Zhang P., Chantra R., Dai Y., et al. (2021). Early Divergence and Differential Population Histories of the Indo-Pacific Humpback Dolphin in the Pacific and Indian Oceans. Integr. Zool. 16, 612–625. doi: 10.1111/1749-4877.12527
Keywords: humpback dolphin, residency, fidelity, robust design, Sousa chinensis, mark-recapture modeling
Citation: Lin W, Zheng R, Liu B, Chen S, Lin M, Liu M, Liu W and Li S (2022) Low Survivals and Rapid Demographic Decline of a Threatened Estuarine Delphinid. Front. Mar. Sci. 9:782680. doi: 10.3389/fmars.2022.782680
Received: 24 September 2021; Accepted: 21 March 2022;
Published: 06 May 2022.
Edited by:
Vitor H. Paiva, University of Coimbra, PortugalReviewed by:
Philippe Verborgh, Museu da Baleia da Madeira, PortugalDelphine Brigitte Hélène Chabanne, Murdoch University, Australia
Copyright © 2022 Lin, Zheng, Liu, Chen, Lin, Liu, Liu and Li. This is an open-access article distributed under the terms of the Creative Commons Attribution License (CC BY). The use, distribution or reproduction in other forums is permitted, provided the original author(s) and the copyright owner(s) are credited and that the original publication in this journal is cited, in accordance with accepted academic practice. No use, distribution or reproduction is permitted which does not comply with these terms.
*Correspondence: Songhai Li, bGlzaEBpZHNzZS5hYy5jbg==; Wenhua Liu, d2hsaXVAc3R1LmVkdS5jbg==
†These authors have contributed equally to this work