Abstract
Global climate change and anthropogenic disturbance have significantly degraded biodiversity in coral reef ecosystems. The genetic potential and adaptability of corals are key factors used to predict the fate of global coral reefs under climate change. In this study, we used eight microsatellite loci to study the patterns of reproduction, genetic diversity, and genetic structure of 302 Porites lutea samples across 13° latitudes in the South China Sea (8.8644°N–22.6117°N). The results indicated that P. lutea reproduces largely via sexual reproduction on scales of 5 m and greater and has abundant gene diversity. Additionally, the tropical populations harbored high genetic diversity (based on alleles, effective number of alleles, gene diversity, and heterozygosity). In contrast, genetic diversity was lower in subtropical coral populations. Genetic variation values and pairwise FST revealed that tropical and subtropical populations had significantly different genetic structures. Finally, the Mantel tests showed that the genetic differentiation and genetic variation of P. lutea were strongly correlated with sea surface temperature and slightly correlated with geographical distance. These results indicated that tropical P. lutea populations have high genetic potential and adaptability because of their sexual reproduction and genetic diversity, giving them a greater capacity to cope with climate change. Subtropical coral populations showed lower genetic diversity and, thus, relatively poor genetic resilience in response to low average sea surface temperature and human activities. Our study provides a theoretical basis for the protection and restoration of coral reefs.
Introduction
Global warming has greatly decreased biodiversity and poses a critical threat to the health of coral reef ecosystems (Hughes et al., 2017; Thomas et al., 2017). The rising sea surface temperature (SST) causes a breakdown in the symbiotic associations between the coral host and its endosymbiotic dinoflagellate, resulting in coral bleaching (Chen et al., 2018). For instance, the record temperatures reported during 2015–2016 triggered a pan-tropical episode of coral bleaching (Hughes et al., 2017). An important factor in coral recovery from environmental stress is its genetic potential (Williams et al., 2014), or the ability of a population to evolve under changing selection pressures (Meyers et al., 2005). Genetic diversity was regarded as the fundamental evolutionary source in speciation and adaptation, reflecting the level of population genetic potential and adaptability. As a population’s genetic diversity increases, so does its genetic potential (Barrett and Schluter, 2008; Hoegh-Guldberg and Bruno, 2010; Thomas et al., 2017). With increases in environmental stressors such as eutrophication, habitat fragmentation, and climate change, the genetic diversity of keystone species may become increasingly important (Hughes and Stachowicz, 2004). The sea surface temperature, ocean currents, breeding patterns, and geographical distances were the most reported factors affecting genetic characteristics of corals in some coral reefs (Knittweis et al., 2009; Tye et al., 2013; Mclachlan et al., 2020). In Western Australia, the low latitude coral populations had higher genetic potential than the high latitude coral populations. The corals in high latitudes were more vulnerable than corals in tropical areas to cope with global climate change (Ayre and Hughes, 2004; Miller and Ayre, 2010; Thomas et al., 2017). Genetic diversity is considered to enhance the sustainability of populations over evolutionary time scales by furnishing sufficient alleles for future environment changes (Ayre and Hughes, 2004; Williams et al., 2014).
The coral reefs of the South China Sea (SCS) are on the northern edge of the Coral Triangle region and comprise high diversity and abundant biological resources (Yu, 2012). The SCS contains both tropical and subtropical coral reefs (Yu, 2012), with distinct SSTs linked to latitudinal gradients (Chen et al., 2019; Qin et al., 2019). However, the genetic characteristics of corals have barely been investigated in the SCS. Recently, Wu et al. (2021) reported low genetic diversity and moderate genetic differentiation of the dominant coral Turbinaria peltata at relatively high latitudes in the SCS. The genetic structure was significantly affected by the average SST, geographical isolation, and anthropogenic activities. Huang et al. (2018) reported high genetic diversity and connectivity in P. lutea across the SCS based on nuclear markers (internal transcribed spacer and β-tubulin). However, no evident genetic structure or effecting factors were found. The genetic characteristics of Mycedium elephantotus, Platygyra sinensis, and Platygyra verweyi in the north SCS also have no obvious genetic structure (Yu et al., 1999; Ng and Morton, 2003; Keshavmurthy et al., 2012). The limited genetic information and limited number of species investigated in this area has hampered the formulation of coral reef protection measures.
Porites lutea is widely distributed in the subtropical and tropical regions of the SCS. This coral species is considered to be adaptable to climate change and other forms of anthropogenic disturbance (Xu et al., 2017; Qin et al., 2019). The species contains a high density of heat-tolerant symbiotic zooxanthellae C15 and a rich diversity of symbiotic microorganisms (Liang et al., 2017; Chen et al., 2020). In this study, we investigated the genetics of P. lutea from coral reef sites in the SCS spanning 13° latitudes based on eight microsatellite loci. We focused on (1) the relationship between genetic potential and reproduction patterns and genetic diversity, (2) how genetic structure varies across latitudes, (3) the relationship between P. lutea genetic structure and SST in the SCS, and (4) the genetic potential and adaptability of P. lutea populations in tropical areas.
Materials and Methods
Sample Collection
Fragments (∼2–3 cm2, n = 302) of P. lutea were collected from 14 different coral reef sites in the SCS, covering a wide range of latitudes (8.8644°N to 22.6117°N): Xiaolajia and Yangmeikeng in Daya Bay; one site in Weizhou Island; one site-Luhuitou in Sanya Bay; Beijiao, Qilianyu, Yongxing, Dongdao, Yuzhuo, and Langhua in the Xisha Islands; and Huangyan in Zhongsha Islands; Sanjiaojiao, Xinyijiao, and Dongjiao in the Nansha Islands (Table 1 and Figure 1). We identified P. lutea based on morphological characteristics. In addition, the collected samples of P. lutea were confirmed by ITS in our previous study (Huang et al., 2018). Furthermore, many studies showed that P. lutea is widely distributed in the SCS (Yu, 2012; Huang et al., 2021). Fragments were obtained at depths of 4–10 m. Sampled colonies were separated by at least 5 m to minimize the probability of collecting samples from the same ramet more than once (Magalon et al., 2005). Small fragments were broken from colonies using a hammer and chisel, and then stored in 95% ethanol or at −80°C until DNA extraction. Genomic DNA was extracted using a marine animal tissue genomic DNA extraction kit (Tiangen Biotech, Beijing, China) following the manufacturer’s protocol.
TABLE 1
| Region | Site | Reef type | Sampling dates | N | Ng | Ng/N | Latitude | Longitude |
| Daya Bay | Xiaolajia | Subtropical non-reefal | 2018.05 | 18 | 18 | 1.00 | 22.6117° | 114.6311° |
| Yangmeikeng | Subtropical non-reefal | 2018.05 | 21 | 21 | 1.00 | 22.5492° | 114.5694° | |
| Weizhou Island | Weizhou | Subtropical reefal | 2015.08 | 20 | 20 | 1.00 | 21.0204° | 109.0805° |
| Sanya Bay | Luhuitou | Tropical reefal | 2015.08 | 20 | 20 | 1.00 | 18.2176° | 109.4855° |
| Xisha Islands | Beijiao | Tropical reefal | 2015.08 | 19 | 19 | 1.00 | 17.1033° | 111.4830° |
| Qilianyu | Tropical reefal | 2015.08 | 23 | 23 | 1.00 | 16.9703° | 112.3142° | |
| Yongxing | Tropical reefal | 2015.08 | 24 | 24 | 1.00 | 16.8476° | 112.3588° | |
| Dongdao | Tropical reefal | 2015.08 | 23 | 23 | 1.00 | 16.6748° | 112.7375° | |
| Yuzhuo | Tropical reefal | 2015.08 | 23 | 23 | 1.00 | 16.3638° | 112.0168° | |
| Langhua | Tropical reefal | 2015.08 | 20 | 20 | 1.00 | 16.0845° | 112.5921° | |
| Zhongsha Islands | Huangyan | Tropical reefal | 2015.08 | 23 | 23 | 1.00 | 15.2190° | 117.7477° |
| Nansha Islands | Sanjiaojiao | Tropical reefal | 2016.08 | 24 | 24 | 1.00 | 10.1899° | 115.2967° |
| Xinyijiao | Tropical reefal | 2016.08 | 22 | 22 | 1.00 | 9.3281° | 115.9332° | |
| Dongjiao | Tropical reefal | 2018.06 | 22 | 21 | 0.95 | 8.8644° | 112.8300° | |
| Total | 302 | 301 | ||||||
| 21.57 | 21.50 | 0.99 | ||||||
| SD | 1.84 | 1.84 | 0.13 |
Porites lutea samples were collected from 14 coral reef sites in the South China Sea.
Sample size (N), number of unique multilocus genotypes (Ng).
FIGURE 1
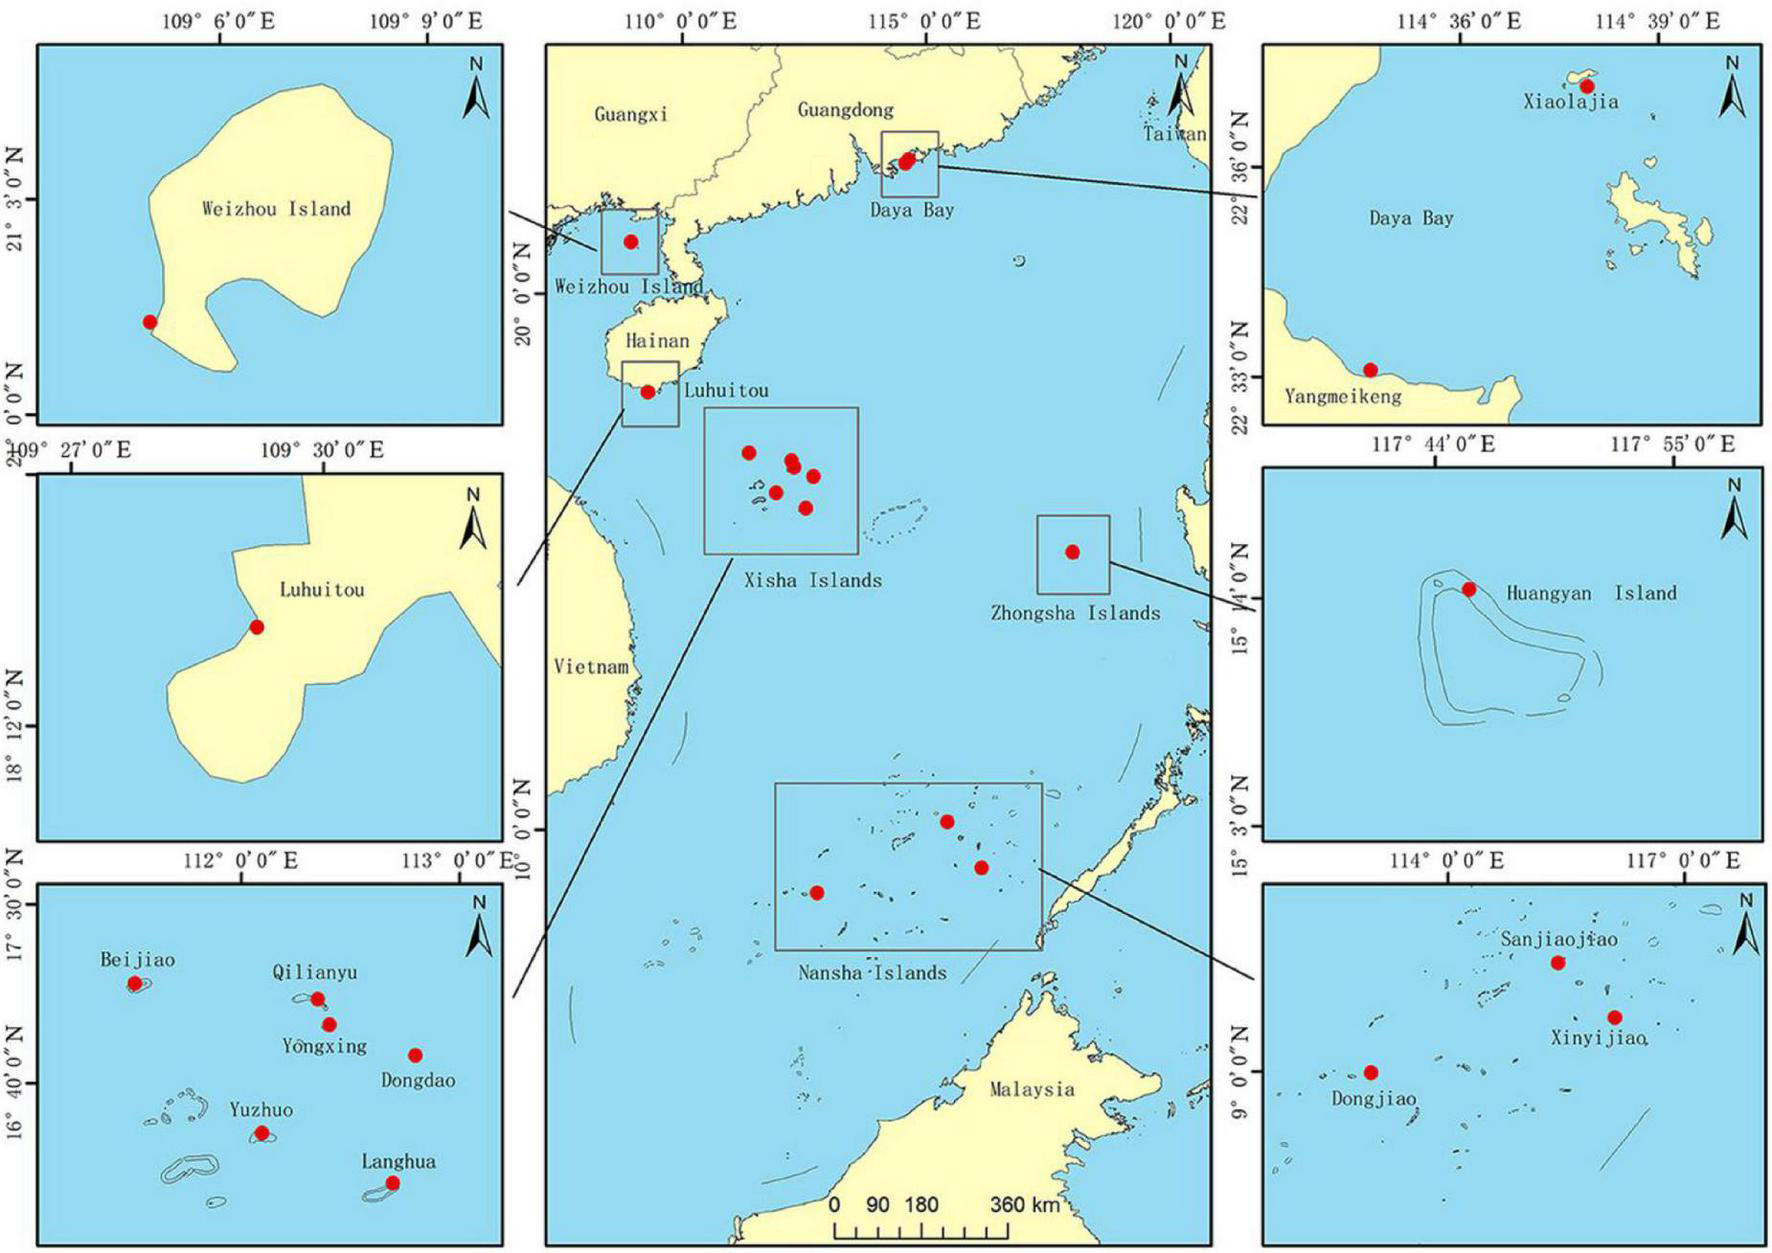
Samples collected from sites in the South China Sea (SCS). Daya Bay is at the northern edge of Porites lutea distribution in the SCS, a region that also includes Xiaolajia and Yangmeikeng. Most coral colonies at Daya Bay have not developed into extensive coral reefs (Chen et al., 2007). Weizhou Island is in the Beibu Gulf at (northwestern SCS); colonies there have developed into extensive coral reefs. Sanya Bay is in the tropical region of the sea. Xisha Islands, Zhongsha Islands, and Nansha Islands are also part of the tropical region. Xisha Islands include Beijiao, Qilianyu, Yongxing, Dongdao, Yuzhuo, and Langhua. Nansha includes Sanjiaojiao, Xinyijiao, and Dongjiao.
PCR Amplification and Sequencing
Microsatellite markers can be used to study the genetics of different species of the same genus (Magalon et al., 2004; Severance et al., 2010). Eight microsatellite loci from P. lobata were validated for the analysis of P. lutea in this study. Primers PL0340, PL1556, PL2258, and PL0780 were from Polato et al. (2010), and primers PL1370, PL0905, PL1483, and PL1868 were from Baums et al. (2012). The forward primer of PL0340, PL2258, PL0780, PL0905, PL1968 was fluorescently labeled with 6FAM. The forward primer of PL1556, PL1370, PL1483 was fluorescently labeled with HEX. The PCR was performed with 50 ng template DNA, 0.4 μL forward primer, 0.4 μL reverse primer, 10 μL 2× PCR enzyme mix (Tiangen Biotech) and Tiangen-free water to the total volume of 20 μL. Thermocycling (ABI GeneAmp® 9700) was performed as follows: 94°C for 3 min, 40 cycles at 94°C for 30 s, annealing temperature for 30 s, 72°C for 45 s, and 72°C for 5 min. Fragments were analyzed using capillary electrophoresis, on an ABI 3730 sequencer with an internal size standard Genescan LIZ 500 (Applied Biosystems). Electropherograms were visualized, and allele sizes were calculated in GENEMAPPER 4.0. Each marker was verified to ensure effective amplification of the DNA samples at each site.
Data Analysis
Unique multilocus genotypes (MLGs) were identified in GenAlex 6.502 (Peakall and Smouse, 2005), by requiring complete matches in all loci. The number of MLGs per population provides an estimate of P. lutea propagation patterns. GenAlex 6.502 was also used to analyze genetic diversity indices, including the average number of alleles per locus in the populations (Na) and average number of effective alleles per locus in the populations (Ne). The genetic variation was tested by Mantel test in GenAlex 6.502 (Peakall and Smouse, 2005). Observed heterozygosity (Ho) and expected heterozygosity (He) were analyzed in MSA v4.0 (Dieringer and Schlötterer, 2003). FSTAT (Goudet, 1995) was used to calculate gene diversity (Gd) and pairwise FST (FST < 0.05, low genetic differentiation; 0.05 < FST < 0.25, moderate genetic differentiation; FST > 0.25, high genetic differentiation). Analysis of molecular variance and principal coordinates analysis (PCoA) were conducted for the geographic populations using GenAlex 6.502 (Peakall and Smouse, 2005; Chen et al., 2020). Based on a matrix of covariance computed from allele frequencies, PCoA can visualize genetic relationships across different latitudes (Peakall and Smouse, 2005). Correlations between genetic structure and geographical distance as well as environmental factors (average SST and SST variance) were determined using Mantel tests, which were performed in IBD (Bohonak, 2002) with 1,000 randomizations. The geographic distances between P. lutea populations were determined using Google Earth version 4.3 and followed the shortest route from the waterway.
The genetic structure was analyzed in STRUCTURE 2.3.4, a program that can estimate the most likely number of genetic clusters (K) (Pritchard et al., 2000). The method on Delta K implement of program STRUCTURE is the widely and popular way to infer population genetic structure (Pritchard et al., 2000; Polato et al., 2010; Baums et al., 2012; Tay et al., 2015; Chen et al., 2020). STRUCTURE implements Bayesian cluster algorithms to assign genotypes to clusters that maximize deviation from Hardy-Weinberg equilibrium expectations and minimize linkage disequilibrium, providing an accurate representation of contemporary divergence (Hubisz et al., 2009). CONVERT (Glaubitz, 2004) was used to format the input data before using STRUCTURE. Correlated allele frequencies and admixed populations were also assumed. Values of K = 1–14 were analyzed by running replicate simulations (≥3) with 106 Markov Chain Monte Carlo repetitions each, with a burn-in of 105 iterations (Evanno et al., 2005; Polato et al., 2010). Each K value was run 10 times in STRUCTURE. The K value based on the STRUCTURE output was determined using STRUCTURE HARVESTER (Earl and Vonholdt, 2012) to plot the log probability [L(K)] of data over multiple runs and to compare the outcome with delta K (Evanno et al., 2005). The results of the STRUCTURE run with the optimal K were merged with CLUMPP (Jakobsson and Rosenberg, 2007) and then visualized using DISTRUCT version 1.1 (Rosenberg, 2004). For all analyses, significance was set at P < 0.05.
Results
Multilocus Genotyping
We verified that the selected microsatellite markers were suitable for our study. The locus failure rate was 0.33∼5.96%, with the lowest in PL0340 and the highest in PL1556, respectively (Supplementary Table 1). The overall missing loci in samples were 2.94%.
Porites lutea in the SCS showed high genotypic diversity. Genetic analysis of 14 P. lutea communities revealed 301 unique MLGs (Table 1). The Dongjiao coral reef site (Nansha Islands) possessed only one set of two identical MLGs (Table 1). This repeated MLG is attributable to a single common genotype occurring across distinct patches within each population. Nevertheless, the high proportion of unique MLGs (mean Ng/N = 0.99 ± 0.13, Table 1) confirmed the substantial diversity of P. lutea genotypes, possibly because of sexual reproduction, and indicated considerable clonal richness.
Genetic Diversity of Porites lutea
In our study populations, Na ranged from 6.000 to 9.750 and Ne ranged from 3.899 to 6.415. Additionally, Ho ranged from 0.515 to 0.749, He ranged from 0.685 to 0.844, and Gd ranged from 0.632 to 0.839 (Table 2), According to the results (Supplementary Table 2), Fis ranged from −0.313 to 0.698. A small part of loci revealed significant deviation from HWE and was mainly found in Dongjiao population in Nansha Islands. These results for the alleles, effective number of alleles, gene diversity, and heterozygosity demonstrated that tropical P. lutea communities had high genetic diversity. Notably, subtropical P. lutea communities (particularly in Daya Bay) showed lower genetic diversity than in the tropical coral populations. In fact, tropical P. lutea were abundant, healthy, and formed reefs, whereas P. lutea in Daya Bay were scattered and did not form reefs.
TABLE 2
| Site | Na | Ne | Gd | Ho | He |
| Xiaolajia | 6.000 | 3.899 | 0.632 | 0.679 | 0.685 |
| Yangmeikeng | 6.125 | 4.304 | 0.735 | 0.515 | 0.758 |
| Weizhou Island | 6.875 | 4.670 | 0.792 | 0.728 | 0.795 |
| Luhuitou | 9.000 | 5.998 | 0.839 | 0.615 | 0.844 |
| Beijiao | 7.625 | 5.303 | 0.823 | 0.672 | 0.834 |
| Qilianyu | 9.750 | 6.415 | 0.819 | 0.624 | 0.835 |
| Yongxing | 8.625 | 6.095 | 0.807 | 0.648 | 0.825 |
| Dongdao | 8.750 | 6.153 | 0.815 | 0.669 | 0.828 |
| Yuzhuo | 8.500 | 5.497 | 0.787 | 0.747 | 0.803 |
| Langhua | 7.250 | 4.928 | 0.784 | 0.732 | 0.798 |
| Huangyan | 8.125 | 5.996 | 0.783 | 0.569 | 0.802 |
| Sanjiaojiao | 9.250 | 5.987 | 0.813 | 0.602 | 0.824 |
| Xinyijiao | 8.875 | 6.254 | 0.827 | 0.602 | 0.837 |
| Dongjiao | 7.875 | 5.509 | 0.771 | 0.749 | 0.797 |
Genetic diversity of Porites lutea samples from the South China Sea estimated using eight microsatellite loci.
Data were analyzed based on the individual site and locus. Na, average number of alleles observed; Ne, average number of effective alleles per locus in populations; Gd, gene diversity; Ho, average observed heterozygosity; He, average expected heterozygosity.
Genetic Structure of Porites lutea
Coral populations from Daya Bay exhibited significant genetic variation compared to other tropical coral populations (ΦPT = 0.129–0.290, P < 0.01) (Table 3). In particular, the Xiaolajia population exhibited strong genetic variation between the Yuzhuo, Langhua and Dongjiao populations. The Weizhou Island population showed moderate genetic variation compared with tropical populations (ΦPT = 0.085–0.148, P < 0.01) (Table 3). Notably, the Luhuitou population exhibited slight variation from other tropical populations (in addition to Beijiao, Dongdao, and Xinyijiao). Therefore, the genetic structure of P. lutea is likely related to the latitudinal gradient.
TABLE 3
| ΦPT | XLJ | YMK | WZ | LHT | BJ | QLY | YX | DD | YZ | LH | HY | SJJ | XYJ | DJ | |
| XLJ | |||||||||||||||
| YMK | 0.047 | ||||||||||||||
| WZ | 0.192 | 0.121 | |||||||||||||
| LHT | 0.211 | 0.129 | 0.085 | ||||||||||||
| BJ | 0.232 | 0.157 | 0.119 | 0.039 | |||||||||||
| QLY | 0.217 | 0.139 | 0.107 | 0.051 | 0.022 | ||||||||||
| YX | 0.212 | 0.145 | 0.090 | 0.057 | 0.015 | 0.001 | |||||||||
| DD | 0.238 | 0.161 | 0.090 | 0.040 | 0.022 | 0.006 | 0.014 | ||||||||
| YZ | 0.289 | 0.223 | 0.148 | 0.098 | 0.054 | 0.020 | 0.042 | 0.028 | |||||||
| LH | 0.271 | 0.196 | 0.103 | 0.066 | 0.064 | 0.056 | 0.051 | 0.057 | 0.096 | ||||||
| HY | 0.232 | 0.147 | 0.130 | 0.054 | 0.031 | 0.009 | 0.025 | 0.033 | 0.033 | 0.076 | |||||
| SJJ | 0.226 | 0.147 | 0.115 | 0.058 | 0.025 | 0.007 | 0.006 | 0.027 | 0.043 | 0.065 | 0.006 | ||||
| XYJ | 0.218 | 0.149 | 0.117 | 0.047 | 0.054 | 0.012 | 0.013 | 0.035 | 0.047 | 0.062 | 0.030 | 0.005 | |||
| DJ | 0.290 | 0.210 | 0.145 | 0.088 | 0.066 | 0.045 | 0.047 | 0.055 | 0.051 | 0.070 | 0.061 | 0.054 | 0.067 |
Pairwise ΦPT values of Porites lutea in the South China Sea.
Significant ΦPT values (sequential-Bonferroni-corrected P < 0.05) marked in bold. Xiaolajia (XLJ), Yangmeikeng (YMK), Weizhou Island (WZ),Luhuitou (LHT), Beijiao (BJ), Qilianyu (QLY), Yongxing (YX), Dongdao (DD), Yuzhuo (YZ), Langhua (LH), Huangyan (HY), Sanjiaojiao (SJJ), Xinyijiao (XYJ), Dongjiao (DJ).
The bold values mean significant ϕPT.
Pairwise FST values derived from microsatellite markers showed that the Xiaolajia and Yangmeikeng subtropical populations of Daya Bay were significantly genetically differentiated from tropical coral populations (FST = 0.1170–0.2361, P < 0.05). These Daya Bay populations differed significantly from tropical populations (Supplementary Table 3). The results of PCoA indicated that the P. lutea populations formed two genetic clusters: subtropical populations and tropical populations (Figure 2). Notably, population of Weizhou Island was slightly isolated from the Daya Bay populations (Figure 2).
FIGURE 2
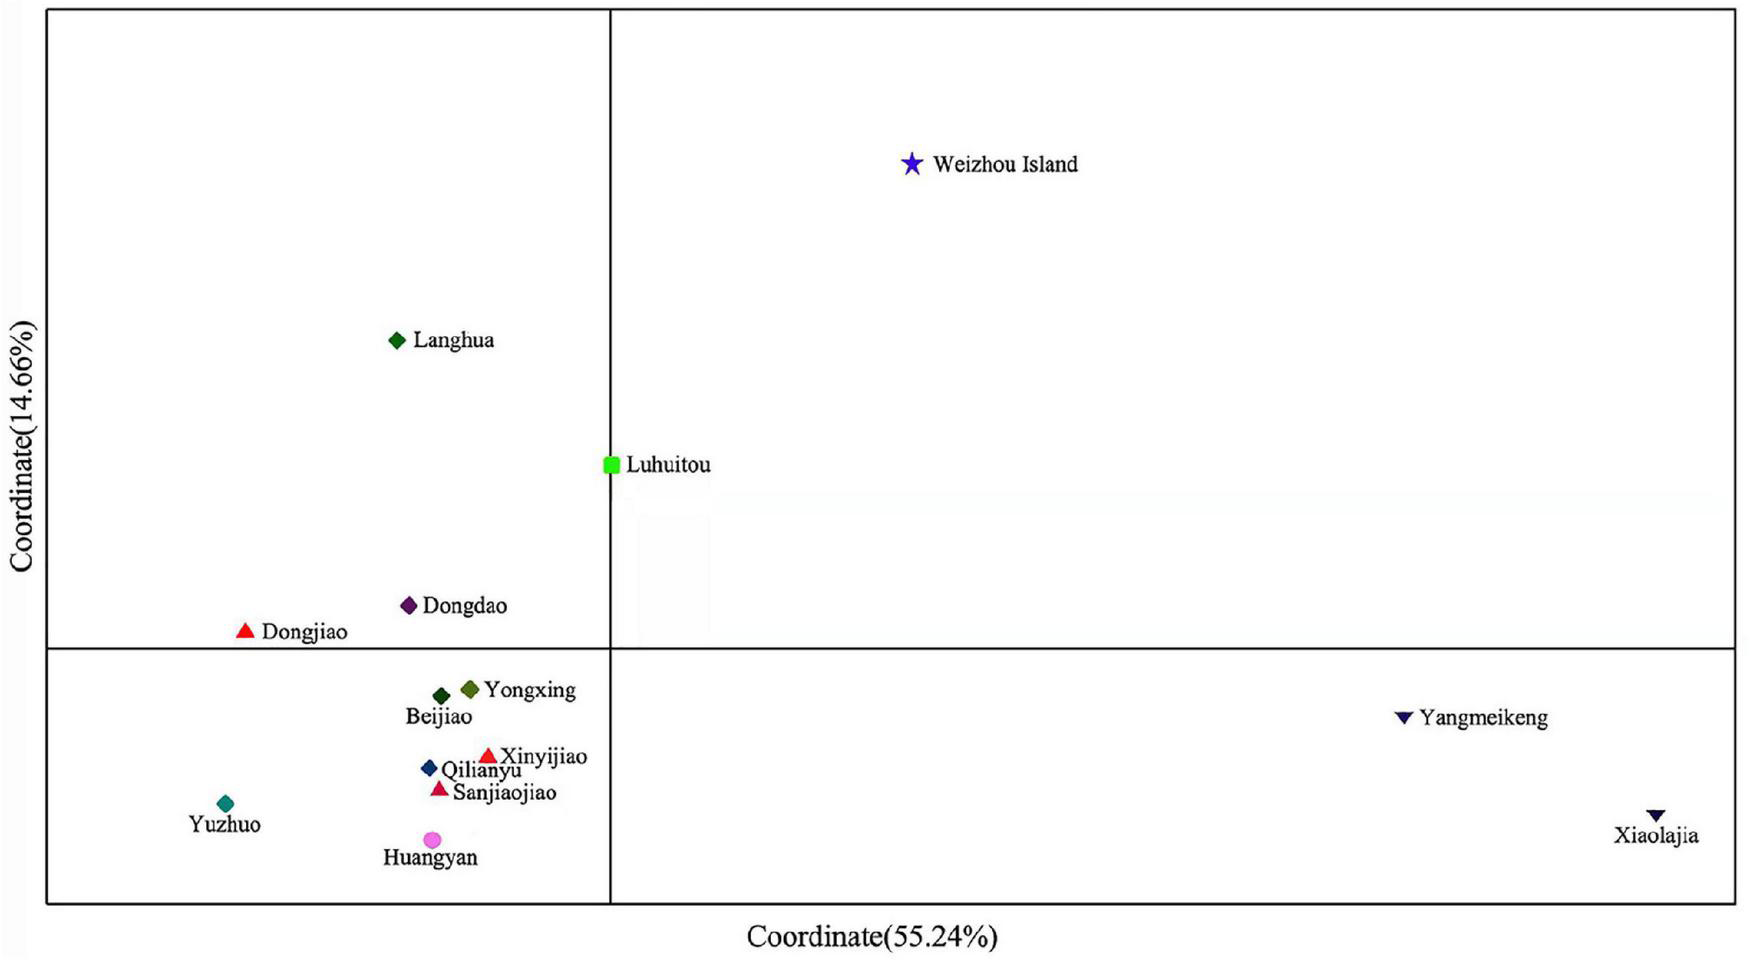
Principal coordinate analysis (PCoA) of samples from the South China Sea.
Cluster Analysis of Porites lutea
According to plots of Delta K (Supplementary Figure 1) and LnP (D) (Supplementary Figure 2) from STRUCTURE analysis, the 14 P. lutea populations could be grouped into two genetic clusters with the optimal K = 2 (Figure 3). The subtropical populations of Daya Bay and Weizhou Island, and tropical populations formed two distinct and closely knit genetic units (Figure 3). The green cluster was found at high frequencies in samples collected from Daya Bay and Weizhou but with lower frequencies in samples from other coral reef sites. But green and little red clusters were found on Weizhou Island. The green clusters with a lower frequency were found on tropical populations. The red clusters were mainly found on tropical populations.
FIGURE 3
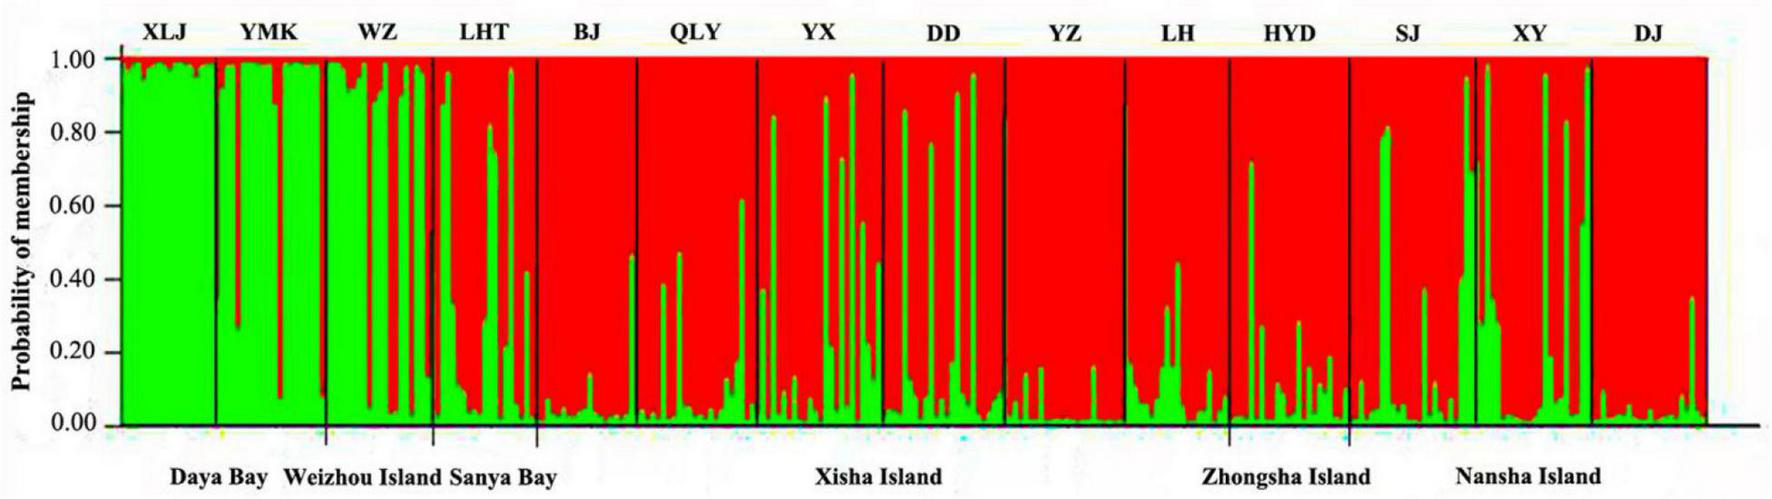
Cluster analysis of Porites lutea in the South China Sea performed using STRUCTURE (optimal K = 2). The y-axis indicates the membership probability of each site (n = 14) in distinct population clusters (different colors). Sampling sites are identified along the x-axis.
Correlations Between Environment Factors and Genetic Structure of Porites lutea
We acquired SST data covering January 1982 to December 2018 from the KNMI Climate Explorer1 (Figures 4A,B). Initial analysis indicated that the subtropical and tropical regions widely varied in seasonal SST. The monthly average SST was low in the subtropical coral reefs of Daya Bay and Weizhou Island. In the tropical regions, including the Xisha Islands, Zhongsha Islands, and Nansha Islands, the SST was relatively stable and high (Figures 4A,B).
FIGURE 4
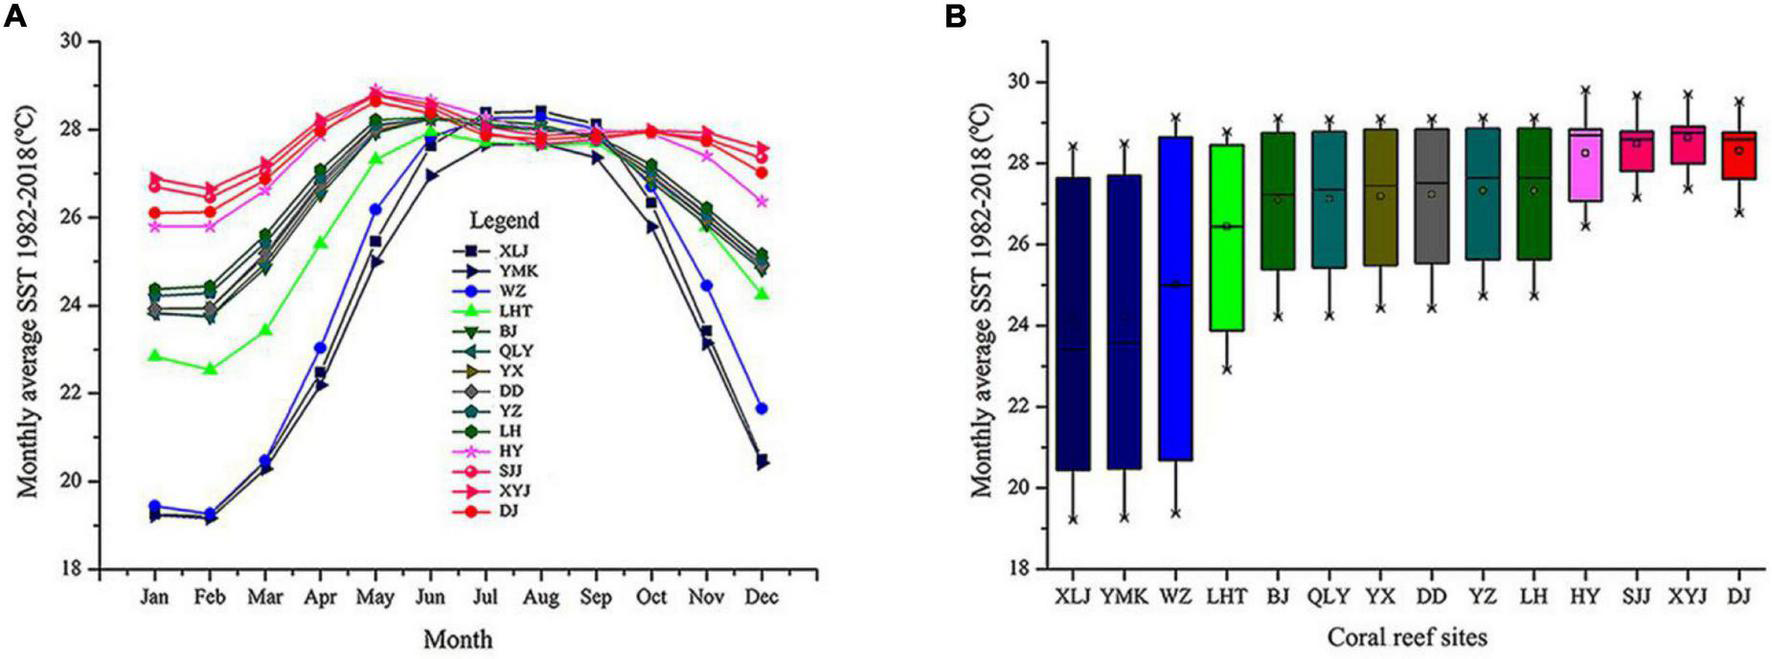
Monthly average sea surface temperatures (SST) from 1982 to 2018 for 14 coral reef sites in the South China Sea. (A) Monthly averages and standard deviations of SST at all coral sites. (B) Box plots indicating annual mean, minimum, and maximum seasonal SST, grouped by coral reef sites.
The results of the Mantel tests showed that genetic variation (ΦPT) was positively correlated with the average SST (R2 = 0.3995, P = 0.001), SST variation (R2 = 0.3860, P = 0.001), and geographic distance (R2 = 0.2358, P = 0.003, Figure 5). Geographic distance had a relatively small impact on genetic variation. In addition, FST was positively correlated with the average SST (R2 = 0.3764, P = 0.001), SST variation (R2 = 0.3525, P = 0.001), and geographic distance (R2 = 0.2105, P = 0.003, Supplementary Figure 3). This result was consistent with that of ΦPT. Therefore, SST and geographic distance were the dominant factors determining the genetic structure of P. lutea in the SCS. The SST had a stronger influence compared with geographic distance.
FIGURE 5
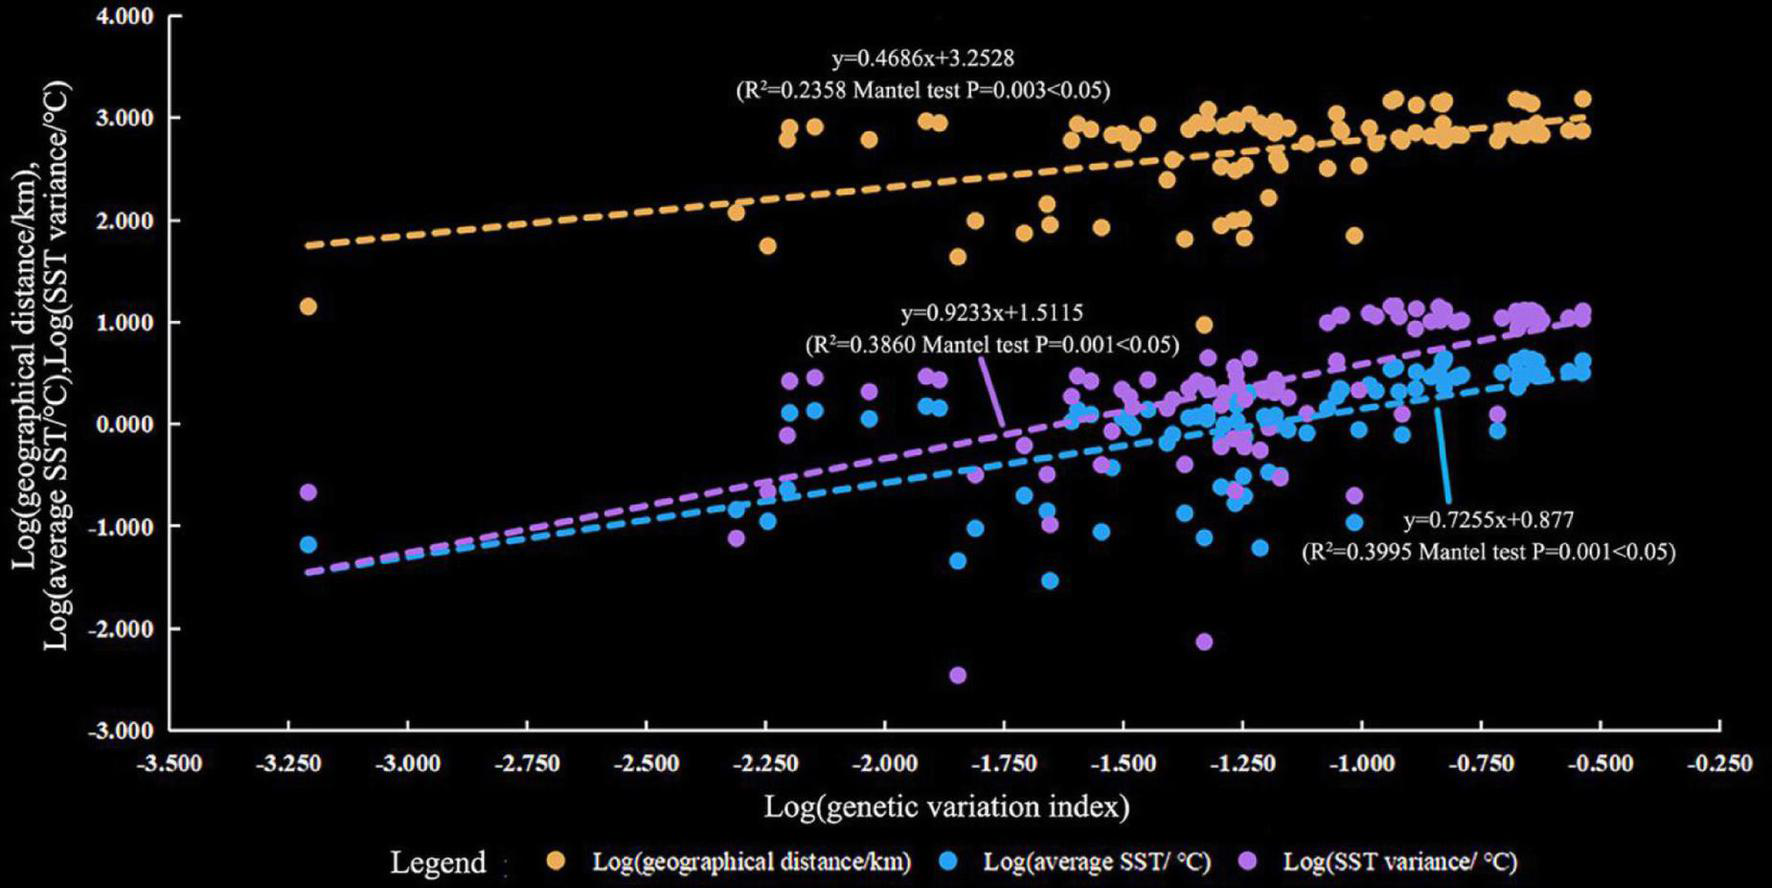
Relationship between genetic variation (pairwise ΦPT value) and geographic distance (marked in blue), average sea surface temperature (SST) (marked in orange), and SST variation (marked in green).
Discussion
Tropical Porites lutea Populations May Have High Adaptive Potential
Using microsatellite markers, we identified 301 unique MLGs in 14 P. lutea populations. This result suggests that P. lutea reproduces largely via sexual propagation on scales of 5 m and greater and has abundant gene diversity. The genetic diversity of tropical P. lutea populations was relatively high but decreased from south to north with the lowest in Daya Bay. Numerous species originate close to the equator, a region with a stable SST and sunny environment (Roy et al., 1998; Jansson et al., 2013). Fossil and phylogenetic evidence support the latitudinal diversity gradient (Roy et al., 1998; Jansson et al., 2013). Additionally, the monthly average SST decreased significantly with increasing latitude (Figure 4). Thus, SST differences across latitude might strongly influence the genetic diversity gradient of P. lutea in the SCS.
The adaptability of organisms is mainly influenced by reproduction patterns and genetic diversity (Bernhardt and Leslie, 2013; Wu et al., 2021). Our findings suggest that sexual reproduction and rich genetic diversity will benefit the adaptability of P. lutea in tropical areas. First, corals add new alleles to the gene pool through sexual recombination, increasing within-population genotypic diversity (Lasker and Coffroth, 1999; Hellberg and Taylor, 2002). Sexual reproduction allows coral larvae to inherit heat tolerance from both parents (Dixon et al., 2015; Kleypas et al., 2016). High genetic diversity enhances population sustainability over evolutionary time scales by providing sufficient alleles for adapting to future environmental change (Ayre and Hughes, 2004; Williams et al., 2014) through natural selection (Ficetola and Auré, 2011). Second, abundant genotypic diversity in populations is beneficial for improving fitness, stress response, and ecosystem function on an ecological time scale (Johnso et al., 2006; Hughes et al., 2008; Hughes and Stachowicz, 2009). Third, larval dispersal also increases genotypic diversity, a key factor affecting the population size and genetic diversity (Tay et al., 2015).
In Western Australia, Pocillopora damicornis populations in high-latitude areas exhibited reduced genetic diversity and restricted gene flow and were more vulnerable to global climate change due to their limited adaptability (Thomas et al., 2017). Turbinaria peltata populations had lower genetic diversity in the northern SCS, revealing their poor evolutionary potential (Wu et al., 2021). Compared to the subtropical P. lutea populations and the two corals above, tropical P. lutea populations may have high adaptive potential. Furthermore, compared to Acropora corals in Luhuitou, P. lutea in the SCS had high zooxanthellae density. The primary dominant symbiont in P. lutea (C15) exhibits high thermal tolerance (LaJeunesse et al., 2010; Chen et al., 2019). Therefore, P. lutea was less susceptible to bleaching and had a high tolerance to thermal stress event (Xu et al., 2017; Qin et al., 2019). Indeed, massive corals, including P. lutea, have experienced the slowest decline in the face of rapidly degrading global coral reefs (Huang et al., 2021). Taken together, our results suggest that tropical P. lutea populations may be highly adaptable.
Spatial Sea Surface Temperature Variation Across Latitudes Affected Porites lutea Genetic Structure in the South China Sea
We detected significant genetic divergence between subtropical (particularly in Daya Bay) and tropical P. lutea populations, as confirmed by the pairwise FST values (Supplementary Table 3). Compared with the results obtained by Huang et al. (2018), we observed a stronger latitude-based difference in the genetic structure and identified a latitudinal structure gradient. Microsatellites are widely dispersed in eukaryotic genomes and have higher levels of polymorphism than nuclear markers (Baums et al., 2005; Wang et al., 2009). Thus, the genetic structure can be identified to a finer resolution using microsatellites (Ridgway and Gates, 2006). In this study, the SST dominated the genetic structure of P. lutea in the SCS. Meanwhile, geographic distance had a relatively small impact on genetic structure. Similarly, the SST had a closer connection with genetic structure than geographical isolation of Turbinaria peltata in the north SCS (Wu et al., 2021).
Temperature is a crucial environmental factor determining the distribution of poikilothermic invertebrates over latitudinal clines, particularly in corals (Parmesan, 2006; Li et al., 2009; Obura, 2012; Howells et al., 2014). The connectivity and structure of coral populations are directly tied to temperature across different latitudes (Hoegh-Guldberg and Pearse, 1995; Levin, 2006; Bradbury et al., 2008). Temperature is the dominant influence on the rates of fundamental biochemical processes regulating development and survival (O’Connor et al., 2007). Ecological simulation experiments indicated that bleaching would occur if P. lutea was exposed to 14°C for 3 days (Li et al., 2009). Furthermore, temperature can alter metabolic rates in individuals, thereby influencing the rates of genetic variation and evolution among populations (Rohde, 1992; Rosenzweig, 1995; Allen et al., 2002; O’Connor et al., 2007). Finally, the SST impacts the spawning period of coral and probably influences gene exchange by driving asynchronous spawning across latitudes (Hanafy et al., 2010; Howells et al., 2014). The coral spawning period in the Gulf of Oman (northwest Indian Ocean) is directly associated with latitudinal variation and is likely influenced by the SST and timing of lunar cycles (Howells et al., 2014). The spawning period at low latitudes is generally earlier than that at higher latitudes, which may be influenced by the SST (Wei et al., 2020). In addition, studies demonstrated that the same coral genus had different gamete development cycles and spawning period in different areas (Baird et al., 2009; Yang, 2013). Hence, the spawning period of P. lutea at different latitudes might be different. The lack of synchronization in spawning periods possible reduces larval recruitment between coral reef sites, ultimately affecting gene exchange and genotype combination between corals at different latitudes.
Geographic distance was also significantly positively correlated with genetic differentiation. The broadcast spawning strategy and high environmental tolerance help species to disperse over long distances (Polato et al., 2010; Baums et al., 2012). The P. lutea populations in this study were across 13° of latitude, with the largest distance between them being 1,500 km. However, there are no consistent ocean currents in the SCS to transport corals over long distances in a certain direction (Huang et al., 1992; Van der Ven et al., 2016). Therefore, geographic distance had a relatively small impact on genetic structure. Geographic distance was reported to affect the genetic structure of T. peltata in the northern SCS (Wu et al., 2021). Taken together, our results clearly indicate that latitudinal differences in the SST and geographic distance were the main factors influencing the genetic structure of P. lutea in the SCS.
Management Implications Under Climate Change
As discussed, tropical P. lutea populations may have a greater adaptability to anthropogenic disturbance and environmental change because of their high genetic diversity and sexual reproduction. In recent years, although tropical P. lutea populations may be more adaptable, coral bleaching has occurred frequently, and coral reef coverage has declined due to external environmental changes. We found that tropical P. lutea grew well in the SCS and had high coverage. However, high-latitude areas are regarded as a refuge for tropical coral species (Riegl, 2003; Beger et al., 2014; Thomas et al., 2017). As the global temperature rises, the SST of subtropical areas has become increasingly suitable for coral growth, and thus corals may shift their distributional ranges toward higher latitudes (Halfar et al., 2005; Chen et al., 2009). For instance, two tropical coral species have been expanding toward higher latitudes with a diffusion of 14 km/a since the 1930s during a century of global warming (Yamano et al., 2011). However, other factors may prevent the consolidation of subtropical regions as new coral refuges. Severe anthropogenic activities deteriorated the marine ecological environment in the subtropics. In particular, subtropical coral reefs of the SCS are mainly distributed along the coast, making them more susceptible to anthropogenic impact. In general, coral reefs are among the most vulnerable and easily disturbed ecosystems and need to be protected systematically. Firstly, the anthropogenic impact in relatively high latitudes should be removed to protect potential further refuges. Secondly, measures to enhance genetic potential and adaptability should be taken in the SCS. Thirdly, stress-tolerant species or populations are needed for artificial transplantation to help natural populations cope with global change.
Conclusion
Tropical P. lutea populations in the SCS show greater evolutionary potential because they exhibit abundant genetic diversity and sexual reproduction. The genetic diversity of P. lutea generally changes with increasing latitude, a gradient that appears largely due to latitudinal SST variation. Subtropical coral populations have lower genetic diversity, and thus, relatively poor genetic resilience in response to low average SST and human activities. Analyses of genetic variation, FST, and genetic clusters revealed that subtropical P. lutea populations are genetically distinct from the tropical populations. SST is likely to be a key factor affecting these genetic differences. Thus, protection measures could be considered to enhance coral cover at reef sites that would likely act as refuges of subtropical areas in the future, such as removing anthropogenic impacts (port construction, overfishing, and city development) and promoting artificial transplantation. Our research provides insight into coral genetics and scientific guidance and a theoretical basis for the protection and restoration of coral reefs.
Publisher’s Note
All claims expressed in this article are solely those of the authors and do not necessarily represent those of their affiliated organizations, or those of the publisher, the editors and the reviewers. Any product that may be evaluated in this article, or claim that may be made by its manufacturer, is not guaranteed or endorsed by the publisher.
Statements
Data availability statement
The original contributions presented in the study are included in the article/Supplementary Material, further inquiries can be directed to the corresponding author.
Author contributions
KY and WH designed the research. BC, XH, and ZQ contributed study materials. YL and ML performed the experiments. YL analyzed the data and generated all images. YL and WH wrote the manuscript. All authors reviewed the manuscript.
Funding
This work was financially supported by the National Natural Science Foundation of China (Grant Nos. 42090041, 41866006, and 42030502) and Guangxi Scientific Projects (Nos. AD17129063 and AA17204074).
Acknowledgments
We would like to thank Editage (www.editage.cn) for English language editing. We would also like to thank Luo Weicheng for helping draw the geographic distribution map.
Conflict of interest
The authors declare that the research was conducted in the absence of any commercial or financial relationships that could be construed as a potential conflict of interest.
Supplementary material
The Supplementary Material for this article can be found online at: https://www.frontiersin.org/articles/10.3389/fmars.2022.791149/full#supplementary-material
Footnotes
References
1
Allen A. P. Brown J. H. Gillooly J. F. (2002). Global biodiversity, biochemical kinetics, and the energetic-equivalence rule.Science2971545–1548. 10.1126/science.1072380
2
Ayre D. J. Hughes T. P. (2004). Climate change, genotypic diversity and gene flow in reef-building corals.Ecol. Lett.7273–278. 10.1111/j.1461-0248.2004.00585.x
3
Baird A. H. Birrel C. L. Hughes T. P. Mcdonald A. Nojima S. Page C. A. et al (2009). Latitudinal variation in reproductive synchrony in Acropora assemblages: Japan vs. Australia Galaxea.J. Coral Reef Studies11101–108. 10.3755/galaxea.11.101
4
Barrett R. D. H. Schluter D. (2008). Adaptation from standing genetic variation.Trends Ecol. Evol.2338–44. 10.1016/j.tree.2007.09.008
5
Baums I. B. Boulay J. N. Polato N. R. Hellberg M. E. (2012). No gene flow across the Eastern Pacific Barrier in the reef-building coral Porites lobata.Mol. Ecol.215418–5433. 10.1111/j.1365-294X.2012.05733.x
6
Baums I. B. Hughes C. R. Hellberg M. E. (2005). Mendelian microsatellite loci for the Caribbean coral Acropora palmata.Mar. Ecol. Prog. Ser.288115–127. 10.3354/meps288115
7
Beger M. Sommer B. Harrison P. L. Smith S. D. Pandolfi J. M. (2014). Conserving potential coral reef refuges at high latitudes.Divers. Distrib.20245–257. 10.1111/ddi.12140
8
Bernhardt J. R. Leslie H. M. (2013). Resilience to climate change in coastal marine ecosystems.Annu. Rev. Mar. Sci.5371–392. 10.1146/annurev-marine-121211-172411
9
Bohonak A. J. (2002). IBD (isolation by distance): a program for analyses of isolation by distance.J. Hered.93153–154. 10.1093/jhered/93.2.153
10
Bradbury I. R. Laurel B. J. Robichaud D. Rose G. A. Snelgrove P. V. R. Gregory R. S. et al (2008). Discrete spatial dynamics in a marine broadcast spawner: re-evaluating scales of connectivity and habitat associations in Atlantic cod (Gadus morhua L.) in coastal Newfoundland.Fish. Res.91299–309. 10.1016/j.fishres.2007.12.006
11
Chen B. Yu K. F. Liang J. Y. Huang W. Wang G. H. Su H. F. et al (2019). Latitudinal variation in the molecular diversity and community composition of Symbiodiniaceae in coral from the South China Sea.Front. Microbiol. (Section Aquatic Microbiology)10:1278. 10.3389/fmicb.2019.01278
12
Chen B. Yu K. F. Qin Z. J. Liang J. Y. Wang G. H. Huang X. Y. et al (2020). Dispersal, genetic variation, and symbiont interaction network of heat-tolerant endosymbiont Durusdinium trenchii: insights into the adaptive potential of coral to climate change.Sci. Total Environ.723:138026. 10.1016/j.scitotenv.2020.138026
13
Chen J. E. Cui G. Xin W. Jin L. Y. Manuel A. (2018). Recent expansion of heat-activated retrotransposons in the coral symbiont.ISME J.12639–643. 10.1038/ismej.2017.179
14
Chen T. R. Yu K. F. Shi Q. Li S. Gilbert J. (2009). Twenty-five years of change in scleractinian coral communities of Daya Bay (northern South China Sea) and its response to the 2008 AD extreme cold climate event.Chin. Sci. Bull.542107–2117. 10.1007/s11434-009-0007-8
15
Chen T. R. Yu K. F. Shi Q. Li S. Wang S. (2007). Distribution and status of Scleractinian coral communities in the Daya Bay, Guangdong.Trop. Geogr.27491–498.
16
Dieringer D. Schlötterer C. (2003). Microsatellite analyser (MSA): a platform independent analysis tool for large microsatellite data sets.Mol. Ecol. Notes3167–169.
17
Dixon G. B. Davies S. W. Aglyamova G. A. Meyer E. (2015). Genomic determinants of coral heat tolerance across latitudes.Coral Reefs3481460–1462. 10.1126/science.1261224
18
Earl D. A. Vonholdt B. M. (2012). Structure Harvester: a website and program for visualizing structure output and implementing the Evanno method. Cons Genet Res 4: 359-361.Conserv. Genet. Resour.4359–361. 10.1007/s12686-011-9548-7
19
Evanno G. S. Regnaunt S. J. Goudet J. (2005). Detecting the number of clusters of individuals using the software structure: a simulation study.Mol. Ecol.142611–2620. 10.1111/j.1365-294X.2005.02553.x
20
Ficetola G. F. Auré L. B. (2011). Conserving adaptive genetic diversity in dynamic landscapes.Mol. Ecol.201569–1571. 10.1111/j.1365-294x.2011.05024.x
21
Glaubitz J. C. (2004). Convert: a user-friendly program to reformat diploid genotypic data for commonly used population genetic software packages.Mol. Ecol. Notes4309–310. 10.1111/j.1471-8286.2004.00597.x
22
Goudet J. (1995). FSTAT (version 1.2): a computer program to calculate F-statistics.J. Hered.86484–486. 10.1093/oxfordjournals.jhered.a111627
23
Halfar J. Godinez-Orta L. Riegl B. Valdez-Holguin J. E. (2005). Living on the edge: high-latitude Porites carbonate production under temperate eutrophic conditions.Coral Reefs24582–592. 10.1007/s00338-005-0029-x
24
Hanafy M. H. Aamer M. A. Habib M. Rouphael A. B. Baird A. (2010). Synchronous reproduction of corals in the Red Sea.Coral Reefs29119–124. 10.1007/s00338-009-0552-2
25
Hellberg M. E. Taylor M. S. (2002). Genetic analysis of sexual reproduction in the dendrophylliid coral Balanophyllia elegans.Mar. Biol.141629–637. 10.1007/s00227-002-0861-2
26
Hoegh-Guldberg O. Bruno J. F. (2010). The impact of climate change on the World’s marine ecosystems.Science3281523–1528. 10.1126/science.1189930
27
Hoegh-Guldberg O. Pearse J. S. (1995). Temperature, food Availability, and the development of marine invertebrate larvae.Am. Zool.35415–425.
28
Howells E. J. Abrego D. Vaughan G. O. Burt J. A. (2014). Coral spawning in the Gulf of Oman and relationship to latitudinal variation in spawning season in the northwest Indian Ocean.Sci. Rep.4:7484. 10.1038/srep07484
29
Huang H. Chen Z. Huang L. T. (2021). Status of Coral Reefs in China During 2010-2019.Beijing: Oceanpress.
30
Huang Q. Z. Wang W. Z. Li Y. X. Li Z. W. Mao M. (1992). General situations of the current and eddy in the South China Sea.Adv. Earth Science71–9.
31
Huang W. Li M. Yu K. F. Wang Y. H. Li J. J. Liang J. Y. (2018). Genetic diversity and large-scale connectivity of the scleractinian coral Porites lutea in the South China Sea.Coral reefs371259–1271. 10.1007/s00338-018-1724-8
32
Hubisz M. Falush D. Stephens M. Pritchard J. (2009). Inferring weak population structure with the assistance of sample group information.Mol. Ecol. Resour.91322–1332. 10.1111/j.1755-0998.2009.02591.x
33
Hughes A. R. Inouye B. D. Johnson M. T. J. Underwood N. (2008). Ecological consequences of genetic diversity.Ecol. Lett.11609–623.
34
Hughes A. R. Stachowicz J. J. (2004). Genetic diversity enhances the resistance of a seagrass ecosystem to disturbance.Proc. Natl. Acad. Sci. U.S.A.1018998–9002. 10.1073/pnas.0402642101
35
Hughes A. R. Stachowicz J. J. (2009). Ecological impacts of genotypic diversity in the clonal seagrass Zostera marina.Ecology901412–1419. 10.1890/07-2030.1
36
Hughes T. P. Kerry J. T. Álvarez-Noriega M. Andeson K. D. Baird A. H. Babcock R. C. et al (2017). Global warming and recurrent mass bleaching of corals.Nature543373–377. 10.1038/nature21707
37
Jakobsson M. Rosenberg N. A. (2007). CLUMPP: a cluster matching and permutation program for dealing with label switching and multimodality in analysis of population structure.Bioinformatics23:1801. 10.1093/bioinformatics/btm233
38
Jansson R. Rodríguez-Castañeda G. Harding L. E. (2013). What can multiple phylogenies say about the latitudinal diversity gradient? A new look at the tropical conservatism, out of the tropics, and diversification rate hypotheses.Evolution671741–1755. 10.1111/evo.12089
39
Johnso M. T. J. Lajeunesse M. J. Agrawal A. A. (2006). Additive and interactive effects of plant genotypic diversity on arthropod communities and plant fitness.Ecol. Lett.924–34. 10.1111/j.1461-0248.2005.00833.x
40
Keshavmurthy S. Hsu C. M. Kuo C. Y. Meng P. J. Wang J. T. Chen C. A. (2012). Symbiont communities and host genetic structure of the brain coral Platygyra verweyi, at the outlet of a nuclear power plant and adjacent areas.Mol. Ecol.214393–4407. 10.1111/j.1365-294X.2012.05704.x
41
Kleypas J. A. Thompson D. M. Castruccio F. S. Curchister E. N. Pinsky M. Watson J. R. (2016). Larval connectivity across temperature gradients and its potential effect on heat tolerance in coral populations.Glob. Chang. Biol.223539–3549. 10.1111/gcb.13347
42
Knittweis L. Kraemer W. E. Timm J. Kochzius M. (2009). Genetic structure of Heliofungia actiniformis (Scleractinia: Fungiidae) populations in the Indo-Malay Archipelago: implications for live coral trade management efforts.Conserv. Genet.10241–249. 10.1007/s10592-008-9566-5
43
LaJeunesse T. C. Pettay D. T. Sampayo E. M. Phongsuwan N. Brown B. Obura D. O. et al (2010). Long-standing environmental conditions, geographic isolation and host-symbiont specificity influence the relative ecological dominance and genetic diversification of coral endosymbionts in the genus Symbiodinium.J. Biogeogr.37785–800. 10.1111/j.1365-2699.2010.02273.x
44
Lasker H. R. Coffroth M. A. (1999). Responses of clonal reef taxa to environmental change.Am. Zool.3992–103. 10.1093/icb/39.1.92
45
Levin L. A. (2006). Recent progress in understanding larval dispersal: new directions and digressions.Integr. Comp. Biol.46282–297. 10.1093/icb/icj024
46
Li S. Yu K. F. Shi Q. Chen T. R. Zhao M. X. (2009). Low water temperature tolerance and responding mode of scleractinian corals in Sanya Bay.Chin. J. Appl. Ecol.202289–2295.
47
Liang J. Y. Yu K. F. Wang Y. H. Huang X. Y. Huang W. Qin Z. J. et al (2017). Distinct bacterial communities associated with massive and branching scleractinian corals and potential linkages to coral susceptibility to thermal or cold Stress.Front. Microbiol.8:979. 10.3389/fmicb.2017.00979
48
Magalon H. Adjeroud M. Veuille M. (2005). Patterns of genetic variation do not correlate with geographical distance in the reef-building coral Pocillopora meandrina in the South Pacific.Mol. Ecol.141861–1868. 10.1111/j.1365-294x.2005.02430.x
49
Magalon H. Samadi S. Richard M. Adjeroud M. Veuille M. (2004). Development of coral and zooxanthella-specific microsatellites in three species of Pocillopora (Cnidaria. Scleractinia) from French Polynesia.Mol. Ecol. Resour.4206–208. 10.1111/j.1471-8286.2004.00618.x
50
Mclachlan R. H. Price J. T. Solomon S. L. Grottoli A. G. (2020). Thirty years of coral heat-stress experiments: a review of methods.Coral Reefs39885–902. 10.1007/s00338-020-01931-9
51
Meyers L. A. Fredric D. A. Lachmann M. (2005). Evolution of genetic potential.PLoS Comput. Biol.1:e32. 10.1371/journal.pcbi.0010032
52
Miller K. J. Ayre D. J. (2010). Protection of Genetic Diversity and Maintenance of Connectivity among Reef Corals within Marine Protected Areas.Biol. Conserv.221245–1254.
53
Ng W. C. Morton B. (2003). Genetic structure of the scleractinian coral Platygyra sinensis in Hong Kong.Mar. Biol.143963–968. 10.1007/s00227-003-1159-8
54
Obura D. (2012). The diversity and biogeography of Western Indian Ocean Reef-Building Corals.PLoS One7:e45013. 10.1371/journal.pone.0045013
55
O’Connor M. Bruno J. Gaines S. D. Halpern B. S. Sarah E. Kinlan B. P. et al (2007). Temperature control of larval dispersal and the implications for marine ecology, evolution, and conservation.Proc. Natl. Acad. Sci. U.S.A.1041266–1271. 10.1073/pnas.0603422104
56
Parmesan C. (2006). Ecological and evolutionary responses to recent climate change.Annu. Rev. Ecol. Evol. Syst.37637–669. 10.1146/annurev.ecolsys.37.091305.110100
57
Peakall R. Smouse P. E. (2005). GENALEX 6: genetic analysis in Excel. Population genetic software for teaching and research.Mol. Ecol. Notes6288–295. 10.1093/bioinformatics/bts460
58
Polato N. R. Concepcion G. T. Toonen R. J. Baums I. B. (2010). Isolation by distance across the Hawaiian Archipelago in the reef-building coral Porites lobata.Mol. Ecol.194661–4677. 10.1111/j.1365-294X.2010.04836.x
59
Pritchard J. K. Stephens M. Donnelly P. (2000). Inference of population structure using multilocus genotype data.Genetics1559197–9201.
60
Qin Z. J. Yu K. F. Wang Y. H. Xu L. J. Huang X. Y. Chen B. et al (2019). Spatial and inter-generic variation in physiological indicators of corals in the South China Sea: insights into their current state and their adaptability to environmental stress.J. Geophys. Res. Oceans1243317–3332. 10.1029/2018JC014648
61
Ridgway T. Gates R. D. (2006). Why are there so few genetic markers available for coral population analyses?Symbiosis411–7.
62
Riegl B. (2003). Climate change and coral reefs: different effects in two high-latitude areas (Arabian Gulf, South Africa).Coral Reefs22433–446. 10.1007/s00338-003-0335-0
63
Rohde K. (1992). Latitudinal gradients in species diversity: the search for the primary cause.Oikos65514–527. 10.2307/3545569
64
Rosenberg N. A. (2004). Distruct: a program for the graphical display of population structure.Mol. Ecol. Notes4137–138. 10.1046/j.1471-8286.2003.00566.x
65
Rosenzweig M. L. (1995). Species Diversity in Space and Time.Cambridge: Cambridge University Press.
66
Roy K. Jablonski D. Valentine J. W. Rosenberg G. (1998). Marine latitudinal diversity gradients: tests of causal hypotheses.Proc. Natl. Acad. Sci. U.S.A.953699–3702. 10.1073/pnas.95.7.3699
67
Severance E. G. Szmant A. M. Karl S. A. (2010). Microsatellite loci isolated from the Caribbean coral, Montastraea annularis.Mol. Ecol. Resour.474–76.
68
Tay Y. C. Noreen A. M. E. Suharsono Chou L. M. Todd P. A. (2015). Genetic connectivity of the broadcast spawning reef coral Platygyra sinensis, on impacted reefs, and the description of new microsatellite markers.Coral Reefs34301–311.
69
Thomas L. Kennington W. J. Evans R. D. Richard D. Kendrick G. A. Stat M. (2017). Restricted gene flow and local adaptation highlight the vulnerability of high-latitude reefs to rapid environmental change.Glob. Chang. Biol.232197–2205. 10.1111/gcb.13639
70
Tye P. D. Lajeunesse T. C. Christian R. V. (2013). Long-range dispersal and high-latitude environments influence the population structure of a “stress-tolerant” dinoflagellate endosymbiont.PLoS One8:e79208. 10.1371/journal.pone.0079208
71
Van der Ven R. M. Triest L. De Ryck D. J. R. Mwaura J. M. Mohammed M. S. Kochzius M. (2016). Population genetic structure of the stony coral Acropora tenuis shows high but variable connectivity in East Africa.J. Biogeogr.43510–519.
72
Wang S. Zhang L. Matz M. (2009). Microsatellite characterization and marker development from public EST and WGS databases in the reef-building coral Acropora millepora (Cnidaria, Anthozoa, Scleractinia).J. Hered.100329–337. 10.1093/jhered/esn100
73
Wei F. Huang W. Yu K. F. Liao Z. Wang X. Wang Y. et al (2020). Embryonic and larval early development of Favia favus and Platygyra carnosus in the Weizhou Island, Guangxi.Haiyang Xuebao4287–95.
74
Williams D. E. Miller M. W. Baums I. B. (2014). Cryptic changes in the genetic structure of a highly clonal coral population and the relationship with ecological performance.Coral Reefs33595–606. 10.1007/s00338-014-1157-y
75
Wu Q. Huang W. Chen B. Yang E. G. Meng L. Q. Chen Y. M. et al (2021). Genetic structure of Turbinaria peltata in the northern South China Sea suggest insufficient evolutionary potential of relatively high-latitude scleractinian corals to environment stress - ScienceDirect.Sci. Total Environ.775:145775. 10.1016/j.scitotenv.2021.145775
76
Xu L. J. Yu K. F. Li S. Liu G. H. Tao S. C. Shi Q. et al (2017). Interseasonal and interspecies diversities of Symbiodinium density and effective photochemical efficiency in five dominant reef coral species from Luhuitou fringing reef, northern South China Sea.Coral Reefs36477–487. 10.1007/s00338-016-1532-y
77
Yamano H. Sugihara K. Nomura K. (2011). Rapid poleward range expansion of tropical reef corals in response to rising sea surface temperatures.Geophys. Res. Lett.38155–170.
78
Yang X. D. (2013). Study of Gonad Development and Growths of Porites lutea, Goniopora djiboutiensis and Galxea fascicularis. Zhanjiang: Guangdong Ocean University.
79
Yu J. K. Wang H. Y. Lee S. C. Dai C. F. (1999). Genetic structure of a scleractinian coral, Mycedium elephantotus, in Taiwan.Mar. Biol.13321–28. 10.1007/s002270050438
80
Yu K. F. (2012). Coral reefs in the South China Sea: their responses to and records on past environmental changes.Sci. China Earth Sci.551217–1229. 10.1007/s11430-012-4449-5
Summary
Keywords
Porites lutea , genetic potential, genetic diversity, genetic structure, sea surface temperature, climate change
Citation
Luo Y, Huang W, Yu K, Li M, Chen B, Huang X and Qin Z (2022) Genetic Diversity and Structure of Tropical Porites lutea Populations Highlight Their High Adaptive Potential to Environmental Changes in the South China Sea. Front. Mar. Sci. 9:791149. doi: 10.3389/fmars.2022.791149
Received
08 October 2021
Accepted
25 January 2022
Published
28 February 2022
Volume
9 - 2022
Edited by
Iliana B. Baums, The Pennsylvania State University, United States
Reviewed by
Carolina Bastidas, Massachusetts Institute of Technology, United States; Yuan Li, Third Institute of Oceanography, Ministry of Natural Resources, China
Updates
Copyright
© 2022 Luo, Huang, Yu, Li, Chen, Huang and Qin.
This is an open-access article distributed under the terms of the Creative Commons Attribution License (CC BY). The use, distribution or reproduction in other forums is permitted, provided the original author(s) and the copyright owner(s) are credited and that the original publication in this journal is cited, in accordance with accepted academic practice. No use, distribution or reproduction is permitted which does not comply with these terms.
*Correspondence: Kefu Yu, kefuyu@scsio.ac.cn
†These authors have contributed equally to this work
This article was submitted to Marine Science, a section of the journal Frontiers in Marine Science
Disclaimer
All claims expressed in this article are solely those of the authors and do not necessarily represent those of their affiliated organizations, or those of the publisher, the editors and the reviewers. Any product that may be evaluated in this article or claim that may be made by its manufacturer is not guaranteed or endorsed by the publisher.