Abstract
The North Atlantic Ocean surrounds Iceland, influencing its climate and hosting a rich ecosystem that provides the Icelandic nation with economically valuable marine species. The basis of the Icelandic marine ecosystem consists of communities of diverse microorganisms including bacteria, archaea, and unicellular eukaryotes. While the primary production of Icelandic waters has been monitored since the 50s, there is limited knowledge of the taxonomic and metabolic diversity of the marine microorganisms in Icelandic waters based on molecular techniques. In this study, we conducted annual sampling at four hydrographic stations over several years to characterize marine microbial communities and their metabolic potential. Using 16S ribosomal RNA gene amplicon sequencing and metagenomics, we resolved the microbial community composition on the North and South Shelves of Iceland, analyzed its evolution from 2011 to 2018, identified frequently occurring taxa, and predicted their potential metabolism. The results showed correlations between the marine microbial community profiles and the water masses in spring, between the North and South Shelves of Iceland. The differences in marine microbial diversity appear to be linked to the average seawater temperature in the mixed surface layer at each sampling station which also constrains the relative abundance of photosynthetic microorganisms. This study set a baseline for the marine microbial diversity in Icelandic marine waters and identified three photosynthetic microorganisms – the cyanobacteria Synechococcus and two members of the Chlorophyta clade – as valuable indicator species for future monitoring, as well as for application in ecosystem modeling in context with research on climate change.
1 Introduction
Marine microbial communities consist of diverse groups of bacteria, archaea and unicellular eukaryotes that are vital to the ocean’s ecosystem. They play key roles in the global cycling of elements (i.e. carbon, nitrogen, sulfur), matter and energy, supporting the marine food web and regulating the global climate (Follows and Dutkiewicz, 2011; Hutchins and Fu, 2017). It is essential to know the structure, potential function of marine microbial communities and the ecological processes that shape microbial communities to understand the role and impacts of the ocean on a global level. Thus studying marine microbial communities has been, and continues to be, an active field of research almost 20 years after the initial Global Ocean Sampling Expedition (Rusch et al., 2007). This original survey revealed the rich microbial diversity of the ocean with the discovery of approximately 1,800 different microbial species encoding over 1.2 million genes (Venter et al., 2004; Yooseph et al., 2007). This study also expanded our understanding of photobiology and evolution with the discovery of the proteorhodopsin (Béjà et al., 2000; Venter et al., 2004). The Global Ocean Sampling Expedition was followed by other large scale expeditions like the Tara Oceans (Sunagawa et al., 2015; Sunagawa et al., 2020) and the Malaspina (Duarte, 2015) expeditions. These resulting metagenomic data and analyses contributed to inventories such as the International Census of Marine Microbes (Zinger et al., 2011) and illustrate how such sequencing data can serve as a baseline for assessing marine ecosystem changes.
Many changes in the marine ecosystem are consequences of climate change, a result of increased anthropogenic carbon emissions relative to pre-industrial times (IPCC, 2019). Specifically, the increased carbon emissions led to acidification of the ocean and warming of surface seawater temperature. Several studies emphasize the role of the North Atlantic Ocean in the export and storage of anthropogenic carbon to the bottom of the ocean (Sabine et al., 2004; Vázquez-Rodríguez et al., 2009). Marine microorganisms play a role in the carbon cycle (Wang, 2018); thus, it is crucial to monitor changes in this region that is simultaneously subjected to rapid acidification of the seawater (Doney et al., 2009; Olafsson et al., 2009; Metzl et al., 2010), warming of seawater temperature (Levitus et al., 2000; Robson et al., 2012; Cheng et al., 2019), and weakening of the Atlantic Meridional Overturning Circulation (AMOC) which in turn reduces the carbon uptake of the Atlantic Ocean (Pérez et al., 2013).
These above-mentioned phenomena have already impacted the distribution and productivity of commercial marine species in the North Atlantic, creating major challenges for nations such as Greenland, the Faroe Islands, and Iceland, where fishing remains economically relevant (Peck and Pinnegar, 2019). To ensure reliable and sustainable management of Icelandic fisheries, a recent end-to-end model of Icelandic waters by Sturludóttir et al. (2018) includes 52 functional groups of organisms, from large marine mammals to bacteria. This model highlighted the complexity of the interactions between functional groups in the marine ecosystem and stated the need for more data on non-commercial species such as marine microorganisms that are at the basis of the food web.
In an attempt to fulfill the need for data on marine microorganisms, the Microbes in the Icelandic Marine Environment (MIME) project conducted annual sampling since 2011 to characterize the microbial diversity in the marine waters surrounding Iceland. Here, we resolved the microbial community structures in Icelandic marine waters and the metabolic potential of the most frequently abundant members using two approaches relying on high-throughput sequencing: 16S rRNA gene amplicon sequencing for samples collected over an eight-year period and metagenomics for samples collected over a five-year period. For clarity in this study, we use the term “metataxonomics” for the 16S rRNA gene amplicon sequencing analysis and “metagenomics” for shotgun metagenomic sequencing analysis as recommended by Marchesi and Ravel (2015). For both approaches, we sampled surface seawater at two stations over the North Shelf of Iceland and at two stations over the South Shelf of Iceland to investigate differences in marine microbial diversity. The resulting marine microbial community structures are linked to the different water masses on the North and South Shelves of Iceland. Furthermore, the analyses reveal differences in the abundances of core taxa between the different environments with photosynthetic microorganisms as potential indicator species.
2 Materials and Methods
2.1 Description of Sampling Sites and Sampling
Four oceanic stations were selected, two north of Iceland, Siglunes 8 (SI8) and Siglunes 3 (SI3), and two south of Iceland, Selvogsbanki 5 (SB5) and Selvogsbanki 2 (SB2). These stations were sampled each spring (May/June) in 2011 - 2018 for metataxonomics and in 2015 - 2018 for metagenomics. Extra samples were collected in the summer (August) of the year 2017. These four stations represent four different environments because distinct water masses are found at each location (Figure 1and Supplementary Table S1). The upper-ocean water masses around Iceland are commonly characterized as Atlantic subarctic, but are regionally divided into three distinguishable water masses, i.e. the cold Polar Water brought by the East Greenland Current, the warm Atlantic Water carried by the Irminger Current and the cold Arctic Water circulating north of Iceland and driven east along the slope of the North Shelf by the East Icelandic Current (Valdimarsson and Malmberg, 1999; Casanova-Masjoan et al., 2020). Here, we use the term North Shelf when referring to the two stations north of Iceland (SI3 and SI8; under the influence of the Arctic Waters) and South Shelf for the two stations south of Iceland (SB2 and SB5; under the influence of North Atlantic Water). The stations with higher numbers at either side of the island are located at the shelf edges, while the other two are located at shallower depth, closer to the coast. In spring (May and June), the influence of in-flowing Atlantic Water to the North Shelf is frequently observed at the station SI3, and occasionally the salinity of the surface seawater at SB2 on the South Shelf may reveal some admixture from the Coastal Current.
Figure 1
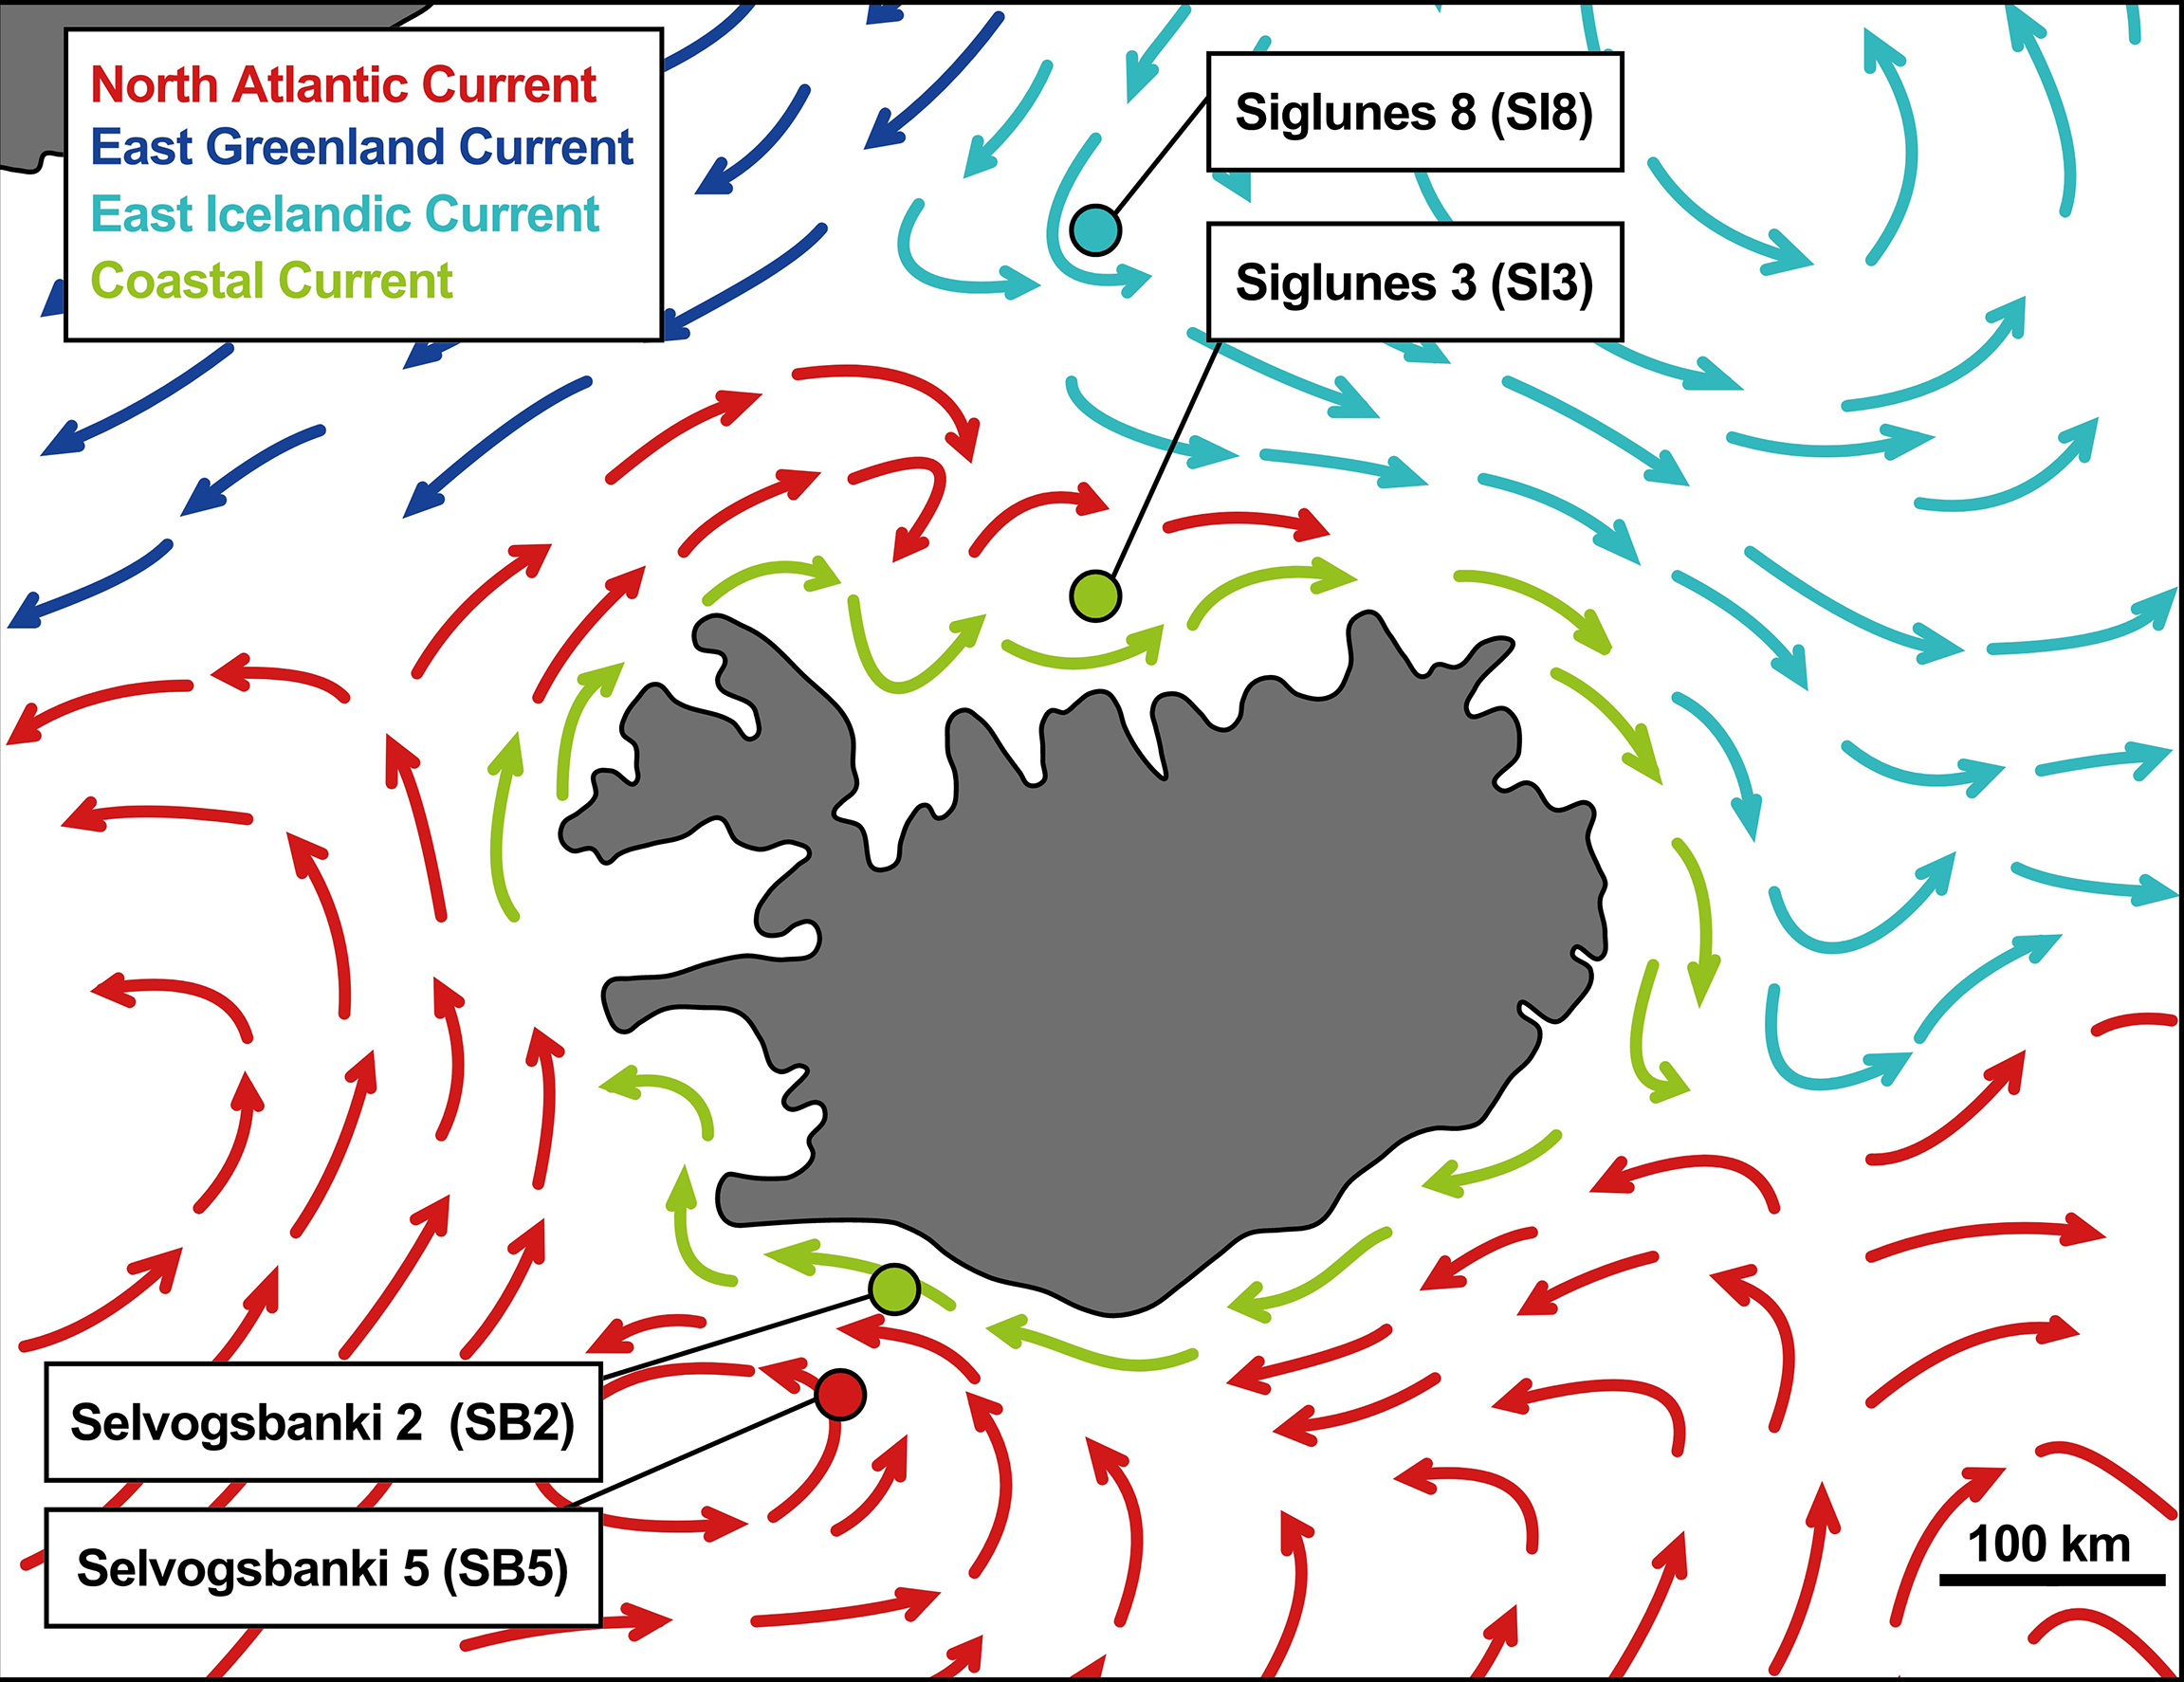
Map of the oceanic currents around Iceland adapted from Valdimarsson and Malmberg (1999) with sampling locations.
For metataxonomics, surface seawater samples were collected from the four stations as 1 L subsamples from Niskin water samplers arranged on a CTD rosette, while 5 L of surface seawater were collected for metagenomics. All samples were filtered directly onto 0.22 μm Sterivex filters (Merck Millipore, Darmstadt, Germany) and then flash frozen in liquid nitrogen before stored at -80 C until further processing.
During sampling, biological and physico-chemical measurements were synchronously recorded by the CTD or measured a posteriori in the corresponding seawater samples. The biological measurements included in this study are chlorophyll a (chl, μg L-1) and phaeopigments (phaeo, μg L-1) measurements. The physico-chemical measurements included in this study are the average temperature (°C) and the average concentrations of silicate (Si(OH)4, μmol L-1) and nitrate (NO3, μmol L-1). Concentrations of dissolved nitrate were measured according to the method described by Grasshoff (1970), using Seal Autoanalyzer AA3. Concentrations of the phytoplankton pigments, chlorophyll a and phaeopigments retained on Whatmann GF/F filters and extracted in 90% acetone, were measured according to the method described by Holm-Hansen et al. (1965), using a Turner Designs 10AU fluorometer. All the physico-chemical and biological variables are observations and measurements from the same station and depth as the corresponding sample used for metataxonomics, except for seven nutrients concentrations values for which we used as a substitute value the average of all values available for the station within the uppermost 20 m (corresponding to the mixed layer of the ocean).
2.2 Nucleic Acid Extractions and Amplification for Metataxonomics and Metagenomics
For metataxonomics, genomic DNA was extracted from each sample using the MasterPure kit (Epicentre, Waltham, MA, USA) following a protocol that was modified to ensure the lysis of all organisms by adding a freeze-thaw and bead-beating step. Briefly, 2 μl of 50 mg/ml proteinase K from the kit was diluted in 600 μl of the Tissue and Cell lysis solution. The resulting solution was injected directly in the Sterivex filter and incubated at RT for 3-5 min while being vortexed. The Sterivex filter was then incubated at 65°C for 30 min under gentle agitation. The lysis solution was retrieved, incubated at -80°C for 30 min and then heated at 65°C for 10 min prior to adding 0.1-0.2 mm Zirconia/Silica beads (BioSpec, Bartlesville, OK, USA). Two bead beating sessions of 30 s at 30 Hz were done with a resting step on ice for 1-2 min in between. A total of 350 μl of MPC protein precipitation reagent from the kit was added to the supernatant and vortexed. After centrifugation (4°C for 10 min at 10,000 × g), 900 μl of cold isopropanol was added to the supernatant and DNA precipitated at -20°C overnight. After precipitation, DNA was pelleted at 4°C for 10 min at 14,000 × g and rinsed with 500 μl of 70% ethanol, followed by a centrifugation at 4°C for 5 min at 16,000 × g. After being dried out, DNA was finally re-suspended in 50 μl of Tris buffer (10 mM, pH8). The concentration and quality of DNA were assessed with a NanoDrop ND1000 Spectrophotometer (Thermo Fisher Scientific Inc., Waltham, MA, USA) before storage at -80°C prior to amplification.
The V4 hypervariable region of the 16S small subunit ribosomal RNA (SSU rRNA) gene was amplified using the universal primers 515F and 806R (Apprill et al., 2015; Parada et al., 2016) with the overhang region complementary to Illumina adapters (Illumina Inc., San Diego, CA, USA). PCR amplifications were performed in triplicate for each sample and negative and positive control were performed for each run with respectively sterile water and Campylobacter DNA. All PCR reactions were conducted in a final volume of 25 μl consisting of 0.4 μg of template DNA and final concentration of 0.5 μM of each primer, 0.2 mM dNTPs, 1X Q5 reaction buffer, 1X Q5 High GC Enhancer and 0.02 U/µl of Q5 high-fidelity DNA polymerase (NEB, New England Biolabs, Ipswich, MA, USA). Amplification conditions consisted of an initial denaturation step at 98°C for 30 s, followed by 30 cycles of 98°C denaturation for 10 s, annealing at 50°C for 30 s and elongation at 72°C for 30 s, with a a final extension step of 7 min at 72°C. Triplicates were pooled together for library preparation following the protocol provided by Illumina and called “16S Metagenomic sequencing library preparation” (version #15044223, rev. B) for sequencing on Illumina MiSeq system (2 × 250 PE; Illumina Inc.) run returning 2 × 250 bp paired-end reads.
For metagenomics, the samples were processed and analyzed as previously described (Jégousse et al., 2021). Shortly, the genomic DNA was extracted from each sample and sequenced on the HiSeq 4000 (2 × 150 PE; Illumina Inc.) resulting in 15 surface seawater metagenomes that were co-assembled to reconstruct 102 microbial metagenomes-assembled genomes (MAGs).
2.3 Taxonomic Profiling
To resolve the taxonomic profiles based on the metataxonomics data, the raw MiSeq reads were processed with Trimmomatic v.0.39 (Bolger et al., 2014) in pair-end mode to ensure the pairing of reads followed by adapter removal with Cutadapt v.2.10 (Martin, 2011) using the parameters -m 220 for minimal length, -m 250 for maximum length, –discard-untrimmed and -a ĜTGCCAGCMGCCGCGGTAA … ATTA GAWACCCBDGTAGTCC and -A ĜGACTACHVGGGTWT CTAAT … TTACCGCGGCKGCTGGCAC to trim the primers. Clean paired reads were then processed in the R environment (Team, R.C. et al., 2013; R Core Team, 2018) following the Bioconductor workflow (Callahan et al., 2016a). First, sequences were filtered to remove low-quality reads (with parameters MaxEE=2 and truncQ=11). Amplicon sequence variants (ASVs) were then resolved at single nucleotide resolution using DADA2 (Callahan et al., 2016b), which provides better accuracy in 16S rRNA gene amplicon sequencing studies when compared with traditional operational taxonomic units (Callahan et al., 2017). The removeBimeraDenovo function implemented through the DADA2 R package removed chimeric sequences. Taxonomy was assigned to amplicon sequences using the DADA2’s function assignTaxonomy, with default parameters, which uses the RDP naive Bayesian classifier (Wang et al., 2007) against the Silva v.138 SSU taxonomic training data formatted for DADA2 (Quast et al., 2012). Sequence counts, taxonomic assignments, and associated metadata were compiled as a phyloseq object for downstream analyses (McMurdie and Holmes, 2013). Only sequences classified at the kingdom level as bacteria or archaea were included, meaning that ASVs assigned to mitochondria were removed, resulting a phyloseq object containing 1,019 ASVs from 32 samples. For clear visualization, we transformed the raw proportions of ASVs to relative abundance and only selected phyla with a relative abundance above 1% (Figure 2). Several samples were not included due to methological failures (during sampling, DNA extraction or sequencing).
Figure 2
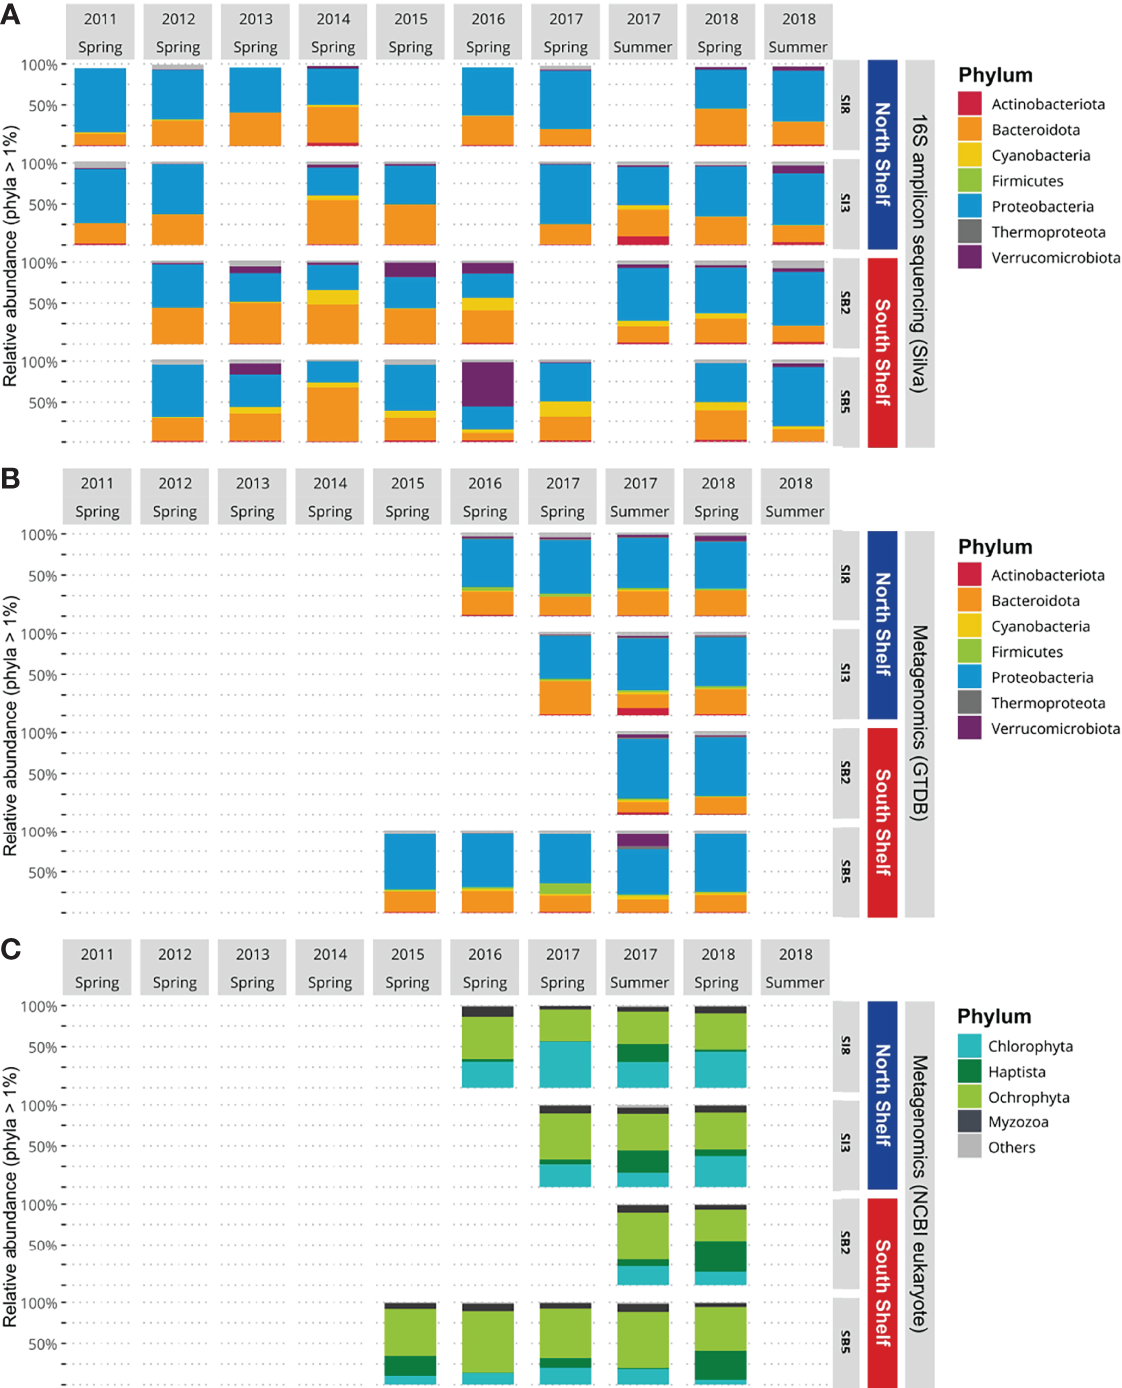
Phylum community composition of Icelandic marine microbial communities. (A) Relative abundances of Bacteria and Archaea per station based on 16S rRNA gene amplicon sequencing data. (B) Relative abundances of Bacteria and Archaea per station based on metagenomics data. (C) Relative abundance of marine eukaryotes per station based on metagenomics data.
To resolve the taxonomic profiles based on the metagenomic data, the quality of the raw HiSeq reads was assessed and reads were filtered as described in Jégousse et al. (2021). The cleaned metagenomic reads were classified with Kraken v2.1.1 (Wood et al., 2019) with the –paired flag and default parameters. To get a complete overview of the microbial community structure encompassing bacteria, archaea and eukaryotes, two different databases were used: the Genome Taxonomy Database (Parks et al., 2018) built for Kraken2 by de la Cuesta-Zuluaga et al. (2019) and a custom-built database including seven eukaryotic clades (Table 1). Both databases were then formatted for estimation of species abundance with Bracken using default parameters (Lu et al., 2017) and results were converted to BIOM format (McDonald et al., 2012) with kraken-biom (https://github.com/smdabdoub/kraken-biom). This format allows data sets to be imported in R as phyloseq objects resulting in two phyloseq objects: one for the archaeal and bacterial taxonomic profiles and the second for the set of eukaryotic taxonomic profiles. The two objects were kept distinct as small eukaryotes have larger average genome sizes which result in higher numbers of reads classified as small eukaryotes. As we did for the 16S rRNA gene amplicons, we transformed the raw proportions of sequences to relative abundance and selected phyla with a relative abundance above 1% (Figures 2B, C). The difference in mean relative abundances, when comparing the North Shelf and South Shelf stations, was tested by applying Wilcoxon tests. To analyze the differences further for the two regions, taxa detected only in the North and South Shelves were identified using the function taxa_core() from the phylosmith package (Smith, 2019).
Table 1
| Clade name | Taxonomic ID | Number of genomes (complete) |
|---|---|---|
| Chlorophyta | 3041 | 75 (30) |
| Dinophyta | 2864 | 11 (0) |
| Cryptophyta | 3027 | 2 (1) |
| Haptophyta | 2830 | 4 (3) |
| Ochrophyta | 2696291 | 47 (20) |
| Cercozoa | 136419 | 1 (1) |
| Retaria | 2662056 | 3 (0) |
Summary of the eukaryotic genomes used to build the custom Kraken2/Bracken database.
To compare the taxonomic profiles from metataxonomics and metagenomics, we focused on prokaryotic profiles by comparing the Silva’s metaxonomic profiles with the GTDB’s metagenomic at the phylum level. In the metataxonomic profiles, the only detected archaeal phylum name Crenarcheota (Garrity et al., 2001) was changed to Thermoproteota (Oren et al., 2015; Whitman et al., 2018) to be consistent across results from both databases. We tested the difference in relative proportions of phyla for each sample available for both techniques using the Chi-square test. To compare the relative proportions of specific taxa identified on the one hand on the North Shelf and on the other hand on the South Shelf, the mean relative proportion of the specific taxa for each region was analyzed using the Wilcoxon test.
Alpha diversity of marine microbial communities was estimated based on the observed ASV richness and the Shannon Index in the metataxonomic profiles. These alpha-diversity estimates were calculated with phyloseq for each sample by sampling sequences with replacement to the smallest library size (3,130 sequences) and averaging the measure over 100 trials. The alpha-diversity estimates as a function of the time are shown in Figure 3 with the Pearson coefficient and corresponding p-values.
Figure 3
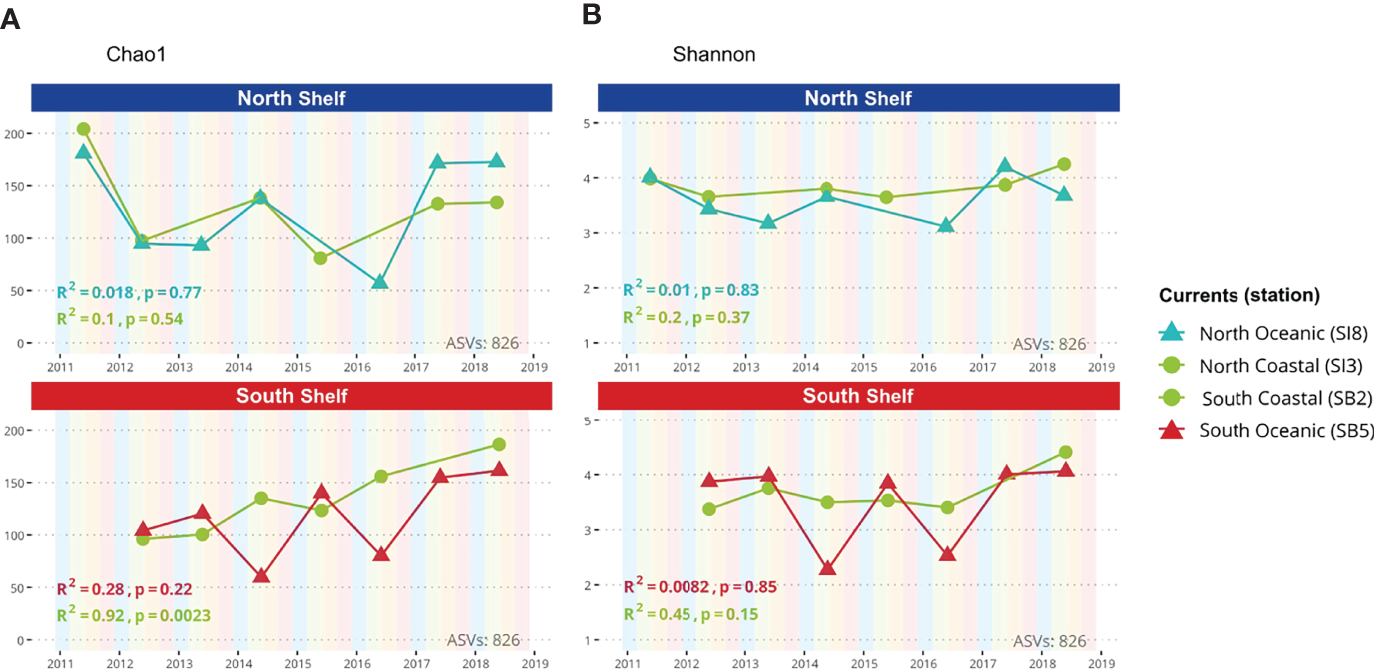
Alpha diversity. (A) Chao1 diversity index as a function of time for both coastal and oceanic stations in the North and South shelves of Iceland. (B) Shannon index as a function of time for both coastal and oceanic stations in the North and South shelves of Iceland.
To investigate differences in community composition, we implemented a principal coordinate analysis (PCoA) using Bray-Curtis dissimilarity (Figure 4A). This required prior transformation of the data by scaling the total raw proportions of ASVs to median sequencing depth (12,010 reads) to avoid using rarefaction (McMurdie and Holmes, 2014). We tested if the clusters had different centroids using permutational multivariate analysis of variance using Bray-Curtis distances with the function adonis2 of the vegan package (Dixon, 2003).
Figure 4
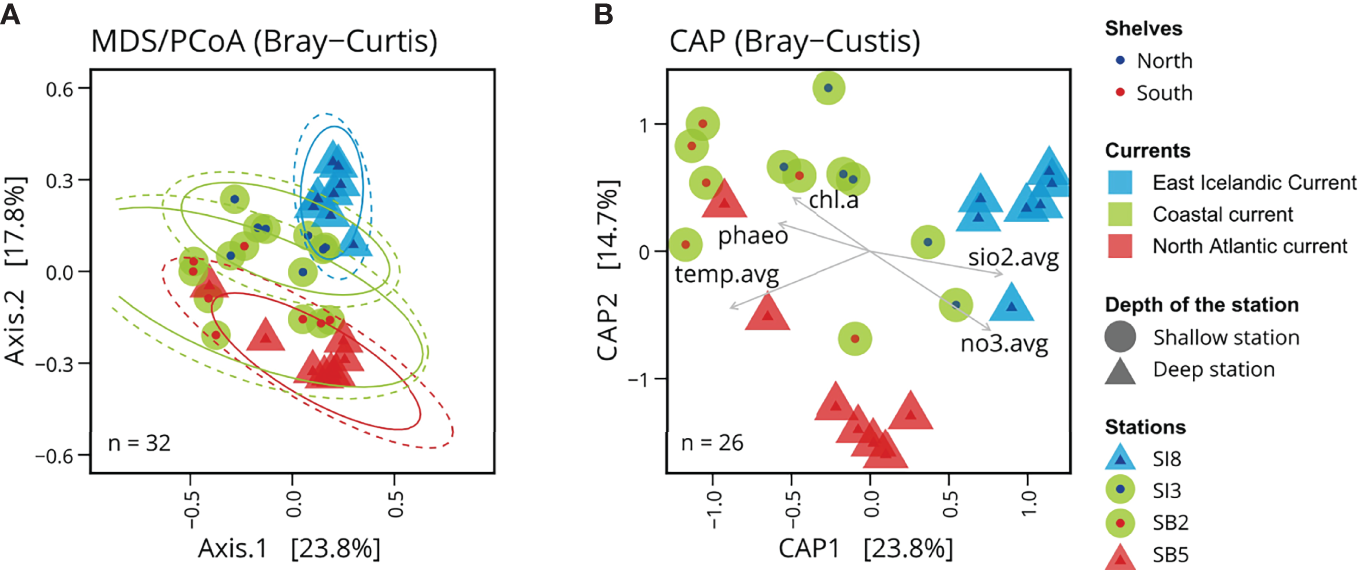
Microbial community structure linked to oceanic currents. (A) Principal coordinates analysis (PCoA) based on Bray-Curtis dissimilarities of Icelandic marine microbial communities. (B) Canonical analysis of principal coordinates (CAP) of Icelandic marine microbial communities with associated environmental variables: phao pigment (phaeo), chlorophyll a (chl.a), average concentration of silicate (sio2.avg), average concentration of nitrate (no3.avg), and average temperature (temp.avg). The average of these variables was calculated using all measurements available above the mixed layer depth.
To investigate the environmental factors likely associated with changes in bacterial/archaeal community composition, we used a constrained analysis of principal coordinates (CAP, also called distance-based redundancy analysis) using the function ordinate of the phyloseq package (Figure 4B). We computed Bray-Curtis principal coordinate scores based on linear models using the linear combination of the selected physico-chemical and biological variables, i.e. the seawater temperature and measured concentrations of silicate, nitrate, chlorophyll a and phaeopigments, in the mixed surface layer at each station. We included in the CAP only the samples collected in spring for which all physico-chemical and biological variables were available.
All preprocessing steps described previously were executed as a Snakemake workflow and analysis as R scripts available at https://github.com/clarajegousse/mime-16s.
2.4 Metabolism of Core Taxa
To investigate the potential metabolism of the core taxa on the South Shelf and on the North Shelf, we identified core taxa as genera with frequency in samples from the North or the South Shelves higher than 0.5 with a minimum abundance threshold of 0.01 using the function taxa_core of the phylosmith package in the metagenomic taxonomic profiles. In other words, we defined the core taxa as the genera present in at least half of the samples collected on the one hand from the North Shelf and on the other hand from the South Shelf, respectively with relative abundance of these genera of at least 1% of the community. The proportions of the core genera were computed using the function taxa_proportions() of the phylosmith package and are shown in Figure 5. The proportions of the core taxa were only computed on the metagenomic taxonomic profiles (annotation from GTDB) so that the taxonomy of these taxa could match with the taxonomic annotations of the MAGs. Based on genus names, the core taxa were matched to available MAGs.
Figure 5
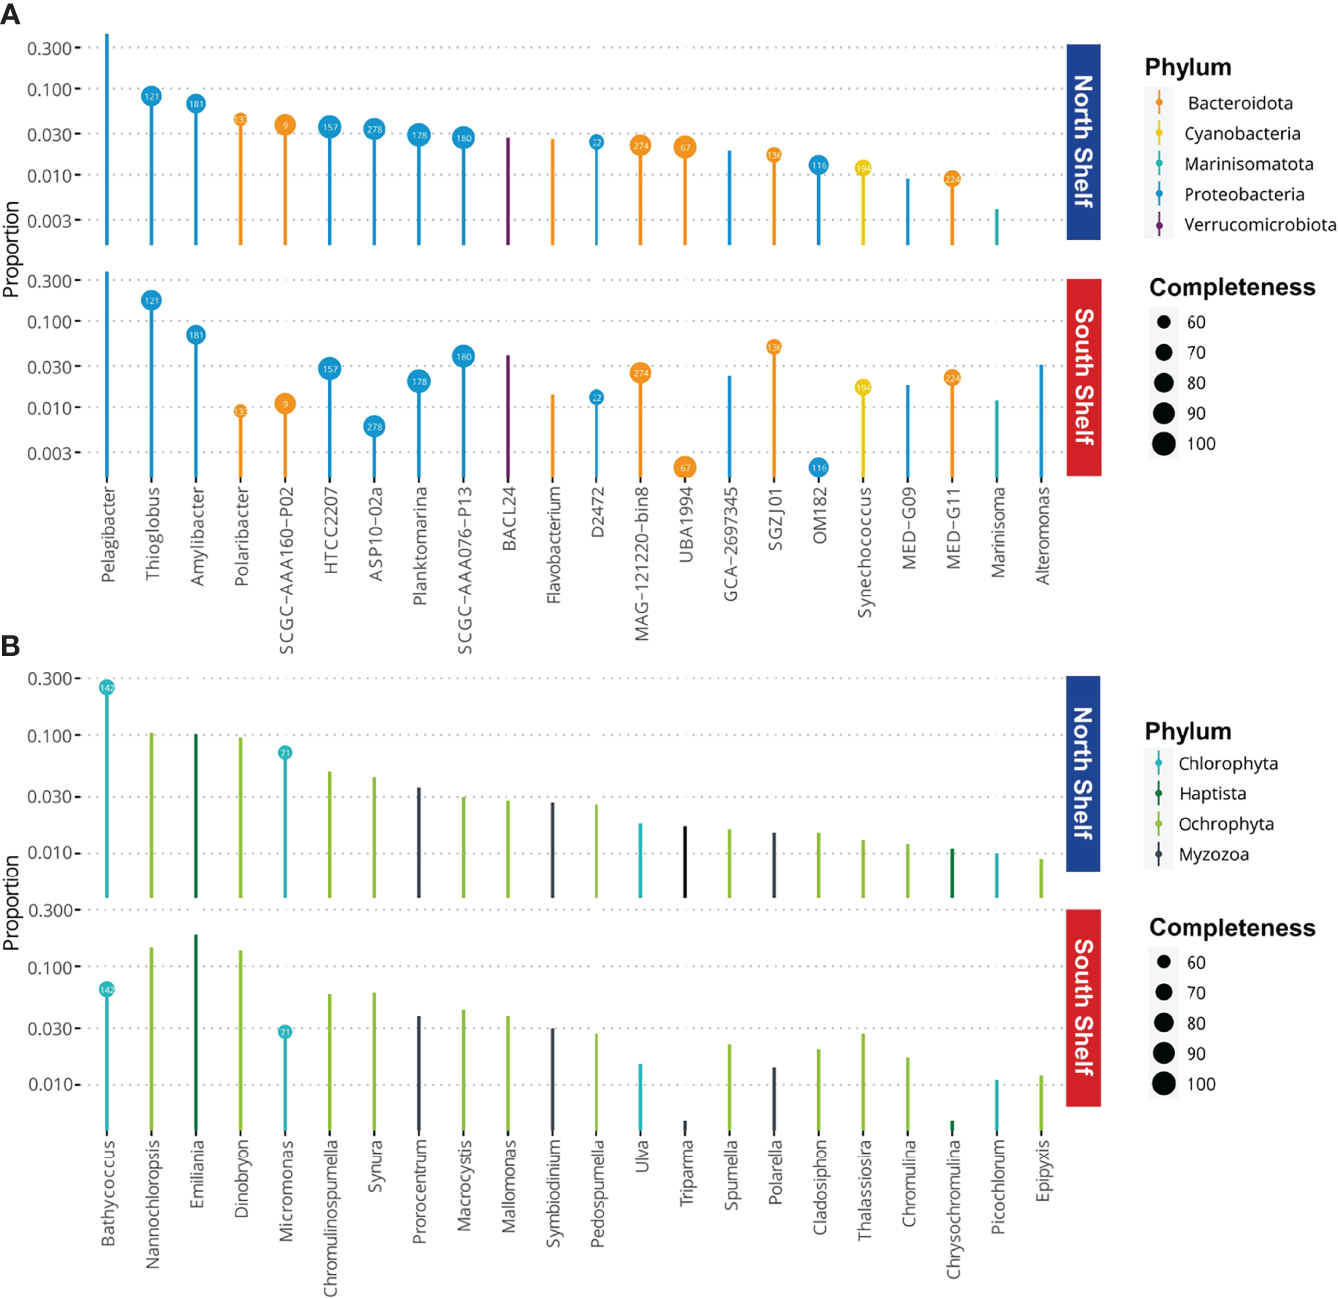
Microbial core taxa at phylum levels and the completeness (%) of the corresponding MAGs. (A) Proportions of bacterial core taxa of the microbial communities observed in samples from the north and south of Iceland. (B) Proportions of eukaryotic core taxa of the microbial communities observed in samples from the north and south of Iceland. Bubbles contain the ID number of the MAGs for the corresponding taxa (Supplementary Table S3).
The potential metabolism was predicted for the MAGs resulting from the co-assembly of surface seawater collected around Iceland. The prediction was performed using Anvi’o (Eren et al., 2015) and the KEGG’s KofamKOALA database (Aramaki et al., 2019). Briefly, we used the program anvi-run-kegg-kofams to extract all gene calls from the contigs of the MAGs of the core taxa. All gene calls were then annotated with functional annotation (K number) using the hmmscan program of HMMER v3.1b2 (Eddy, 2011; Mistry et al., 2013) against a hidden Markov models (HMM) database of KEGG Orthologs (KOs) called KOfam. Then, these annotations were used to reconstruct the potential metabolic pathways using the program anvio-estimate-metabolism. The metabolic pathways are defined by KEGG modules as set of KOs and if at least 75% of the KOs (genes) within the KEGG module (pathway) were found, the pathway in question is considered complete. In this study, we focused on energy metabolism using the five KEGG modules, namely carbon fixation, methane metabolism, nitrogen metabolism, sulfur metabolism, photosynthesis, in our subset of the 17 MAGs of the core taxa previously identified (Supplementary Table S2). The results were manually curated to remove false positives – pathways considered present while they are recorded as incomplete in KEGG.
3. Results
3.1 Microbial Community Composition
When comparing the taxonomic profiles obtained with the two methods – the metataxonomic and metagenomic profilings with the GTDB – the bacterial and archaeal community composition is consistent for the 12 samples that were studied with both methods. For each sample, no significant difference in taxonomic profiles was detected (Chi-square test, Supplementary File S3). The mean relative proportions of each phylum observed with metataxonomics did not show significant differences (Wilcoxon test) with the mean relative proportion of each phylum with metagenomics profiles. This further confirms the overall consistency between the two methods in terms of relative abundance and mean proportion of taxa at the phylum level. However, the Firmicutes phylum represents on average less than 1% of the microbial community in the metataxonomic profiles, while it represents on average 3% of the metagenomic taxonomic profile.
We compared the taxonomic profiles of the North and South Shelves of Iceland. In both metataxonomic profiles and metagenomic taxonomic profiles, Proteobacteria (Alphaproteobacteria and Gammaproteobacteria) and Bacteroidota represent the largest component of marine bacterial communities in both shallow and deep stations north and south of Iceland (Figures 2A, B) with average proportions of 52.6% ± 14% for Proteobacteria and 33.5% ± 12.8% for Bacteroidota. In most of the samples (25 samples out of 32) Proteobacteria is the most abundant phylum with roughly equal proportions of Alpha- and Gammaproteobacteria and no significant differences in mean relative abundance. Bacteroidota is the most abundant phylum in seven samples from which six were collected from shallow stations (SI3 and SB2) and one was from the deeper station at Selvogsbanki (SB5). The main difference between the North and South Shelves is the relative abundance of Cyanobacteria that almost only consist of genus Synechococcus (either classified as Synechococcus CC9902 in Silva or as Synechococcus_C and Synechococcus_E in GTDB). There is a significant difference in the relative proportions of Cyanobacteria when comparing pairs of stations that are located on different shelves. Moreover, pairwise comparison of individual stations on the same shelf show no significant differences in the mean relative abundances of Cyanobacteria (Table 2). Overall Cyanobacteria are more abundant in the warmer Atlantic water south of Iceland than in the colder water north of Iceland, which is also visible in the difference of relative coverage of the Synechococcus MAG (Figure 6C).
Table 2
| Compared stations | p-value | adjusted p-value | significance | |
|---|---|---|---|---|
| 1 | Selvogsbanki 5 x Selvogsbanki 2 | 0.3282 | 0.6400 | ns |
| 2 | Selvogsbanki 5 x Siglunes 3 | 0.0047 | 0.0230 | ** |
| 3 | Selvogsbanki 5 x Siglunes 8 | 0.0013 | 0.0081 | ** |
| 4 | Selvogsbanki 2 x Siglunes 3 | 0.0498 | 0.1500 | * |
| 5 | Selvogsbanki 2 x Siglunes 8 | 0.0180 | 0.0720 | * |
| 6 | Siglunes 3 x Siglunes 8 | 0.3181 | 0.6400 | ns |
Results of pairwise comparison of the mean relative abundances of Cyanobacteria between the four stations.
The p-values are considered non significant (ns) when above 0.05, significant (*) between 0.01 and 0.05, and very significant (**) between 0.001 and 0.01.
Figure 6
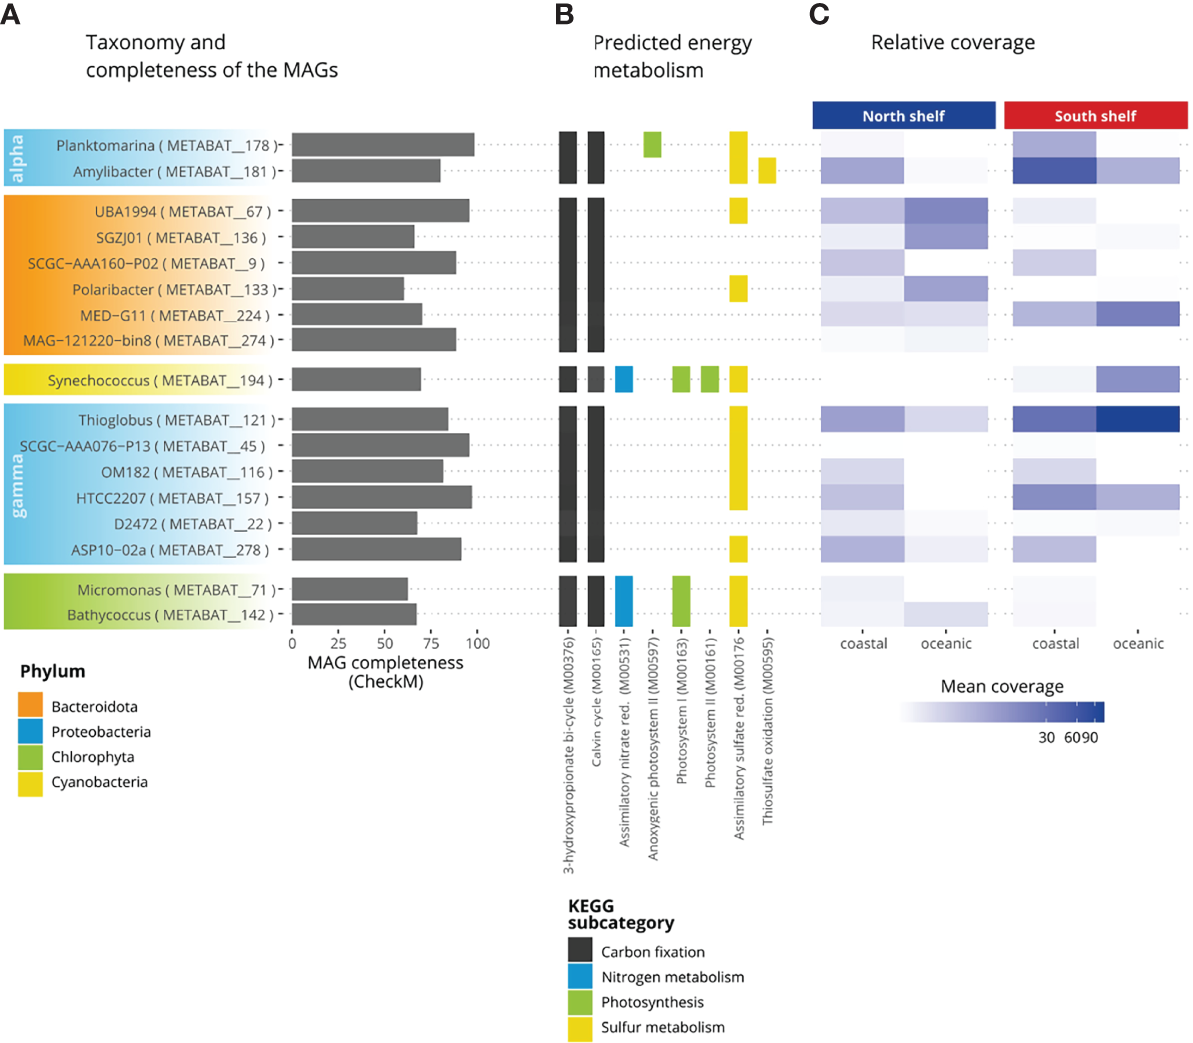
Metabolic potential of the core taxa of the microbial community in Icelandic marine waters. (A) Completeness of the MAGs. (B) Percentage of completeness of KEGG modules. (C) Relative coverage of the MAGs.
When investigating the metagenomics profiles, one genus in the Actinobacteria phylum was solely detected in samples from the North Shelf, with a relative abundance above 1% (Figure 2B). This exclusively northern taxon belongs to the genus Aquiluna and was mostly detected in the sample collected in summer 2017 at the north shallower station off Siglunes 3 (SI3).
In the metagenomic taxonomic profiles for marine eukaryotes at the phylum level, Ochrophyta is the main component of the eukaryotic communities in the south while, Chlorophyta is the main component in samples from the more arctic stations on the North Shelf (Figure 2C). The relative proportions of Myzozoa range from 0.02% to 0.08% of the eukaryotic community. Haptophyta proportions are highly variable between samples. Haptophyta represent less than 5% of the community in spring 2016 but more than 30% of the community observed in samples from the South Shelf in spring 2018 (Figure 2C).
Variations in microbial diversity within samples (alpha-diversity) are shown in Figures 3A, B based on metataxonomics. The richness Chao1 index displays no significant correlations with time except for the shallower station of Selvogsbanki (SB2) in the south. In this case, the Chao1 richness index is strongly correlated with time (R2 = 0.92; p-value<0.01) indicating an increase in diversity over the years. The evenness of the microbial communities was measured using the Shannon index which does not show any significant correlation with time. Both alpha-diversity estimates - Chao1 and Shannon - fluctuate more in samples from deeper stations, both north and south, compared with the shallower stations with an average Chao1 index of 132 ± 37 in shallow stations against 123 ± 42 in deeper stations. However, there was no significant differences observed in either of the two alpha-diversity estimates between stations (Anova, p=0.896 and p=0.632 respectively for Chao1 and Shannon estimates).
The PCoA based on Bray-Curtis dissimilarities (beta-diversity) shows a clustering pattern of the microbial surface communities in accordance with the different subregions, north and south of Iceland (Figure 4A), matching the different water masses. Clustering based on ASV profiles revealed distinct microbial communities, i.e. matching the Arctic Water influenced station SI8, the Atlantic-influenced station SB5 and the two shallower stations SI3 and SB2 with more variable water masses. The first principal coordinate (axis 1) of Bray-Curtis sample dissimilarities explained 23.8% of variation in archaeal and bacterial community composition across all samples while the second principal coordinate (axis 2) explained 17.8% of variations within these communities. It shows differences between the shallow and deep stations, as well as the North and South Shelves. These differences correspond to different water masses and currents, suggesting that the characteristics of these water masses are influencing factors. The canonical analysis of principal coordinates (Figure 4B) shows the environmental variables associated with these changes in community composition: the northern samples are associated with colder water temperature and higher concentrations in silicate and nitrate, while the southern shallow samples are associated with warmer water temperatures and higher levels of pigment (phaeopigments and chloropyll a).
3.2 Core Taxa and Their Metabolic Potential
In the metagenomic taxonomic profiles, we identified 22 core taxa within the bacterial-archaeal community and 22 in the eukaryotic community. In the bacterial community, the core taxa species include 12 Proteobacteria, seven Bacteroidota, and one Cyanobacteria, one Marinisomatota and one Verrumicrobiota in the bacterioplankton (Figure 5). More than half (15/22) of these core taxa correspond to available MAGs. The most dominant core taxon belongs to the genus Pelagibacter, member of the ubiquitous SAR11 clade. In the eukaryotic community the core taxa include 13 genera of Ochrophyta, of which one of the genera is the common diatoms Thalassiosira, while two of the genera are the macro-algae Macrocystis and titCladosiphon, and the seven genera of flagellates and monades, i.e. Dinobryon, Chromulinospumella, Syruna, Mallomonas, Pedospumella, Spumella and Epipyxis. In addition, genera Nannochloropsis, Triparma and Chromulin are also three core taxa belonging to the Ochrophyta pylum. Moreover, there are four chlorophytes, of which one is the macroalgaea Ulva, and three are photosynthetic marine picoplanktonic monades Bathycoccus, Micromonas and Picochlorum. Lastly, there are three Myzozoa (two free-living dinoflagellates Prorocentrum and Polarella, and one symbiont Symbiodinium) and two Haptophyta genera, Emiliana and Chrysochromulina. Only two of the eukaryote genera were also correspond to available MAGs from the co-assembly of surface seawater metagenomes.
The potential energy metabolism of these core taxa was investigated (Figure 6). More than half of the genes (KO) involved in carbon fixation coding for the 3-hydroxypropionate bi-cycle (M00376) and the Calvin-Benson cycle (M00165) were identified for all core taxa. Pathways of the methane metabolism were present in 17 of the core taxa. The formaldehyde assimilation pathway was found in all studied MAGs. The assimilatory nitrate reduction (M00531) was only found for Micromonas (METABAT_71), Bathycoccus (METABAT_142) and Synechococcus (METABAT_194). Nitrate is the dominant form of biologically available nitrogen and is rapidly assimilated by phytoplankton in surface seawaters (Gruber and Galloway, 2008). Nitrite-oxidizing bacteria are found within four bacterial phyla: Proteobacteria, Nitrospirae, Nitrospinae and Chloroflexi (Daims et al., 2016). Almost complete pathways involved in the photosynthesis were identified such as the anoxygenic photosystem II for Planktomarina (METABAT_178), the photosystem I for the Chlorophyta, Micromonas (METABAT_71) and Bathycoccus (METABAT_142) and for the Cyanobacteria Synechococcus (METABAT_194). Finally, the photosystem II was onlyfound for Synechococcus (METABAT_194). Pathways involved in the sulfur metabolism were found for assimilatory sulfate reduction (M00176), dissimilatory sulfate reduction (M00596) and thiosulfate oxidation (M00595). The assimilatory sulfate reduction was found for 13 of the 17 core taxa: only in the MAGs for the two Flavobacteriacea members: SGZJ01 (METABAT_136) and SCGS-AAA160-P02 (METABAT_9), for the two Cryomorphaceae members: MED_G11 (METABAT_224) and MAG_121220-bin8 (METABAT_174) and for the Porticoccaceae member SAR92: D2472 (METABAT_22) this pathway was not reconstructed. Finally, the thiosulfate oxidation pathway (M00595) was identified only for Amylibacter.The relative coverage of MAGs (Figure 6C) may indicate that UBA1994 (METABAT_67), a member of Saprospiraceae, and Polaribacter (METABAT_133) thrive best in oceanic water north of Iceland whereas genus MED-G11 (METABAT_224), Synechococcus (METABAT_194), Planktomarina (METABAT_178), Amilybacter (METABAT_181) and Thioglobus (METABAT_121) apparently prefer the oceanic water south of Iceland and Amylibacter the shallower part of the South Shelf.
4. Discussion
The combination of metataxonomics and metagenomics give a first insight of taxonomy and metabolic potential of the microbial communities in Icelandic marine waters. For the metataxonomics, the 16S rRNA gene amplicons were obtained with the EMP primers which were designed in a global effort to create a catalogue of microbial life across habitat (Apprill et al., 2015; Parada et al., 2016). This makes the dataset comparable to other datasets of 16S rRNA amplicons from different regions of the global ocean. Because 16S rRNA gene amplicon sequencing is known to have many biases such as the PCR bias (Brooks et al., 2015), metagenomics were used as a complementary taxonomic analysis in this study. The consistency between the taxonomic profiles obtained with both methods highlights the reliability of our results (Brumfield et al., 2020). Therefore the taxonomic profiles in this study can be a reliable baseline for monitoring the marine microbial diversity around Iceland.
This study describes a stable microbial diversity in both the North and South Shelves waters since 2011, under the Atlantic influence of the North Atlantic Oscillation (NOA) phenomenon (Desbruyères et al., 2021). However, this study also reveals a correlation between the microbial community structure and the water masses from which the samples were collected. Despite inter-annual variations the marine microbial communities are constrained by specific environmental conditions influenced by the time and region such as the average sea surface temperature and nutrient availability. Our results suggest that the average sea surface temperature is the main driver in microbial composition which corroborates recent findings in the same region by Carter-Gates et al. (2020).
The energy metabolic potential of the 17 core taxa (15 prokaryotes and two eukaryotes) is presented alongside the completeness and the average mean coverage of the MAGs (Figure 6C). The prediction of the presence or absence of metabolic pathways in each MAG depends on the identification of at least 75% of the genes involved in each pathway. This approach is limited by incompleteness of MAGs and the variable number of genes (KO) involved in a pathway (module) because, in the KEGG database, some pathways have as little as three genes (KO) while some pathways have more than 50 genes. Thus, this approach can result in both false positive and false negative but can provide information on uncultured species. For example, the thiosulfate oxidation pathway (M00595) is not detected in Planktomarina (METABAT_178), however this pathway recorded as complete in species Planktomarina temperata RCA23 (KEGG entry ptp_M00595). Thus, it is likely that the absence of thiosulfate oxidation pathway (M00595) is a false negative and is indeed present in Planktomarina. Beside, this pathway is considered present in Amylibacter (METABAT_181), which also belongs to the Rhodobacteraceae family, but unfortunately has no data available in KEGG. Similarly, four core taxa (two bacteria and two eukaryotes) with potential photosynthetic activity were identified: Planktomarina, Synechococcus, Bathycoccus and Micromonas. The absence of photosystem II in photosynthetic eukaryotic MAGs can be explained by the relatively lower completeness scores of these two MAGs, with 67.5% for Bathycoccus and 62.7% for Micromonas, compared with 15 prokaryotic MAGs that have an average completeness score of 77.8%. Indeed, the relatively large size and complexity of eukaryotic genomes complicate the resolution of eukaryotic MAGs (Zhang et al., 2011). The representant of the genus Planktomarina harbor the anoxygenic system I, suggesting the ability to acquire energy using aerobic anoxygenic photosynthesis as described by Giebel et al. (2019). The other key photosynthetic bacteria belongs to the genus Synechococcus, in which we detect most of the genes involved in the photosystems I and II. The relative mean coverage of the Synechococcus bin corroborates the pattern displayed in the taxonomic profiles, with a high mean coverage on the South Shelf suggesting a higher proportion of this genus in the southern microbial communities.
In the eukaryotic microbial community, several of the genera identified in this study are known as freshwater organisms (e.i. Dinobryon, Chromolinospumella, Mallomonas, Pedospumella, Syruna, Spumella and Epipyxis). This is explained by the presence of sequencing reads in our data set that matched our custom-made database of eukaryotic genomes (Table 1). It is likely that these reads belong to the genomes of marine organisms, related to these freshwater organisms, that do not have a reference genomes in NCBI. Indeed, eukaryotic genome databases are biased toward multicellular organism with a lack of available genomes for unicellular eukaryotes (del Campo et al., 2014). Our results highlight the need for more reference genomes of unicellular eukaryotes as Sibbald and Archibald (2017) also recommended. Besides, the presence of macroalgae likely results from the inclusion of the Ochrophyta phylum in the custom made Kraken database. The Ochrophyta phylum is diverse and includes, according to NCBI, diatoms, golden algae as well as brown algae. Some members of the Ochrophyta phylum are macroalgae, namely genera Macrocystis, Ulva, Cladosiphon. For reproduction, these algae form swarms of spores which may spread over long distances and could explain the presence of these organisms in our data set.
The main distribution difference between the northern and southern microbial communities is the type of photosynthetic core taxa: Cyanobacteria in the samples collected from the South Shelf and chlorophytes in the samples collected from the North Shelf. As autotrophs in general, photosynthetic picoeukaryotes are sensitive to water temperature, as well as the available light and nutrient concentrations (Kirkham et al., 2011). Thus, changes in average sea surface temperature may lead to the redistribution of certain taxa. In one scenario, parts of the Arctic Ocean would keep warming up and transition from cold and stratified waters to a warm and well-mixed Atlantic-dominated waters (Lind et al., 2018). In this case, temperate adapted marine microorganisms from the Atlantic water masses may replace cold water taxa from the polar water masses. In particular, cyanobacteria are predicted to expand in higher latitudes as a consequence of global warming (Morán et al., 2010; Flombaum et al., 2013). Accordingly, one may expect to find higher proportions of Cyanobacteria - Synechococcus north of Iceland in the near future. However, on the other hand there are evidences of the decline in strength of the AMOC with a weakening the North Atlantic Current flowing south of Iceland. If so, the warmer waters carried by the Atlantic current will not reach as far north as they currently do. In this case, it becomes unlikely that southern Cyanobacteria would expand its distribution to the north of Iceland. If this later scenario takes place, one would expect that the southern microbial community would retreat further south and be replaced by higher proportions of unicellular photosynthetic eukaryotes such as Micromonas and Bathycoccus over the South Shelf of Iceland. Either way, this study highlights the relevance of monitoring such photosynthetic species, as indicator species.Our results provide a foundation for future monitoring of microbial community composition in Icelandic marine waters. This study revealed that the main difference between the North Shelf and the South Shelf is the relative abundance of photosynthetic microorganisms: members of the Chlorophyta clade more abundant in the north and the cyanobacteria Synechococcus in the south. Presumably, more differences may be expected in the microbial communities found deeper in the water-columns in the study area, where environments are more constant through out the year, closer to the bottom with the contrasting water masses north and south, separated by the ocean ridges. On the other hand, one may also expect to observe more variability in the microbial communities in the surface layer than found in this presented study, if the sampling covered all the seasons in the high latitudes. Therefore further investigation is needed for a comparison with our description of the spring and summer microbial communities in the waters around Iceland that highlighted the potential of Synechococcus, Bathycoccus and Micromonas as indicator species. Data on such candidate indicator species are valuable as they are needed for ecosystem monitoring and modeling as well as sustainable management of the Icelandic waters.
The marine waters around Iceland represent a contrasting and dynamic ecosystem that have been under-sampled for microbiome analyses compared to lower latitudes. Until very recently, there was a lack of published microbial community structure data for this marine environment outside of the datasets from large scale surveys such as the Tara Oceans (Sunagawa et al., 2015; Sunagawa et al., 2020) and Malaspina expeditions (Duarte, 2015). The MIME project provides a temporal and regional view of the Icelandic marine microbial communities and their relative abundance studied with a combination of two well-established methods based on DNA sequencing: metagenomics and metataxonomics. The results of this study are consistent with major trends in marine microbial studies with bacterial phyla Proteobacteria and Bacteroidota and Cyanobacteria found to be the dominant as described in the structure of the global ocean microbiome (Sunagawa et al., 2015). These data are potential resources for further analysis of the distribution and temporal variations of specific taxonomic groups and provide baseline information and insights into the relationship between microbial communities and their surrounding environments in Icelandic marine waters, which is valuable for comparison with other large-scale surveys and future monitoring.
Funding
The work is part of the Microbes in the Icelandic Marine Environment (MIME) project which was funded by the Grant of Excellence (No. 163266-051) of the Icelandic Research Fund (Rannís). The funders had no role in study design, data collection and analysis, decision to publish, or preparation of the manuscript.
Publisher’s Note
All claims expressed in this article are solely those of the authors and do not necessarily represent those of their affiliated organizations, or those of the publisher, the editors and the reviewers. Any product that may be evaluated in this article, or claim that may be made by its manufacturer, is not guaranteed or endorsed by the publisher.
Statements
Data availability statement
The datasets presented in this study are available in the European Nucleotide Archive under the study accession number PRJEB41565.
Author contributions
CJ conceived and designed the experiments, performed the experiments, analyzed the data, prepared the figures and tables, authored or reviewed drafts of the paper, and approved the final draft. PV conceived and designed the experiments, performed the experiments, authored or reviewed drafts of the paper, and approved the final draft. RG, KG and VM conceived and designed the experiments, authored or reviewed drafts of the paper, and approved the final draft. All authors contributed to the article and approved the submitted version.
Acknowledgments
The authors would like to thank the Marine and Fresh Water Research Institute’s crew of the r/s Bjarni Saemundsson, the division manager Sólveig R. Ólafsdóttir and others at the environmental division for kindly helping with sampling and providing various background data. Furthermore, we thank Alexandra Klonowski, Sigurlaug Skírnisdóttir from Matís for their help with DNA extraction and sequencing, Alexandra Leeper from Matís for proofreading, as well as Pauline Bergsten and Mia Cerfonteyn from the University of Iceland & Matís for sampling, Professor Arnar Pálsson, Professor María Guðjónsdóttir and Elvar Örn Jónsson from the University of Iceland for advice and support. The analyses presented in the study were performed using the resources provided by the Icelandic High Performance Computing Centre at the University of Iceland.
Conflict of interest
The authors declare that the research was conducted in the absence of any commercial or financial relationships that could be constructed as a potential conflict of interest.
Supplementary material
The Supplementary Material for this article can be found online at: https://www.frontiersin.org/articles/10.3389/fmars.2022.795835/full#supplementary-material
References
1
Apprill A. McNally S. Parsons R. Weber L. (2015). Minor Revision to V4 Region SSU rRNA 806R Gene Primer Greatly Increases Detection of SAR11 Bacterioplankton. Aquat. Microbial. Ecol.75, 129–137. doi: 10.3354/ame01753
2
Aramaki T. Blanc-Mathieu R. Endo H. Ohkubo K. Kanehisa M. Goto S. et al . (2019). KofamKOALA: KEGG Ortholog Assignment Based on Profile HMM and Adaptive Score Threshold. Bioinformatics36, 2251–2252. doi: 10.1093/bioinformatics/btz859
3
Béjà O. Aravind L. Koonin E. V. Suzuki M. T. Hadd A. Nguyen L. P. et al . (2000). Bacterial Rhodopsin: Evidence for a New Type of Phototrophy in the Sea. Science289, 1902–1906. doi: 10.1126/science.289.5486.1902
4
Bolger A. M. Lohse M. Usadel B. (2014). Trimmomatic: A Flexible Trimmer for Illumina Sequence Data. Bioinformatics30, 2114–2120. doi: 10.1093/bioinformatics/btu170
5
Brooks J. P. Edwards D. J. Harwich M. D. Rivera M. C. Fettweis J. M. Serrano M. G. et al . (2015). The Truth About Metagenomics: Quantifying and Counteracting Bias in 16S rRNA Studies. BMC Microbiol.15, 1–14. doi: 10.1186/s12866-015-0351-6
6
Brumfield K. D. Huq A. Colwell R. R. Olds J. L. Leddy M. B. (2020). Microbial Resolution of Whole Genome Shotgun and 16S Amplicon Metagenomic Sequencing Using Publicly Available NEON Data. PloS One15, 1–21. doi: 10.1371/journal.pone.0228899
7
Callahan B. J. McMurdie P. J. Holmes S. P. (2017). Exact Sequence Variants Should Replace Operational Taxonomic Units in Marker-Gene Data Analysis. ISME J.11, 2639–2643. doi: 10.1038/ismej.2017.119
8
Callahan B. J. McMurdie P. J. Rosen M. J. Han A. W. Johnson A. J. A. Holmes S. P. (2016b). Dada2: High-Resolution Sample Inference From Illumina Amplicon Data. Nat. Methods13, 581–583. doi: 10.1038/nmeth.3869
9
Callahan B. Sankaran K. Fukuyama J. McMurdie P. Holmes S. (2016a). Bioconductor Workflow for Microbiome Data Analysis: From Raw Reads to Community Analyses. F1000Res. 5, 1492. doi: 10.12688/f1000research.8986.2
10
Carter-Gates M. Balestreri C. Thorpe S. E. Cottier F. Baylay A. Bibby T. S. et al . (2020). Implications of Increasing Atlantic Influence for Arctic Microbial Community Structure. Sci. Rep.10, 19262. doi: 10.1038/s41598-020-76293-x
11
Casanova-Masjoan M. Pérez-Hernández M. D. Pickart R. S. Valdimarsson H. Ólafsdóttir S. R. Macrander A. et al . (2020). Along-Stream, Seasonal, and Interannual Variability of the North Icelandic Irminger Current and East Icelandic Current Around Iceland. J. Geophys. Res.: Oceans125, e2020JC016283. doi: 10.1029/2020JC016283
12
Cheng L. Zhu J. Abraham J. Trenberth K. E. Fasullo J. T. Zhang B. et al . (2019). 2018 Continues Record Global Ocean Warming. Adv. Atmos Sci.36, 249–252. doi: 10.1007/s00376-019-8276-x
13
Daims H. Lücker S. Wagner M. (2016). A New Perspective on Microbes Formerly Known as Nitrite-Oxidizing Bacteria. Trends Microbiol.24, 699–712. doi: 10.1016/j.tim.2016.05.004
14
de la Cuesta-Zuluaga J. Ley R. E. Youngblut N. D. (2019). Struo: A Pipeline for Building Custom Databases for Common Metagenome Profilers. Bioinformatics36, 2314–2315. doi: 10.1093/bioinformatics/btz899
15
del Campo J. Sieracki M. E. Molestina R. Keeling P. Massana R. Ruiz-Trillo I. (2014). The Others: Our Biased Perspective of Eukaryotic Genomes. Trends Ecol. Evol.29, 252–259. doi: 10.1016/j.tree.2014.03.006
16
Desbruyères D. Chafik L. Maze G. (2021). A Shift in the Ocean Circulation has Warmed the Subpolar North Atlantic Ocean Since 2016. Commun. Earth Environ.2, 48. doi: 10.1038/s43247-021-00120-y
17
Dixon P. (2003). Vegan, a Package of R Functions for Community Ecology. J. Veg. Sci.14, 927–930. doi: 10.1111/j.1654-1103.2003.tb02228.x
18
Doney S. C. Fabry V. J. Feely R. A. Kleypas J. A. (2009). Ocean Acidification: The Other CO2 Problem. Annu. Rev. Mar. Sci.1, 169–192. doi: 10.1146/annurev.marine.010908.163834
19
Duarte C. M. (2015). Seafaring in the 21st Century: The Malaspina 2010 Circumnavigation Expedition. Limnol. Oceanogr. Bull.24, 11–14. doi: 10.1002/lob.10008
20
Eddy S. R. (2011). Accelerated Profile Hmm Searches. PloS Comput. Biol.7, 1–16. doi: 10.1371/journal.pcbi.1002195
21
Eren A. M. Esen Ö.C. Quince C. Vineis J. H. Morrison H. G. Sogin M. L. et al . (2015). Anvi’o: An Advanced Analysis and Visualization Platform for ’omics Data. PeerJ3, e1319. doi: 10.7717/peerj.1319
22
Flombaum P. Gallegos J. L. Gordillo R. A. Rincón J. Zabala L. L. Jiao N. et al . (2013). Present and Future Global Distributions of the Marine Cyanobacteria Prochlorococcus and Synechococcus. Proc. Natl. Acad. Sci.110, 9824–9829. doi: 10.1073/pnas.1307701110
23
Follows M. J. Dutkiewicz S. (2011). Modeling Diverse Communities of Marine Microbes. Annu. Rev. Mar. Sci.3, 427–451. doi: 10.1146/annurev-marine-120709-142848
24
Garrity G. M. Holt J. G. Reysenbach A.-L. Huber H. Stetter K. O. Zillig W. et al . (2001). “Phylum Al. Crenarchaeota Phy. Nov,” in Bergey’s Manual® of Systematic Bacteriology (New York: Springer), 169–210.
25
Giebel H. A. Wolterink M. Brinkhoff T. Simon M. (2019). Complementary Energy Acquisition via Aerobic Anoxygenic Photosynthesis and Carbon Monoxide Oxidation by Planktomarina Temperata of the Roseobacter Group. FEMS Microbiol. Ecol.95, 1−9. doi: 10.1093/femsec/fiz050
26
Grasshoff K. (1970). A Simultaneous Multiple Channel System for Nutrient Analysis in Seawater With Analog and Digital Data Record. Technicon Q.3, 7–17.
27
Gruber N. Galloway J. N. (2008). An Earth-System Perspective of the Global Nitrogen Cycle. Nature451, 293–296. doi: 10.1038/nature06592
28
Holm-Hansen O. Lorenzen C. J. Holmes R. W. Strickland J. D. (1965). Fluorometric Determination of Chlorophyll. ICES J. Mar. Sci.30, 3–15. doi: 10.1093/icesjms/30.1.3
29
Hutchins D. A. Fu F. (2017). Microorganisms and Ocean Global Change. Nat. Microbiol.2, 17058. doi: 10.1038/nmicrobiol.2017.58
30
Jégousse C. Vannier P. Groben R. Glöckner F. O. Marteinsson V. (2021). A Total of 219 Metagenome-Assembled Genomes of Microorganisms From Icelandic Marine Waters. PeerJ9, e11112. doi: 10.7717/peerj.11112
31
Kirkham A. R. Jardillier L. E. Tiganescu A. Pearman J. Zubkov M. V. Scanlan D. J. (2011). Basin-Scale Distribution Patterns of Photosynthetic Picoeukaryotes Along an Atlantic Meridional Transect. Environ. Microbiol.13, 975–990. doi: 10.1111/j.1462-2920.2010.02403.x
32
Levitus S. Antonov J. I. Boyer T. P. Stephens C. (2000). Warming of the World Ocean. Science287, 2225–2229. doi: 10.1126/science.287.5461.2225
33
Lind S. Ingvaldsen R. B. Furevik T. (2018). Arctic Warming Hotspot in the Northern Barents Sea Linked to Declining Sea-Ice Import. Nat. Climate Change8, 634–639. doi: 10.1038/s41558-018-0205-y
34
Lu J. Breitwieser F. P. Thielen P. Salzberg S. L. (2017). Bracken: Estimating Species Abundance in Metagenomics Data. PeerJ Comput. Sci.3, e104. doi: 10.7717/peerj-cs.104
35
Marchesi J. R. Ravel J. (2015). The Vocabulary of Microbiome Research: A Proposal. Microbiome3, 31. doi: 10.1186/s40168-015-0094-5
36
Martin M. (2011). Cutadapt Removes Adapter Sequences From High-Throughput Sequencing Reads. EMBnet.journal17, 10–12. doi: 10.14806/ej.17.1.200
37
McDonald D. Clemente J. C. Kuczynski J. Rideout J. R. Stombaugh J. Wendel D. et al . (2012). The Biological Observation Matrix (BIOM) Format or: How I Learned to Stop Worrying and Love the Ome-Ome. GigaScience1, 1−7. doi: 10.1186/2047-217X-1-7
38
McMurdie P. J. Holmes S. (2013). Phyloseq: An R Package for Reproducible Interactive Analysis and Graphics of Microbiome Census Data. PloS One8, 1–11. doi: 10.1371/journal.pone.0061217
39
McMurdie P. J. Holmes S. (2014). Waste Not, Want Not: Why Rarefying Microbiome Data is Inadmissible. PloS Comput. Biol.10, 1–12. doi: 10.1371/journal.pcbi.1003531
40
Metzl N. Corbière A. Reverdin G. Lenton A. Takahashi T. Olsen A. et al . (2010). Recent Acceleration of the Sea Surface Fco2 Growth Rate in the North Atlantic Subpolar Gyr-2008) Revealed by Winter Observations. Global Biogeochem. Cycles24, GB4004 doi: 10.1029/2009GB003658
41
Mistry J. Finn R. D. Eddy S. R. Bateman A. Punta M. (2013). Challenges in Homology Search: HMMER3 and Convergent Evolution of Coiled-Coil Regions. Nucleic Acids Res.41, e121–e121. doi: 10.1093/nar/gkt263
42
Morán X. A. G. López-Urrutia Á. Calvo-Díaz A. Li W. K. (2010). Increasing Importance of Small Phytoplankton in a Warmer Ocean. Global Change Biol.16, 1137–1144. doi: 10.1111/j.1365-2486.2009.01960.x
43
Olafsson J. Olafsdottir S. R. Benoit-Cattin A. Danielsen M. Arnarson T. S. Takahashi T. (2009). Rate of Iceland Sea Acidification From Time Series Measurements. Biogeosciences6, 2661–2668. doi: 10.5194/bg-6-2661-2009
44
Oren A. da Costa M. S. Garrity G. M. Rainey F. A. Rosselló-Móra R. Schink B. et al . (2015). Proposal to Include the Rank of Phylum in the International Code of Nomenclature of Prokaryotes. Int. J. Syst. evol. Microbiol.65, 4284–4287. doi: 10.1099/ijsem.0.000664
45
Parada A. E. Needham D. M. Fuhrman J. A. (2016). Every Base Matters: Assessing Small Subunit rRNA Primers for Marine Microbiomes With Mock Communities, Time Series and Global Field Samples. Environ. Microbiol.18, 1403–1414. doi: 10.1111/1462-2920.13023
46
Parks D. H. Chuvochina M. Waite D. W. Rinke C. Skarshewski A. Chaumeil P.-A. et al . (2018). A Standardized Bacterial Taxonomy Based on Genome Phylogeny Substantially Revises the Tree of Life. Nat. Biotechnol.36, 996–1004. doi: 10.1038/nbt.4229
47
Peck M. Pinnegar J. K. (2019). Climate Change Impacts, Vulnerabilities and Adaptations: North Atlantic and Atlantic Arctic Marine Fisheries (FAO). 5, 87−111.
48
IPCC 2019 Technical Summary [PörtnerH.-O.RobertsD.CMasson-DelmotteVZhaiPPoloczanskaEMintenbeckKTignorMAlegríaANicolaiMOkemAPetzoldJRamaB (eds.)]. In: IPCC Special Report on the Ocean and Cryosphere in a Changing ClimateWeyerN.MPörtnerH.- ORobertsD.CMasson-DelmotteVZhaiP.TignorMPoloczanskaEMintenbeckKAlegríaM.NicolaiAOkemAPetzoldJRamaBWeyerN.M (eds.)]. In press. Available at: https://www.ipcc.ch/srocc
49
Quast C. Pruesse E. Yilmaz P. Gerken J. Schweer T. Yarza P. et al . (2012). The SILVA Ribosomal RNA Gene Database Project: Improved Data Processing and Web-Based Tools. Nucleic Acids Res.41, D590–D596. doi: 10.1093/nar/gks1219
50
R Core Team (2018). R: A Language and Environment for Statistical Computing. R Foundation for Statistical Computing (Vienna, Austria: rcoreteam).
51
Robson J. Sutton R. Lohmann K. Smith D. Palmer M. (2012). Causes of the Rapid Warming of the North Atlantic Ocean in the Mid-1990s. J. Climate25, 4116 –4134. doi: 10.1175/JCLI-D-11-00443.1
52
Rusch D. B. Halpern A. L. Sutton G. Heidelberg K. B. Williamson S. Yooseph S. et al . (2007). The Sorcerer II Global Ocean Sampling Expedition: Northwest Atlantic Through Eastern Tropical Pacific. PloS Biol.5, 1–34. doi: 10.1371/journal.pbio.0050077
53
Sabine C. L. Feely R. A. Gruber N. Key R. M. Lee K. Bullister J. L. et al . (2004). The Oceanic Sink for Anthropogenic CO2. Science305, 367–371. doi: 10.1126/science.1097403
54
Sibbald S. J. Archibald J. M. (2017). More Protist Genomes Needed. Nat. Ecol. Evol.1, 145. doi: 10.1038/s41559-017-0145
55
Smith S. D. (2019) Phylosmith. Available at: https://github.com/schuyler-smith/phylosmith.
56
Sturludóttir E. Desjardins C. Elvarsson B. Fulton E. A. Gorton R. Logemann K. et al . (2018). End-To-End Model of Icelandic Waters Using the Atlantis Framework: Exploring System Dynamics and Model Reliability. Fish. Res.207, 9–24. doi: 10.1016/j.fishres.2018.05.026
57
Sunagawa S. Acinas S. G. Bork P. Bowler C. Babin M. Boss E. et al . (2020). Tara Oceans: Towards Global Ocean Ecosystems Biology. Nat. Rev. Microbiol.18, 428–445. doi: 10.1038/s41579-020-0364-5
58
Sunagawa S. Coelho L. P. Chaffron S. Kultima J. R. Labadie K. Salazar G. et al . (2015). Structure and Function of the Global Ocean Microbiome. Science348 (6237), 1261359. doi: 10.1126/science.1261359
59
Team, R. C et al (2013). R: A Language and Environment for Statistical Computing. (Vienna, Austria: R Foundation for Statistical Computing). Available online at https://www.R-project.org/.
60
Valdimarsson H. Malmberg S.-A. (1999). Near-Surface Circulation in Icelandic Waters Derived From Satellite Tracked Drifters. Rit Fiskideild16, 23–40.
61
Vázquez-Rodríguez M. Touratier F. Lo Monaco C. Waugh D. W. Padin X. A. Bellerby R. G. J. et al . (2009). Anthropogenic Carbon Distributions in the Atlantic Ocean: Data-Based Estimates From the Arctic to the Antarctic. Biogeosciences6, 439–451. doi: 10.5194/bg-6-439-2009
62
Venter J. C. Remington K. Heidelberg J. F. Halpern A. L. Rusch D. Eisen J. A. et al . (2004). Environmental Genome Shotgun Sequencing of the Sargasso Sea. Science304, 66–74. doi: 10.1126/science.1093857
63
Wang L. (2018). Microbial Control of the Carbon Cycle in the Ocean. Natl. Sci. Rev.5, 287–291. doi: 10.1093/nsr/nwy023
64
Wang Q. Garrity G. M. Tiedje J. M. Cole J. R. (2007). Naïve Bayesian Classifier for Rapid Assignment of rRNA Sequences Into the New Bacterial Taxonomy. Appl. Environ. Microbiol.73, 5261–5267. doi: 10.1128/AEM.00062-07
65
Whitman W. B. Oren A. Chuvochina M. da Costa M. S. Garrity G. M. Rainey F. A. et al . (2018). Proposal of the Suffix–Ota to Denote Phyla. Addendum to ‘Proposal to Include the Rank of Phylum in the International Code of Nomenclature of Prokaryotes’. Int. J. Syst. evol. Microbiol.68, 967–969. doi: 10.1099/ijsem.0.002593
66
Wood D. E. Lu J. Langmead B. (2019). Improved Metagenomic Analysis With Kraken 2. Genome Biol.20, 257. doi: 10.1186/s13059-019-1891-0
67
Yooseph S. Sutton G. Rusch D. B. Halpern A. L. Williamson S. J. Remington K. et al . (2007). The Sorcerer II Global Ocean Sampling Expedition: Expanding the Universe of Protein Families. PloS Biol.5, 1–35. doi: 10.1371/journal.pbio.0050016
68
Zhang W. Chen J. Yang Y. Tang Y. Shang J. Shen B. (2011). A Practical Comparison of De Novo Genome Assembly Software Tools for Next-Generation Sequencing Technologies. PloS One6, 1–12. doi: 10.1371/journal.pone.0017915
69
Zinger L. Amaral-Zettler L. A. Fuhrman J. A. Horner-Devine M. C. Huse S. M. Welch D. B. M. et al . (2011). Global Patterns of Bacterial Beta-Diversity in Seafloor and Seawater Ecosystems. PloS One6, e24570. doi: 10.1371/journal.pone.0024570
Summary
Keywords
marine, microbial communities, Iceland, metagenomics, metataxonomics
Citation
Jégousse C, Vannier P, Groben R, Guðmundsson K and Marteinsson VT (2022) Marine Microbial Communities of North and South Shelves of Iceland. Front. Mar. Sci. 9:795835. doi: 10.3389/fmars.2022.795835
Received
15 October 2021
Accepted
06 June 2022
Published
20 July 2022
Volume
9 - 2022
Edited by
Tony Gutierrez, Heriot-Watt University, United Kingdom
Reviewed by
John Kenneth Pearman, Cawthron Institute, New Zealand; Sandi Orlic, Rudjer Boskovic Institute, Croatia
Updates
Copyright
© 2022 Jégousse, Vannier, Groben, Guðmundsson and Marteinsson.
This is an open-access article distributed under the terms of the Creative Commons Attribution License (CC BY). The use, distribution or reproduction in other forums is permitted, provided the original author(s) and the copyright owner(s) are credited and that the original publication in this journal is cited, in accordance with accepted academic practice. No use, distribution or reproduction is permitted which does not comply with these terms.
*Correspondence: Viggó Thor Marteinsson, viggo@matis.is
This article was submitted to Aquatic Microbiology, a section of the journal Frontiers in Marine Science
Disclaimer
All claims expressed in this article are solely those of the authors and do not necessarily represent those of their affiliated organizations, or those of the publisher, the editors and the reviewers. Any product that may be evaluated in this article or claim that may be made by its manufacturer is not guaranteed or endorsed by the publisher.