Abstract
Humpback whales (Megaptera novaeangliae) have recently been observed feeding in the New York Bight (NYB), the section of ocean from Montauk, New York to Cape May, New Jersey, United States (US). This feeding technique brings humpback whales to the surface of the water which puts them at a greater risk of vessel strike. The NYB is already an area of concern due to shipping traffic leading to the Ports of New York and New Jersey (PNYNJ). In this study, data collected by Gotham Whale from 2011 to 2019 were analyzed on humpback whales lunge feeding in the NYB apex, near the entrance to the PNYNJ. Clusters of lunge feeding were investigated, along with the water depths of lunge feeding locations. Using ArcGISPro, six significant hot spot clusters were identified, and water depth of lunge feeding locations ranged from 4.50 to 35.00 m with a mean of 14.83 m. The results of this study provide the first documentation on potential lunge feeding hot spot clusters in the NYB apex. Future studies should obtain comprehensive data looking at the amount of time humpback whales in the NYB are spending on the surface and time they are spending feeding in shipping lanes. This information will be important for the management of marine mammals in this area and may help to mitigate and reduce the incidence of boat strikes to humpback whales in this region.
Introduction
After nearly facing extinction due to commercial hunting, North Atlantic humpback whales (Megaptera novaeangliae) have experienced a remarkable recovery following their listing as “endangered” under the United States (US) Endangered Species Conservation Act of 1970, the Endangered Species Act of 1973, their protection under the Marine Mammal Protection Act of (MMPA) 1972, and a moratorium in 1985 on commercial whaling (NOAA, n.d.). North Atlantic humpback whales have distinct feeding grounds: the Gulf of Maine, West Greenland, Eastern Canada (Gulf of Saint Lawrence; Nova Scotia), and areas in the Eastern North Atlantic (Katona and Beard, 1990; Stevick et al., 2006). They can be found on these feeding grounds generally from spring through fall until they migrate to lower-latitude winter breeding grounds (Katona and Beard, 1990). Along the US mid-Atlantic states (USMA) from New Jersey to North Carolina, photo identification has matched juvenile humpback whales (alive or dead) in this region to feeding grounds in the Gulf of Maine and eastern Canada (Barco et al., 2002). Humpback whales are often documented feeding in the USMA, suggesting that this area may serve as a supplemental feeding ground for juveniles (Barco et al., 2002; Clapham et al., 2003; Aschettino et al., 2020).
In the New York Bight (NYB), an area of ocean from Montauk, New York to Cape May, New Jersey, US, about 15,000 square miles in size, and the northernmost portion of the USMA, both juvenile and adult humpback whales have been seen feeding from April through December, suggesting this area could be a supplemental feeding ground (Brown et al., 2018; King et al., 2021; Stepanuk et al., 2021). Stepanuk et al. (2021) found that juveniles in the NYB were lunge feeding at the surface in nearshore waters while adults and juveniles were cooperatively feeding in offshore habitats. Further, Brown et al. (2018) documented an increase in juvenile humpback whales in the NYB apex, at the northwest corner of the NYB, where shipping lanes converge toward the entrance to the Port of New York and New Jersey (PNYNJ) (Figure 1). In the apex, juveniles have been seen lunge feeding as close as 0.03 km from shore, with most sightings falling directly within the tracks of large commercial vessels (Brown et al., 2019). The proximity to shipping lanes is worrisome because a high number of whales have been killed by vessels (as suggested by the marks of vessel strikes in the carcasses) in the NYB (Stepanuk et al., 2021). Thus, humpback whales in the NYB could be at particular risk of vessel strikes in nearshore waters partly because of their habitat use and lunge feeding behavior at the surface (Stepanuk et al., 2021). Hill et al. (2017) found in the Gulf of Maine that vessel strikes are often underreported and that the location and seriousness of the strike to humpback whales determine the likelihood of healing. Lunge feeding exposes humpback whale bodies to the surface of the water, which allows for the potential of serious injuries if struck by a vessel.
FIGURE 1
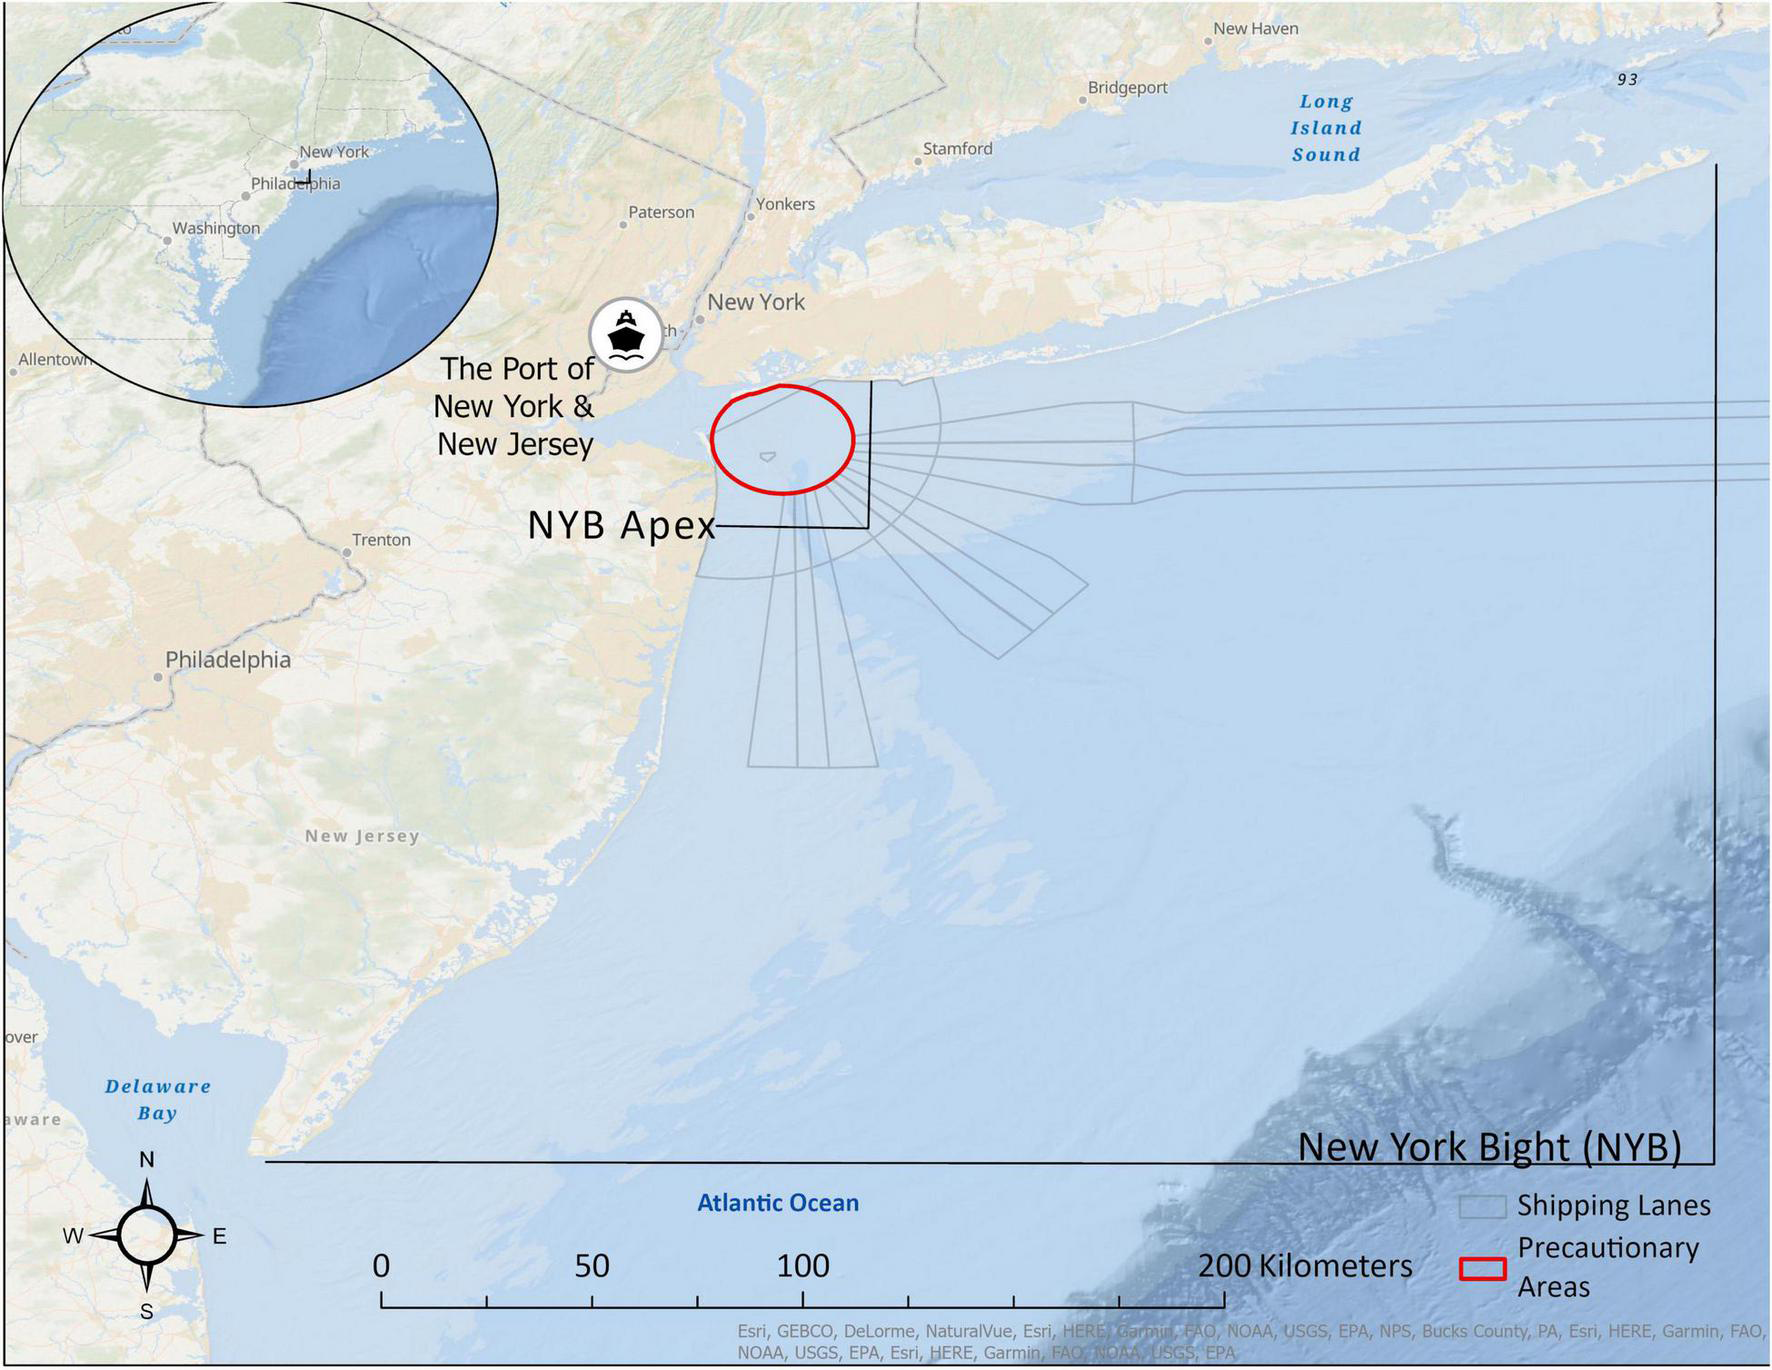
Locations of the Port of New York and New Jersey, the New York Bight, commercial shipping lanes and precautionary areas, and the New York Bight Apex. Sources: Esri, GEBCO, NOAA, National Geographic, DeLorme, HERE, Geonames.org, and other contributors (Esri, 2022a,b).
A better understanding and further refinement of the locations and depths of humpback whale feeding hotspots in NYB (greater region and apex) and their proximity to shipping lanes can inform and optimize MMPA policies for the protection and conservation of this species of whale. Therefore, it is beneficial to the management of humpback whales in the NYB apex and greater NYB to understand the factors associated with lunge feeding in this area. This study aims to provide the first analysis of the locations and water depths of lunge feeding by humpback whales in the NYB apex. The study specifically addresses where lunge feeding events are occurring, if the lunge feeding locations are occurring in significant “clusters” and at what water depths are these lunge feeding events being observed.
Materials and Methods
Data Collection
Data for this study were collected through opportunistic observations by trained staff from Gotham Whale from 2011 to 2019 aboard the American Princess, a 29 m commercial whale watching vessel. Gotham Whale is a non-profit research initiative based in Staten Island, New York that partners with local whale watching organizations to collect data on whale and dolphin behavior. The majority of whale watching trips took place in the afternoon, departure times ranging from 12:00 to 13:00 EST and duration ranging from 3.5 to 4.5 h. Whale watching took place in all weather conditions and from Beaufort sea states code 0–5. A Beaufort sea state of 0 means no wind or waves while a sea state of 5 is 17–24 knot wind speeds and 6 foot waves. The number of whale watching trips conducted increased annually from 22 to 99, in part due to an increase in whale sightings. During whale watching trips, Gotham Whale staff recorded the GPS location upon first sighting of any humpback whale, photographed the fluke and dorsal fin for identification, and documented any lunge feeding behavior based on the description in Jurasz and Jurasz (1979).
Lunge feeding is the process by which whales come from below their prey and entrap them in their mouth and filter the water out through their baleen; the baleen are ventral plates that act like a sieve keeping the food inside their mouth and removing the water (Clapham, 2000; Ware et al., 2011). Any sighting locations where at least one lunge feeding event was witnessed were used in this analysis. Continuous data tracks were recorded during each whale watching trip from 2016 to 2019. Water depth data were obtained from the United States Geological Survey (USGS) CoNED Website (U. S. Geological Survey [USGS], 2015), and the National Oceanic and Atmospheric Administration’s (NOAA) Bathymetric viewer (National Center for Environmental Information [NCEI], 2015). For distance to shore measurements, county shapefiles were obtained from Esri (Esri Inc., 2020). For shipping lanes and precautionary areas, data were obtained from NOAA National Centers for Environmental Information (NCEI), Office of Coast Survey (Office of Coast Survey [OCS], 2022). The direction of vessel traffic is defined by the commercial shipping lanes and the precautionary areas are locations where vessels should travel with caution (Figure 1).
Data Analysis
ArcGIS Pro version 2.7 was used to spatially assess the lunge feed locations (Esri Inc., 2020). Data were projected in the coordinate system for Long Island (NAD 1983 New York Long Island State Plane Projection FIPS 3104 Meters). All maps in this research were made using ArcGIS® software by Esri. ArcGIS® and ArcMap™ are the intellectual property of Esri and are used herein under license. Copyright © Esri. All rights reserved. For more information about Esri® software, please visit www.esri.com.
Two hundred and forty sightings from 2016 to 2019 were used in the hot spot analysis. The Optimized Hot Spot Analysis (Getis-Ord Gi*) tool was used (Esri Inc, n.d.; Getis and Ord, 1992). Bruce et al. (2014) used the Optimized Hot Spot Analysis when investigating the compositions of pods and the variation of ways humpback whales used Jervis Bay in Australia using data collected on a commercial whale watching vessel. The hot spot analysis has also been used for a variety of ocean conservation research (Jalali et al., 2015; Betty et al., 2020; Olson et al., 2020; Stack et al., 2020). This tool took the locations of lunge feeding and aggregated them into cells. These cells are associated with a count value that is the total number of observations within each cell. In order to account for the effort of the boat tracks, researchers took the number of feeding events divided by the kilometers that the boat covered and used the results to conduct the Optimized Hot Spot Analysis. The tool then takes each cell and groups them with the neighboring cells, which is referred to as a neighborhood. The Optimized Hot Spot (Getis Ord Gi*) tool set the neighborhood distance of this analysis for 5.60 km and the observations were grouped in 2.38 km cells. This is done based on the notion that objects closer to each other will be more related than objects further from each other. The tool then separates this neighborhood and compares it to the entire study region, looking to see if the neighborhood is statistically different from the entire study region with p-values (<0.05) and z-scores obtained from the Getis Ord Gi* statistic. To get a significant hot spot, the neighborhood must have a low p-value (p < 0.05) and a positive z-score. This signifies that the high clustering of occurrence data is above the chance occurrence and suggests a potential underlying process that resulted in this clustering. If the tool finds a low p-value and a negative z-score, this signifies that there is a significant cold spot in the study area. In other words, the observations are dispersed in a way that is not random but suggests a potential process that resulted in dispersal. Depending upon the p-value, the hot and cold spots are given a “confidence” ranking telling the researcher how confident the tool is that the locations are indeed significantly above the chance of random occurrence. The False Discovery Rate (FDR) correction is an additional measure taken by the tool to cope with multiple testing and spatial dependency (Esri Inc, n.d.). Multiple testing refers to a type of false positive, meaning a cluster could be deemed significantly hot or cold but in actuality is random (Esri Inc, n.d.). Spatial dependency is the assumption that data closest to each other are usually similar (Esri Inc, n.d.). The FDR uses the confident rankings for each significant spot to estimate the number of significant clusters that could in actuality be random; this estimate is referred to as the estimation of false positives. The FDR correction removes the weakest significant p-values using the estimation of false positives. The output presents the clusters that remain with statistically significant p-values. Whale-watching vessels usually go wherever the whales are most likely to be present, creating a bias toward these locations.
Water depth datasets came in the form of a raster, which is an image file composed of pixels. For this study, each pixel contained a water depth measurement (in meters). The accuracy of the water depth datasets ranged from 1 to 4 m. The most up to date bathymetry raster data were used in the analysis. Rasters were chosen based on their coverage. Both USGS and NOAA had raster data, but USGS had more complete and continuous water depth data as compared to the NOAA data (National Center for Environmental Information [NCEI], 2015; U. S. Geological Survey [USGS], 2015). Therefore, the USGS datasets were primarily used and NOAA datasets were only used for 50 lunge feeding locations where USGS data was unavailable. The NOAA and USGS raster files were downloaded separately and then imported into ArcGIS Pro where they were combined into a single raster file for analysis.
Whale locations were recorded upon first sighting and buffers were created that surrounded each lunge feeding location by 100 m. We chose a 100 m buffer around each whale sighting to account for their movements while feeding and for the distance that the whale watching vessel was from the whale (Brown et al., 2019). Using these buffers, the water depths were obtained from the raster file. Within the 100 m buffer there were a range of water depths and so an average was calculated for each observation. Water depth of the boat tracks was taken for 2016–2019.
Distance to shore was analyzed to enable us to compare our data with that of Stepanuk et al. (2021)’s distance to shore measurements. The distance to shore measurements were obtained using the near tool in ArcGIS Pro (Esri Inc, n.d.). This tool calculates the distance from one object to another. For this analysis the near tool calculated how far the lunge feed locations were from the shore (in meters). The results were divided by 1,000 to obtain distance to shore in km.
Results
There were 787 documented humpback whale sightings from 2011 to 2019 (Figure 2). Of these sightings, 321 were identified as occurrences of lunge feeding (Table 1). Four observations did not have complete sighting data and were therefore removed.
FIGURE 2
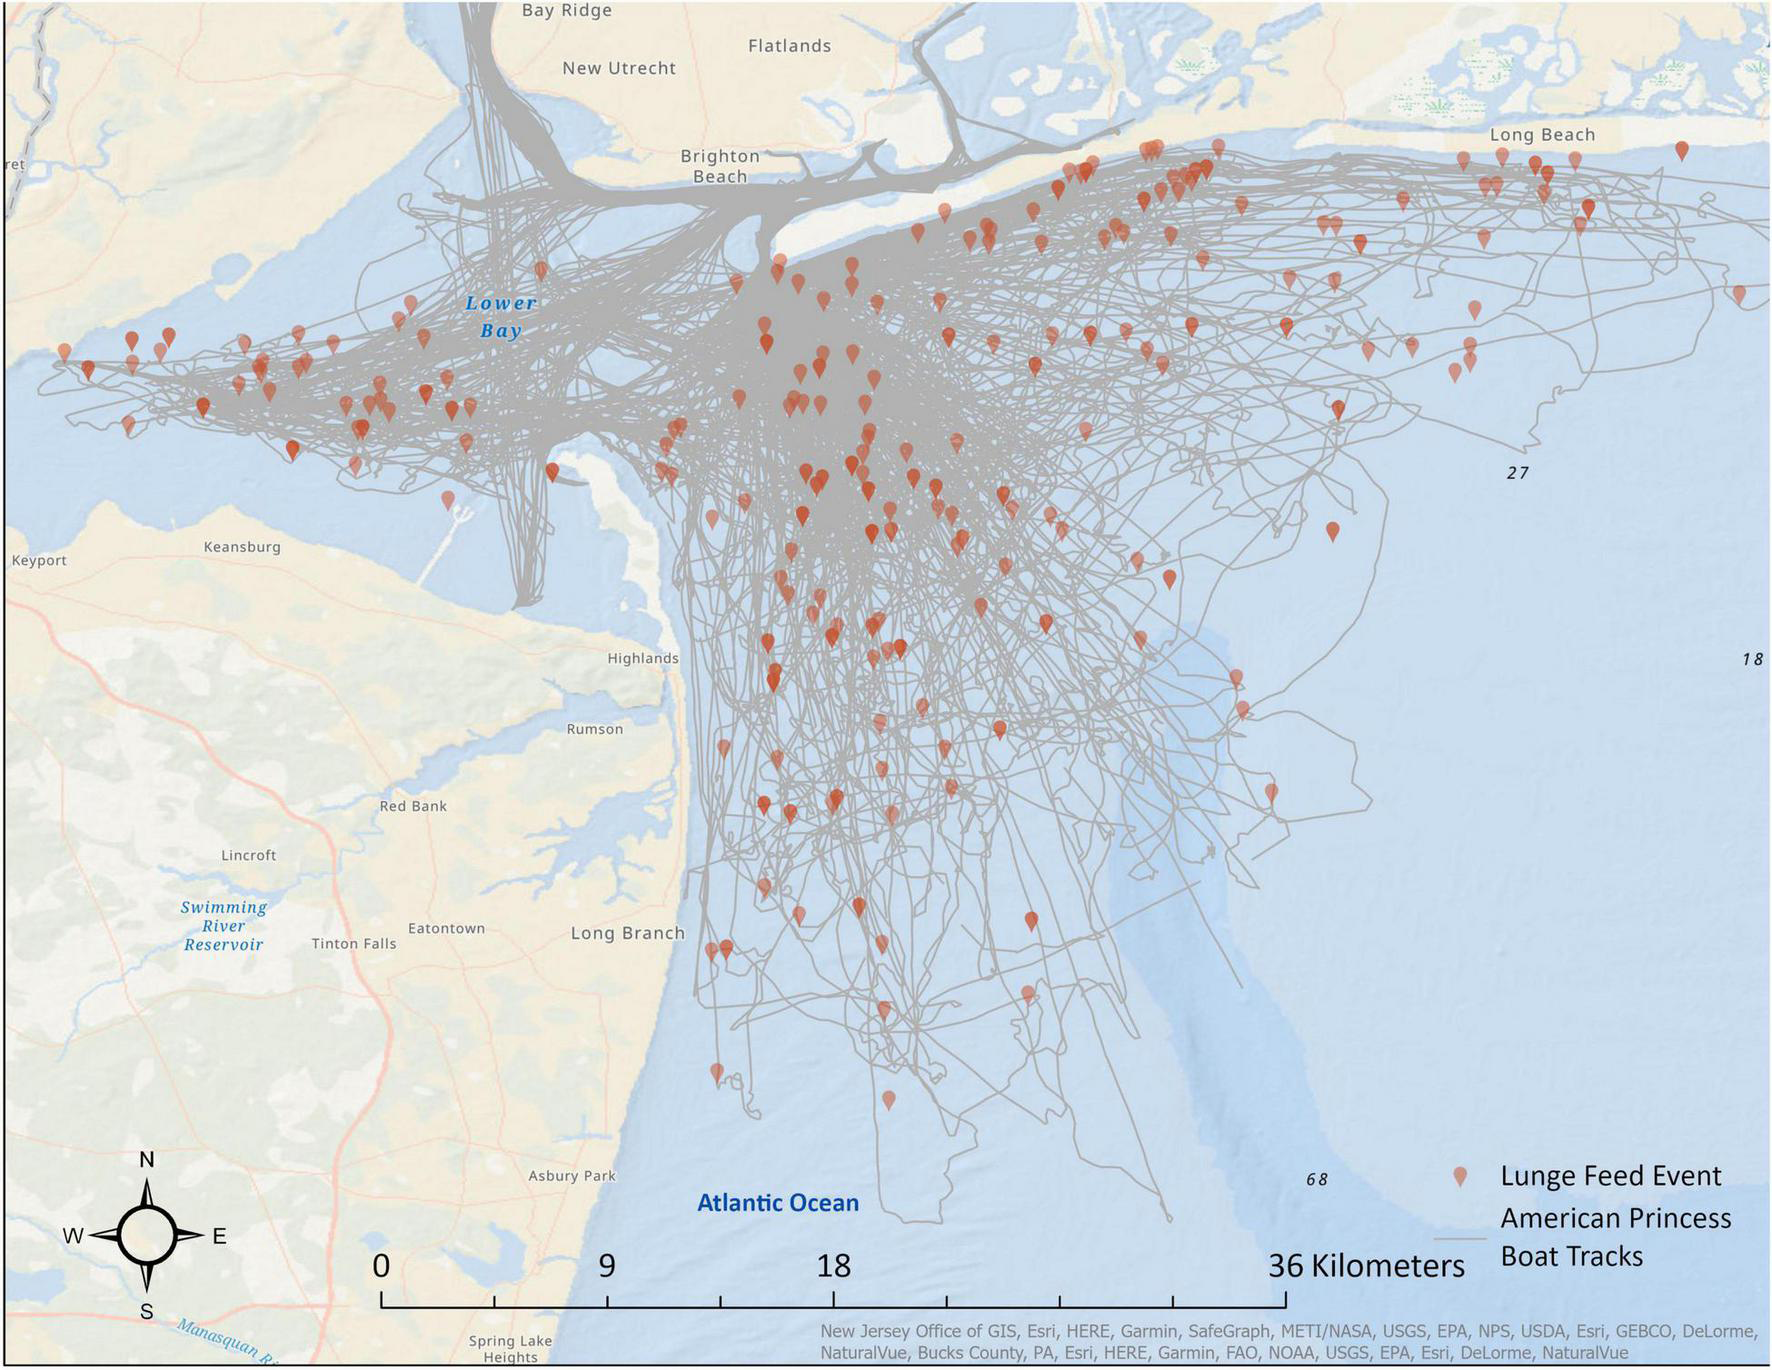
Locations of humpback whale lunge feeding in the study region (2011–2019), placed over the locations of boat tracks in the study region (2016–2019). Sources: Esri, GEBCO, NOAA, National Geographic, DeLorme, HERE, Geonames.org, and other contributors (Esri, 2022a,b).
TABLE 1
| Year | Trips taken per year | Total observations | Lunge feed sightings | Number of lunge feeding whales identified | Minimum percent of lunge feed sightings (%) |
| 2011 | 22 | 3 | 1 | 0 | 33.33 |
| 2012 | 31 | 17 | 9 | 4 | 52.94 |
| 2013 | 36 | 30 | 14 | 5 | 46.67 |
| 2014 | 54 | 74 | 36 | 14 | 48.65 |
| 2015 | 60 | 60 | 17 | 8 | 28.33 |
| 2016 | 72 | 94 | 38 | 11 | 40.43 |
| 2017 | 74 | 106 | 41 | 21 | 38.68 |
| 2018 | 86 | 157 | 61 | 19 | 38.85 |
| 2019 | 99 | 246 | 104 | 42 | 42.28 |
| Overall | 534 | 787 | 321 | 99 | 40.79 |
Breakdown of the observations by year showing the total observations, the observations marked as lunge feeding, and the minimum percentage of lunge feeding.
The percent of lunge feeding taken from the total observations are shown under minimum percent of lunge feed sightings. The overall number of lunge feeding whales identified is not a sum of all the years listed because some whales were resighted in multiple years.
Four 2.38 km cells were found to have significant clustering, and therefore considered to be hot spots (Figure 3). Of these, one cell was found to be 99% significantly above chance of random occurrence, one cells was found to be 90% significantly above chance of random occurrence, and two cells were found to be between 90 to 99% significantly above the chance of random occurrence. Four cells were found to be slightly significant. All four cells were located within the precautionary area of the commercial shipping lanes within the NYB apex. All other polygons had no significance.
FIGURE 3
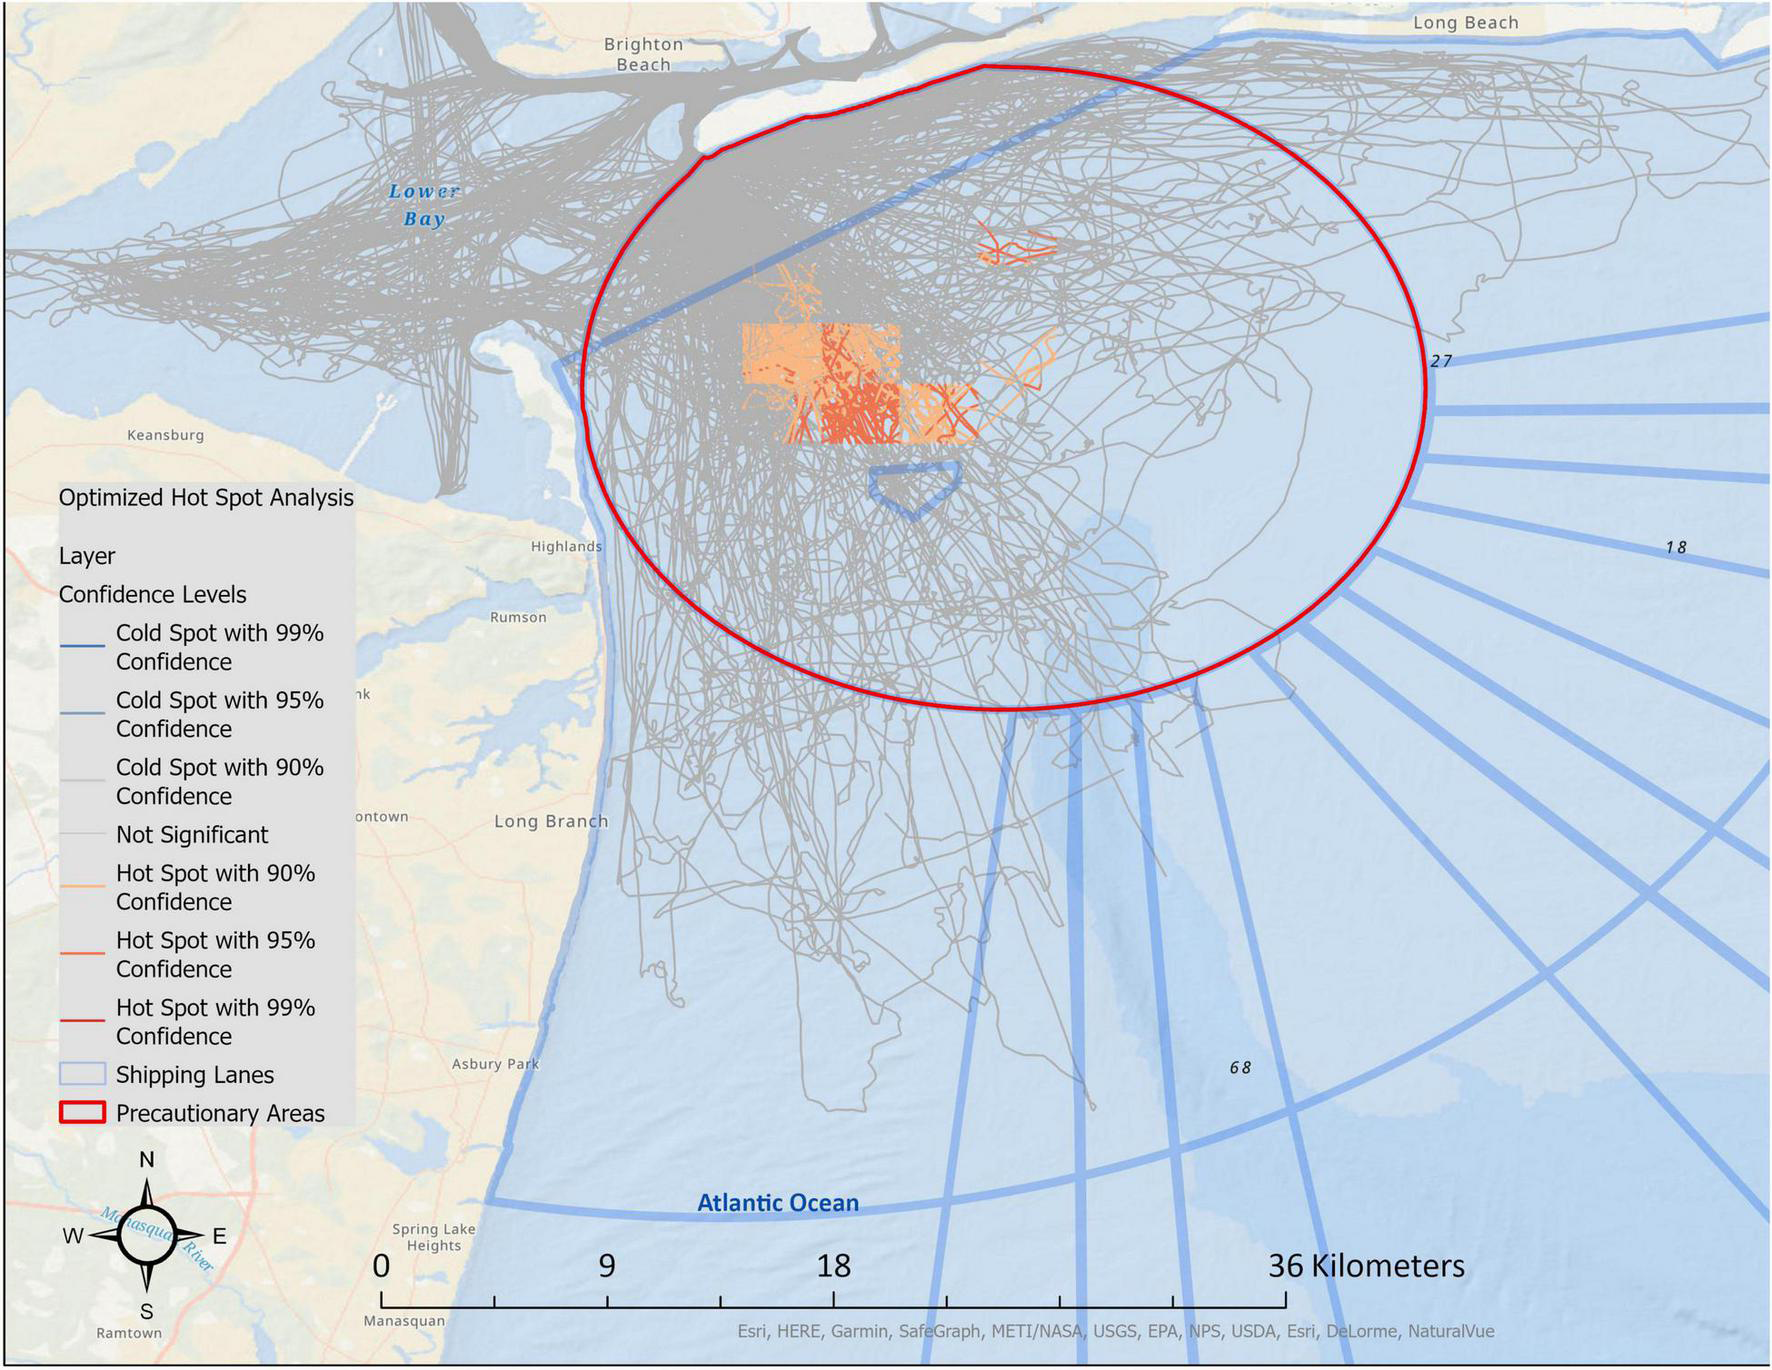
The output from the Getis-Ord Gi* analysis, run through the Optimized Hot Spot tool; with the commercial shipping lanes and precautionary area. The output shows the hot spots according to their confidence levels. Sources: Esri, GEBCO, NOAA, National Geographic, DeLorme, HERE, Geonames.org, and other contributors (Esri, 2022a,b).
A total of 313 of the 321 lunge feed events were used in the water depth and distance to shore analyses. Ninety-nine individual whales were photographically identified in those events (Table 1). Four data points were not analyzed for their water depth because raster data was not available for those locations. The total range of water depth from 2011 to 2019 was 4.50–35.00 m, with a mean of 14.83 (Table 2). A peak of the lunge feed locations was found between 9.59 and 7.89 m. A smaller peak was also seen between 16.36 and 14.67 m. Water depth from 2016 to 2019 boat tracks ranged from 4.50 to 55.46 m (Figure 4).
TABLE 2
| Year | Trips taken per year | Lunge feed sightings | Mean water depth ± SE | Range of water depth |
| 2011 | 22 | 1 | N/A | 25.00 |
| 2012 | 31 | 9 | 17.40 ± 2.31 | 6.32–25.82 |
| 2013 | 36 | 14 | 13.12 ± 2.01 | 7.00–32.35 |
| 2014 | 54 | 36 | 18.20 ± 0.87 | 9.00–28.00 |
| 2015 | 60 | 15 | 21.03 ± 2.22 | 7.72–34.56 |
| 2016 | 72 | 38 | 12.51 ± 1.04 | 4.50–31.03 |
| 2017 | 74 | 41 | 13.63 ± 0.81 | 7.66–24.00 |
| 2018 | 86 | 61 | 15.40 ± 0.83 | 5.00–35.00 |
| 2019 | 99 | 98 | 13.61 ± 0.63 | 5.00–26.95 |
| Overall | 534 | 313 | 14.80 ± 0.37 | 4.50–35.00 |
Summary of lunge feeding events recorded by year showing the observations marked as lunge feeding, mean water depth for each year, and the range of water depth in meters.
FIGURE 4
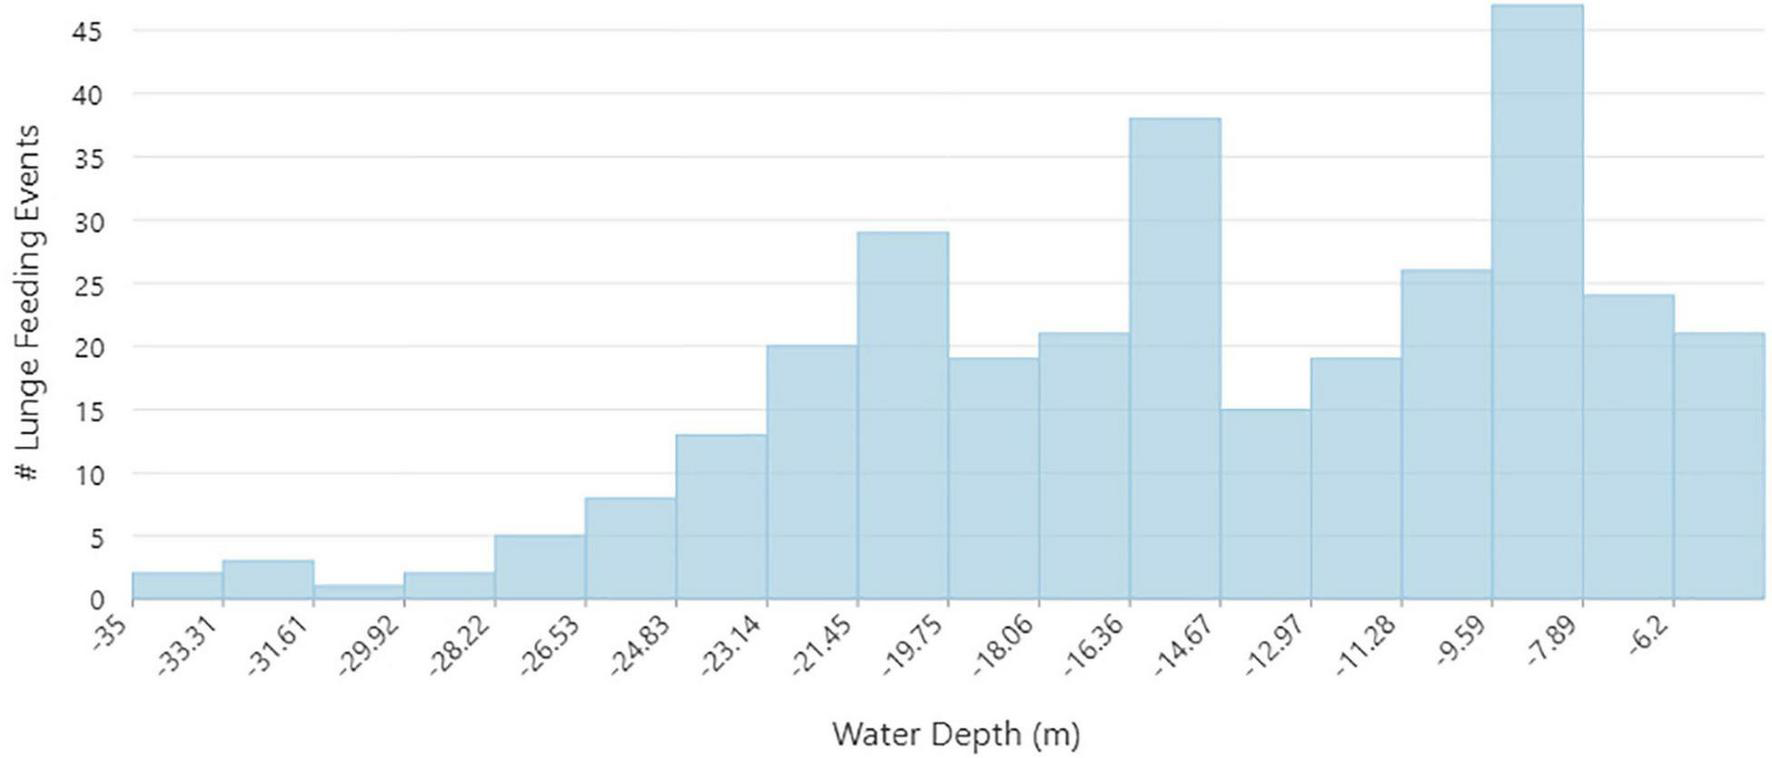
Distribution of water depths for each lunge feeding event (2011–2019).
Two hundred and eighty-three lunge feed locations (90%) were less than 10 km from shore. The minimum distance from shore was 0.32 km, while the maximum distance from shore was 26.14 km (Figure 5). The average distance from shore is 5.01 km. For the boat tracks, the average distance from shore was also 5.01 km.
FIGURE 5
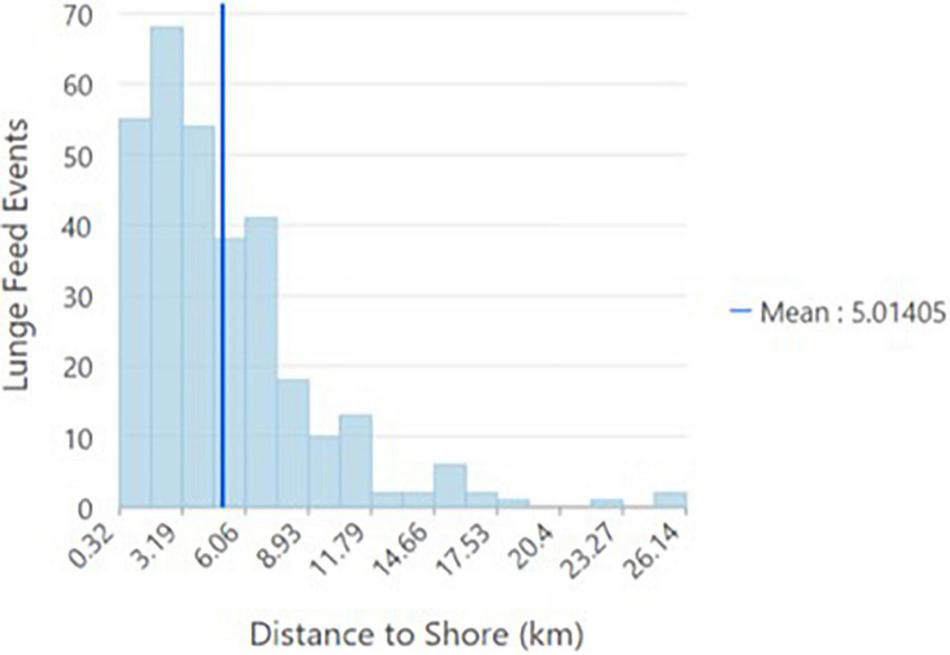
Distribution of distance to shore for each lunge feeding event (2011–2019). Since the data file included elevation and bathymetry, the outcomes were negative since they were below sea level.
Discussion
The goal of the present study was to analyze previously collected data on occurrence, locations, and water depths of humpback whale lunge feeding events in the NYB apex. Locations were plotted and then analyzed to determine whether there were any significant hot spots where lunge feeding occurred. Our findings in this preliminary study revealed hot spots that occurred within the precautionary area of the commercial shipping lanes.
Four significant clusters were found in the analysis, and all were within the areas of the dredged shipping lanes. These clusters were above the chance of random clustering, suggesting that lunge feeding is more frequent within the cells. In order to be overly cautious, no conclusions are drawn from the four locations that only had slight significance. It is possible that the shipping lanes could allow for greater depth with which to conduct the lunge feeds. It is also possible that the denser prey patches are forming in line with the deeper areas; therefore, attracting and allowing humpback whales to lunge feed in these areas. Jurasz and Jurasz (1979) first recorded lunge feeding in a southeast Alaska humpback whale population and reported this to be the most common feeding method in this group that typically occurred when food was abundant. Hain et al. (1983) further suggested that the use of different feeding strategies by humpback whales could be due to variations in densities and species of prey. Goldbogen et al. (2008) noted that the termination of lunge feeding in humpback whales seemed to be related to the quality of prey patch present. This may indicate a preferences of prey patch quality and that humpback whales may have selective control over their lunge feed behavior.
Humpback whales feed on a variety of prey species (Laerm et al., 1997), suggesting that their feeding patterns are not solely dependent on the presence of one species. However, their feeding behavior may be influenced by where the prey is located in the water column (Hazen et al., 2009). Hazen et al. (2009) found that humpback whales were surface feeding more often when prey patches were dense and took a vertical over a horizontal form. Dredged shipping lanes may allow prey patches to assemble more vertically in the water column and so this could affect the amount of lunge feeding in these areas. Differences in prey density may also explain the variation in the number of lunge feeds documented across years, although it is important to note that the number of the observations increased with the number of trips. Unfortunately, data on prey density within the NYB apex was not available for the present study. However, Alter et al. (2022) found that Atlantic menhaden (Brevoortia tyrannus) were the dominant fish species in eDNA samples collected during cetacean surveys in the NYB and humpback whales were visually documented feeding on menhaden by Brown et al. (2018) and King et al. (2021). Further research in the NYB areas should focus on the effects of vessel traffic on humpback whale foraging behavior as well as the behavior of this documented prey species, Atlantic menhaden (Brevoortia tyrannus) Brown et al. (2018).
The results of the present study indicate that humpback whales are lunge feeding in near shore areas (e.g., <10 km from shore) and in consistently shallow water depths ranging from 4 to 6 m in the NYB apex. The number of lunges per each feeding event could depend upon the water depth. Ware et al. (2011) described lunge feeding across water depths and reported that lunge feeding consisted of only one lunge per dive in water depths of less than 25 m, two lunges per dive in water depths of 25–50 m, and six or more lunges in water depths greater than 100 m. It is possible that individual humpback whales in the NYB apex may be lunging more or less often with varying water depths and that the vessel strike risk varies at the individual level.
It is possible that the number of lunge feeding events observed in this study was effected by the presence of the whale watching vessel. It was shown in Stellwagen Bank National Marine Sanctuary that the foraging behavior of humpback whales was affected by the presence of vessel noise leading to decreased ascents and descents (Blair et al., 2016). However, there have been studies with results to the contrary that suggest that feeding humpback whales are not impacted by vessel traffic (Di Clemente et al., 2018). Di Clemente et al. (2018) did not detect any short term negative behavioral changes when researching humpback whales in the presence of whale watching vessels. The study found a decrease in travel time and an increase in surface-behaviors, while feeding time was not found to decrease in relation to the presence of vessels.
Although it is unclear whether humpback whales in the NYB are affected by vessel noise, the sounds made by heavy vessel traffic can mask whale vocalizations (Hatch et al., 2012). This makes them more difficult to detect using passive acoustic monitoring (PAM) devices, which are currently being used to monitor for whales occurring near the shipping lanes in the NYB (WCS, 2021). Shallow water also decreases the detection rate of whale vocalizations (Kuperman and Lynch, 2004). Our results can be used to inform management so that vessel traffic can be more vigilant when entering hotspots, potentially minimizing ship strikes; rather than relying on acoustic monitoring or restructuring of the shipping lanes, which is unlikely. It has been suggested that speed restrictions in heavily trafficked areas may help to protect feeding humpback whales (Guzman et al., 2020). Speed restrictions do exist to protect North Atlantic right whales in the NYB apex from November-April (Silber and Bettridge, 2012), but feeding humpback whales have been documented here from April-November (Brown et al., 2018; King et al., 2021; Stepanuk et al., 2021). Therefore, we recommend that management implement speed restrictions within these high feeding locations during the months that humpback whales are most often feeding.
Due to the opportunistic nature of data collection during whale watching trips, the number of observations varied by year based on effort/the number of trips taken. Of particular note is the lack of data from 2011 during which only one lunge feed was observed. The documentation of lunge feeding data by Gotham Whale was not standardized across years. Therefore, lunge feeding locations are minimum estimates, as there is a possibility that a lunge feed did occur during an observation and was not recorded. Boat effort was accounted for within the hot spot analysis through dividing the number of lunge feeds by the km traveled by the boat and so the conclusions drawn in the discussion take the limitations of the data into account.
The results of this study provide the first documentation and evidence for potential hot spot clusters and water depths at which humpback whales are lunge feeding in the NYB apex. This research is beneficial for management in this region, considering that lunge feeding brings the whales to the surface in this highly vessel trafficked area. The increased awareness of lunge feeding hot spots can inform strategies for reducing potential vessel strikes on humpback whales. However, future studies should obtain more systematic and comprehensive data on the amount of time humpback whales spend lunge feeding, whether there are seasonal or individual differences, and how these variables relate to variations in shipping traffic and prey density. The present study is an important preliminary step toward achieving management goals.
Publisher’s Note
All claims expressed in this article are solely those of the authors and do not necessarily represent those of their affiliated organizations, or those of the publisher, the editors and the reviewers. Any product that may be evaluated in this article, or claim that may be made by its manufacturer, is not guaranteed or endorsed by the publisher.
Statements
Data availability statement
The raw data supporting the conclusions of this article will be made available by the authors, without undue reservation.
Ethics statement
Ethical review and approval was not required for the animal study because only pre-collected data was analyzed.
Author contributions
SS gathered and analyzed existing data collected by PS and DB, and other members of Gotham Whale and also the USGS at Earth Resources Observation and Science (EROS) Center and NOAA at NCEI and NOS. All authors contributed to the article and approved the submitted version.
Acknowledgments
We would like to thank Jane Denny, Bradford Butman, John Warner, and William Danforth from USGS for their guidance in selecting the raster depth datasets for this project. We are also grateful to Jim Trimble from Rutgers University for his assistance with the AIS vessel track data. We would like to thank the staff of Gotham Whale for providing the datasets and valuable insights for this project and specific thanks to the American Princess Captains and Kristi A. Collom for their help on this project. Lastly, we thank two reviewers and editor DC for their comments toward the improvement of this manuscript.
Conflict of interest
The authors declare that the research was conducted in the absence of any commercial or financial relationships that could be construed as a potential conflict of interest.
References
1
Alter S. E. King C. D. Chou E. Chin S. C. Rekdahl M. Rosenbaum H. C. (2022). Using environmental DNA to detect whales and dolphins in the New York Bight. Front. Conserv. Sci.3:820377. 10.3389/fcosc.2022.820377
2
Aschettino J. M. Engelhaupt D. T. Engelhaupt A. G. DiMatteo A. Pusser T. Richlen M. F. et al (2020). Satellite telemetry reveals spatial overlap between vessel high-traffic areas and humpback whales (Megaptera novaeangliae) near the mouth of the Chesapeake Bay.Front. Mar. Sci.7:121. 10.3389/fmars.2020.00121
3
Barco S. G. Mclellan W. A. Allen J. M. Asmutis-Silvia R. A. Meagher E. M. Pabst D. A. et al (2002). Population identity of humpback whales (Megaptera novaeangliae) in the waters of the US mid-Atlantic states.J. Cetacean Res. Manage.4135–141.
4
Betty E. L. Bollard B. Murphy S. Ogle M. Hendriks H. Orams M. B. et al (2020). Using emerging hot spot analysis of stranding records to inform conservation management of a data-poor cetacean species.Biodiver. Conserv.29643–665. 10.1007/s10531-019-01903-8
5
Blair H. B. Merchant N. D. Friedlaender A. S. Wiley D. N. Parks S. E. (2016). Evidence for ship noise impacts on humpback whale foraging behaviour.Biol. Lett.12:20160005. 10.1098/rsbl.2016.0005
6
Brown D. M. Robbins J. Sieswerda P. L. Schoelkopf R. Parsons E. C. M. (2018). Humpback whale (Megaptera novaeangliae) sightings in the New York-New Jersey Harbor Estuary.Mari. Mam. Sci.34250–257. 10.1111/mms.12450
7
Brown D. M. Sieswerda P. L. Parsons E. C. M. (2019). Potential encounters between humpback whales (Megaptera novaeangliae) and vessels in the New York Bight apex.U. S. A. Mar. Policy106:103527. 10.1016/j.marpol.2019.103527
8
Bruce E. Albright L. Sheehan S. Blewitt M. (2014). Distribution patterns of migrating humpback whales (Megaptera novaeangliae) in Jervis Bay, Australia: a spatial analysis using geographical citizen science data.Appl. Geogr.5483–95. 10.1016/j.apgeog.2014.06.014
9
Clapham P. J. (2000). “The Humpback Whale. Seasonal feeding and breeding in a baleen whale” in Cetacean Societies: field Studies of Dolphins and Whales.1 Edn. edsMannJ.ConnorR. C.TyackP. L.WhiteheadH. (United States: University of Chicago Press). 173–196.
10
Clapham P. J. Barlow J. Bessinger M. Cole T. Mattila D. K. Pace R. et al (2003). Abundance and demographic parameters of humpback whales from the Gulf of Maine, and stock definition relative to the Scotian Shelf.J. Cetacean Res. Manage.513–22.
11
Di Clemente J. Christiansen F. Pirotta E. Steckler D. Wahlberg M. Pearson H. C. (2018). Effects of whale watching on the activity budgets of humpback whales, Megaptera novaeangliae (Borowski, 1781), on a feeding ground.Aquat. Conserv. Mar. Freshwater Ecosystems28810–820. 10.1002/aqc.2909
12
Esri Inc (n.d.). How Optimized Hot Spot Analysis Works.ArcGIS Pro. Available online at: https://pro.arcgis.com/en/pro-app/latest/tool-reference/spatial-statistics/how-optimized-hot-spot-analysis-works.htm
13
Esri Inc. (2020). ArcGIS Pro (Version 2.7).United States: Esri Inc.
14
Esri (2022a). “Ocean Basemap” [basemap]. Scale Not Given. “World Ocean Base”. Available online at: https://www.arcgis.com/home/item.html?id=67ab7f7c535c4687b6518e6d2343e8a2(accessed January 31, 2022).
15
Esri (2022b). “Oceans” [basemap]. Scale Not Given. “World Oceans Reference”. Available online at: https://basemaps.arcgis.com/arcgis/rest/services/World_Basemap_v2/VectorTileServer(accessed January 31, 2022).
16
Getis A. Ord J. K. (1992). The analysis of spatial association by use of distance statistics.Geogr. Anal.24189–206. 10.1111/j.1538-4632.1992.tb00261.x
17
Goldbogen J. A. Calambokidis J. Croll D. A. Harvey J. T. Newton K. M. Oleson E. M. et al (2008). Foraging behavior of humpback whales: kinematic and respiratory patterns suggest a high cost for a lunge.J. Exp. Biol.2113712–3719. 10.1242/jeb.023366
18
Guzman H. M. Capella J. J. Valladares C. Gibbons J. Condit R. (2020). Humpback whale movements in a narrow and heavily-used shipping passage. Chile.Mar. Policy118:103990. 10.1016/j.marpol.2020.103990
19
Hain J. H. W. Gary I. Carter R. Kraus I. S. D. Mayo C. A. Winni H. E. (1983). Feeding behavior of the humpback whale, Megaptera novaeangliae, in the western North Atlantic. Deep Sea Research Part B.Oceanogr. Literat. Rev.30:467. 10.1016/0198-0254(83)90241-8
20
Hatch L. T. Clark C. W. Van Parijs S. M. Frankel A. S. Ponirakis D. W. (2012). Quantifying loss of acoustic communication space for right whales in and around a U.S. National Marine Sanctuary.Conserv. Biol.26983–994. 10.1111/j.1523-1739.2012.01908.x
21
Hazen E. L. Friedlaender A. S. Thompson M. A. Ware C. R. Weinrich M. T. Halpin P. N. et al (2009). Fine-scale prey aggregations and foraging ecology of humpback whales Megaptera novaeangliae.Mar. Ecol. Progress Ser.39575–89. 10.3354/meps08108
22
Hill A. N. Karniski C. Robbins J. Pitchford T. Todd S. Asmutis-Silvia R. (2017). Vessel collision injuries on live humpback whales, Megaptera novaeangliae, in the southern Gulf of Maine.Mar. Mam. Sci.33558–573. 10.1111/mms.12386
23
Jalali M. A. Ierodiaconou D. Gorfine H. Monk J. Rattray A. (2015). Exploring spatiotemporal trends in commercial fishing effort of an abalone fishing zone: a GIS-based hotspot model.PLoS One10:e0122995. 10.1371/journal.pone.0122995
24
Jurasz C. M. Jurasz V. P. (1979). Feeding modes of the humpback whale, Megaptera novaeangliae, in southeast Alaska.Sci. Rep. Whales Res. Instit.3169–83.
25
Katona S. K. Beard J. A. (1990). Population size, migrations and feeding aggregations of the humpback whale (Megaptera novaeangliae) in the western North Atlantic Ocean.Rep. Int. Whaling Commission12295–305.
26
King C. D. Chou E. Rekdahl M. L. Trabue S. G. Rosenbaum H. C. (2021). Baleen whale distribution, behaviour and overlap with anthropogenic activity in coastal regions of the New York Bight.Mar. Biol. Res.17380–400. 10.1080/17451000.2021.1967993
27
Kuperman W. A. Lynch J. F. (2004). Shallow-water acoustics.Phys. Today5755–61.
28
Laerm J. Wenzel F. Craddock J. E. Weinand D. Mcgurk J. Harris M. J. et al (1997). New prey species for northwestern Atlantic humpback whales.Mar. Mam. Sci.13705–711. 10.1111/j.1748-7692.1997.tb00094.x
29
National Center for Environmental Information [NCEI] (2015). Bathymetric Attributed Grid (BAG) Image Service.United States: National Center for Environmental Information.
30
NOAA (n.d.) Humpback Whale (N. d).United States: National Centers for Environmental Information (NCEI).
31
Office of Coast Survey [OCS] (2022). Shipping Fairways, Lanes, and Zones for US waters from 2010-06-15 to 2010-08-15. Available online at: https://www.fisheries.noaa.gov/inport/item/39986(accessed January 31, 2022).
32
Olson J. K. Aschoff J. Goble A. Larson S. Gaydos J. K. (2020). Maximizing surveillance through spatial characterization of marine mammal stranding hot spots.Mar. Mam. Sci.361083–1096. 10.1111/mms.12696
33
Silber G. K. Bettridge S. O. M. (2012). An assessment of the Final Rule to Implement Vessel Speed Restrictions to Reduce the Threat of Vessel Collisions with North Atlantic Right Whales.United States: U.S. Department of Commerce.
34
Stack S. H. Olson G. L. Neamtu V. Machernis A. F. Baird R. W. Currie J. J. (2020). Identifying spinner dolphin Stenella longirostris longirostris movement and behavioral patterns to inform conservation strategies in Maui Nui, Hawai‘i.Mar. Ecol. Progress Ser.644187–197. 10.3354/meps13347
35
Stepanuk J. Heywood E. Lopez J. DiGiovanni R. Jr. Thorne L. (2021). Age-specific behavior and habitat use in humpback whales: implications for vessel strike.Mar. Ecol. Progress Ser.663209–222. 10.3354/meps13638
36
Stevick P. T. Allen J. Clapham P. J. Katona S. K. Larsen F. Lien J. et al (2006). Population spatial structuring on the feeding grounds in North Atlantic humpback whales (Megaptera novaeangliae).J. Zool.270244–255. 10.1111/j.1469-7998.2006.00128.x
37
U. S. Geological Survey [USGS] (2015). USGS CoNED Viewer (Version 2.0). Available online at: https://edcintl.cr.usgs.gov/downloads/sciweb1/shared/topo/public/CoNED_New_England_New_Jersey_Delaware_y3DKdGPBfqAbnrI2CX1g.zip(accessed January 31, 2022).
38
Ware C. Friedlaender A. S. Nowacek D. P. (2011). Shallow and deep lunge feeding of humpback whales in fjords of the West Antarctic Peninsula.Mar. Mam. Sci.27587–605. 10.1111/j.1748-7692.2010.00427.x
39
WCS (2021). New York Bight Passive Acoustic Monitoring Workshop Report.New York: Wildlife Conservation Society.
Summary
Keywords
foraging, New York region, water depth, ship strikes, lunge feeding locations
Citation
Smith SE, Brown DM, Oliveras JR, Sieswerda PL, Ahearn S and Reiss D (2022) A Preliminary Study on Humpback Whales Lunge Feeding in the New York Bight, United States. Front. Mar. Sci. 9:798250. doi: 10.3389/fmars.2022.798250
Received
19 October 2021
Accepted
22 February 2022
Published
16 March 2022
Volume
9 - 2022
Edited by
Donata Melaku Canu, Istituto Nazionale di Oceanografia e di Geofisica Sperimentale, Italy
Reviewed by
Yujiang Hao, Institute of Hydrobiology (CAS), China; Ester Quintana-Rizzo, Simmons University, United States
Updates
Copyright
© 2022 Smith, Brown, Oliveras, Sieswerda, Ahearn and Reiss.
This is an open-access article distributed under the terms of the Creative Commons Attribution License (CC BY). The use, distribution or reproduction in other forums is permitted, provided the original author(s) and the copyright owner(s) are credited and that the original publication in this journal is cited, in accordance with accepted academic practice. No use, distribution or reproduction is permitted which does not comply with these terms.
*Correspondence: Diana Reiss, dreiss@hunter.cuny.edu
This article was submitted to Marine Ecosystem Ecology, a section of the journal Frontiers in Marine Science
Disclaimer
All claims expressed in this article are solely those of the authors and do not necessarily represent those of their affiliated organizations, or those of the publisher, the editors and the reviewers. Any product that may be evaluated in this article or claim that may be made by its manufacturer is not guaranteed or endorsed by the publisher.