Abstract
The giant kelp Macrocystis pyrifera is a cosmopolitan species of cold-temperate coasts. Its South-American distribution ranges from Peru to Cape Horn and Argentina, encompassing a considerable temperature gradient, from 3 to 20°C. Temperature is known to strongly affect survival, growth and reproduction of many kelp species, and ongoing global warming is already eroding their range distribution. Their response to thermal variability was shown to vary among genetically differentiated regions and populations, suggesting a possible adaptive divergence in thermal tolerance traits. This study aimed at testing the existence of local adaptation in the giant kelp, in regions separated by up to 4000km and strong thermal divergence. Two complementary experiments mimicked reciprocal transplants through a common garden approach, each habitat being represented by a given temperature corresponding to the regional average of the sampled populations. Several proxies of fitness were measured in the haploid stage of the kelp, and sympatric versus allopatric conditions (i.e. individuals at the temperature of their region of origin versus in a different temperature and versus individuals from other regions in that temperature) were compared. Additionally, a heat wave at 24°C was applied to measure the tolerance limits of these gametophytes. A significant interaction between experimental temperature and region of origin revealed that temperature tolerance varied among regions. However, depending on the fitness parameter measured, high latitude populations from the sub-Antarctic region were not always less heat resilient than populations from the warmer region of Peru. Even at 24°C, a temperature that is exceptionally reached in the southernmost part of the kelp’s natural habitat, all the gametophytes survived, although with strong differences in other traits among regions and populations within regions. This large range of temperature tolerance supports the idea of kelp gametophytes being a resistant stage. Finally, local adaptation sensu stricto was not detected. Fertility was more influenced by the geographic origin than by temperature, with possible effects of marginal conditions at the extremes of the distribution range. The latter results also suggest that stochastic dynamics such as genetic drift restricts adaptive processes in some populations of M. pyrifera.
Introduction
Kelp forests are distributed in most cold-temperate coasts. Even though they can be found in inter-tropical regions (e.g. Peru, Brazil, among others), they are restricted to specific areas where temperature do not exceed 22-24°C, such as in deep water (>60m) or upwelling centers. In approximately a third of their worldwide distribution, kelp forests are declining (Krumhansl et al., 2016). Several drivers explain this dynamic of distribution ranges, including overharvesting in some regions but the effect of warming became the major focus of attention, with an increasing number of studies focusing on the low physiological tolerance to temperature increases (Lind and Konar, 2017; Park et al., 2017; Gonzalez et al., 2018; Nepper-Davidsen et al., 2019; Borlongan et al., 2019; Hollarsmith et al., 2020, see review by Smale, 2020). Low latitude populations seem particularly affected (Wernberg et al., 2010; Filbee-Dexter et al., 2020). While most of these studies highlight the sensitivity to heat waves (Smale and Wernberg, 2013; Wernberg, 2021), differences among regions suggest some adaptive divergence in thermal tolerance across the distribution range (King et al., 2019; Liesner et al., 2020a; Liesner et al., 2020b; Diehl and Bischof, 2021). Ecological niche models predict major range shifts towards higher latitudes when including parameters of physiological responses to environmental stressors (Assis et al., 2017; Franco et al., 2018; Martinez et al., 2018). However, the capacity to evolve adaptations to changing environments is generally not considered (Valladares et al., 2014). Locally adapted populations could theoretically experience fitness reductions in a rapidly changing environment, and could decline as rapidly as maladapted populations (Cotto et al., 2017). On the other hand, locally adapted populations could also export favorable alleles to neighboring populations and thus slow down the range shift due to warming (Bush et al., 2016). It has been shown that kelp populations with reduced genetic diversity are less resilient to heat waves and may go extinct (Wernberg et al., 2018), suggesting a lack of genetic variance underlying thermal tolerance traits is actually restricting the evolution of thermal adaptations in these populations.
How thermal adaptations could evolve in kelps? On the one side, the heterogeneity of selective pressures experienced across the distribution range, due for instance to the latitudinal variability in coastal temperatures, is expected to stimulate the evolution of phenotypic traits providing increased fitness in local/regional habitats. The underlying evolutionary process and the resulting pattern correspond to local adaptation (Williams, 1966; see Box 1). Local adaptation emerges if the action of selection is stronger than other evolutionary forces. Notably, local adaptation seems more likely in large populations for which the intensity of drift is weak and does not prevent the action of selection (Eckert et al., 2008). On the contrary, by promoting an effective gene flow among populations and habitats, dispersal may limit population divergence and therefore counteract the process of local adaptation (Endler, 1973; Slatkin, 1973; Hendry et al., 2001). Migration may also generate maladaptation, because introgression of foreign alleles can be disadvantageous for locally adapted populations (Pujol and Pannell, 2008). The equilibrium between these evolutionary forces and its effect on the process of local adaptation has been widely discussed (e.g. Lenormand, 2002; Blanquart and Gandon, 2011; Blanquart et al., 2012; Blanquart and Gandon, 2014). For example, when the migration rate is very low, local genetic drift may reduce the additive genetic variance and eventually fix a reduced number of genotypes, therefore hampering local adaptation process. In this context, a moderate migration may speed up the process of adaptive divergence by allowing favorable alleles to be introduced in local populations (Blanquart and Gandon, 2011). Most kelps have limited dispersal capacities, due to the predominance of spore dispersal, suggesting therefore that population divergence may evolve under an equilibrium between selection and drift. Another layer of complexity corresponds to the heteromorphic haploid-diploid life cycle typical of kelps, which deeply influences population dynamics and evolutionary trajectories (Valero et al., 1992; Otto and Gerstein, 2008; Gerstein and Otto, 2009). The diploid individual, i.e. the sporophyte, is large and constitutes the actual kelp forests. It produces spores after meiosis, which gives rise to a microscopic filamentous haploid stage, the gametophyte. Each sporophyte is able to release tens to hundreds of thousands of spores, which represent a myriad of new genetic combinations on which selection can act in the gametophyte stage. Moreover, because of the absence of dominance effects during the haploid phase, deleterious mutations are expected to be rapidly purged, and selection for beneficial alleles is expected to be more efficient, both mechanisms theoretically favoring the process of local adaptation. However, kelp gametophytes are often depicted as a resistance stage (e.g. Ladah and Zertuche-González, 2007), suggesting they produce an all-purpose phenotype relatively insensitive to environmental variability. The question of selection efficiency in this peculiar haploid and microscopic stage is largely unaddressed in kelps.
Box 1
What is local adaptation and how should it be detected.
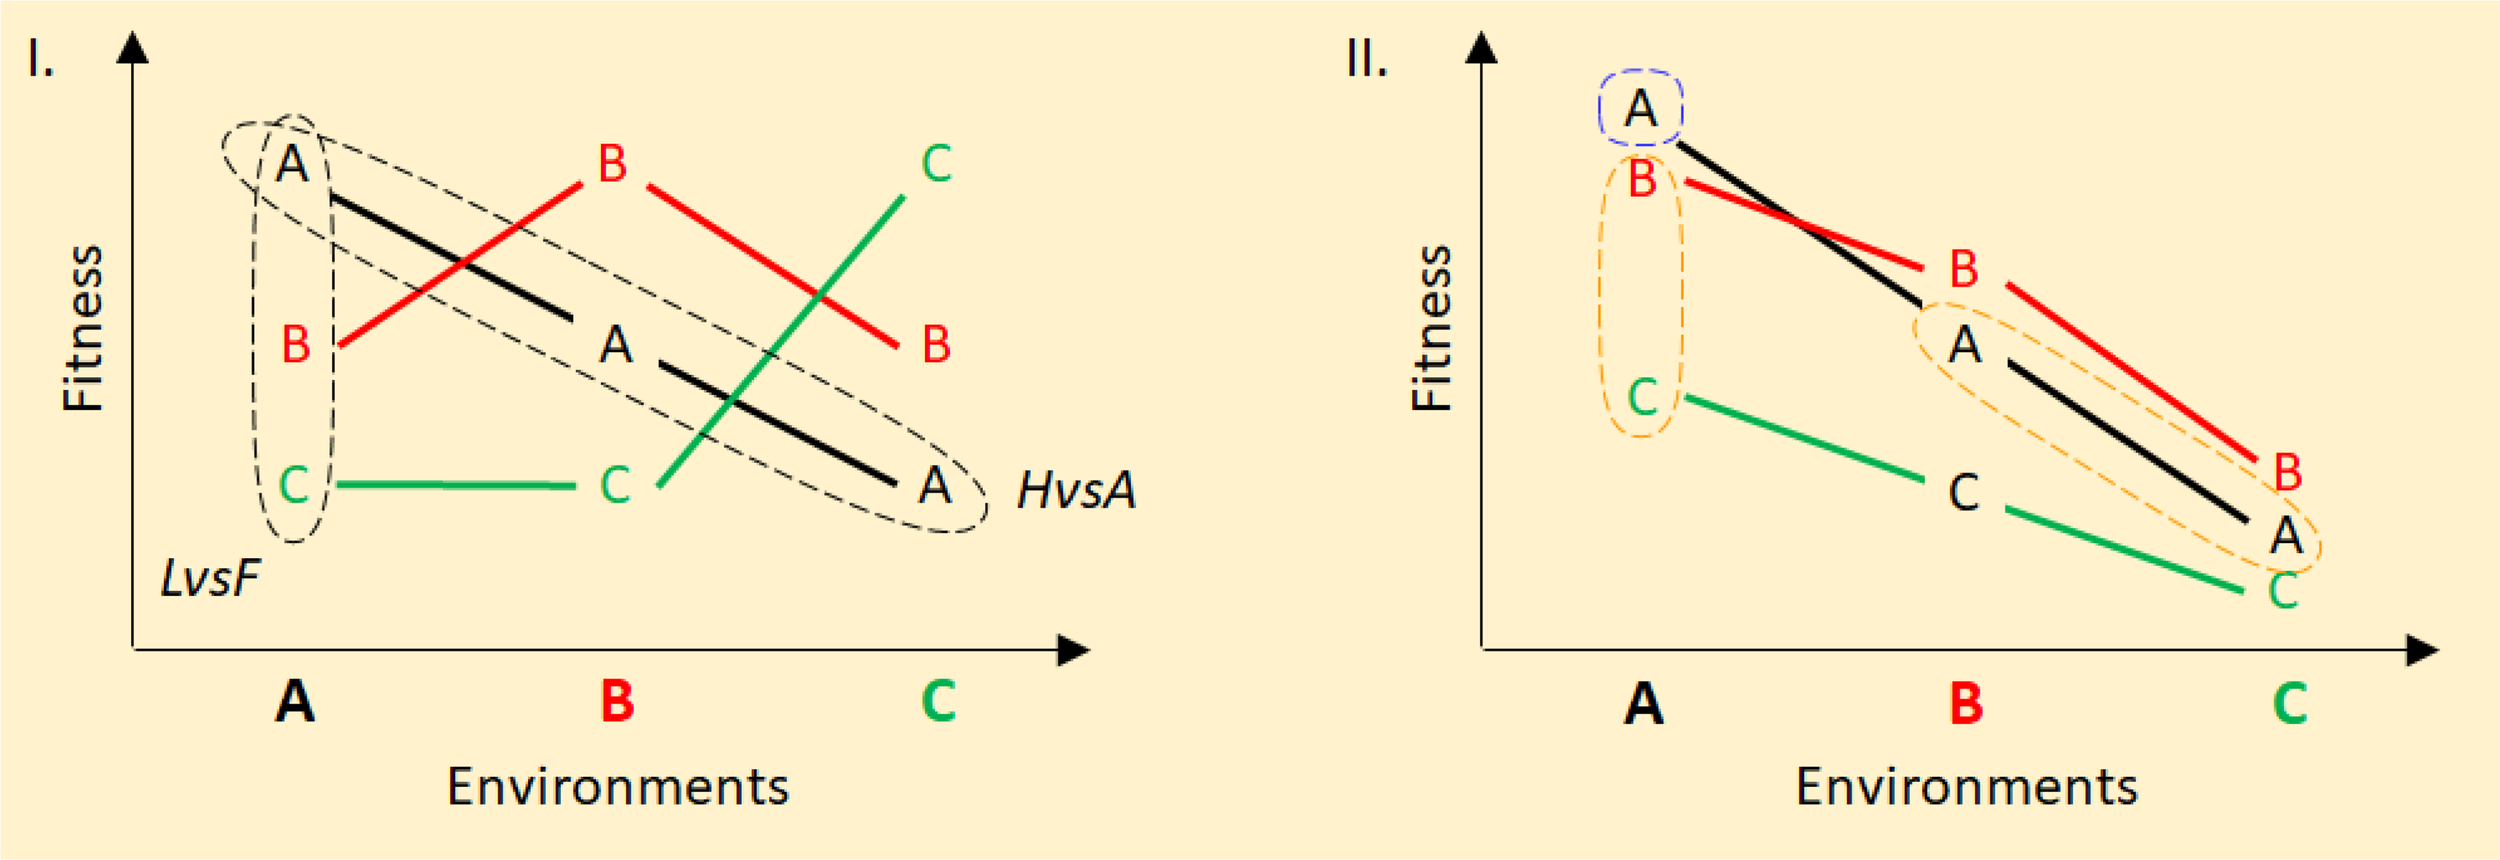
Local adaptation is an evolutionary process resulting from the balance between selection and other forces, leading to an increased average fitness of individuals in the habitat from which they originate. A spatially heterogeneous environment will therefore promote the differentiation of populations occupying different habitats, by evolving different adaptations to each local condition. Testing local adaptation commonly involves reciprocal transplant experiments, yet the statistical treatment can address different predictions from this process. The Local versus Foreign test (LvsF; Leimu and Fisher, 2008) assumes individuals born in environment A will perform better than individuals immigrating from environment B, because the latter are expected to bear adaptations to environment B that are not suitable in environment A. Figure I. below illustrates the case with 3 environments, where individuals in their local environment always perform better than other individuals in that same environment (i.e. comparisons are made “vertically”, that is among individuals from different origins for each specific environmental condition). The Home versus Away test (HvsA; Kawecki and Ebert, 2004) assumes individuals will perform better in their native environment than in any other environment, because the traits that evolved in response to selection from environment A are not suitable in other environments. In figure I., comparisons of average performance of individuals issued from the same population or region are made “horizontally”, i.e. among habitats.
When populations are highly connected by migration, the average fitness of a population may be reduced because some of the individuals born there have their parents bearing adaptations from other environments. This process leads to a homogenization of the distribution of trait diversity among populations, erasing the differences in both LvsF and HvsA comparisons. Eventually, populations with a strong immigration load, such as think populations, may become maladapted to their local environment due to an overrepresentation of individuals bearing adaptations to other environments (i.e. both LvsF and HvsA will show lower performance of locals).
LvsF and HvsA approaches can be restricted by the intrinsic quality of both the environment and the population: a poor or stressful environment may affect every individual whatever their origin; a population with high inbreeding depression or mutational load may perform poorly in any environment. In the case illustrated in Figure II, Environment A systematically outperforms environment C, and individuals C bear the lowest fitness whatever the environment. Individuals A are locally adapted according to LvsF and HvsA, while C individuals are maladapted. However, B individuals are locally adapted according to LvsF but not HvsA as we can see their performance is highest in environment A, as it is for any individual. This complex pattern arises because individual performance is the result of both environmental and population quality, and the efficiency of selection in driving adaptations. More broadly, under the LvsF contrast, it is difficult to distinguish the effects of adaptive divergence and the quality of focal populations on the average performance of individuals. Similarly, the HvsA test confounds the effects of local adaptation and environmental quality. To disentangle these multiple factors, we consider an array of populations (i.e. a metapopulation) distributed in different environments (following Blanquart et al., 2013). It becomes possible to compare different populations from each environment, in order to assess the effects of environment and population qualities, using a classical two-ways ANOVA. When the interaction is statistically significant, local adaptation can be assessed by comparing Sympatric combinations (i.e. the average performance of populations of a same native environment in that environmental condition) with all Allopatric combinations (i.e. including the Foreign and Away definitions). Blanquart et al. (2013) showed that this approach is a general framework that allows testing for local adaptation sensu stricto in a metapopulation model of adaptive divergence. Moreover, it increases the statistical power for detecting local adaptation because it integrates LvsF and HvsA approaches after removing the effects of environment and population variability. In Figure II., average fitness of populations A in environment A (blue dotted circle) represents the sympatric condition, while both the fitness of other populations in environment A and of populations A in other environments (orange dotted ellipses) represent the allopatric condition.
We aimed to explore this question with the giant kelp Macrocystis pyrifera as a biological model. The giant kelp is the largest brown algae that grows up to 50m long and forms marine forests (Steneck et al., 2002) that host a considerable biodiversity (Graham et al., 2007). This kelp has a wide distribution: present in both hemispheres, it ranges from Alaska to Mexico, from Peru to Argentina and the Falkland Islands. It is also found in isolated regions such as South Africa, south Australia and New Zealand and in most of the Sub-Antarctic islands (Graham et al., 2007). Along the coast of Chile and Peru, its large distribution encompasses the 3 recognized biogeographic discontinuities (Camus, 2001): the Peruvian province north of 30°S (mean temperatures around 18°C, with low seasonality but large inter-annual variability); the Magellan province south of 42°S (mean temperatures around 8°C, with high seasonality but only marginal inter-annual variability); the Intermediate Region along Central Chile (where both seasonality and inter-annual variability are modest, and a mean temperature around 12°C). This distribution therefore encompasses a significant environmental heterogeneity (Figure 1). Yet, it is not homogeneously occupied. For instance, populations from northern Chile and Peru are sparse and isolated (Vásquez et al., 2010), and correspond to the northern edge for the South American distribution. In contrast, the species is conspicuous between 30°S and the sub-Antarctic region of South America, although a patchy distribution is observed in some fjords and sounds of Patagonia and the Magellan region (personal observations). It was hypothesized that such a wide distribution is the result of both the global ecological success of M. pyrifera due to its large physiological and morphological variability (Graham et al., 2007) and its ability to disperse over large distances through rafting of fertile individuals (Macaya et al., 2005, Rothaüsler et al., 2011, Thiel and Haye, 2006; Tala et al., 2016). Yet, the origin of its phenotypic variability, i.e plasticity or local adaptation, has never been clearly evaluated. Some discontinuities in the spatial genetic structure are matched by phenotypic divergence among populations when sharp environmental discontinuities are observed, suggesting the existence of environmental restrictions to effective dispersal at scales<30km (Camus et al., 2018). Previous studies further support this hypothesis by showing that spatial genetic diversity is strongly structured by habitat discontinuities (i.e. islands, long sandy beaches; Alberto et al., 2010) and environmental gradients (i.e. sea surface temperature, light extinction with depth; Alberto et al., 2011; Johansson et al., 2015). These small-scale, environmentally driven population differentiation at both the genetic and the phenotypic diversities strongly suggest adaptive divergence occurs along the distribution range of the species.
Figure 1
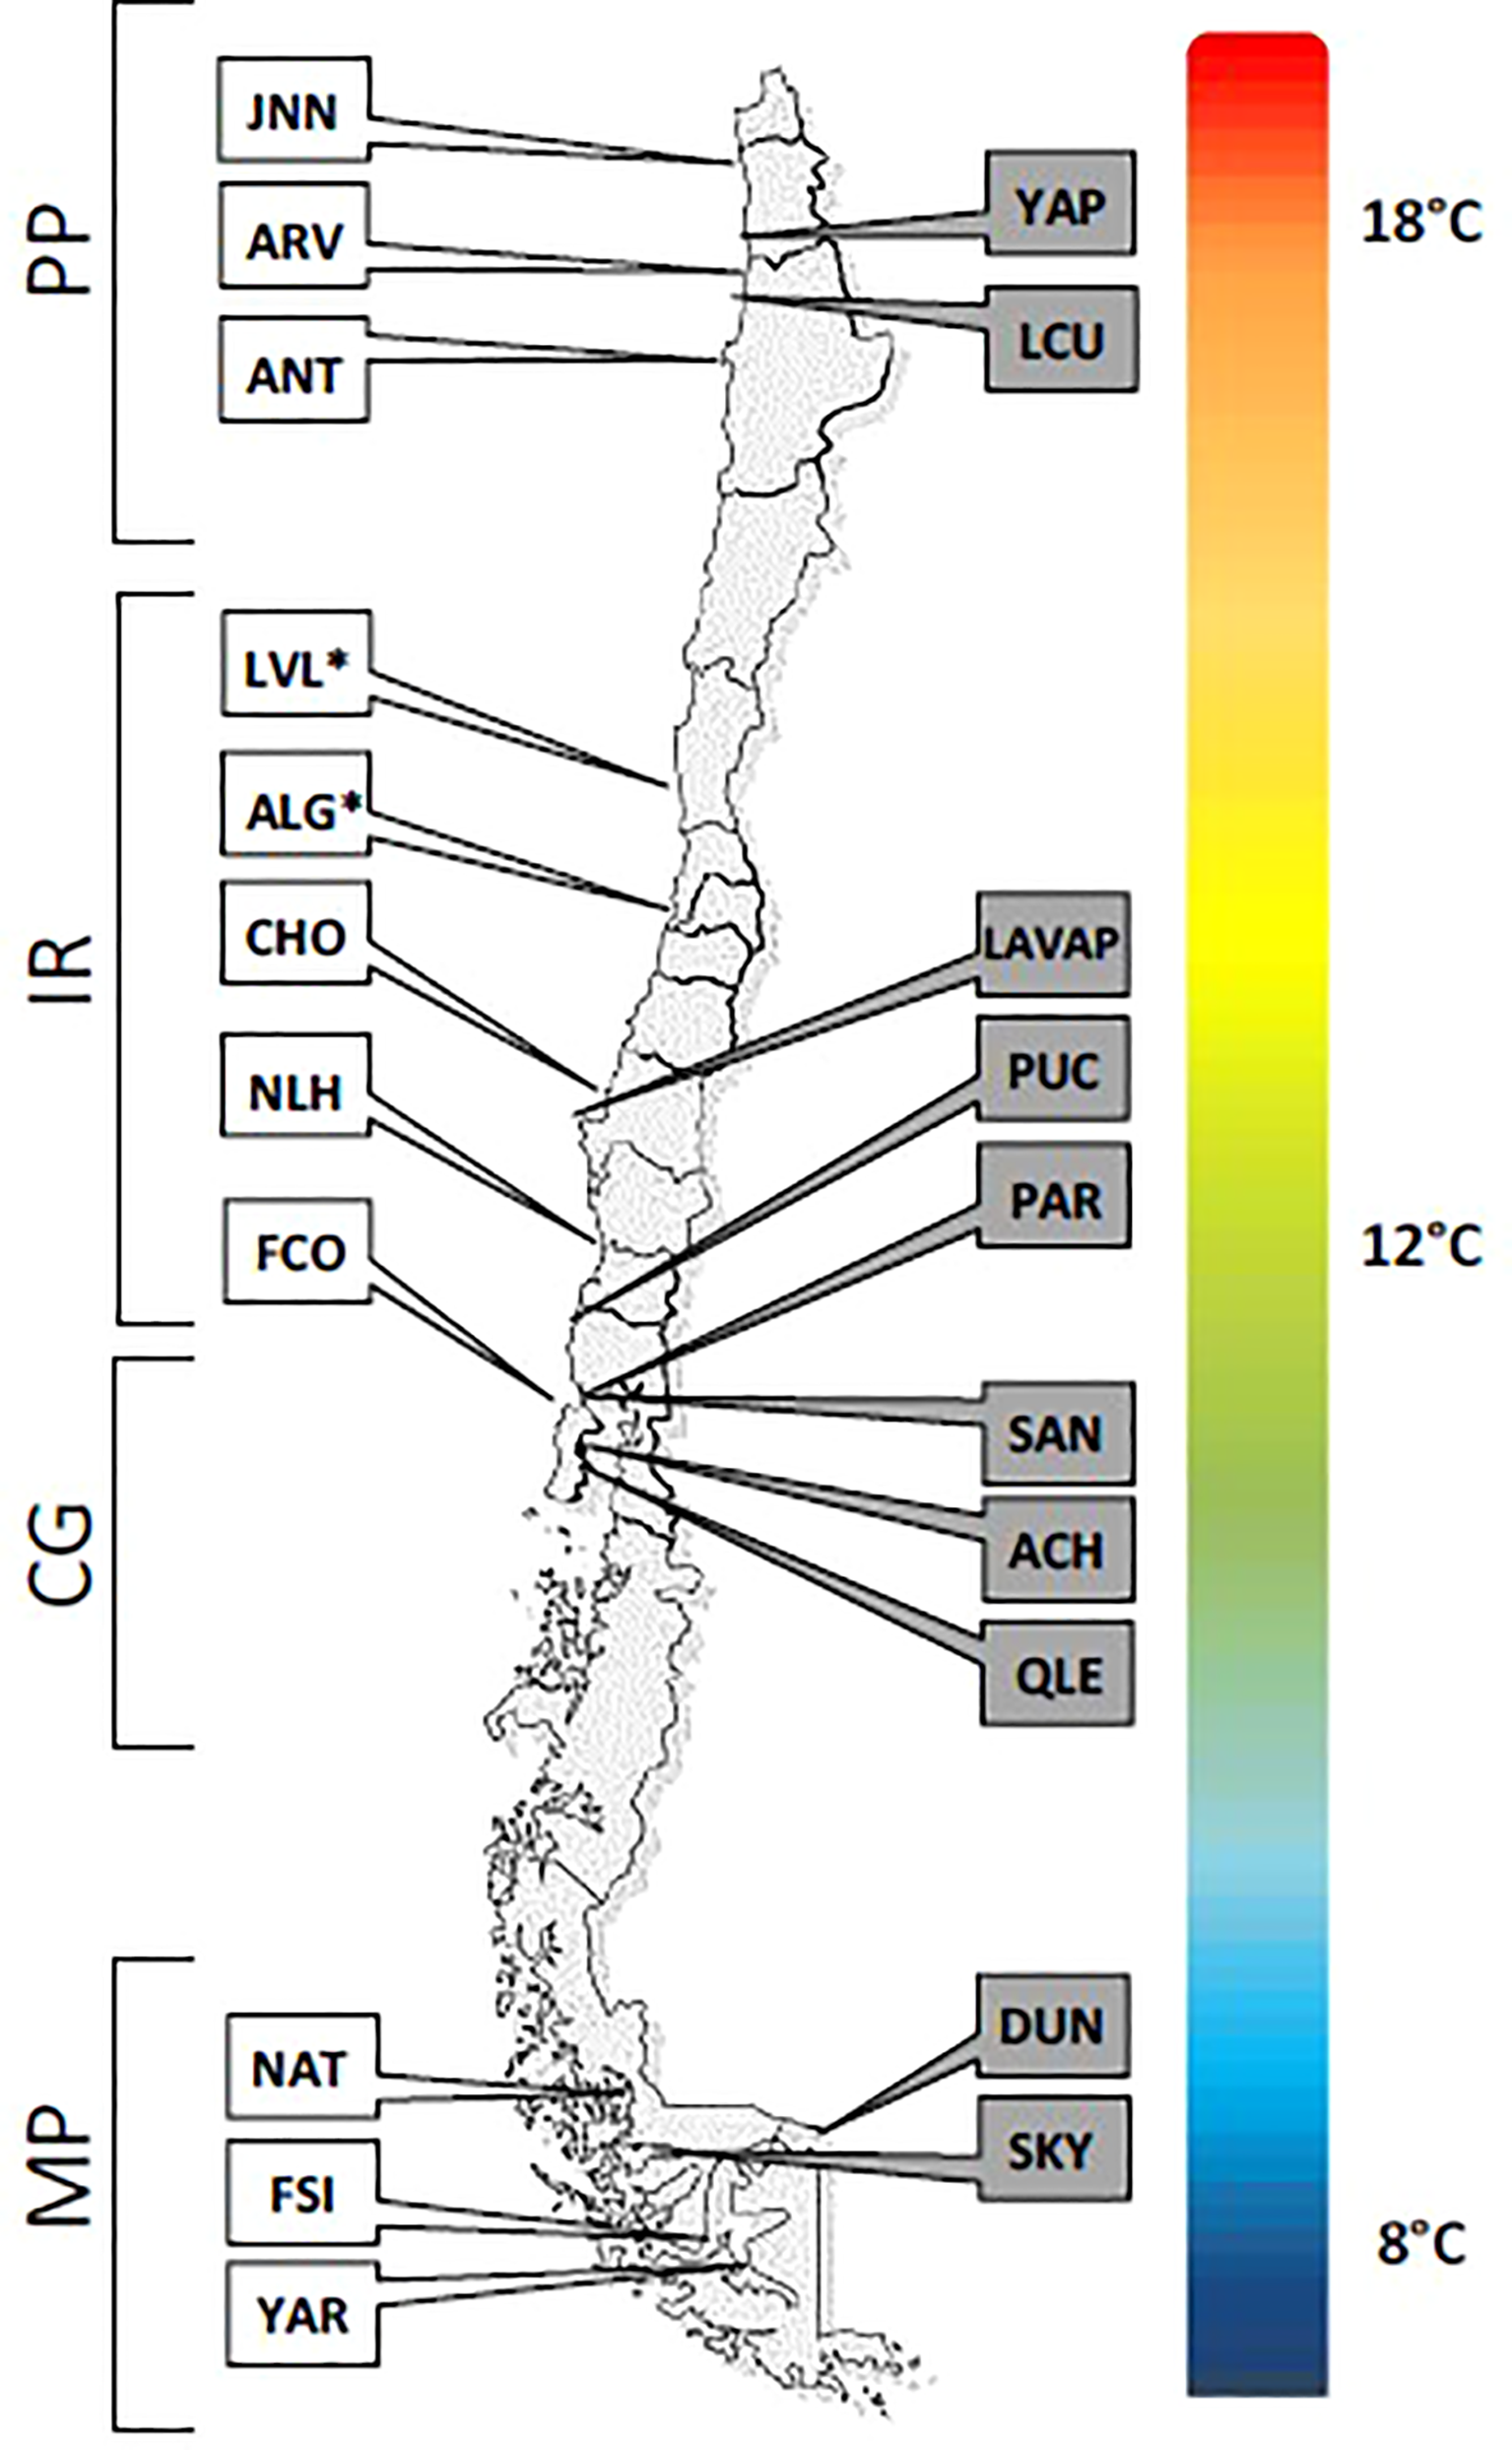
Distribution of the sampling locations within the three biogeographic regions. All sites (except LVL* and ALG*) were included in experiment 1. Experiment 2 included all populations indicated on the left of the map. The colored gradation indicates the latitudinal gradient of coastal temperatures. MP, Magellan Province (average temperature of 8°C); CG, Corcovado Gulf (average temperature of 12°C); IR, Intermediate Region (average temperature of 12°C) and PP, Peruvian Province (average temperature of 18°C).
With its wide geographic range and the extent of ecological variability met by its populations, Macrocystis pyrifera appears to be an ideal candidate species to tackle several questions around local adaptation. Does the large and environmentally heterogeneous distribution range promote local adaptation? Are low latitude populations located at the edge of the South American distribution range experiencing maladaptation due to extreme thermal conditions? At what spatial scale do populations diverge in their response to environmental heterogeneity? These questions are relevant to understand how the giant kelp copes with such environmental variability along its wide distribution. In this context, we aimed at examining the regional variance of thermal tolerance of the giant kelp and testing for local adaptation through two experiments. While they differed in their choice of experimental units, both were based on a common-garden approach simulating reciprocal transplantations of individuals among habitats, and were performed under laboratory-controlled conditions. Experiment 1 aimed at maximizing the number of populations sampled per region, following Blanquart et al. (2013), to maximize the statistical power of the sympatric-allopatric comparison of the local adaptation test (see Box 1). In order to better assess the variation among populations within regions, experiment 2 was performed with fewer populations but a higher number of individuals per population.
Material and Methods
Sampling and Isolation of Gametophytes
Twenty-one sampling sites were selected among the three biogeographic provinces of the Chilean coast (Figure 1). For each sampling site, a 200m-transect parallel to the coast (whenever possible) was made. Every 50 meters, one healthy and reproductive blade was collected from two different sporophytes. Such strategy allowed the collection of gametophyte progeny from 10 sporophytes per site. Reproductive blades were washed with fresh water and a 2-4cm2 piece of fertile tissue was placed for 2h in 50mL-tubes filled with sterile seawater for spore release. Tissue was then removed from the tube and spores were allowed to settle on glass slides. The spores developed into the gametophytic phase as they were kept in standardized culture conditions of 12/12 day/night, approximately 10 photons.m-2.s-1. of red light to avoid gamete production. Each gametophyte progeny was stored at 12°C. Individual gametophytes were isolated after their differentiation into males and females and grown individually under vegetative growth conditions (red light) with weekly change of sterile SFC-enriched seawater (Correa et al., 1988). This collection of gametophytes represents the basal material used for the two independent experiments.
Experimental Designs
The two common garden experiments consisted in submitting gametophytes of different origins to different temperatures (e.g. 8°C, 12°C and 18°C for Magellan Province, MP, Intermediate Region, IR, and Peruvian Province, PP, respectively), each corresponding to the average of each of the 3 sampled regions. In addition, a heat wave was simulated by submitting the gametophytes of Experiment 2 (see below) to 24°C. Such a temperature is largely above the usual coastal temperatures in all the distribution range, but can occasionally be reached in the PP during austral summers. This treatment aimed at evaluating the limit of thermal tolerance of gametophytes. We expected that the northernmost populations would show a better tolerance to this unusually high temperature than populations of IR and MP, which are never exposed to this environmental condition. Before starting the experiments, gametophytes were acclimated at white light for 5 days to activate growth and fertility. Each gametophyte was fragmented in order to obtain hundreds of clones of similar size (Figure 2). These clones were then distributed among the different aliquots, each of which including at least 50 clonal fragments, and cultivated for 14 days at the experimental temperatures. Each of these aliquots were considered as experimental units. The change of temperature from the standard culture condition (i.e. at 12°C) to the experimental temperature was performed smoothly by ramping up or down by 2°C every day until reaching the target experimental temperature (Figure 2). Besides temperature, all treatments were kept at identical culture conditions: light intensity was 25-27 photons. m-2.s-1, a photoperiod of 12:12 h (light:dark), and SFC-enriched sterile seawater.
Figure 2
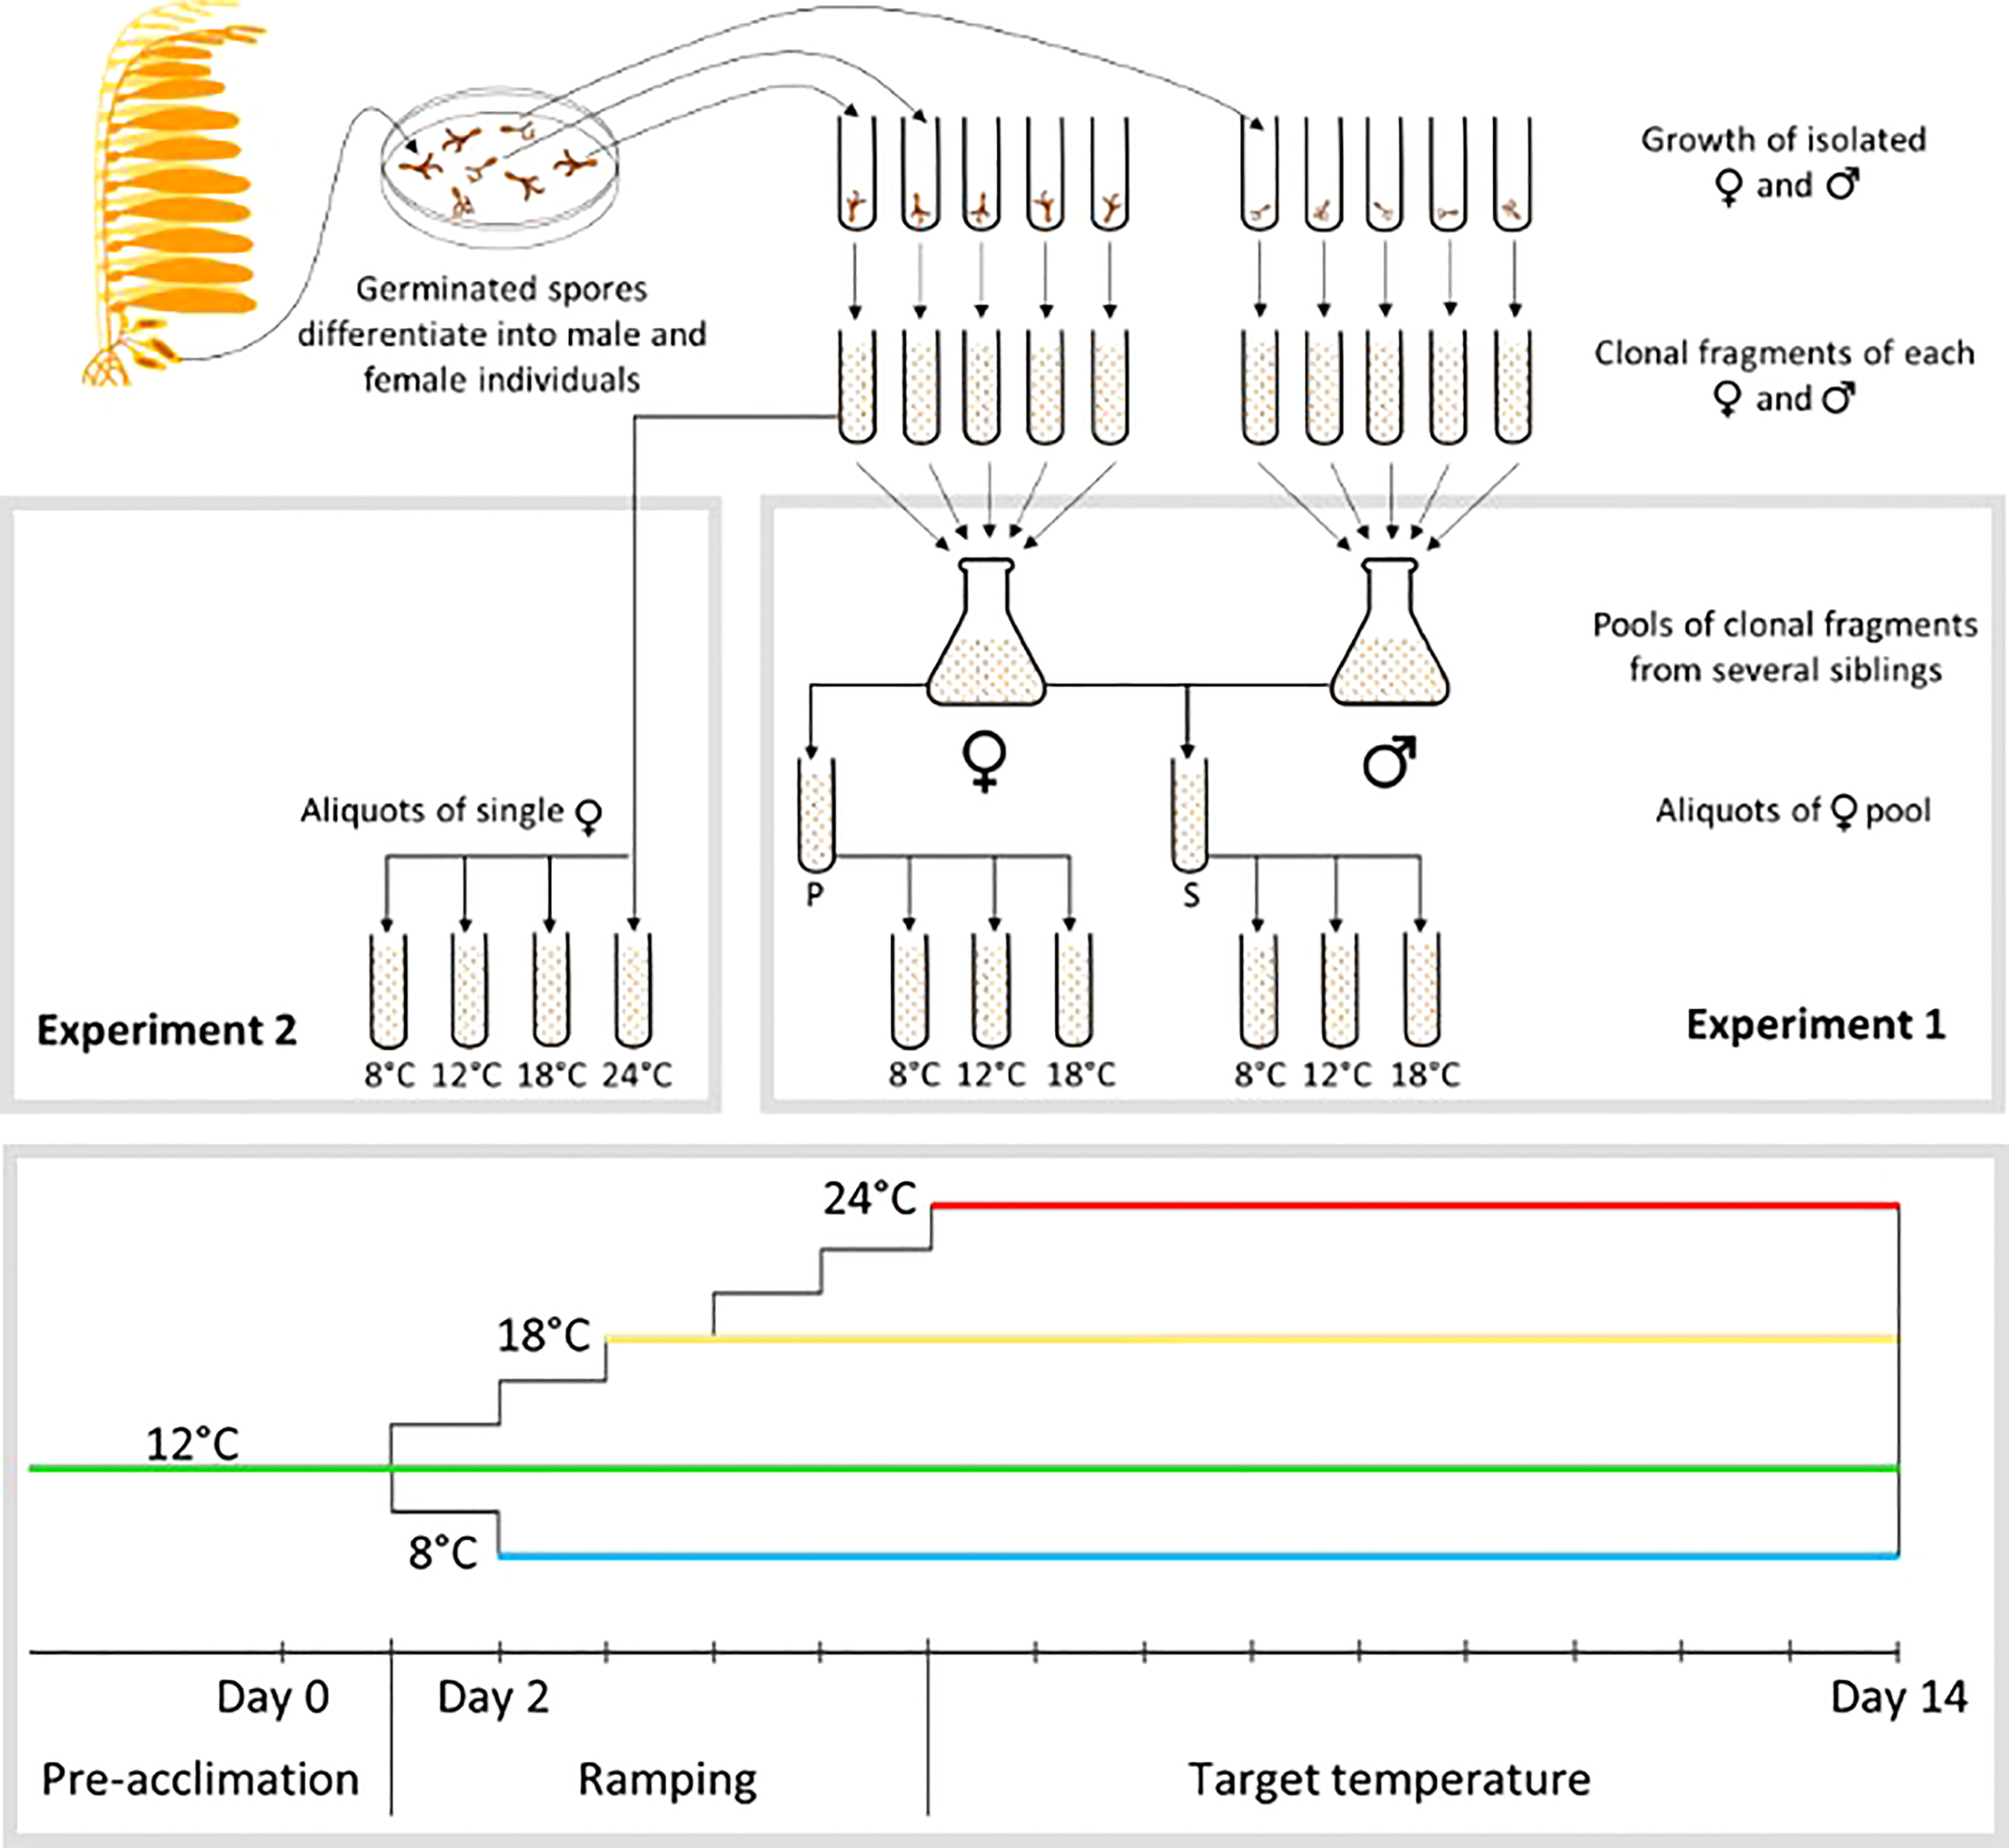
Upper part: Experimental design for the isolation and manipulation of gametophytes. Initially, spores were collected from sporophylls (i.e. specialized blades located at the base of the sporophyte) and cultivated until male and female could be recognized. Individual gametophytes were then isolated and cultivated separately, and then fragmented into fragments of 5-15 cells. In Experiment 1, pools of clonal fragments from 5 sister females were split in 2 aliquots, one left without males to induce parthenogenesis (P), the other mixed with a pool of 5 males issued from the same parental sporophyte to induce self-fertilization (S). Each of these pools were then split in 3 aliquots, each aliquot being submitted to a different temperature. In Experiment 2, clonal fragments of single females were separated in 4 aliquots, each aliquot then submitted to a different temperature. Lower part: work flow for temperature changes between pre-acclimation conditions to target temperature.
Experiment 1 used 3 to 6 populations per region, and considered the Intermediate Region as 2 different units: the Corcovado Gulf and the open coast (19 populations in total, see Figure 1 for details). These 2 sub-regions experience the same average temperature but the populations of M. pyrifera are strongly differentiated both genetically and phenotypically (Camus et al., 2018). Due to logistical limitations, the design of experiment 1 was at the expense of the number of sporophytes per population (1 to 3; Table S1). For each sporophyte progeny, 5 female and 5 male gametophytes were selected, fragmented and pooled by sex (Figure 2). Males were merely used as gamete donors to assess female fecundity, defined as the proportion of egg cells successfully fertilized at day 14. The female pools were subdivided in two replicates. One was kept without males to measure survival and physiological vigor. The other was mixed with their respective male sibs’ pool to induce self-fertilization and measure fertility and fecundity. The density of fragments per pool of females alone was defined so that the bottom of the well (1cm diameter) was uniformly covered. In the mixed pools, 5 fragments per individual gametophyte (either male or female) were selected to build the pool, so that the reproductive investment and success could be standardized. Each of these pools was done in triplicate, i.e. cloned replicates of the same isolated gametophytes, and placed at the different temperatures (Figure 2). The survival rate was quantified as the ratio of the number of living female gametophytes at day 14 to their initial number by direct counting under a stereoscopic microscope. Fertility was estimated as the proportion of living clonal fragments bearing reproductive structures at day 6, and fecundity was defined as the proportion of egg cells successfully fertilized at day 14. Proxies of physiological vigor were estimated through the parameter of photosynthetic efficiency (Fv/Fm) at days 2 and 14, using a pulsed amplitude-modulated fluorometer (Diving PAM, Hansatech; following Krause and Weis, 1984; Juneau and Popovic, 1999).
Experiment 2 used up to 8 sporophytes per population (Table S1) and 3 to 5 populations per region (see Figure 1 for further details). This experiment was performed on five sister females per sporophyte. Each of these five female gametophytes were cloned separately to obtain hundreds of fragments (Figure 2), then acclimated under white light and to the temperature of the region of origin. At least 50 clones per female gametophytes were exposed to the different experimental temperatures, i.e. at 8, 12, 18 and 24°C (Figure 2). Growth multiplication factor was estimated using a subsample of 100μL of a homogenized suspension of female’s fragments stained with 50 μL of neutral red solution (concentration of 0.01 g/L). This colorant stains living cells, which can be distinguished from dead cells. Four pictures per sample (in different areas of the well) were taken under microscope at 20x magnification, to obtain an average count at days 2 and 14. A batch-script (Java v 1.8) was run under the software ImageJ (http://imagej.net), to count living and dead cells. Growth multiplication factor (GMF) was estimated as the ratio of living cells at day 14 over day 2. The proxy of physiological vigor was chlorophyll production (following Krause and Weis, 1984). Briefly, chlorophyll a concentration was measured with an AquaFluor (Turner Designs), and normalized with the estimate of living females to produce an estimation of the quantity of Chlorophyll a per living cell. The relative chlorophyll a production was estimated as the ratio between day 14 and day 2. Fertility was estimated from these same images by detecting eggs in females based on a circularity parameter: circ = 4π · Surface/Perimeter². circ ranges from 0 to 1 (i.e. perfect circle), and a threshold-value of 0.8 considered the cell circular enough to be an egg (as opposed to the rod-shaped vegetative cells of the gametophyte).
Data Analysis
Our approach was based on the Sympatric versus Allopatric (SvsA) test recommended by Blanquart et al. (2013). This test aims at analyzing the variance of fitness among habitats and populations of origin, as well as their interaction (see Box 1). By considering the temperature homogeneous at the scale of the region, habitats were thus summarized by the average regional temperature (fixed in laboratory, and noted TEXP hereafter). Experiments performed here slightly differed from a strict transplant design (Tables S2 A, B), as the region was considered as the evolutionary unit (i.e. the habitat was considered homogeneous within region) while populations were replicated samples within regions. This implied that local adaptation was tested through the interaction between the regional temperature and region of origin, and required to introduce the populations as a random factor nested within regions. For both experiment, the linear mixed model on fitness proxies (W) was thus defined as follow:
W ~ TEXP + Region + Population[Region] + (TEXP x Region) + (TEXP x Population[Region])The importance of the random effects of populations was estimated using a likelihood-ratio test. To this aim, a submodel including only fixed effects was designed (W ~ TEXP + Region + (TEXP x Region)). The log-likelihood of each model was estimated, and the significance of the ratio [logL(submodel)]/[logL(full model)] was tested against a χ²-distribution. Tukey’s HSD post hoc tests were then performed, to detail the effect of fixed factors (i.e. region and TEXP). When the interaction (TEXP x Region) was significant, the SvsA comparison, which is embedded in the interaction, was tested in a second phase. Its F-ratio was calculated over the interaction (TEXP x Region), and its significance was assessed against the F-distribution (F, df1 = 1; df2 = df interaction). The obtained p< 0.05 indicates whether or not sympatric region-temperature combinations perform better than allopatric ones (Box 1), which case was considered as evidence of local adaptation sensu stricto (Blanquart et al., 2013).
A second test of local adaptation was performed, according to the definition “Local versus Foreign” (Kawecki and Ebert, 2004). The pairwise comparison of the fitness of local versus foreign gametophytes was estimated at a given experimental temperature, through the assessment of the effect size Hedge’s d, calculated as:
where and are the mean fitness of respectively local and foreign gametophytes under the considered experimental condition, and α is a corrective term for biases due to sampling size (nL and nF for local and foreign populations or regions respectively). Here, we used α =1 because our interest was in the sign (i.e. negative or positive) of Hedge’s g-values. The pooled standard deviation s* is estimated by:
With sL2 and sF2 the sample variance of fitness for respectively local of foreign groups. This method was detailed in the meta-analysis of Leimu and Fischer (2008). All other things being equal (i.e without deme and/or habitat quality effects) positive values of g* indicate a fitness advantage of local over foreign individuals. On the opposite, negative values could indicate maladaptation. However, according to Leimu and Fischer (2008), a mixed result of positive and negative g-values leads to the rejection of the hypothesis of local adaptation or maladaptation.
The response of fitness proxies to the simulated heat wave (TEXP = 24°C, experiment 2) was analyzed through an ANOVA performed on the following linear mixed model:
W = Region + Population[Region]
The same likelihood-ratio approach was then used to assess the effect of populations as a random factor nested in regions. These analyses were performed using the functions lm and lmer (package lme4) in R 3.4.4. Survival rates (experiment 1) were previously transformed to sin-1(√x), to fit normality expectations.
Results
Experiment 1
For all fitness proxies surveyed in this experiment (i.e. survival, fertility, fecundity and photosynthetic efficiency), either the effect of the experimental temperature (TEXP) and/or region of origin were strongly significant (p< 0.01; Table 1). Survival rates ranged between 61 and 100% at 8°C and 12°C (Figure 3), but dropped between 6 and 62% at 18°C, indicating a strong negative impact of the northern temperature on survival. Fecundity appeared largely higher at the intermediate temperature (i.e 12°C; fecundity > 20%; Figure 3) than at 8 and 18°C (i.e. between 0 and 11%), except for females from the Magellan Province which maintained a fecundity close to 0. Photosynthetic efficiency varied slightly, and higher values were reached at 8°C (Figure 3). The effect of the region of origin appeared strongly significant for each of the four proxies (p< 0.01; Table 1). This was mainly explained by the gametophytes from Corcovado Gulf, which showed lower survival rates but higher fertility than any other region (Table S4). Fertility of gametophytes from Peruvian Province was close to 0 whatever the experimental temperature, while fecundity was among the highest at 12 and 18°C. Pairwise comparisons among treatments are provided in Table S4 (Tukey’s HSD tests).
Table 1
| Survival | Fertility | Fecundity | Photosynthetic efficiency | |||||||||||||
|---|---|---|---|---|---|---|---|---|---|---|---|---|---|---|---|---|
| Model | W ~ TEXP + Region + (TEXP x Region) | |||||||||||||||
| L-ratio | 1,783 | p = 0.182 | -1,14E-13 | p = 1 | 0,644 | p = 0.422 | 8,68 | p = 0.003 | ||||||||
| ANOVA on submodel | Df | Sum. Sq | Mean. Sq | F (p-value) | Df | Sum. Sq | Mean. Sq | F (p-value) | Df | Sum. Sq | Mean. Sq | F (p-value) | Df | Sum. Sq | Mean. Sq | F (p-value) |
| TEXP | 2 | 6,411 | 3,205 | 19.333 (<0.001) | 2 | 0,059 | 0,03 | 2.203 (0.11) | 2 | 0,392 | 0,196 | 10.039 (0.001) | 2 | 0,036 | 0,018 | 7.73 (<0.001) |
| Region | 3 | 3,389 | 1.130 | 6.814 (<0.001) | 3 | 0,331 | 0,11 | 8.193 (<0.001) | 3 | 0,213 | 0,071 | 3.648 (0.01) | 3 | 0,043 | 0,014 | 6.109 (<0.001) |
| TEXP x Region | 6 | 0,637 | 0,106 | 0.640 (0.70) | 6 | 0,11 | 0,018 | 1.366 (0.24) | 6 | 0,186 | 0,031 | 1.589 (0.15) | 6 | 0,008 | 0,001 | 0.596 (0.73) |
| Residuals | 100 | 16,58 | 0,166 | 0.000 | 91 | 1,227 | 0,013 | 106 | 2,068 | 0,02 | 108 | 0,254 | 0,002 | |||
Best fit model of the analysis of the variance observed in fitness proxies in the experiment 1, according to the methodology recommended by Blanquart et al. (2013).
Figure 3
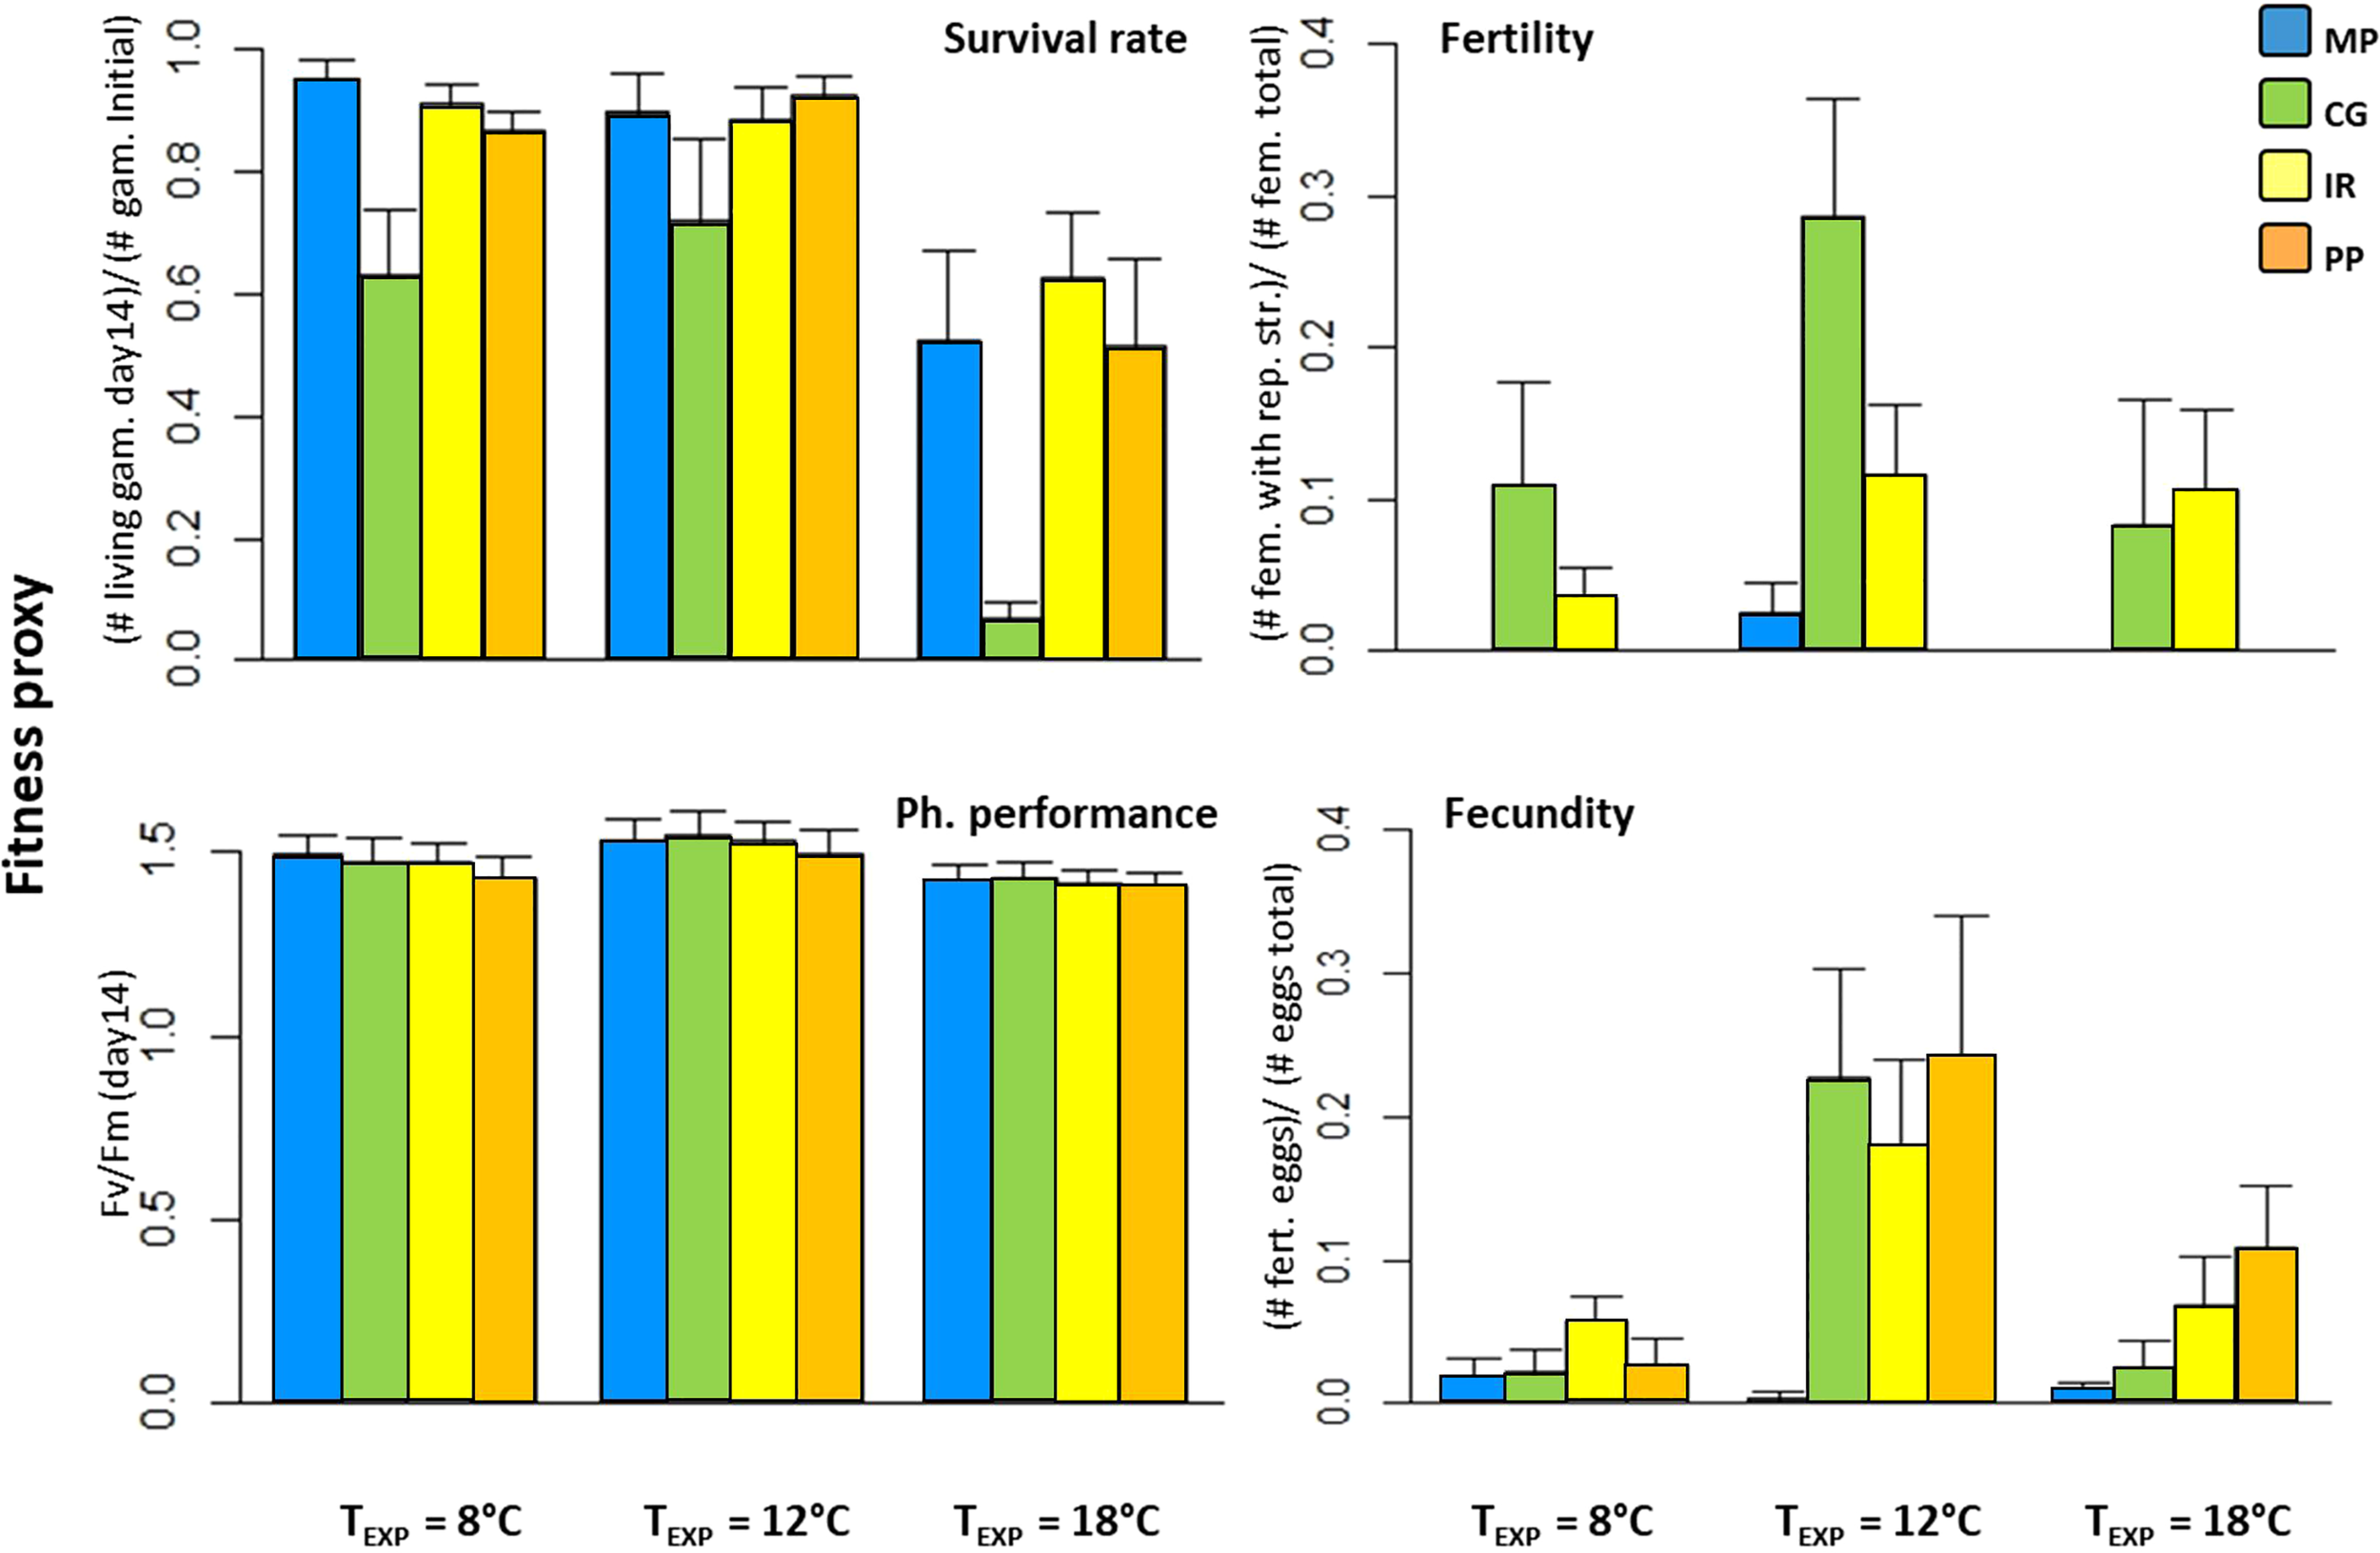
Mean fitness of gametophytes from the four regions included in experiment 1, after 14 days under experimental conditions. Related results of ANOVA and Tukey’s HSD tests were consigned in Table 1 and Table S4, respectively. For the definitions of PP, IR, CG and MP, see Figure 1. The survival rate was quantified as the ratio of the number of living gametophytes at the day 14 to the initial number of gametophytes. Fertility was estimated as the ratio of living females bearing reproductive structures at day 6 to the total number of females. Fecundity was defined as the ratio of egg cells successfully fertilized at day 14 to the total number of eggs. Proxies of physiological vigor were estimated through the parameter Fv/Fm at day 14. Note: no interaction TEXP x Region was significant.
The factor “population of origin”, nested within regions, did not significantly contribute to the total variance of the proxies, except for the photosynthetic efficiency – the less variable proxy we used (L-ratio = 8.68, p = 0.003; Table 1, and Table S3 for details about mixed linear models). For the three other proxies, the full models failed to reach convergence (see REML criterion of convergence, Table 1) - likely because of too low sampling size within population relative to the high variance of these proxies in our experimental data. The interaction between experimental temperature and region of origin was significant for none of the four proxies, suggesting no evidence of local adaptation.
The distributions of Hedge’s d at the regional scale did not reveal clear patterns (Figure S1), as the results varied depending on the considered fitness proxy. All g* values for the survival rate and photosynthetic activity of MP versus others regions were positive. Yet, fertility and fecundity responded in the opposite way, i.e. all g*-values were negative. The test performed for the others regions produced both positive and negative g* values, and therefore did not support the hypothesis of local adaptation.
Experiment 2
In this experiment, the number of parental sporophytes per population was sufficient for the likelihood approach to converge, and a significant effect of populations-within-region was detected for growth and fertility, but not for physiological vigor (i.e. chlorophyll production rate; Table 2; Table S5 for details about mixed models). The effects of TEXP and region of origin were significant for some fitness proxies (physiological vigor and fertility respectively; p< 0.01; Table 2) but neither was significant for growth multiplication factor. The highest physiological vigor was reached at TEXP = 18°C, while the highest fertility was observed in gametophytes from the Intermediate Region (Figure 4; Table S6). Interestingly, the Growth multiplication factors were largely homogeneous among treatments, as neither the TEXP, nor the Region and nor their interaction were significant. An uneven distribution of fitness proxies among populations was observed (Figure 4), some of them being substantially “fitter” than others, notably populations FCO and NLH for Intermediate Region and ARV and ANT for Peruvian Province, which outperformed the others at all experimental temperatures. The interaction [TEXP x Region] was significant for the physiological vigor. Yet, neither the SA contrast (F(1; 4) = 0.69; p = 0.45), nor the examination of the Tukey’s test (Table S6) revealed local adaptation sensu stricto. Finally, the distribution of Hedge’s d was in line with the former results (Figure S2), as they were uniformly distributed on both sides of y = 0 (Figure S2).
Table 2
| Growth | Fertility | Physiological Vigor | ||||||||||
|---|---|---|---|---|---|---|---|---|---|---|---|---|
| Model | W ~ TEXP + Region + (TEXP x Region) | |||||||||||
| L-ratio | 11,79 | p< 0.001 | 7,95E+00 | p = 0.005 | -1,71 | p = 1 | ||||||
| ANOVA on submodel | Df | Sum. Sq | Mean. Sq | F (p-value) | Df | Sum. Sq | Mean. Sq | F (p-value) | Df | Sum. Sq | Mean. Sq | F (p-value) |
| TEXP | 2 | 11,91 | 5,955 | 2.057 (0.131) | 2 | 9,4E-09 | 4,7E-09 | 2.203 (0.113) | 2 | 4,043 | 2,022 | 4.836 (0.009) |
| Region | 2 | 10,07 | 5,037 | 1.740 (0.179) | 2 | 2,0E-08 | 1,0E-08 | 4.760 (0.010) | 2 | 1,44 | 0,72 | 1.723 (0.182) |
| TEXP x Region | 4 | 21,39 | 5,348 | 1.847 (0.122) | 4 | 5,7E-09 | 1,4E-09 | 0.663 (0.618) | 4 | 6,111 | 1,528 | 3.655 (0.006) |
| Residuals | 177 | 512,35 | 2,895 | 179 | 3,8E-07 | 2,1E-09 | 179 | 74,819 | 0,418 | |||
Best fit model of analysis of the variance observed in fitness proxies in the experiment 2, according to the methodology recommended by Blanquart et al. (2013).
Figure 4
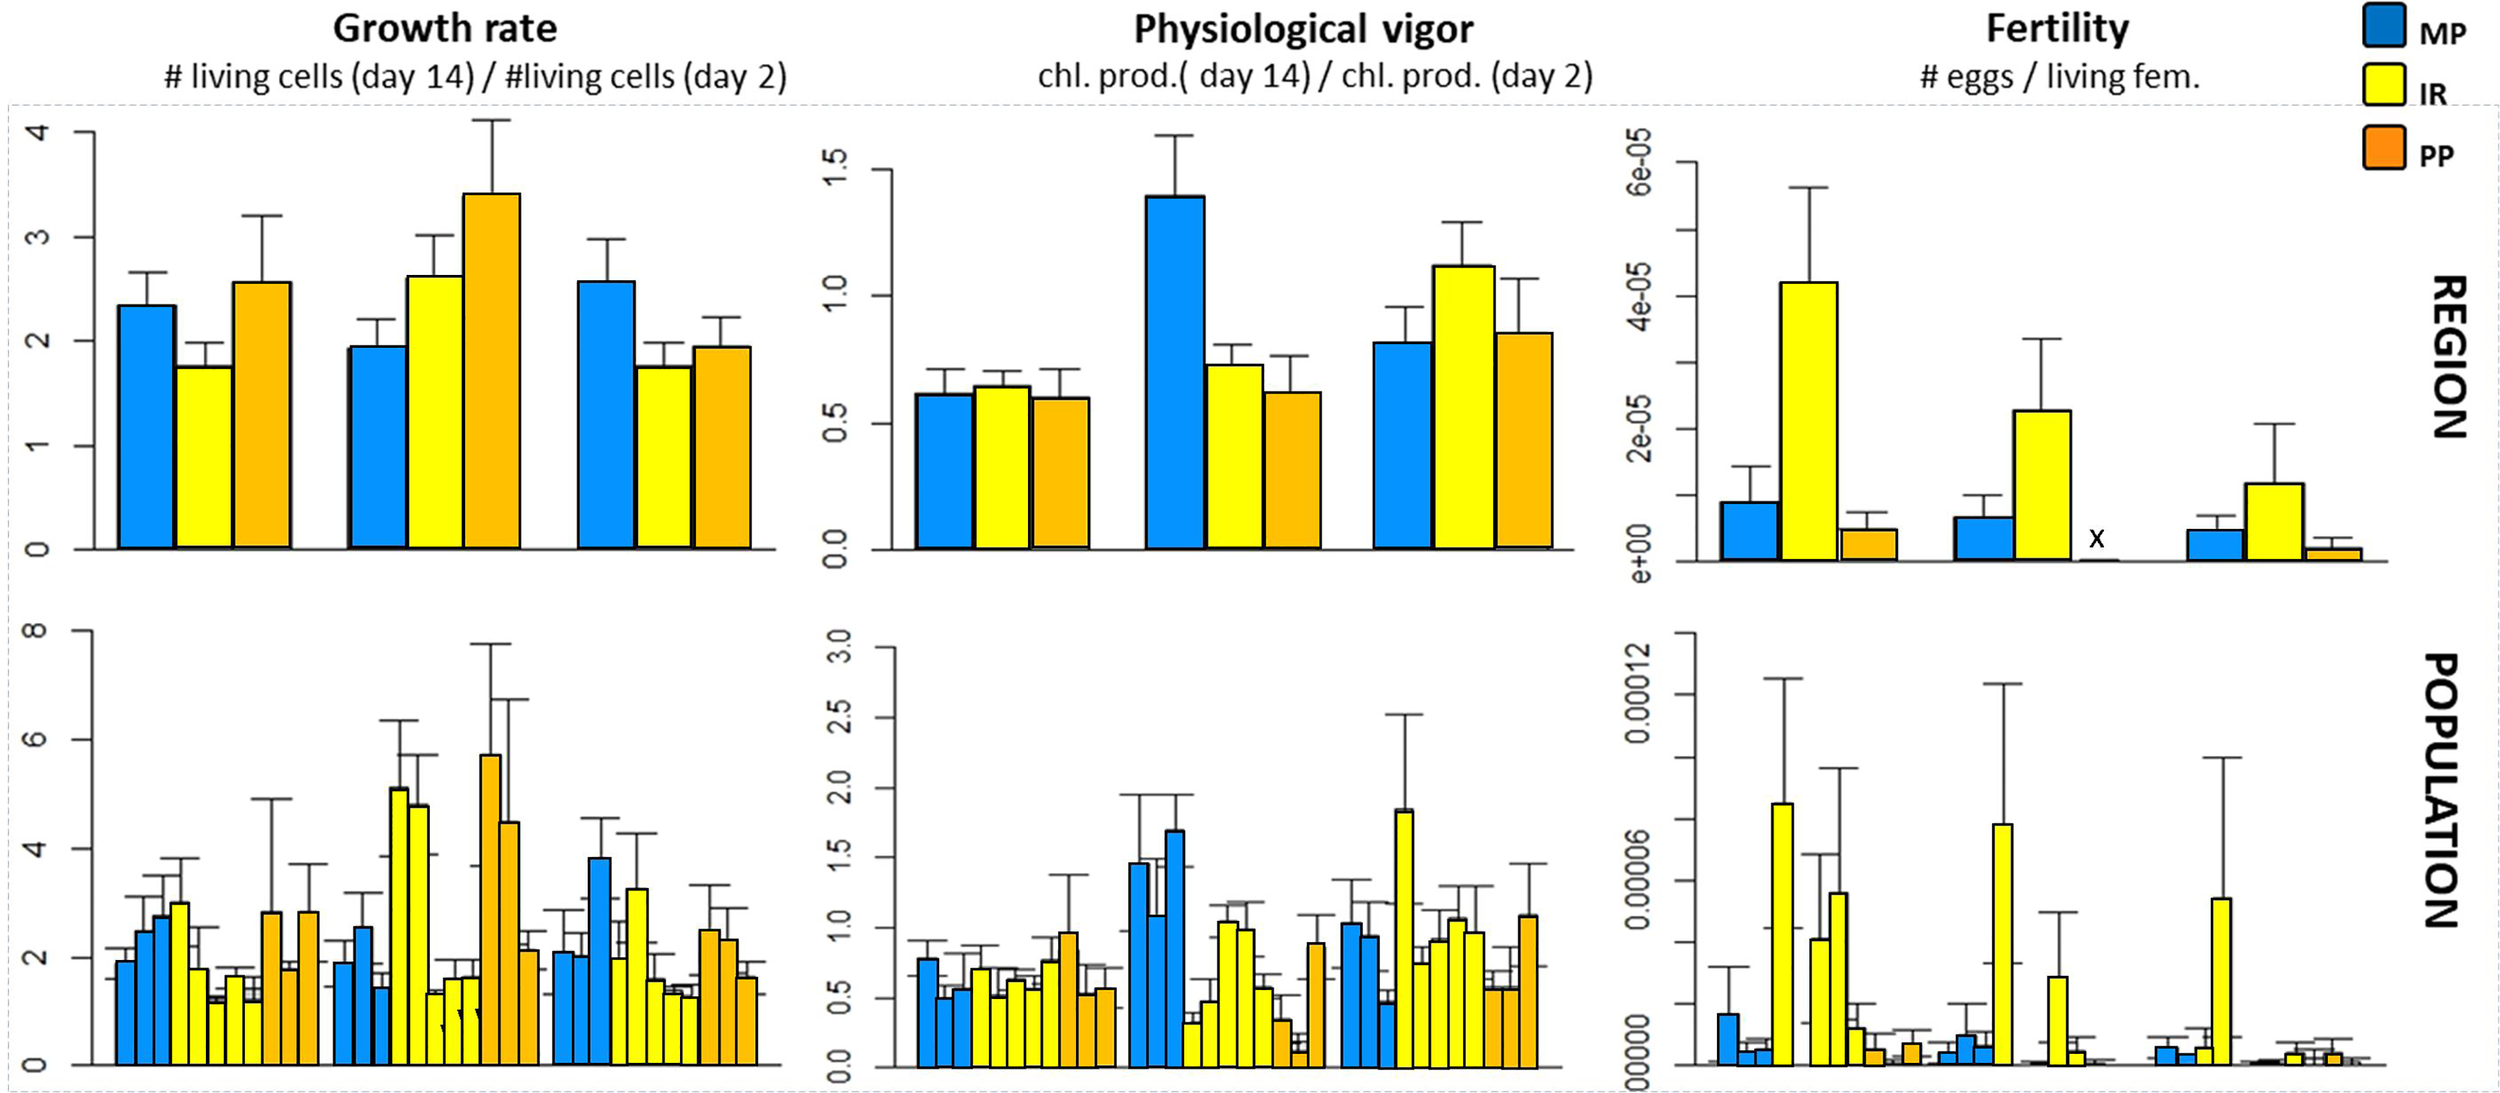
Mean fitness of gametophytes included in experiment 2 after 14 days under experimental conditions. Above, the mean fitness was estimated for each region (regional scale, Table 2 and Table S6 for ANOVA and Tukey’s HSD tests). Below, the same experimental outputs were presented at the population-scale. For the definitions of PP, IR, CG and MP, see Figure 1. Populations’ order from left to right on the x-axis corresponds to south-to-north in Figure 1. Growth rate was estimated as the ratio of living cells at day 14 over the day 2. The physiological vigor was estimated as the ratio of chlorophyll a production between day 14 and day 2. Fertility was estimated by counting the number of eggs per living female. The interaction TEXP x Region was only significant for the physiological vigor.
Heat Wave
Regardless of the region of origin, the ability of gametophytes to grow was affected by the experimental temperature of 24°C with GMF generally centered around 1 (Figure 5), indicating that most gametophytes neither grew nor lost biomass due to cell death. This trend was independent of the region of origin (F(2; 60) = 0.73; p = 0.49; Table 3). The factor “population of origin” was not significant (L-ratio = 0, p = 1, Table 3 and Table S7), yet the pool of gametophytes from Antofagasta (ANT) were a noticeable exception, with GMF > 2.5 (Figure 5). The physiological vigor was well explained by the region of origin (F(2; 60) = 11.63; p<0.001; Table 3), with the lowest values observed in the Magellan Province. In fact, gametophytes from this region were the most impacted by the heatwave as they showed the lowest values for the 3 fitness proxies. Contrary to our hypothesis of local adaptation, both physiological vigor and fertility were higher for gametophytes from the Intermediate Region than those from the Peruvian Province, the only region where such high temperature can be reached (Table 3 and Table S8 for Tukey’s tests).
Figure 5
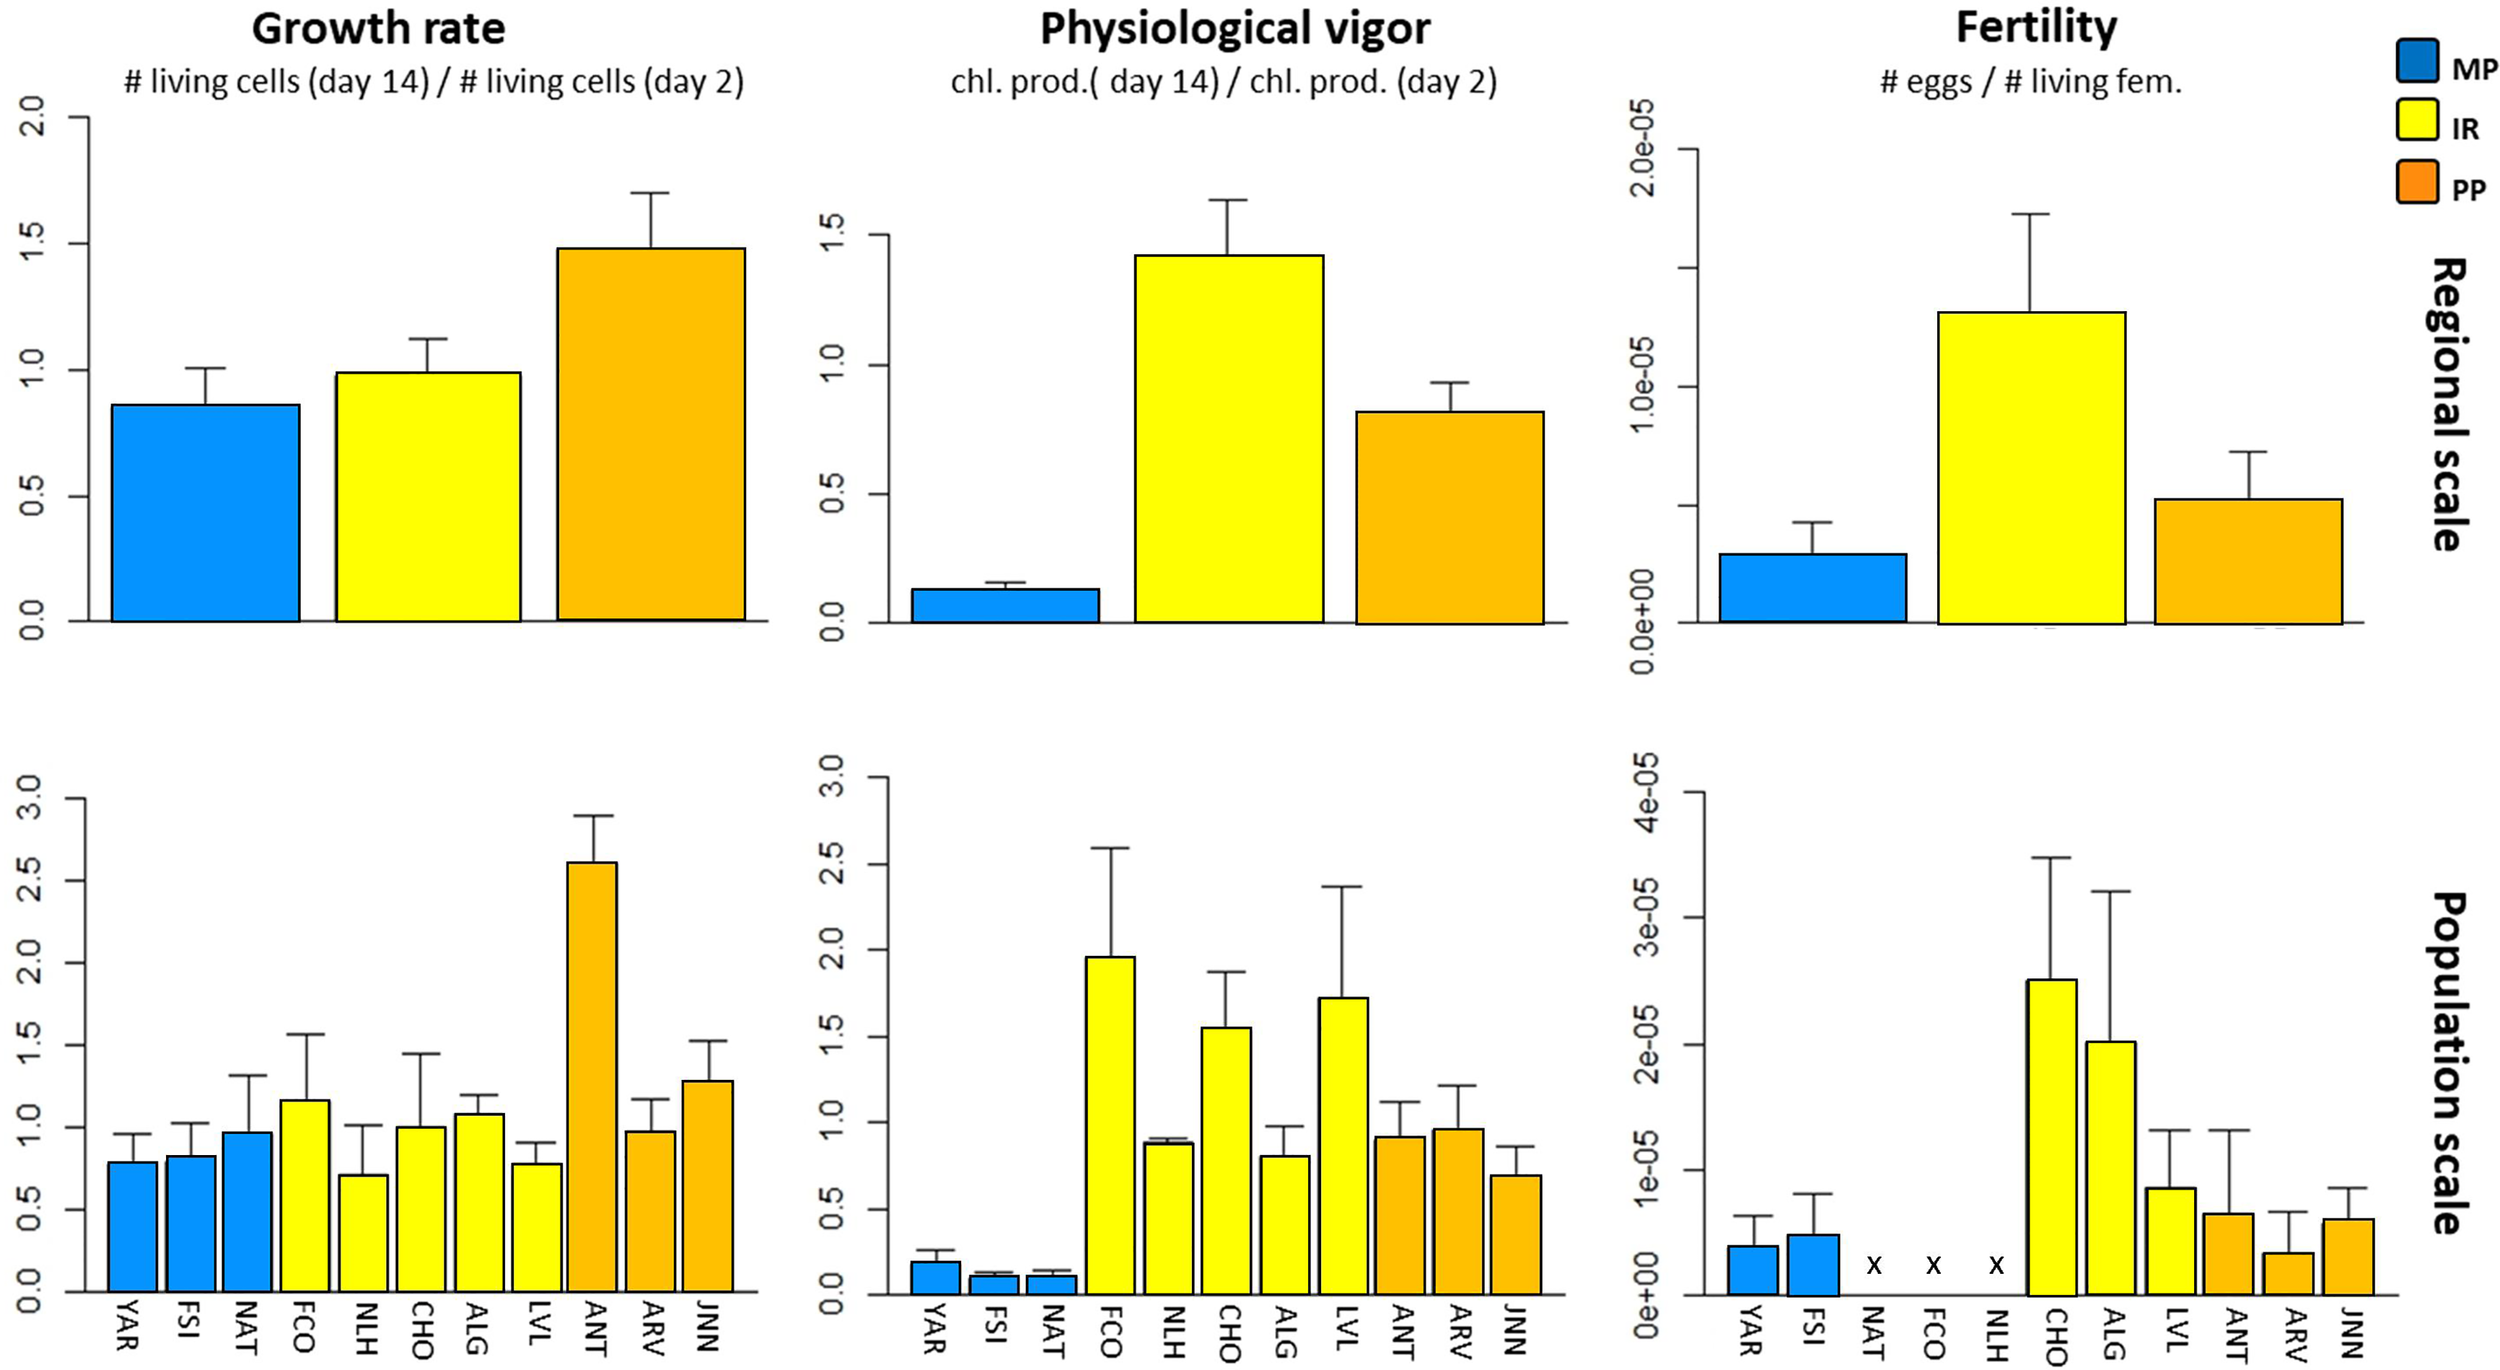
Distribution of fitness of gametophytes facing a simulated heat wave (TEXP = 24°C). This test was performed during experiment 2. Above, the mean fitness was estimated for each region (regional scale, see Table 3 and Table S8 for ANOVA and Tukey’s HSD tests). For the definitions of PP, IR, CG and MP, and locations see Figure 1. Growth rate was estimated as the ratio of living cells at day 14 over the day 2. The physiological vigor, corresponding to the relative chlorophyll a production, was estimated as the ratio between day 14 and day 2. Fertility was estimated by counting the number of eggs per living female.
Table 3
| Growth | Fertility | Physiological Vigor | ||||||||||
|---|---|---|---|---|---|---|---|---|---|---|---|---|
| Model | W ~ Region | |||||||||||
| L-ratio | 0 | p = 1 | 1,10E-01 | p = 0.73 | 0 | p = 1 | ||||||
| ANOVA on submodel | Df | Sum. Sq | Mean. Sq | F (p-value) | Df | Sum. Sq | Mean. Sq | F (p-value) | Df | Sum. Sq | Mean. Sq | F (p-value) |
| Region | 2 | 8,63 | 4,316 | 0.729 (0.487) | 2 | 1,2E-09 | 5,85E-10 | 1.8882 (0.160) | 2 | 18,821 | 9,411 | 11.625 (<0.001) |
| Residuals | 60 | 355,21 | 5.920 | 60 | 1,9E-08 | 3,10E-10 | 60 | 48,57 | 0.810 | |||
Best fit model of analysis of the variance observed in fitness proxies in the Heat Wave experiment.
Discussion
This study focused on the haploid stage, i.e. the gametophyte, of the giant kelp Macrocystis pyrifera, isolated from different biogeographic regions and covering a large latitudinal range. The physiological state of these gametophytes and the fitness proxies (i.e. growth, survival, fertility and fecundity) varied according to the experimental temperature and the region of origin. This kind of result has been observed in a number of recent studies on kelps thermal tolerance (King et al., 2019; Liesner et al., 2020a; Liesner et al., 2020b; Martins et al., 2020). The divergence in thermal tolerance among populations suggests the existence of a genetic background for these traits. Yet, this is not direct evidence of an adaptive divergence leading to local adaptation. Indeed, no evidence of local adaptation sensu stricto was detected by neither Blanquart’s method nor Leimu and Fisher’s test. This latter is considered as highly conservative (Blanquart et al., 2013; Bucharova et al., 2017), as it often leads to rejection of the paradigm “local is best”. Indeed, according to this LvsF-definition, each local experimental unit must perform better than foreign ones. When increasing the sampling effort, the odds that some foreign individuals perform better than locals is also increased. Moreover, this test can detect local adaptation only in situations where population quality effects are much reduced. Indeed, differences in population quality may increase the pooled standard deviation (noted s * in the material and methods section), which alters the value of Hedge’s d. Thus, the local versus foreign test alone cannot finely explain the observed variations of fitness in our study, as the effect of deme quality was proved to be large. Since Blanquart’s method revealed that fitness proxies varied according to genetic (i.e. among regions or among populations) and environmental (experimental temperature) sources of variation, rather than the sympatric vs allopatric contrast, the variability of Hedge’s d is thus mainly imputable to the variability of regional and population quality. Hereafter, we discuss the putative ecological and evolutionary causes and consequences of this variability, in the light of the recommendation of J. Hereford (2009) claiming that “studies that do not demonstrate local adaptation should not be looked on as failed experiments, but as demonstrations that populations may be prevented from reaching adaptive optima”.
The large thermal tolerance of gametophytes represents the first likely explanation, as they were able to survive most experimental treatments, including the heat wave. Surviving gametophytes invested in vegetative growth in both experiments, to the detriment of reproductive functions (notably fertility was reduced at high temperatures, 18°C or above). Such trade-offs among fitness traits (e.g. survival, growth and reproduction) in response to stressful temperature was shown in other kelps (e.g. Oppliger et al., 2012 for Lessonia nigrescens), other seaweeds (e.g. Araújo et al., 2015 for Ascophyllum sp.; Chu et al., 2011 for Sargassum sp.) and number of terrestrial plants (reviewed by Hereford, 2009). This phenomenon was observed in wild gametophyte stands and ends once suitable environmental conditions are restored for successful sexual reproduction (Dayton, 1985; Hoffmann and Santelices, 1991; Edwards, 2000; Carney and Edwards, 2010; Delebecq et al., 2016). In this context, gametophyte survival at 24°C, even for those collected in the Magellan Province where temperatures rarely overpass 10°C, suggests the gametophytes are acting as a resting stage (Ladah et al., 1999) like a seed bank (Edwards, 2000). The ability of kelp gametophytes to persist for years under laboratory conditions have never been clearly observed in the wild. While previous estimations proposed that gametophytes can survive for a few weeks (Deysher and Dean, 1986; Hoffmann and Camus, 1989; Reed et al., 1997), more recent work suggests some gametophytes could persist in the field during several months (Carney et al., 2013; Robuchon et al., 2014), enough to survive the warm season. Kelp demographic turnover may be ensured by two possible mechanisms: either gametophytes survive during warm seasons until colder conditions are met to complete mating and restore the diploid phase, or spores are released during the cold season to ensure a rapid development of the gametophyte stage. In any case, successful sexual reproduction is likely to occur mainly when temperature is below 18°C. Such condition is met during austral winter (June-August) and during the upwelling season (spring and early summer; Thiel et al., 2007).
Considering the large distribution range, we hypothesize that selection on gametophytes does not promote local adaptation but instead favors all-purpose phenotypes, allowing them to cope with the diverse array of environmental conditions within the range. This would be the case if a stabilizing selection is acting on a large spatial scale (Price et al., 2003). While dispersal through rafting of mature sporophytes is probably too rare to ensure an effective gene flow among populations, it allows the transport of individuals for several hundred (Thiel and Haye, 2006), and up to several thousands of kilometers (Macaya and Zuccarello, 2010). The subsequent release of spores then may occur in a very distinct habitat than the origin of the parental rafting sporophyte. Under such a scenario, the resistance and plasticity of gametophytes appears as a necessary property to ensure successful recruitment. However, to what extent selection for rare long-distance dispersal and successful recruitment could prevent specialization to local, or even regional, environmental conditions is difficult to predict. This hypothesis questions the weight of the parental effects on the fitness of the migrant progeny (defined as the part of the phenotype of descendants explained by the phenotype and/or the environment of parental sporophytes, Mousseau and Fox, 1998; Wolf and Wade, 2009), as they may potentially affect the success of recruitment. Transgenerational effects of temperature have been observed in kelps: the thermal tolerance of juvenile sporophytes was influenced by the temperature at which the gametophytes were grown and reproduced in Laminaria digitata (Liesner et al., 2020b). However, such inherited epigenetic variation from the sporophyte to the gametophyte stage is less likely as i. spores are small and their nutrient content is very low; ii. after germination, the young gametophytes are physiologically independent; iii. recent studies suggest that, at least in plants, the epigenetic modifications that are environmentally induced showed a limited meiotic stability (Paszkowski and Grossniklaus, 2011; Wibowo et al., 2016), suggesting that meiotic spores may not be an adequate carrier of the maternal effect on the gametophytic stage; iv. brown algae seem to lack the capacity to methylate DNA (Vigneau and Borg, 2021). We therefore might expect an overall low incidence of parental effects. Besides a reduced impact on estimations of fitness during our experiments, the phenotype of immigrant gametophyte would consequently depend on its own plasticity.
The results of the two experiments also highlighted that low temperature may restrain fertility and fecundity, while survival rate and the physiological state remained globally stable. Therefore, the range of optimal temperature for reproduction in M. pyrifera seems to be restricted to few degrees around 12°C. In fact, regional temperatures tend to be seasonally variable, and may range between 14 and 20°C in the Peruvian Province and between 3 and 10°C in the Magellan Province. In this context, the choice of fixed experimental temperatures at the regional average (8°C for MP and 18°C PP) may have forced the gametophytes to express their plasticity in the form of a resistance state, yet in detriment to the detection of LA (if existing). This is a difficulty inherent to laboratory-controlled experiments, which are oversimplifications of the environmental factors involved, usually disregarding the interaction among them. This being said, several features of the reproductive strategy of M. pyrifera and dispersal capacity of its spores may also prevent the reach of a local adaptive optimum. One of these relates to the likely effect of genetic drift. In their meta-analysis about local adaptations in plants, Leimu and Fisher (2008) showed that LA is usually not detected in populations of<1000 fertile individuals. This agreed with the classical theoretical expectation that increased stochasticity (through reduced effective size) diminishes the efficiency of selection. The effective size of kelp populations is generally not known, but might be relatively small in the case of M. pyrifera. The species is distributed along the shoreline, in stands that rarely exceed a few meters in width (Vásquez et al., 2010). The production of meiotic spores occurs on specialized blades located at the base of the individual, close to the substrate where the hydrodynamics is reduced by the large standing biomass. Most of the spores settle within a few hours after release. This morphological specificity, as well as the short duration of the spores’ swimming phase, greatly restrict spore dispersal and effective gene flow within and among kelp stands. Population genetic estimate of mean dispersal distance ranges between 0.5 to 3 km, and is strongly determined by coastal current velocity (Alberto et al., 2010). Additionally, a temporal survey across 11 years of Californian kelp populations showed that their stochastic dynamics was mitigated by the presence of persistent neighbor stands, further suggesting dispersal was relevant only at local scales (Castorani et al., 2015). Equivalent temporal survey is not available for the Chilean Coast, but fluctuating demography is expected in the Peruvian Province, where El Niño events are known to cause strong kelp mortality (Thiel et al., 2007). Considered together, these elements suggest low neighborhood and effective sizes of giant kelp’s populations. In this context, migration-selection equilibrium is potentially an unreachable state because of the dominant effect of genetic drift. Stochasticity may be particularly strong at range edge where a reduced averaged fitness is expected due to marginality. Such mechanism explained the particularly poor thermal tolerance of populations of L. digitata located at warm range limits (Liesner et al., 2020a). Our two experiments included populations from Peruvian and Magellan Provinces, close to the edge of the distribution range of M. pyrifera. Marginality was taken into account by the factor “region of origin” (i.e. the “deme quality” sensu Blanquart et al., 2013), and was expected to confer a bad quality caused by stochastic fixation of deleterious mutations (Willi et al., 2006). Several results were in line with this expectation. Indeed, gametophytes from these provinces had low fertility compared to those from the Intermediate Region. Increased investment in vegetative growth of the gametophyte, uneven sex ratio and meiotic alterations or apomixis have been observed in other kelps at their range margins (Oppliger et al., 2011; Oppliger et al., 2012; Oppliger et al., 2014). Such changes in reproductive strategies are expected to further reduce effective size (Hoffmann and Blows, 1994) and should slow down the selective processes acting on the standing variability (Glemin and Ronfort, 2013). Altogether, the combination of stressful environmental conditions that lower fitness and the harsh genetic context (e.g. stochastic fluctuations of deleterious alleles and inbreeding) may strongly reduce adaptability of marginal populations (Willi et al., 2006).
Adaptive optima to regional temperatures seem to be hardly reached in M. pyrifera gametophytic populations. We proposed two possible explanations that are non-mutually exclusive. One likely restriction stems from the effect of stochasticity driving the dynamics and evolutionary trajectories of the giant kelp’s populations. In parallel, selection may favor generalist gametophytic phenotypes over specialized ones to local habitat, as a consequence of selection in unpredictable environmental conditions. As the product of meiosis, the gametophyte population holds a large diversity of haploid genotypes expressing different thermal tolerance traits and reproductive strategies on which selection can act. With potentially reduced mutational load and nutrient requirements, and a strong phenotypic plasticity or wide physiological tolerance, this haploid stage is able to transmit most of the standing genetic variance of thermal tolerance traits to the next diploid generation. Therefore, tackling the question of local adaptation requires further experiments on the diploid sporophyte to complete the puzzle of the actual evolutionary trajectory in this heteromorphic haploid-diploid species. So far, we conclude that the large distribution range of this cosmopolitan species is better explained by its capacity to colonize distant and diverse habitats, than by the adaptation to local conditions.
Funding
This study was financed by grants ANID/CONICYT FONDECYT 1160930, FONDECYT 3170597, FB-0001 CeBiB, ANID MIllenium Science Initiative Program NCN2021_033, CNRS International Research Network: Diversity and Biotechnology of Marine Algae, and IDEALG project (France: ANR-10-BTBR-04).
Publisher’s Note
All claims expressed in this article are solely those of the authors and do not necessarily represent those of their affiliated organizations, or those of the publisher, the editors and the reviewers. Any product that may be evaluated in this article, or claim that may be made by its manufacturer, is not guaranteed or endorsed by the publisher.
Statements
Data availability statement
The raw data supporting the conclusions of this article will be made available by the authors, without undue reservation.
Author contributions
RB, SF, and AM planned and designed the experiments. DH, CC, GM performed the experiments and analyzed the data together with RB and SF. All co-authors contributed to the interpretation of the results. SF and MV supervised the project. RB, SF, and MV wrote the manuscript, which was reviewed and approved by all authors. All authors contributed to the article and approved the submitted version.
Acknowledgments
We are grateful to Jessica Beltran for her support in the training and supervision of students DH, CC, and GM during this study.
Conflict of interest
The authors declare that the research was conducted in the absence of any commercial or financial relationships that could be construed as a potential conflict of interest.
Supplementary material
The Supplementary Material for this article can be found online at: https://www.frontiersin.org/articles/10.3389/fmars.2022.802535/full#supplementary-material
Supplementary Table 1Details about sampling effort and the number of parental sporophytes that provided the gametophytes included in our experiments.
Supplementary Table 2Experimental design and structure of our dataset, indicating which are sympatric or allopatric combinations.
Supplementary Table 3Details about the mixed linear models used to analyze data from the experiment 1.
Supplementary Table 4Pairwise comparisons among treatments from the experiment 1 (post hoc Tukey’s HSD tests), performed for significant fixed effects (see ).
Supplementary Table 5Details about the mixed linear models used to analyze data from the experiment 2.
Supplementary Table 6Pairwise comparisons among treatments from the experiment 2 (post hoc Tukey’s HSD test), performed for significant fixed effects (see ).
Supplementary Table 7Details about the mixed linear models used to analyze data from the experiment of Heat Wave.
Supplementary Table 8Pairwise comparisons among treatments from the experiment of Heat Wave (post hoc Tukey’s HSD test), performed for significant fixed effects (see ).
Supplementary Figure 1Hedge’s d distribution for testing the hypothesis of “local is best”, performed with data from Experiment 1 at the regional scale. The null hypothesis (i.e. no local adaptation) cannot be rejected as both negative (maladaptation) and positive (local adaptation) d-values were encountered for each proxy.
Supplementary Figure 2Hedge’s d distribution for testing the hypothesis of “local is best”, performed with data from Experiment 2 at the population scale. The null hypothesis (i.e. no local adaptation) cannot be rejected as both negative (maladaptation) and positive (local adaptation) d-values were encountered for each proxy.
References
1
Alberto F. Raimondi P. Reed D. Coelho N. Raphael L. Whitmer A. et al . (2010). Habitat Continuity and Geographic Distance Predict Population Genetic Differentiation in Giant Kelp. Ecology91, 49–56. doi: 10.1890/09-0050.1
2
Alberto F. Raimondi P. Reed D. Coelho N. Raphael L. Whitmer A. et al . (2011). Isolation by Oceanographic Distance Explains Genetic Structure for Macrocystis Pyrifera in the Santa Barbara Channel. Mol. Ecol.20, 2543–2554. doi: 10.1111/j.1365-294X.2011.05117.x
3
Araújo R. Serrão E. A. Sousa-Pinto I. Arenas F. Monteiro C. A. Toth G. et al . (2015). Trade-Offs Between Life-History Traits at Range-Edge and Central Locations. J. phycol.51, 808–818. doi: 10.1111/jpy.12321
4
Assis J. Berecibar E. Claro B. Alberto F. Reed D. Raimondi P. et al . (2017). Major Shifts at the Range Edge of Marine Forests: The Combined Effects of Climate Changes and Limited Dispersal. Sci. Rep.7., 44348. doi.org: 10.1038/srep44348
5
Blanquart F. Gandon S. (2011). Evolution of Migration in a Periodically Changing Environment. Am. Nat.177, 188–201. doi: 10.1086/657953
6
Blanquart F. Gandon S. (2014). ON THE EVOLUTION OF MIGRATION IN HETEROGENEOUS ENVIRONMENTS. Evolution68, 1617–1628. doi: 10.1111/evo.12389
7
Blanquart F. Gandon S. Nuismer S. L. (2012). The Effects of Migration and Drift on Local Adaptation to a Heterogeneous Environment. J. Evolution. Biol.25, 1351–1363. doi: 10.1111/j.1420-9101.2012.02524.x
8
Blanquart F. Kaltz O. Nuismer S. L. Gandon S. (2013). A Practical Guide to Measuring Local Adaptation. Ecol. Lett.16, 1195–1205. doi: 10.1111/ele.12150
9
Borlongan I. A. Maeno Y. Kozono J. Endo H. Shimada S. Nishihara G. N. et al . (2019). Photosynthetic Performance of Saccharina Angustata (Laminariales, Phaeophyceae) at the Southern Boundary of Subarctic Kelp Distribution in Japan. Phycologia58, 300–309. doi: 10.1080/00318884.2019.1571355
10
Bucharova A. Durka W. Holzel N. Kollmann J. Michalski S. Bossdorf O. (2017). Are Local Plants the Best for Ecosystem Restoration? It Depends on How You Analyze the Data. Ecol. Evol.7, 10683–10689. doi: 10.1002/ece3.3585
11
Bush A. Mokany K. Catullo R. Hoffmann A. Kellermann V. Sgro C. et al . (2016). Incorporating Evolutionary Adaptation in Species Distribution Modelling Reduces Projected Vulnerability to Climate Change. Ecol. Lett.19, 1468–1478. doi: 10.1111/ele.12696
12
Camus P. A. (2001). Marine Biogeography of Continental Chile. Rev. Chil. Hist. Natural74, 587–617.
13
Camus C. Faugeron S. Buschmann A. H. (2018). Assessment of Genetic and Phenotypic Diversity of the Giant Kelp, Macrocystis Pyrifera, to Support Breeding Programs. Algal. Research-Biomass. Biofuels Bioprod.30, 101–112.
14
Carney L. T. Bohonak A. J. Edwards M. S. Alberto F. (2013). Genetic and Experimental Evidence for a Mixed-Age, Mixed-Origin Bank of Kelp Microscopic Stages in Southern California. Ecology94, 1955–1965. doi: 10.1890/13-0250.1
15
Carney L. T. Edwards M. S. (2010). Role of Nutrient Fluctuations and Delayed Development in Gametophyte Reproduction by Macrocystis Pyrifera (Phaeophyceae) in Southern California. J. Phycol.46, 987–996. doi: 10.1111/j.1529-8817.2010.00882.x
16
Castorani M. C. Reed D. C. Alberto F. Bell T. W. Simons R. D. Cavanaugh K. C. et al . (2015). Connectivity Structures Local Population Dynamics: A Long-Term Empirical Test in a Large Metapopulation System. Ecology96, 3141–3152. doi: 10.1890/15-0283.1
17
Chu S. Zhang Q. Liu S. Zhang S. Tang Y. Lu Z. et al . (2011). Trade-Off Between Vegetative Regeneration and Sexual Reproduction of Sargassum Thunbergii. Hydrobiologia678, 127–135. doi: 10.1007/s10750-011-0835-9
18
Correa J. A. Nielsen R. Grund D. W. (1988). Endophytic Algae of Chondrus Crispus (Rhodophyta).II. Acrochaete Heteroclada Sp. Nov., A. Operculata Sp. Nov., and Phaeophila Dendroides (Chlorophyta). J. Phycol.24, 528–539.
19
Cotto O. Wessely J. Georges D. Klonner G. Schmid M. Dullinger S. et al . (2017). A Dynamic Eco-Evolutionary Model Predicts Slow Response of Alpine Plants to Climate Warming. Nat. Commun.8. , 1-9 doi: 10.1038/ncomms15399
20
Dayton P. K. (1985). ECOLOGY OF KELP COMMUNITIES. Annu. Rev. Ecol. Systemat.16, 215–245. doi: 10.1146/annurev.es.16.110185.001243
21
Delebecq G. Davoult D. Janquin M. A. Oppliger L. V. Menu D. Dauvin J. C. et al . (2016). Photosynthetic Response to Light and Temperature in Laminaria Digitata Gametophytes From Two French Populations. Eur. J. Phycol.51, 71–82. doi: 10.1080/09670262.2015.1104556
22
Deysher L. E. Dean T. A. (1986). In Situ Recruitment of Sporophytes of the Giant Kelp, Macrocystis Pyrifera (L) Agardh, C.A. – Effects of Physical Factors. J. Exp. Mar. Biol. Ecol.103, 41–63. doi: 10.1016/0022-0981(86)90131-0
23
Diehl N. Bischof K. (2021). Coping With a Changing Arctic: Mechanisms of Acclimation in the Brown Seaweed Saccharina Latissima From Spitsbergen. Mar. Ecol. Prog. Ser.657, 43–57. doi: 10.3354/meps13532
24
Eckert C. G. Samis K. E. Lougheed S. C. (2008). Genetic Variation Across Species’ Geographical Ranges: The Central-Marginal Hypothesis and Beyond. Mol. Ecol.17, 1170–1188. doi: 10.1111/j.1365-294X.2007.03659.x
25
Edwards M. S. (2000). The Role of Alternate Life-History Stages of a Marine Macroalga: A Seed Bank Analogue? Ecology81, 2404–2415. doi: 10.1890/0012-9658(2000)081[2404:TROALH]2.0.CO;2
26
Endler J. A. (1973). Gene Flow and Population Differentiation. Science179, 243–250. doi: 10.1126/science.179.4070.243
27
Filbee-Dexter K. Wernberg T. Grace S. P. Thormar J. Fredriksen S. Narvaez C. N. et al . (2020). Marine Heatwaves and the Collapse of Marginal North Atlantic Kelp Forests. Sci. Rep.10, 1–11. doi: 10.1038/s41598-020-70273-x
28
Franco J. N. Tuya F. Bertocci I. Rodriguez L. Martinez B. Sousa-Pinto I. et al . (2018). The “Golden Kelp’ Laminaria Ochroleuca Under Global Change: Integrating Multiple Eco-Physiological Responses With Species Distribution Models. J. Ecol.106, 47–58. doi: 10.1111/1365-2745.12810
29
Gerstein A. C. Otto S. P. (2009). Ploidy and the Causes of Genomic Evolution. J. Heredity.100, 571–581. doi: 10.1093/jhered/esp057
30
Glemin S. Ronfort J. (2013). Adaptation and Maladaptation in Selfing and Outcrossing Species: New Mutations Versus Standing Variation (vol 67, pg 225, 2012). Evolution67, 3381–3381.
31
Gonzalez C. P. Edding M. Torres R. Manriquez P. H. (2018). Increased Temperature But Not pCO(2) Levels Affect Early Developmental and Reproductive Traits of the Economically Important Habitat-Forming Kelp Lessonia Trabeculata. Mar. pollut. Bull.135, 694–703. doi: 10.1016/j.marpolbul.2018.07.072
32
Graham M. H. Vasquez J. A. Buschmann A. H. (2007). “Global Ecology of the Giant Kelp Macrocystis: From Ecotypes to Ecosystems,” in Oceanography and Marine Biology, vol. Vol. 45 . Eds. GibsonR. N.AtkinsonR. J. A.GordonJ. D. M., Taylor and Francis, Boca Raton, Florida, USA. 39–88.
33
Hendry A. P. Day T. Taylor E. B. (2001). Population Mixing and the Adaptive Divergence of Quantitative Traits in Discrete Populations: A Theoretical Framework for Empirical Tests. Evolution55, 459–466. doi: 10.1554/0014-3820(2001)055[0459:PMATAD]2.0.CO;2
34
Hereford J. (2009). A Quantitative Survey of Local Adaptation and Fitness Trade-Offs. Am. Nat.173, 579–588. doi: 10.1086/597611
35
Hoffmann A. A. Blows M. W. (1994). Species Borders – Ecological and Evolutionary Perspectives. Trends Ecol. Evol.9, 223–227. doi: 10.1016/0169-5347(94)90248-8
36
Hoffmann A. J. Camus P. (1989). Sinking Rates and Viability of Spores From Benthic Algae in Central Chile. J. Exp. Mar. Biol. Ecol.126, 281–291. doi: 10.1016/0022-0981(89)90193-7
37
Hoffmann A. J. Santelices B. (1991). Banks of Algal Microscopic Forms – Hypotheses on Their Functioning and Comparisons With Seed Banks. Mar. Ecol. Prog. Ser.79, 185–194. doi: 10.3354/meps079185
38
Hollarsmith J. A. Buschmann A. H. Camus C. Grosholz E. D. (2020). Varying Reproductive Success Under Ocean Warming and Acidification Across Giant Kelp (Macrocystis Pyrifera) Populations. J. Exp. Mar. Biol. Ecol.522, 151247. doi: 10.1016/j.jembe.2019.151247
39
Johansson M. L. Alberto F. Reed D. C. Raimondi P. T. Coelho N. C. Young M. A. et al . (2015). Seascape Drivers of Macrocystis Pyrifera Population Genetic Structure in the Northeast Pacific. Mol. Ecol.24, 4866–4885. doi: 10.1111/mec.13371
40
Juneau P. Popovic R. (1999). Evidence for the Rapid Phytotoxicity and Environmental Stress Evaluation Using the PAM Fluorometric Method: Importance and Future Application. Ecotoxicology8, 449–455. doi: 10.1023/A:1008955819527
41
Kawecki T. J. Ebert D. (2004). Conceptual Issues in Local Adaptation. Ecol. Lett.7, 1225–1241. doi: 10.1111/j.1461-0248.2004.00684.x
42
King N. McKeown N. Smale D. Moore P. (2018). The Importance of Phenotypic Plasticity and Local Adaptation in Driving Intraspecific Variability in Thermal Niches of Marine Macrophytes. Ecography41, 1469–1484. doi: 10.1111/ecog.03186
43
King N. G. McKeown N. J. Smale D. A. Wilcockson D. C. Hoelters L. Groves E. A. et al . (2019). Evidence for Different Thermal Ecotypes in Range Centre and Trailing Edge Kelp Populations. J. Exp. Mar. Biol. Ecol.514, 10–17. doi: 10.1016/j.jembe.2019.03.004
44
Krause G. H. Weis E. (1984). Chlorophyll Fluorescence as a Tool in Plant Physiology. 2. Interpretation of Fluorescence Signals. Photosynthesis. Res.5, 139–157. doi: 10.1007/BF00028527
45
Krumhansl K. A. Okamoto D. K. Rassweiler A. Novak M. Bolton J. J. Cavanaugh K. C. et al . (2016). Global Patterns of Kelp Forest Change Over the Past Half-Century. Proc. Natl. Acad. Sci.113, 13785–13790. doi: 10.1073/pnas.1606102113
46
Ladah L. B. Zertuche-González J. A. (2007). Survival of Microscopic Stages of a Perennial Kelp (Macrocystis Pyrifera) From the Center and the Southern Extreme of its Range in the Northern Hemisphere After Exposure to Simulated El Niño Stress. Mar. Biol.152 (3), 677–686. doi: 10.1007/s00227-007-0723-z
47
Ladah L. B. Zertuche-Gonzalez J. A. Hernandez-Carmona G. (1999). Giant Kelp (Macrocystis Pyrifera, Phaeophyceae) Recruitment Near its Southern Limit in Baja California After Mass Disappearance During ENSO 1997-1998. J. Phycol.35, 1106–1112. doi: 10.1046/j.1529-8817.1999.3561106.x
48
Leimu R. Fischer M. (2008). A Meta-Analysis of Local Adaptation in Plants. PLoS One3. e4010 doi: 10.1371/journal.pone.0004010
49
Lenormand T. (2002). Gene Flow and the Limits to Natural Selection. Trends Ecol. Evol.17, 183–189. doi: 10.1016/S0169-5347(02)02497-7
50
Liesner D. Fouqueau L. Valero M. Roleda M. Y. Pearson G. A. Bischof K. et al . (2020a). Heat Stress Responses and Population Genetics of the Kelp Laminaria Digitata (Phaeophyceae) Across Latitudes Reveal Differentiation Among North Atlantic Populations. Ecol. Evol.10, 9144–9177. doi: 10.1002/ece3.6569
51
Liesner D. Shama L. N. Diehl N. Valentin K. Bartsch I. (2020b). Thermal Plasticity of the Kelp Laminaria Digitata (Phaeophyceae) Across Life Cycle Stages Reveals the Importance of Cold Seasons for Marine Forests. Front. Mar. Sci.7, 456. doi: 10.3389/fmars.2020.00456
52
Lind A. C. Konar B. (2017). Effects of Abiotic Stressors on Kelp Early Life-History Stages. Algae32, 223–233. doi: 10.4490/algae.2017.32.8.7
53
Macaya E. C. Boltana S. Hinojosa I. A. Macchiavello J. E. Valdivia N. A. Vasquez N. R. et al . (2005). Presence of Sporophylls in Floating Kelp Rafts of Macrocystis Spp. (Phaeophyceae) Along the Chilean Pacific Coast. J. Phycol.41, 913–922. doi: 10.1111/j.1529-8817.2005.00118.x
54
Macaya E. C. Zuccarello G. C. (2010). Genetic Structure of the Giant Kelp Macrocystis Pyrifera Along the Southeastern Pacific. Mar. Ecol. Prog. Ser.420, 103–112. doi: 10.3354/meps08893
55
Martinez B. Radford B. Thomsen M. S. Connell S. D. Carreno F. Bradshaw C. J. A. et al . (2018). Distribution Models Predict Large Contractions of Habitat-Forming Seaweeds in Response to Ocean Warming. Diversity Distrib.24, 1350–1366. doi: 10.1111/ddi.12767
56
Martins N. Pearson G. A. Bernard J. Serrão E. A. Bartsch I. 2020. Thermal traits for reproduction and recruitment differ between Arctic and Atlantic kelp Laminaria digitata. PLoS One15, e0235388. doi.org: 10.1371/journal.pone.0235388
57
Mousseau T. A. Fox C. W. (1998). The Adaptive Significance of Maternal Effects. Trends Ecol. Evol.13, 403–407. doi: 10.1016/S0169-5347(98)01472-4
58
Nepper-Davidsen J. Andersen D. T. Pedersen M. F. (2019). Exposure to Simulated Heatwave Scenarios Causes Long-Term Reductions in Performance in Saccharina Latissima. Mar. Ecol. Prog. Ser.630, 25–39. doi: 10.3354/meps13133
59
Oppliger L. V. Correa J. A. Engelen A. H. Tellier F. Vieira V. Faugeron S. et al . (2012). Temperature Effects on Gametophyte Life-History Traits and Geographic Distribution of Two Cryptic Kelp Species. PLoS One7., e39289. doi: 10.1371/journal.pone.0039289
60
Oppliger L. V. Correa J. A. Faugeron S. Beltran J. Tellier F. Valero M. et al . (2011). Sex Ratio Variation in the Lessonia Nigrescens Species Complex (Laminariales, Phaeophyceae): Effects of Latitude, Temperature and Marginality. J. Phycol.47, 5–12. doi: 10.1111/j.1529-8817.2010.00930.x
61
Oppliger L. V. von Dassow P. Bouchemousse S. Robuchon M. Valero M. Correa J. A. et al . (2014). Alteration of Sexual Reproduction and Genetic Diversity in the Kelp Species Laminaria Digitata at the Southern Limit of Its Range. PLoS One9., e102518 doi: 10.1371/journal.pone.0102518
62
Otto S. P. Gerstein A. C. (2008). The Evolution of Haploidy and Diploidy. Curr. Biol.18, 1121–1124. doi: 10.1016/j.cub.2008.09.039
63
Park J. Kim J. K. Kong J. A. Depuydt S. Brown M. T. Han T. (2017). Implications of Rising Temperatures for Gametophyte Performance of Two Kelp Species From Arctic Waters. Botanica Marina.60, 39–48. doi: 10.1515/bot-2016-0103
64
Paszkowski J. Grossniklaus U. (2011). Selected Aspects of Transgenerational Epigenetic Inheritance and Resetting in Plants. Curr. Opin. Plant Biol.14, 195–203. doi: 10.1016/j.pbi.2011.01.002
65
Price T. D. Qvarnstrom A. Irwin D. E. (2003). The Role of Phenotypic Plasticity in Driving Genetic Evolution. Proc. R. Soc. London. Ser. B.270, 1433–1440. doi: 10.1098/rspb.2003.2372
66
Pujol B. Pannell J. R. (2008). Reduced Responses to Selection After Species Range Expansion. Science321, 96–96. doi: 10.1126/science.1157570
67
Reed D. C. Anderson T. W. Ebeling A. W. Anghera M. (1997). The Role of Reproductive Synchrony in the Colonization Potential of Kelp. Ecology78, 2443–2457. doi: 10.1890/0012-9658(1997)078[2443:TRORSI]2.0.CO;2
68
Robuchon M. Le Gall L. Mauger S. Valero M. (2014). Contrasting Genetic Diversity Patterns in Two Sister Kelp Species Co-Distributed Along the Coast of Brittany, France. Mol. Ecol.23, 2669–2685. doi: 10.1111/mec.12774
69
Rothaüsler E. Gomez I. Hinojosa I. A. Karsten U. Miranda L. Tala F. et al . (2011). Kelp Rafts in the Humboldt Current: Interplay of Abiotic and Biotic Factors Limit Their Floating Persistence and Dispersal Potential. Limnol. Oceanogr.56, 1751–1763. doi: 10.4319/lo.2011.56.5.1751
70
Slatkin M. (1973). Gene Flow and Selection in a Cline. Genetics75, 733–756. doi: 10.1093/genetics/75.4.733
71
Smale D. A. (2020). Impacts of Ocean Warming on Kelp Forest Ecosystems. New Phytol.225, 1447–1454. doi: 10.1111/nph.16107
72
Smale D. A. Wernberg T. (2013). Extreme Climatic Event Drives Range Contraction of a Habitat-Forming Species. Proc. R. Soc. B.: Biol. Sci.280, 20122829. https://doi.org/10.1098/rspb.2012.2829
73
Steneck R. S. Graham M. H. Bourque B. J. Corbett D. Erlandson J. M. Estes J. A. et al . (2002). Kelp Forest Ecosystems: Biodiversity, Stability, Resilience and Future. Environ. Conserv.29, 436–459. doi: 10.1017/S0376892902000322
74
Tala F. Velasquez M. Mansilla A. Macaya E. C. Thiel M. (2016). Latitudinal and Seasonal Effects on Short-Term Acclimation of Floating Kelp Species From the South-East Pacific. J. Exp. Mar. Biol. Ecol.483, 31–41. doi: 10.1016/j.jembe.2016.06.003
75
Thiel M. Haye P. A. (2006). “The Ecology of Rafting in the Marine Environment. III. Biogeographical and Evolutionary Consequences,” in Oceanography and Marine Biology - an Annual Review, vol. Vol 44 . Eds. GibsonR. N.AtkinsonR. J. A.GordonJ. D. M.Taylor and Francis, Boca Raton, Florida, USA, 323–429.
76
Thiel M. Macaya E. C. Acuna E. Arntz W. E. Bastias H. Brokordt K. et al . (2007). “The Humboldt Current System of Northern and Central Chile,” in Oceanography and Marine Biology, vol. Vol 45 . Eds. GibsonR. N.AtkinsonR. J. A.GordonJ. D. M., Taylor and Francis, Boca Raton, Florida, USA195–344.
77
Valero M. Richerd S. Perrot V. Destombe C. (1992). Evolution of Alternation of Haploid and Diploid Life-Cycles. Trends Ecol. Evol.7, 25–29. doi: 10.1016/0169-5347(92)90195-H
78
Valladares F. Matesanz S. Guilhaumon F. Araújo M. B. Balaguer L. Benito-Garzón M. et al . (2014). The Effects of Phenotypic Plasticity and Local Adaptation on Forecasts of Species Range Shifts Under Climate Change. Ecol. Lett.17, 1351–1364. doi: 10.1111/ele.12348
79
Vásquez J. A. Piaget N. Tala F. Vega A. J. (2010). “Evaluación De Biomasa De Praderas Naturales Y Prospección De Potenciales Lugares De Repoblamiento De Algas Pardas En La Costa De La XV, 1 Y II Regiones,” in Informe Final Fondo De Investigación Pesquera Y De Acuicultura ( Subsecretaria de Pesca, Ministerio de Economia de Chile) Subsecretaria de Pesca, Ministerio de Economia de Chile, Valparaiso, Chile.
80
Vigneau J. Borg M. (2021). The Epigenetic Origin of Life History Transitions in Plants and Algae. Plant Reproduct.34, 267–285. doi: 10.1007/s00497-021-00422-3
81
Wernberg T. (2021). “Marine Heatwave Drives Collapse of Kelp Forests in Western Australia,” in Ecosystem Collapse and Climate Change. Eds. CanadellJ. G.JacksonR. B. (Cham: Springer), 325–343.
82
Wernberg T. Coleman M. A. Bennett S. Thomsen M. S. Tuya F. Kelaher B. P. (2018). Genetic Diversity and Kelp Forest Vulnerability to Climatic Stress. Sci. Rep.8, 1–8. doi: 10.1038/s41598-018-20009-9
83
Wernberg T. Thomsen M. S. Tuya F. Kendrick G. A. Staehr P. A. Toohey B. D. (2010). Decreasing Resilience of Kelp Beds Along a Latitudinal Temperature Gradient: Potential Implications for a Warmer Future. Ecol. letters.13, 685–694. doi: 10.1111/j.1461-0248.2010.01466.x
84
Wibowo A. Becker C. Marconi G. Durr J. Price J. Hagmann J. et al . (2016). Hyperosmotic Stress Memory in Arabidopsis is Mediated by Distinct Epigenetically Labile Sites in the Genome and is Restricted in the Male Germline by DNA Glycosylase Activity. eLife5, e13546. doi: 10.7554/eLife.13546.044
85
Williams G. C. (1966). Adaptation and Natural Selection (Princeton: Princeton University Press).
86
Willi Y. Van Buskirk J. Hoffmann A. A. (2006). Limits to the Adaptive Potential of Small Populations. Annu. Rev. Ecol. Evol. Systemat.37, 433–458. doi: 10.1146/annurev.ecolsys.37.091305.110145
87
Wolf J. B. Wade M. J. (2009). What are Maternal Effects (and What are They Not)? Philos. Trans. R. Soc. B.: Biol. Sci.364, 1107–1115. doi: 10.1098/rstb.2008.0238
Summary
Keywords
phenotypic plasticity, latitudinal gradient, common garden experiment, heat tolerance, local adaptation
Citation
Becheler R, Haverbeck D, Clerc C, Montecinos G, Valero M, Mansilla A and Faugeron S (2022) Variation in Thermal Tolerance of the Giant Kelp’s Gametophytes: Suitability of Habitat, Population Quality or Local Adaptation?. Front. Mar. Sci. 9:802535. doi: 10.3389/fmars.2022.802535
Received
26 October 2021
Accepted
09 June 2022
Published
22 July 2022
Volume
9 - 2022
Edited by
Melinda Ann Coleman, New South Wales Department of Primary Industries, Australia
Reviewed by
Georgina Valentine Wood, University of Western Australia, Australia; Nora Diehl, University of Bremen, Germany
Updates
Copyright
© 2022 Becheler, Haverbeck, Clerc, Montecinos, Valero, Mansilla and Faugeron.
This is an open-access article distributed under the terms of the Creative Commons Attribution License (CC BY). The use, distribution or reproduction in other forums is permitted, provided the original author(s) and the copyright owner(s) are credited and that the original publication in this journal is cited, in accordance with accepted academic practice. No use, distribution or reproduction is permitted which does not comply with these terms.
*Correspondence: Sylvain Faugeron, sfaugeron@bio.puc.cl
This article was submitted to Marine Ecosystem Ecology, a section of the journal Frontiers in Marine Science
Disclaimer
All claims expressed in this article are solely those of the authors and do not necessarily represent those of their affiliated organizations, or those of the publisher, the editors and the reviewers. Any product that may be evaluated in this article or claim that may be made by its manufacturer is not guaranteed or endorsed by the publisher.