Abstract
The shallow coral Madracis auretenra has an important role in the rich diversity of coral reef ecosystems found in the Caribbean Sea, providing habitat and support to different marine species. Improved understanding of the genetic structure of marine species in the region is needed for the design and management of marine reserves, which are usually created as a biodiversity conservation tool. In this study, seventeen new microsatellite markers were used to examine the population structure of M. auretenra through different areas in the Caribbean Sea (Guatemala, Colombia, Curacao and Barbados), analysing 313 samples from 18 localities. A significant differentiation and a clear clustering were found (k=11), indicating structure in the Caribbean sampled populations with high levels of inbreeding. A pattern of isolation by distance was present in all the localities but not identified in the stratified Mantel test, suggesting a major role of the physical barriers (e.g. currents, upwelling and rivers) in the genetic diversity distribution. Patterns of migration were found for Curacao, Barbados and some areas of Colombia. In contrast, some localities from Colombia (Varadero and Albuquerque) and Guatemala were identified as isolated. The population structure identified here highlights the importance of careful design and monitoring of marine reserves in the region and will help to guide further ecological analysis of shallow Caribbean coral formations.
Introduction
The marine ecosystems from the Caribbean region, and in particular coral reefs, have been affected by the increase of natural and anthropogenic stressors (hurricanes, cyclones, pollutants, diseases, overexploitation and others), with a 60% reduction of the live coral coverage in the region over the last 30 years (Grober-Dunsmore and Keller, 2008; Camp et al., 2015; Lindfield et al., 2015). The main structural component in coral reef ecosystems are the stony corals (Scleractinian group), characterised by being biogenic structures of calcium carbonate (De’ath et al., 2009) and which are involved in natural processes (e.g., carbon cycle), generating a reservoir of carbonate in the sea (Goreau et al., 1996). Additionally, coral reefs provide habitat and support to different organisms due to their three-dimensional structure, resulting on one of the most diverse ecosystems in the world and representing one-third of all marine species described in the ocean (Reaka-Kudla, 2005; Camargo et al., 2009). These organisms associated with coral reefs and the corals themselves, usually are found in small patches or huge coral reefs of hundreds of kilometres, mostly interconnected by corridors (Gonzalez et al., 1998; Díaz et al., 2000), allowing their survival by the movement of larvae, recruits, juveniles and adults among populations of distant areas (Grober-Dunsmore and Keller, 2008). However, the recent degradation ongoing in the ecosystem has led to a breakup of these corridors, isolating the coral reef patches, decreasing the immigration rates and reducing the long term viability for the population (Gaines et al., 2007; Munday et al., 2009).
As a powerful tool in the conservation of coral reef ecosystems, the designs of marine reserves (such as Marine Protected Areas – MPAs), have been considered an excellent instrument to expand the resistance and recovery of coral reef communities (Baco et al., 2016; Mellin et al., 2016). Using the patterns of dispersion data which can also determine growth rates and gene flow among populations (Palumbi, 2003; Ospina-Guerrero et al., 2008), the design and management of MPAs can be improved. The implementation of MPAs in the Caribbean Sea, to increase the reproductive capacity and exportation of larvae among different habitats, has increased in recent years (Alonso et al., 2008, Alonso et al., 2015). However, the composition of the populations, migration and connectivity in MPAs are not fully understood through the region (Grober-Dunsmore and Keller, 2008). For example, the larval flow (dispersion and migration) in marine invertebrates is difficult to track based on the movement of particles in the ocean (Grober-Dunsmore et al., 2009; Lowe and Allendorf, 2010; Pujolar et al., 2013). Accordingly, molecular tools have been used as an useful technique for indirect estimation of population structure (Riesgo et al., 2019). Additionally, these tools help to define the processes that affect the larval dispersion and identify barriers in gene flow, which are fundamental for understanding the interactions of marine populations (Botsford et al., 2001; Botsford et al., 2009). Genetic markers such as microsatellites are used to estimate dispersion, migration, population structure and genetic diversity of marine organisms (Sunnucks, 2000; Selkoe and Toonen, 2006; Hedgecock et al., 2007; Lowe and Allendorf, 2010).
With an abundant distribution inside of MPAs, the stony coral Madracis auretenra (Pocilloporidae family) is found across the Caribbean Sea, giving it the position of “Least Concern” on the IUCN red list (International Union for Conservation of Nature). This species is a zooxanthellae coral known also as “yellow pencil coral”, which grows optimally between 1 and 20 m depth, with patches that can reach more than 5 m diameter (Bruno, 1998). M. auretenra is characterised by bushy colonies with branches that reach two meters in diameter, usually with bright or dark yellow colours; the calyxes reach 1- 2 mm in diameter and have 10 septa fused to the columnella; the coenosteum is finely spinate, rarely forming a circle around the calyx, and the columnella is flat or styliform (Locke et al., 2007; Reyes et al., 2010). This shallow coral is a hermaphrodite with the ability to spread quickly, alternating between (1) a high level of asexual propagation, by fragmentation, to compete for space and (2) continuous planulae “quick releaser” instead of “brooder reproductive pathway” due to the fast liberation of the embryo after fertilization for Madracis to settle in new areas during rainy seasons (September and October) (Vermeij et al., 2004). In addition, it produces a large amount of yolk in the oocytes (Vermeij et al., 2004), which increases the dispersive capabilities by providing nutrients to travel long distances (Diekmann, 2003); and also the planulae have the advantage of owning the zooxanthellae through “vertical transmission” from parent to offspring (Hauff et al., 2016). Madracis auretenra was for a long time wrongly described as M. mirabilis, a synonymous name from the deep-water species M. myriaster (Locke et al., 2007). Due to this misidentification, some data available from M. mirabilis cannot be interpreted completely as relevant information for M. auretenra (Locke and Coates, 2008). However, important reports on M. auretenra must be taken into account, including: “the evolutionary ecology of the coral genus Madracis” (Vermeij, 2002), which includes morphological, reproductive, growth and general aspects for the species; population structure along the depth gradient in Curacao (Vermeij and Bak, 2003), reproductive biology descriptions for the species (Vermeij et al., 2004), and presence of phenotypic plasticity among clones (Bruno and Edmunds, 1997).Other relevant studies in the genus Madracis show demographic processes on coral population sizes (Vermeij and Bak, 2000), the morphological and genetic divergence between Mediterranean and Caribbean populations (Benzoni et al., 2018), the evidence of reticulate speciation in Madracis (Diekmann et al., 2001; Diekmann, 2003) and the role of hybridization in the genus (Frade et al., 2010). However, specific studies on the population structure of M. auretenra among Caribbean areas have not previously been performed.
The area occupied by M. auretenra, and in general by coral reefs in the Caribbean is one of the most challenging areas to define in biogeographic classification due to the complexity in their biological and physicochemical conditions (Vides-Casado, 2011). The Caribbean Sea is an area enclosed by South and Central America and Atlantic Oceanic islands, with obstacles or barriers in shallow waters, including between (1) East Coast of the USA and the Gulf of Mexico (Mobley et al., 2010); (2) Florida peninsula and Bahamas (Carlin et al., 2003); (3) Bahamas and Cuba (Cowen et al., 2006); (4) Northwest Caribbean and Caribbean (Salas et al., 2010); and (5) East Caribbean and North Caribbean (Betancur-R et al., 2011). Some ecoregions of the Caribbean have been identified by their physicochemical composition (bathymetry, hydrography, chlorophyll concentration, salinity, temperature and others) and by areas which could hold relatively homogeneous composition of marine species. Ecoregions of note in this classification include (1) Northern Gulf of Mexico; (2) Bahamian; (3) Eastern Caribbean; (4) Greater Antilles; (5) Southern Caribbean; (6) South-western Caribbean; (7) Western Caribbean; (8) Southern Gulf of Mexico; (9) Floridian (Spalding et al., 2007). Also, the Caribbean climate is controlled by the Intertropical Convergence Zone (ITCZ), with a windy and dry season dominated by winds travelling from the NE to the SW from December to April, and rainy seasons with decreased wind speed, but increased precipitation rate from August to October (Andrade Amaya, 1993). During the rainy season, the formation of cyclonic eddies has been monitored, showing an interaction with the Caribbean Current as a wind curl (Andrade, 2001), which fulfils an important function in the mechanism of retention-expulsion of larvae and eggs (Andrade et al., 1996).
Previous studies on the coral reefs population structure in the Caribbean for Montastrea cavernosa (Eckert et al., 2019; Sturm et al., 2020), Orbicella faveolata and Acropora palmata (Porto-Hannes et al., 2015), Pseudopterogorgia elisabethae (Gutiérrez-Rodríguez and Lasker, 2004), and Gorgonia ventalina (Andras et al., 2013) have shown that the exchange of organisms among areas is guided by physicochemical conditions (e.g., upwelling, bathymetric characteristics, hydrology, trophic interactions, salinity, oxygen, temperature, and rivers) working as barriers between marine ecosystems. The interaction of those conditions with the particular characteristics in the Caribbean Sea (currents, cyclones, anticyclones and eddies), determines the movements of organisms, the gene flow and population structure (Munday et al., 2009; Andras et al., 2013) as exhibited by models for the Caribbean corals (Galindo et al., 2006). Taking into account the information previously shown, the aim of this study was to assess the population structure of M. auretenra in shallow Caribbean coral reefs, with the support of seventeen new microsatellite markers developed for this purpose.
Methods
Sampling and identification
The sampling was carried out in 10 localities from Colombia with 145 samples; four localities from Curacao with 74 samples; three localities from Barbados with 78 samples and one locality from Guatemala with 23 samples, for a total of 320 samples (Supplementary Table 1, Supplementary Material-1A). All the samples were collected by scuba diving using morphological descriptions from Reyes et al. (2010). The sampling of colonies was done at least 5 meters apart (reducing the chances to collect clones), at depths between 5m and 15m. On surfacing, the samples were placed in 96% alcohol or DMSO and then stored at -20° C in the laboratory. To confirm the correct identification of M. auretenra, the samples were examined by Dr Nadia Santodomingo at the Natural History Museum of London, UK., and scanned under electron microscopy-SEM (Zeiss Supra 40VP FE-SEM) (Supplementary Material 2A, B). In addition, the amplification of cox1 (Folmer et al., 1994) and 28S (Stolarski et al., 2011) was performed in 13 samples (6, 3, 2 and 2 samples from Colombia, Curacao, Barbados and Guatemala, respectively). The sample sequences matched with sequences of M. auretenra (95.43 - 99.85% similarity) in NCBI database (Supplementary Material 2C).
DNA extraction, microsatellites amplification and genotyping
The kit protocol DNeasy Blood & Tissue of QIAGEN was used for the DNA extraction. To test the quality and quantity of the DNA extractions an electrophoresis was performed using 0.80g of agar for 1% agar gels, in 80ml of 1X TBE Buffer solution and 0.8 μL of GEL GREEN. Then, 1 μL of sample was added in each pool plus 2 μL of loading buffer; the electrophoresis gel chamber was run at 60 V- 60 minutes. A NanoDrop (Thermo Scientific) was also used to test the DNA concentration and quality. Seventeen microsatellites for M. auretenra (Ballesteros-Contreras, 2020) were re-designed with the universal tail sequence Blacket A: GCCTCCCTCGCGCCA (Blacket et al., 2012) and M13-mod B: CACTGCTTAGAGCGATGC (Culley et al., 2013), to distinguish among amplified fragments by the labelling with fluorescent dyes (6-FAM and ROX), accordingly (Supplementary Table 2). In order to test the samples, the program Multiplex_Manager (Holleley and Geerts, 2009) was used to perform multiplexes in order to reduce time and cost under the reaction mixes containing: 5 μL of Master Mix (Type-it Microsatellite PCR QIAGEN Kit), 3 μL H2O molecular grade, 1μl Primer mix (Pre_laballed Forward + Reverse + Fluorescence 6-FAM or ROX + H20 molecular grade) and 1μl DNA (20 ng/μl), following the PCR conditions: (1) denaturation 95°C/5 min; (2) 32 cycles including 95°C/30 sec for denaturation, 60°C/1.5 min for annealing, and 72°C/30 sec for elongation; (3) a final extension at 60°C/30 min; (4) an endless holding at 4°C, using a TECHNE thermocycler. The PCR products were electrophoresed in a 0.8% agarose gel to confirm the amplification of the microsatellites. The fluorescence labelled PCR products were sent to the University of Manchester DNA Sequencing Facility (UK) and to the Core Genomics Facility at the University of Sheffield. In both places the products were sized using the capillary electrophoresis Applied Biosystems 3730 DNA Analyser (enabling size discrimination within the range of 20 to 600 base pairs using a range of dyes).
Data analysis
The fragment sizes for each loci were analysed with the software R, using the packages “Fragman” (Covarrubias-pazaran et al., 2016) and “MsatAllele” (Alberto, 2013). The clones were inspected in the sampling counting the multi-locus genotypes throughout localities in “Poppr” (Kamvar et al., 2014), only one genotype per clone was kept for the analyses. Validation of clone identification was performed using the Poppr function “psex” (Parks and Werth, 1993; Arnaud-Haond et al., 2007). The probability of encountering each sample’s genotype more than once by chance was calculated across all 320 samples without stratification. The maximum probability of a second encounter across the samples was 3.278x10⁻⁶. Seven samples with repeat multi-locus genotypes (country level stratification) were therefore removed from downstream analysis. The remaining 313 samples were analysed at three different scales: country, department and locality. The department level was based on geo-political limits in the case of Colombia (Bolivar, Cordoba, Magdalena, Uraba Chocoano, SAI), due to the high sample number in the localities distributed along the country, which covers around 800 km2. GenoDive v2.032b (Meirmans and Van Tienderen, 2004) was used to get the number of alleles (Na), the effective number of alleles (NEa), the observed heterozygosity (Ho), expected heterozygosity (He), and the inbreeding coefficient (FIS) per locality. To calculate the average allelic richness and the private allele richness, a minimum sample size (maximum g = 10) was used in ADZE v1.0 (Szpiech et al., 2008). The population pairwise was calculated (Fst) in GENODIVE v 3.04 (Meirmans and Van Tienderen, 2004). Also, the null allele frequency in the loci was estimated using “FreeNa” (Chapuis and Estoup, 2007) and its expectation-maximization (EM) algorithm (1000 bootstrap resamples). Afterwards, the proportion of genetic variance in Fst values with ENA correction for null alleles was estimated; this method was used to provides accurate estimation of Fst in presence of null alleles (Chapuis and Estoup, 2007).
The inbreeding in the localities was measured by INEST v2.1 (Chybicki and Burczyk, 2009). In this case, a Bayesian test was performed with the default parameters (50000 MCMC cycles, keeping every 50th and with 10000 cycles burn-in) to calculate the mean value of the inbreeding coefficient, and the limit of the highest density posterior interval. In order to determinate the effect on inbreeding coefficients by null alleles and genotyping failure, a DIC (deviance information criterion) analysis using two different models was performed by INEST v2.1 (Chybicki and Burczyk, 2009). The DIC analysis can determinate if the ‘nfb’ model (null allele, inbreeding and genotyping failure) or ‘nb’ model (null allele and genotyping failure) fit better for the different localities. Due to the massive Caribbean coral bleaching registered in 2005 (Eakin et al., 2010; Simonti and Eastman, 2010), the evidence of recent bottlenecks was explored with INEST to identify heterozygosity excesses in respect to allelic richness, where the number of alleles reduces faster than heterozygosity under a bottleneck event; and M-ratio deficiencies, which is the mean ratio of allelic richness to allelic size, where the number of alleles is reduced but the size range is constant in the case of a reduction in the population size (Garza and Williamson, 2001; Chybicki and Burczyk, 2009). The analysis was run using the two-phase model (TPM), with default parameters (0.22 proportion of multi-step mutations, 3.1 average multi-step mutation size, 10000 coalescent simulations); then, a Wilcoxon signed-rank test was used to obtain a p-value from the deficiency in M-ratio based on 1000000 permutations.
The Hardy-Weinberg Equilibrium (HWE) was tested with the function “hw.test” of the package “pegas” in R (Paradis, 2010) and then the values were corrected by BH (Benjamini-Hochberg) method in R. To assess the population differentiation in M. auretenra the software STRUCTURE (Pritchard et al., 2000) was used. The program was run using the admixture model, a burn-in time of 100,000 repetitions, 100,000 iterations (MCMC), and 20 replicates per data were carried out (Evanno et al., 2005); the putative K was from 2 to 19, considering an extra cluster from the original number of sampling localities following the protocol from (Riesgo et al., 2019). The data from STRUCTURE was analysed in STRUCTURE HARVESTER to calculate the optimal K by Evanno (Delta K) (Earl and vonHoldt, 2012). Afterwards, using the average of the probabilities for each K cluster, the major and minor best alignments were analysed, and the graphs obtained were visualized with CLUMPAK web server (Kopelman et al., 2015).
A Discriminant Analysis of Principal Components (DAPC) was performed using the “adegenet” package in R (Jombart, 2008), which does not require the assumption that populations are panmictic and allows seeing the grouping of samples based on similarity. The results of the first two principal components obtained under the DAPC analysis were plotted, using Country and Department, allowing 80 principal components for the analysis as determined in the validation step in “adegenet”. Additionally, the samples from Colombia were separately plotted to clarify the country clustering. In this case, and using the Locality information, a principal component plot was created. The validation of 80 principal components was performed running a cross- validation to check the correct assignment of the parameters. In addition, a Principal Coordinates Analysis (PCoA) was performed using “ape” (Paradis and Schliep, 2019) with the null allele corrected pairwise Fst (from FreeNA).
The software BARRIER v2.2 was used to visualise genetic barriers among sampling sites of M. auretenra using a matrix of geographical coordinates vs the Fst distance matrix, applying the Monmonier’s maximum distance algorithm (Manni et al., 2004). Three sets were defined a priori (using the hierarchical disruption data in BARRIER) for the analysis of molecular variance (AMOVA), using GENODIVE v 3.04 (Meirmans and Van Tienderen, 2004), to examine how the variance was explained by the different levels, and the calculation was made with 10,000 permutations from the original data. The sets were defined as: Set 1) No grouping among all localities sampled; Set 2) grouping Curacao and Barbados (Eastern Caribbean and Southern Caribbean, respectively) (CUR_A, CUR_B, CUR_C, CUR_D, DOTT, FISH, FOLK), grouping Albuquerque (ALB) (Colombia) and Guatemala (GUA) (South-western Caribbean and Western Caribbean, respectively) (ALB and GUA), and Colombia (South-western Caribbean) (CT, Rosario, Fuerte, BARU, PG, PB, SJ, VAR, CHENGE); and Set 3), Curacao (CUR_A, CUR_B, CUR_C and CUR_D), Barbados (DOTT, FISH and FOLK), Colombia (CT, Rosario, Fuerte, BARU, PG, PB, SJ, VAR and CHENGE) Albuquerque (ALB), and Guatemala (GUA).
The isolation by distance (IBD) was also tested using the least-cost oceanographic distance between localities using “marmap” in R (Pante and Simon-Bouhet, 2013) with linearized pairwise Fst in a Mantel test for all the localities; in addition a stratified Mantel test (Meirmans, 2012) was performed using the information from BARRIER. A further analysis of population assignment was performed using GENODIVE v 3.04, where a likelihood ratios threshold was calculated using the Monte Carlo test with an alpha (threshold) of 0.002, zero frequencies by a random frequency of 0.005 and 4000 permutations.
Finally, exploratory migration estimates were plotted using divMigrate from the diveRsity R package (Sundqvist et al., 2016). This package shows the relative migration levels between population samples from microsatellite allele frequency data, the analysis considered values over 0.5 values of Gst statistic with a bootstrapping analysis of 100 replicates. However, the migration data here presented are only an exploration as the method is still under validation (Sundqvist et al., 2016; Riesgo et al., 2019).
Results
Seventeen new microsatellite loci were analysed in a total of 313 samples of M. auretenra from 18 localities in the Caribbean. Seven samples identified as clones were eliminated: (Cabo Tiburon (CT) =1; Isla Fuerte (FUERTE) =2; Varadero (VAR) =3 and Folkestone (Folk)=1. The genetic diversity of alleles per locality showed that the number of alleles per locus (Na) ranged from 2.941 (CT) to 6.471 (ALB). The number of effective alleles (NEa) ranged between 1.907 (CT) and 4.103 (ALB); the observed heterozygosity (Ho) ranged from 0.172 (BARU) to 0.459 (CHENGE); the expected heterozygosity (He) ranged from 0.401 (CT) to 0.717 (ALB), and the inbreeding coefficient (FIS) ranged between 0.216 (CHENGE) and 0.711 (BARU) per Locality. The average allelic richness and private allele richness ranged from 2.47 (CT) to 4.48 (ALB) and from 0.03 (Cur_B) to 0.62 (ALB), respectively (Table 1). All the localities presented high values of inbreeding coefficients (FIS) showing the high relation among individuals from the same locality (low signal of random mating). Due to the presence of null alleles, the inbreeding coefficients were estimated in each locality with INEST. The null allele corrected inbreeding coefficients-Avg (Fi) had high frequency among regions, ranging from 0.55 (FOLK) to 0.675 (BARU) (Table 1). The DIC analysis using INEST determined that the “nb model” (null allele and genotyping failure) fitted in the localities of FOLK (Barbados) and CHENGE - VAR in Colombia, indicating that null alleles and genotyping failure without inbreeding coefficients best explain the data in those two localities. The “nfb” (null allele, genotyping failure and inbreeding coefficients) model fitted in the rest of the localities, indicating that inbreeding is a significant component of the model. A Bottleneck effect was interfered based on excess in heterozygosity (under two-phase model: TPM) for the localities of Punta Bota (PB) (p=0.001), Punta Gigante (PG) (p=0.000), Varadero (VAR) (p=0.012), and CHENGE (p=0.041); also, M-ratios along all the localities, except for Albuquerque (ALB) (p = 0.073) in Colombia (Table 1). Significant deviations from Hardy Weinberg Equilibrium (p<0.001) were found in the loci and shown with pink (p<0.05 after BH correction) (Supplementary Material 2D) (Supplementary Table 3). The estimated Fst values with ENA correction for null alleles exhibited a Fst after correction of 0.191 for country level structure, 0.2168 Fst for department level structure and 0.248 Fst for locality level structure. The results for pairwise Fst also showed that the Departments of Cordoba-Bolivar (p=0.06) were particularly similar, while Izabal (Guatemala) and Uraba Chocoano (Colombia) (p= 0.41) were particularly distant (Supplementary Table 4). In more detail, higher similarities between localities from the same Department/Country such as in Curacao (Curacao A- B; p=0.056), and inside Bolivar- Colombia Department’s localities between Punta_Gigante (PG) and Punta Bota (PB) (p=0.032); also between Punta Bota (PB) and Sr Juan (SJ) (p=0.031) were found (Supplementary Table 5).
Table 1
| Locality | Na | Nea | Ho | He | Fis | AR | (SE) | PR | (SE) | Avg (Fi) | 95% HPDI | MODEL nfb | MODEL nb | TPM | M-ratio |
|---|---|---|---|---|---|---|---|---|---|---|---|---|---|---|---|
| GUA | 3.706 | 2.047 | 0.276 | 0.414 | 0.333 | 2.58 | 0.27 | 0.19 | 0.1 | 0.238 | 0.026-0.378 | 1063.029 | 1064.673 | 0.911 | 0.000 |
| ALB | 6.471 | 4.103 | 0.276 | 0.717 | 0.616 | 4.48 | 0.32 | 0.62 | 0.21 | 0.611 | 0.541-0.669 | 1357.600 | 1435.559 | 0.229 | 0.073 |
| CT | 2.941 | 1.907 | 0.289 | 0.401 | 0.28 | 2.47 | 0.25 | 0.08 | 0.06 | 0.178 | 0.019-0.313 | 464.184 | 469.726 | 0.633 | 0.000 |
| FUERTE | 4.059 | 2.428 | 0.241 | 0.576 | 0.581 | 2.50 | 0.14 | 0.13 | 0.06 | 0.552 | 0.457-0.642 | 799.775 | 822.038 | 0.244 | 0.047 |
| ROSARIO | 4.765 | 2.966 | 0.195 | 0.627 | 0.689 | 2.87 | 0.22 | 0.35 | 0.07 | 0.647 | 0.534-0.730 | 698.794 | 737.636 | 0.698 | 0.000 |
| BARU | 3.882 | 2.863 | 0.172 | 0.593 | 0.711 | 3.27 | 0.33 | 0.15 | 0.08 | 0.675 | 0.575-0.761 | 668.031 | 713.787 | 0.095 | 0.000 |
| PB | 4.118 | 3.044 | 0.311 | 0.655 | 0.525 | 3.39 | 0.26 | 0.08 | 0.05 | 0.433 | 0.268-0.567 | 1120.234 | 1125.241 | 0.001 | 0.009 |
| PG | 4.647 | 3.237 | 0.338 | 0.686 | 0.508 | 3.66 | 0.27 | 0.07 | 0.03 | 0.440 | 0.339-0.529 | 1118.098 | 1141.397 | 0.000 | 0.001 |
| SJ | 5.588 | 3.468 | 0.253 | 0.684 | 0.63 | 4.08 | 0.32 | 0.08 | 0.04 | 0.618 | 0.539-0.693 | 1016.042 | 1067.762 | 0.229 | 0.012 |
| VAR | 3.353 | 2.25 | 0.264 | 0.539 | 0.51 | 2.63 | 0.14 | 0.17 | 0.1 | 0.386 | 0.029-0.529 | 1111.470 | 1109.434 | 0.012 | 0.000 |
| CHENGE | 3.882 | 2.597 | 0.459 | 0.585 | 0.216 | 3.16 | 0.21 | 0.08 | 0.03 | 0.071 | 0-0.201 | 846.114 | 845.793 | 0.041 | 0.007 |
| CUR_A | 4.471 | 2.409 | 0.232 | 0.508 | 0.544 | 3.11 | 0.27 | 0.12 | 0.05 | 0.446 | 0.303-0.572 | 1058.139 | 1064.833 | 0.983 | 0.000 |
| CUR_B | 4.059 | 2.22 | 0.225 | 0.508 | 0.557 | 3.02 | 0.18 | 0.03 | 0.01 | 0.523 | 0.405-0.609 | 886.258 | 916.239 | 0.934 | 0.000 |
| CUR_C | 4.176 | 2.462 | 0.231 | 0.513 | 0.551 | 3.08 | 0.28 | 0.26 | 0.09 | 0.502 | 0.407-0.585 | 1102.953 | 1125.628 | 0.858 | 0.001 |
| CUR_D | 3.765 | 2.146 | 0.177 | 0.455 | 0.611 | 2.76 | 0.24 | 0.12 | 0.06 | 0.537 | 0.425-0.633 | 965.029 | 992.871 | 0.920 | 0.001 |
| DOTT | 4.765 | 2.315 | 0.334 | 0.532 | 0.372 | 3.09 | 0.2 | 0.13 | 0.05 | 0.055 | 0-0.2078 | 1634.550 | 1631.069 | 0.888 | 0.000 |
| FISH | 5.471 | 2.97 | 0.229 | 0.6 | 0.618 | 3.57 | 0.28 | 0.17 | 0.06 | 0.579 | 0.52-0.66 | 1943.413 | 1999.872 | 0.693 | 0.000 |
| FOLk | 4.824 | 2.912 | 0.337 | 0.585 | 0.425 | 3.36 | 0.29 | 0.17 | 0.1 | 0.225 | 0-0.353 | 1532.961 | 1537.817 | 0.138 | 0.002 |
Genetic diversity for M. auretenra in different localities through the Caribbean.
Na, Number of alleles; NEa, number of effective alleles; Ho, observed heterozygosity; He, expected heterozygosity; FIS, inbreeding coefficient; AR, mean rarefied allelic richness; PR, mean rarefied private allelic richness; SE, standard errors. Corrected inbreeding coefficient (Avg Fi), 95% highest posterior density intervals (95% HPDI), DIC values for the NFB model (null alleles, inbreeding coefficients, and genotyping failures), DIC values for the NB model (null alleles and genotyping failures). (TPM) Two-Phase Model, Test for the excess in heterozygosity -Wilcoxon signed – rank test, in bold significant heterozygosity excess. (M-ratio) M- ratio deficiency p-value bottleneck effect, in bold M-ratio deficiency found. In bold the higher and lower values.
The optimal K (delta K) by STRUCTURE HARVESTER was 11, followed by K= 9 (Supplementary Material 3A-C). Considering a K of 11 the clusters were: cluster 1 (orange): GUA; cluster 2 (yellow): ALB; cluster 3 (brown): Cabo Tiburon – CT and part of the sampling for FUERTE; cluster 4 (blue): part of the sampling for FUERTE, ROSARIO, some individuals from BARU, PG, SJ and a few from VAR; cluster 5 (grey): some individuals from BARU, PB, PG, SJ and a few individuals from ROSARIO and FOLK; cluster 6 (soft yellow): PB, PG, some individuals from SJ and BARU; cluster 7 (soft blue): VAR; cluster 8 (pink): CHENGE; cluster 9 (purple): CUR_A, CUR_B, some sampling for CUR_C and CUR_D; cluster 10 (red): some individuals from CUR_C and CUR_D, also a few from CUR_A and CUR_B; and cluster 11 (green): DOTT, FISH and FOLK (Figure 1). In the case of K= 9, the separation of ALB and CT was not detected, mixing the sampling of ALB, CT, FUERTE, ROSARIO, BARU, PB, PG and SJ. However, the cluster of Varadero (VAR) is still notable (Supplementary Material 3B). Six a priori barriers were selected in BARRIER in order of importance: “a”, separating the Curacao and Barbados localities from Colombia and Guatemala; “b”, between Curacao and Barbados localities; “c”, isolating Cabo Tiburon (CT) from the others; “d”, between Guatemala (GUA) and Albuquerque (ALB); “e”, separating CHENGE from the rest of the localities in Colombia; and “f”, separating Varadero (VAR) from BARU, PB, PG and SJ (Figure 2).
Figure 1
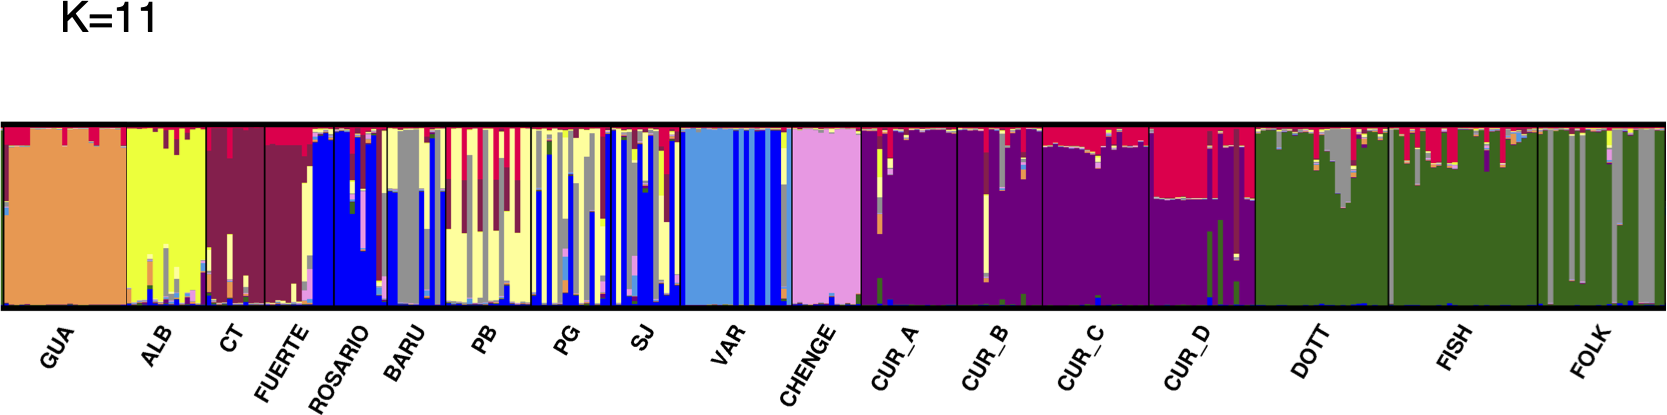
Clusters of M. auretenra in the Caribbean Sea. It shows the individual membership coefficients for M. auretenra to the clusters (K) as inferred by STRUCTURE for all studied sites with K= 11.
Figure 2
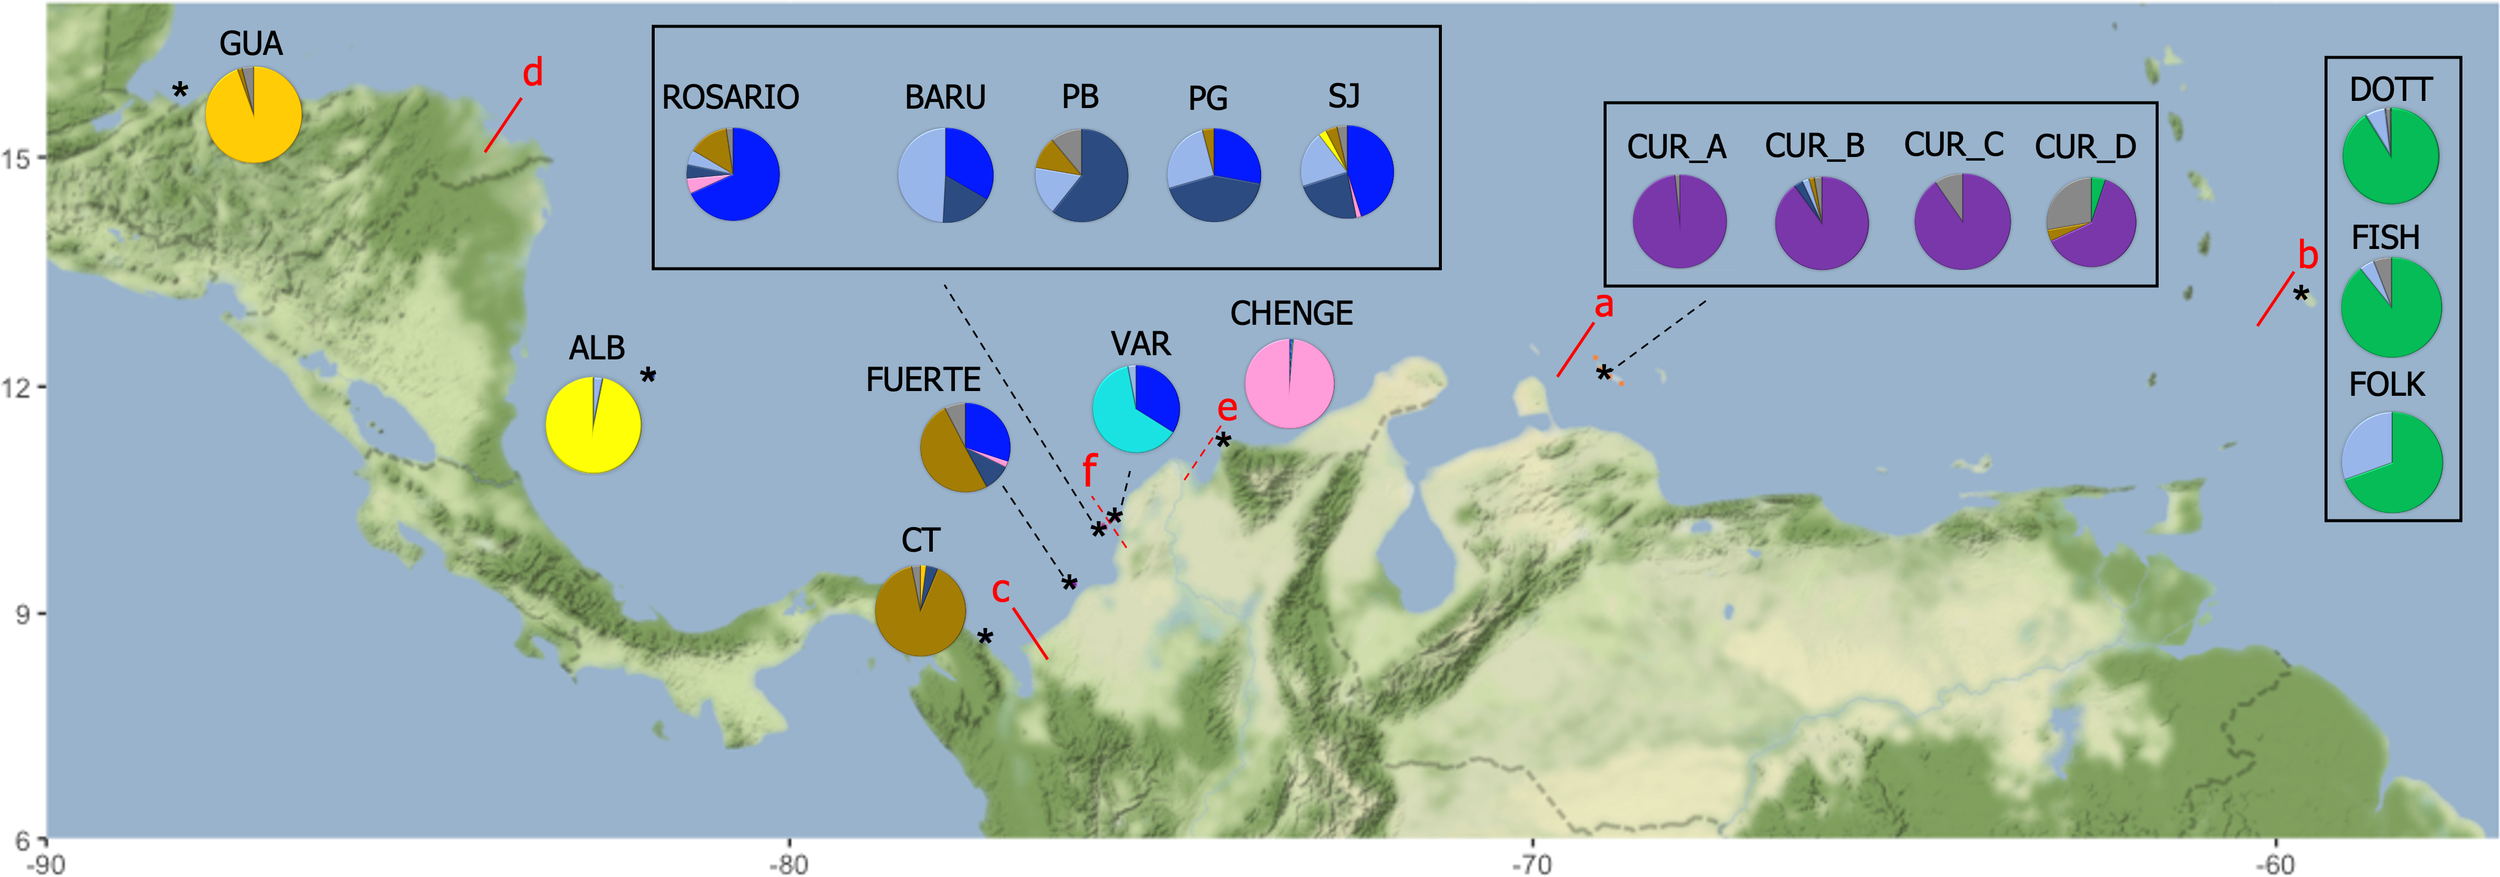
Percentage of individuals assigned to each of the 11 clusters (pie frequency charts). The colours were assigned following the result from STRUCTURE HARVESTER. The red lines illustrate the disruptions (barriers) detected by BARRIER ranked from “a” to “f” in order of importance. The symbol * means an approximated location of sampling.
The DAPC by Country and Department (Supplementary Material 4A, B) showed a clear grouping using the first two principal components in samples from Barbados, Curacao, Guatemala and localities from Bolivar and Cordoba from Colombia (Figure 3). A further DAPC was performed for Colombian samples only, due to the high number of localities compared with the other countries (Supplementary Material 4C); which showed Albuquerque (ALB), Cabo Tiburon (CT) and Varadero (VAR) as the most isolated localities. In contrast, there was evident mixing among the localities from SJ, Punta Gigante (PG), Punta Bota (PB) and Isla Fuerte (FUERTE), all from the departments of Bolivar and Cordoba in Colombia (Figure 3). The PCoA showed similar patterns to the DAPC, with a clear grouping by Country (Guatemala and Curacao different from Colombia and Barbados) and by Departments (Supplementary Material 5A). A closer analysis for the localities in Colombia showed isolation of the localities of ALB (SAI), CT (Uraba Chocoano), and VAR (Bolivar) (Supplementary Material 5B, C).
Figure 3
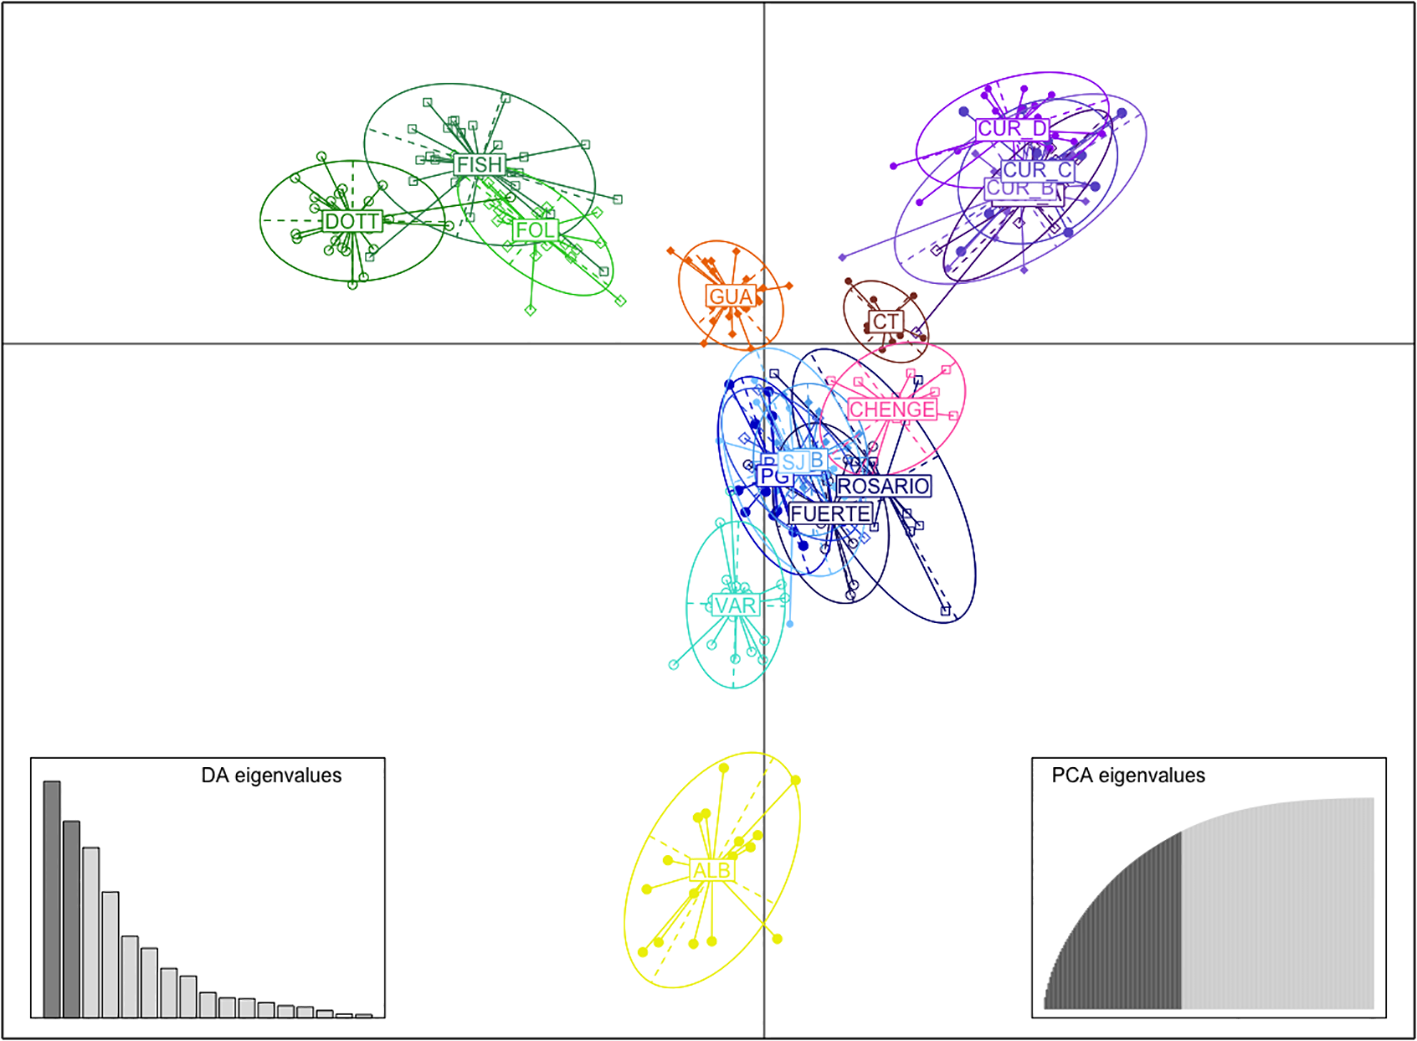
DAPC using the first two principal components by localities; GUA, Guatemala, ALB, Albuquerque-Seaflower Reserve, CT, Cabo Tiburon, FUERTE, Isla Fuerte, ROSARIO, Corales del Rosario, BARU, Barú, PB, Punta Bota, PG, Punta Gigante, SJ, Sr. Juan, VAR, Varadero, CHENGE, Chenge, CUR_A, Curacao point A, CUR_B, Curacao point B, CUR_C, Curacao point C, CUR_D, Curacao-CARMABI Marine Research Centre, DOTT, Dottins, FISH, Fisherman, FOLK, Folkstone Marine Reserve.
The different AMOVA analyses were significant in all the sets, but the highest percentage of variance explained among the groups used was for the set 3), which included five groups, Curacao (CUR_A, CUR_B, CUR_C and CUR_D), Barbados (DOTT, FISH and FOLK), Colombia (CT, ROSARIO, FUERTE, BARU, PG, PB, SJ, VAR and CHENGE), Albuquerque (ALB), and Guatemala (GUA) with 17.6%. However, in all cases the variation was found among individuals with A = 3.68%, B = 3.56%, and C = 3.52% (Table 2).
Table 2
| 1. All localities, no grouping | ||||||
| Source of Variation | %var | F-value | Std. Dev. | c.i.2.5% | c.i.97.5% | P-value |
| Within Individual | 0.347 | 0.653 | 0.051 | 0.554 | 0.746 | – |
| Among Individual | 0.368 | 0.515 | 0.058 | 0.403 | 0.623 | 0.000 |
| Among Population | 0.286 | 0.286 | 0.03 | 0.232 | 0.344 | 0.000 |
| 2. Curacao - Barbados vs. Colombia vs. Albuquerque - Guatemala | ||||||
| Source of Variation | %var | F-value | Std. Dev. | c.i.2.5% | c.i.97.5% | P-value |
| Within Individual | 0.335 | 0.665 | 0.05 | 0.565 | 0.754 | – |
| Among Individual | 0.356 | 0.515 | 0.058 | 0.404 | 0.622 | 0.000 |
| Among Populat ion | 0.219 | 0.241 | 0.027 | 0.191 | 0.295 | 0.000 |
| Among groups | 0.09 | 0.09 | 0.013 | 0.066 | 0.115 | 0.000 |
| 3. Curacao vs. Barbados vs. Colombia vs. Albuquerque VS. Guatemala | ||||||
| Source of Variation | %var | F-value | Std. Dev. | c.i.2.5% | c.i.97.5% | P-value |
| Within Individual | 0.335 | 0.667 | 0.05 | 0.568 | 0.760 | – |
| Among Individual | 0.352 | 0.515 | 0.058 | 0.404 | 0.623 | 0.000 |
| Among Population | 0.139 | 0.169 | 0.015 | 0.143 | 0.197 | 0.000 |
| Among groups | 0.176 | 0.176 | 0.032 | 0.117 | 0.237 | 0.000 |
Results of AMOVA. Variance for M. auretenra using two different groupings.
1) all localities without grouping, 2) Three groups, Curacao- Barbados vs. Colombia vs. Albuquerque – Guatemala. And 3) five groups, Curacao vs. Barbados vs. Colombia vs. Albuquerque vs. Guatemala. Significant p-values appear in bold letters.
The isolation by distance (IBD) for the sampling localities in the Caribbean was significant (P value = 0.003; r2 = 0.237) (Supplementary Material 6A). However, after performing the stratified Mantel test using the disruptions identified by BARRIER, marginally significant IBDs were found only in Curacao samples (barrier a; A, B, C and D [r2 = 0.690, p = 0.049]). In contrast, no significant IBD was found in the cluster of Barbados samples (barrier b; DOTT, FISH and FOLK [r2 = 0.417, p = 0.321]) or Colombia ([r2 = 0.135, p = 0.161]).
The population assignment analysis in GENODIVE suggested localities GUA, CT and CHENGE had no migrants among their individuals. However, last generation migrants were found from South-western Caribbean (PB) in Southern Caribbean (CUR_B) and from South-western Caribbean (ALB) in Eastern Caribbean (FOLK) (Supplementary Material 7A). Migration patterns were found among localities and among populations inside Curacao with a higher value between CUR_B to CUR_A (1), followed by Bolivar and Cordoba departments in Colombia, PB to SJ, respectively (0.82) and Barbados, FOLK to FISH (0.67); no migration was found in the areas ALB, CT, VAR, CHENGE and GUA (Figure 4).
Figure 4
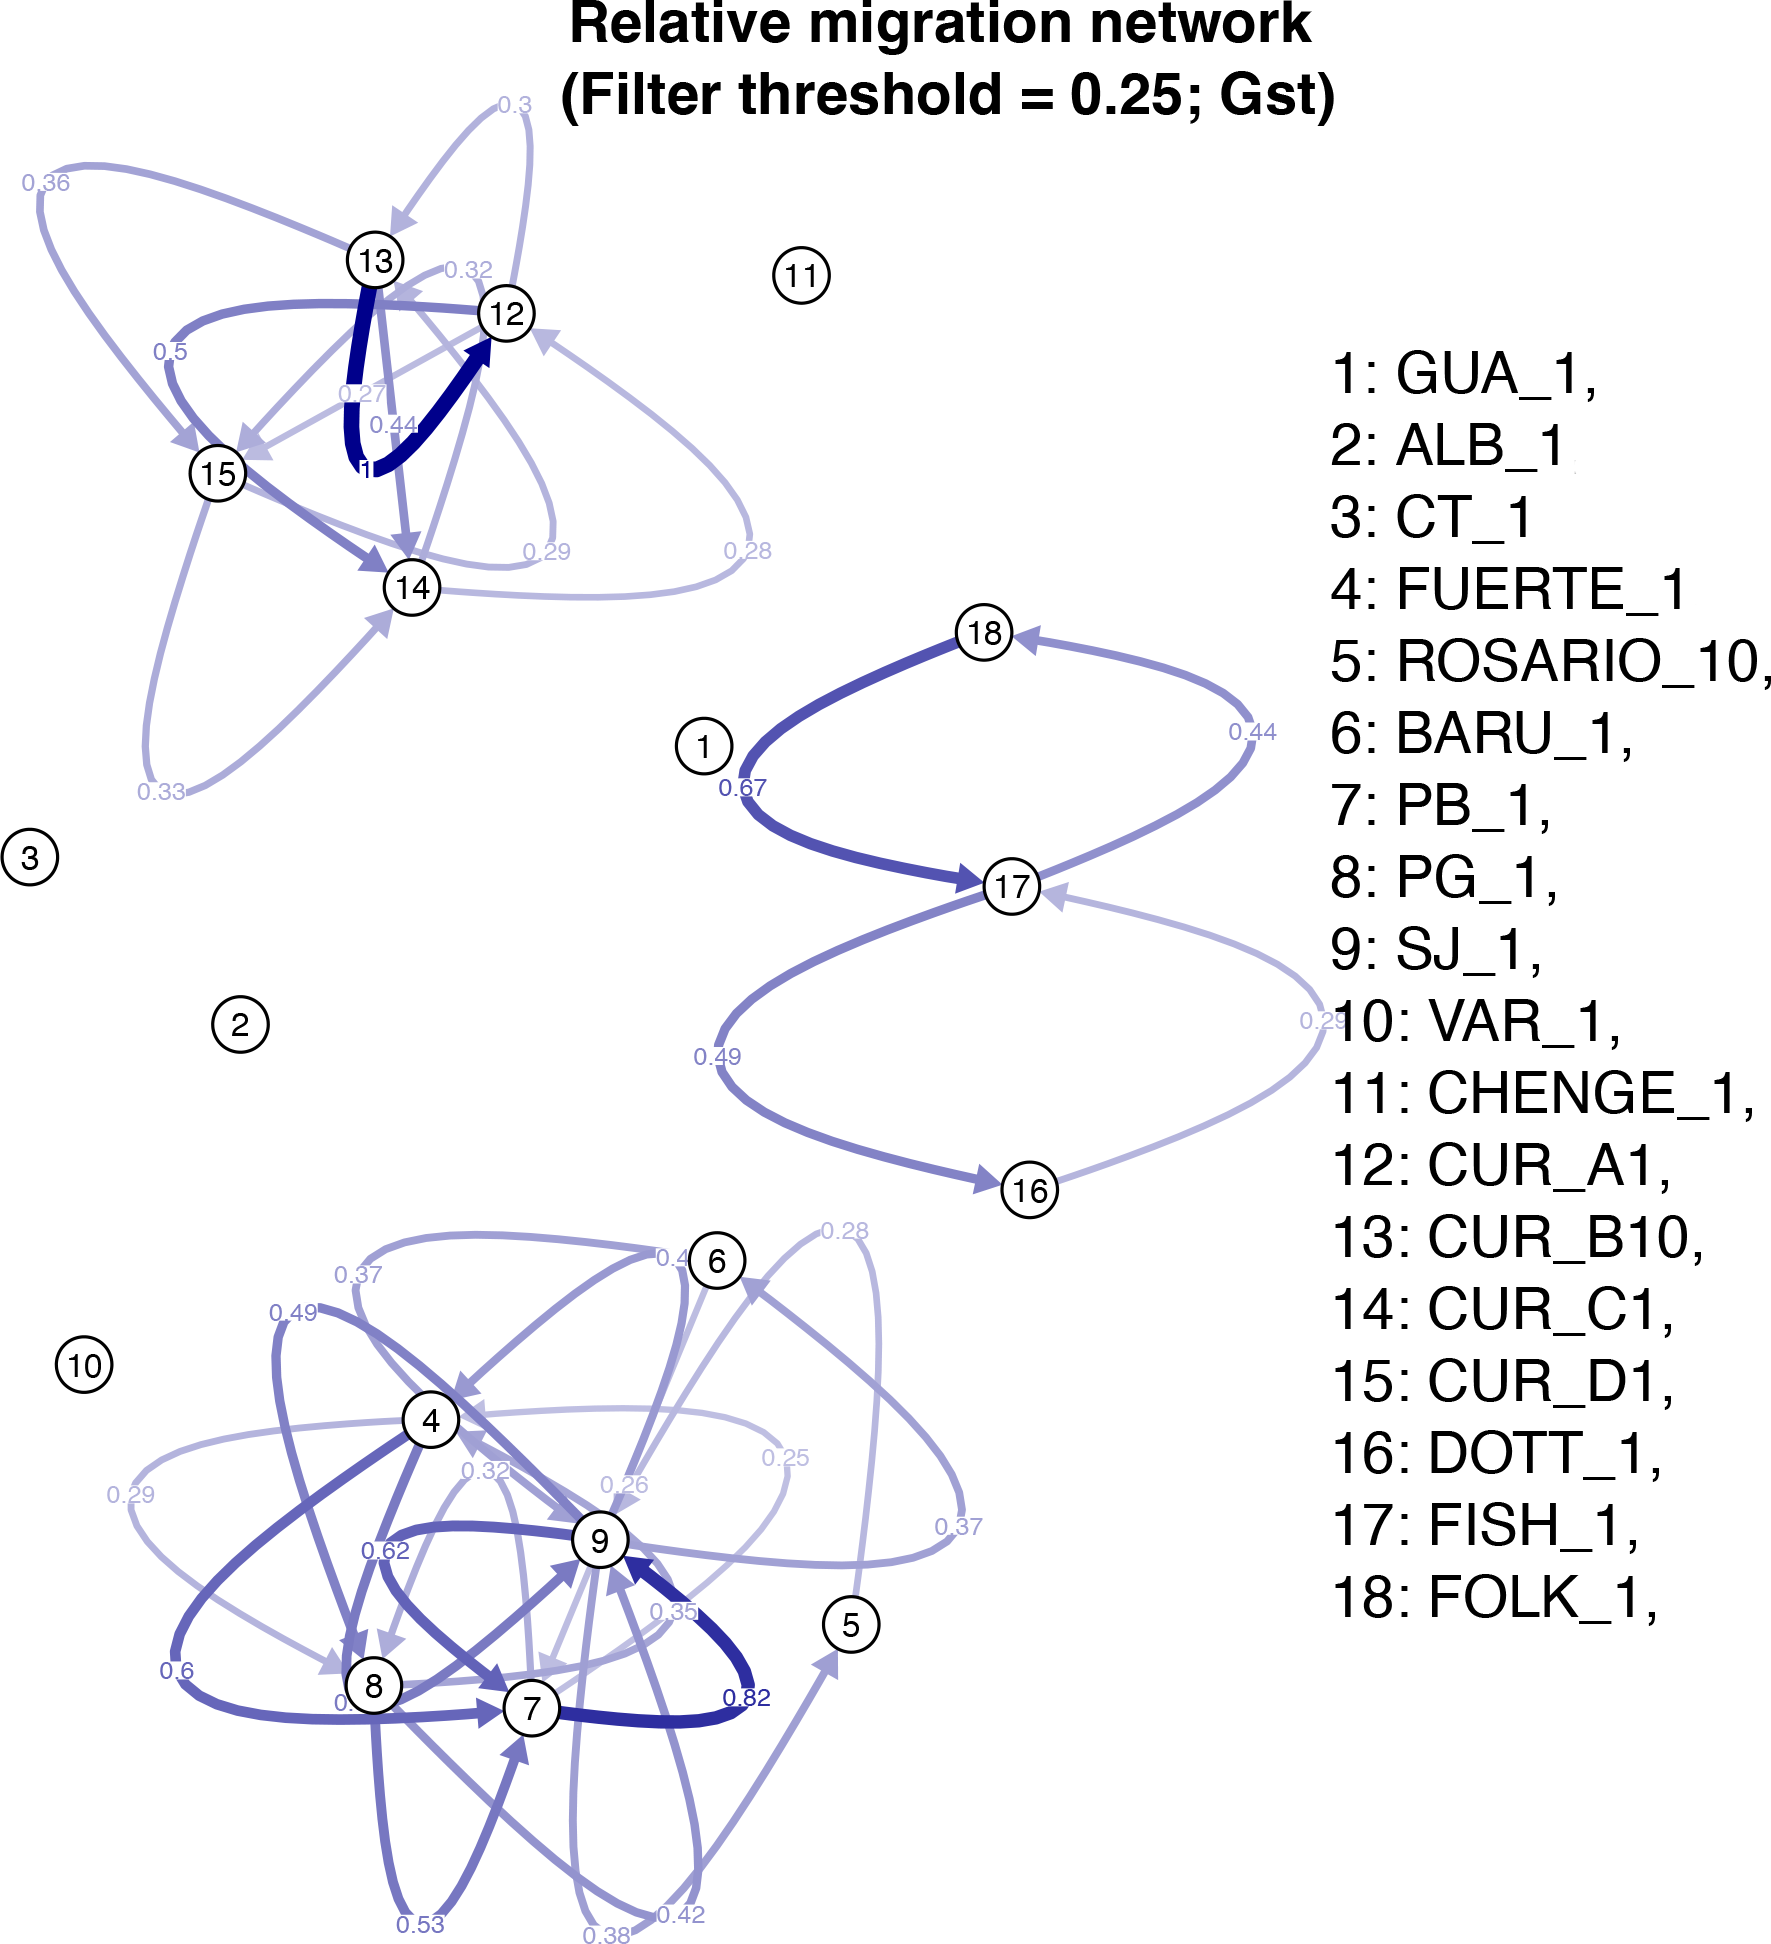
Relative migration among the different localities of M. auretenra in the Caribbean Sea.
Discussion
In this study, analyses were performed to explore genetic diversity, population differentiation, and disruption localisation in the Caribbean to assess the population structure of M. auretenra. Results revealed a significant differentiation and a clear clustering among the samples inside of Curacao (CUR_A, CUR_B, CUR_C, CUR_D), Barbados (DOTT, FISH, FOLK), within localities from Bolivar (SJ, PG, BARU, PB), and within localities from Bolivar and Cordoba (Isla Fuerte and Isla Rosario, respectively). In contrast, some populations as Guatemala (GUA), Albuquerque (ALB), Varadero (VAR), Cabo Tiburon (CT), and CHENGE were individually clustering as isolated populations.
The genetic diversity value (Na [2.9 – 6.5], Ho [0.4 – 0.7], AR [2.5 – 4.5]) ranges were similar to reports for other species such as the octocoral Pseudopterogorgia elisabethae (Gutiérrez-Rodríguez and Lasker, 2004), the Scleractinian coral Acropora sp. (Vollmer and Palumbi, 2002; Hemond and Vollmer, 2010) and other Madracis (Benzoni et al., 2018) in the Caribbean. The significant inbreeding present in the majority of localities sampled can be explained by the presence of null alleles, larval dispersion and settlement (Addison and Hart, 2005; Sherman, 2008). Null alleles are common in microsatellite loci with large heterozygotes deficits (FIS and DIC in our data), and in some cases they may represent a weak effect when more alleles of that type are involved (Maier et al., 2005). As the occurrence of null alleles can complicate detection of populations with inbreeding (Falush et al., 2007), ENA corrected values were used from FreeNA.
Significant results for bottleneck effects were found in almost all the localities using M-ratio deficiencies. The M-ratio may be more sensitive to detect bottleneck effects (in most cases does not suffer as many type II errors) than the excess of heterozygosity test (heterozygosity given the number of alleles) (Girod et al., 2011). The localities Punta Bota (PB), Punta Gigante (PG), Varadero (VAR) and CHENGE which were identified as isolated, exhibited a genetic bottleneck based on TPM and M- ratio values. These areas have been reported to have large mortalities and “regular” condition under the trend condition indicator in coral areas (Indicador de Condicion tendencia de areas coralinas -ICTac) (Gómez-López et al., 2019); also, the presence of white band disease and bleaching on M. auretenra colonies have been reported (Navas-Camacho et al., 2010).
The genetic bottleneck found and the evidence of previous mortalities in the Caribbean coral reefs, can lead to a loss of genetic diversity. This, combined with the reproductive strategy of self-fertilization may create vulnerability in these populations (Mumby and Harborne, 2010; Chong-Seng et al., 2014). However, this strategy can provide reproductive assurance under gamete limitations (Sherman, 2008). Other authors also suggest that self- fertilization or asexual reproduction may be favoured in case of re-colonisation to extend the geographic range of the organism (Pannell et al., 2015), as supported by a meta-analysis (Grossenbacher et al., 2015).
The deviation from Hardy Weinberg Equilibrium (HWE) was found within loci and localities, features that can be the result of population subdivision (Wahlund effect) (Crooks and Sanhayan, 2006). Nevertheless, the occurrence of null alleles (Le Goff-Vitry et al., 2004) and inbreeding (Sherman, 2008) in our results, may explain the HWE deviation observed. Similarly, HWE deviation has been found in other Scleractinian corals such as Pocillopora damicornis, Montastrea cavernosa and Porites astreoides (Ayre et al., 1997; Shearer and Coffroth, 2004), where fragmentation and the presence of clones, promotes deviation from HWE (Nakajima et al., 2016).
The Fst values showed high genetic differentiation and population structure among populations from Guatemala, Colombia, Curacao and Barbados, with a significant genetic differentiation by department and locality (>0.15) according to values in Crooks and Sanhayan (2006). In addition, the clustering approach with K-means by STRUCTURE, DAPC and PCoA agreed with the Fst distances, showing a clear separation using a k=11, following similar patterns of population structure for Scleractinian corals in the Atlantic (Goodbody-Gringley et al., 2012), where significant comparisons among locations indicate that the gene flow may be limited over large geographic distances. Additionally, the AMOVA analysis confirmed the geographical differentiation through the Caribbean, using the main barriers identified in the software BARRIER, with the empirical and modelled gene flow for the Caribbean by Foster et al. (2012) and Sturm et al. (2020). The clustering and barriers identified in the present study have similar patterns to the oceanographic model prediction for Acropora cervicornis, or Gorgonia ventalina, with a clear clustering for these populations in the Caribbean (Galindo et al., 2006; Andras et al., 2013).
Although isolation by distance (IBD) was observed among the localities sampled in the Caribbean (P value = 0.001; r2 = 0.237), under the stratified Mantel test (by disruptions identified in BARRIER) IBD was not present; similar to other corals such as Lophelia pertusa (Le Goff-Vitry et al., 2004) and Seriatopora hystrix (Maier et al., 2005). This result can suggest that specific disruptions (barriers) had a major role in the genetic diversity distribution. In more detail, the clustering in Curacao could be influenced by the main disruption found with BARRIER (disruption= a, Figure 3). This disruption may be explained by strong coastal upwelling (ascendant movements of colder and salty sub-shallow waters) (Alvarez-León et al., 1995), a consequence of strong winds on the surface that are parallel to the coast (Andrade et al., 2003). Also, the eastern Caribbean brake in the Mona’s passage, slip winds along NE-SW from Puerto Rico to Guajira Peninsula- Colombia, which are influenced by the Magdalena river (Baums et al., 2006a; Betancur-R et al., 2011) could have an effect in the clustering found for Curacao samples (Southern Caribbean). The clustering of Barbados, could be explained by the disruption “b” (Figure 3); which matched with the Caribbean Current (dominant surface current in the area and associated with the production of eddies that travel along the Caribbean) (Andrade and Barton, 2000) and the directional relative migration, similarly reported in Acropora palmata and Gorgonia ventalina (Baums et al., 2005; Baums et al., 2006b; Andras et al., 2013). The disruption “d” matched with the isolation in the Guatemala population; that could, with the strong (170 cm s-1) Yucatan current present in this area, and the dominance of the Honduras gyre, isolate the population of the western Caribbean region from the South-western Caribbean region (Sheng and Tang, 2003).
The currents in the Colombian Caribbean are influenced by the trade winds, the Panama- Colombia Counter-current (PCC) and the Panama- Colombia Gyre (PCG) (Andrade, 2001; INVEMAR & ANH, 2010). In addition, the seasonality observed during the year (ITCZ) could facilitate the gene flow and migration in the samples for Colombia. We hypothesise that this has a particularly high influence in the connectivity between Cordoba and Bolivar (Isla Fuerte, Isla Rosario, BARU, PB, PG and SJ), as was evident in the analysis of Fst, DAPC, PCoA, and STRUCTURE. Gene flow found here could be facilitated by the reproductive characteristics of M. auretenra, as a quick planulae releaser after fertilization, where the presence of zooxanthellae and nutrients in the planulae, increase the chances to move and settle in different areas (Vermeij et al., 2004; Hauff et al., 2016). This mechanism is similarly reported for Scleractinians such as Agaricia sp. and Pocillopora sp. (Carlon and Olson, 1993; Gaither and Rowan, 2010). In comparison, some populations, enclosed by bays with low circulation patterns (lower influence of the PCC) such as the Uraba Chocoano (CT) (disruption “c”) and Magdalena (CHENGE) (disruption “e”), showed isolation patterns. Similar genetic structure patterns were found in Lutjanus synagris, where physical barriers (Atrato River) from Uraba Chocoano isolate the populations (Landínez-García et al., 2009). Likewise, the sedimentation from the Magdalena river discharges (Foster et al., 2012) and the abrupt break in the coastal shelf by the Santa Marta Massif (Sierra Nevada de Santa Marta with an elevation of 5800m), create a place of cold up-welling waters (Betancur-R et al., 2010), likely working as a gene flow barrier as well.
The clustering found in Varadero (VAR) shows a limitation in the larvae and coral fragments dispersion, despite the closeness with the other populations (BARU, PB, PG and SJ). The disruption “f” was identified as a barrier among these localities, an area which is described as a particularly highly polluted system (industrial and sewage waste), with high sedimentation and elevated influence of the Magdalena river freshwater income in VAR (Santodomingo et al., 2013). However, the apparently healthy reef in Varadero is one of the few cases where atypical reef ecosystems can be found (Pizarro et al., 2017). Similarly, the locality of Albuquerque (ALB), which belongs to the Seaflower Reserve (Marine Protected Area) in the Caribbean region, showed an isolation from the continental sampling, influenced possibly by PCG, along with the cyclones, anticyclones and eddies, which could work as a barrier creating a disruption between Albuquerque and the continental reefs (Andrade et al., 1996; CORALINA-INVEMAR, 2012). Both localities include stressors in the area such as freshwater streams in Varadero (Pizarro et al., 2017) and sanitary landfill discharges in Albuquerque (Bernal-Sotelo et al., 2019), which can increase the sedimentation and nutrients in the water, leading to the loss of populations by unbalancing the interaction between coral and resident microbial flora (Bruno et al., 2003; Harvell, 2007). However the healthy reef described in Varadero (Pizarro et al., 2017) and the high allelic richness (4.48) in Albuquerque, could indicate a high potential for adaptability and persistence in the long term (Greenbaum et al., 2014).
The population assignment analysis in GENODIVE showed a possible gene flow among enclosed sampling areas of Barbados, Curacao and Bolivar-Cordoba in Colombia, with similar results to the relative migration by divMigrate. The presence of cyclones and anticyclones, in these areas between July and October, could have an important function in the mechanism of expulsion and transport of larvae in nearby localities (Andrade et al., 1996); due to the presence of oocytes and spermaries in M. auretenra during the rainy seasons (September-October) (Vermeij et al., 2004). Last generation migrants were also inferred between PB - CUR_B and ALB – FOLK. Although it is possible that currents and storms contribute to the dispersion of fragments and planulae at larger scales (Lirman, 2000; Mercado-Molina et al., 2014), offering an expansion of the organisms and the establishment of new populations (Highsmith, 1982), as in some reef fishes (Shulman and Bermingham, 1995; Betancur-R et al., 2011); however, these exploratory results need to be treated with caution, as migration estimation by these tools is uncertain, and this flow pattern is not supported by other results.
Interestingly, areas with high relative migration belong to MPAs. Some examples include within Bolivar and Cordoba areas the “Corales del Rosario, San Bernardo and Isla Fuerte MPA”, within Cur_D the “CARMABI Marine Research centre” and, within Folkstone (FOLK) the “Folkestone Marine Reserve”. These results reinforce the importance of the management and design of reservoirs (MPAs) for coral reef ecosystems, facilitating the exchange of organisms between corridors from the same area. Areas including Albuquerque (ALB) (“Seaflower Reserve”) and CHENGE (Tayrona National Natural Park), identified as isolated locations, show a high coral coverage, suggesting that the implementation of MPAs may maintain the reproductive capacity and exportation of larvae among different habitats (Gómez-López et al., 2019). However, and despite the high coral coverage in these MPAs (Albuquerque and Chenge), the increase of macroalgae and the low biomass value of carnivore fish in both MPAs show the evident reef deterioration in recent years (Gómez-López et al., 2019). Similarly, coral reefs in Guatemala (“Marine wild reserve Punta Manabique”) exhibit an outstanding degraded health grade (Díaz-pérez et al., 2016). The isolation of the areas identified in this study, combined with challenges previously reported, reinforces the need to improve the management on these reserves (MPAs) along with a constant monitoring, not only for M. auretenra, but also for other species within the coral reef ecosystems. Further understanding of coral reef resilience, through future studies of ecology, conservation and restoration activities, may help to mitigate the effects of climate change in the Caribbean region.
Acknowledgments
The authors thank The Colombian institute for Marine and Coastal Research-INVEMAR, in particular to the Marine Natural History Museum of Colombia (MHNMC) and Cristina Cedeño for their support with sample transportation, to David Alonso (Head of Biodiversity and Marine ecosystems Program) for the logistics and academic support, to Raul Navas-Camacho and all members of ODI (Organization and Dynamics of Ecosystems) for the logistics and sampling. The authors also thank the sequencing team at The University of Manchester, the Ecological Genetics Group and the Ecology and the Environment Research Centre-EERC at Manchester Metropolitan University, specially Alejandra Zamora and Sarah Griffiths, for their support with the molecular analysis. To the Core Genomics Facility at the University of Sheffield for their support with the sequencing analyses. To Dr Nadia Santodomingo, Dr Mark Vermeij and CARMABI Marine Research for the sampling and exportation of M. auretenra samples from Curacao. To the CONAP- Refugio de Vida Silvestre Punta Manabique- Guatemala, specially Juan Carlos Hernandez Montesflores and Hendric Acevedo for the sampling logistics. To the NGOs Corales de Paz and Blue Indigo, and the Seaflower Research expedition (Phanor Montoya, Maria Fernanda Maya, David Barrios, Santiago Estrada, Danielle Florio, and Alfredo Colmenares) for the sampling logistics. To Carlos Gilkes and the entire member staff at Folkestone Marine Reserve in Barbados for their collaboration with sampling and exportation permits. To Dr Thomas Bleazard and Professor James Mair for their helpful comments on the manuscript. To the Ministry of Environment and Sustainable Development (Colombia- National Authority of Environmental Licenses (ANLA) for their support with the export permits. This study was partially supported by INVEMAR-Colombia, Parques Nacionales Naturales de Colombia and Manchester Metropolitan University-UK. This project was sponsored by COLCIENCIAS fellowship 679 (Doctorados Exterior).
Publisher’s note
All claims expressed in this article are solely those of the authors and do not necessarily represent those of their affiliated organizations, or those of the publisher, the editors and the reviewers. Any product that may be evaluated in this article, or claim that may be made by its manufacturer, is not guaranteed or endorsed by the publisher.
Statements
Data availability statement
The original contributions presented in the study are included in the article/Supplementary Material, further inquiries can be directed to the corresponding author/s.
Author contributions
DB-C supported the following processes: experimental design of the work, design of primers, sample collection in the field, acquisition of data in the laboratory, optimization of protocols, data analysis, and writing up and editing of document. LB supported the following processes: experimental design of the work, design of primers, sample collection in the field, optimization of protocols, data analysis, and writing up and editing of document. RP supported the following processes: experimental design of the work, data analysis, funding, and editing of document. All authors contributed to the article and approved the submitted version.
Conflict of interest
The authors declare that the research was conducted in the absence of any commercial or financial relationships that could be construed as a potential conflict of interest.
Supplementary material
The Supplementary Material for this article can be found online at: https://www.frontiersin.org/articles/10.3389/fmars.2022.840730/full#supplementary-material
References
1
Addison J. A. Hart M. W. (2005). Spawning, copulation and inbreeding coefficients in marine invertebrates. Biol. Lett.1, 450–453. doi: 10.1098/rsbl.2005.0353
2
Alberto F. (2013). MsatAllele_1.0: An r package to visualize the binning of microsatellite alleles. J. Hered.100, 394–397. doi: 10.1093/jhered/esn110
3
Alonso D. Barbosa H. Duque M. Gil I. Morales M. Navarrete S. et al . (2015). Conceptualización del subsistema de Áreas marinas protegidas en Colombia (Santa Marta, Colombia: Serie de Publicaciones Generales del Invemar).
4
Alonso D. Ramírez L. F. Segura- Quintero C. Castillo-Torres P. Diaz J.M. Walschburger T. (2008). Prioridades de conservación in situ para la biodiversidad marina y costera de la plataforma continental del Caribe y Pacífico colombiano. (Santa Marta, Colombia: Instituto de Investigaciones Marinas y Costeras INVEMAR, The Nature Conservancy-TNC y Unidad Administrativa Especial del Sistema de Parques Nacionales Naturales-UAESPNN). 20p.
5
Alvarez-León R. Aguilera-Quinonez J. Andrade C. A. Nowak P. (1995). Caracterizacion general de la zona de surgencia en la guajira colombiana. Rev. la Acad. Colomb. Cienc.19, 679–694.
6
Andrade C. A. (2001). Las corrientes superficiales en la cuenca de Colombia observadas con boyas de deriva. Rev. Acad. Colomb. Cienc.25, 321–335.
7
Andrade Amaya C. A. (1993). Análisis de la velocidad del viento en el mar caribe. Boletín Científico CIOH13, 33–44. doi: 10.26640/22159045.53
8
Andrade C. A. Barton E. D. (2000). Eddy development and motion in the Caribbean Sea. J. Geophys. Res. Ocean105, 26191–26201. doi: 10.1029/2000jc000300
9
Andrade C. A. Barton E. D. Mooers C. N. K. (2003). Evidence for an eastward flow along the central and south American Caribbean coast. J. Geophys. Res. C Ocean108, 16–11. doi: 10.1029/2002jc001549
10
Andrade C. A. Giraldo L. Lonin S. (1996). Nota sobre la circulación de las aguas en el bajo Alicia y el sector de San andrés islas. Boletín Científico CIOH1727–36. doi: 10.26640/22159045.82
11
Andras J. P. Rypien K. L. Harvell C. D. (2013). Range-wide population genetic structure of the Caribbean sea fan coral, Gorgonia ventalina. Mol. Ecol.22, 56–73. doi: 10.1111/mec.12104
12
Arnaud-Haond S. Duarte C. M. Alberto F. Serrão E. A. (2007). Standardizing methods to address clonality in population studies. Mol. Ecol.16, 5115–5139. doi: 10.1111/j.1365-294X.2007.03535.x
13
Ayre D. J. Hughes T. P. Standish R. J. (1997). Genetic differentiation, reproductive mode, and gene flow in the brooding coral Pocillopora damicornis along the great barrier reef, Australia. Mar. Ecol. Prog. Ser.159, 175–187. doi: 10.3354/meps159175
14
Baco A. R. Etter R. J. Ribeiro P. A. von der Heyden S. Beerli P. Kinlan B. P. (2016). A synthesis of genetic connectivity in deep-sea fauna and implications for marine reserve design. Mol. Ecol.25, 3276–3298. doi: 10.1111/mec.13689
15
Ballesteros-Contreras D. C. (2020). Connectivity and resilience of coral reef ecosystems. [Thesis].
16
Baums I. B. Miller M. W. Hellberg M. E. (2005). Regionally isolated populations of an imperiled Caribbean coral, Acropora palmata. Mol. Ecol.14, 1377–1390. doi: 10.1111/j.1365-294X.2005.02489.x
17
Baums I. B. Miller M. W. Hellberg M. E. (2006a). Geographic variation in clonal structure in a reef-building Caribbean coral, Acropora palmata. Ecol. Monogr.76, 503–519. doi: 10.1890/0012-9615(2006)076[0503:GVICSI]2.0.CO;2
18
Baums I. B. Paris C. B. Chérubin L. M. (2006b). A bio-oceanographic filter to larval dispersal in a reef-building coral. Limnol. Oceanogr.51, 1969–1981. doi: 10.4319/lo.2006.51.5.1969
19
Benzoni F. Arrigoni R. Berumen M. L. Taviani M. Bongaerts P. Frade P. R. (2018). Morphological and genetic divergence between Mediterranean and Caribbean populations of Madracis pharensis (Heller 1868) (Scleractinia, pocilloporidae): Too much for one species? Zootaxa4471, 473–492. doi: 10.11646/zootaxa.4471.3.3
20
Bernal-Sotelo K. Acosta A. Cortés J. (2019). Decadal change in the population of Dendrogyra cylindrus (Scleractinia: Meandrinidae) in old providence and st. Catalina islands, Colombian Caribbean. Front. Mar. Sci.5. doi: 10.3389/fmars.2018.00513
21
Betancur-R R. Arturo Acero P. Duque-Caro H. Santos S. R. (2010). Phylogenetic and morphologic analyses of a coastal fish reveals a marine biogeographic break of terrestrial origin in the southern Caribbean. PloS One5, 1–10. doi: 10.1371/journal.pone.0011566
22
Betancur-R R. Hines A. Arturo A. P. Orti G. Wilbur A. E. Freshwater D. W. (2011). Reconstructing the lionfish invasion: Insights into greater Caribbean biogeography. J. Biogeogr.38, 1281–1293. doi: 10.1111/j.1365-2699.2011.02496.x
23
Blacket M. J. Robin C. Good R. T. Lee S. F. Miller A. D. (2012). Universal primers for fluorescent labelling of PCR fragments-an efficient and cost-effective approach to genotyping by fluorescence. Mol. Ecol. Resour.12, 456–463. doi: 10.1111/j.1755-0998.2011.03104.x
24
Botsford L. W. Hastings A. Gaines S. D. (2001). Dependence of sustainability on the configuration of marine reserves and larval dispersal distance. Ecol. Lett.4, 144–150. doi: 10.1046/j.1461-0248.2001.00208.x
25
Botsford L. W. White J. W. Coffroth M. A. Paris C. B. Planes S. Shearer T. L. et al . (2009). Connectivity and resilience of coral reef metapopulations in marine protected areas: Matching empirical efforts to predictive needs. Coral Reefs28, 327–337. doi: 10.1007/s00338-009-0466-z
26
Bruno J. F. (1998). Fragmentation in Madracis mirabilis (Duchassaing and michelotti): How common is size-specific fragment survivorship in corals? J. Exp. Mar. Bio. Ecol.230, 169–181. doi: 10.1016/S0022-0981(98)00080-X
27
Bruno J. F. Edmunds P. J. (1997). Clonal variation for phenotypic plasticity in the coral Madracis mirabilis. Ecology78, 2177–2190. doi: 10.2307/2265954
28
Bruno J. F. Petes L. E. Harvell C. D. Hettinger A. (2003). Nutrient enrichment can increase the severity of coral diseases. Ecol. Lett.6, 1056–1061. doi: 10.1046/j.1461-0248.2003.00544.x
29
Camargo C. Maldonado J. H. Alvarado E. Moreno-Sánchez R. Mendoza S. Manrique N. et al . (2009). Community involvement in management for maintaining coral reef resilience and biodiversity in southern Caribbean marine protected areas. Biodivers. Conserv.18, 935–956. doi: 10.1007/s10531-008-9555-5
30
Camp E. F. Krause S. L. Santos L. M. F. Naumann M. S. Kikuchi R. K. P. Smith D. J. et al . (2015). The “Flexi-chamber”: A novel cost-effective in situ respirometry chamber for coral physiological measurements. PloS One10, 1–21. doi: 10.1371/journal.pone.0138800
31
Carlin J. L. Robertson D. R. Bowen B. W. (2003). Ancient divergences and recent connections in two tropical Atlantic reef fishes Epinephelus adscensionis and Rypticus saponaceous (Percoidei: Serranidae). Mar. Biol.143, 1057–1069. doi: 10.1007/s00227-003-1151-3
32
Carlon D. Olson R. R. (1993). Larval dispersal distance as an explanation for adult spatial pattern in two Caribbean reef corals. J. Exp. Mar. Bio. Ecol.173, 247–263. doi: 10.1016/j.geobios.2014.02.001
33
Chapuis M. P. Estoup A. (2007). Microsatellite null alleles and estimation of population differentiation. Mol. Biol. Evol.24, 621–631. doi: 10.1093/molbev/msl191
34
Chong-Seng K. M. Graham N. A. J. Pratchett M. S. (2014). Bottlenecks to coral recovery in the Seychelles. Coral Reefs33, 449–461. doi: 10.1007/s00338-014-1137-2
35
Chybicki I. J. Burczyk J. (2009). Simultaneous estimation of null alleles and inbreeding coefficients. J. Hered.100, 106–113. doi: 10.1093/jhered/esn088
36
CORALINA-INVEMAR (2012) Atlas de la reserva de biósfera seaflower Archipiélago de San andrés, providencia y Santa Catalina 28th ed., Eds. G.- LópezC.S.-Q.D. I.Sierra-CorreaP. C.Garay-TinocoJ. (Santa Marta, Colombia: Serie de publicaciones especiales de INVEMAR). Available at: http://www.invemar.org.co/redcostera1/invemar/docs/10447AtlasSAISeaflower.pdf.
37
Covarrubias-pazaran A. G. Diaz-Garcia L. Schlautman B. Salazar W. Zalapa J. (2016). Fragman: An r package for fragment analysis. BMC Genet.17, 1–8. doi: 10.1186/s12863-016-0365-6
38
Cowen R. K. Paris C. B. Srinivasan A. (2006). Scaling of connectivity in marine populations. Sci. (80-.)311, 522–527. doi: 10.1126/science.1122039
39
Crooks K. R. Sanhayan M. (2006). Connectivity conservation (New York: Cambridge University Press).
40
Culley T. M. Stamper T. I. Stokes R. L. Brzyski J. R. Hardiman N. A. Klooster M. R. et al . (2013). An efficient technique for primer development and application that integrates fluorescent labeling and multiplex PCR. Appl. Plant Sci.1, 1300027. doi: 10.3732/apps.1300027
41
De’ath G. Lough J. M. Fabricius K. E. (2009). Declining coral calcification on the great barrier reef. Sci.323, 116–119. doi: 10.1126/science.1165283
42
Díaz J. M. Barrios L. M. Cendales M. H. Garzón-Ferreira J. Geister J. López-Victoria M. et al . (2000). Areas coralinas de colombia. 5th ed (Santa Marta, Colombia: Invemar Serie de Publicaciones Especiales). Available at: https://www.researchgate.net/profile/Sven_Zea/publication/233761050_Areas_Coralinas_de_Colombia/links/09e41513277af44bed000000.pdf?inViewer=0&pdfJsDownload=0&origin=publication_detail.
43
Díaz-pérez L. Rodríguez-zaragoza F. A. Ortiz M. Cupul-magaña A. L. Carriquiry J. D. Ríos-jara E. R. et al . (2016). Coral reef health indices versus the biological, ecological and functional diversity of fish and coral assemblages in the caribbean sea. PloS One11, 19. doi: 10.1371/journal.pone.0167252
44
Diekmann O. E. (2003). The coral genus Madracis Speciation in corals and their symbionts.
45
Diekmann O. E. Bak R. P. M. Stam W. T. Olsen J. L. (2001). Molecular genetic evidence for probable reticulate speciation in the coral genus Madracis from a Caribbean fringing reef slope. Mar. Biol.139, 221–233. doi: 10.1007/s002270100584
46
Eakin C. M. Morgan J. A. Heron S. F. Smith T. B. Liu G. Alvarez-Filip L. et al . (2010). Caribbean Corals in crisis: Record thermal stress, bleaching, and mortality in 2005. PloS One5, 9. doi: 10.1371/journal.pone.0013969
47
Earl D. A. vonHoldt B. M. (2012). STRUCTURE HARVESTER: A website and program for visualizing STRUCTURE output and implementing the evanno method. Conserv. Genet. Resour.4, 359–361. doi: 10.1007/s12686-011-9548-7
48
Eckert R. J. Studivan M. S. Voss J. D. (2019). Populations of the coral species Montastraea cavernosa on the Belize barrier reef lack vertical connectivity. Sci. Rep.9, 1–12. doi: 10.1038/s41598-019-43479-x
49
Evanno G. Regnaut S. Goudet J. (2005). Detecting the number of clusters of individuals using the software STRUCTURE: A simulation study. Mol. Ecol.14, 2611–2620. doi: 10.1111/j.1365-294X.2005.02553.x
50
Falush D. Stephens M. Pritchard J. K. (2007). Inference of population structure using multilocus genotype data: Dominant markers and null alleles. Mol. Ecol. Notes7, 574–578. doi: 10.1111/j.1471-8286.2007.01758.x
51
Folmer O. Black M. Hoeh W. Lutz R. (1994). DNA Primers for amplification of mitochondrial cytochrome c oxidase subunit I from diverse metazoan invertebrates. Mol. Mar. Biol. Biotechnol.3, 294–299.
52
Foster N. L. Paris C. B. Kool J. T. Baums I. B. Stevens J. R. Sanchez J. A. et al . (2012). Connectivity of Caribbean coral populations: Complementary insights from empirical and modelled gene flow. Mol. Ecol.21, 1143–1157. doi: 10.1111/j.1365-294X.2012.05455.x
53
Frade P. R. Reyes-Nivia M. C. Faria J. Kaandorp J. Luttikhuizen P. C. Bak R. P. M. et al . (2010). Semi-permeable species boundaries in the coral genus Madracis: the role of introgression in a brooding coral system. Mol. Phylogenet. Evol.57, 1072–1090. doi: 10.1080/096132100418474
54
Gaines S. Gaylord B. Gerber L. Hastings A. Kinlan B. (2007). Connecting places: The ecological consequences of dispersal in the Sea. Oceanography20, 90–99. doi: 10.5670/oceanog.2007.32
55
Gaither M. R. Rowan R. (2010). Zooxanthellar symbiosis in planula larvae of the coral Pocillopora damicornis. J. Exp. Mar. Bio. Ecol.386, 45–53. doi: 10.1016/j.jembe.2010.02.003
56
Galindo H. M. Olson D. B. Palumbi S. R. (2006). Seascape genetics: A coupled oceanographic-genetic model predicts population structure of Caribbean corals. Curr. Biol.16, 1622–1626. doi: 10.1016/j.cub.2006.06.052
57
Garza J. C. Williamson E. G. (2001). Detection of reduction in population size using data from microsatellite loci. Mol. Ecol.10, 305–318. doi: 10.1046/j.1365-294x.2001.01190.x
58
Girod C. Vitalis R. Leblois R. Fréville H. (2011). Inferring population decline and expansion from microsatellite data: A simulation-based evaluation of the msvar method. Genetics188, 165–179. doi: 10.1534/genetics.110.121764
59
Gómez-López D. I. Acosta A. González J. D. Sánchez L. Navas-Camacho R. Alonso D. (2019). Reporte del estado de los arrecifes coralinos y pastos marinos en Colombia, (2018-2019) (Santa Marta, Colombia: Serie de publicaciones periódicas del Invemar).
60
Gonzalez A. Lawton J. H. Gitbert F. S. Blackburn T. M. XXXI E.-F. (1998) Metapopulation dynamics, abundance, and distribution in a microecosystemScience2812045–2047 doi: 10.1126/science.281.5385.2045
61
Goodbody-Gringley G. Woollacott R. M. Giribet G. (2012). Population structure and connectivity in the Atlantic scleractinian coral Montastraea cavernosa (Linnaeu). Mar. Ecol.33, 32–48. doi: 10.1111/j.1439-0485.2011.00452.x
62
Goreau T. J. Goreau N. I. Trench R. K. Hayes R. L. (1996). Calcification rates in corals. Science274, 117–118. doi: 10.1126/science.274.5284.117
63
Greenbaum G. Templeton A. R. Zarmi Y. Bar-David S. (2014). Allelic richness following population founding events - a stochastic modeling framework incorporating gene flow and genetic drift. PloS One9, 1–23. doi: 10.1371/journal.pone.0115203
64
Grober-Dunsmore R. Keller B. D. (2008). Caribbean Connectivity: Implications for Marine Protected Area Management. in Proceedings of a Special Symposium, 9-11 November 2006, 59th Annual Meeting of the Gulf and Caribbean Fisheries Institute, Belize City, Belize.(ilver Spring, MD: Marine Sanctuaries Conservation Series ONMS-08-07 195). Available from: https://sanctuaries.noaa.gov/science/conservation/carib.html
65
Grober-Dunsmore R. Pittman J. S. Caldow C. Kendall M. S. Frazer T. K. (2009). “A landscape ecology approach for the study of ecological connectivity across tropical marine seascapes,” in Ecological connectivity among tropical coastal ecosystems (Dordrecht: Springer), 493–530. doi: 10.1007/978-90-481-2406-0
66
Grossenbacher D. Briscoe Runquist R. Goldberg E. E. Brandvain Y. (2015). Geographic range size is predicted by plant mating system. Ecol. Lett.18, 706–713. doi: 10.1111/ele.12449
67
Gutiérrez-Rodríguez C. Lasker H. R. (2004). Microsatellite variation reveals high levels of genetic variability and population structure in the gorgonian coral Pseudopterogorgia elisabethae across the Bahamas. Mol. Ecol.13, 2211–2221. doi: 10.1111/j.1365-294X.2004.02247.x
68
Harvell C. D. (2007). Coral disease, environmental drivers, and the balance between coral and microbial associates. Oceanography20, 172–195. doi: 10.5670/oceanog.2007.91
69
Hauff B. Haslun J. A. Strychar K. B. Ostrom P. H. Cervino J. M. (2016). Symbiont diversity of zooxanthellae (Symbiodinium spp.) in Porites astreoides and Montastraea cavernosa from a reciprocal transplant in the lower Florida keys. Int. J. Biol.8, 9. doi: 10.5539/ijb.v8n2p9
70
Hedgecock D. Barber P. Suzanne E. (2007). Genetic approaches to measuring connectivity. Oceanography20, 70–79. doi: 10.5670/oceanog.2007.30
71
Hemond E. M. Vollmer S. V. (2010). Genetic diversity and connectivity in the threatened staghorn coral (Acropora cervicornis) in Florida. PloS One5, 11. doi: 10.1371/journal.pone.0008652
72
Highsmith R. (1982). Reproduction by fragmentation in corals. Mar. Ecol. Prog. Ser.7, 207–226. doi: 10.3354/meps007207
73
Holleley C. E. Geerts P. G. (2009). Multiplex manager 1.0: A cross-platform computer program that plans and optimizes multiplex PCR. Biotechniques46, 511–517. doi: 10.2144/000113156
74
INVEMAR & ANH (2010). Biodiversidad del margen continental del caribe colombiano. (Santa Marta, Colombia: Serie de Publicaciones Generales). Available at: https://www.cbd.int/doc/meetings/mar/rwebsa-wcar-01/other/rwebsa-wcar-01-colombia-03-es.pdf.
75
Jombart T. (2008). Adegenet: A r package for the multivariate analysis of genetic markers. Bioinformatics24, 1403–1405. doi: 10.1093/bioinformatics/btn129
76
Kamvar Z. N. Tabima J. F. Grüunwald N. J. (2014). Poppr: An r package for genetic analysis of populations with clonal, partially clonal, and/or sexual reproduction. PeerJ2014, 1–14. doi: 10.7717/peerj.281
77
Kopelman N. M. Mayzel J. Jakobsson M. Rosenberg N. A. Mayrose I. (2015). Clumpak: A program for identifying clustering modes and packaging population structure inferences across K. Mol. Ecol. Resour.15, 1179–1191. doi: 10.1111/1755-0998.12387
78
Landínez-García R. M. Ospina-Guerrero S. P. Rodríguez-Castro D. J. Arango R. Márquez E. (2009). Análisis genético de Lutjanus synagris en poblaciones del caribe colombiano. Cienc. Mar.35, 321–331. doi: 10.7773/cm.v35i4.1240
79
Le Goff-Vitry M. Pybus O. G. Roger (2004). Genetic structure of the deep-sea coral. Mol. Ecol.13, 537–549. doi: 10.1046/j.1365-294X.2004.02079.x
80
Lindfield S. J. Harvey E. S. Halford A. R. McIlwain J. L. (2015). Mesophotic depths as refuge areas for fishery-targeted species on coral reefs (Berlin Heidelberg: Springer). doi: 10.1007/s00338-015-1386-8
81
Lirman D. (2000). Fragmentation in the branching coral Acropora palmata (Lamarck): Growth, survivorship, and reproduction of colonies and fragments. J. Exp. Mar. Bio. Ecol.251, 41–57. doi: 10.1016/S0022-0981(00)00205-7
82
Locke J. M. Coates K. A. (2008). What are the costs of bad taxonomic practices: And what is Madracis mirabilis? Proceedings of the 11th International Coral Reef Symposium; 1348–1351. Available at: http://www.nova.eduncri/11icrs/proceedings/files/m26-03.pdf.
83
Locke J. M. Weil E. Coates K A. (2007). A newly documented species of Madracis (Scleractinia: Pocilloporidae) from the Caribbean. Proc. Biol. Soc Washingt.120, 214–226. doi: 10.2988/0006-324X(2007)120[214:ANDSOM]2.0.CO;2
84
Lowe W. H. Allendorf F. W. (2010). What can genetics tell us about population connectivity? Mol. Ecol.19, 3038–3051. doi: 10.1111/j.1365-294X.2010.04688.x
85
Maier E. Tollrian R. Rinkevich B. Nürnberger B. (2005). Isolation by distance in the scleractinian coral Seriatopora hystrix from the red Sea. Mar. Biol.147, 1109–1120. doi: 10.1007/s00227-005-0013-6
86
Manni F. Guérard E. Heyer E. (2004). Geographic patterns of (genetic, morphologic, linguistic) variation: How barriers can be detected by using monmonier’s algorithm. Hum. Biol.76, 173–190. doi: 10.1353/hub.2004.0034
87
Meirmans P. G. (2012). The trouble with isolation by distance. Mol. Ecol.21, 2839–2846. doi: 10.1111/j.1365-294X.2012.05578.x
88
Meirmans P. G. Van Tienderen P. H. (2004). GENOTYPE and GENODIVE: Two programs for the analysis of genetic diversity of asexual organisms. Mol. Ecol. Notes4, 792–794. doi: 10.1111/j.1471-8286.2004.00770.x
89
Mellin C. Aaron MacNeil M. Cheal A. J. Emslie M. J. Julian Caley M. (2016). Marine protected areas increase resilience among coral reef communities. Ecol. Lett.19, 9. doi: 10.1111/ele.12598
90
Mercado-Molina A. E. Ruiz-Diaz C. P. Sabat A. M. (2014). Survival, growth, and branch production of unattached fragments of the threatened hermatypic coral Acropora cervicornis. J. Exp. Mar. Bio. Ecol.457, 215–219. doi: 10.1016/j.jembe.2014.04.017
91
Mobley K. B. Small C. M. Jue N. K. Jones A. G. (2010). Population structure of the dusky pipefish (Syngnathus floridae) from the Atlantic and gulf of Mexico, as revealed by mitochondrial DNA and microsatellite analyses. J. Biogeogr.37, 1363–1377. doi: 10.1111/j.1365-2699.2010.02288.x
92
Mumby P. J. Harborne A. R. (2010). Marine reserves enhance the recovery of corals on Caribbean reefs. PloS One5, 1–7. doi: 10.1371/journal.pone.0008657
93
Munday P. L. Leis J. M. Lough J. M. Paris C. B. Kingsford M. J. Berumen M. L. et al . (2009). Climate change and coral reef connectivity. Coral Reefs28, 379–395. doi: 10.1007/s00338-008-0461-9
94
Nakajima Y. Zayasu Y. Shinzato C. Satoh N. Mitarai S. (2016). Genetic differentiation and connectivity of morphological types of the broadcast-spawning coral Galaxea fascicularis in the nansei islands, Japan. Ecol. Evol.6, 1457–1469. doi: 10.1002/ece3.1981
95
Navas-Camacho R. Gil-Agudelo D. L. Rodríguez-Ramírez A. Reyes-Nivia M. C. Garzón-Ferreira J. (2010). Coral diseases and bleaching on Colombian Caribbean coral reefs. Rev. Biol. Trop.58, 95–106. doi: 10.15517/rbt.v58i1.20026
96
Ospina-Guerrero S. P. Landinez-garcía R. M. Rodríguez-castro D. J. Arango R. Márquez E. (2008). Genetic connectivity of Stegastes partitus in the south Caribbean evidenced by microsatellite analysis. Cienc. Mar.34, 155–163. doi: 10.7773/cm.v34i2.1237
97
Palumbi S. R. (2003). Population genetics, demographic connectivity, and the desing of marine reserves. Ecol. Appl.13, 146–158. doi: 10.1890/1051-0761(2003)013[0146:PGDCAT]2.0.CO;2
98
Pannell J. R. Auld J. R. Brandvain Y. Burd M. Busch J. W. Cheptou P. et al . (2015). Tansley review the scope of baker’s law. New Phytol.208, 656–667. doi: 10.1111/nph.13539
99
Pante E. Simon-Bouhet B. (2013). Marmap: A package for importing, plotting and analyzing bathymetric and topographic data in r. PloS One8, 6–9. doi: 10.1371/journal.pone.0073051
100
Paradis E. (2010). Pegas: An r package for population genetics with an integrated-modular approach. Bioinformatics26, 419–420. doi: 10.1093/bioinformatics/btp696
101
Paradis E. Schliep K. (2019). Ape 5.0: An environment for modern phylogenetics and evolutionary analyses in r. Bioinformatics35, 526–528. doi: 10.1093/bioinformatics/bty633
102
Parks J. C. Werth C. R. (1993). A study of spatial features of clones in a population of bracken fern, Pteridium aquilinum (Dennstaedtiaceae). Am. J. Bot.80, 537–544. doi: 10.2307/2445369
103
Pizarro V. Rodríguez S. C. López-Victoria M. Zapata F. A. Zea S. Galindo-Martínez C. T. et al . (2017). Unraveling the structure and composition of varadero reef, an improbable and imperiled coral reef in the Colombian Caribbean. PeerJ. 12, 1–18. doi: 10.7717/peerj.4119
104
Porto-Hannes I. Zubillaga A. L. Shearer T. L. Bastidas C. Salazar C. Coffroth M. A. et al . (2015). Population structure of the corals Orbicella faveolata and Acropora palmata in the mesoamerican barrier reef system with comparisons over Caribbean basin-wide spatial scale. Mar. Biol.162, 81–98. doi: 10.1007/s00227-014-2560-1
105
Pritchard J. K. Stephens M. Donnelly P. (2000). Inference of population structure using multilocus genotype data. Genetics155, 945–959. doi: 10.1093/genetics/155.2.945
106
Pujolar J. M. Schiavina M. Di Franco A. Melià P. Guidetti P. Gatto M. et al . (2013). Understanding the effectiveness of marine protected areas using genetic connectivity patterns and Lagrangian simulations. Divers. Distrib.19, 1531–1542. doi: 10.1111/ddi.12114
107
Reaka-Kudla M. L. (2005). “Biodiversity of Caribbean coral reefs,” in .Caribb. Mar. Biodivers: The Known Unkn and the Unkown, eds. PMiloslavichKleinE. (Lancaster: Des Tech Publishers) 18, 259–276.
108
Reyes J. Santodomingo N. Florez P. (2010). Corales escleractinios de colombia. 14th ed (Invemar Santa Marta, Colombia: Invemar Serie de Publicaciones Especiales).
109
Riesgo A. Taboada S. Pérez-Portela R. Melis P. Xavier J. R. Blasco G. et al . (2019). Genetic diversity, connectivity and gene flow along the distribution of the emblematic atlanto-Mediterranean sponge Petrosia ficiformis (Haplosclerida, demospongiae). BMC Evol. Biol.19, 18. doi: 10.1186/s12862-018-1343-6
110
Salas E. Molina-Ureña H. Walter R. P. Heath D. D. (2010). Local and regional genetic connectivity in a Caribbean coral reef fish. Mar. Biol.157, 437–445. doi: 10.1007/s00227-009-1330-y
111
Santodomingo N. Reyes J. Flórez P. Chacón-Gómez I. C. van Ofwegen L. P. Hoeksema B. W. (2013). Diversity and distribution of azooxanthellate corals in the Colombian Caribbean. Mar. Biodivers.43, 7–22. doi: 10.1007/s12526-012-0131-6
112
Selkoe K. A. Toonen R. J. (2006). Microsatellites for ecologists: A practical guide to using and evaluating microsatellite markers. Ecol. Lett.9, 615–629. doi: 10.1111/j.1461-0248.2006.00889.x
113
Shearer T. L. Coffroth M. A. (2004). Isolation of microsatellite loci from the scleractinian corals, Montastraea cavernosa and Porites astreoides. Mol. Ecol. Notes4, 435–437. doi: 10.1111/j.1471-8286.2004.00653.x
114
Sheng J. Tang L. (2003). A numerical study of circulation in the western Caribbean Sea. J. Phys. Oceanogr.33, 2049–2069. doi: 10.1175/1520-0485(2003)033<2049:ANSOCI>2.0.CO;2
115
Sherman C. D. H. (2008). Mating system variation in the hermaphroditic brooding coral, Seriatopora hystrix. Heredity (Edinb).100, 296–303. doi: 10.1038/sj.hdy.6801076
116
Shulman M. J. Bermingham E. (1995). Early life histories, ocean currents, and the population genetics of Caribbean reef fishes. Evol. (N. Y)49, 897. doi: 10.2307/2410412
117
Simonti A. L. Eastman J. R. (2010). 2005 Caribbean mass coral bleaching event: A sea surface temperature empirical orthogonal teleconnection analysis. J. Geophys. Res. Ocean115, 1–11. doi: 10.1029/2010JC006233
118
Spalding M. D. Fox H. E. Allen G. R. Davidson N. Ferdaña Z. A. Finlayson M. et al . (2007). Marine ecoregions of the world: A bioregionalization of coastal and shelf areas. Bioscience57, 573–583. doi: 10.1641/B570707
119
Stolarski J. Kitahara M. V. Miller D. J. Cairns S. D. Mazur M. Meibom A. (2011). The ancient evolutionary origins of scleractinia revealed by azooxanthellate corals. BMC Evol. Biol.11, 10. doi: 10.1186/1471-2148-11-316
120
Sturm A. B. Eckert R. J. Méndez J. G. González-Díaz P. Voss J. D. (2020). Population genetic structure of the great star coral, Montastraea cavernosa, across the Cuban archipelago with comparisons between microsatellite and SNP markers. Sci. Rep.10, 1–15. doi: 10.1038/s41598-020-72112-5
121
Sundqvist L. Keenan K. Zackrisson M. Prodöhl P. Kleinhans D. (2016). Directional genetic differentiation and relative migration. Ecol. Evol.6, 3461–3475. doi: 10.1002/ece3.2096
122
Sunnucks P. (2000). Efficient genetic markers for population biology. Trends Ecol. Evol.15, 199–203. doi: 10.1038/mt.2008.212
123
Szpiech Z. A. Jakobsson M. Rosenberg N. A. (2008). ADZE: A rarefaction approach for counting alleles private to combinations of populations. Bioinformatics24, 2498–2504. doi: 10.1093/bioinformatics/btn478
124
Vermeij M. J. A. (2002) Evolutionary ecology of the coral genus Madracis - an illustration of the nature of species in scleractinian coralsInst. Biodivers Ecosyst. Dyn. [Thesis].
125
Vermeij M. Bak R. (2000). Inferring demographic processes from population size structure in corals. Proc. 9th Int. Coral Reef Symp., 23–27. Available at: http://coremap.or.id/downloads/IRCS9th-Vermeij.pdf%5Cnpapers2://publication/uuid/CAD42D38-2591-4EBE-9BE7-6B76CFFACFFB.
126
Vermeij M. J. A. Bak R. P. M. (2003). Species-specific population structure of closely related coral morphospecies along a depth gradient (5-60 m) over a Caribbean reef slope. Bull. Mar. Sci.73, 725–744.
127
Vermeij M. J. A. Sampayo E. Bröker K. Bak R. P. M. (2004). The reproductive biology of closely related coral species: Gametogenesis in Madracis from the southern Caribbean. Coral Reefs23, 206–214. doi: 10.1007/s00338-004-0368-z
128
Vides-Casado M. P. (2011). Distribución de la megafauna bentónica del caribe colombiano asociado a variables ambientales del fondo Marino. Bol. Investig. Mar. y Costeras40, 249–270.
129
Vollmer S. V. Palumbi S. R. (2002). Hybridization and the evolution of reef coral diversity. Sci. (80-.)296, 2023–2025. doi: 10.1126/science.1069524
Summary
Keywords
Madracis auretenra , microsatellites, shallow coral reefs, population structure, Caribbean Sea
Citation
Ballesteros-Contreras DC, Barrios LM and Preziosi R (2022) Population structure of the shallow coral Madracis auretenra in the Caribbean Sea. Front. Mar. Sci. 9:840730. doi: 10.3389/fmars.2022.840730
Received
21 December 2021
Accepted
14 September 2022
Published
04 October 2022
Volume
9 - 2022
Edited by
Sophie Arnaud-Haond, UMR9190 Centre Pour la Biodiversité Marine, l’exploitation et la Conservation (MARBEC), France
Reviewed by
Federica Costantini, University of Bologna, Italy; Eric Pante, Centre National de la Recherche Scientifique (CNRS), France; Cynthia Riginos, The University of Queensland, Australia
Updates
Copyright
© 2022 Ballesteros-Contreras, Barrios and Preziosi.
This is an open-access article distributed under the terms of the Creative Commons Attribution License (CC BY). The use, distribution or reproduction in other forums is permitted, provided the original author(s) and the copyright owner(s) are credited and that the original publication in this journal is cited, in accordance with accepted academic practice. No use, distribution or reproduction is permitted which does not comply with these terms.
*Correspondence: Diana Carolina Ballesteros-Contreras, diana.carolinab09@gmail.com
This article was submitted to Marine Molecular Biology and Ecology, a section of the journal Frontiers in Marine Science
Disclaimer
All claims expressed in this article are solely those of the authors and do not necessarily represent those of their affiliated organizations, or those of the publisher, the editors and the reviewers. Any product that may be evaluated in this article or claim that may be made by its manufacturer is not guaranteed or endorsed by the publisher.