Abstract
The Atlantic Meridional Overturning Circulation (AMOC) and its surface limb, the Gulf Stream, are in their weakest state since the last millennium. The consequences of this weakening in the Northeast Atlantic are not yet known. We show that the slowdown of the Gulf Stream in the 1960s, 1970s, and after 2000 may have caused a delayed weakening of the Azores Current. Concurrently, the Azores Front associated with the Azores Current migrated northward since the 1970s due to gradual changes in the Atlantic Multidecadal Oscillation and ocean heat content. We argue that the AMOC slowdown is also detectable in the low-energy region of the Northeast Atlantic and that the dynamics of Azores Current tightly connects to that of the dynamics of the Gulf Stream and AMOC on decadal and longer time scales.
Introduction
Over the last century, multiple changes in large-scale circulation and water properties were reported in the North Atlantic. Among them, the most intriguing and alarming are the recent slowdown of the Atlantic Meridional Overturning Circulation (AMOC) (Bryden et al., 2005; Caesar et al., 2021) and an increase in ocean heat content (OHC) in the upper 2000 m of the water column since the mid-20th century (Levitus et al., 2012). The Intergovernmental Panel on Climate Change (IPCC) projects a very likely weakening of the AMOC over the 21st century in comparison to its pre-industrial state (Collins et al., 2013) under warmer climate conditions, at least partially caused by increased anthropogenic carbon dioxide concentration in the atmosphere (Caesar et al., 2018).
The AMOC strength depends, among other factors, on the Gulf Stream’s strength and position (de Coëtlogon et al., 2006; Joyce and Zhang, 2010). Since the 1990s, Gulf Stream transports have strongly declined (Ezer, 2015; Dong et al., 2019). Ocean warming and the AMOC slowing are supposed to be linked to the recent Gulf Stream decline, which may cause sea-level rise along the U.S. East Coast (Ezer et al., 2013). However, quantifying the Gulf Stream slowdown from direct current observations is still difficult to achieve (Rossby et al., 2014; Andres et al., 2020). Additionally, Gulf Stream variability and pathway have been associated with the North Atlantic Oscillation (NAO) (e.g., Joyce et al., 2000; Zhang et al., 2020), warming in the southeast region of the Gulf Stream (Seidov et al., 2019a) and the Atlantic Multidecadal Oscillation (AMO) phase (Nigam et al., 2018). Moreover, the reconstructions of the Gulf Stream transport and some modeling efforts revealed a weakening of the Gulf Stream during the 1960s and 1970s (Greatbatch et al., 1991; Ezer, 2015). However, possible consequences of an AMOC slowdown for the circulation and thermohaline structure in the mid-latitude of the Northeastern Atlantic have not yet been sufficiently studied. A new focus on this part of the North Atlantic Ocean is needed because of the dependence of the Azores Current, as the major pathway of eastward transport into the recirculation in the Canary Basin, on the AMOC dynamics (Figure 1A). The Azores Current is weaker than the Gulf Stream, with kinetic energy values exceeding 200 cm2 s-2 at the surface between the Mid-Atlantic Ridge (MAR) and 29°W (Barbosa Aguiar et al., 2011), falling in the lower energy band (Garçon et al., 2001). Therefore, being a much weaker current, the Azores Current might be more sensitive to AMOC variability than the more powerful Gulf Stream current system and thus not as easily discovered.
Figure 1
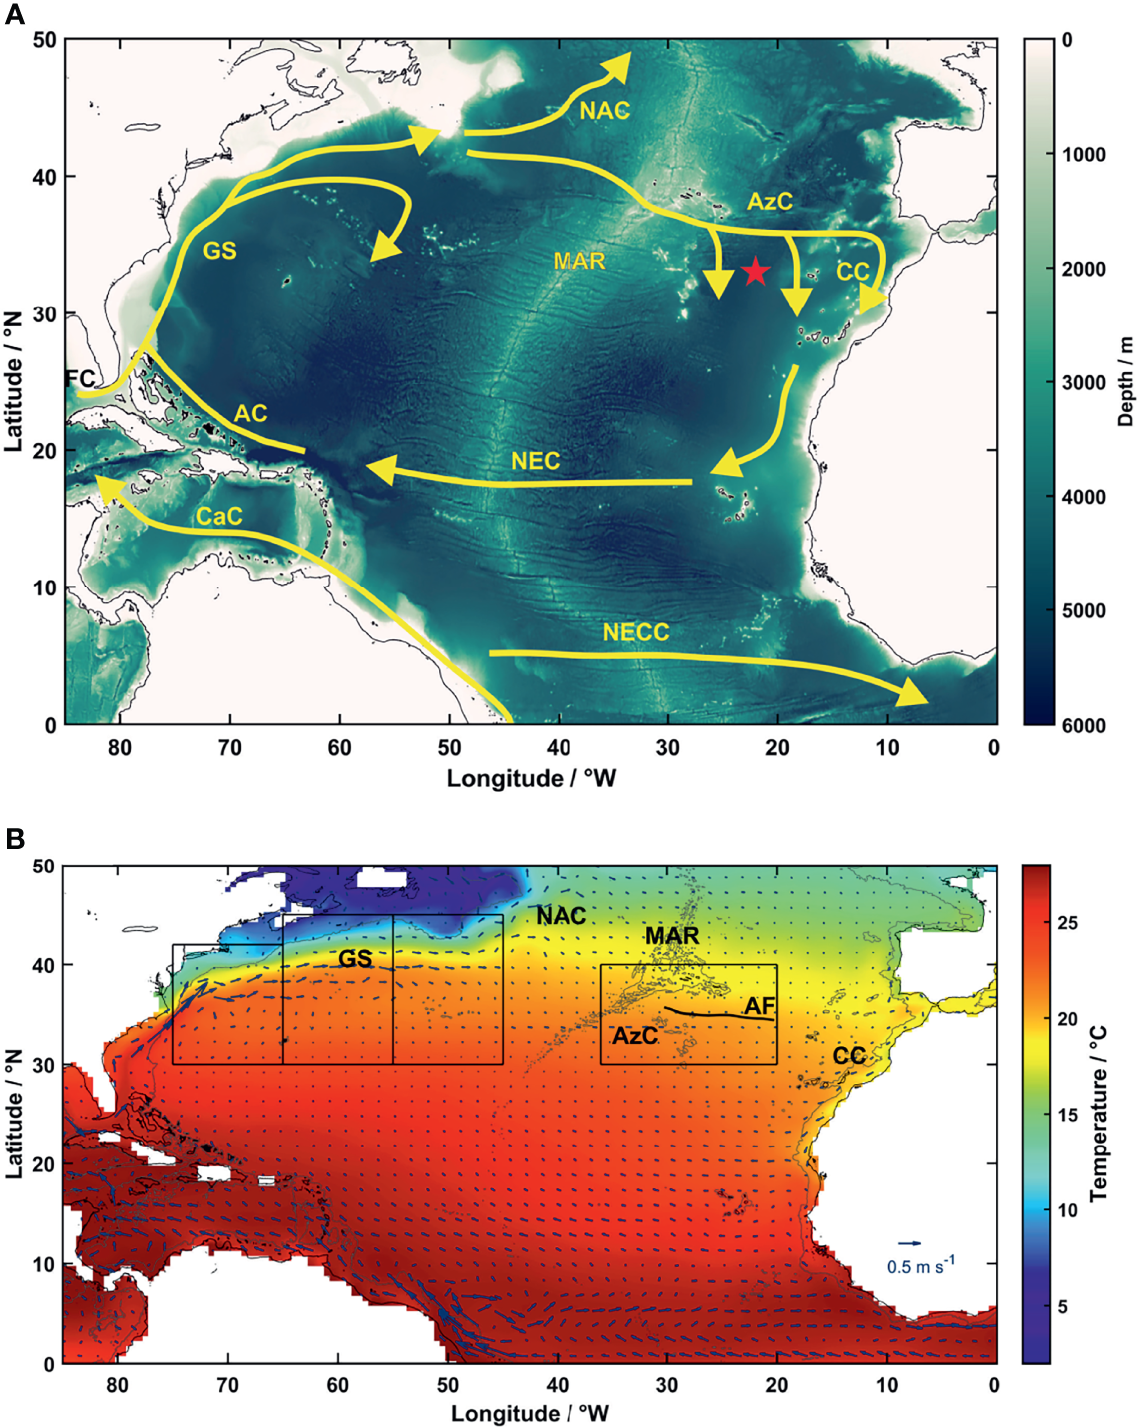
North Atlantic circulation at the surface. (A) Schematic representation of the North Atlantic Subtropical Gyre currents at the surface: Caribbean Current (CaC), Florida Current (FC), Antilles Current (AC), Gulf Stream (GS), North Atlantic Current (NAC), Azores Current (AzC), Canary Current (CC), North Atlantic Equatorial Current (NEC), and North Atlantic Equatorial Counter Current (NECC). Mid-Atlantic Ridge (MAR) and the Kiel 276 mooring (red star) are also identified (adapted from Tomczak and Godfrey, 1994 and Daniault et al., 2016). (B) Mean temperature and mean velocity at 5 m depth in the North Atlantic basin from the SODA-POP v2.2.4 (Carton and Giese, 2008; Giese and Ray, 2011) averaged between 1871 and 2010. Black boxes show our study domains in the Gulf Stream (between 75°W and 45°W, divided into three 10° sub-zones) and in the Azores Current (between 36°W and 20°W). A thin grey line depicts the 2000 m-isobath. The time-averaged annual position of the Azores Front (AF) position is represented by a thick black line between 30°W and 20°W for the period 1871-2010.
The Azores Current originates near the Grand Banks (40°N, 45°W), where the Gulf Stream splits into two main branches – the North Atlantic Current and the Azores Current (Figure 1). It then flows south-eastward until it crosses the MAR at approximately 34°N, 37°W, and then turns eastward as a coherent jet towards the Strait of Gibraltar. East of the Mid-Atlantic Ridge, the Azores Current forms three main branches, the easternmost branch heads into the Canary Basin and feeds the Canary Current (Stramma, 1984; New et al., 2001; Figure 1), while the other two branches recirculate into the North Equatorial Current (Maillard and Käse, 1989; Figure 1). Furthermore, the Azores Current recirculates in two westward countercurrents – (i) north (known as the Azores Countercurrent; Onken, 1993) and (ii) south of the Azores Current core (Peliz et al., 2007; Barbosa Aguiar et al., 2011). The Azores Current’s core is located between 33°N and 36°N east of MAR (Figures 1B, 2), transporting 10–12 Sv (1 Sv = 106 m3 s-1) eastward in the upper 1000 m (e.g., Käse and Siedler, 1982). The Azores Current surface velocity and transports decrease eastwards (Peliz et al., 2007). Consequently, the eddy field along the Azores Current jet varies zonally (Barbosa Aguiar et al., 2011; Silva-Fernandes and Peliz, 2020).
Figure 2
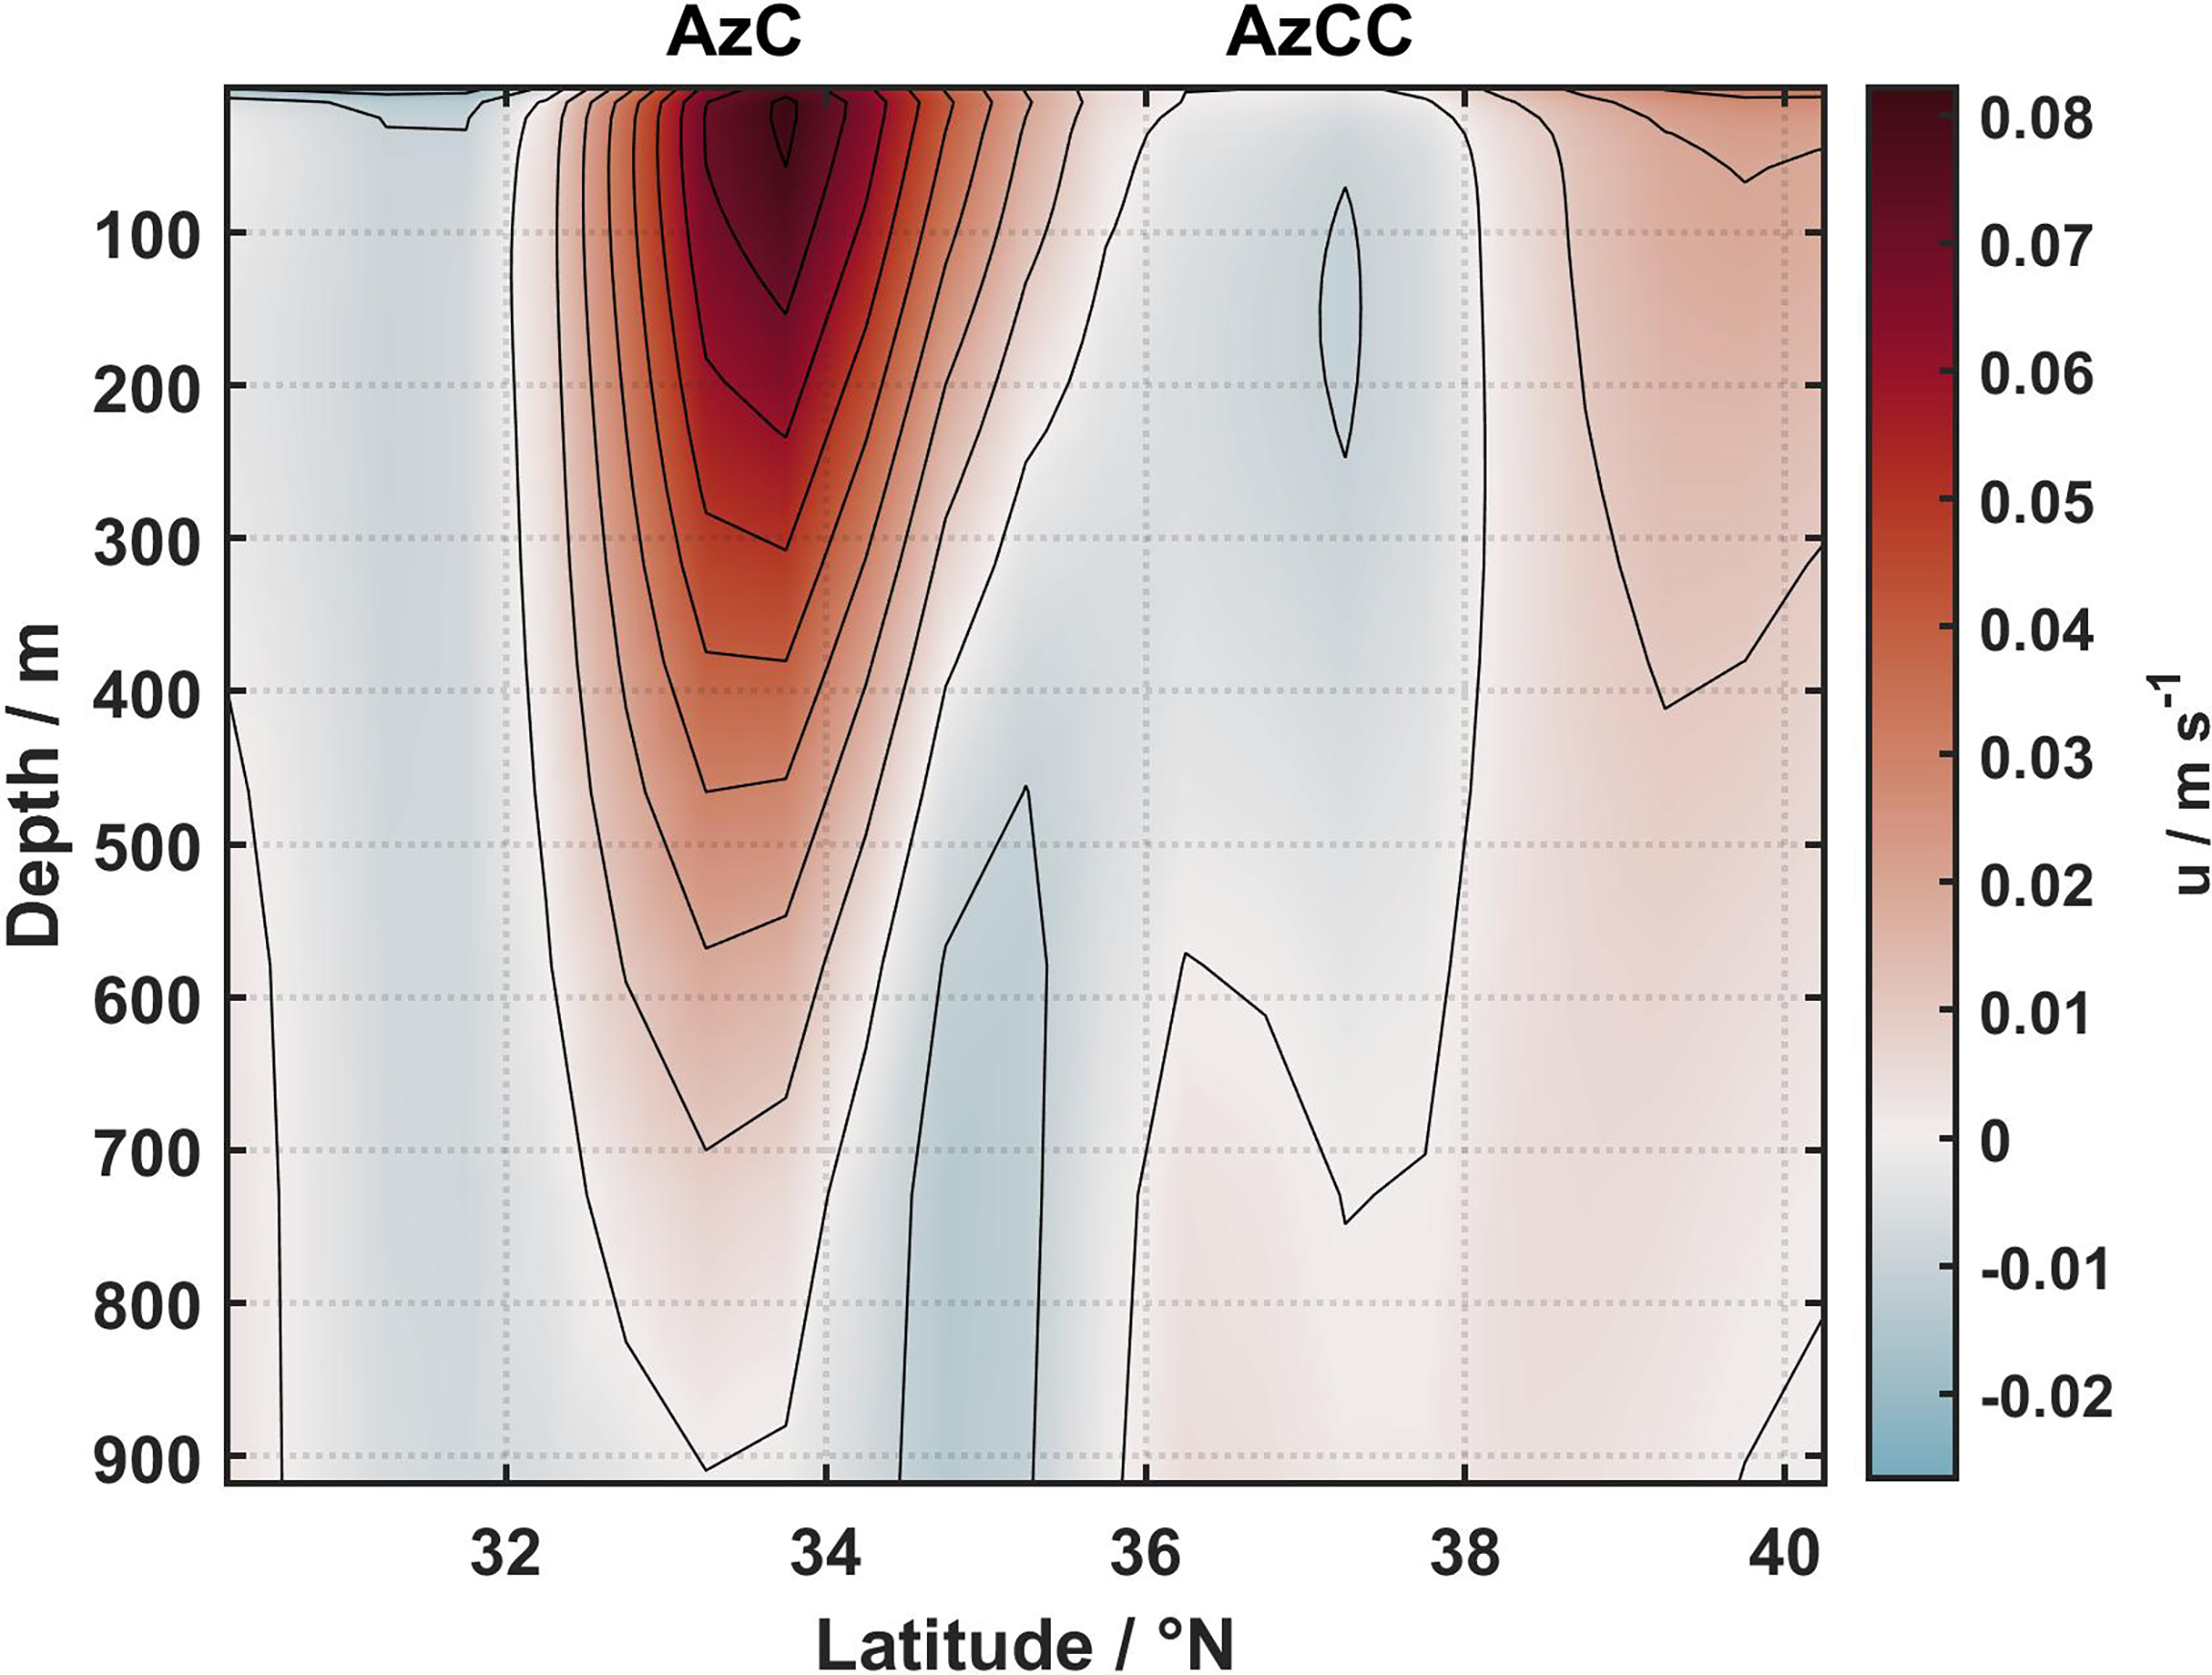
The Azores Current System. Average of the zonal velocity component at the Azores Current region between 36°W and 20°W (see Figures 1B) for the period 1871 and 2010. Positive values indicate eastward flow. The Azores Current (AzC) and Azores Countercurrent (AzCC; Onken, 1993) cores are identified.
The Azores Current and its associated thermohaline Azores Front comprise the northeast boundary of the North Atlantic subtropical gyre. Importantly, the Azores Front-Current system separates two different biogeochemical regimes (Fründt and Waniek, 2012) − the cold and more productive temperate Eastern North Atlantic Water in the north and the warm and oligotrophic 18°C-mode water south of the Azores Current. The changes in this system may be, therefore, critical for the long-term alteration of the biogeochemical regime in this region. Unfortunately, the existing analyses of the structure and variability of the Azores Front-Current system using hydrographic data are limited to the last 40 years and mainly based on quasi-synoptic surveys and drifters (e.g., Onken, 1993; Alves et al., 2002) or the Kiel 276 mooring data located at 33°N, 22°W (30 years of current and temperature measurements Siedler et al., 2005; Fründt et al., 2013; Frazão et al., 2021; Figure 1 red star). To date, most studies described the Azores Current’s transports (e.g., Alves et al., 2002; Peliz et al., 2007, among others), the spatial and vertical structure of the Azores Current (Stramma and Müller, 1989; Comas-Rodríguez et al., 2011), its meandering characteristic (e.g., Siedler et al., 1985; Alves et al., 2002), and the zonal variability of the Kinetic Energy (e.g., Richardson, 1983; Le Traon and De May, 1994; Volkov and Fu, 2011; Silva-Fernandes and Peliz, 2020). The interest in the Azores Current has recently increased as satellite altimeter data became available, allowing far better monitoring of the Azores Current surface signature and mesoscale variability (Barbosa Aguiar et al., 2011; Silva-Fernandes and Peliz, 2020). There are some modeling studies of the Azores Current, but their main focus remained on the possible link between the Azores Current system and the Mediterranean Outflow Water (MOW) based on the dynamical concept of the β-plume mechanism (Jia, 2000; Kida et al., 2008;Volkov and Fu, 2010), rather than on a potential link between the Azores Current and AMOC. Yet, the driving mechanisms for the Azores Current are not fully understood. Spall (1990), using a numerical model, analyzed the circulation in the Canary basin and concluded that the model misrepresented the position of the Azores Current and its transports. Nevertheless, he could not explain why the model did not adequately represent the Azores Current since the dominant forcing mechanisms at the time were not determined. However, little progress has been made since Spall (1990), and some hypotheses have been put forward without reaching a general consensus. The latest hypothesis formulates that a combined effect of the wind and the β -plume mechanism might drive Azores Current (Peliz et al., 2007; Lamas et al., 2010). However, the NAO, as the primary mode associated with changes in the wind field over the North Atlantic Ocean, has shown to have little influence on the Azores Current magnitude (Volkov and Fu, 2011). Siedler et al. (2005) argued that the Azores Current’s axis during the 1990s was further south than in the 1980s. Nonetheless, those links were calculated over periods shorter than 30 years, and the long-term influence of the NAO over the Azores Current is not yet known.
Understanding the multi-decadal variability of the Azores Current and its importance in a wider circulation context of the North Atlantic subtropical gyre is currently far from complete. Here we explore the link between the Gulf Stream and the Azores Current, the latter as an extension of the Gulf Stream in the eastern subtropical Atlantic (Schmitz and McCartney, 1993; Richardson, 2001). Furthermore, we consider a possible link between the reported slowdown of the Gulf Stream (Greatbatch et al., 1991; Ezer, 2015; Dong et al., 2019) and a decline in the Azores Current strength.
Materials and Methods
We used monthly temperature and velocity data from the Simple Ocean Data Assimilation reanalysis (SODA-POP v2.2.4) in the Gulf Stream (30°N–50°N, 75°W–45°W; Figure 1B) and at the Azores Current regions (30°N–40°N, 36°W–20°W; Figure 1B) between 1871–2010 (Carton and Giese, 2008; Giese and Ray, 2011). The SODA assimilation is performed sequentially in a 10-day cycle, with corrections applied incrementally at every time step. Output variables are averaged every 5 days and mapped onto a uniform global 0.5°× 0.5° horizontal grid using the horizontal grid spherical coordinate remapping and interpolation package of Jones (1999). The ocean model is based on Parallel Ocean Programming (POP; Smith et al. (1992) with an average horizontal resolution of 0.4° in longitude × 0.25° in latitude. The surface boundary conditions are provided by the Twentieth Century Atmospheric Reanalysis product (20CRv2; Compo et al., 2011). From 20CRv2, the surface wind stress is used for the surface momentum flux; additionally, the heat and freshwater fluxes are calculated using the solar radiation, 2 m air temperature, cloud cover, 10 m wind speed, specific humidity, and precipitation (Giese and Ray, 2011). SODA-POP assimilates all available hydrographic profile data from the World Ocean Database 2009 (Boyer et al., 2009), including CTD, buoys, moorings, and expendable bathythermograph (XBT) and mechanical bathythermograph (MBT). The temperature obtained from XBT and MBT was corrected following Levitus et al. (2009). Surface temperature data is provided by the International Comprehensive Ocean-Atmosphere Data Set (ICOADS 2.5); however, other datasets are also used (for more details about the additional datasets used, see Giese and Ray, 2011). The monthly property fields (temperature, salinity, velocity) used in this study have a spatial resolution of 0.5°× 0.5°, with 40 depth levels.
We further divided the Gulf Stream region into three 10° longitude zones, 75°W−65°W, 65°W−55°W, and 55°W−45°W, according to the Gulf Stream behavior and resilient position of the jet-like flow (Dong et al., 2019; Seidov et al., 2019a) (see the areas shown by three boxes in the Gulf Stream region Figure 1B; note that the third of the three areas is already in the extension zone; Seidov et al., 2019a).
The circulation pattern west of the Madeira Islands shows recirculation both north and south of the Azores Current (Barbosa Aguiar et al., 2011). Thus, we constrained the study area around the Azores Current between 36°W and 20°W and limited the analysis to its core (between 32°N and 36°N, Figure 2). Additionally, the Azores Current’s dynamics and eddy energy at the surface show a zonal variation along its pathway towards the Strait of Gibraltar (Barbosa Aguiar et al., 2011; Silva-Fernandes and Peliz, 2020). East of the MAR, those authors further divided the Azores Current into three main regions according to the surface variability of eddy kinetic energy: 36°W−28°W, 28°W−24°W, and 24°W−20°W. In this study, we followed the same partition suggested by those authors and accessed the dynamic of the Azores Current in the three sub-regions.
Monthly zonal and meridional velocity fields were used to calculate the absolute velocity for both Azores Current and Gulf Stream. The Azores Current and Gulf Stream cores were identified by the latitudes at each sub-region with the maximum averaged velocity in the upper 1000 m for the entire period (Figures 3A, 4A), once the higher transports for both currents occur in the upper 1000 m (Käse and Siedler, 1982; Pelegrí and Csanady, 1991).
Figure 3
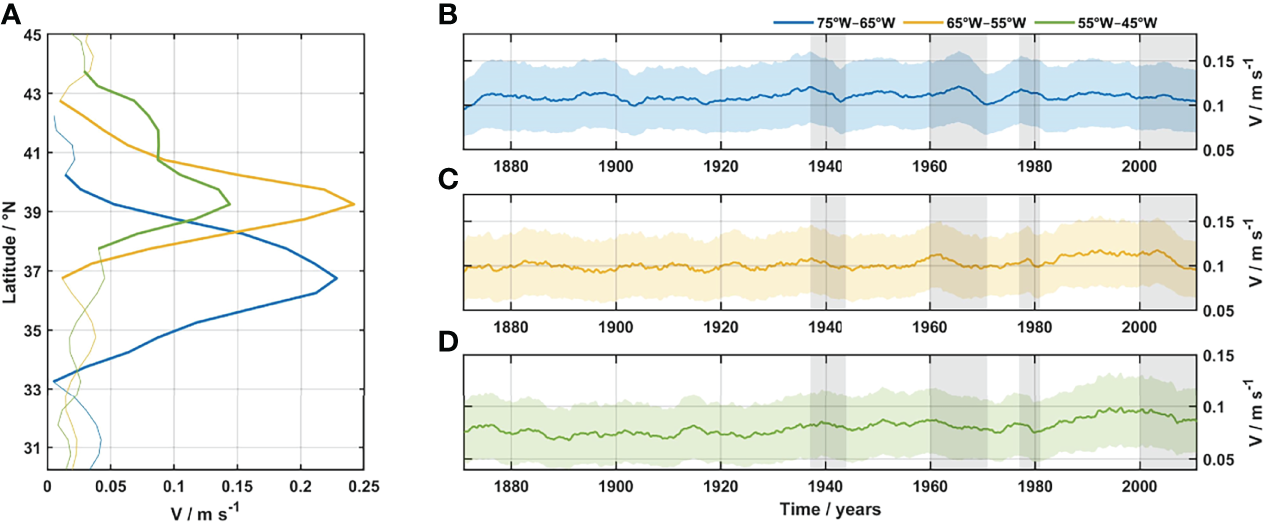
The Gulf Stream. (A) Meridional profiles of the absolute velocity averaged in the upper 1000 m for each sub-region along the Gulf Stream: western (75°W–65°W, blue line), central (65°W–55°W, yellow line), and eastern/extension (55°W–45°W, green line) zones. The Gulf Stream cores are marked with a thicker line for each region. (B) Averaged monthly time-series of absolute velocity at the western Gulf Stream, (C) central Gulf Stream region, and (D) extension Gulf Stream region inside the core in the upper 1000 m between 1871 and 2010. Colored shadowed areas in (B–D) represent the standard deviation. Shadow grey areas mark the periods of velocity decrease of the Gulf Stream. Absolute velocity was calculated from the monthly zonal and meridional velocity fields from SODA-POP v2.2.4 (Carton and Giese, 2008; Giese and Ray, 2011). The time-series are smoothed with a 60-months running mean.
Figure 4
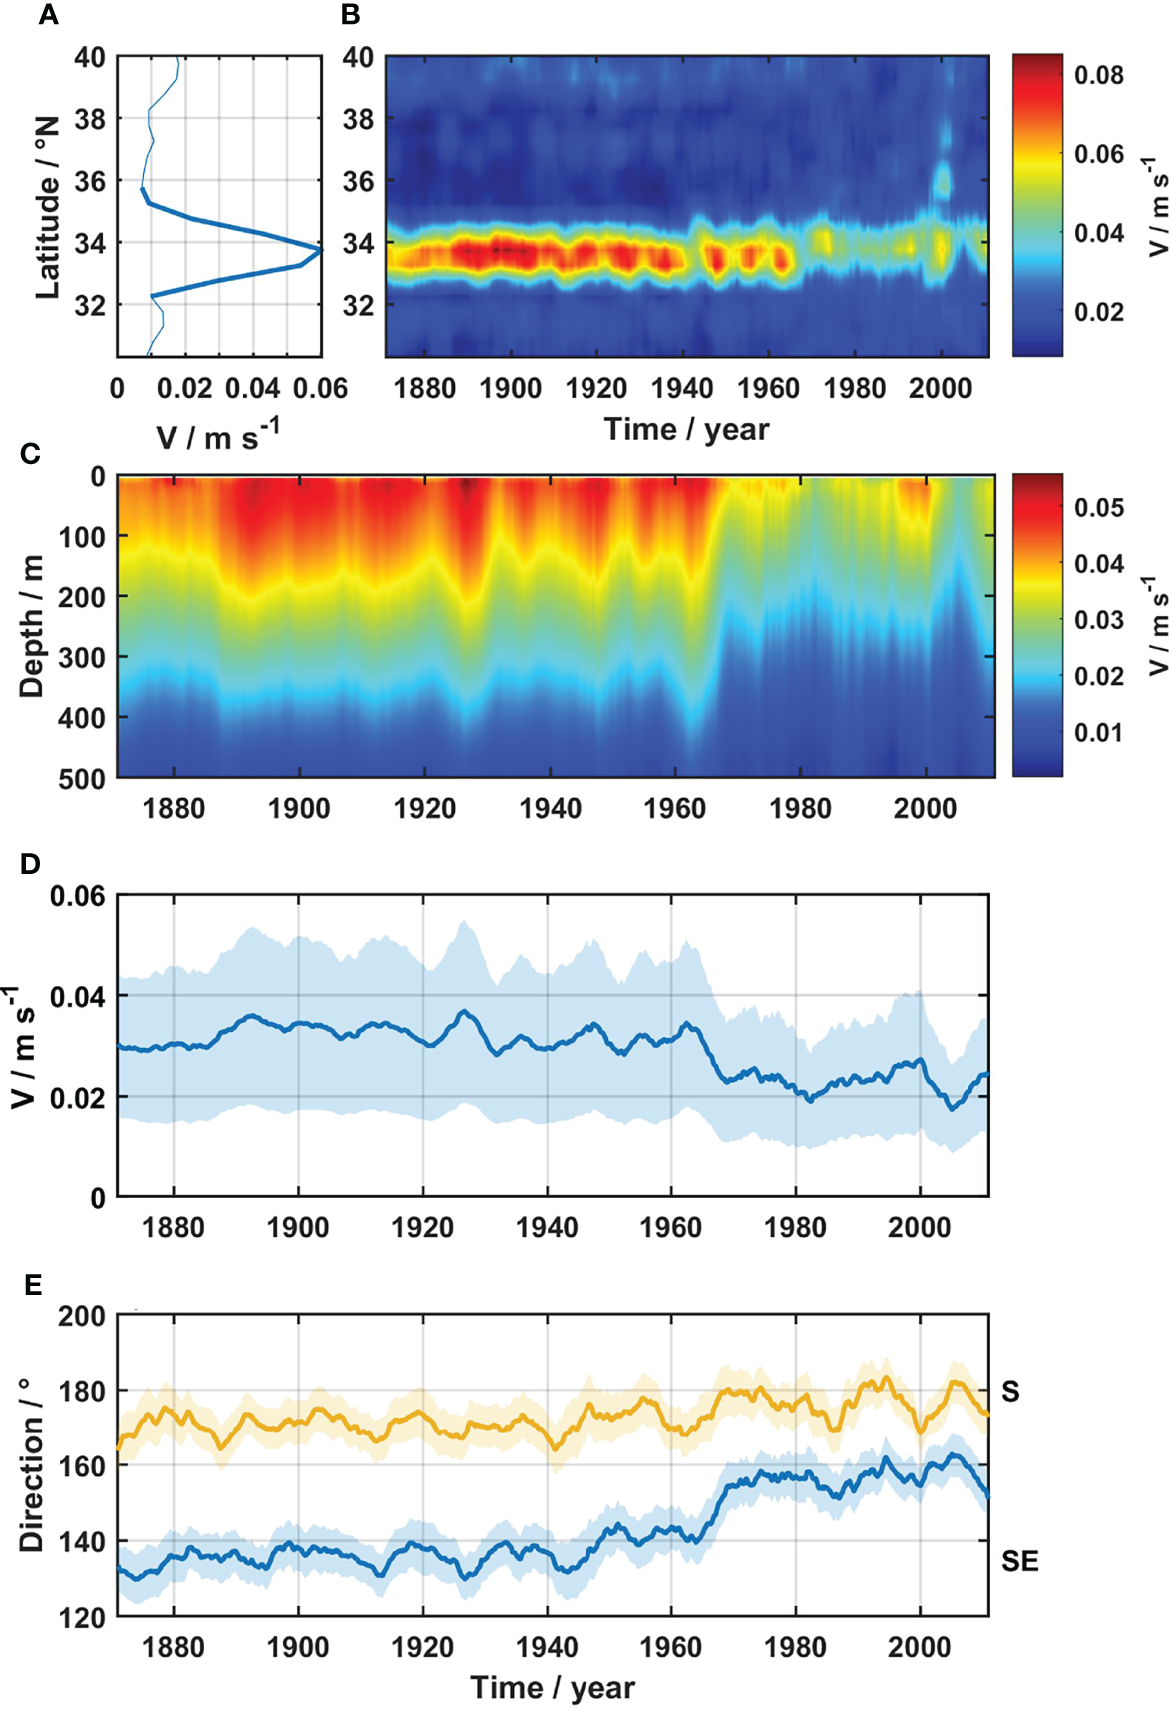
The Azores Current. (A) Average absolute velocity in the upper 1000 m along the Azores Current region (30°N–40°N, 36°W–20°W, Fig. 1). A thicker line represents the Azores Current core. (B) Average absolute velocity in the upper 1000 m in the region between 36°W and 20°W for the period 1871–2010. Higher velocities between 32° and 36°N indicate the Azores Current jet. (C) Vertical variation of the mean absolute velocity averaged between the core latitudes over the entire period. (D) Time-series of the monthly absolute velocity averaged inside the Azores Current core (A) in the upper 1000 m. Shadowed area is the calculated standard deviation of the absolute velocity in the Azores Current region. (E) Time-series of the Azores Current’s average direction in the upper 300 m (solid blue line) and at the layer 300−1000 m (solid yellow line) between the latitudes of the Azores Current core (A). Blue and yellow shadowed areas are the calculated standard deviation of the mean direction flow in the upper 300 m and between 300−1000 m, respectively. The absolute velocity was calculated from the monthly zonal and meridional velocity fields from SODA-POP v2.2.4 (Carton and Giese, 2008; Giese and Ray, 2011). All time-series are smoothed using a 60-months running mean.
To map the northern boundary of the Azores Current, we define the Azores Front latitude using the established criterion of 15°C-isotherm coordinates at 200 m depth between 30°W and 20°W (Gould, 1985; Figure 6). West of 30°W, the Azores Front position shows higher variability, with a standard deviation of up to 2° in latitude. Therefore, we calculated the Azores Front position between 30°W and 20°W, where the Azores Front variability is less than 1.5°.
The integrated Ocean Heat Content (OHC) time-series in the upper 400 m was calculated following Levitus et al. (2012). The temperature anomaly fields were obtained by subtracting the climatological temperature (the temperature averaged over the entire period from 1871 to 2010) from the SODA-POP monthly temperature data. Häkkinen et al. (2016) showed a good agreement between the OHC calculated using the SODA-POP dataset and the OHC time-series determined by Levitus et al. (2012).
To better understand the long-term variability of the Azores Current and Front, it is instrumental to find their links, if any, to the major ocean-atmosphere interaction patterns in the North Atlantic Ocean – the North Atlantic Oscillation and the Atlantic Multidecadal Oscillation. The NAO is the dominant pattern in the North Atlantic Ocean, associated with altering the wind pattern, large-scale circulation, and water properties (Visbeck et al., 2003), affecting the upper water column even at the Mediterranean Water depths (e.g., Frazão and Waniek, 2021). The AMO, on the other hand, is the major pattern of the sea surface temperature variability and thus provides a fundamental description of the climate pattern in the North Atlantic Ocean. Therefore, we investigated the possible connection between the Azores Front position and the most dominant climate patterns in the North Atlantic, the winter NAO and the AMO. The latter has an oscillation period of about 60–80 years (Schlesinger and Ramankutty, 1994), meaning our time-series are sufficiently long to explore a possible link, if any, between AMO and the Azores Front. We used the unsmoothed detrended Atlantic Multidecadal Oscillation index (AMO) (available at https://psl.noaa.gov/data/timeseries/AMO/) and the North Atlantic Oscillation index (retrieved from https://climatedataguide.ucar.edu/climate-data/hurrell-north-atlantic-oscillation-nao-index-station-based). The correlation coefficients between AMO, OHC, and the Azores Front position were calculated using the monthly time-series smoothed with a 60-months running mean.
Validation of the Azores Current System in the SODA-POP Dataset
First, we evaluated how well the SODA-POP dataset represents the Azores Current. The surface circulation of the North Atlantic Subtropical Gyre averaged between 1871 and 2010 is depicted in Figure 1B. As this figure attests, the SODA-POP reproduces the surface circulation in the subtropical North Atlantic quite well, with all major currents of the subtropical gyre resolved. It is known that models often misrepresent the Azores Current (e.g., New et al., 2001). Therefore, at this first step, we estimated the mean circulation in the Azores Current region (see Figure 1B) and its transports, this time from the SODA reanalysis.
The average zonal velocity shows a well-defined eastward jet located between 32° and 35°N in the upper 1000 m comprising the Azores Current, bordered by two countercurrents south and north of the Azores Current jet (Figure 2). North of the Azores Current, the Azores Countercurrent (AzCC in Figure 2) appear between 36° and 38°N, a sub-surface intensified jet (Onken, 1993; Comas-Rodríguez et al., 2011). Also, the SODA-POP velocity components were previously used to fill the gaps in the Kiel 276 mooring dataset (Fründt et al., 2013). The authors compared the SODA-POP annual zonal and meridional velocities with the Kiel 276 velocity measurements at 240 m and 500 m, and they concluded that the difference in variance between the two datasets is less than the natural variances estimated for this region (for more details, see Fründt et al., 2013). The estimated zonal transports within the Azores Current jet varied zonally, with higher transports close to the MAR (mean of 14 ± 6 Sv west of 35°W), decreasing towards the Strait of Gibraltar (mean of 8 ± 4 Sv at 20°W). Our estimates agree with reported values estimated using observational data – e.g., Gould (1985) estimated a total volume transport of 10 to 12 Sv, Alves et al. (2002) reported transports of 11 to 18 Sv, and Comas-Rodríguez et al. (2011) estimated a mean transport of 13.9 Sv at 24.5°W; and also with models (Peliz et al. (2007) calculated an Azores Current transport of about 16 Sv west of 30°W and 8 Sv east of 20°W).
Fründt and Waniek (2012) compared the Azores Front position at 22°W calculated using the SODA-POP temperature fields with the Azores Front position retrieved from the observations in fourteen research cruises in the Azores region. A good agreement is found between the observed Azores Front position and the one calculated from SODA-POP, with the differences between both positions not exceeding 0.5°, corresponding to the horizontal resolution of the SODA-POP dataset (for more details, the reader is referred to Fründt and Waniek (2012) and their Figure 2).
Azores Current as a Part of the Extended Gulf Stream Region
The Gulf Stream’s velocity time-series averaged along the core latitudes for the upper 1000 m are shown in Figures 3B–D. The Gulf Stream absolute velocity for all regions demonstrates larger variability on inter-annual and decadal time scales, with the selected areas behaving quite differently (Figures 3B–D). Stronger variability in the Gulf Stream region occurs mainly on shorter time and spatial scales because the mesoscale activity in the western Atlantic sector is stronger than in the eastern Atlantic sector (Le Traon, 1991; Garçon et al., 2001). Also, the Gulf Stream jet is marked by strong mesoscale activity and the meanders intensifying towards the Gulf Stream extension region.
Periods of Gulf Stream intensification (1920−1930, the 1950s, 1980−2000) and weakening (end of the 1930s and beginning of the 1940s, 1960−1970, and after 2000) are similar in all three regions, although the intensity of strengthening and weakening varied (Figures 3B–D). The most pronounced Gulf Stream weakening episodes occurred between the 1960s and 1970s (accounting for 10% across the Gulf Stream pathway) and after 2000 in all sub-regions (Figures 3B–D). During the 1980s and 1990s, the velocity increased in both the Gulf Stream’s central and extension zone and simultaneously decreased in the western zone. Nevertheless, overall Gulf Stream weakening was observed in all sub-regions after the 1990s, agreeing with the most recent literature (e.g., Ezer, 2015; Dong et al., 2019).
Weakening of the Azores Current
The mean flow of the Azores Current showed a well-defined jet before the mid-1960s, with a maximum velocity at 34°N (Figures 2, 4B). At the end of the 1960s, however, the Azores Current experienced a drastic change, with a decrease in the jet’s velocity, and its axis moved roughly 0.5° northward (Figure 4B). In the current’s core, the Azores Current velocity exceeds 0.10 m s-1 at the surface, with a sub-surface maximum of up to 0.11 m s-1 at 15 m, and the vertically averaged velocity reaches 0.04 m s-1 (Figures 4C, D).
Over the last century, the Azores Current was in its stronger state between 1890 and 1960. Then, in the late 1960s, the velocity began decreasing in the upper 500 m, and by 1969 the core with the higher velocities raised from 300 m to 200 m, coinciding with the northward migration of the Azores Current jet (Figure 4C). The time-averaged direction of the flow in the Azores Current’s core is predominantly southeast (142°) in the upper 300 m and directed to the south below (172°). Concurrently with the velocity decrease, the flow’s direction in the upper 300 m turned from 136° to 154° after the 1960s (Figure 4E). A change in the flow’s direction in the upper thermocline (at 240 m and 500 m) was also observed by Fründt et al. (2013) at the Kiel 276 site, where the authors reported a divergent flow between the two depth levels after 2000. They suggested that a northward displacement of the North Atlantic Subtropical Gyre could result in an altered current regime. However, here we found that the altered current regime started before during the 1960s, and it affected the upper 600 m of the Azores Current’s core.
The vertically-averaged velocity inside the Azores Current core in the upper 1000 m varies on interannual and inter-decadal scales (Figure 4D). Variations on the annual scale were insignificant and therefore are not shown. The Azores Current velocity time-series is marked by two periods of weakening: the most pronounced decrease started in 1962 and continued until 1983, and a shorter event occurred between 2000 and 2005. Although the current speed increased slightly in the 1980s and 1990s, and afterward, at the end of the time-series, the Azores Current never returned to its pre-1960s state (Figures 4B–D). The acceleration of the Azores Current after the 1980s, and also in the second half of the 2000s, is confirmed by the current measurements taken close to the Azores Current jet, at the Kiel 276 mooring (33°N, 22°W) between 1980 and 2009, where almost daily continuous observations showed an increase in the current speed in the upper 1000 m from the 1980s to 2000s (Siedler et al., 2005; Fründt et al., 2013; Frazão et al., 2021). At this site, according to the authors, the velocity noticeably increased on a decadal scale, especially in the transition from the 1980s to the 1990s. From the end of the 1990s until 2004, a decrease in the velocity in the upper thermocline (upper 500 m) was observed, followed by a significant increase until 2009 (Fründt et al., 2013). Mean current speeds averaged over 1000 m prior to and after 1960 are 0.03 m s-1 and 0.02 m s-1 (Figure 4D), respectively, resulting in a substantial Azores Current reduction of 24% after the 1960s.
Interannual variability of the Azores Current has been shown to be only mildly impacted by the wind (Volkov and Fu, 2010). Calculation of the correlation between the winter NAO and the intensity of the Azores Current did not result in a significant correlation that could explain the interannual variability of the Azores Current. However, for timescales over 20 years or longer, the correlation between the winter NAO and the annual Azores Current velocity is significant and positive and has a maximum for the NAO leading the Azores Current velocity by 41 years (ρ = 0.45, p < 0.05; not shown). Similarly, Ezer and Dangendorf (2022) calculated positive correlation coefficients on multi-decadal timescales and long-term trends between the sea level and the NAO in the Azores Current region.
The three regions of Azores Current are highly correlated (ρ > 0.8, p < 0.05), and the average velocity at the core increase towards the MAR (Figure 5), a result consistent with other observations and models (e.g., Peliz et al., 2007). The correlation between the sub-regions along the Azores Current time-series has a maximum with a lag of three months between them, with the easternmost region leading the western. The increase of the Azores Current’s velocity at the beginning of the time-series starts earlier in the easternmost region (1875), and it is followed by the central and then western regions until 1893. In the following period up to 1962, the three areas behave similarly. The drastic weakening along the Azores Current pathway occurred almost synchronously in the western and central zones (starting in 1962), while the changes in the easternmost area lagged the other two by about one year. In the 1960s, the strong decline of the average velocity at the core occurred in the western region close to the MAR (accounting for up 19%), while in the central and eastern zones, the decrease of the average velocity at the core accounted for 15% (Figure 5).
Figure 5
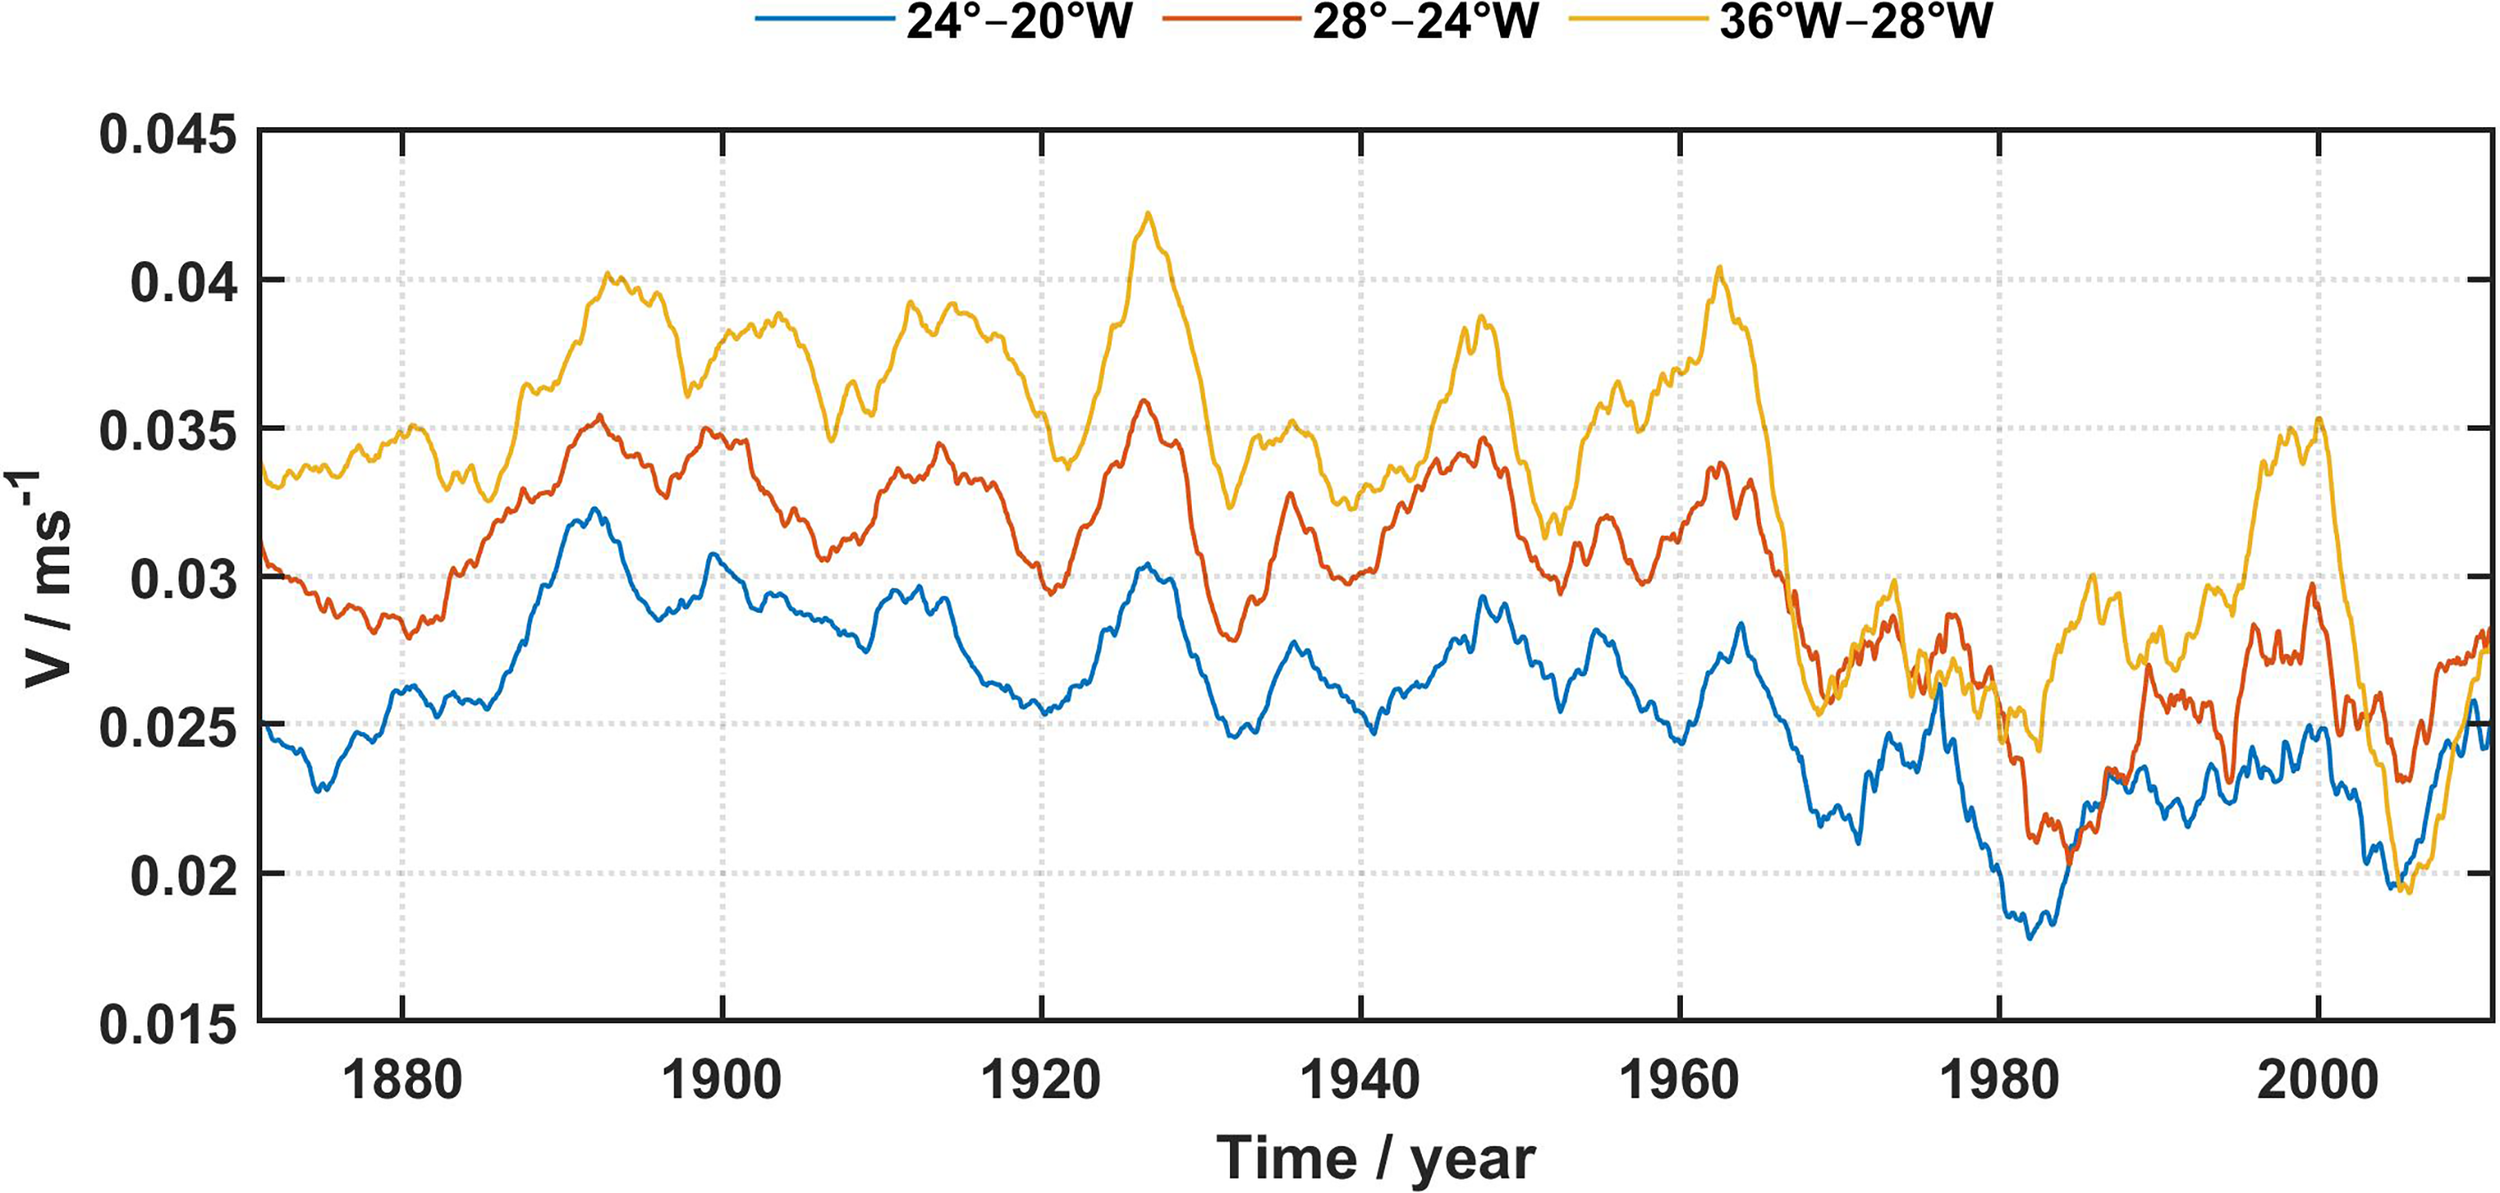
The Azores Current sub-regions. Monthly absolute velocity averaged inside the core of the Azores Current (between 32° and 36°N) in the upper 1000 m between 1871 and 2010. The Azores Current is divided into three sub-regions according to the eddy kinetic energy dynamic at the surface (Barbosa Aguiar et al., 2011; Silva-Fernandes and Peliz, 2020): western (36°W–28°W, yellow line), central (28°W–24°W, orange line), and eastern (24°W–20°W, blue line). All time-series are smoothed with a 60-months running mean.
Comparing the Gulf Stream and Azores Current velocity series reveals a striking similarity between the periods of weakening (during the 1960s and after 2000) and strengthening (during the 1980s and 1990s, Figures 3B–D, 4D). The correlations between the Gulf Stream (Figures 3B–D) and the Azores Current absolute velocity (Figure 4D) show a striking negative value (significant at p < 0.05). The highest negative correlations are found between the Azores Current and the central and eastern Gulf Stream time-series (ρ > –0.5), while between the western Gulf Stream and Azores Current, the correlation is weak yet still negative (ρ = –0.1). The latter weaker correlation is possibly due to the different driving mechanisms that control both currents – while the western flank of the Gulf Stream (west of 65°W) is constrained by the shelf (shallower than 200 m), the central and eastern flanks are not topography-constrained and behave as a free jet (Dong et al., 2019), similarly to the Azores Current.
Interesting to note is the change of the correlation signal throughout the last century. Before the drastic weakening of the Azores Current in the 1960s, the correlation coefficient between the Azores Current and all regions of the Gulf Stream is significant and negative. The opposite situation is observed after the 1960s, with the correlation coefficients between both currents reversing to a positive value. However, the correlation between the two currents had almost ceased after 2000 (it is not yet clear to us what caused this sudden drop in correlation).
Azores Front
The Azores Front position shows large inter-annual and decadal variability; however, it does not have a significant seasonality (not shown in Figure 6). The Azores Front position shows slight variation around the mean before the 2000s (34.9°N ± 0.5°), with periods of southward (1880–1925, 1935–1948, 1957–1974, 2006–2010) and northward (1871–1880, 1926–1934, 1975–2005) migration (Figure 6). Notably, the progressive northward Azores Front migration starting in the mid-1970s and continuing until 2005, at an estimated rate of ≈ 12 m day-1, is twice as high as estimated by Fründt and Waniek (2012) at 22°W for the period 1966–2007.
Figure 6
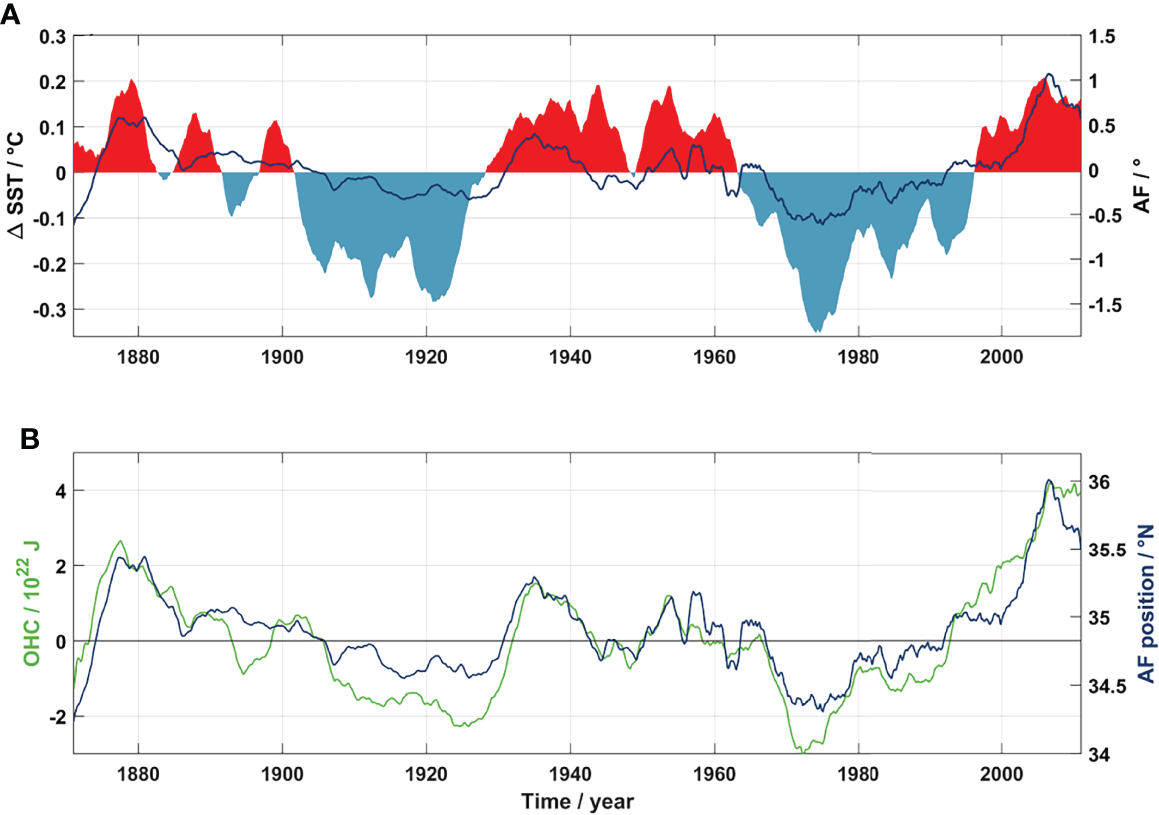
The Azores Front. (A) Monthly detrended Azores Front position (solid dark blue line) superimposed on the Atlantic Multidecadal Oscillation index (shadowed areas: positive phase in red; negative phase in blue). (B) Monthly Azores Front position (solid dark blue line) and integrated OHC in the upper 400 m (solid green line; details on the OHC calculation are given in Data and Methods). The Azores Front position is an average of all the Azores Front positions between 30°W and 20°W. The monthly detrended time-series was calculated by removing the linear trend for the entire period. All time-series are smoothed with a 60-months running mean.
North and south of the Azores Current, the meridional Ekman transport forms a convergence zone within which the Azores Front lies (Fründt and Waniek, 2012). Changes in the wind direction impact the position of the convergence zone, which ultimately alters the Azores Front position. The correlation between the winter NAO index and the annual mean Azores Front position was not significant at any confidence level (and therefore is not shown). This result is similar to the findings in Seidov et al. (2019a), where they did not find a significant correlation between the Gulf Stream thermal front and NAO. Although some authors already showed the NAO impact on the Azores Front position, with the Azores Front lagging NAO from months to years (Volkov and Fu, 2011; Fründt and Waniek, 2012), NAO does not seem to be the main driver of the Azores Front variability for the period 1871–2010, as it was not the main driver of the Gulf Stream position either on the decadal and longer time scale (Seidov et al., 2017a). There may be several reasons why we did not find a significant correlation between the NAO and the Azores Front position. First, the different definitions used to determine the Azores Front position, either using eddy kinetic energy at the surface (Volkov and Fu, 2011), the temperature at 250 m (Fründt and Waniek, 2012) or 200 m in this study. Second, NAO effects seen in Azores Front are expected to be lagging at 200 m and stronger at the surface due to the adjustment of the water column to atmospheric forcing (Visbeck et al., 2003). Finally, even though Fründt and Waniek (2012) and Volkov and Fu (2011) determined significant correlations for shorter periods, Fründt and Waniek (2012) noticed that the correlation between NAO and Azores Front at 22°W changed after 2003. Moreover, Williams et al. (2000) found that the correlation between NAO and nutrient supply in the eastern Atlantic is not significant, in contrast to the western and central Atlantic basin between 1968 and 1993.
The Azores Front position, together with the AMO and the OHC in the upper 400 m, are presented in Figure 6. The Azores Front position shows similar behavior as the AMO (Figure 6A), but the similarity between the Azores Front position and OHC is even more striking (Figure 6B). Periods of increase (decrease) in OHC are consistent with a northward (southward) propagation of the Azores Front (Figure 6B). The correlation coefficient between Azores Front and AMO is 0.69, and between Azores Front and OHC is 0.92, both at 0-lag and significant at the 95% confidence level. The correlation coefficient between the AMO and the Azores Front position is maximum at 0.7, with the AMO leading the Azores Front position by 13 months. The Azores Front definition used partly implies the high correlation between Azores Front and AMO and OHC as this delimits the extension of warmer subtropical waters and mirrors the thermal conditions of the upper water column in this part of the Northeast Atlantic.
Discussion and Implications
The use of assimilation products, like the one in this study, helps to analyze the basin-scale ocean circulation in general, and in our case – with a special focus on the northern border of the North Atlantic subtropical gyre. Our analysis so far points to the close though time-lagged connection between the Gulf Stream climatology and dynamics and the Azores Current behavior − an extension of the Gulf Stream in the Northeast Atlantic. We found that the Azores Current responds to the changes in all three sections of the Gulf Stream, with the signal of weakening or strengthening of the Gulf Stream traveling toward the Azores Current within two years, most likely driven by the observed decline in the central and extension parts of the Gulf Stream current. Indeed, the Azores Current weakening in the 1960s and 1970s (Figure 4D) was observed two years after the weakening of the Gulf Stream started (Figure 3).
While no sufficient data is available for the North Atlantic before the 1980s, there were some attempts to reconstruct the circulation using hydrographic data. For example, Greatbatch et al. (1991), using a diagnostic model, showed that the Gulf Stream transport was reduced by 30% in the early 1970s compared to the mid-1950s, and Ezer and Dangendorf (2020) employed a global reconstruction of the sea level and discovered similar weakening in the 1960s and 1970s. Levitus (1989a) hypothesized that this weakening might be due to density changes in the subsurface of the North Atlantic. Our analysis follows this line of argument. The most recent weakening in the Gulf Stream region and Azores Current (after 2000) also allegedly links to a new slowdown of the AMOC (Bryden et al., 2005; Caesar et al., 2021). Ezer (2015) and Ezer and Dangendorf (2020) suggested that AMOC weakening might be linked to the Gulf Stream slowdown both in the 1960s/1970s and late 2000s. Possibly, slowing down of the AMOC, which may relate, at least partially, to reduced Gulf Stream transports east of the U.S. coast, leads to a delayed weakening of the Azores Current in the eastern North Atlantic. However, different views of the variability in the Gulf Stream transport arose in the last decade, where some authors advocate that the Gulf Stream transport is not declining (e.g., Rossby et al., 2014; Rossby et al., 2019) and neither is the AMOC (e.g., Willis, 2010; Moat et al., 2020). For example, Rossby et al. (2014, 2019) did not detect a long-term change in the Gulf Stream along the Oleander line. Nonetheless, as pointed out by Ezer (2015), the part of the Gulf Stream in the Oleander line (near 70.3°W) does not correlate with the AMOC nor the Florida Current due to the eddies and meandering of the Gulf Stream. The AMOC transports calculated at 26°N with the SODA-POP dataset are close to the observational AMOC transports, with an increasing trend in the AMOC transports since the 1960s (Tett et al., 2014). Additionally, AMOC transports estimated at mid- and higher latitudes show larger interannual variability, with alternating periods of stronger and weaker AMOC (e.g., Bryden et al., 2005; Willis, 2010; Moat et al., 2020). As noted by Moat et al. (2020), it is still difficult to assess with certainty whether the AMOC is recovering or not, partly due to the short time-series of continuous measurements.
The regional differences in the Gulf Stream velocity may possibly be attributed to the behavior of the Gulf Stream jet at its different parts. For example, southwest of Cape Hatteras, the jet is strongly controlled by bottom topography, while east of Cape Hatteras, where the Gulf Stream separates from the continental shelf and slope, the flow becomes a free baroclinic jet not constrained by topography (Dong et al., 2019). Different trends were also found between the eastern and western parts of the Gulf Stream between 1993 and 2016 (e.g., Andres et al., 2020; Zhang et al., 2020), reinforcing the zonal behavior between the extension and the western zone of the Gulf Stream. Additionally, the presence of cold and warm recirculation gyres north and south of the Gulf Stream, respectively, has been shown to influence the position of the Gulf Stream jet (e.g., Marchese, 1999).
The baroclinic instability along the Azores Current jet leads to the formation of large mesoscale anticyclonic structures north and cyclonic eddies south of the jet, with diameters on the order of 200 km and timespans of 40 to 100 days (Müller and Siedler, 1992; Alves et al., 2002). The three-month lag between the Azores Current sub-regions is of the same order as the relevant timescales associated with the meandering of the Azores Front-Current system (Siedler et al., 1985; Müller and Siedler, 1992). In fact, Silva-Fernandes and Peliz (2020) determined the number of eddies in the last 25 years in the Azores Current region. They showed that most of the eddies expected to be associated with the Azores Current have a lifetime of 16 weeks, 54% of these were cyclonic, i.e., propagating westward. Those cyclonic eddies were shown to propagate westward with a combination of Rossby waves and advective flow characteristics (Pingree and Sinha, 2001).
Our interpretation of the results in Figure 5 is inherently incomplete as we cannot offer a satisfying conclusion on how the variability evident in the time-series can be explained fully and through which processes it may be forced and maintained. Indeed, the speed maxima in different segments of the Azores Current are not synchronized universally throughout the entire time of the analyzed record. Sometimes they are synchronized, sometimes obviously and even strikingly desynchronized, and being anything between these two extremes during other time intervals. Nevertheless, we provide this result to encourage a discussion that may shed a better light than what we can currently offer in our analysis.
The 1960s seem to be a turning point for changes in the North Atlantic circulation and water properties from the 1950s to the 1970s, as reported in a number of studies (e.g., Levitus, 1989a; Levitus, 1989b; Greatbatch et al., 1991; Grey et al., 2000; Reverdin, 2010; Yeager and Danabasoglu, 2014). During this period, we found a northward displacement of the Azores Current’s jet by 0.5° starting in the late 1960s (Figure 4B), a change in the signal of the correlation coefficient between the Azores Current and the Gulf Stream in the 1960s, and gradual poleward migration of the Azores Front starting in the 1970s. We offer a working hypothesis that the existence of two transient periods, before and after the 1960s, was driven by some mechanisms that were variable in time. That is, before the 1960s, the wind had a preponderant role in the North Atlantic circulation, namely over the Gulf Stream, North Atlantic Current, and Azores Current, with the signal between the North Atlantic Current and the Gulf Stream better correlated than with the Azores Current. However, after roughly the 1960s, the ongoing surface warming began (Figure 6), and the Gulf Stream became stronger influenced by increasing density differences between the warm and cold recirculation gyres, south and north of the Gulf Stream jet, respectively. By that time, the correlation between the Gulf Stream path (and possibly the Gulf Stream strength) with the zero line of the wind stress curl reduced and, in contrast, increased with the AMO (Nigam et al., 2018; Seidov et al., 2019a). After the onset of surface warming, the OHC began to rise, controlled by a combination of the surface warming and the circulation pattern, and started to play a more critical role, leading to a stronger correlation between the AMO and OHC and the Azores Current and the Gulf Stream. The largest increase of OHC was observed in the North Atlantic in the upper 2000 m (Levitus et al., 2012) and is concentrated in the warm recirculation gyre of the Gulf Stream (Seidov et al., 2017). After 2000, the OHC pool south of the Gulf Stream increased very quickly, and therefore, the Gulf Stream path deviated northward quite strongly. At that time, the largest weakening of AMOC was reported (e.g., Ezer, 2015; Caesar et al., 2021). As a result, the subpolar gyre strengthened (Zhang, 2008), accompanied by a coincident weakening of the Gulf Stream and Azores Current. It seems that the dipole observed by Zhang (2008), where a stronger (weaker) AMOC induces a weaker (stronger) subpolar gyre, can also be viewed as a seesaw in the Gulf Stream changes signal between the North Atlantic Current and the Azores Current, depending on the Gulf Stream behavior in the bifurcation zone between the two major current systems in the North Atlantic Ocean. However, this hypothesis is very difficult to verify, so we provide our explanation for a discussion rather than a definitive conclusion. Perhaps the best way to prove or disprove the relative role of surface warming and its consequences and the wind stress over the North Atlantic would be through numerical hindcast experiments that could compare the Gulf Stream and the Azores Current connection with and without the 20th-century surface warming. Nevertheless, this hypothesis is far beyond the scope of our research and requires further investigation.
Global and regional models often misrepresent the Azores Current, e.g., New et al. (2001), because of the difficulties of adequately resolving the Mediterranean Outflow, especially close to the Gulf of Cadiz (Jia, 2000). The difficulty in properly represent the Azores Current might be one of the reasons why its role in decadal and longer-term variability of the North Atlantic large-scale circulation was underestimated and, therefore, did not attract much attention. Recently, Jia (2000); Özgökmen et al. (2001), and Kida et al. (2008) proposed that the effect of water mass exchange in the Gulf of Cadiz between the Atlantic Central Water and the Mediterranean Outflow (known as the β-plume mechanism) could impact the upper-ocean circulation. In particular, it may lead to a cyclonic recirculation consisting of the Azores Current and the Azores Countercurrent in the north. However, this hypothesis does not explain some observational characteristics of the Azores Current, namely the intensity of the jet and the higher transports west of the Azores islands far from the Gulf of Cadiz (source region). Although the temporal and spatial distribution of MOW in the Northeast Atlantic varies through time (Bozec et al., 2011; Frazão and Waniek, 2021) and ultimately could influence the Azores Current positioning, it is not yet conclusive, and addressing this issue may require further research.
The northward propagation of the Azores Front position from the 1970s until the mid-2000 is similar to the finding that the variations of the Gulf Stream position correlate with AMO and OHC but not with NAO (Seidov et al., 2017; Seidov et al., 2019a). Several publications have shown that the sea surface path of the Gulf Stream correlates with the NAO (e.g., Joyce et al., 2000; Gangopadhyay et al., 2016; Watelet et al., 2017), and we do not dispute those findings. However, Seidov et al. (2019a) indicate that the observed Gulf Stream North Wall (GSNW) position west of 50°W is very resilient and is only mildly impacted by the overall North Atlantic atmospheric variability. Even at the extension zone, i.e., east of 50°W, where the Gulf Stream branches into the North Atlantic Current and the Azores Current, the correlation with the NAO is not significant. Instead, they showed that the strongest correlation of the GSNW position east of 50°W is between the AMO and ocean heat content on decadal and longer time scales. A detailed discussion of the weaker dependence of the Gulf Stream path on NAO compared with AMO and OHC can be found in Seidov et al. (2019a). Notwithstanding, other authors also found a strong correlation between the Gulf Stream northward excursion and the AMO index (e.g., Nigam et al., 2018; Ezer and Dangendorf, 2020). Therefore, it can be argued that a gradual change in the AMO and the OHC over the upper 400 m in the 1970s (Figure 6) coincided with the poleward displacement of the Azores Front and also the Gulf Stream path, both defined via a temperature index (Seidov et al., 2019a). Although both AMO and OHC are highly coherent (ρ = 0.77, p < 0.05), as pointed out by Seidov et al. (2017) for the North Atlantic basin, they are not linearly connected because the OHC depends on both thermal conditions at the surface (hence AMO) and the Ekman pumping (Seidov et al., 2019b). Thus, since OHC depends on both the sea surface temperature and the wind stress curl, there is a better correlation between the OHC and the current’s dynamics (Seidov et al., 2019a).
The poleward migration of the Azores Front, as the border separating the waters with higher biological productivity in the north from the waters with lower productivity in the south, is coherent with an expansion of the oligotrophic areas of the main gyres (Polovina et al., 2008). Additionally, the Azores Front movements have been shown to influence not only the primary production in the region but also affect the export production in the Northeast Atlantic (e.g., Waniek et al., 2005; Fründt and Waniek, 2012; Fründt et al., 2015; Stern et al., 2017; Stern et al., 2019). Marine productivity decline in the oligotrophic regions since the 1990s (Boyce et al., 2010) is associated with rising sea surface temperature (Behrenfeld et al., 2006; Martinez et al., 2009). It is projected to further decline by up to 20% by the end of the 21st century (Steinacher et al., 2010). In a first attempt, Fründt et al. (2015) estimated a 700 megaton reduction of carbon uptake over the North Atlantic subtropical region between 1871 and 2008. Nevertheless, the understanding of the future impact of a northward expansion of the subtropical gyre on the biogeochemical cycles in this region requires further investigation.
The northward propagation of both the Azores Current jet and the Azores Front after the 1970s poses the question of whether the subtropical gyre is moving northward as an entity or the subtropical gyre is simply expanding. Answering this question is critical for understanding the subtropical gyre dynamics as a competitor to AMOC internal variability. Northward migration of the entire subtropical gyre would have forced the relocation of the main surface currents, leading to drastic changes in the basin-wide circulation. In connection with this problem, several studies have been exploring the size and intensity of the North Atlantic subpolar gyre (Koul et al., 2020). Depending on the employed methodology, some authors have shown a decline in size and strength (e.g., Häkkinen and Rhines, 2004), while others did not find any significant change (e.g., Daniault et al., 2011). Unfortunately, the time-series in these studies are too short to conclude with greater certainty whether a northward shift of the northern limit of the subtropical gyre does lead to a shrinkage of the subpolar gyre. Yang et al. (2020), using observational data analysis and numerical modeling, showed a poleward shift of the main ocean gyres. They argue that such a poleward shift was likely caused by global warming in the last four decades, coupled with a displacement of the extratropical atmospheric circulation.
Regardless of the overall change in the size or the northward propagation of the northern border only, we are now confident that the Atlantic Meridional Overturning Circulation, Gulf Stream, and Azores Current slowdown are tightly connected and are the parts of a larger picture of the North Atlantic circulation variability on the decadal and longer time scale. The bottom line here is that we confidently show that the changes in large-scale circulation reflected in the Gulf Stream and AMOC weakening/strengthening pattern are detectable in the low energy region of the northeastern Atlantic, embracing the biogeochemically very important regions of the Azores Current and its thermohaline front.
Funding
This work was funded by the German Research Foundation grant, WA 2175/5-1 (J.J.W.), and by the Leibniz Institute for Baltic Sea Research Warnemünde (DES-B, RDP, HCF).
Publisher’s Note
All claims expressed in this article are solely those of the authors and do not necessarily represent those of their affiliated organizations, or those of the publisher, the editors and the reviewers. Any product that may be evaluated in this article, or claim that may be made by its manufacturer, is not guaranteed or endorsed by the publisher.
Statements
Data availability statement
The original contributions presented in the study are included in the article/supplementary material. Further inquiries can be directed to the corresponding author.
Author contributions
Conceptualization: HCF and JJW; Methodology: HCF and JJW; Visualization: HCF and RDP; Funding acquisition: JJW and DES-B; Supervision: JJW and DS; Writing – original draft: HCF; Writing – review and editing: HCF, RDP, DES-B, DS, and JJW. All authors contributed to the article and approved the submitted version.
Acknowledgments
We thank the three reviewers for their valuable comments to improve the manuscript.
Conflict of interest
The authors declare that the research was conducted in the absence of any commercial or financial relationships that could be construed as a potential conflict of interest.
References
1
Alves M. Gaillard F. Sparrow M. Knoll M. Giraud S. (2002). Circulation Patterns and Transport of the Azores Front-Current System. Deep Sea Res. II49, 3983–4002. doi: 10.1016/S0967-0645(02)00138-8
2
Andres M. Donohue K. A. Toole J. M. (2020). The Gulf Stream’s Path and Time-Averaged Velocity Structure and Transport at 68.5°W and 70.3°W. Deep Sea Res. Part I156, 103179. doi: 10.1016/j.dsr.2019.103179
3
Barbosa Aguiar A. C. Peliz A. J. Cordeiro Pires A. Le Cann B. (2011). Zonal Structure of the Mean Flow and Eddies in the Azores Current System. J. Geophys. Res.116, C02012. doi: 10.1029/2010JC006538
4
Behrenfeld M. J. O’Malley R. T. Siegel D. A. McClain C. R. Sarmiento J. L. Feldman G. C. et al . (2006). Climate-Driven Trends in Contemporary Ocean Productivity. Nature444, 752–555. doi: 10.1038/nature05317
5
Boyce D. G. Lewis M. R. Worm B. (2010). Global Phytoplankton Decline Over the Past Century. Nature446, 591–596. doi: 10.1038/nature09268
6
Boyer T. P. Antonov J. I. Baranova O. K. Garcia H. E. Johnson D. R. Locarnini R. A. et al . (2009). World Ocean Database 2009. Ed. LevitusS. (Wash., D.C.: U.S. Gov. Printing Office), 216 pp. NOAA Atlas NESDIS 66.
7
Bozec A. Lozier M. S. Chassignet E. P. Halliwell G. R. (2011). On the Variability of the Mediterranean Outflow Water in the North Atlantic From 1948 to 2006. J. Geophys. Res.116, C09033. doi: 10.1029/2011JC007191
8
Bryden H. L. Longworth H. R. Cunningham S. A. (2005). Slowing of the Atlantic Meridional Overturning Circulation at 25°N. Nature438, 655–657. doi: 10.1038/nature04385
9
Caesar L. McCarthy G. D. Thornalley D. J. R. Cahill N. Rahmstorf S. (2021). Current Atlantic Meridional Overturning Circulation Weakest in the Last Millennium. Nat. Geosci.14, 118–120. doi: 10.1038/s41561-021-00699-z
10
Caesar L. Rahmstorf S. Robinson A. Feulner G. Saba V. (2018). Observed Fingerprint of a Weakening Atlantic Ocean Overturning Circulation. Nature556, 191–196. doi: 10.1038/s41586-018-0006-5
11
Carton J. A. Giese B. S. (2008). A Reanalysis of Ocean Climate Using Simple Ocean Data Assimilation (SODA). Mon. Weather Rev.136, 2999–3017. doi: 10.1175/2007MWR1978.1
12
Collins M. Knutti R. Arblaster J. Dufresne J.-L. Fichefet T. Friedlingstein P. et al . (2013). “Long-Term Climate Change: Projections, Commitments and Irreversibility,” in Climate Change 2013: The Physical Science Basis Contribution of Working Group I to the Fifth Assessment Report of the Intergovernmental Panel on Climate Change. Eds. StockerT. F.QinD.PlattnerG.-K.TignorM.AllenS. K.BoschungJ.NauelsA.XiaY.BexV.MidgleyP. M. (Cambridge, United Kingdom and New York, NY, USA: Cambridge University Press).
13
Comas-Rodríguez I. Hernández-Guerra A. Fraile-Nuez E. Martínez-Marrero A. Benítez-Barrios V. M. Pérez-Hernández M. D. et al . (2011). The Azores Current System From a Meridional Section at 24.5°W. J. Geophys. Res.116, C09021. doi: 10.1029/2011JC007129
14
Compo G. P. Whitaker J. S. Sardeshmukh P. D. Matsui N. Allan R. J. Yin X. et al . (2011). The Twentieth Century Reanalysis Project. Q. J. R. Meteorol. Soc.137, 1–28. doi: 10.1002/qj.776
15
Daniault N. Mercier H. Lherminier P. (2011). The 1992–2009 Transport Variability of the East Greenland-Irminger Current at 60°N. Geophys. Res. Lett.38, L07601. doi: 10.1029/2011GL046863
16
Daniault N. Mercier H. Lherminier P. Sarafanov A. Falina A. Zunino P. et al . (2016). The Northern North Atlantic Ocean Mean Circulation in the Early 21st Century. Prog. Oceanogr.146, 142–158. doi: 10.1016/j.pocean.2016.06.007
17
de Coëtlogon G. Frankignoul C. Bentsen M. Delon C. Haak H. Masina S. et al . (2006). Gulf Stream Variability in Five Oceanic General Circulation Models. J. Phys. Oceanogr.36, 2119–2135. doi: 10.1175/JPO2963.1
18
Dong S. Baringer M. O. Goni G. J. (2019). Slow Down of the Gulf Stream During 1993–2016. Sci. Rep.9, 6672. doi: 10.1038/s41598-019-42820-8
19
Ezer T. (2015). Detecting Changes in the Transport of the Gulf Stream and the Atlantic Overturning Circulation From Coastal Sea Level Data: The Extreme Decline in 2009-2010 and Estimated Variations for 1935–2012. Global Planet. Change129, 23–36. doi: 10.1016/j.gloplacha.2015.03.002
20
Ezer T. Atkinson L. P. Corlett W. B. Blanco J. L. (2013). Gulf Stream’s Induced Sea Level Rise and Variability Along the U.S. Mid-Atlantic Coast. J. Geophys. Res.118 (2), 685–697. doi: 10.1002/jgrc.20091
21
Ezer T. Dangendorf S. (2020). Global Sea Level Reconstruction for 1990–2015 Reveals Regional Variability in Ocean Dynamics and an Unprecedented Long Weakening in the Gulf Stream Flow Since the 1990s. Ocean Sci.16, 997–1016. doi: 10.5194/os-16-997-2020
22
Ezer T. Dangendorf S. (2022). Spatiotemporal Variability of the Ocean Since 1900: Testing a New Analysis Approach Using Global Sea Level Reconstruction. Ocean Dyn.72, 79–97. doi: 10.1007/s10236-021-01494-5
23
Frazão H. C. Prien R. D. Müller T. J. Schulz-Bull D. E. Waniek J. J. (2021). 30 Years of Temporal Variability of Temperature and Currents Below the Main Thermocline Between 1980–2009 in the Subtropical Northeast Atlantic (Kiel 276, 33°N, 22°W). J. Mar. Syst.217, 103517. doi: 10.1016/j.jmarsys.2021.103517
24
Frazão H. C. Waniek J. J. (2021). Mediterranean Water Properties at the Eastern Limit of the North Atlantic Subtropical Gyre Since 1981. Oceans2, 266–280. doi: 10.3390/oceans2010016
25
Fründt B. Dippner J. W. Schulz-Bull D. E. Waniek J. J. (2015). Chlorophyll a Reconstruction From In Situ Measurements: 2. Marked Carbon Uptake Decrease in the Last Century. J. Geophys. Res.: Biogeosci.120, 246–253. doi: 10.1002/2014JG002692
26
Fründt B. Müller T. J. Schulz-Bull D. E. Waniek J. J. (2013). Long-Term Changes in the Thermocline of the Subtropical Northeast Atlantic (33°N, 22°W). Prog. Oceanogr.116, 246–260. doi: 10.1016/j.pocean.2013.07.004
27
Fründt B. Waniek J. J. (2012). Impact of the Azores Front Propagation on Deep Ocean Particle Flux. Cent. Eur. J. Geosci.4, 531–544. doi: 10.2478/s13533-012-0102-2
28
Gangopadhyay A. Chaudhuri A. H. Taylor A. H. (2016). On the Nature of Temporal Variability of the Gulf Stream Path From 75°W to 55°W. Earth Interact.20, 1–17. doi: 10.1175/EI-D-15-0025.1
29
Garçon V. G. Oschlies A. Doney S. C. McGillicuddy D. Waniek J. (2001). The Role of Mesoscale Variability on Plankton Dynamics in the North Atlantic. Deep Sea Res. II48, 2199–2226. doi: 10.1016/S0967-0645(00)00183-1
30
Giese B. S. Ray S. (2011). El Niño Variability in Simple Ocean Data Assimilation (SODA), 1871–2008. J. Geophys. Res.116, C02024. doi: 10.1029/2010JC006695
31
Gould W. J. (1985). Physical Oceanography of the Azores Front. Prog. Oceanogr.14, 167–190. doi: 10.1016/0079-6611(85)90010-2
32
Greatbatch R. J. Fanning A. F. Goulding A. D. Levitus S. (1991). A Diagnosis of Interpentadal Circulation Changes in the North Atlantic. J. Geophys. Res.96, 22009–22023. doi: 10.1029/91JC02423
33
Grey S. M. Haines K. Troccoli A. (2000). A Study of Temperature Changes in the Upper North Atlantic: 1950–94. J. Climate13, 2697–2711. doi: 10.1175/1520-0442(2000)013<2697:ASOTCI>2.0.CO;2
34
Häkkinen S. Rhines P. B. (2004). Decline of Subpolar North Atlantic Circulation During the 1990s. Science304, 555–559. doi: 10.1126/science.1094917
35
Häkkinen S. Rhines P. B. Worthen D. L. (2016). Warming of the Global Ocean: Spatial Structure and Water-Mass Trends. J. Climate29 (13), 4949–4963. doi: 10.1175/JCLI-D-15-0607.1
36
Jia Y. (2000). Formation of an Azores Current Due to Mediterranean Overflow in a Modeling Study of the North Atlantic. J. Phys. Oceanogr.30, 2342–2358. doi: 10.1175/1520-0485(2000)030<2342:FOAACD>2.0.CO;2
37
Jones P. W. (1999). First- and Second-Order Conservative Remapping Schemes for Grids in Spherical Coordinates. Mon. Weather Rev.127, 2204–2210. doi: 10.1175/1520-0493(1999)127<2204:FASOCR>2.0.CO;2
38
Joyce T. M. Deser C. Spall M. A. (2000). The Relation Between Decadal Variability of Subtropical Mode Water and the North Atlantic Oscillation. J. Climate13, 2550–2569. doi: 10.1175/1520-0442(2000)013<2550:TRBDVO>2.0.CO;2
39
Joyce T. M. Zhang R. (2010). On the Path of the Gulf Stream and the Atlantic Meridional Overturning Circulation. J. Climate23, 3146–3154. doi: 10.1175/2010JCLI3310.1
40
Käse R. H. Siedler G. (1982). Meandering of the Subtropical Front South-East of the Azores. Nature300, 245–246. doi: 10.1038/300245a0
41
Käse R. H. Siedler G. (1982). Meandering of the Subtropical Front South-East of the Azores. Nature300, 245–246. doi: 10.1038/300245a0
42
Kida S. Price J. F. Yang J . (2008). The Upper-Oceanic Response to Overflows: A Mechanism for the Azores Current. J. Phys. Oceanography38, 880–895. doi: 10.1175/2007JPO3750.1
43
Lamas L. Peliz Á. Ambar I. Barbosa Aguiar A. Maximenko N. Teles-Machado A. (2010). Evidence of Time-Mean Cyclonic Cell Southwest of Iberian Peninsula: The Mediterranean Outflow-Driven β-Plume? Geophys. Res. Lett.37, L12606. doi: 10.1029/2010GL043339
44
Le Traon P. Y. (1991). Time Scales of Mesoscale Variability and Their Relationship With Space Scales in the North Atlantic. J. Mar. Res.49, 467–492. doi: 10.1357/002224091784995828
45
Le Traon P.-Y. De May P. (1994). The Eddy Field Associated With the Azores Front East of the Mid-Atlantic Ridge as Observed by the Geosat Altimeter. J. Geophys. Res.99 (C5), 9907–9923. doi: 10.1029/93JC03513
46
Levitus S. (1989a). Interpentadal Variability of Temperature and Salinity at Intermediate Depths of the North Atlantic Ocean 1970–1974 Versus 1955–1959. J. Geophys. Res.94, 6091–6131. doi: 10.1029/JC094iC05p06091
47
Levitus S. (1989b). Interpentadal Variability of Salinity in the Upper 150 M of the North Atlantic Ocean 1970-1974 Versus 1955–1959. J. Geophys. Res.94 (C7), 9679–9685. doi: 10.1029/JC094iC07p09679
48
Levitus S. Antonov J. I. Boyer T. P. Baranova O. K. Garcia H. E. Locarnini R. et al . (2012). World Ocean Heat Content and Thermosteric Sea Level Change (0–2000 M), 1955–2010. Geophys. Res. Lett.39, L10603. doi: 10.1029/2012GL051106
49
Levitus S. Antonov J. I. Boyer T. P. Locarnini R. A. Garcia H. E. Mishonov A. V. (2009). Global Ocean Heat Content 1955-2008 in Light of Recently Revealed Instrumentation Problems. Geophys. Res. Lett.36, L07608. doi: 10.1029/2008GL037155
50
Maillard C. Käse R. (1989). The Near-Surface Flow in the Subtropical Gyre South of the Azores. J. Geophys. Res.94 (C11), 16133–16140. doi: 10.1029/JC094iC11p16133
51
Marchese P. J. (1999). Variability in the Gulf Stream Recirculation Gyre. J. Geophys. Res.14 (C12), 29549–29560. doi: 10.1029/1999JC900254
52
Martinez E. Antoine D. D’Ortenzio F. Gentili B. (2009). Climate-Driven Basin-Scale Decadal Oscillations of Oceanic Phytoplankton. Science326, 1253–1256. doi: 10.1126/science.1177012
53
Moat B. I. Smeed D. A. Frajka-Williams E. Desbruyères D. G. Beaulieu C. Johns W. E. et al . (2020). Pending Recovery in the Strength of the Meridional Overturning Circulation at 26°N. Ocean Sci.16, 863–874. doi: 10.5194/os-16-863-2020
54
Müller T. J. Siedler G. (1992). Multi-Year Current Time Series in the Eastern North Atlantic Ocean. J. Mar. Res.50, 63–98. doi: 10.1357/002224092784797755
55
New A. L. Jia Y. Coulibaly M. Dengg J. (2001). On the Role of the Azores Current in the Ventilation of the North Atlantic Ocean. Prog. Oceanogr.48, 163–194. doi: 10.1016/S0079-6611(01)00004-0
56
Nigam S. Ruiz-Barradas A. Chafik L. (2018). Gulf Stream Excursions and Sectional Detachments Generate the Decadal Pulses in the Atlantic Multidecadal Oscillation. J. Climate31, 2853–2870. doi: 10.1175/JCLI-D-17-0010.1
57
Onken R. (1993). The Azores Countercurrent. J. Phys. Oceanogr.23, 1638–1646. doi: 10.1175/1520-0485(1993)023<1638:TAC>2.0.CO;2
58
Özgökmen T. M. Chassignet E. P. Rooth C. G. H. (2001). On the Connection Between the Mediterranean Outflow and the Azores Current. J. Phys. Oceanogr.31 (2), 461–480. doi: 10.1175/1520-0485(2001)031<0461:OTCBTM>2.0.CO;2
59
Pelegrí J. L. Csanady G. T. (1991). Nutrient Transport and Mixing in the Gulf Stream. J. Geophys. Res.96, 2577–2583. doi: 10.1029/90JC02535
60
Peliz A. Dubert J. Marchesiello P. Teles-Machado A. (2007). Surface Circulation in the Gulf of Cadiz: Model and Mean Flow Structure. J. Geophys. Res.12, C11015. doi: 10.1029/2007JC004159
61
Pingree R. Sinha B. (2001). Westward Moving Waves or Eddies (Storms) on the Subtropical/Azores Front Near 32.5°N? Interpretation of the Eulerian Currents and Temperature Records at Mooring 155 (35.5°W) and 156 (34.4°W). J. Mar. Syst.29, 239–276. doi: 10.1016/S0924-7963(01)00019-7
62
Polovina J. J. Howell E. A. Abecassis M. (2008). Ocean’s Least Productive Waters are Expanding. Geophys. Res. Lett.35, L03618. doi: 10.1029/2007GL031745
63
Reverdin G. (2010). North Atlantic Subpolar Gyre Surface Variability, (1895-2009). J. Climate23, 4571–4584. doi: 10.1175/2010JCLI3493.1
64
Richardson P. L. (1983). Eddy Kinetic Energy in the North Atlantic From Surface Drifters. J. Geophys. Res.88 (C7), 4355–4367. doi: 10.1029/JC088iC07p04355
65
Richardson P. L. (2001). “Florida Current, Gulf Stream, and Labrador Current,” in Encyclopedia of Ocean Sciences, 2nd Ed. Ed. SteeleJ. H. (Oxford: Academic Press), 554–563. doi: 10.1016/B978-012374473-9.00357-X
66
Rossby T. Flagg C. N. Donohue K. Fontana S. Curry R. Andres M. et al . (2019). Oleander is More Than a Flower: Twenty-Five Years of Oceanography Aboard a Merchant Vessel. Oceanography32 (3), 126–137. doi: 10.5670/oceanog.2019.319
67
Rossby T. Flagg C. N. Donohue K. Sanchez-Franks A. Lillibridge J. (2014). On the Long-Term Stability of Gulf Stream Transport Based on 20 Years of Direct Measurements. Geophys. Res. Lett.41, 114–120. doi: 10.1002/2013GL058636
68
Schlesinger M. E. Ramankutty N. (1994). An Oscillation in the Global Climate System of Period 65–Years. Nature367, 723–726. doi: 10.1038/367723a0
69
Schmitz W. J. Jr. McCartney M. S. (1993). On the North Atlantic Circulation. Rev. Geophys.31 (1), 29–49. doi: 10.1029/92RG02583
70
Seidov D. Mishonov A. Reagan J. Parsons R. (2017). Multidecadal Variability and Climate Shift in the North Atlantic Ocean. Geophys. Res. Lett.44, 4985–4993. doi: 10.1002/2017GL073644
71
Seidov D. Mishonov A. Reagan J. Parsons R. (2019a). Resilience of the Gulf Stream Path on Decadal and Longer Timescales. Sci. Rep.9, 11549. doi: 10.1038/s41598-019-48011-9
72
Seidov D. Mishonov A. Reagan J. Parsons R. (2019b). Eddy-Resolving In Situ Ocean Climatologies of Temperature and Salinity in the Northwest Atlantic Ocean. J. Geophys. Res.: Oceans124, 41–58. doi: 10.1029/2018JC014548
73
Siedler G. Armi L. Müller T. J. (2005). Meddies and Decadal Changes at the Azores Front From 1980 to 2000. Deep Sea Res. II52, 583–604. doi: 10.1016/j.dsr2.2004.12.010
74
Siedler G. Zenk W. Emery W. J. (1985). Strong Current Events Related to a Subtropical Front in the Northeast Atlantic. J. Phys. Oceanogr.15, 885–897. doi: 10.1175/1520-0485(1985)015<0885:SCERTA>2.0.CO;2
75
Silva-Fernandes S. M. Peliz A. J. (2020). The Turbulent Structure of the Azores Current System: A Statistical Analysis. J. Geophys. Res.: Oceans125, e2020JC016327. doi: 10.1029/2020JC016327
76
Smith R. D. Dukowicz J. K. Malone R. C. (1992). Parallel Ocean General Circulation Modeling. Phys. D60, 38–61. doi: 10.1016/0167-2789(92)90225-C
77
Spall M. A. (1990). Circulation in the Canary Basin: A Model/Data Analysis. J. Geophys. Res.95, 9611–9628. doi: 10.1029/JC095iC06p09611
78
Steinacher M. Joos F. Frölicher T. L. Bopp L. Cadule P. Cocco V. et al . (2010). Projected 21st Century Decrease in Marine Productivity: A Multi-Model Analysis. Biogeosciences7, 979–1005. doi: 10.5194/bg-7-979-2010
79
Stern J. Dellwig O. Waniek J. J. (2017). Deep-Sea Fluxes of Barium and Lithogenic Trace Elements in the Subtropical Northeast Atlantic. Deep Sea Res. I122, 72–80. doi: 10.1016/j.dsr.2017.02.002
80
Stern J. Kaiser D. Przibilla A. Schulz-Bull D. E. Waniek J. J. (2019). Trace Metals and Persistent Organic Pollutants Fingerprint on the Particle Flux in the Deep Subtropical NE Atlantic. Mar. Pollut. Bull.145, 508–516. doi: 10.1016/j.marpolbul.2019.06.001
81
Stramma L. (1984). Geostrophic Transport in the Warm Water Sphere of the Eastern Subtropical North Atlantic. J. Mar. Res.42 (3), 537–558. doi: 10.1357/002224084788506022
82
Stramma L. Müller T. J. (1989). Some Observations of the Azores Current and the North Equatorial Current. J. Geophys. Res.94 (C3), 3181–3186. doi: 10.1029/JC094iC03p03181
83
Tett S. F. B. Sherwin T. J. Shravat A. Browne O. (2014). How Much Has the North Atlantic Ocean Overturning Circulation Changed in the Last 50 Years? J. Climate27, 6325–6342. doi: 10.1175/JCLI-D-12-00095.1
84
Tomczak M. Godfrey J. S. (1994). Regional Oceanography: An Introduction. Pergamon, 437. doi: 10.1016/C2009-0-14825-0
85
Visbeck M. Chassignet E. P. Curry R. G. Delworth T. L. Dickson R. R. Krahmann G. (2003). The Ocean’s Response to North Atlantic Oscillation Variability. Geophys. Monogr. -Am. Geophys. Union134, 113–146. doi: 10.1029/134GM06
86
Volkov D. L. Fu L.-L. (2010). On the Reasons for the Formation and Variability of the Azores Current. J. Phys. Oceanogr.40, 2197–2220. doi: 10.1175/2010JPO4326.1
87
Volkov D. L. Fu L.-L. (2011). Interannual Variability of the Azores Current Strength and Eddy Energy in Relation to Atmospheric Forcing. J. Geophys. Res.116, C11011. doi: 10.1029/2011JC007271
88
Waniek J. J. Schulz-Bull D. E. Blanz T. Prien R. D. Oschlies A. Müller T. J. (2005). Interannual Variability of Deep Water Particle Flux in Relation to Production and Lateral Sources in the Northeast Atlantic. Deep Sea Res. I52, 33–50. doi: 10.1016/j.dsr.2004.08.008
89
Watelet S. Beckers J.-M. Barth A. (2017). Reconstruction of the Gulf Stream From 1940 to the Present and Correlation With the North Atlantic Oscillation. J. Phys. Oceanogr.47, 2741–2754. doi: 10.1175/JPO-D-17-0064.1
90
Williams R. G. McLaren A. J. Follows M. J. (2000). Estimating the Convective Supply of Nitrate and Implied Variability in Export Production Over the North Atlantic. Global Biogeochem. Cycles14, 1299–1313. doi: 10.1029/2000GB001260
91
Willis J. K. (2010). Can in Situ Floats and Satellite Altimeters Detect Long-Term Changes in Atlantic Ocean Overturning? Geophys. Res. Lett.37, L06602. doi: 10.1029/2010GL042372
92
Yang H. Lohmann G. Krebs-Kanzow U. Ionita M. Shi X. Sidorenko D. et al . (2020). Poleward Shift of the Major Ocean Gyres Detected in a Warming Climate. Geophys. Res. Lett.47, e2019GL085868. doi: 10.1029/2019GL085868
93
Yeager S. Danabasoglu G. (2014). The Origins of Late-Twentieth-Century Variations in the Large-Scale North Atlantic Circulation. J. Climate27, 3222–3247. doi: 10.1175/JCLI-D-13-00125.1
94
Zhang R. (2008). Coherent Surface-Subsurface Fingerprint of the Atlantic Meridional Overturning Circulation. Geophys. Res. Lett.35, L20705. doi: 10.1029/2008GL035463
95
Zhang W.-Z. Chai F. Xue H. Oey L.-Y. (2020). Remote Sensing Linear Trends of the Gulf Stream From 1993 to 2016. Ocean Dyn.70, 701–712. doi: 10.1007/s10236-020-01356-6
Summary
Keywords
Azores Current, Azores Front, Gulf Stream, North Atlantic Circulation, Atlantic Multidecadal Oscillation, Ocean Heat Content, North Atlantic
Citation
Frazão HC, Prien RD, Schulz-Bull DE, Seidov D and Waniek JJ (2022) The Forgotten Azores Current: A Long-Term Perspective. Front. Mar. Sci. 9:842251. doi: 10.3389/fmars.2022.842251
Received
23 December 2021
Accepted
05 April 2022
Published
28 April 2022
Volume
9 - 2022
Edited by
Ming Li, University of Maryland Center for Environmental Science (UMCES), United States
Reviewed by
Tal Ezer, Old Dominion University, United States; Manuel Bensi, Istituto Nazionale di Oceanografia e di Geofisica Sperimentale, Italy
Updates
Copyright
© 2022 Frazão, Prien, Schulz-Bull, Seidov and Waniek.
This is an open-access article distributed under the terms of the Creative Commons Attribution License (CC BY). The use, distribution or reproduction in other forums is permitted, provided the original author(s) and the copyright owner(s) are credited and that the original publication in this journal is cited, in accordance with accepted academic practice. No use, distribution or reproduction is permitted which does not comply with these terms.
*Correspondence: Helena C. Frazão, helena.frazao@io-warnemuende.de
This article was submitted to Physical Oceanography, a section of the journal Frontiers in Marine Science
Disclaimer
All claims expressed in this article are solely those of the authors and do not necessarily represent those of their affiliated organizations, or those of the publisher, the editors and the reviewers. Any product that may be evaluated in this article or claim that may be made by its manufacturer is not guaranteed or endorsed by the publisher.