Abstract
China has an abundance of Saccharina cultivars. Most of them are in Shandong Province. These cultivars have been used for many years, and their genetic structure is likely to change. In this study, 13 Saccharina cultivars that are widely applicated in China were collected from Rongcheng and Changdao and sequenced using SLAF-seq technology. A total of 277.27M reads were obtained with a 12.98× sequencing depth, a mean 87.84% Q30 ratio, and a mean 48.49% GC content. A subset of >300,000 SNPs associated with minor allele frequency (MAF) > 0.05 and integrity > 0.5 was obtained. A phylogenetic tree and a population structure analysis based on the high-confidence SNP data showed that the 13 Saccharina cultivars could be divided into 2 groups. The average nucleic acid diversity (Pi), heterozygosity (Ho), and expected heterozygosity (He) of SNP markers in the populations were 4.38×10⁻⁵, 0.249, and 0.265, respectively. The average inbreeding coefficient is 0.198, which is high. The results could provide scientific basis for heterosis in Saccharina breeding and germplasm utilization.
Introduction
Saccharina japonica plays a major role in the seaweed industry in China. It is naturally distributed along the cold-temperature coasts of northern Japan, northeastern Korea of Japan sea, and Far Eastern Russia. In the 1920s, it was first unintentionally introduced into China from Japan, and thereafter its cultivation was initiated in China (Tseng, 2001). S. japonica was initially only cultivated in the north of China using the method of seaweed proliferation (Li, 2013a), but modern cultivation technology (Tseng et al., 1955; Tseng and Wu, 1962; Li, 1990; Li, 2013b) expanded the cultivation area from the northern areas (Shandong and Liaoning) to the south of China (Fujian) (Jin et al., 2009). In 2019, it was grown on approximately 44,494 ha with a total annual yield of 36.5 t per ha (China Fisheries Statistics Yearbook, 2020).
Early in the domestication process, natural kelp populations were cultivated. From the 1960s onward, China has made significant progress in Saccharina breeding, which led to the release of many cultivars, “Haiqing 1” (Fang et al., 1962), “901” (Zhang et al., 2007), “Rongfu” (Liao et al., 2010; Zhang et al., 2011), “Dongfang 2” (Li et al., 2007), and “Dongfang 3” (Li et al., 2008). Most cultivars have been bred using continuous selection strategies based on local cultivar germplasm.
Previous studies indicated that intensive inbreeding and selection during the domestication process may reduce the genetic diversity (Voisin et al., 2005; Doebley et al., 2006; Veasey et al., 2008; Provan et al., 2013; Cao et al., 2019). Some previous reports have assessed the genetic diversity and population structure of S. japonica populations in China and indicated that intensive selection and inbreeding for multiple generations are likely to have an effect on the genetic diversity of cultivated S. japonica populations (Wang et al., 2005; Shan et al., 2010; Bi et al., 2011; Liu F. et al., 2012).
SNPs are more useful molecular markers of genomic tools to elucidate the genetic background of the cultivars because they are the most abundant and stable type of genetic markers in most genomes (Liu J. et al., 2012). In the recent 20 years, the rapid development in research of deep sequencing technology has made the high-throughput identification of SNPs possible (Singh and Singh, 2015), yet its application is limited due to the high cost when the population is large. The specific-locus amplified fragment (SLAF) sequencing (SLAF-seq) provides a new high-throughput sequencing strategy for the genotyping of different biological large populations with wide applicability (Davey et al., 2011; Sun et al., 2013).
This study presents a comprehensive view of the genome-wide variation among 13 Saccharina cultivars in Shandong Province, because not only the kelp yield of Shandong Province accounts for 29.6% of China in 2019 (China Fisheries Statistics Yearbook, 2020), but also most of Saccharina cultivars were released from Shandong Province. Almost all kelp in Shandong Province was bred and cultured in Changdao and Rongcheng. Our research objectives were to assess the genetic diversity of the cultivars and investigate the cultivars’ population structure.
Materials and Methods
Saccharina Cultivars
A collection of 13 Saccharina cultivars was evaluated in the present study. Six cultivars came from Changdao, and 7 cultivars came from Rongcheng (Figure 1). These cultivars were generated from different breeding methods. Detailed information on the regional distribution of the 13 cultivars is provided in Table 1.
Figure 1
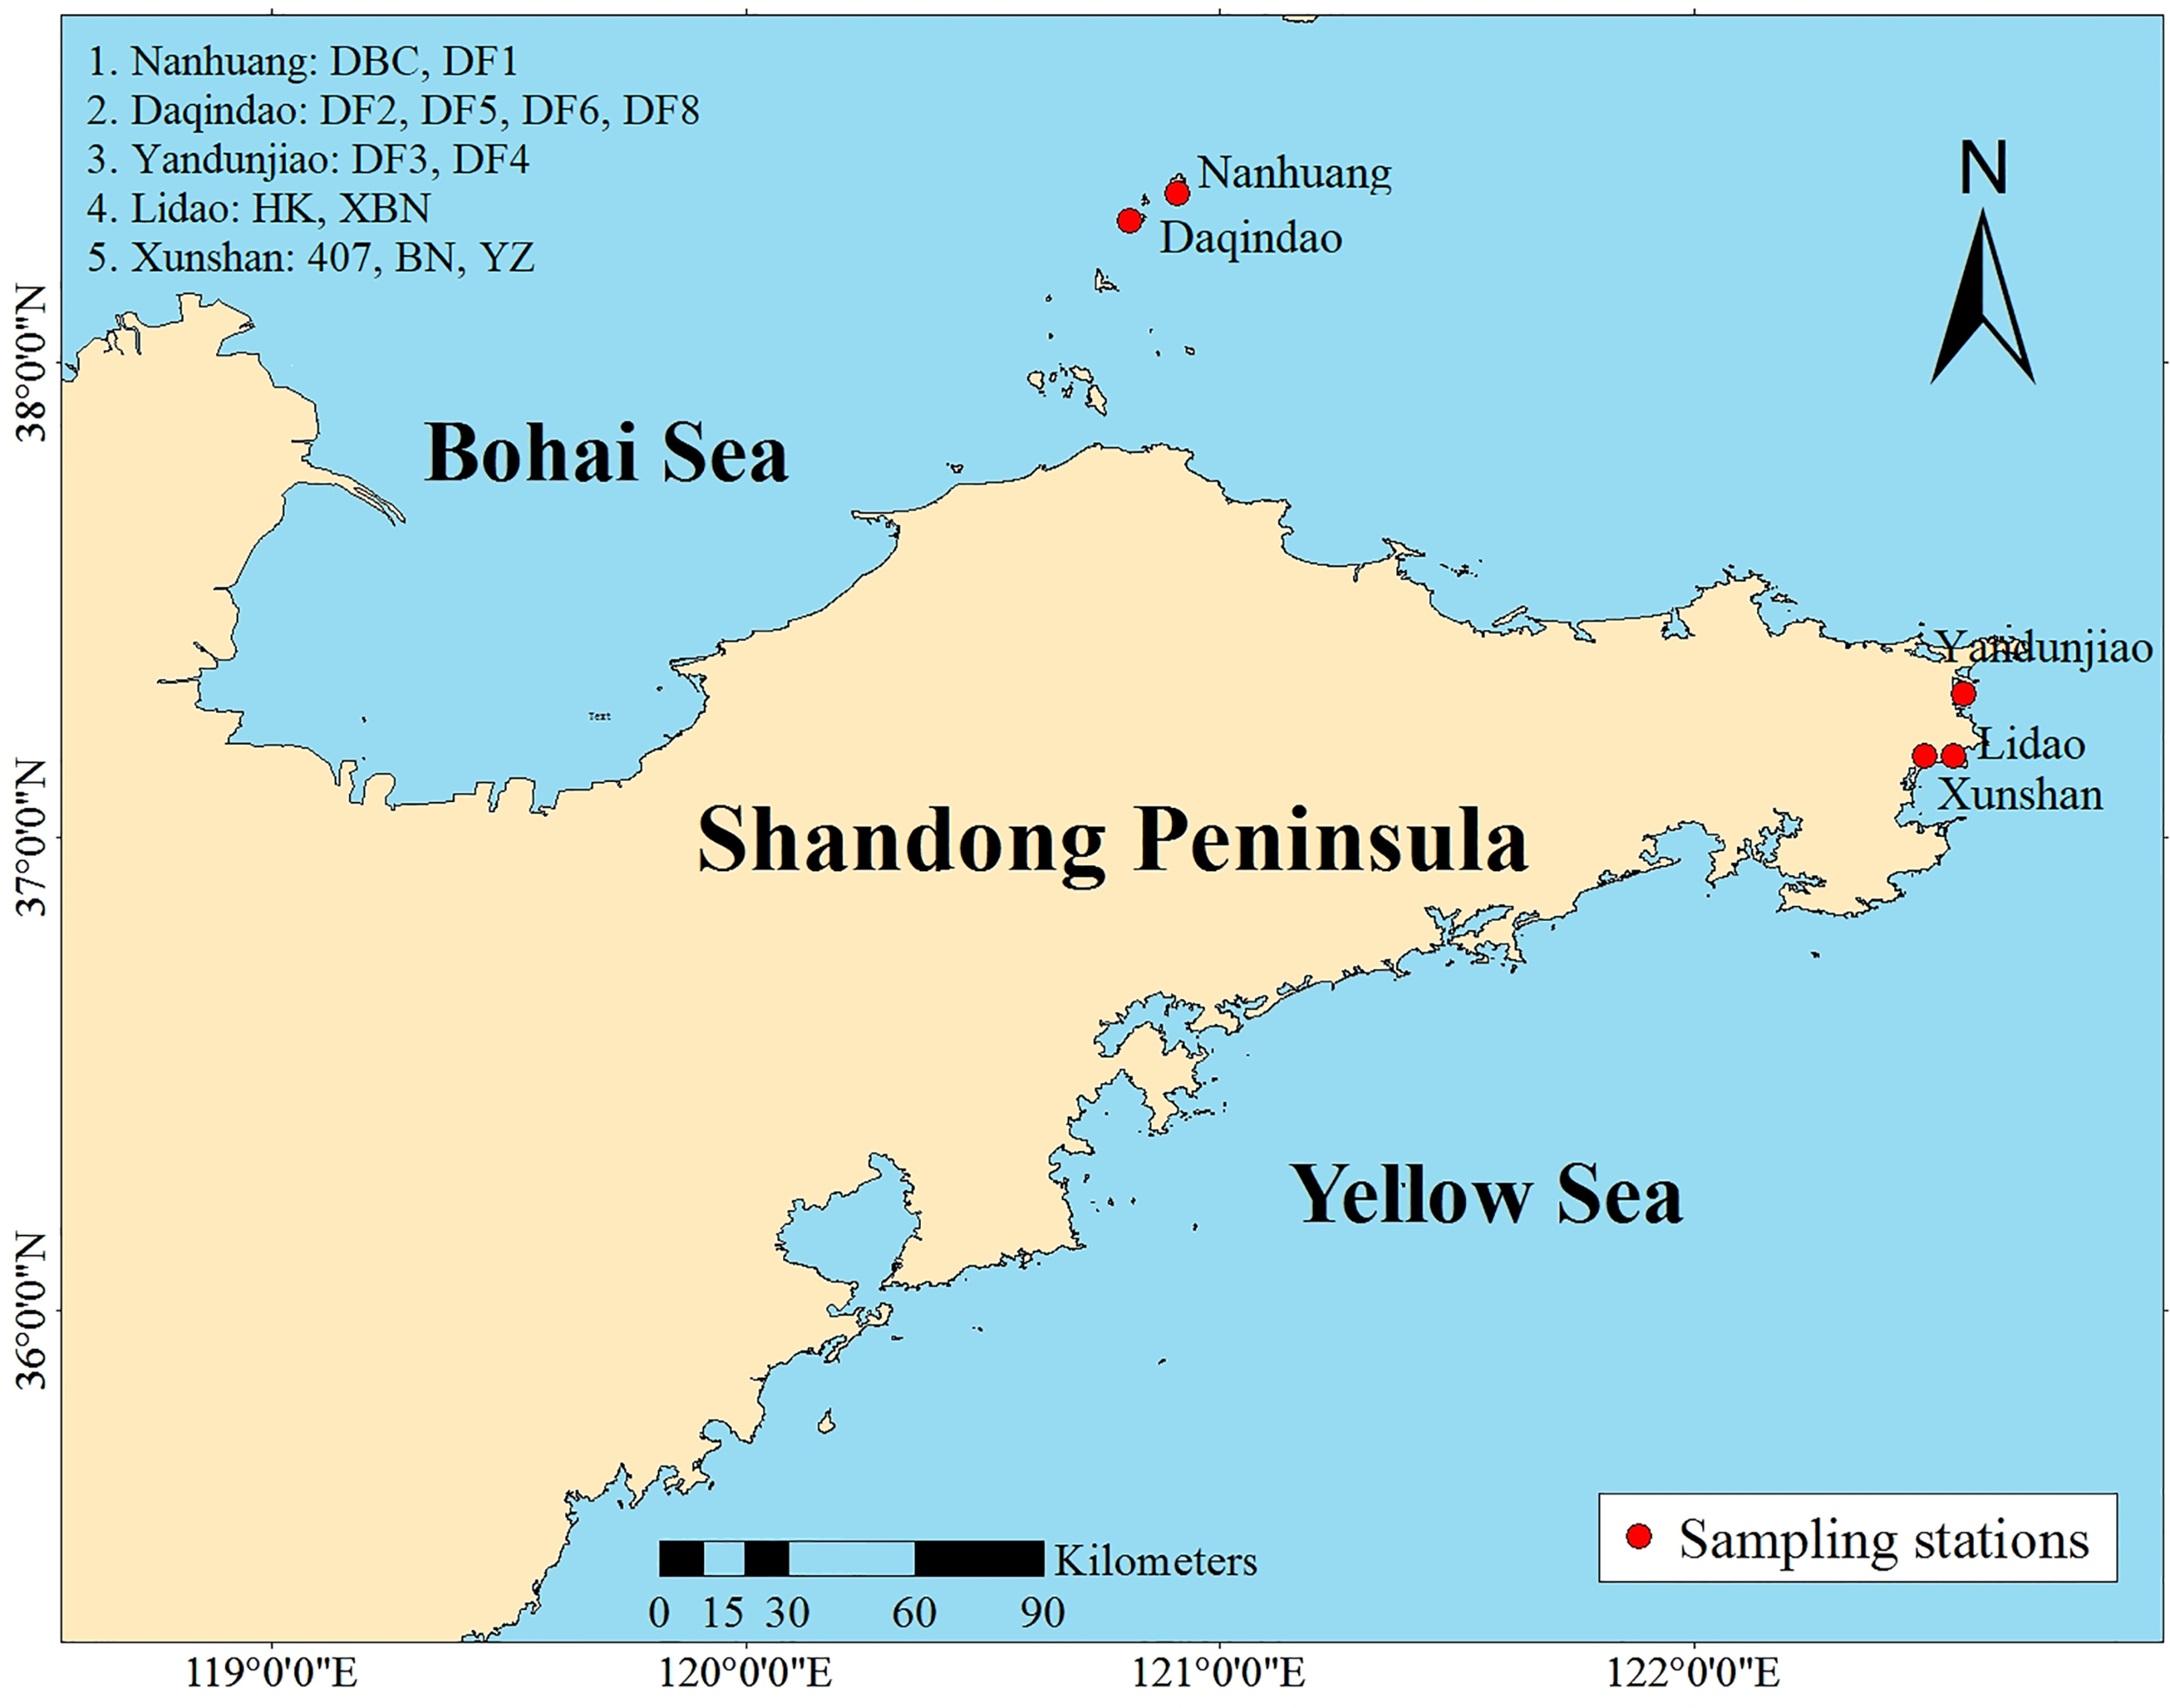
Location of the Saccharina cultivars around the Shandong Peninsula.
Table 1
| Cultivar | Sampling site | Breeding method | Coordinates (N/E) | N | Date |
|---|---|---|---|---|---|
| 407 | (Xunshan) Rongcheng | Directional Selection | 122.55°/37.17° | 10 | 2017.10.15 |
| BN | (Xunshan) Rongcheng | Directional Selection | 122.55°/37.17° | 10 | 2017.10.15 |
| DBC | (Nanhuang) Changdao | Directional Selection | 120.91°/38.36° | 10 | 2017.10.12 |
| DF1 | (Nanhuang) Changdao | Hybridization | 120.91°/38.36° | 10 | 2017.10.12 |
| DF2 | (Daqindao) Changdao | Hybridization | 120.81°/38.30° | 10 | 2017.10.13 |
| DF3 | (Yandunjiao) Rongcheng | Hybridization | 122.57°/37.30° | 10 | 2017.10.15 |
| DF4 | (Yandunjiao) Rongcheng | Hybridization | 122.57°/37.30° | 10 | 2017.10.15 |
| DF5 | (Daqindao) Changdao | Hybridization | 120.81°/38.30° | 10 | 2017.10.13 |
| DF6 | (Daqindao) Changdao | Hybridization | 120.81°/38.30° | 10 | 2017.10.13 |
| DF8 | (Daqindao) Changdao | Hybridization | 120.81°/38.30° | 10 | 2017.10.13 |
| HK | (Lidao) Rongcheng | Directional Selection | 122.49°/37.17° | 10 | 2017.10.15 |
| XBN | (Lidao) Rongcheng | Directional Selection | 122.49°/37.17° | 10 | 2017.10.15 |
| YZ | (Xunshan) Rongcheng | Hybridization | 122.55°/37.17° | 10 | 2017.10.15 |
Regional distribution of the total collection.
DNA Extraction
Approximately 3- to 5-cm young healthy leaves were collected, frozen in liquid nitrogen, and used for genomic DNA isolation. Each sample was ground into a powder using a mortar, and genomic DNA was isolated and purified via the Plant Genomic DNA Kit (TIANGEN BIOTECH CO., LTD). The purity and concentration of extracted DNA were qualified using a spectrophotometer (NanoDrop-2000); 117 qualified DNA samples were obtained, and 13 unqualified DNA samples were not used. Qualified DNA samples were diluted to 50 ng/μl. The high-throughput sequencing method is individual sequencing.
High-Throughput Sequencing and Data Processing
Genomic DNA extracted from sporophytes were genotyped using the reported SLAF (Specific-Locus Amplified Fragment) method (Sun et al., 2013). Restriction enzyme combinations were tested and selected following the four criteria: (I) low proportion of restriction fragments comprising repeat sequences; (II) even distribution of restriction fragments through chromosomes; (III) simulated fragments match uniquely to the reference genome; and (IV) ample number of SLAF tags. RsaI and HaeIII were selected as the fittest restriction endonucleases to obtain evenly distributed SLAF tags and to avoid repetitive SLAF tags.
To obtain the SLAF tags, genomic DNA of each accession was digested with RsaI and HaeIII. Then, the target fragments (fragment sequence of 314–394 bp) for SLAF library construction were selected for 3’ end reparation, dual-index paired-end adapter ligation, and PCR amplification. The selected SLAFs were sequenced with 126 bp × 2 pairs by Illumina high-throughput sequencing platform (Illumina, Inc., USA). After sequencing, the Q30 and GC content were checked for sequencing quality.
Identification of SNP Markers
The files of SLAF reads were aligned to the reference genome of S. japonica (https://www.ncbi.nlm.nih.gov/genome/?term=txid88149[orgn]) using the software BWA (Li and Durbin, 2009). Oryza sativa ssp. japonica DNA (http://rapdb.dna.affrc.go.jp/) was used as a control to assess the normal rate of enzyme digestion. The two sequenced reads were compared through SOAP (Arabidopsis Genome Initiative, 2000) software. SNPs were developed based on the polymorphic SLAF tags information via the software of GATK (McKenna et al., 2010) and SAMtools (Li H. et al., 2009). SNPs predicted by both GATK and SNPs were screened with the criteria of minor allele frequency (MAF) > 0.05 and integrity > 0.5.
Population Genetic Structure Analysis
Based on the SNPs identified in this study, genetic distances were calculated between the cultivars using the neighbor-joining method. Phylogenetic tree was constructed using the MEGA5 software (Tamura et al., 2011). The K-means clustering analysis using admixture software (Alexander et al., 2009) was conducted assuming that the K-value ranged from 2 to 20. A principal component analysis (PCA) was performed using EIGENSOFT (Price et al., 2006).
Genetic Differentiation
Prior to population genetic analysis, VCF tools (Version 0.1.14) were used to rigorously obtain the most informative SNPs (Eimanifar et al., 2018). The nucleic acid diversity (Pi), heterozygosity (Ho), and expected heterozygosity (He) of SNP loci in each population were separately calculated using PLINK2 (Purcell et al., 2007).
Results
SLAF Analysis and SNP Marker Development and Genotyping
The efficiency of two terminal comparison is 92.27%, the efficiency of enzyme digestion is 87.67%, and the read length inserts are distributed within the expected range. The efficiency of database building comparison is normal, SLAF library building is normal, and sequencing quality is normal.
In total, 277.27 M reads were obtained from the raw data of the SLAF library. The Q30 ratio was 87.84%, and the GC content was 48.49% (Table S1). A total of 178,047 SLAFs were anchored to the whole Saccharina genome, including 124,745 polymorphic SLAFs (approximately 70.1%), and the average sequencing depth per sample is 12.98× (Table S2). Using SAMtools and GATK for realignment and detection, a total of 2,847,332 SNPs from the original reads were developed (Table S3). After the low-depth SNPs were filtered out, 340,398 SNPs were successfully encoded.
Phylogenetic Tree Construction
The phylogenetic relationships between the 117 entries from 13 cultivars, based on the set of 340,398 SNPs, are illustrated in Figure 2. The cluster results showed that DF1 and DF4 are pure and independent cultivars. DF2 were almost all dispersed between the DF6 and DF8 groups, YZ were almost all dispersed between 407 groups, and DF3 were almost all dispersed between the BN and DBC groups, suggesting genetic permeation between these cultivars. Most of DF5 are in one group, with only a few clustering into the DF1 group. DBC and HK dispersed widely.
Figure 2
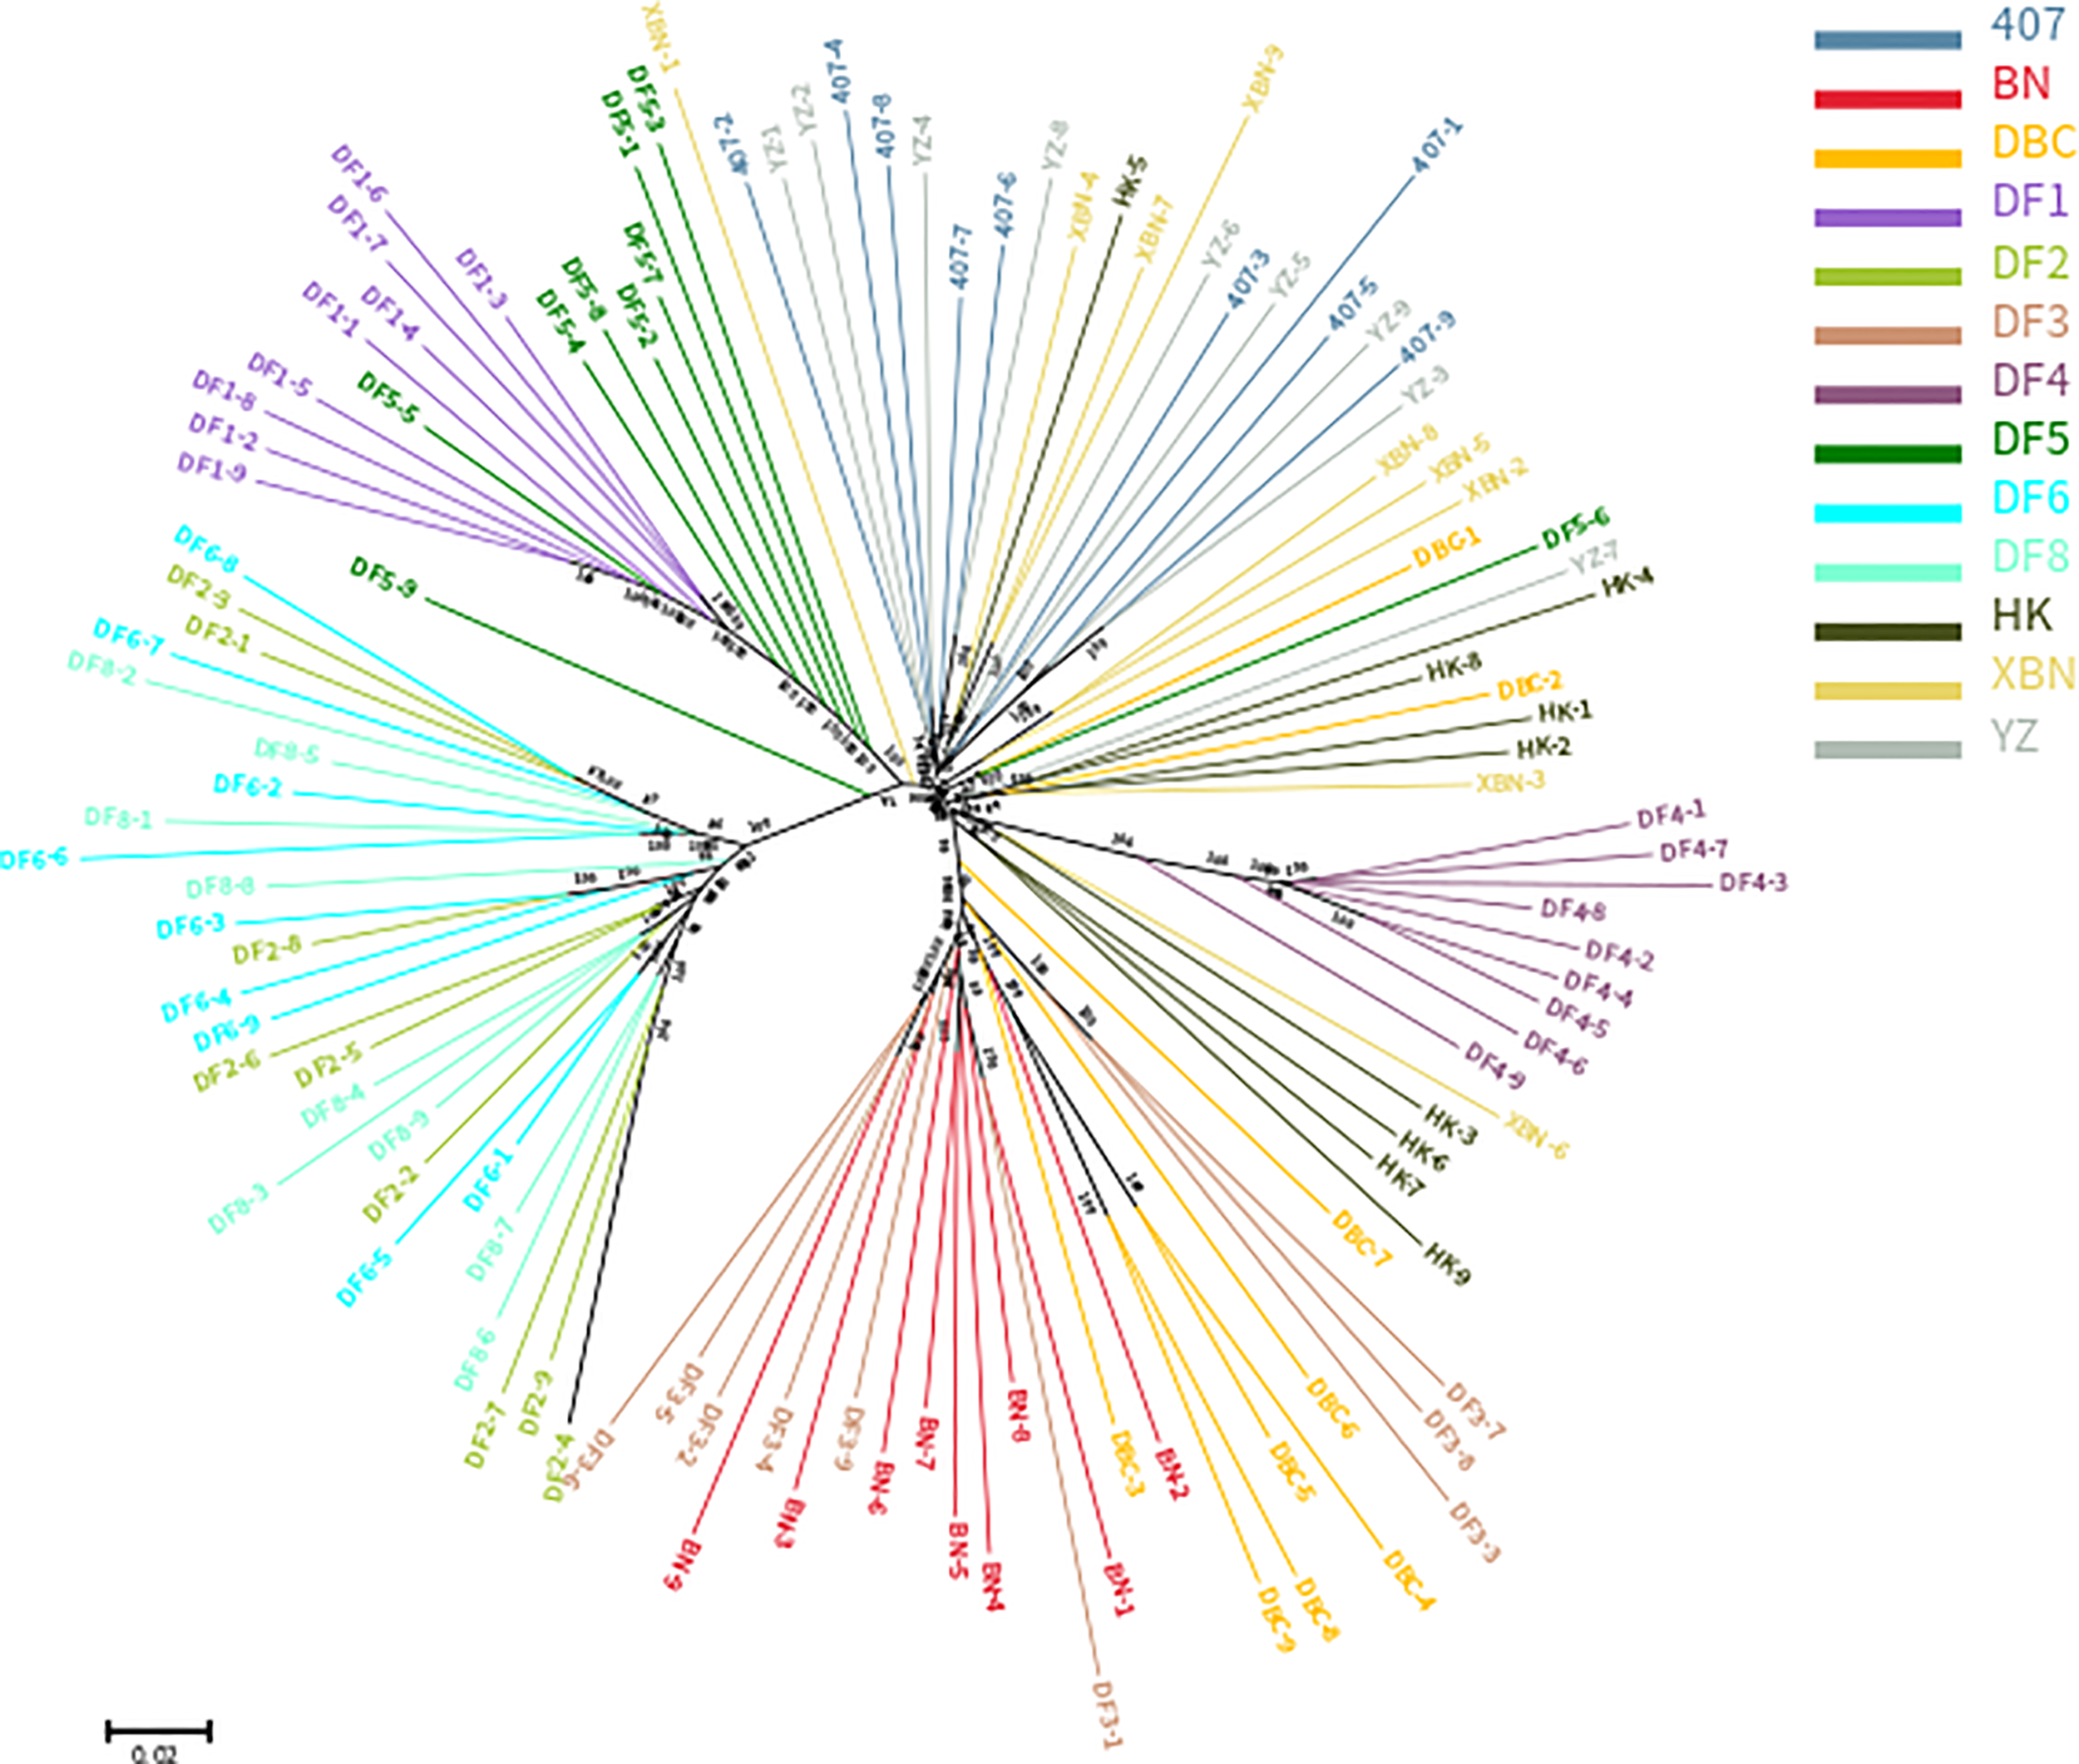
Phylogenetic tree of the 13 cultivars based on the analysis of 340,398 SNPs.
Principal Component Analysis
The first three PCs accounted for 10.07% of the population-wide SNP variation; the first, second, and the third principal components explained 4.34%, 3.14%, and 2.59% of the genetic diversity, respectively (Figure 3), and the hybrid level among the cultivars was high.
Figure 3
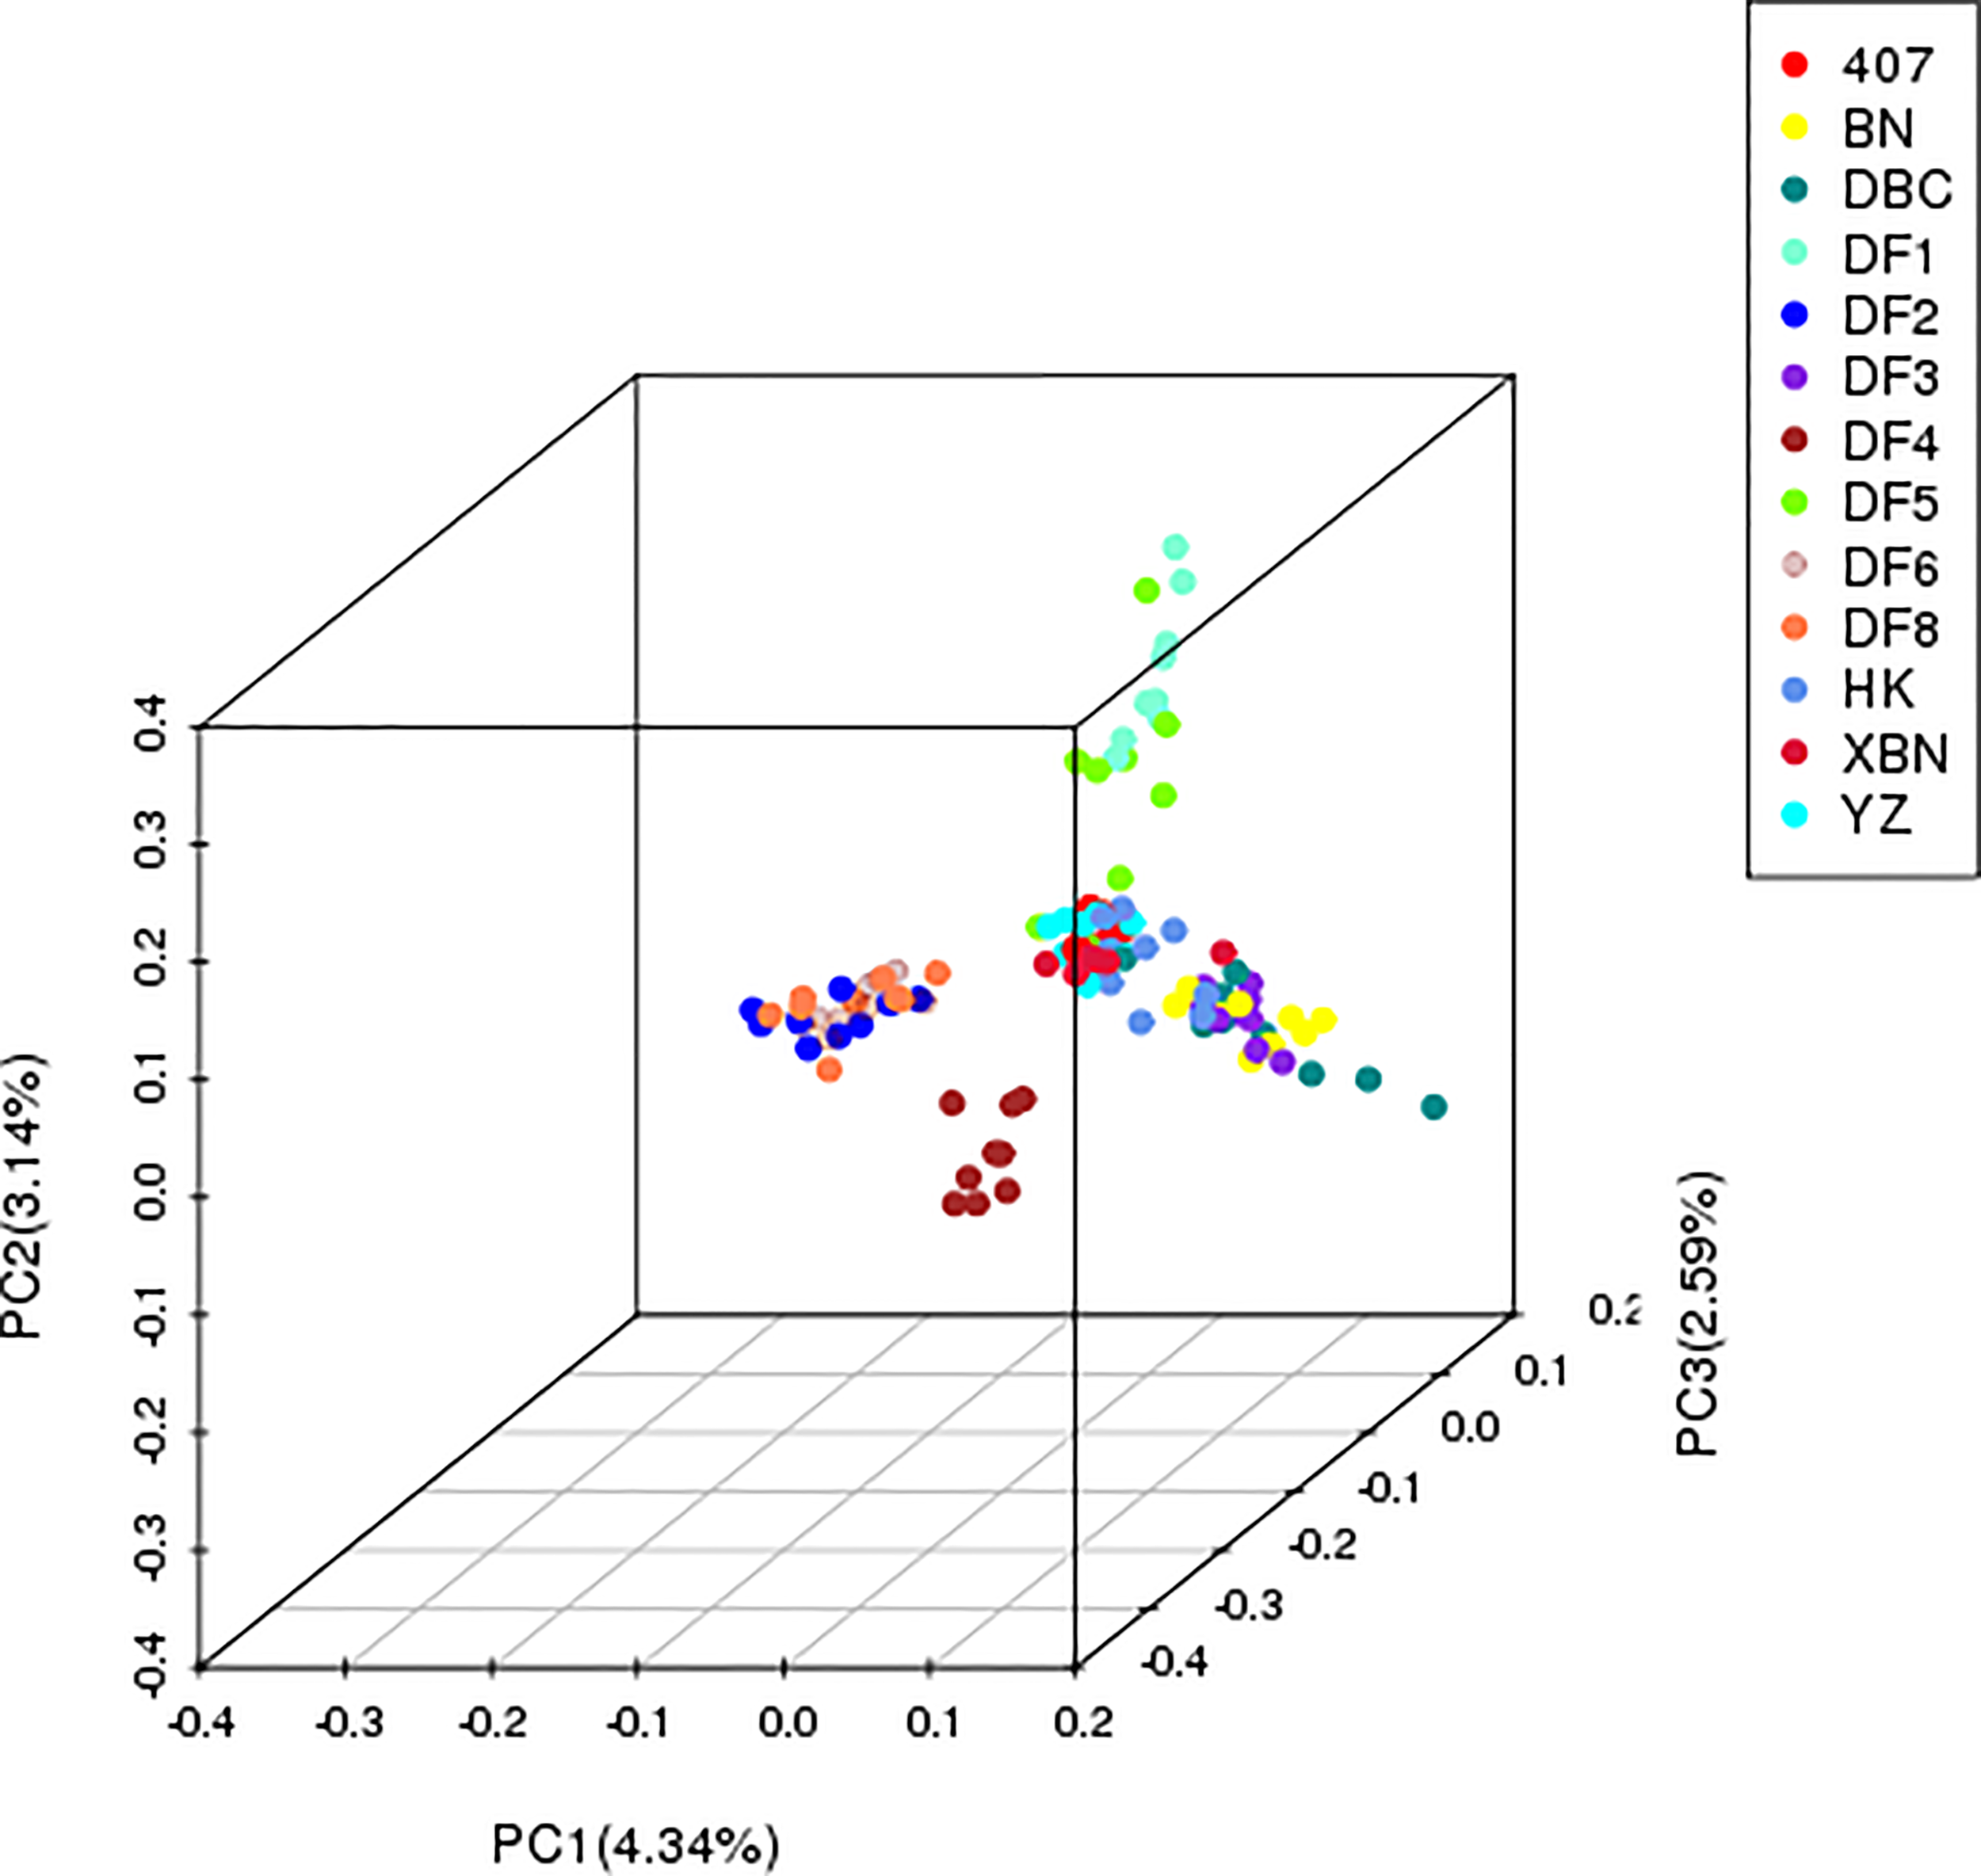
PCA plot of the 13 cultivars based on the analysis of 340,398 SNPs.
The PCA results confirmed that “HK” was widely dispersed from the YZ and XBN, providing evidence of a large diverse genetic background. DF4 is a pure and independent cultivar. DF2, DF6, and DF8 are mixed groups. DF3, BN, and DBC are also mixed. DF1 and DF5 in relationship are near with each other.
Population Structure
The estimated membership fractions of the 13 cultivars for different values of K ranged from 2 to 20, and the maximum likelihood revealed by the population structure showed an optimum value of 2 (K = 2) (Figures 4, 5), which indicated that the entire population could be categorized into 2 groups (Table S4). Group 1 contained 3 cultivars, DF2, DF6 and DF8. Other cultivars belong to group 2.
Figure 4
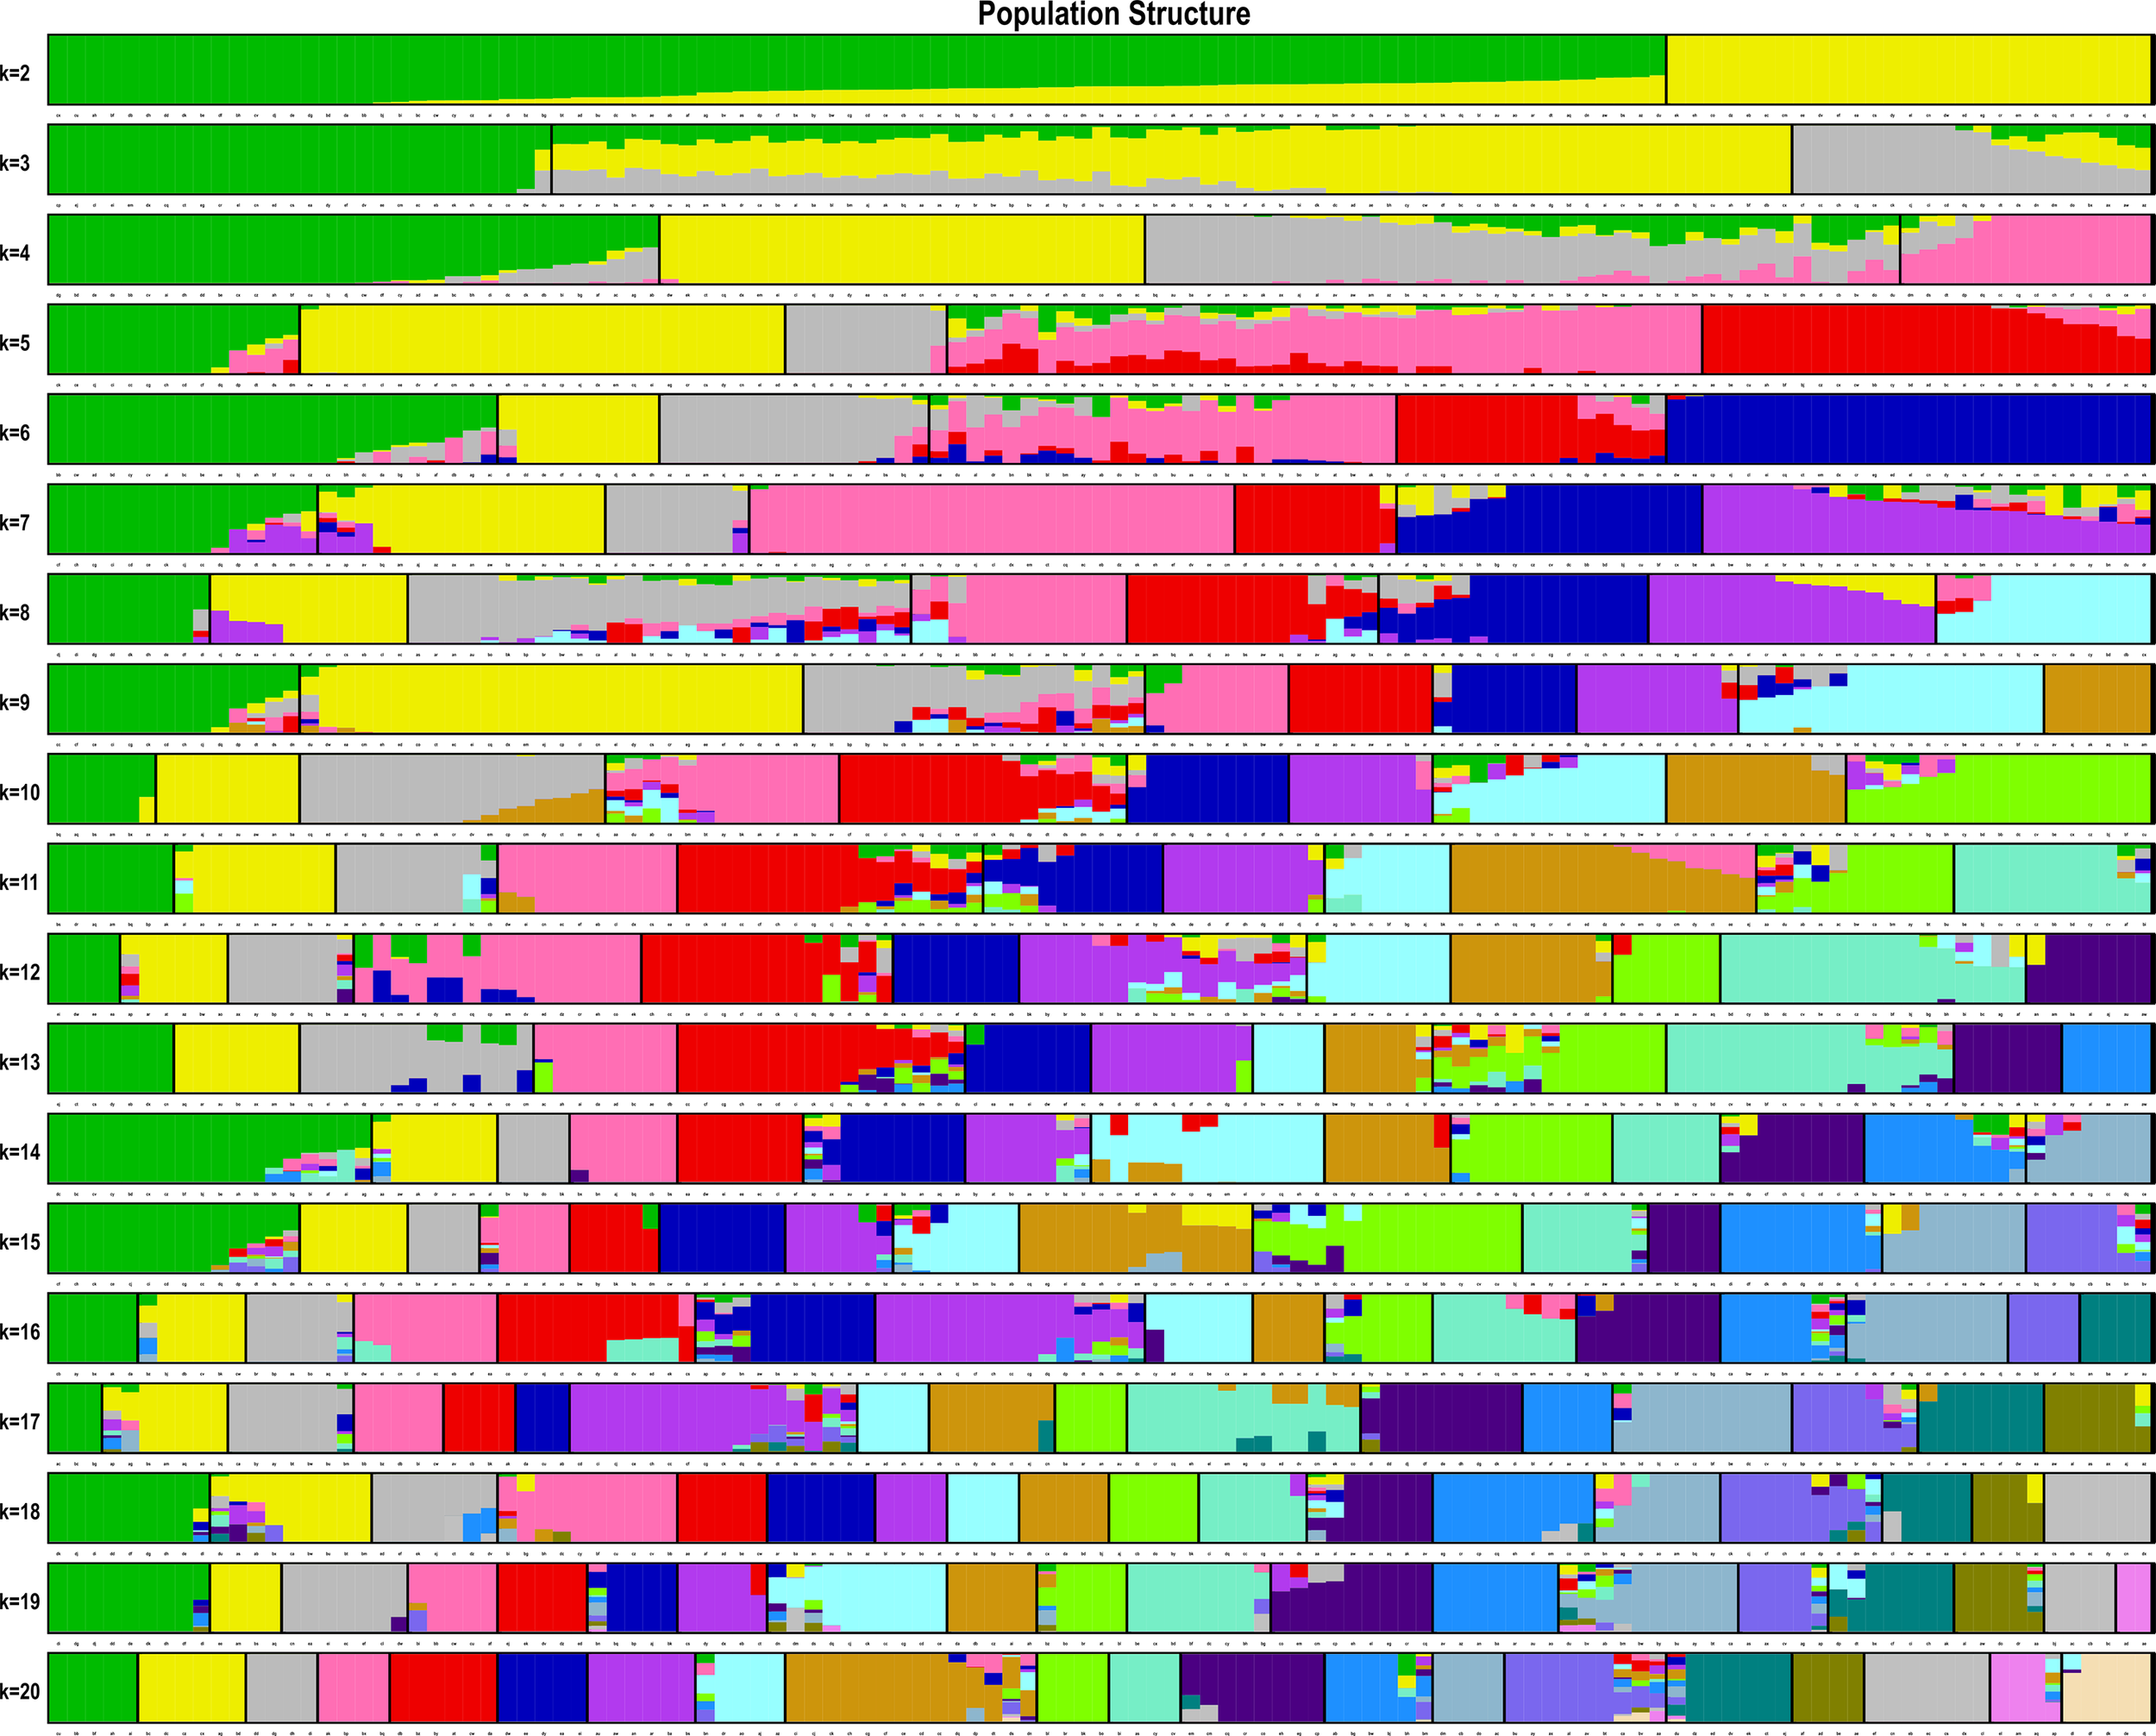
Pattern of variation among the 13 cultivars based on SNPs. The x-axis showed different cultivars. The y-axis quantified the membership probability of cultivars belonging to different groups. Colors in each row represented structural components.
Figure 5
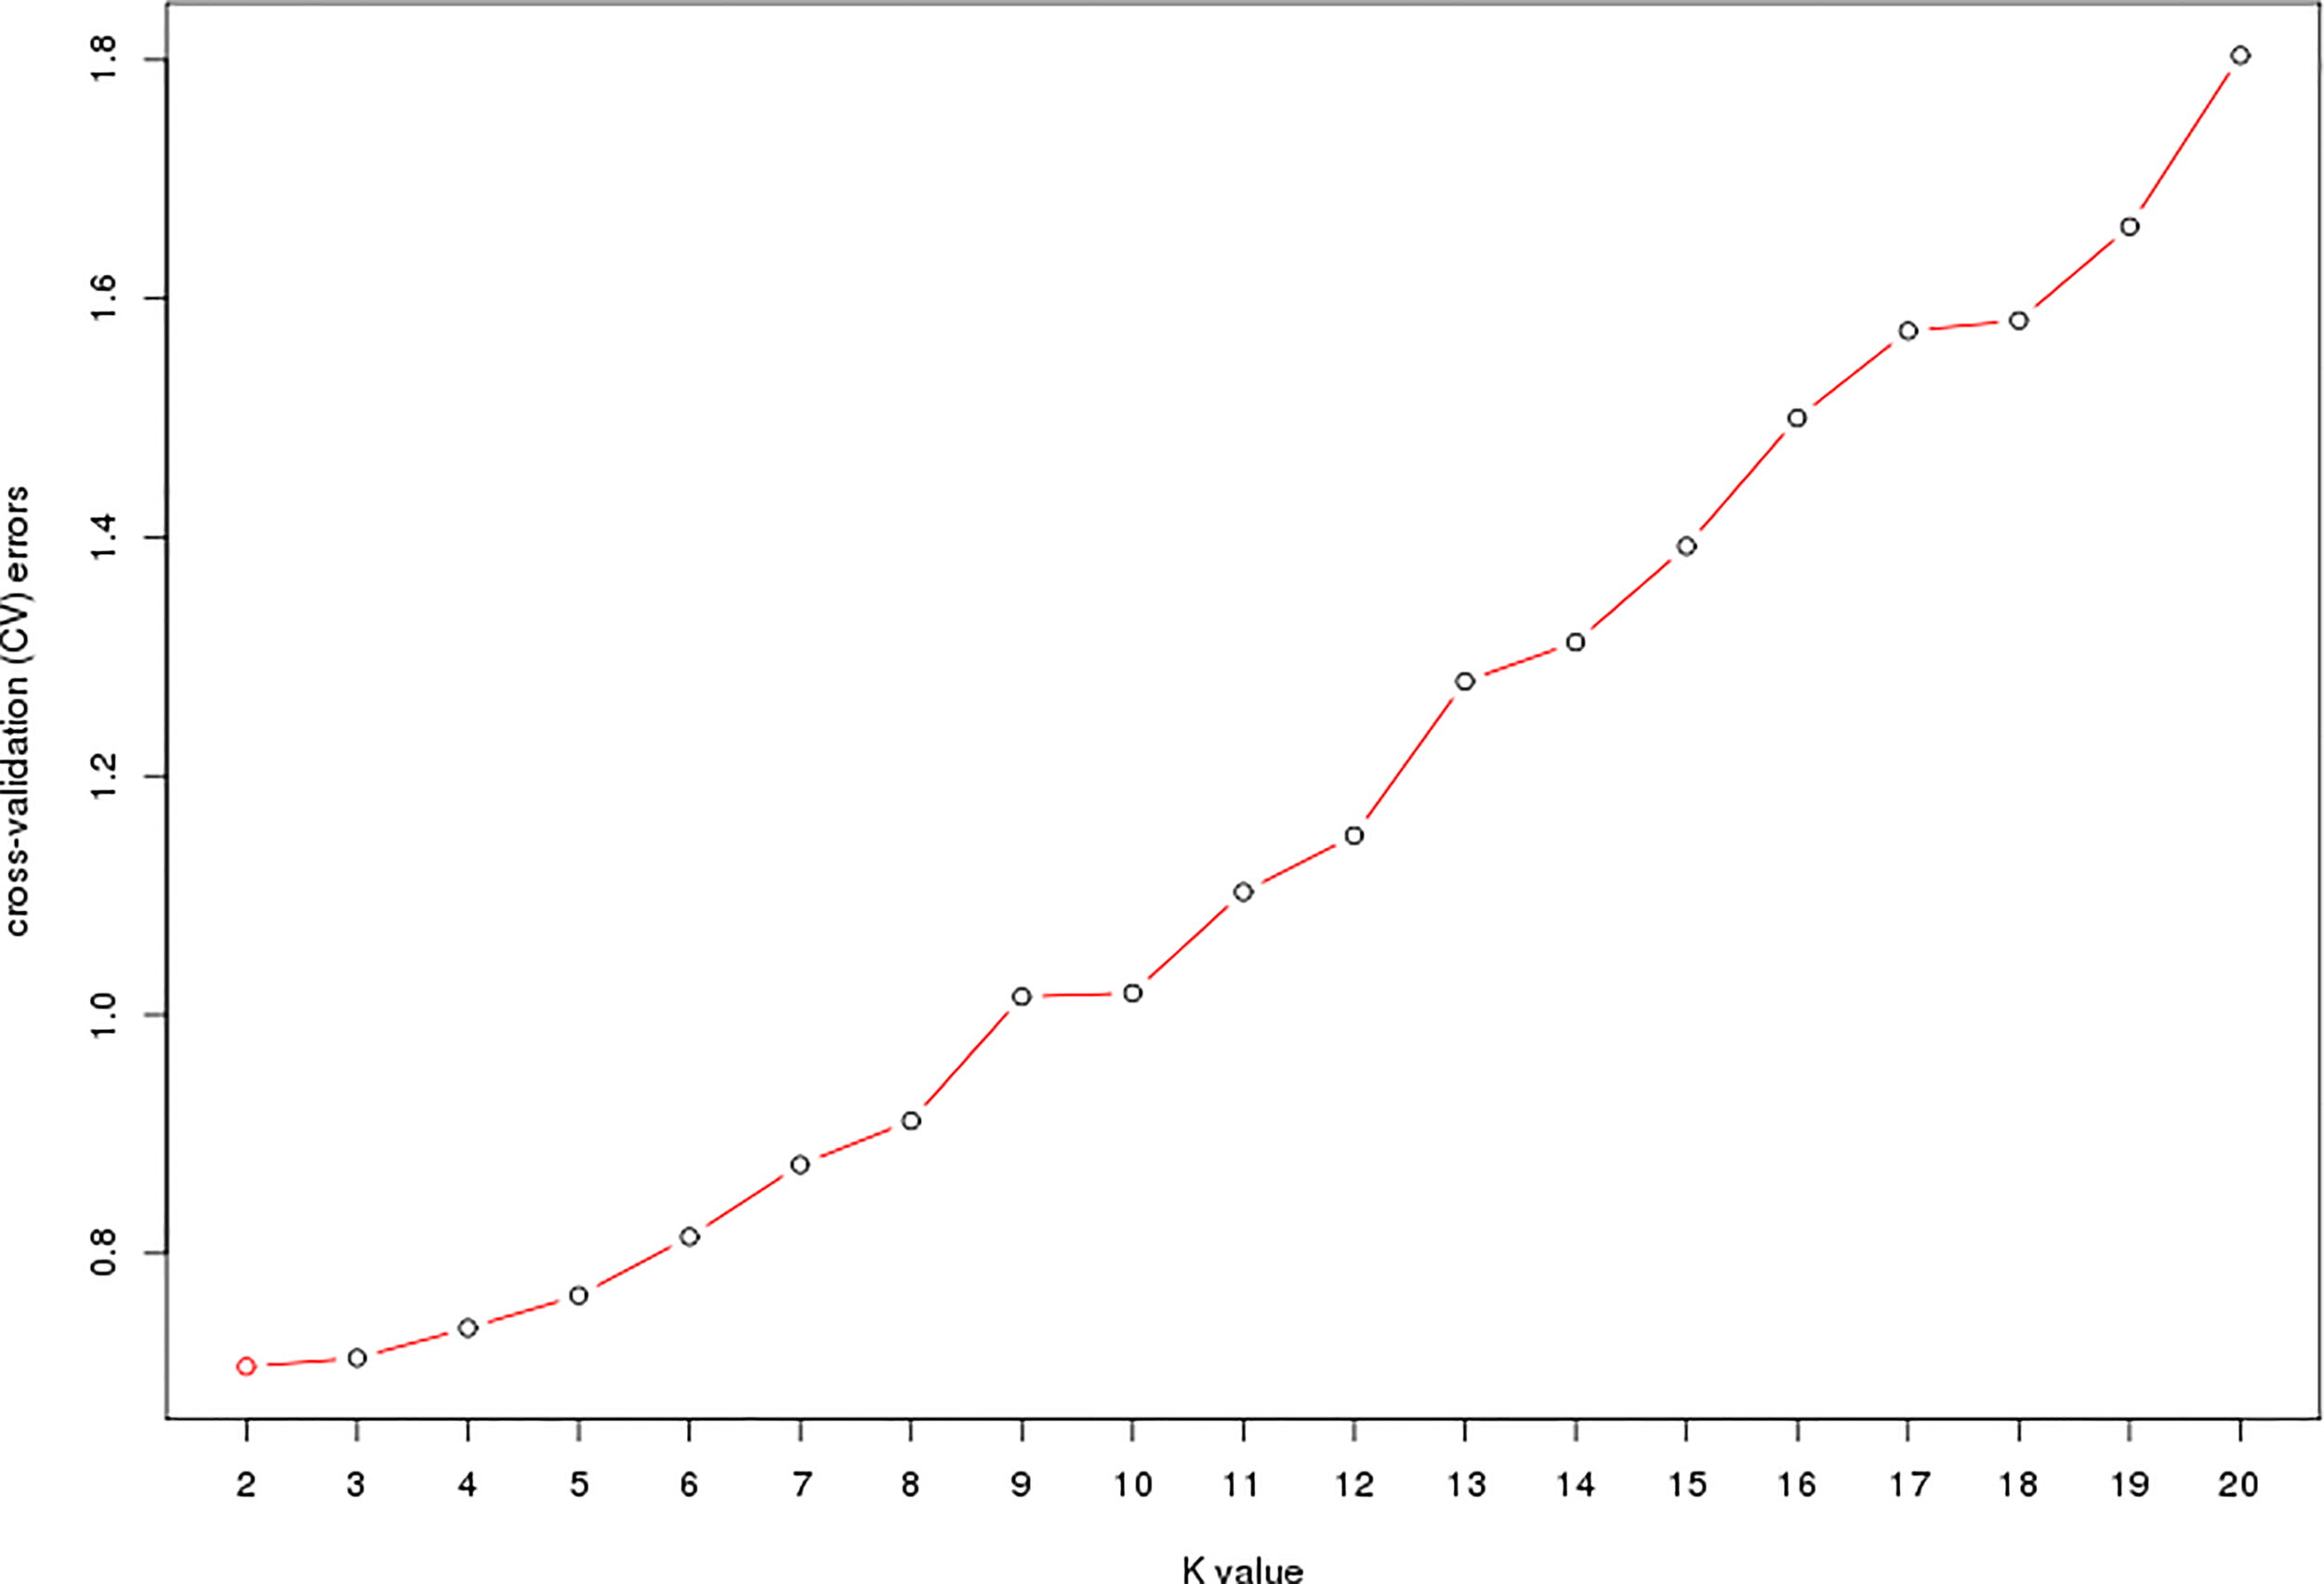
ADMIXTURE estimation of the number of groups for K values ranging from 2 to 20.
Population Genetic Diversity
Prior to population genetic analysis, we performed secondary filtering of the SNP data following the three criteria: (I) SNP loci that could be classified in <80% of individuals; (II) SNP loci with minor allele frequency (MAF) <0.05; and (III) SNP loci with an allele gene greater than 2.
The Pi distribution of 407, DF2, and DF8 was similar with average Pi values of 4.24×10⁻⁵, 4.27×10⁻⁵, and 4.28×10⁻⁵ respectively (Figure 6), which are lower than the average (the average Pi = 4.38×10⁻⁵). The highest Pi is 5.10×10⁻⁵in DF5.
Figure 6
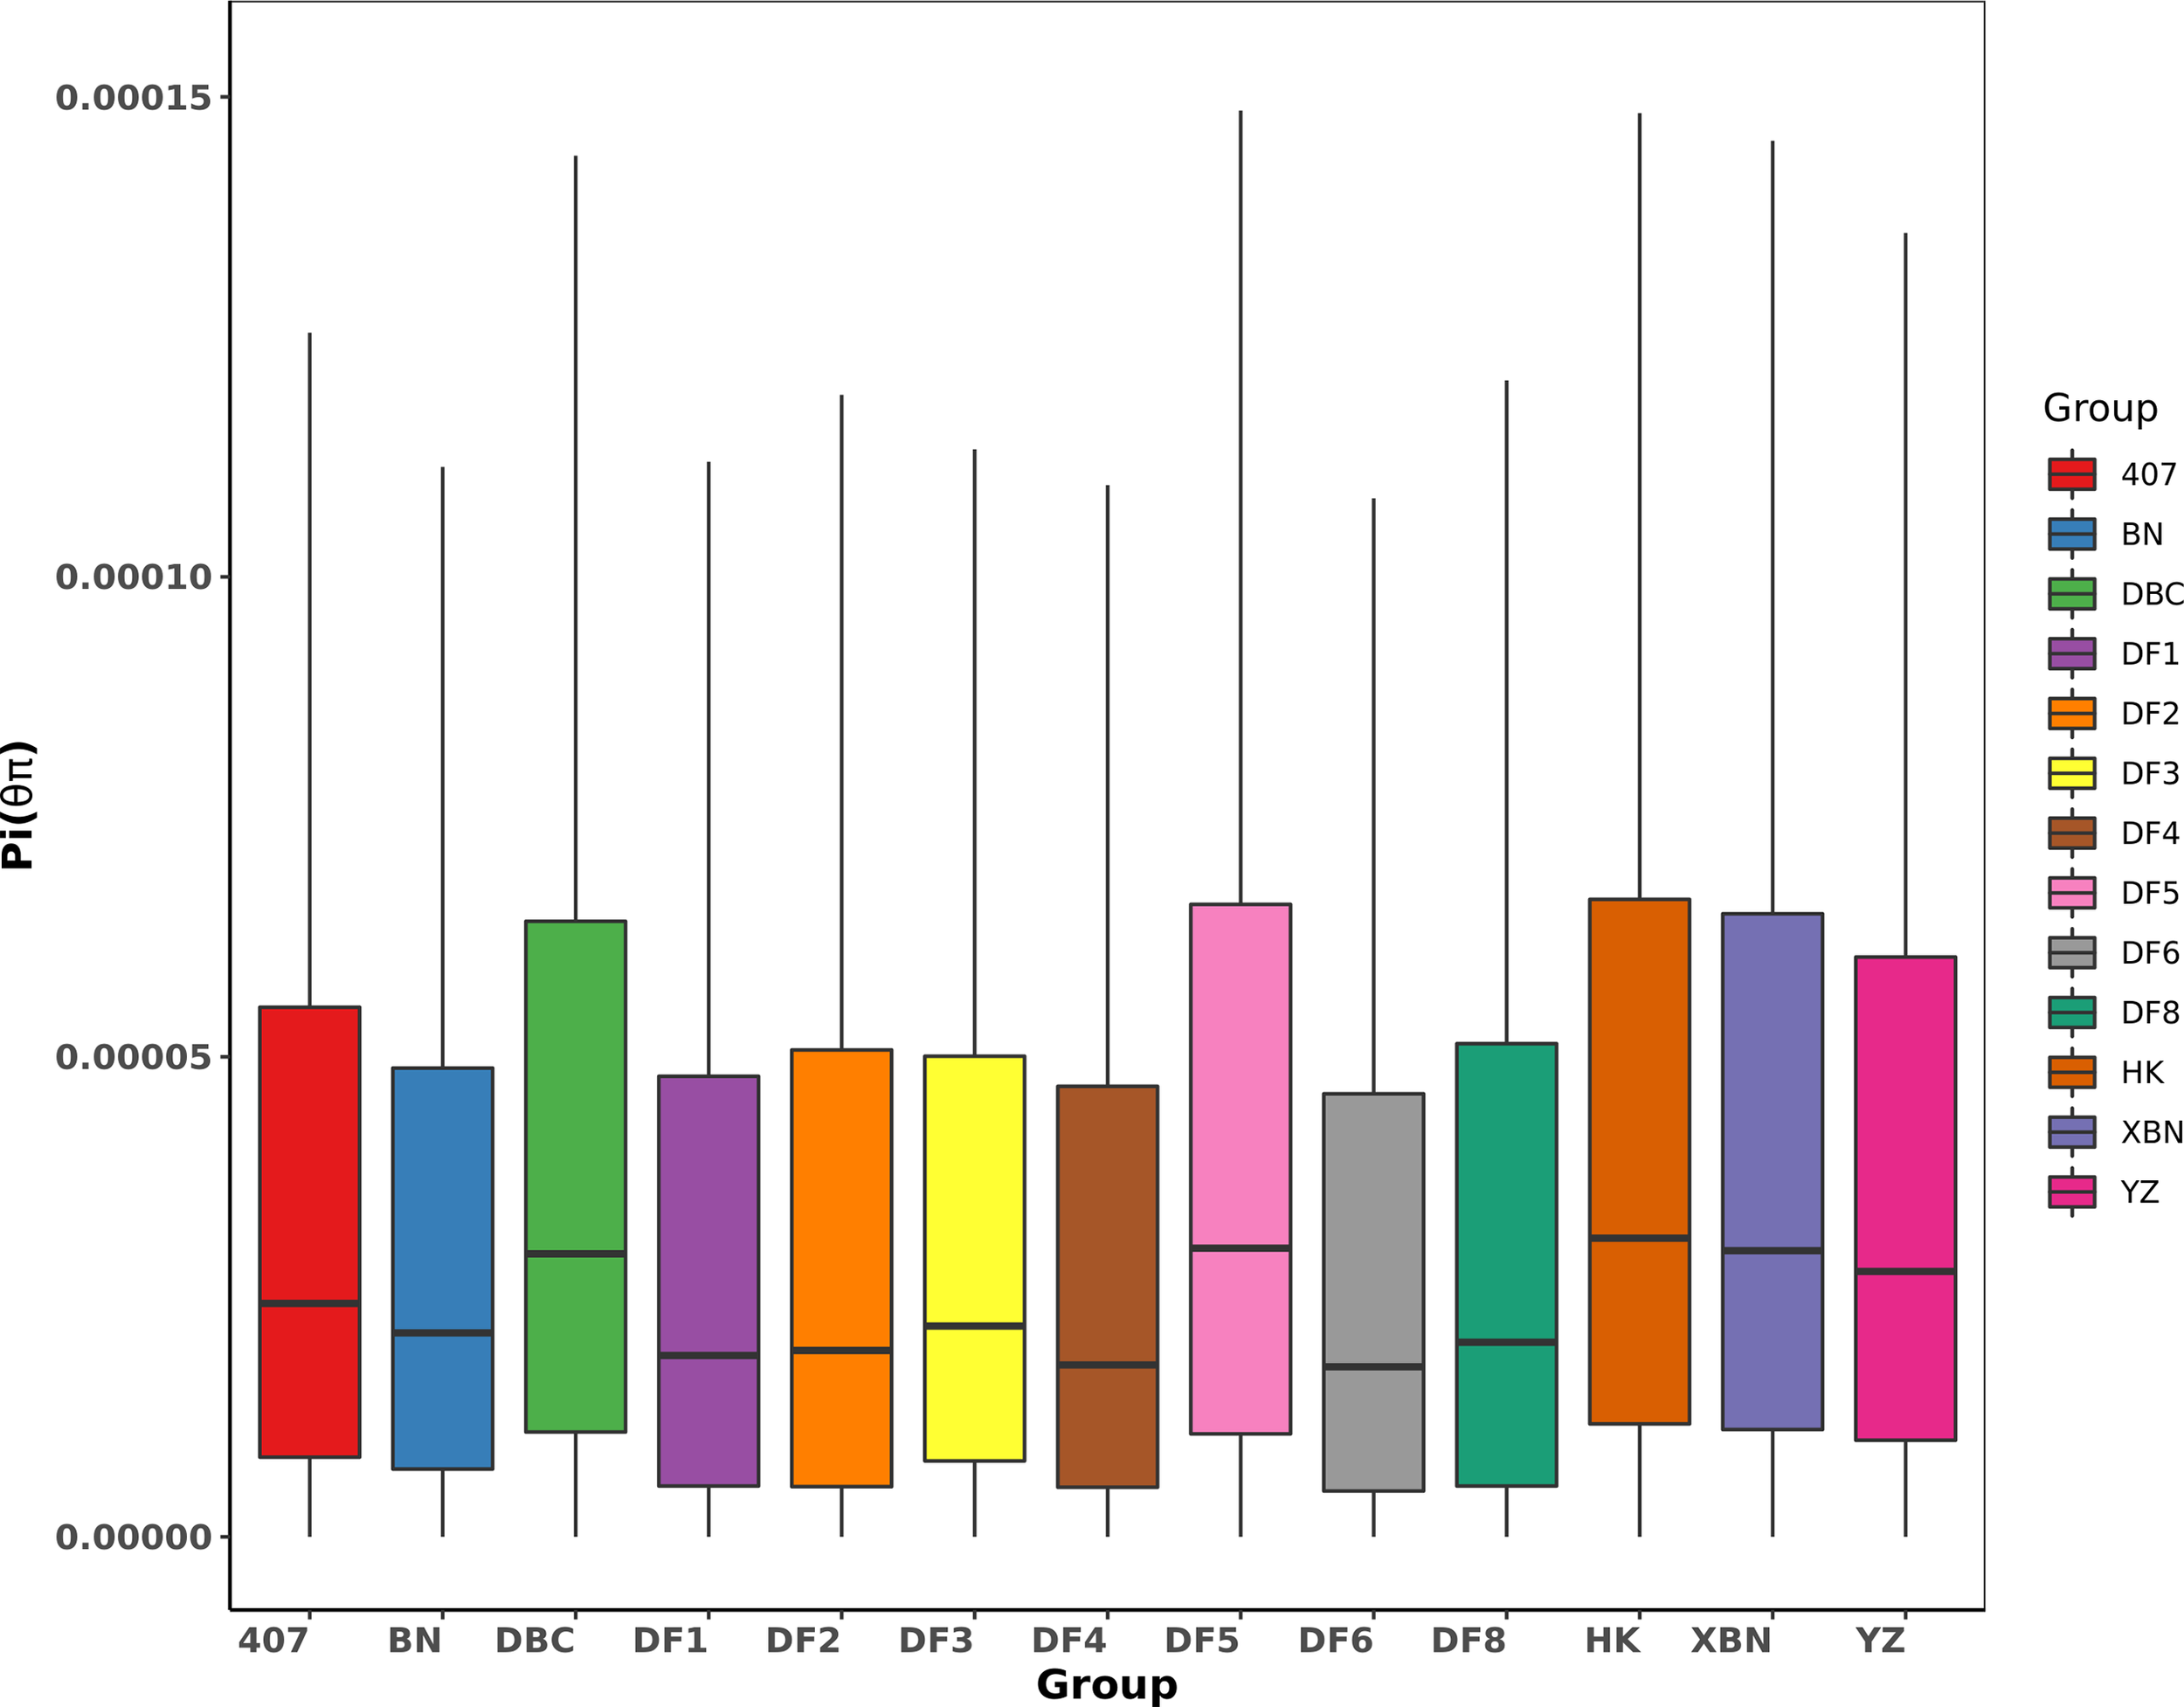
Boxplot of π value of nucleotide diversity.
We found from Table 2 and Figure 7 that most observed heterozygosity (Ho) was lower than expected heterozygosity (He) at the population level and that the inbreeding coefficient Fis was high. DF5 has the highest Ho, indicating that the population heterozygosity was high. DF1 and DF3 have the lowest Ho. XBN and DF5 have the highest F.
Table 2
| Name | 407 | BN | DBC | DF1 | DF2 | DF3 | DF4 | DF5 | DF6 | DF8 | HK | XBN | YZ |
|---|---|---|---|---|---|---|---|---|---|---|---|---|---|
| He | 0.277 | 0.260 | 0.290 | 0.232 | 0.247 | 0.262 | 0.224 | 0.289 | 0.242 | 0.251 | 0.289 | 0.295 | 0.281 |
| Ho | 0.244 | 0.227 | 0.278 | 0.210 | 0.240 | 0.210 | 0.229 | 0.302 | 0.212 | 0.244 | 0.295 | 0.295 | 0.254 |
| Pi | 4.24×10⁻⁵ | 3.84×10⁻⁵ | 4.93×10⁻⁵ | 3. 99×10-5 | 4.27×10⁻⁵ | 3. 87×10-5 | 3. 82×10-5 | 5.10×10⁻⁵ | 3. 90×10-5 | 4.28×10⁻⁵ | 5. 05×10-5 | 5. 01×10-5 | 4.68×10⁻⁵ |
| Fis | 0.114 | 0.226 | 0.166 | 0.284 | 0.007 | 0.095 | 0.281 | 0.293 | 0.302 | 0.238 | 0.013 | 0.364 | 0.196 |
The PIC of SNP of 13 cultivars.
Figure 7
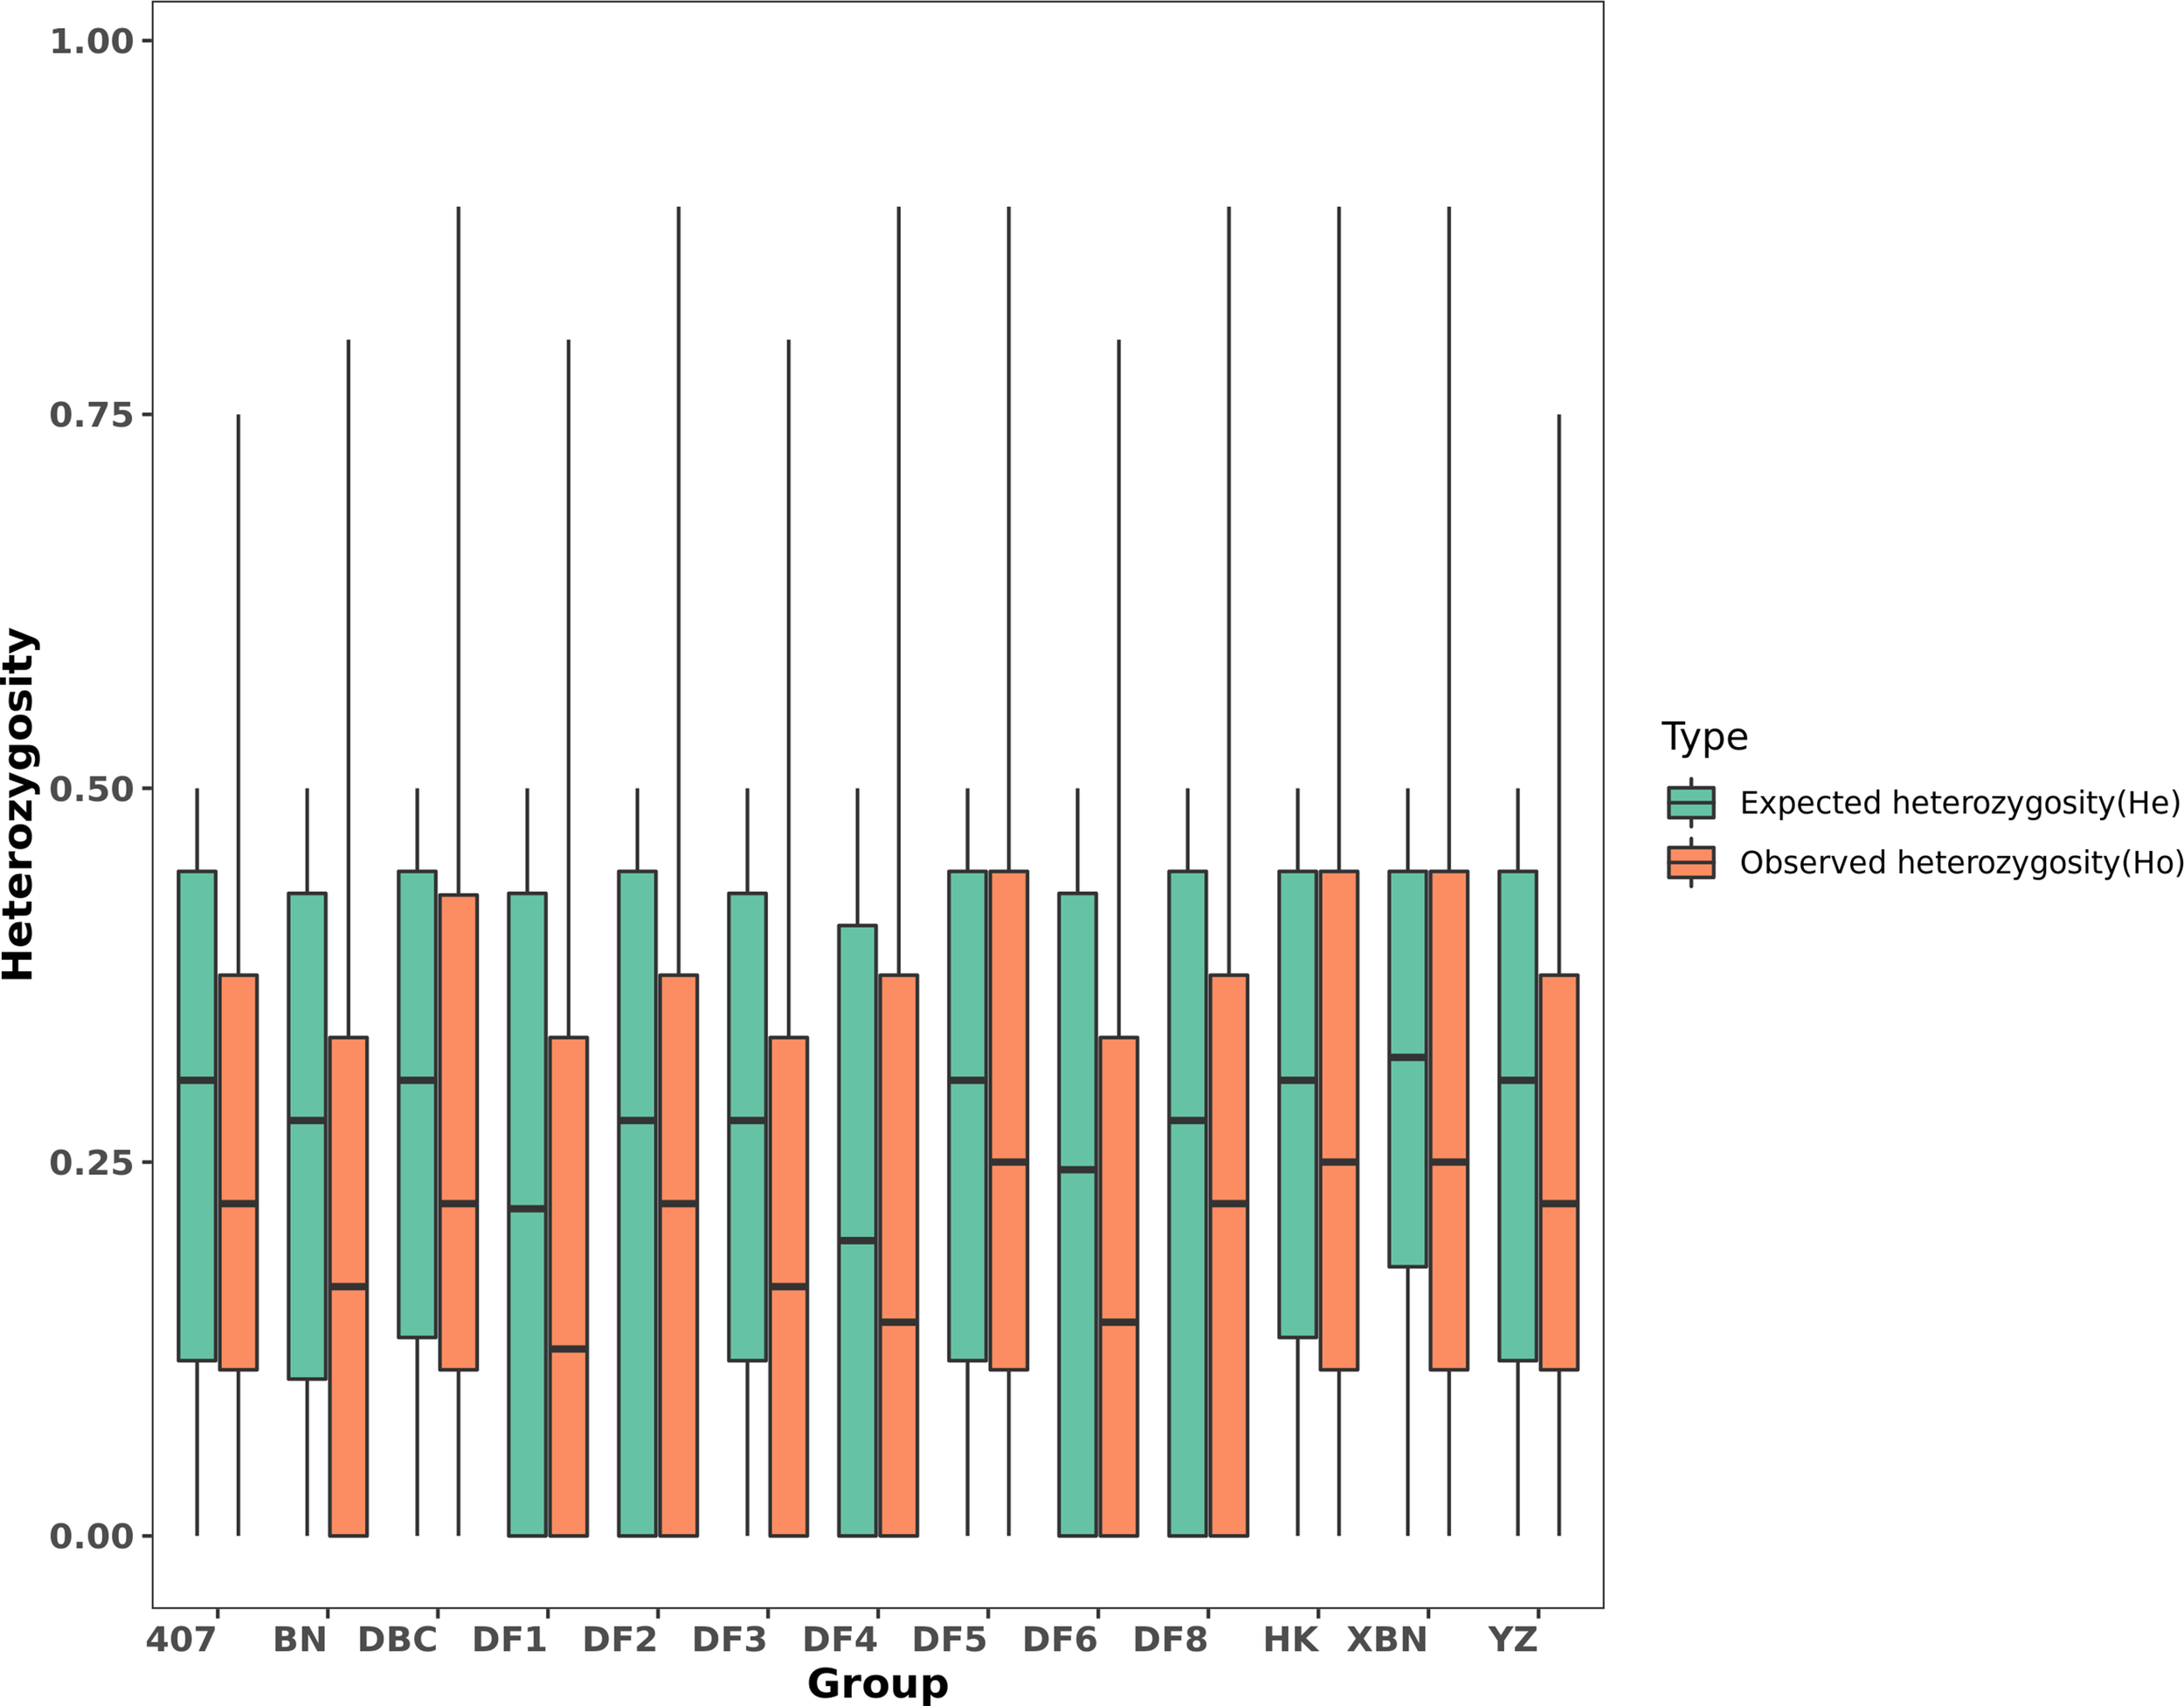
Boxplot of Ho and He in each population.
Discussion
Population Structure
In this study, the concordance of the model-based structure analysis reveals two groups in the population with the phylogenetic tree and PCA clustering. However, there is no correlation between molecular classification and main character classification (Table 3). DF2 and DF6 belong to one group according to molecular analysis. DF2, DF3, and DF6 belong to one group according to the characteristics of high light resistance. DF1, DF6, and YZ belong to one group according to the characteristics of temperature resistance. HK, XBN, DF2, and DF3 belong to one group according to the characteristics of high yield. Because of the mixing in the actual farming process, we cannot accurately evaluate the phenotypic characteristics of 407, DF4, DF5, and DF8. XBN is a cultivar mainly cultured in Rongcheng, and the phenotypic characteristics can be obtained through personal investigation.
Table 3
| Name | Parents | Typical phenotypic characteristics | Usage years |
|---|---|---|---|
| 407 | S. japonica | / | > 20 |
| BN | S. japonica | Wide frond edge, middle yield (Li et al., 2017) | > 30 |
| DBC | S. japonica | Narrow frond edge, middle yield (Li et al., 2009) | > 25 |
| HK | S. japonica | Non-distinct middle groove, high yield (Wang et al., 2019) | 15 |
| XBN | S. japonica | Wide frond edge, high yield | 6 |
| DF1 | S. longissima♀× “zaohoucheng” ♂ | High growth rate and temperature resistance (Zhang et al., 2007) | 25 |
| DF2 | S. japonica♀×S. longissima♂ | High light resistance, high yield (Zhang, 2009) | 16 |
| DF3 | 200 hybrid test groups | High light resistance, high yield (Yizhou, 2009) | 13 |
| DF4 | Different geographical population | / | / |
| DF5 | Different geographical population | / | 8 |
| DF6 | Different geographical population | High light and temperature resistance (Zhe, 2015) | 6 |
| DF8 | Different geographical population | / | 5 |
| YZ | Different geographical population | High growth rate and temperature resistance (Cui, 1996) | 10 |
Information of cultivars breeding and phenotypic characteristics.
Generally, the diversity of phenotypic characteristics of Saccharina cultivars is high, but some characteristics are likely hereditable, and the correlated genes have changed. However, some traits are more affected by circumstance factor, and genetic models were more complex too. Thus, the reasonable classification of cultivated strains is worth further study.
Genetic Diversity
The parents of most Chinese Saccharina cultivars are from S. japonica; long-term selection results in genetic variability. Across the 13 Saccharina cultivars examined in this study, we observed that the highest He and Ho value is 0.295, which is lower than natural kelp population in Japan and Russia (Zhang et al., 2017). However, another study showed that the genetic diversity of cultivars group was higher than the natural kelp populations (Li et al., 2017). The AFLP analysis of cultured and wild population of kelp in Dalian coast showed that the level of genetic variation of two kinds of population has no significant difference (Wang, 2009).
We can discuss the reasons from two aspects: one is that the identification of germplasm of Saccharina cultivars still relies on the experience of technical staff, to increase the impact of the intermixed germplasm; the other is that the analysis of genetic diversity detected by different molecular markers may show different results (Zhang and Yang, 2008). For the kelp analysis of genetic diversity, different analysis methods should be applied and compared; meanwhile, the phenotypic characteristics should be an important reference. Besides, for the cultivars, strong genetic coherence is beneficial for application, but is likely harmful for continuous expression of some excellent characteristics, and it is worthy to find a balance between the two sides in a further study. The reason for high Fis is most probably that the direct ancestor of the cultivation cultivars of kelp was the S. japonica of Japan in China (Shan et al., 2010). It is also necessary to continuously detect genetic structure changes in combination with apparent traits.
Conclusions
In the paper, we collected 13 Saccharina cultivars and developed high-confidence population SNP markers using SLAF-seq. Based on these SNPs, the genetic analysis validated the population structure and genetic diversity. Some Saccharina cultivars are pure and independent cultivars, while some cultivars are still mixed with others. The genetic diversity of these cultivars’ population is lower than the natural S. japonica population that has been reported.
Funding
We acknowledge the support of Agricultural Industrial Technology System in Shandong Province (No. SDAIT-26) and Agricultural Variety Improvement Project (No. 2019LZGC020).
Publisher’s Note
All claims expressed in this article are solely those of the authors and do not necessarily represent those of their affiliated organizations, or those of the publisher, the editors and the reviewers. Any product that may be evaluated in this article, or claim that may be made by its manufacturer, is not guaranteed or endorsed by the publisher.
Statements
Data availability statement
The datasets presented in this study can be found in online repositories. The names of the repository/repositories and accession number(s) can be found at: https://www.ncbi.nlm.nih.gov/, PRJNA786396.
Author contributions
XW and WW conceived the experiments. XW, WW, and DZ performed the experiments and collected algae. XW, SG, and LT performed the data analyses and chart drawing. All authors contributed to the revisions, and read and approved the final manuscript.
Acknowledgments
We sincerely thank Dr. Wang Xiuliang for his valuable comments.
Conflict of interest
The authors declare that the research was conducted in the absence of any commercial or financial relationships that could be construed as a potential conflict of interest.
Supplementary material
The Supplementary Material for this article can be found online at: https://www.frontiersin.org/articles/10.3389/fmars.2022.849502/full#supplementary-material
References
1
Alexander D. H. Novembre J. Lange K. (2009). Fast Model-Based Estimation of Ancestry in Unrelated Individuals. Genome Res.19 (9), 1655–1664. doi: 10.1101/gr.094052.109
2
Arabidopsis Genome Initiative (2000). Analysis of the Genome Sequence of the Flowering Plant Arabidopsis Thaliana. Nature408, 796–815. doi: 10.1038/35048692
3
Bi Y. Hu Y. Zhou Z. (2011). Genetic Variation of Laminaria Japonica (Phaeophyta) Populations in China as Revealed by RAPD Markers. Acta Oceanol. Sinica30, 103–112. doi: 10.1007/s13131-011-0110-y
4
Cao Y. Green-Gavrielidis L. A. Eriksen R. L. Klein A. S. (2019). A Pilot Study of Genetic Structure of Porphyra Umbilicalis Kützing in the Gulf of Maine Using SNP Markers From RNA-Seq. J. Appl. Phycol.31 (2), 1493–1503. doi: 10.1007/s10811-018-1604-1
5
Cong Y. (2009). Germplasm Analysis of Dongfang No.3 Hybrid Laminaria, MS.Thesis. Beijing:Chinese Academy of Agricultural Sciences.
6
Cui X. (1996). Yanza No.1 Transplanted to ShanHaiguan. Hebei Fisheries. 1, 47.
7
Davey J. W. Hohenlohe P. A. Etter P. D. Boone J. Q. Catchen J. M. Blaxter M. L. (2011). Genome-Wide Genetic Marker Discovery and Genotyping Using Next-Generation Sequencing. Nat. Rev. Genet.12, 499–510. doi: 10.1038/nrg3012
8
Doebley J. F. Gaut B. S. Smith B. D. (2006). The Molecular Genetics of Crop Domestication. Cell127 (7), 1309–1321. doi: 10.1016/j.cell.2006.12.006
9
Eimanifar A. Brooks S. A. Bustamante T. Ellis J. D. (2018). Population Genomics and Morphometric Assignment of Western Honey Bees (Apis Mellifera L.) in the Republic of South Africa. BMC Genomics19, 615. doi: 10.1186/s12864-018-4998-x
10
Fang T. C. Wu C. Y. Jiang B. Y. Li J. J. Ren K. Z. (1962). The Breeding of a New Breed of Haidai (Laminaria Japonica.Aresch) and Its Preliminary Genetic Analysis. Bull. Bot.10 (3), 197–209.
11
Jin Z. Liu Y. Zhang J. Gong Q. L. Cui J. J. Liu T . (2009). Breeding Actuality and Developing Direction of Laminaria in China. Trans. Oceanol. Limnol.1, 141–150. doi: 10.1016/j.elecom.2008.10.019
12
Li H. (1990). Notes on the Laminaria Raft Cultivation Method. Mariculture1 (2), 41–48.
13
Li H. (2013a). Collected of Works of Li Hongji (Qingdao, China: China Ocean University Press), 39–48.
14
Li H. (2013b). Collected of Works of Li Hongji (Qingdao, China: China Ocean University Press), 64–73.
15
Li H. Durbin R. (2009). Fast and Accurate Short Read Alignment With Burrows–Wheeler Transform. Bioinformatics25 (14), 1754–1760. doi: 10.1093/bioinformatics/btp324
16
Li H. Handsaker B. Wysoker A. Fennell T. Ruan J. Homer N. et al . (2009). The Sequence Alignment/Map Format and SAMtools. Bioinformatics25 (16), 2078–2079. doi: 10.1093/bioinformatics/btp352
17
Li R. Yu C. Li Y. Lam T.-W. Yiu S.-M. Kristiansen K. et al . (2009). SOAP2, an Improved Ultrafast Tool for Short Read Alignment. Bioinformatics25 (15), 1966–1967. doi: 10.1093/bioinformatics/btp336
18
Li S. Shan T. Hou H. Pang S. J. (2009). Genetic Analyses of Principal Farmed Cultivars of Laminaria Japonica in China, AFLP Analyses of Selfbreeding F1 of Nine Cultivars. J. Fishery Sci. China16 (2), 214–220.
19
Li X. Cong Y. Yang G. Shi Y. Qu S. Li Z. et al . (2007). Trait Evaluation and Trial Cultivation of Dongfang No.2, the Hybrid of a Male Gametophyte Clone of Laminaria Longissima (Laminariales, Phaeophyta) and a Female One of L. Japonica. J. Appl. Phycol.19 (2), 139–151. doi: 10.1007/s10811-006-9120-0
20
Li X. Liu J. Cong Y. Qu S. Zhang Z. Dai H. et al . (2008). Breeding and Trial Cultivation of Dongfang No.3, a Hybrid of Laminaria Gametophyte Clones With a More Than Intraspecific But Less Than Interspecific Relationship. Aquaculture280 (1-4), 76–80. doi: 10.1016/j.aquaculture.2008.05.005
21
Li X. Pang S. J. Shan T. (2017). Genetic Diversity and Population Structure Among Cultivars of Saccharina Japonica Currently Farmed in Northern China. Phycol. Res.65, 111–117. doi: 10.1111/pre.12167
22
Liao L. Lai X. Chen W. Luo D. Li C. Du H. (2010). Study on a New Species of Kelp (“Rongfu” Kelp) Farming Southward Test in Shantou. Fisheries Sci. Technol.1, 12–14. 8.
23
Liu F. Sun X. Wang F. Wang W. Liang Z. Lin Z. et al . (2014). Breeding, Economic Traits Evaluation, and Commercial Cultivation of a New Saccharina Variety “Huangguan No.1”. Aquacult. Int.22, 1665–1675. doi: 10.1007/s10499-014-9772-8
24
Liu F. Yao J. Wang X. Repnikova A. Galanin D. A. Duan D. (2012). Genetic Diversity and Structure Within and Between Wild and Cultivated Saccharina Japonica (Laminariales, Phaeophyta) Revealed by SSR Markers. Aquaculture358–359 (15), 139–145. doi: 10.1016/j.aquaculture.2012.06.022
25
Liu J. Huang S. Sun M. Liu S. Liu Y. Wang W. et al . (2012). An Improved Allele-Specific PCR Primer Design Method for SNP Marker Analysis and its Application. Plant Methods8 (1), 34. doi: 10.1186/1746-4811-8-34
26
McKenna A. Hanna M. Banks E. Sivachenko A. Cibulskis K. Kernytsky A. et al . (2010). The Genome Analysis Toolkit, a MapReduce Framework for Analyzing Next-Generation DNA Sequencing Data. Genome Res.20 (9), 1297–1303. doi: 10.1101/gr.107524.110
27
Ministry of agriculture and rural affairs of the People’s Republic of China Fisheries and Fisheries Administration National fisheries technology extension center China society of Fisheries (2020). China Fisheries Statistics Yearbook (Beijing, China: China Agriculture Press).
28
Price A. L. Patterson N. J. Plenge R. M. Weinblatt M. E. Shadick N. A. Reich D. (2006). Principal Components Analysis Corrects for Stratification in Genome-Wide Association Studies. Nat. Genet.38 (8), 904–909. doi: 10.1038/ng1847
29
Provan J. Glendinning K. Kelly R. Maggs C. A. (2013). Levels and Patterns of Population Genetic Diversity in the Red Seaweed Chondrus Crispus (Florideophyceae), a Direct Comparison of Single Nucleotide Polymorphisms and Microsatellites. Biol. J. Linn. Soc.108 (2), 251–262. doi: 10.1111/j.1095-8312.2012.02010.x
30
Purcell S. Neale B. Todd-Brown K. Thomas L. Ferreira M. A. R. Bender D. et al . (2007). PLINK, a Tool Set for Whole-Genome Association and Population-Based Linkage Analyses. Am. J. Hum. Genet.81 (3), 559–575. doi: 10.1086/519795
31
Shan T. F. Pang S. J. Zhang Y. R. Yakovleva I. M. Skriptsova A. V. (2010). An AFLP-Based Survey of Genetic Diversity and Relationships of Major Farmed Cultivars and Geographically Isolated Wild Populations of Saccharina Japonica (Phaeophyta) Along the Northwest Coasts of the Pacific. J. Appl. Phycol.23, 35–45. doi: 10.1007/s10811-010-9530-x
32
Singh B. D. Singh A. K. (2015). High-Throughput SNP Genotyping. Marker-Assisted Plant Breeding, Principles and Practices (New Delhi: Springer), 367–400.
33
Sun X. Liu D. Zhang X. Li W. Liu H. Hong W. et al . (2013). SLAF-Seq, an Efficient Method of Large-Scale De Novo SNP Discovery and Genotyping Using High-Throughput Sequencing. PloS One. 8 (3), 1–9. doi: 10.1371/journal.pone.0058700
34
Tamura K. Peterson D. Peterson N. Stecher G. Nei M. Kumar S. (2011). MEGA5, Molecular Evolutionary Genetics Analysis Using Maximum Likelihood, Evolutionary Distance, and Maximum Parsimony Methods. Mol. Biol. Evol.28 (10), 2731–2739. doi: 10.1093/molbev/msr121
35
Tseng C. K. (2001). Algal Biotechnology Industries and Research Activities in China. J. Appl. Phycol.13, 375–380. doi: 10.1023/A:1017972812576
36
Tseng C. K. Sun K. Y. Wu C. Y. (1955). On the Cultivation of Haidai (Laminaria Japonica Aresch.) by Summering Young Sporophytes at Low Temperature. Acta Botanica Sinica4, 255–264.
37
Tseng C. K. Wu C. Y. (1962). Aquacultural Biology of Saccharina Japonica (Beijing, China: Science Press), 253–268.
38
Veasey E. A. Borges A. Rosa M. S. Queiroz-Silva J. R. de Andrade Bressan E. Peroni N. (2008). Genetic Diversity in Brazilian Sweet Potato (Ipomoea Batatas (L.) Lam., Solanales, Convolvulaceae) Landraces Assessed With Microsatellite Markers. Genet. Mol. Biol.31 (3), 725–733. doi: 10.1590/S1415-47572008000400020
39
Voisin M. Engel C. R. Viard F. (2005). Differential Shuffling of Native Genetic Diversity Across Introduced Regions in a Brown Alga, Aquaculture vs. Maritime Traffic Effects. PNAS102 (15), 5432–5437. doi: 10.1073/pnas.0501754102
40
Wang H. (2009). AFLP Analysis in Genetic Diversity of Cultured and Wild Populations of Laminaria Japonica in Dalian Coast. MS. Thesis (Dalian: Liaoning Normal University).
41
Wang X.-L. Liu C.-L. Li X.-J. Cong Y.-Z. Duan D.-L. (2005). Assessment of Genetic Diversities of Selected Laminaria (Laminariales, Phaeophyta) Gametophytes by Inter-Simple Sequence Repeat Analysis. J. Integr. Plant Biol.47 (6), 753–758. doi: 10.1111/j.1744-7909.2005.00059.x
42
Wang S. Zhang R. Chang L. Xiao L. Sun L. Liu Z. (2019). Growth Performance of Different Varieties/Lines of Kelp Saccharina Japonica in Sanggou Bay, Weihai, China. J. Dalian Ocean University35 (1), 1–7. doi: 10.16535/j.cnki.dlhyxb.2019-022
43
Zhang Z. (2009). The Breeding Technique of Hyrid Laminaria Dongfang No.2. MS. Thesis (Beijing: Chinese Academy of Agricultural Sciences).
44
Zhang J. Liu Y. Yu D. Song H. Cui J. Liu T. (2011). Study on High-Temperature-Resistant and High-Yield Laminaria Variety “Rongfu”. J. Appl. Phycol.23, 165–171. doi: 10.1007/s10811-011-9650-y
45
Zhang Q.-S. Tang X.-X. Cong Y.-Z. Qu S.-C. Luo S.-J. Yang G.-P. (2007). Breeding of an Elite Laminaria Variety 901 Through Inter-Specific Gametophyte Crossing. J. Appl. Phycol.19, 303–311. doi: 10.1007/s10811-006-9137-4
46
Zhang J. Wang X. Yao J. Li Q. Liu F. Yotsukura N. et al . (2017). Effect of Domestication on the Genetic Diversity and Structure of Saccharina Japonica Populations in China. Sci. Rep. 7, 1–11. doi: 10.1038/srep42158
47
Zhang D. Yang Y. (2008). A Statistical and Comparative Analysis of Genetic Diversity Detected by Different Molecular Markers. Acta Botanica Yunnanica30 (2), 159–167.
48
Zhe Y. (2015). Laminaria Dongfang No.6. China Fisheries2, 53–55.
49
Zhenhui J. Liu Y. Zhang J. Gong Q. L. Cui J. J. Liu T. (2009). Breeding Actuality and Developing Direction of Laminaria in China. Trans. Oceanol. Limnol.1, 141–150. doi: 10.1016/j.elecom.2008.10.019
Summary
Keywords
Saccharina japonica , cultivar, SLAF-seq, phylogenetic analysis, genetic structure
Citation
Wang X, Wang W, Zhan D, Ge S and Tang L (2022) Genome-Wide SNP Markers Based on SLAF-Seq Uncover Genetic Diversity of Saccharina Cultivars in Shandong, China. Front. Mar. Sci. 9:849502. doi: 10.3389/fmars.2022.849502
Received
06 January 2022
Accepted
14 March 2022
Published
22 April 2022
Volume
9 - 2022
Edited by
Tifeng Shan, Institute of Oceanology (CAS), China
Reviewed by
Wilson Thau Lym Yong, Universiti Malaysia Sabah, Malaysia; Ming Liu, Morgan State University, United States
Updates
Copyright
© 2022 Wang, Wang, Zhan, Ge and Tang.
This is an open-access article distributed under the terms of the Creative Commons Attribution License (CC BY). The use, distribution or reproduction in other forums is permitted, provided the original author(s) and the copyright owner(s) are credited and that the original publication in this journal is cited, in accordance with accepted academic practice. No use, distribution or reproduction is permitted which does not comply with these terms.
*Correspondence: Xiangyu Wang, wangxiangyu0532@outlook.com
This article was submitted to Marine Molecular Biology and Ecology, a section of the journal Frontiers in Marine Science
Disclaimer
All claims expressed in this article are solely those of the authors and do not necessarily represent those of their affiliated organizations, or those of the publisher, the editors and the reviewers. Any product that may be evaluated in this article or claim that may be made by its manufacturer is not guaranteed or endorsed by the publisher.