Abstract
Ecosystems are simultaneously regulated by bottom-up (resources) and top-down forces (predators). However, because predator-prey interactions operate on spatial scales beyond the reach of manipulative experimentation, the actual roles of predators remain poorly understood. In ecosystems where predators are naturally absent, biological invasions provide a unique experiment to shed light on the large-scale and long-term effects of predators in the recipient ecosystem. We combined data from long-term benthic monitoring, environmental conditions, and a census of round goby population to identify changes in the dominant benthic bivalve population (Mytilus trossulus and Macoma balthica) following round goby (Neogobius melanostomus) invasion. This study demonstrates a substantial change in the food web, with earlier primarily bottom-up regulated communities facing strong top-down control effects. The introduction of a novel predator to a species-poor ecosystem substantially reduced dominant invertebrate populations in a large part of the study area, sometimes with a time lag of 1−3 years. In general, the effects were less in high productivity areas. In some cases, community recovery was observed but rarely to pre-invasion levels, raising the question of the ability of bivalve communities to act as a natural filter. This study demonstrates long-term trends in benthic communities and by excluding possible effects due to the changing environment provides more evidence that invasive species transform coastal ecosystems over time and space.
Introduction
Human activities increase the rate of species introductions and rapidly break down natural barriers separating species in different biogeographic provinces (Elton, 1958; Gurevitch and Padilla, 2004). These introductions often result in a devastating rearrangement of structure and functioning of the recipient ecosystems (Miehls et al., 2009). Predators are believed to offer biotic resistance to invasions by preferentially consuming non-native prey over native prey (Colautti et al., 2004). When native predators are absent from the system, the introduction of an efficient predator could reduce and eventually decimate consumer populations, but likely lead to many other unpredicted outcomes (Burkepile and Hay, 2006). The omnipresence of predators in the marine realm has hampered quantification of their ecological role and function because the spatial scales required for relevant experiments exceed realistic scientific boundaries. Although testing the consequences of different predator-prey interactions is theoretically simple, in practice it is very difficult because most of these interactions operate on large spatial scales. However, we can take advantage of the events of species introduction to learn more about the roles of different predators in ecosystems.
The functioning of ecosystems relies on contributions and functioning of all food web levels. Plant growth is enhanced initially by bottom-up effects such as the availability of light, nutrients, and heat, which determine interactively the consumable biomass of primary producers and set theoretical biomass limits for subsequent trophic levels (Hill et al., 1995; Field et al., 1998; Chapin III et al., 2002). Concurrently, plants as well as herbivores and mesopredators are subject to top-down forces that regulate their realized biomass in ecosystems (Mattson and Addy, 1975; Hughes et al., 2014). Bottom-up and top-down forces operate simultaneously and how these forces regulate interactively species diversity, biomass, and productivity within and across ecosystems is an ongoing research topic (Burkepile and Hay, 2006; Ripple et al., 2016). These forces are affected by a large amount of biological invasions with some species already causing significant changes in the bottom-up top-down regulations (Kotta et al., 2018).
Trophic cascade is based on the concept that change in one trophic level proliferates through lower levels and results in positive and negative feedbacks (Heath et al., 2014). Predators can alter ecosystems directly or indirectly by reducing prey populations and altering energy flow through food webs via trophic cascades (Power, 1992; Preisser et al., 2005). The strength of trophic cascades varies widely among ecosystems; some ecosystems are less resilient to increased top-down pressure caused by trophic cascades (Heath et al., 2014).
Mobile consumers can often act as key species, able to move to spatially localized resources created by bottom-up effects and exert major control over comparatively large spatial scales (Levinton and Kelaher, 2004), particularly in marine environments where mobile species can dictate the rules of existence for broad suites of resident biota (Hastings et al., 2007; Jones et al., 2010). Specifically, benthic fish play a key ecological role in many coastal food webs (Andersson et al., 1978; Winkelmann et al., 2011; de Aguiar et al., 2020); their grazing, predation and scavenging exert strong control over benthic communities (Ruitton et al., 2000; Gerke et al., 2018). Community response to mobile consumers can be rapid or exhibit a time lag, especially in heterogeneous habitats in which some prey species may have opportunity to recover (González-Moreno et al., 2017).
The Pontocaspian round goby Neogobius melanostomus (Pallas 1811) was introduced to the Baltic Sea in 1991 and has become a key predator in coastal food webs in the north-eastern area since the 2010s (Kotta et al., 2016; Skabeikis et al., 2019). The round goby is a generalist feeder, able to prey on most benthic invertebrates in local benthic invertebrate communities, although bivalves typically constitute most of their diet (Nurkse et al., 2016; Nurkse et al., 2018). In the Baltic Sea the hard bottom dominant mussel Mytilus trossulus Gould, 1850 and the soft bottom dominant clam Macoma balthica (Linnaeus, 1758) are key habitat forming species, responsible for mitigating effects of eutrophication and exerting significant impact on pelagic habitats through benthic-pelagic coupling (Tomczak et al., 2009; Griffiths et al., 2017). Over time, the invasive round goby is expected to reduce the availability of resources for multiple trophic levels (Pennuto et al., 2018). Prior to the arrival of round goby, the lack of abundant benthic predators allowed most coastal communities to be largely bottom-up regulated with the availability of nutrients, food and space controlling species abundances (Kotta et al., 2008a; Kotta et al., 2008b). Here we take advantage of this unique opportunity to test the ecological implications of introducing an efficient predator to an ecosystem.
The Baltic Sea represents a truly unique waterbody. In addition to its extensive natural environmental gradients, the anthropogenic effects of ca. 85 million people living within its drainage area render the Baltic Sea subject to myriad ecological pressures (Snoeijs-Leijonmalm and Andrén, 2017). Because these natural and anthropogenic factors can themselves affect the status of benthic bivalves, we required models that account for their effects. In this study we combined the data from long-term benthic monitoring and a census of round goby population to identify changes in the biomass of benthic bivalves following the round goby invasion. Data collected for the national coastal monitoring programme were designed to describe community condition and biodiversity. Models were designed to calculate and remove the effects of environmental variables on benthic bivalves. This process allowed us not only to quantify the role of round goby invasion on benthic populations, but to quantify their effect sizes with respect to spatially different environmental conditions within the study area.
Material and Methods
Study Area
The study was conducted in the north-eastern Baltic Sea (Figure 1). The sampling locations extended throughout the Estonian coastal sea with stations in the Gulf of Finland (eastern, central, and western), Gulf of Riga, Väinameri and Baltic Proper. The area is characterized by almost non-existent tides, high nutrient fluxes from large river systems and seawater freshening (Segerstråle, 1957; HELCOM, 2013). The coastline is highly heterogenic, with rocky shores at the tips of the peninsulas, mixed shores with cobbles, gravel-pebble, and sand particles on the flanks of the peninsulas and finer grained sandy and silty shores in the bays (Martin et al., 2013). Benthic communities in the area are affected mostly by depth, salinity, wave exposure, and seabed substrates. Species richness is low and spatially variable (Ojaveer et al., 2010).
Figure 1
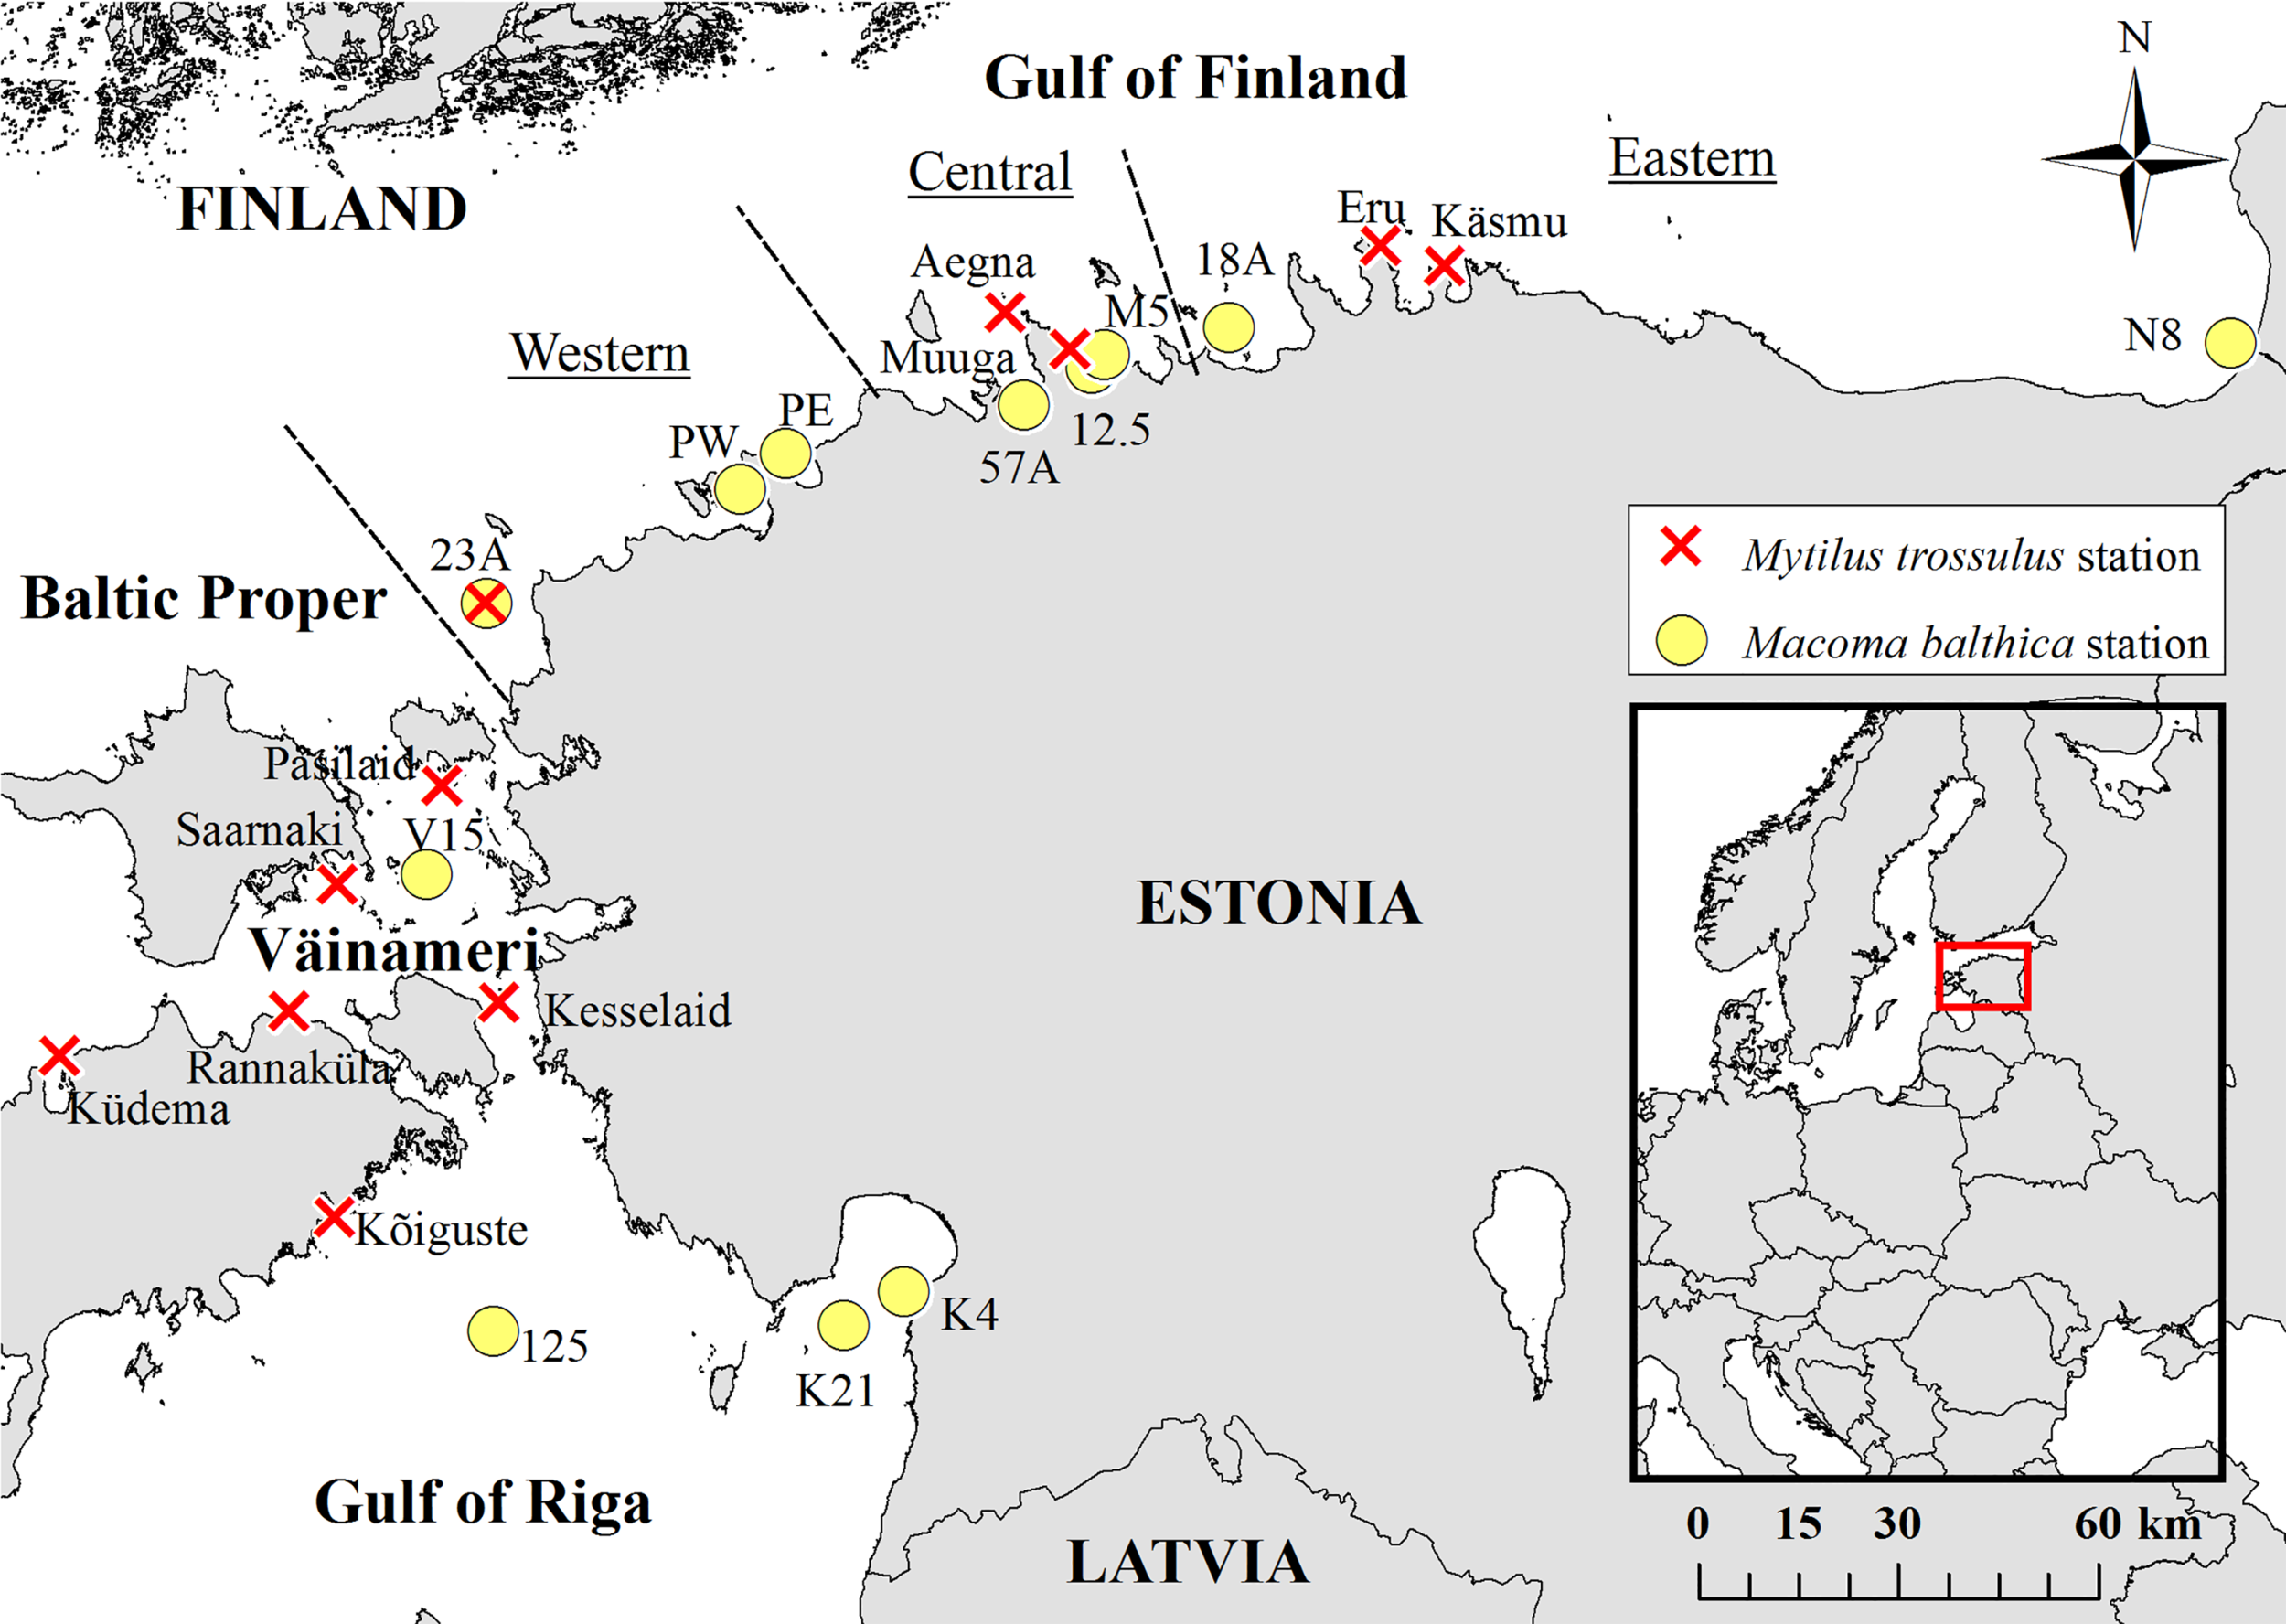
Location of study stations.
Round Goby and Benthic Habitat Data
The yearly catch of round goby was used as a proxy of the areal biomass of the invasive fish in each station. The catch statistics were obtained from the Veterinary and Food Board based on obligatory catch data submitted by coastal fishermen. Each round goby catch in a unique small statistical quadrat is reported as a monthly biomass (kg). The main grid of catch quadrates consists of approximately 10 x 18 km grid cells and some neighbouring grid cells near the coastline are merged. Small statistical quadrats map can be downloaded from the Estonian Government website (https://www.riigiteataja.ee/aktilisa/1311/0201/5002/VV_29102015_110m_lisa2.pdf). The annual round goby biomass was calculated as the total annual biomass (kg) divided by the catch quadrate surface area (km2) obtained with ArcMap 10.8.1. For each benthic sampling station, each sampling year-round goby biomass (kg km-2) was assigned based on its location within a specific small statistical quadrat. For stations located near the border of two or more small catch quadrats, the biomass was calculated as the mean of the small catch quadrats. For stations located offshore, the nearest adjacent shoreline small catch quadrat was used.
Whenever possible, annual fishermen catches were compared with the census of national coastal fish monitoring (2012−2020). Data showed strong correlations in all stations between catches reported by fishermen and coastal monitoring (Spearman rank correlation: Station 125 rho=0.87, p<0.05; station Kõiguste rho=0.86, p<0.05; station Eru rho=0.83, p<0.05).
The biomass of prey species was obtained from 22 benthic sampling stations. The samples were collected between 1995 and 2020. Data from replicate samples (n=3) of each sampling station were averaged to reduce the variability due to habitat heterogeneity. Ekman and Van Veen type bottom grab samplers were used to estimate the biomass of Macoma balthica in soft sediments and scuba divers collected samples with a 0.04m2 metal frame for the biomass estimations of Mytilus trossulus on hard substrates. Sampling and analysis followed the guidelines developed for the HELCOM COMBINE programme (HELCOM, 2015). All biomasses were calculated per m2. Physical variables, such as depth, and the areal coverage of hard substrate and perennial species were recorded during sample collection. This habitat information was later used as covariables in prey models (see the section data analyses) as benthic habitat characteristics are known to modulate the behaviour and predation rate of round goby (Liversage et al., 2017).
Water Column Data
Information on the physical and biogeochemical conditions (temperature, salinity, oxygen, chlorophyll a, nitrogen, and phosphorus) in the Baltic Sea were downloaded from the EU Copernicus Marine Service data portal (https://marine.copernicus.eu/). Data from the products Baltic Sea Physics Reanalysis (https://resources.marine.copernicus.eu/product-detail/BALTICSEA_REANALYSIS_PHY_003_011) and Baltic Sea Biogeochemistry Reanalysis (https://resources.marine.copernicus.eu/product-detail/BALTICSEA_REANALYSIS_BIO_003_012) were obtained to cover the time frame of 1995-2019. Unfortunately, no data from 2020 were available in these products (Copernicus Marine Service data portal visited on December 10, 2021). To match the time frame of biological data, the 2020 data were obtained from the products Baltic Sea Physics Analysis and Forecast (https://resources.marine.copernicus.eu/product-detail/BALTICSEA_ANALYSISFORECAST_PHY_003_006) and Baltic Sea Biogeochemistry Analysis and Forecast (https://resources.marine.copernicus.eu/product-detail/BALTICSEA_ANALYSISFORECAST_BGC_003_007).
The Baltic Sea Physics Reanalysis and Baltic Sea Biogeochemistry Reanalysis are produced by using the NEMO-Nordic ice-ocean model (based on NEMO-3.6, Nucleus for European Modelling of the Ocean) together with a LSEIK data assimilation scheme. The biogeochemistry product is additionally coupled with the biogeochemical model SCOBI. The Baltic Sea Physics Analysis and Forecast is produced by a Baltic Sea set up of the NEMOv4.0 ocean model. The ocean model is offline coupled with Stokes drift data from the Baltic Wave forecast product. The Baltic Sea Biogeochemistry Analysis and Forecast product is produced by the biogeochemical model ERGOM one way coupled to a Baltic Sea set up of the NEMO ocean model. The products’ documentation provides further details.
The reanalysis and forecast products were available in 4 × 4 km and 2 × 2 km resolutions, respectively. All products contained 56 vertical water column layers, but only surface and bottom layers were used in this study. Monthly means were downloaded for all products. All data were interpolated to a 1 × 1 km grid using inverse distance weighted interpolation with default settings in R package gstat (Gräler et al., 2016).
Only data from recent two years were available in the forecast products. The forecast products were used only because the reanalysis products’ timeframe did not cover the year 2020. There were some systematic differences between the values of variables of reanalysis and forecast products. To address these differences, data from 2019 was used, which was the common year in both products. Using the 2019 data, reanalysis product’s values of each variable in each grid cell were divided with those of forecast product resulting in coefficients in each grid cell. Mean values of these coefficients for each variable were then used to recalculate the values of forecast products to match the levels in the reanalysis products.
Data Analysis
Change in the overall prey biomass was tested by calculating average annual biomass before and after round goby invasion and by Kruskal-Wallis test to test the differences in the before and after invasion biomasses in each station (Daniel, 1990).
A selection of environmental variables into final models included only these variables with documented ecological relevance to a prey species (Mytilus trossulus, Macoma balthica, Table 1). The Mytilus trossulus model included yearly sea bottom temperature (annual average), salinity (annual maximum), oxygen concentration (minimum of summer months, i.e. June to August average) and sea surface chlorophyll a (maximum of summer months average). Perennial plant biomass, depth and areal coverage of hard substrate were used as a proxy for habitat suitability. The study area temperature range is suitable for M. trossulus, and its variability possibly regulates biomass growth, thus annual averages were used (Marshall et al., 2021). Maximum annual salinity was used owing to M. trossulus inhabiting the edge of its distribution range and the decreasing eastward salinity gradient in the study area indicates that M. trossulus populations likely benefit from annual maximum salinity levels (Westerbom et al., 2002). Summer anoxic conditions are known to affect coastal community functioning and minimal oxygen concentrations can serve as a proxy to investigate its impact on the M. trossulus biomass (Jakubowska and Normant, 2015). Chlorophyll a served as a proxy for M. trossulus food supply, which is quite uniformly distributed in the entire study area; however, extremely high values of chlorophyll a may occur in the inner embayments, which inhibits feeding. Therefore, maximum values were used to characterize the feeding conditions of mussels (Orav-Kotta et al., 2010). The Macoma balthica model included annual sea bottom temperature, salinity, current speed (all annual averages), surface nitrate concentration (maximum of winter months i.e. December to February average), and phosphate concentration (maximum of winter months average). Depth, areal coverage of hard substrate and current speed are used as a proxy for suitable M. balthica habitats. Because extremes in temperature, salinity and current speed have not been shown to affect M. balthica biomass, annual averages were used in the models (Drent, 2002; Jansen et al., 2009). Dissolved nutrients in winter are indicative of food supply availability in summer (Piiparinen et al., 2010) and maximum events are more prone to cause extreme events which indirectly effect M. balthica biomass. The surface level chlorophyll a concentration (summer months averaged between 2000 and 2019) was used as a proxy of productivity level in each station over the entire study period.
Table 1
| Model | Variables | Unit | Transform. | Smooth | edf | df | F | p |
|---|---|---|---|---|---|---|---|---|
| 1 | Dependent variable: | |||||||
| Mytilus trossulus biomass | g m-2 | square root | ||||||
| Independent variables: | ||||||||
| Temperature | °C | none | mpi | 1 | 1 | 16.99 | 0.000 | |
| Perennial plant biomass | g m-2 | log+1 | micv | 1.1 | 1.2 | 9.27 | 0.002 | |
| Depth | m | log | mpi | 1 | 1 | 8.84 | 0.004 | |
| Areal coverage of hard substrate | % | none | mpi | 2.6 | 2.9 | 5.41 | 0.002 | |
| Chlorophyll | mg m-3 | none | mpd | 1 | 1 | 4.44 | 0.039 | |
| Salinity | psu | none | mpi | 2.2 | 2.6 | 3.80 | 0.019 | |
| Oxygen | mmol m-3 | none | mpi | 1 | 1 | 1.63 | 0.207 | |
| 2 | Dependent variable: | |||||||
| Macoma balthica biomass | g m-2 | square root | ||||||
| Independent variables: | ||||||||
| Depth | m | none | cv | 2.7 | 3.1 | 10.88 | 0.000 | |
| Current speed | ms-1 | none | mpd | 2 | 2.4 | 7.87 | 0.000 | |
| Salinity | psu | none | mpi | 1 | 1.0 | 4.85 | 0.029 | |
| NO3 | mmol m-3 | none | cv | 2.8 | 3.0 | 4.80 | 0.003 | |
| Temperature | °C | none | mpi | 1 | 1.0 | 3.59 | 0.060 | |
| Areal coverage of hard substrate | % | none | cv | 2 | 2.1 | 3.37 | 0.036 | |
| PO4 | mmol m-3 | none | mpi | 2.5 | 3.0 | 2.83 | 0.041 |
SCAM model descriptive statistics.
Smoothed trends used in models: monotone increasing (mpi), monotone decreasing (mpd), concave (cv) and monotone increasing concave (micv).
Values marked with bold indicate statistically significant p-values (<0.05).
Shape Constrained Additive Models (SCAMs) (Pya and Wood, 2015) were used to investigate the relationship between prey species (Mytilus trossulus or Macoma balthica) and key environmental variables before the round goby invasion for years prior to round goby invasion. These models were then run on the complete data to predict the biomass of the prey species. The residuals of these predictive models served as the deviation of the realized biomass and the biomass predicted after removal of environmental effects. Negative residuals indicate greater prey biomass than observed in field sampling. A series of negative residuals associated with an elevated density of round goby suggests increased predation of M. trossulus or M. balthica by the non-indigenous round goby. Prey species biomass values were square root transformed prior to modelling to reduce data skewedness and the effect of extreme values in the models. To increase normality distribution in M. trossulus dataset, depth and perennial plant biomass was log-transformed.
SCAMs are a variant of General Additive Models that allow for the general shape of the relationship between explanatory and predictive variables to be pre-selected. We chose the relationships based on visual examination of the data and theoretical expectation. M. trossulus biomass is anticipated to increase with temperature, salinity, minimum oxygen concentrations, depth, and areal coverage of hard substrate (Westerbom et al., 2002; Jakubowska and Normant, 2015). Biomass is likely to increase with the biomass of perennial plants up to a certain threshold (Kotta et al., 2015). The dataset shows that some areas in the study area exhibit overly high chlorophyll a values, so a declining relationship is expected (Orav-Kotta et al., 2010). M. balthica biomass is anticipated to be greater at moderate depths, as feeding rates are reduced in both shallow areas (too strong wave activity) and deep areas (anoxic conditions). Although a general biomass decline is expected with increased coverage of hard substrate (soft-bottom species), M. balthica is expected to accommodate both detritus feeding and filter feeding in a mixed sea bottom conditions (Olafsson, 1989), thereby suggesting a concave relationship with areal coverage of hard substrate. Low bottom current velocity is expected to improve bivalve feeding rates and thus supports biomass growth (Sobral and Widdows, 2000). M. balthica growth rate is expected to increase with salinity and temperature (Kube et al., 1996; Drent, 2002; Genelt-Yanovskiy et al., 2018). Nutrients are generally thought to enhance M. balthica growth (Seitz, 2011), with increased dissolved phosphorus concentration increasing M. balthica food availability (Beukema et al., 1977). However dissolved nitrogen is expected to promote M. balthica growth only up to a threshold, with excessive amounts increasing potential filamentous algae blooms causing increased mortality, (Tallqvist, 2001), thus a concave relationship is expected.
Spearman rank correlation test with bootstrapping (n=1000) was done between the residuals and the round goby biomass for each station. To investigate potential lags in prey biomass response to the invasion of round goby, up to 4 years of yearly lags were investigated in each station. Median and Median absolute deviation (MAD) was calculated based on the bootstrapped Spearman rho values. For each station a lag or no lag with the highest median Spearman correlation rho was chosen.
Modelling was done in the statistical software R 3.0.3 (R Core Team, 2015): package scam (Pya and Wood, 2015) and mgcv (Wood, 2011) for SCAM, and the packages boot (Davison and Hinkley, 1997; Canty and Ripley, 2021) and rcompanion (Mangiafico, 2016) for correlation and bootstrapping.
Results
Since the round goby invasion, the overall biomass of dominant bivalves has declined substantially; the average reduction within study area from 57.4 to 35.5 for M. trossulus and from 42.1 to 32.5 for M. balthica g dry weight m-2 (Kruskal Wallis rank test: for M. trossulus chi-sq=1.9, p=0.16, df=1; for M. balthica chi-sq=5.5, p=0.02, df=1). Average biomass decreased in several sites by > 80%, i.e., in M5 and Kõiguste from 56.6 to 8.8 and 35.5 to 6.3 g dry weight m-2, respectively. Substantial decreases in before and after period average were observed in stations 12.5, 57A, PE with drops 158.8 to 62.8, 17.5 to 9.2, and 56.1 to 17.6 g dry weight m-2, respectively.
Environmental variables accounted for most of the variance in M. trossulus biomass (Model 1: 61%, R-sq.(adj)=0.55; n=79) and 36% for the M. balthica biomass (Model 2: R-sq.(adj)=0.3; n=158) (Table 1). Greater M. trossulus biomass is predicted in areas over 2m depth and sufficient hard substrate with decreasing chlorophyll maximums, increased average temperature, moderate perennial plant biomass and higher salinity maximums (Figure 2). M. balthica biomass is predicted to be greater in areas within depths 10−30m, less hard substrate, slower bottom current speed, and increased average salinity (Figure 2). Optimal amount of nitrogen and increased amounts of phosphorus contribute to greater M. balthica biomass (Figure 2).
Figure 2
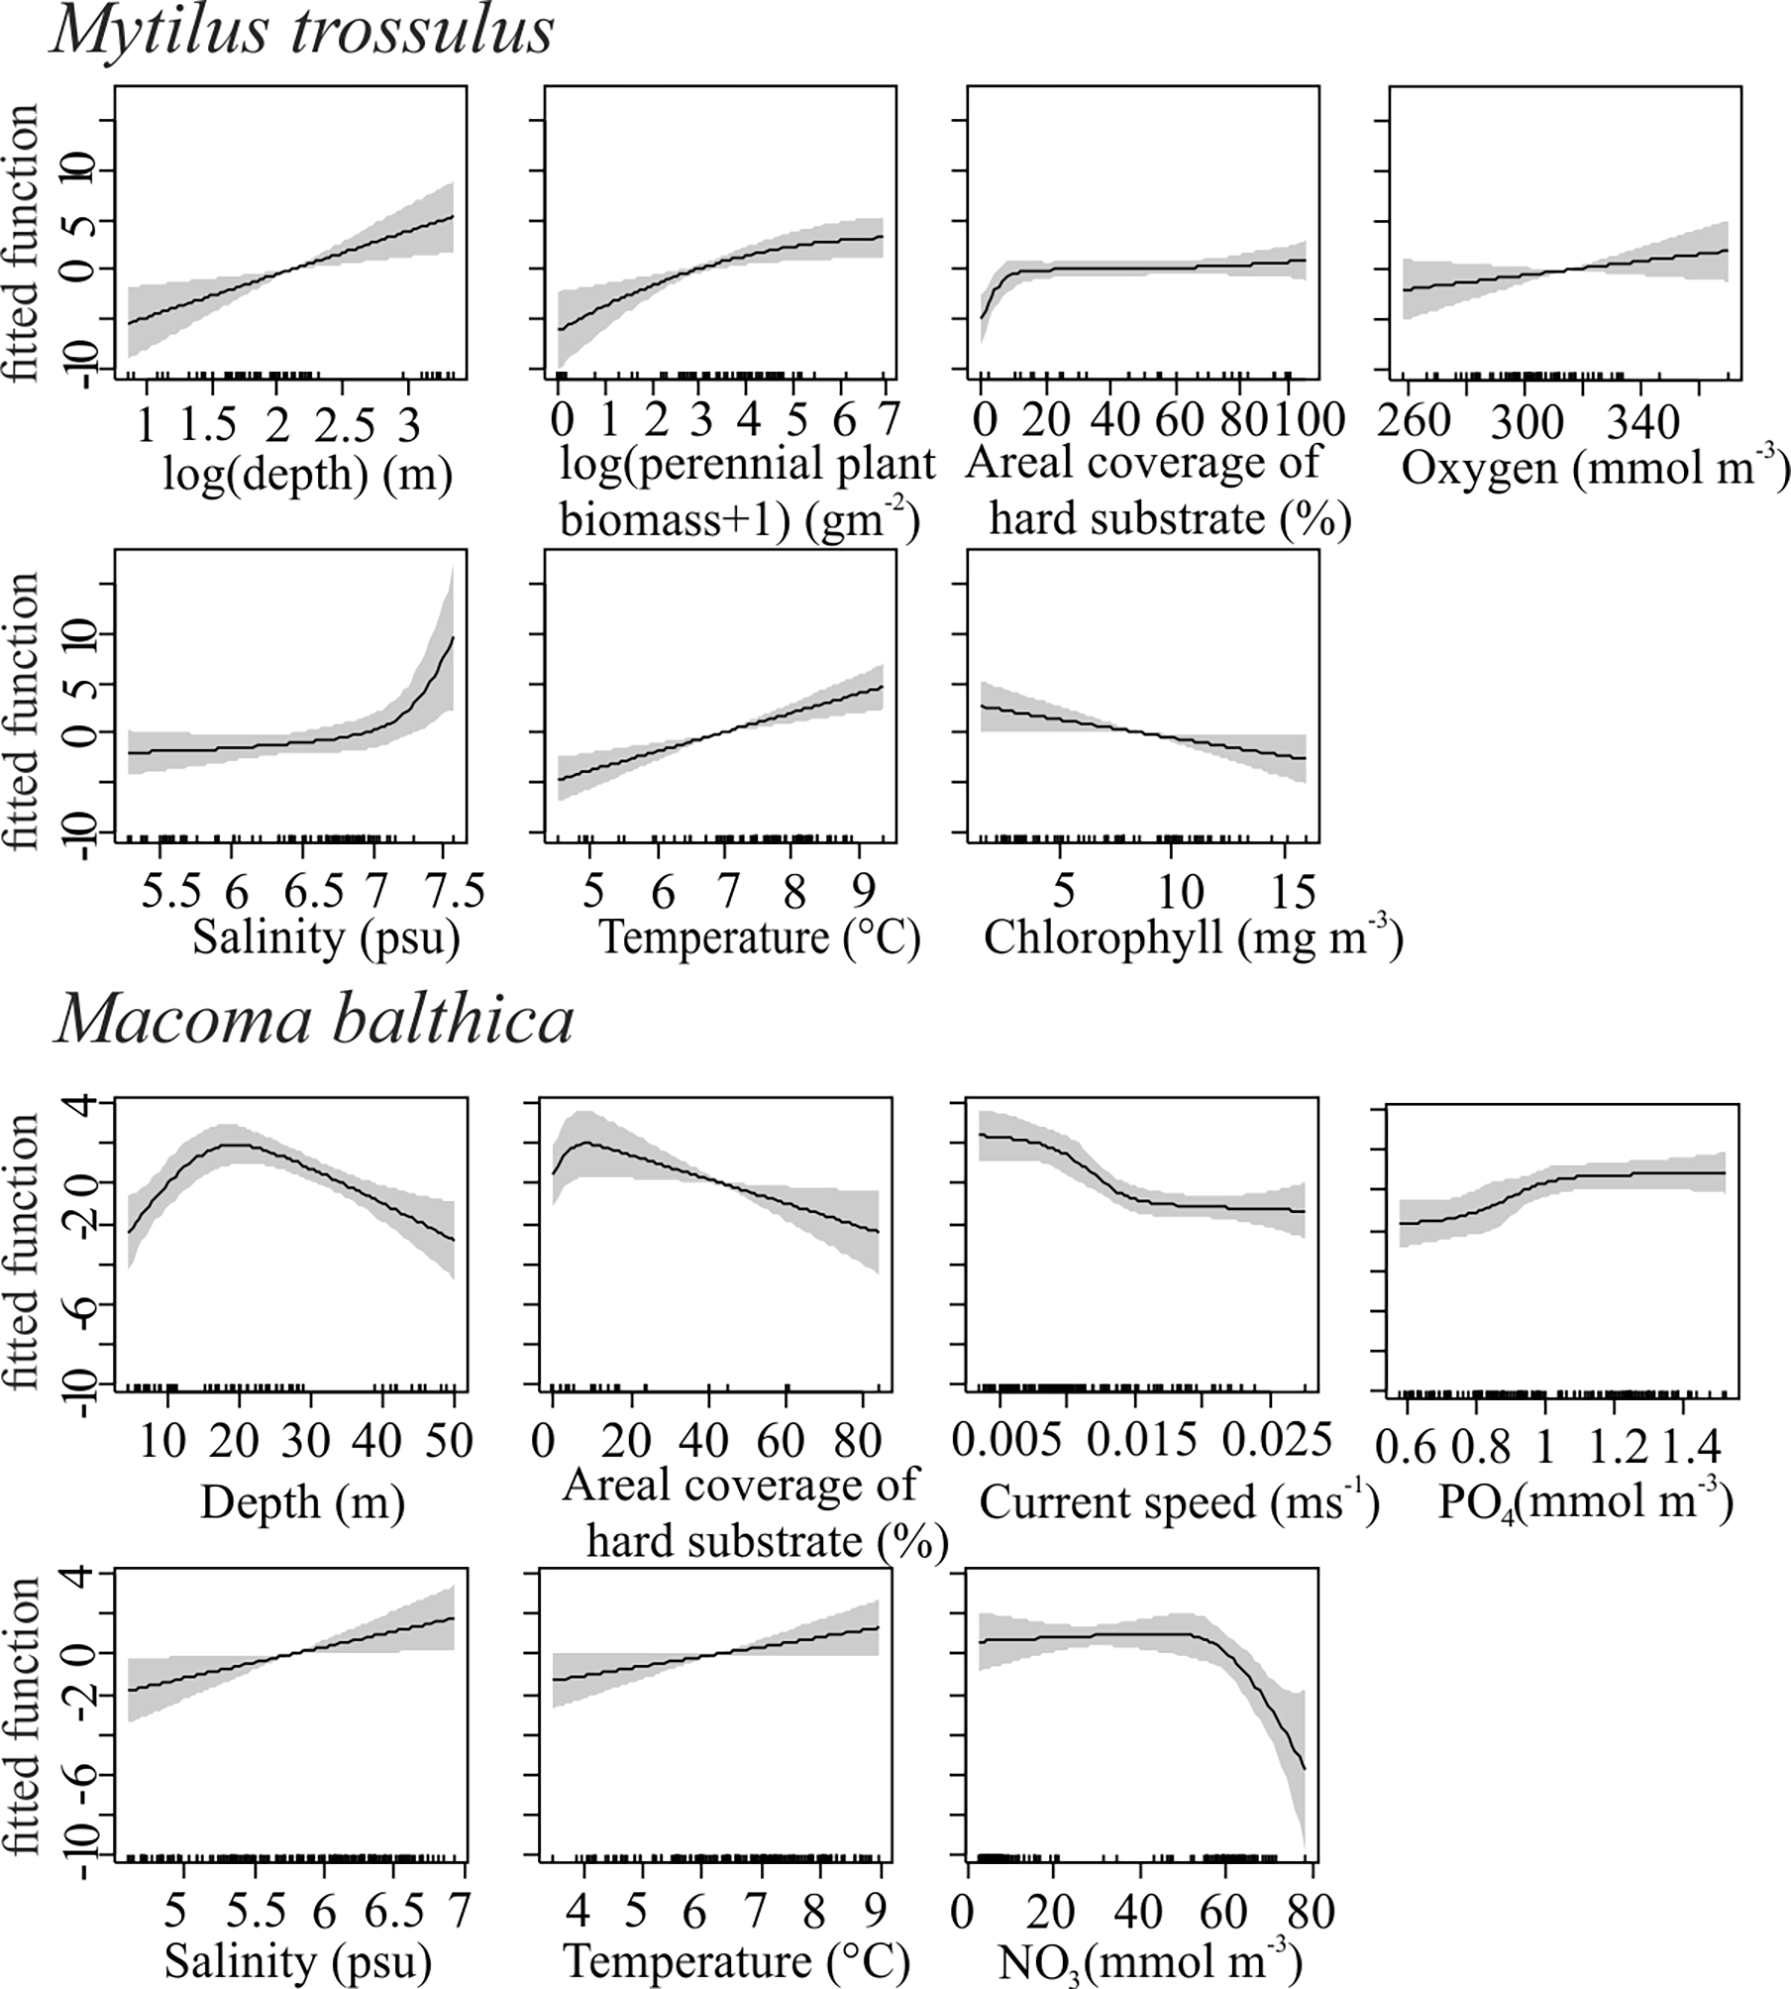
SCAM model variables.
Most study subareas exhibited strong negative correlations between model residuals and round goby biomass (Table 2). The central and western areas of the Gulf of Finland exhibited significant correlation in most stations (Figure 3). The eastern areas of the Gulf of Finland, where round goby had not yet attained as great biomass exhibited weaker effects (Figure 3). Only two stations in the Gulf of Riga (station 125) and Väinameri (Pasilaid) reveal a significant effect of round goby (Figure 4). An effect of round goby was absent in the open sea area of the Baltic Proper probably due to the shortness of invasion. After a five-year invasion on the Baltic proper, average biomass of M. trossulus had decreased less than in other sites, from 164.4 to 155.6 g dry weight m-2, respectively, but the maximum observed annual values had decreased substantially, from 405.1 to 230.7 g dry weight m-2.
Table 2
| No | Station | Basin | Basin subarea | Depth | Prey species | n | Invasion start | Impact lag | Rho | p |
|---|---|---|---|---|---|---|---|---|---|---|
| 1 | Aegna | Gulf of Finland | Central Gulf of Finland | 4.9 ± 0.2 | M. trossulus | 16 | 2007 | 2 | -0.77 ± 0.16 | 0.007 |
| 2 | M5 | Gulf of Finland | Central Gulf of Finland | 17.6 ± 0.4 | M. balthica | 21 | 2007 | 1 | -0.75 ± 0.13 | 0.005 |
| 3 | Muuga | Gulf of Finland | Central Gulf of Finland | 4.8 ± 0.1 | M. trossulus | 14 | 2007 | 3 | -0.53 ± 0.26 | 0.114 |
| 4 | 12.5 | Gulf of Finland | Central Gulf of Finland | 18.6 ± 0.3 | M. balthica | 17 | 2007 | 3 | -0.81 ± 0.19 | 0.017 |
| 5 | 57A | Gulf of Finland | Central Gulf of Finland | 7.1 ± 0.3 | M. balthica | 24 | 2010 | 0 | -0.78 ± 0.16 | 0.008 |
| 6 | N8 | Gulf of Finland | Eastern Gulf of Finland | 16.0 ± 0.6 | M. balthica | 10 | 2016 | 0 | 0.67 ± 0.49 | 0.350 |
| 7 | Käsmu | Gulf of Finland | Eastern Gulf of Finland | 2.9 ± 0.1 | M. trossulus | 5 | 2012 | NA | NA | NA |
| 8 | Eru | Gulf of Finland | Eastern Gulf of Finland | 8.4 ± 0.2 | M. trossulus | 16 | 2012 | 0 | -0.46 ± 0.25 | 0.267 |
| 9 | 18A | Gulf of Finland | Eastern Gulf of Finland | 44.4 ± 0.6 | M. balthica | 23 | 2012 | 1 | -0.41 ± 0.45 | 0.498 |
| 10 | 23A | Gulf of Finland | Western Gulf of Finland | 24.5 ± 0.4 | M. balthica | 24 | 2015 | 0 | -0.54 ± 0.43 | 0.321 |
| 11 | 23A | Gulf of Finland | Western Gulf of Finland | 24.5 ± 0.4 | M. trossulus | 24 | 2015 | 0 | -0.41 ± 0.61 | 0.425 |
| 12 | PE | Gulf of Finland | Western Gulf of Finland | 21.0 ± 0.3 | M. balthica | 24 | 2013 | 1 | -0.85 ± 0.17 | 0.034 |
| 13 | PW | Gulf of Finland | Western Gulf of Finland | 21.7 ± 0.4 | M. balthica | 24 | 2013 | 3 | -0.60 ± 0.41 | 0.350 |
| 14 | 125 | Gulf of Riga | Gulf of Riga | 27.2 ± 0.2 | M. balthica | 24 | 2012 | 3 | -0.88 ± 0.17 | 0.033 |
| 15 | Kõiguste | Gulf of Riga | Gulf of Riga | 5.6 ± 0.1 | M. trossulus | 26 | 2013 | 0 | -0.40 ± 0.34 | 0.360 |
| 16 | K21 | Gulf of Riga | Gulf of Riga | 10.4 ± 0.1 | M. balthica | 24 | 2015 | 0 | 0.88 ± 0.17 | 0.033 |
| 17 | K4 | Gulf of Riga | Gulf of Riga | 5.5 ± 0.1 | M. balthica | 14 | 2015 | 0 | 0.73 ± 0.40 | 0.175 |
| 18 | Küdema | Baltic Proper | Küdema Bay | 7.8 ± 0.2 | M. trossulus | 24 | 2016 | 1 | NA | 0.333 |
| 19 | V15 | Väinameri | Väinameri | 7.1 ± 0.1 | M. balthica | 25 | 2016 | 1 | NA | 0.333 |
| 20 | Kesselaid | Väinameri | Väinameri | 4.2 ± 0.0 | M. trossulus | 4 | 2015 | NA | NA | NA |
| 21 | Pasilaid | Väinameri | Väinameri | 5.5 ± 0.2 | M. trossulus | 8 | 2016 | 0 | -1.00 ± 0.0 | 0.017 |
| 22 | Rannaküla | Väinameri | Väinameri | 3.6 ± 0.3 | M. trossulus | 6 | 2016 | NA | NA | NA |
| 23 | Saarnaki | Väinameri | Väinameri | 4.1 ± 0.3 | M. trossulus | 4 | 2016 | NA | NA | NA |
Overview of each station’s location, depth (m ± SE), number of years sampled (n), round goby invasion start (y), round goby impact lag (y), dominate prey species, residuals spearman correlation Rho (median ± MAD) and significance (p).
Values marked with bold indicate statistically significant p-values (<0.05). NA indicates data not available due to insufficient sampling in post-invasion years in station.
Figure 3
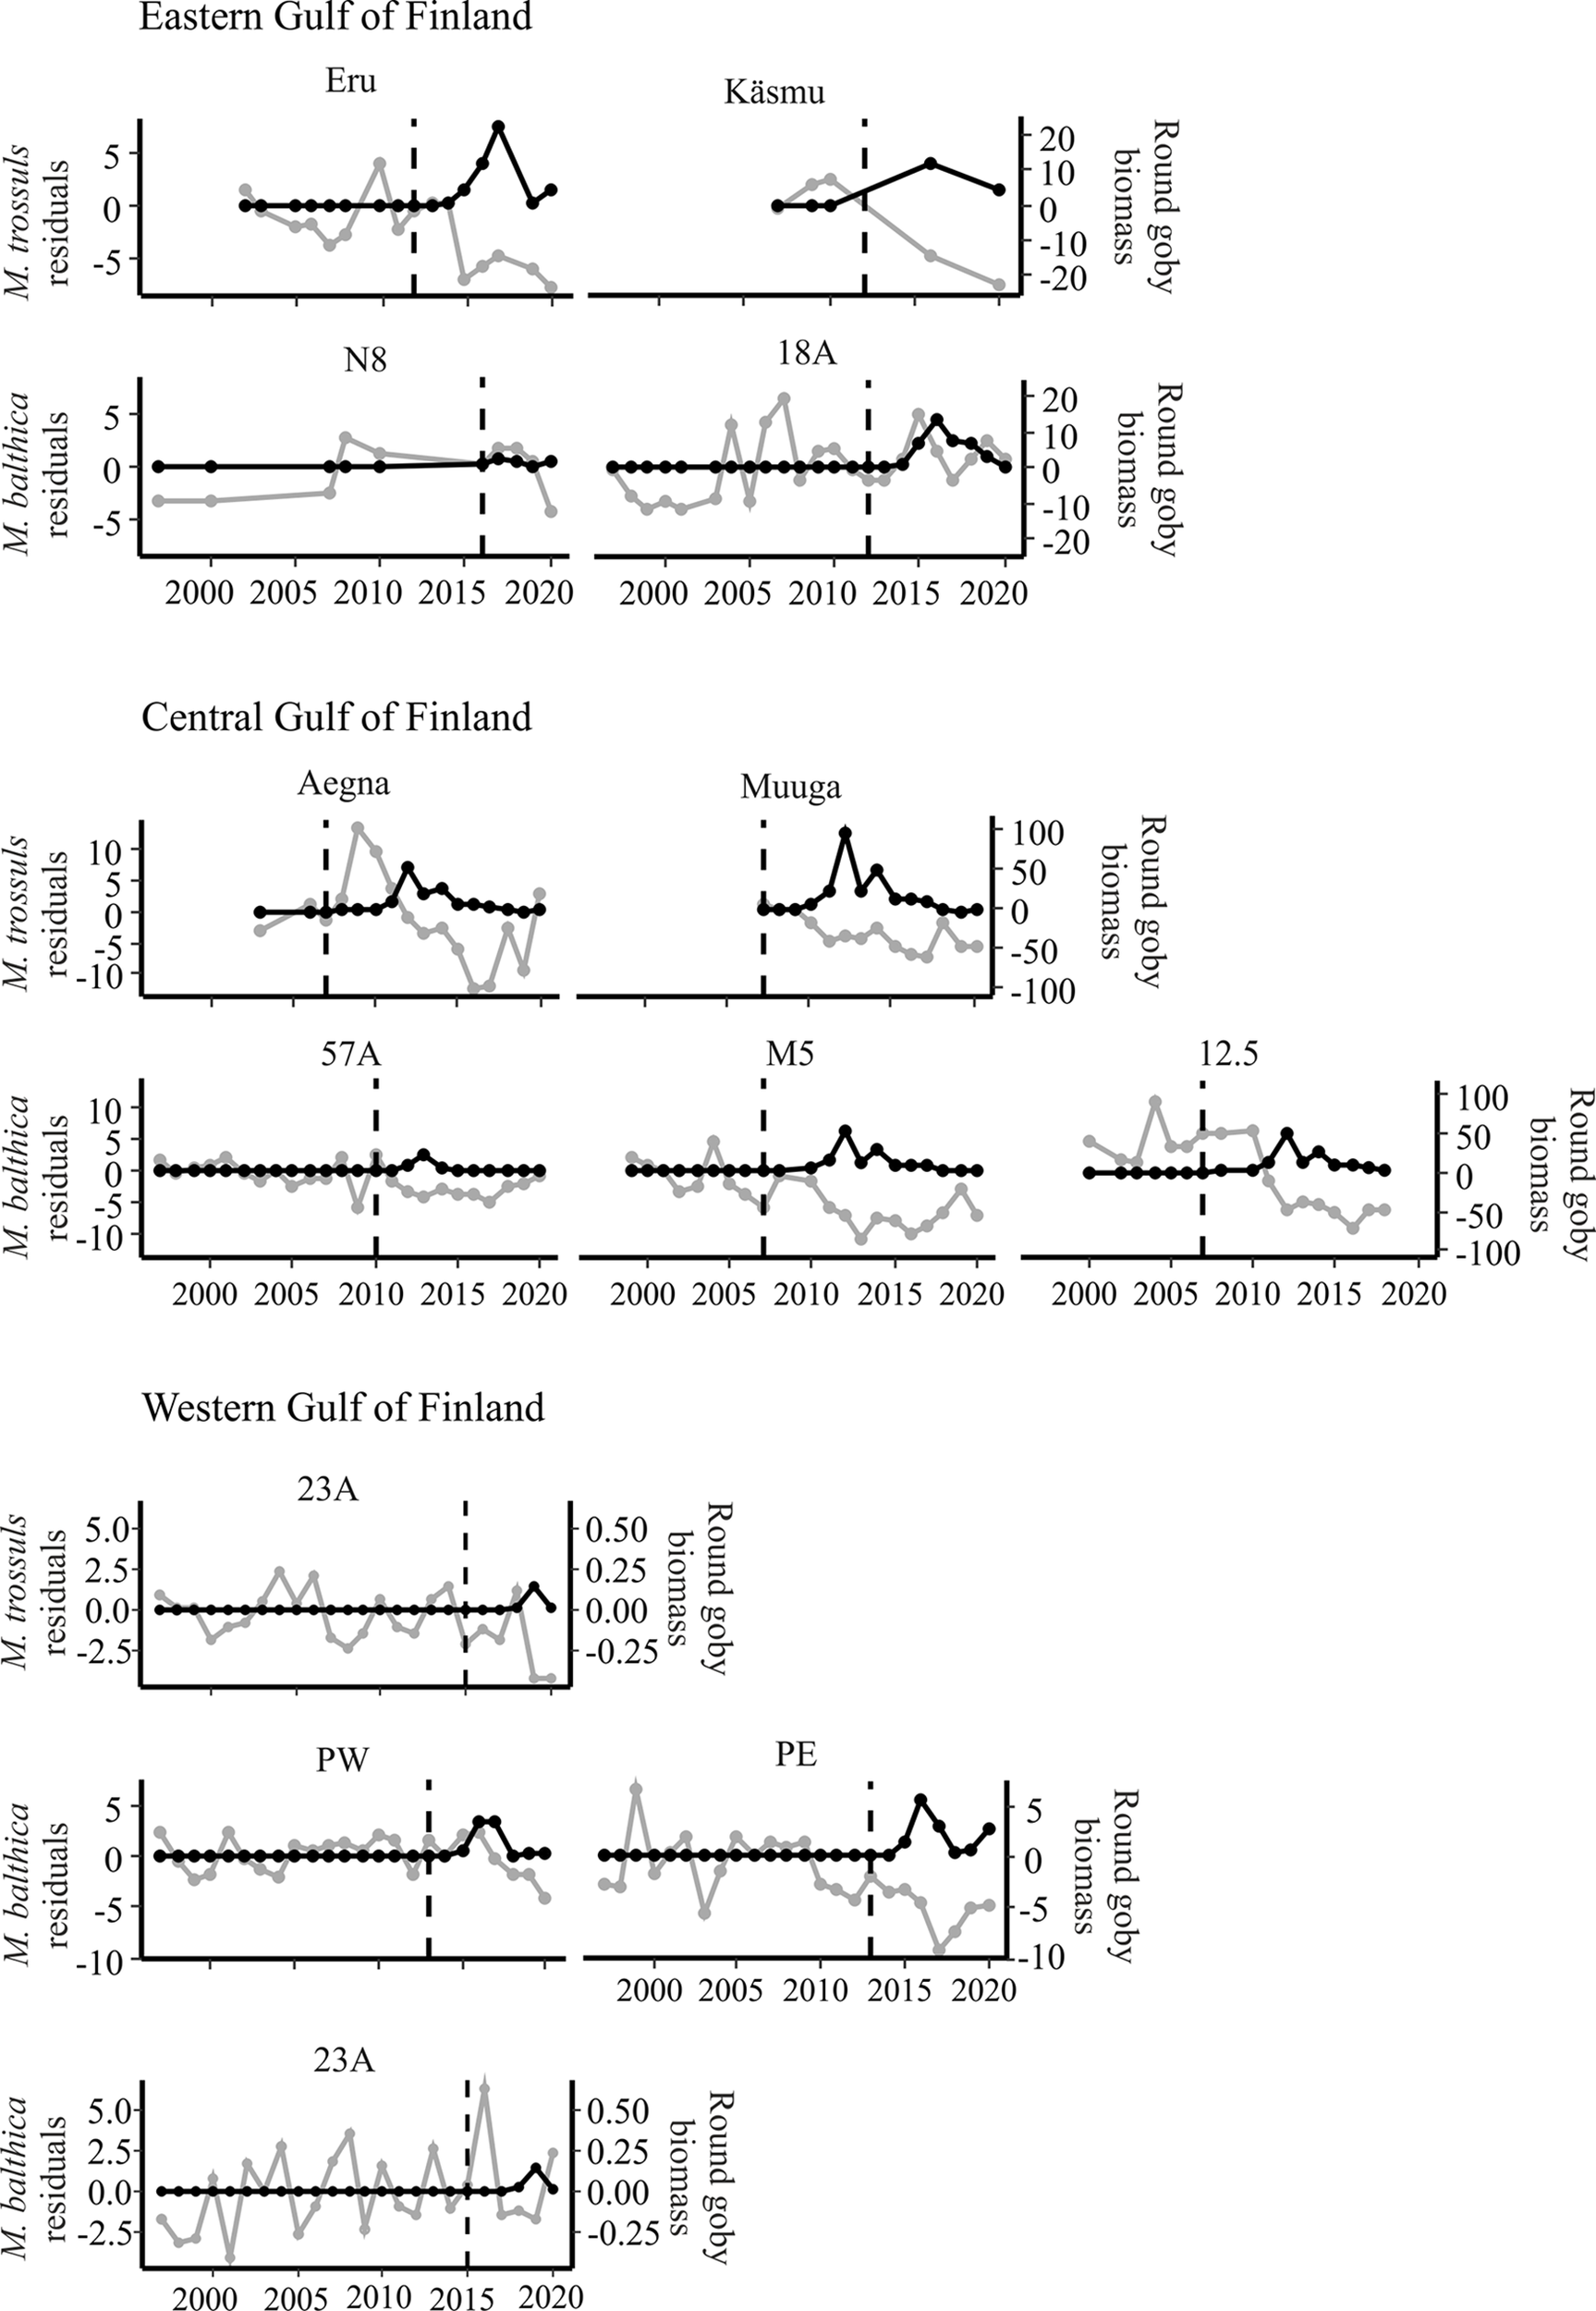
Annual residuals (grey) (g dry weight m-2) and round goby biomass (black) (annual kg km-2) at stations in the Gulf of Finland. Dashed vertical line indicates start of round goby invasion in each station.
Figure 4
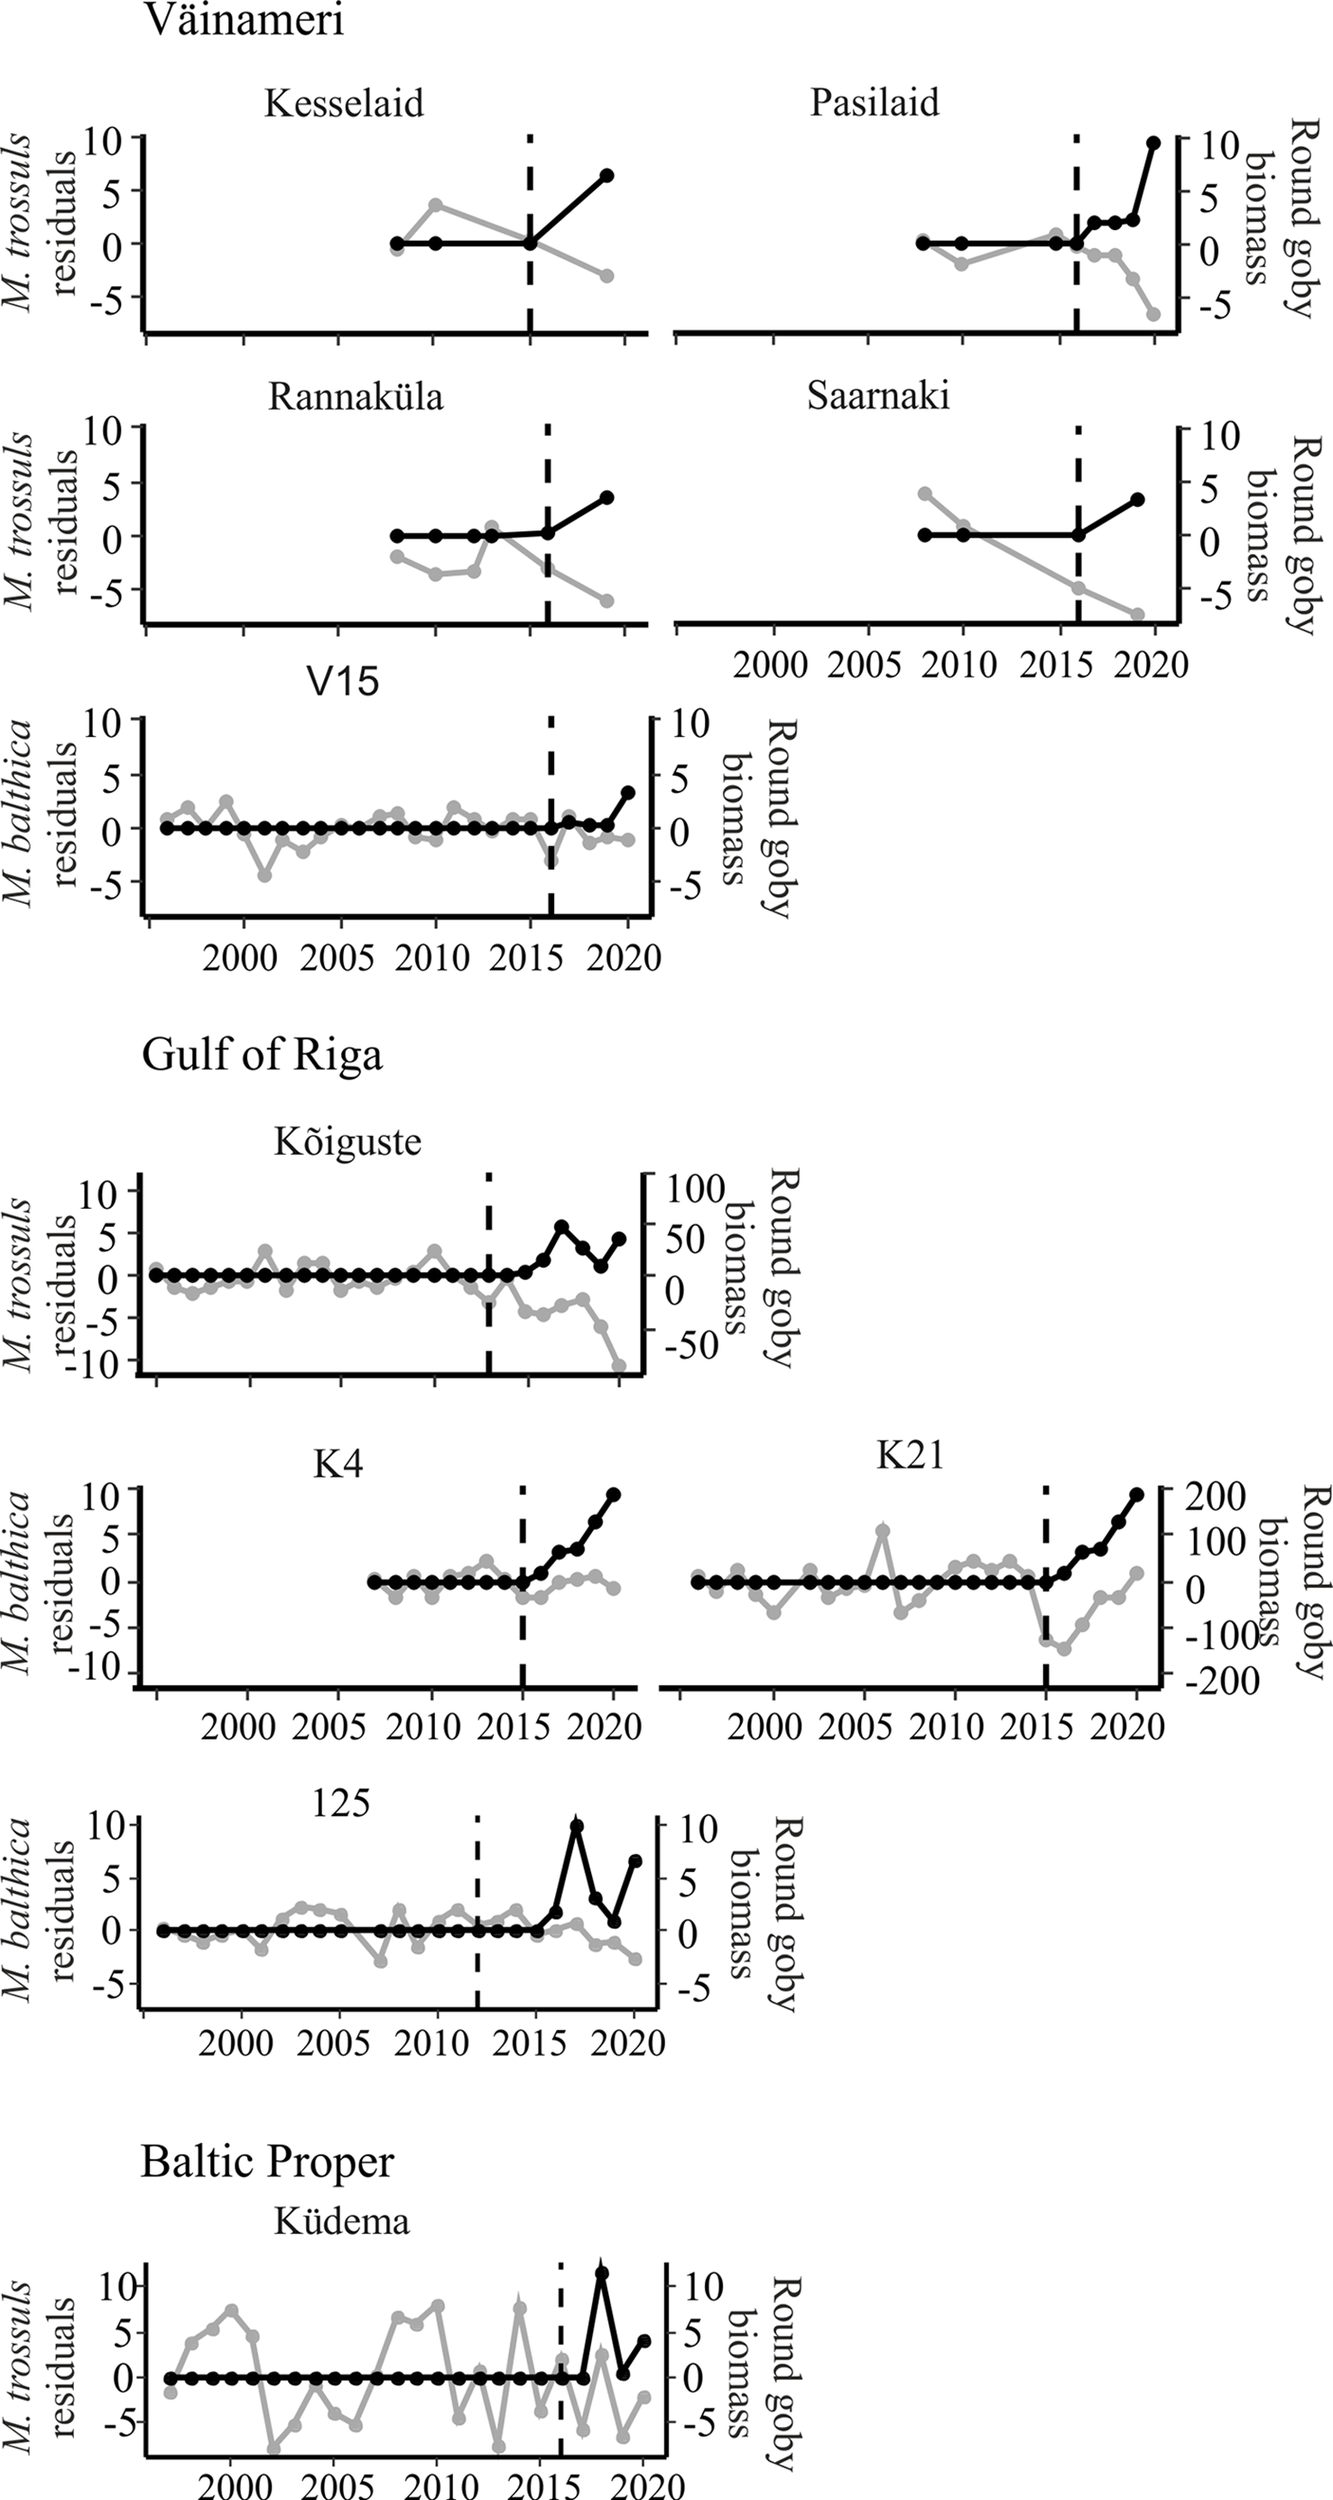
Annual residuals (grey) (g dry weight m-2) and round goby biomass (black) (annual kg km-2) at stations in Väinameri, Gulf of Riga and Baltic Proper. Dashed vertical line indicates start of round goby invasion in each station.
Many stations lack sufficient data to calculate correlations between residuals and the goby biomass. In some stations (Kesselaid, Rannaküla, Saarnaki and Käsmu) with longer sampling series (every 4 years), only visual round goby effects can be made (Figure 4). Although overly short invasion time is another reason for the inability to calculate correlation coefficients, visual effects of round goby effects are already apparent (N8, Küdema, 23A).
Some stations in the Gulf of Finland and Gulf of Riga (Aegna, Muuga, 57A, M5, Eru, PE, Kõiguste, K21) show signs of prey population recovery, which suggests possible non-lineal correlations (Figure 3). Even with small recovery of prey species biomass in Eru and Kõiguste, visual negative effects of round goby are still apparent (Figures 3, 4).
Most of the prey responses to the invasion of round goby exhibited no time lag or a one-year lag. However, several stations (stations 125, 12.5, PW, V15, Küdema) exhibited time lags of up to 3 years (Table 2).
Areas of higher productivity (i.e. higher chlorophyll a) were all located in the Gulf of Riga and Väinameri (Figure 1), which contained stations inhabited by both M. trossulus and M. balthica (Figure 5). Except for some outliers (stations 125 and Pasilaid) stations with lower chlorophyll exhibited stronger effects of round goby on M. trossulus and M. balthica (Figure 5).
Figure 5
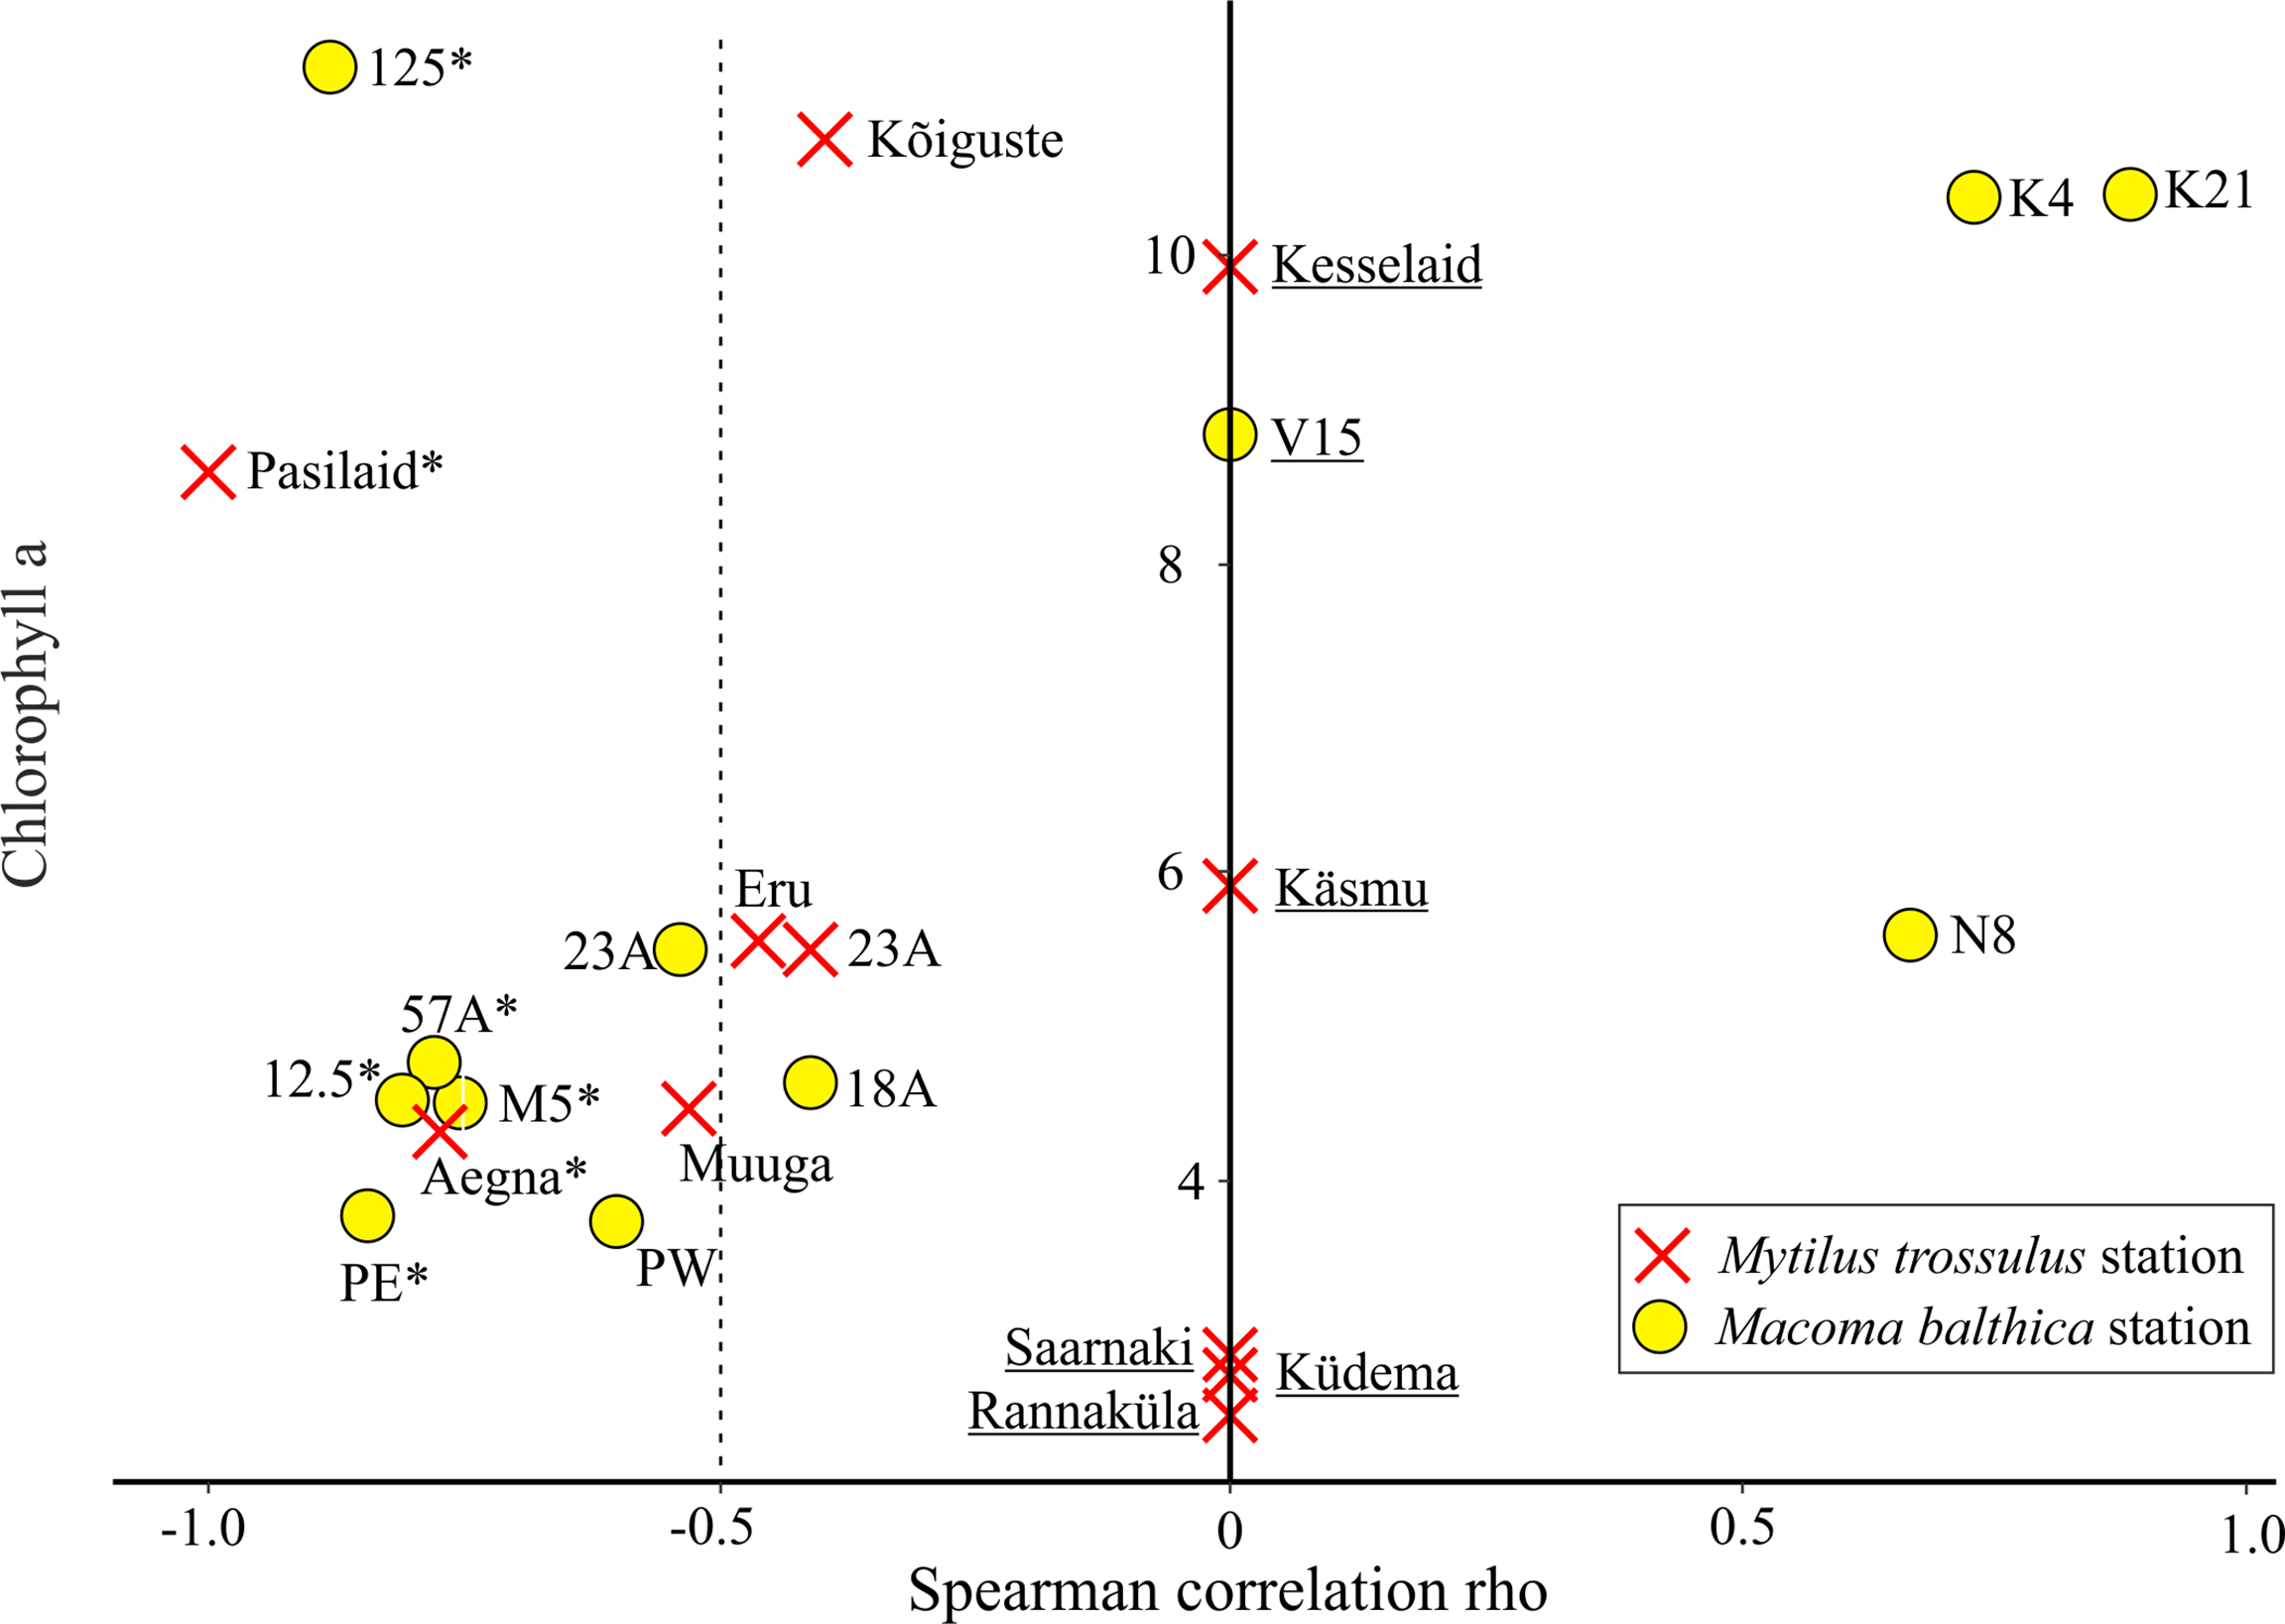
Relationship between chlorophyll a concentration (average of 2000-2019) and the strength of correlations between prey model residuals and the biomass of goby (Rho value). Due to small sample size Rho values could not be calculated for some stations (underlined) and these stations were assigned Rho = 0. Dashed vertical line indicates spearman rho value significance threshold and stations on the left are under strong negative pressure from round goby. Stations with statistically significant correlation (p < 0.05) is marked with *.
Discussion
Overall Round Goby Impact
The addition of a novel demersal predator provided us with a unique opportunity to study their role in the Baltic Sea ecosystem that previously lacked such predators. Top-down trophic cascades in various ecosystems have been illustrated mainly in literature through the removal of top predators from the ecosystems (Terborgh et al., 2001; Worm and Myers, 2003; Elmhagen and Rushton, 2007; Baum and Worm, 2009). However, these experiments were performed at spatial scales that are severely restricted compared to the spatial scales in which the predator-prey interactions operate. Our study demonstrated a substantial large-scale and long-term change in the food web, with previously primarily bottom-up regulated communities currently facing strong top-down control effects. These effects have the potential to spread to upper (e.g. Liversage et al., 2017) and lower trophic levels (e.g. Kotta et al., 2018) through trophic cascades.
A true assessment of the effects of long-lasting invasion requires long-term research (Bonanno and Orlando-Bonaca, 2019; Catford et al., 2019; Strayer et al., 2019; Crystal-Ornelas and Lockwood, 2020). Previously invasive round goby effects have only been shown in experimental studies (Pagnucco et al., 2016; Henseler et al., 2021) or short-term field observations (Kornis et al., 2013; Skabeikis et al., 2019; Armoškaitė et al., 2021; van Deurs et al., 2021). Predicting long-term impact of invasion from field data is challenging as the environment can change during the invasion, which in turn can affect the results (Denley et al., 2019; Dickey et al., 2021). This study demonstrates long-term trends in benthic communities and by excluding possible effects due to the changing environment, provides more evidence that invasive species alter the functioning of coastal ecosystems over time. Invasion effects are known to be stronger when invaders occupy functions previously not fulfilled by native species (Case et al., 2016b). This makes especially fragile ecosystems that are characterized by a few species in important niches, allowing an invasive predator to have long lasting effects on benthic communities and thus on the whole ecosystem functioning.
High Productivity Mitigates Round Goby Effects
Invasion ecology predicts that some communities are more resistant to invasion effects (González-Moreno et al., 2013; Beaury et al., 2020). Here a variety of habitats were investigated and based on the nature of the less impacted areas, we speculate areas of higher productivity are more resilient to round goby invasion. Both prey species, M. balthica and M. trossulus, rely directly or indirectly on phytoplankton primary production with greater microalgal biomass resulting in significantly greater biomass yield of the species (Beukema et al., 1977; Kotta et al., 2015). Higher growth rates enable bivalve species to avoid predation by round goby and/or recover faster. Moreover, high productivity areas are characterized by high biomasses of alternative food sources (e.g. amphipods, isopods, snails, other bivalves) further reducing the predation of M. balthica and M. trossulus by round goby. Similarly stronger effects from top-down pressure in low-productivity systems have been described among herbivores (Burkepile and Hay, 2006). Although less significant effects were observed in high productivity areas, some stations given enough time already show clear and significant impacts of the invasion. Such patterns could globally cause underestimating invasion events effects, if low productivity communities are expected to have similar reactions to invasive species and failing to look at larger patterns in community functioning.
Invasion Duration and Lags
Newly-invaded habitat often experience time lags before the effects of invasion become apparent (Thorlacius and Brodin, 2018). As such, round goby invasion in several areas has likely been too short to exhibit any effect, similar to other invaded areas (Kornis et al., 2013). In the five years (since 2016) round goby has been invading the Baltic Proper, large M. trossulus reefs have not yet been affected by round goby invasion, but lower maximum M. trossulus biomass values have already been recorded. Thus, given enough time round goby will likely significantly affect all communities it invades. Recent studies have shown that the round goby is a very mobile consumer, able to move several kilometres daily with even longer seasonal migrations (Christoffersen et al., 2019; Behrens et al., 2021). If an area contains many suitable habitats (such as in stations Aegna, Muuga, 12.5, PW), these movement patterns could prolong time lags of the effect of round goby on individual communities.
Benthic Community Recovery
Information regarding native community recovery after invasion is limited to a few examples (Case et al., 2016a). Even after total removal of an invader, recovery to previous biomass levels has been unsuccessful (Maclean et al., 2018). With the decline of round goby abundance after invasion expansion phase, prey population recovery was observed in several stations. In areas with sufficient population of several prey species, the availability of an alternative food resource may provide a buffer allowing prey populations to recover. The observed recovery further suggests that round goby effects are not linear and given enough time prey-predator population dynamics could be observed. Apparent recovery of prey population to pre-invasion levels was observed in only a few stations (Aegna and Muuga). If large scale population biomass recovers to a substantially lower population size than before, the ability of their ecosystems to act as a natural filter to mitigate eutrophication effects are suspect. Such areas might benefit from additional eutrophication mitigation action.
Method Benefits
Like many other ecosystems around the globe, the Baltic Sea is heavily impacted, and its communities experience multiple pressures simultaneously. Moreover, the Baltic Sea is very dynamic and benthic species inhabiting its coastal ecosystems are adapted to cope with harsh environments and are tolerant not only to variable salinity conditions, but also to other environmental variables, such as hypoxia and exposure. In such systems, physically driven fluxes often override the effects of biological interactions (e.g. Herkül et al., 2006). Thus, accurate assessment of biological interacts, such as species invasion, demands proper evaluation of confounding environmental factors.
This study provides valuable methods on how to model long term general-purpose data, to filter out environmental effects and subsequently detect possible effects of invasive species, as described in Kotta et al., 2018, where predatory crab-induced regime shift was apparent only when observed in changing environmental conditions. Similarly, our results showed that the round goby is likely the cause of the decline in benthic bivalve biomass, but this decline can be properly quantified only if other forcing factors are considered. Our “filter” model did not consider other benthic predators and therefore some of the observed decline can be attributed to interactions not covered in the current study. However, this is not likely as predation rates of the native bivalve populations by native predators are very low and all earlier evidence has suggested that the study area is primarily a bottom-up regulated system with minor small-scale top-down effects (Kotta et al., 2018). In addition, the round goby is the only fish to exploit both shallow coastal habitats with M. trossulus and deeper habitats with M. balthica (Behrens et al., 2021); thus, a simultaneous shift in the bivalve biomass in these very different habitats again point to the round goby as a causal factor. Moreover, all documented significant shifts in the biomass of benthic community have been related to shifts in nutrient loading and hence changes in the productivity of ecosystem (Bonsdorff et al., 1997; Kotta et al., 2007). Nevertheless, this aspect was considered in the modelling frame of the current study.
When dealing with marine ecosystems there are several unknowns related to sampling intensity both in space and time. Improved monitoring intensity and quality will allow researchers to apply the expected predation pressures of the round goby with a broad range of habitat characteristics beyond a single habitat and region. Moreover, the method can be used for other invasive species and regions to test hypotheses on the determinants of success of introduced species, the magnitude and dimensions of their impact, and the mechanisms sustaining successful invasions (Chabrerie et al., 2019).
Conclusions
To conclude, the addition of an invasive benthic predator is causing significant changes in the ecosystem with the potential for the changes to proliferate to other trophic levels by trophic cascades. We found that the round goby causes significant declines in benthic bivalve biomass in the north-eastern Baltic Sea, which is not associated with overall changes to the physical and biochemical environment. The severity of the impact is likely related to overall productivity in the area; recovery of the benthic community to pre-invasion biomass levels is infrequent. However, the ability to assess impacts of nonindigenous species is contingent on suitable monitoring of the area. The Baltic Sea provides an excellent case study to show a way forward to analyse correlative linkage of invasion and species patterns.
Funding
This study was funded under the auspices of the MAREA project, which has been co-funded by the Interreg Central Baltic programme with funds from the European Regional Development Fund. We also acknowledge financial support from the EEA grant “Climate Change Mitigation and Adaptation” call I “Ecosystem resilience increased” project “Impacts of invasive alien species and climate change on marine ecosystems in Estonia”.
Publisher’s Note
All claims expressed in this article are solely those of the authors and do not necessarily represent those of their affiliated organizations, or those of the publisher, the editors and the reviewers. Any product that may be evaluated in this article, or claim that may be made by its manufacturer, is not guaranteed or endorsed by the publisher.
Statements
Data availability statement
The raw data supporting the conclusions of this article will be made available by the authors, without undue reservation.
Author contributions
KN and JK contributed to the original idea, data collection, analyses, and manuscript writing. R-SK contributed to the analyses and manuscript writing. KH contributed to the data collection, analyses, and manuscript writing. RE and MV contributed to data collection. All authors contributed to the article and approved the submitted version.
Acknowledgments
The authors acknowledge the contributions of our Estonian Marine Institute colleagues, who were involved in the collection of coastal monitoring data from 1995−2020. Special thanks to all coastal fishermen for their catch data reporting.
Conflict of interest
The authors declare that the research was conducted in the absence of any commercial or financial relationships that could be construed as a potential conflict of interest.
References
1
Andersson G. Breggren H. Cronberg G. Gelin C. (1978). Effects of Planktivorous and Benthivorous Fish on Organisms and Water Chemistry in Eutrophic Lakes. Hydrobiologia59, 9–15. doi: 10.1007/BF00017602
2
Armoškaitė A. Aigars J. Andersone I. Hansen H. S. Schrøder L. Strāķe S. (2021). Assessing Change in Habitat Composition, Ecosystem Functioning and Service Supply in Latvian Protected Stony Reefs. J. Environ. Manage.298, 113537. doi: 10.1016/j.jenvman.2021.113537
3
Baum J. K. Worm B. (2009). Cascading Top-Down Effects of Changing Oceanic Predator Abundances. J. Anim. Ecol.78, 699–714. doi: 10.1111/j.1365-2656.2009.01531.x
4
Beaury E. M. Finn J. T. Corbin J. D. Barr V. Bradley B. A. (2020). Biotic Resistance to Invasion is Ubiquitous Across Ecosystems of the United States. Ecol. Lett.23, 476–482. doi: 10.1111/ele.13446
5
Behrens J. W. Ryberg M. P. Einberg H. Eschbaum R. Florin A.-B. Grygiel W. et al . (2021). Seasonal Depth Distribution and Thermal Experience of the non-Indigenous Round Goby Neogobius Melanostomus in the Baltic Sea: Implications to Key Trophic Relations. Biol. Invasions24, 527–541. doi: 10.1007/s10530-021-02662-w
6
Beukema J. J. Cadee G. C. Jansen J. J. M. (1977). “Variability of Growth Rate of Macoma Balthica (L.) in the Wadden Sea in Relation to Availabity of Food,” in Biology of Benthic Organisms, eds. KeeganB. F.CeidighP. O.BoadenP. J. S. (Oxford: Pergamon Press), 69–77. doi: 10.1016/B978-0-08-021378-1.50013-0
7
Bonanno G. Orlando-Bonaca M. (2019). Non-Indigenous Marine Species in the Mediterranean Sea—Myth and Reality. Environ. Sci. Policy96, 123–131. doi: 10.1016/j.envsci.2019.03.014
8
Bonsdorff E. Blomqvist E. M. Mattila J. Norkko A. (1997). Long-Term Changes and Coastal Eutrophication. Examples From the Åland Islands and the Archipelago Sea, Northern Baltic Sea. Ocenologica20, 319–329.
9
Burkepile D. E. Hay M. E. (2006). Herbivore vs. Nutrient Control of Marine Primary Producers: Context-Dependent Effects. Ecology87, 3128–3139. doi: 10.1890/0012-9658
10
Canty A. Ripley B. D. (2021). Boot: Bootstrap R (S-Plus) Functions. R package version 1. 3–28
11
Case E. J. Harrison S. Cornell H. V. (2016a). After an Invasion: Understanding Variation in Grassland Community Recovery Following Removal of a High-Impact Invader. Biol. Invasions18, 371–380. doi: 10.1007/s10530-015-1009-x
12
Case E. J. Harrison S. Cornell H. V. (2016b). Do High-Impact Invaders Have the Strongest Negative Effects on Abundant and Functionally Similar Resident Species? Funct. Ecol.30, 1447–1453. doi: 10.1111/1365-2435.12615
13
Catford J. A. Smith A. L. Wragg P. D. Clark A. T. Kosmala M. Cavender-Bares J. et al . (2019). Traits Linked With Species Invasiveness and Community Invasibility Vary With Time, Stage and Indicator of Invasion in a Long-Term Grassland Experiment. Ecol. Lett.22, 593–604. doi: 10.1111/ele.13220
14
Chabrerie O. Massol F. Facon B. Thevenoux R. Hess M. Ulmer R. et al . (2019) Biological Invasion Theories: Merging Perspectives From Population, Community and Ecosystem Scales. Available at: http://www.preprints.org/manuscript/201910.0327/v1 (Accessed March 18, 2022).
15
Chapin F. S. III Matson P. A. Mooney H. A. (2002). “Principles of Terrestrial Ecosystem Ecology,” (1st ed. New York, NY: Springer).
16
Christoffersen M. Svendsen J. C. Behrens J. W. Jepsen N. van Deurs M. (2019). Using Acoustic Telemetry and Snorkel Surveys to Sstudy Diel Activity and Seasonal Migration of Round Goby (Neogobius Melanostomus) in an Estuary of the Western Baltic Sea. Fish. Manage. Ecol.26, 172–182. doi: 10.1111/fme.12336
17
Colautti R. I. Ricciardi A. Grigorovich I. A. MacIsaac H. J. (2004). Is Invasion Success Explained by the Enemy Release Hypothesis? Ecol. Lett.7, 721–733. doi: 10.1111/j.1461-0248.2004.00616.x
18
Crystal-Ornelas R. Lockwood J. L. (2020). The ‘Known Unknowns’ of Invasive Species Impact Measurement. Biol. Invasions22, 1513–1525. doi: 10.1007/s10530-020-02200-0
19
Daniel W. W. (1990). “Kruskal–Wallis One-Way Analysis of Variance by Ranks”. Appl. Nonparametric Stat., (2nd ed.) Boston: PWS-Kent. pp. 226–234.
20
Davison A. C. Hinkley D. V. (1997) Bootstrap Methods and Their Applications. Available at: http://statwww.epfl.ch/davison/BMA/.
21
de Aguiar F. S. de Sousa Gomes-Gonçalves R. Araújo F. G. (2020). Fish and Benthic Invertebrate Relationship and Their Association to Environmental Variables in Tropical Sandy Beaches. Environ. Biol. Fishes103, 1309–1321. doi: 10.1007/s10641-020-01024-0
22
Denley D. Metaxas A. Fennel K. (2019). Community Composition Influences the Population Growth and Ecological Impact of Invasive Species in Response to Climate Change. Oecologia189, 537–548. doi: 10.1007/s00442-018-04334-4
23
Dickey J. W. E. Cuthbert R. N. Steffen G. T. Dick J. T. A. Briski E. (2021). Sea Freshening may Drive the Ecological Impacts of Emerging and Existing Invasive non-Native Species. Divers. Distrib.27, 144–156. doi: 10.1111/ddi.13178
24
Drent J. (2002). Temperature Responses in Larvae of Macoma Balthica From a Northerly and Southerly Population of the European Distribution Range. J. Exp. Mar. Biol. Ecol.275, 117–129. doi: 10.1016/S0022-0981(02)00141-7
25
Elmhagen B. Rushton S. P. (2007). Trophic Control of Mesopredators in Terrestrial Ecosystems: Top-Down or Bottom-Up? Ecol. Lett.10, 197–206. doi: 10.1111/j.1461-0248.2006.01010.x
26
Elton C. S. (1958). The Ecology of Invasions by Animals and Plants (1st ed. Boston, MA: Springer).
27
Field C. B. Behrenfeld M. J. Randerson J. T. Falkowski P. (1998). Primary Production of the Biosphere: Integrating Terrestrial and Oceanic Components. Science281, 237–240. doi: 10.1126/science.281.5374.237
28
Genelt-Yanovskiy E. A. Aristov D. A. Poloskin A. V. Nazarova S. A. (2018). Trends and Drivers of Macoma Balthica L. Dynamics in Kandalaksha Bay, the White Sea. J. Mar. Biol. Assoc. U K98, 13–24. doi: 10.1017/S0025315417001473
29
Gerke M. Cob Chaves D. Richter M. Mewes D. Schneider J. Hübner D. et al . (2018). Benthic Grazing in a Eutrophic River: Cascading Effects of Zoobenthivorous Fish Mask Direct Effects of Herbivorous Fish. PeerJ6, e4381. doi: 10.7717/peerj.4381
30
González-Moreno P. Pino J. Carreras D. Basnou C. Fernandez-Rebollar I. Vilà M. (2013). Quantifying the Landscape Influence on Plant Invasions in Mediterranean Coastal Habitats. Landsc. Ecol.28, 891–903. doi: 10.1007/s10980-013-9857-1
31
González-Moreno P. Pino J. Cózar A. García-de-Lomas J. Vilà M. (2017). The Effects of Landscape History and Time-Lags on Plant Invasion in Mediterranean Coastal Habitats. Biol. Invasions19, 549–561. doi: 10.1007/s10530-016-1314-z
32
Gräler B. Pebesma E. Heuvelink G. (2016). Spatio-Temporal Interpolation Using Gstat. R J.8, 204. doi: 10.32614/RJ-2016-014
33
Griffiths J. R. Kadin M. Nascimento F. J. A. Tamelander T. Törnroos A. Bonaglia S. et al . (2017). The Importance of Benthic-Pelagic Coupling for Marine Ecosystem Functioning in a Changing World. Glob. Change Biol.23, 2179–2196. doi: 10.1111/gcb.13642
34
Gurevitch J. Padilla D. (2004). Are Invasive Species a Major Cause of Extinctions? Trends Ecol. Evol.19, 470–474. doi: 10.1016/j.tree.2004.07.005
35
Hastings A. Byers J. E. Crooks J. A. Cuddington K. Jones C. G. Lambrinos J. G. et al . (2007). Ecosystem Engineering in Space and Time. Ecol. Lett.10, 153–164. doi: 10.1111/j.1461-0248.2006.00997.x
36
Heath M. R. Speirs D. C. Steele J. H. (2014). Understanding Patterns and Processes in Models of Trophic Cascades. Ecol. Lett.17, 101–114. doi: 10.1111/ele.12200
37
HELCOM (2013). HELCOM HUB – Technical Report on the HELCOM Underwater Biotope and Habitat Classification. Balt. Sea Environ. Proc., 1075–1084.
38
HELCOM (2015). Manual for Marine Monitoring in the COMBINE Programme of HELCOM. Available at: http://www.helcom.fi/action-areas/monitoring-and-assessment/manuals-and-guidelines/combine-manual (Accessed December 11, 2016).
39
Henseler C. Oesterwind D. Kotterba P. Nordström M. C. Snickars M. Törnroos A. et al . (2021). Impact of Round Goby on Native Invertebrate Communities - An Experimental Field Study. J. Exp. Mar. Biol. Ecol.541, 151571. doi: 10.1016/j.jembe.2021.151571
40
Herkül K. Kotta J. Kotta I. Orav-Kotta H. (2006). Effects of Physical Disturbance, Isolation and Key Macrozoobenthic Species on Community Development, Recolonisation and Sedimentation Processes. Oceanologia48, 267–282.
41
Hill W. R. Ryon M. G. Schilling E. M. (1995). Light Limitation in a Stream Ecosystem: Responses by Primary Producers and Consumers. Ecology76, 1297–1309. doi: 10.2307/1940936
42
Hughes J. M. Stewart J. Lyle J. M. Suthers I. M. (2014). Top-Down Pressure on Small Pelagic Fish by Eastern Australian Salmon Arripis Trutta; Estimation of Daily Ration and Annual Prey Consumption Using Multiple Techniques. J. Exp. Mar. Biol. Ecol.459, 190–198. doi: 10.1016/j.jembe.2014.05.026
43
Jakubowska M. Normant M. (2015). Metabolic Rate and Activity of Blue Mussel Mytilus Edulis Trossulus Under Short-Term Exposure to Carbon Dioxide-Induced Water Acidification and Oxygen Deficiency. Mar. Freshw. Behav. Physiol.48, 25–39. doi: 10.1080/10236244.2014.986865
44
Jansen J. M. Koutstaal A. Bonga S. W. Hummel H. (2009). Salinity-Related Growth Rates in Populations of the European Clam Macoma Balthica and in Field Transplant Experiments Along the Baltic Sea Salinity Gradient. Mar. Freshw. Behav. Physiol.42, 157–166. doi: 10.1080/10236240902904348
45
Jones C. G. Gutiérrez J. L. Byers J. E. Crooks J. A. Lambrinos J. G. Talley T. S. (2010). A Framework for Understanding Physical Ecosystem Engineering by Organisms. Oikos119, 1862–1869. doi: 10.1111/j.1600-0706.2010.18782.x
46
Kornis M. S. Sharma S. Jake Vander Zanden M. (2013). Invasion Success and Impact of an Invasive Fish, Round Goby, in Great Lakes Tributaries. Divers. Distrib.19, 184–198. doi: 10.1111/ddi.12001
47
Kotta J. Jaanus A. Kotta I. (2008a). “Haapsalu and Matsalu Bay,” in Ecology of Baltic Coastal Waters. Ed. SchiewerU. (Berlin Heidelberg: Springer-Verlag), 245–258.
48
Kotta J. Lauringson V. Kotta I. (2007). Response of Zoobenthic Communities to Changing Eutrophication in the Northern Baltic Sea. Hydrobiologia580, 97–108. doi: 10.1007/s10750-006-0462-z
49
Kotta J. Lauringson V. Martin G. Simm M. Kotta I. Herkül K. et al . (2008b). “Gulf of Riga and Pärnu Bay,” in Ecology of Baltic Coastal Waters Studies, vol. 217–243. Ed. SchiewerU. (Berlin Heidelberg: Springer-Verlag) 217–243. doi: 10.1007/978-3-540-73524-3_10
50
Kotta J. Nurkse K. Puntila R. Ojaveer H. (2016). Shipping and Natural Environmental Conditions Determine the Distribution of the Invasive non-Indigenous Round Goby Neogobius Melanostomus in a Regional Sea. Estuar. Coast. Shelf Sci.169, 15–24. doi: 10.1016/j.ecss.2015.11.029
51
Kotta J. Oganjan K. Lauringson V. Pärnoja M. Kaasik A. Rohtla L. et al . (2015). Establishing Functional Relationships Between Abiotic Environment, Macrophyte Coverage, Resource Gradients and the Distribution of Mytilus Trossulus in a Brackish non-Tidal Environment. PloS One10, e0136949. doi: 10.1371/journal.pone.0136949
52
Kotta J. Wernberg T. Jänes H. Kotta I. Nurkse K. Pärnoja M. et al . (2018). Novel Crab Predator Causes Marine Ecosystem Regime Shift. Sci. Rep.8, 1–7. doi: 10.1038/s41598-018-23282-w
53
Kube J. Peters C. Powelleit M. (1996). Spatial Variation in Growth of Macoma Balthica and Mya Arenaria (Mollusca, Bivalvia) in Relation to Environmental Gradients in the Pomeranian Bay (Southern Baltic Sea). Arch. Fish. Mar. Res. Fuer Fisch.- Meeresforsch.44, 81–93.
54
Levinton J. Kelaher B. (2004). Opposing Organizing Forces of Deposit-Feeding Marine Communities. J. Exp. Mar. Biol. Ecol.300, 65–82. doi: 10.1016/j.jembe.2003.12.008
55
Liversage K. Nurkse K. Kotta J. Järv L. (2017). Environmental Heterogeneity Associated With European Perch (Perca Fluviatilis) Predation on Invasive Round Goby (Neogobius Melanostomus). Mar. Environ. Res.132, 132–139. doi: 10.1016/j.marenvres.2017.10.017
56
Maclean J. E. Mitchell R. J. Burslem D. F. R. P. Genney D. Hall J. Pakeman R. J. (2018). Understorey Plant Community Composition Reflects Invasion History Decades After Invasive Rhododendron has Been Removed. J. Appl. Ecol.55, 874–884. doi: 10.1111/1365-2664.12973
57
Mangiafico S. S. (2016). Summary and Analysis of Extension Program Evaluation in R, Version 1.18.1. New Brunswick, NJ: Rutgers Cooperative Extension. pp806
58
Marshall K. E. Anderson K. M. Brown N. E. M. Dytnerski J. K. Flynn K. L. Bernhardt J. R. et al (2021). Whole-Organism Responses To Constant Temperatures Do Not Predict Responses To Variable Temperatures in the Ecosystem Engineer Mytilus trossulus. Proc. R. Soc. B288: 20202968. doi: 10.1098/rspb.2020.2968
59
Martin G. Kotta J. Möller T. Herkül K. (2013). Spatial Distribution of Marine Benthic Habitats in the Estonian Coastal Sea, Northeastern Baltic Sea. Est. J. Ecol.62, 165. doi: 10.3176/eco.2013.3.01
60
Mattson W. J. Addy N. D. (1975). Phytophagous Insects as Regulators of Forest Primary Production. Science190, 515–522. doi: 10.1126/science.190.4214.515
61
Miehls A. L. J. Mason D. M. Frank K. A. Krause A. E. Peacor S. D. Taylor W. W. (2009). Invasive Species Impacts on Ecosystem Structure and Function: A Comparison of Oneida Lake, New York, USA, Before and After Zebra Mussel Invasion. Ecol. Model.220, 3194–3209. doi: 10.1016/j.ecolmodel.2009.07.020
62
Nurkse K. Kotta J. Orav-Kotta H. Ojaveer H. (2016). A Successful non-Native Predator, Round Goby, in the Baltic Sea: Generalist Feeding Strategy, Diverse Diet and High Prey Consumption. Hydrobiologia777, 271–281. doi: 10.1007/s10750-016-2795-6
63
Nurkse K. Kotta J. Rätsep M. Kotta I. Kreitsberg R. (2018). Experimental Evaluation of the Effects of the Novel Predators, Round Goby and Mud Crab on Benthic Invertebrates in the Gulf of Riga, Baltic Sea. J. Mar. Biol. Assoc. U K98, 25–31, 1–7. doi: 10.1017/S0025315417001965
64
Ojaveer H. Jaanus A. MacKenzie B. R. Martin G. Olenin S. Radziejewska T. et al . (2010). Status of Biodiversity in the Baltic Sea. PloS One5, e12467. doi: 10.1371/journal.pone.0012467
65
Olafsson E. (1989). Contrasting Influences of Suspension-Feeding and Deposit-Feeding Populations of Macoma Balthica on Infaunal Recruitment. Mar. Ecol. Prog. Ser.55, 171–179. doi: 10.3354/meps055171
66
Orav-Kotta H. Kotta J. Kaljurand K. Kotta I. (2010). “Seasonal Changes in Biodeposition and Grazing Potential of the Suspension Feeding Bivalve Mytilus Trossulus,” in International Conference on Biosciences (Cancun, Mexico: IEEE), 145–149. doi: 10.1109/BioSciencesWorld.2010.26
67
Pagnucco K. S. Remmal Y. Ricciardi A. (2016). An Invasive Benthic Fish Magnifies Trophic Cascades and Alters Pelagic Communities in an Experimental Freshwater System. Freshw. Sci.35, 654–665. doi: 10.1086/685285
68
Pennuto C. M. Cudney K. A. Janik C. E. (2018). Fish Invasion Alters Ecosystem Function in a Small Heterotrophic Stream. Biol. Invasions20, 1033–1047. doi: 10.1007/s10530-017-1609-8
69
Piiparinen J. Kuosa H. Rintala J.-M. (2010). Winter-Time Ecology in the Bothnian Bay, Baltic Sea: Nutrients and Algae in Fast Ice. Polar Biol.33, 1445–1461. doi: 10.1007/s00300-010-0771-6
70
Power M. E. (1992). Habitat Heterogeneity and the Functional Signifiance of Fish in River Food Webs. Ecology73, 1675–1688. doi: 10.2307/1940019
71
Preisser E. L. Bolnick D. I. Benard M. F. (2005). Scared to Death? The Effects of Intimidation and Consumption in Predator-Prey Interactions. Ecology86, 501–509. doi: 10.1890/04-0719
72
Pya N. Wood S. N. (2015). Shape Constrained Additive Models. Stat. Comput.25, 543–559. doi: 10.1007/s11222-013-9448-7
73
R Core Team (2015). R: A Language and Environment for Statistical Computing. R Foundation for Statistical Computing. Vienna, Austria: R Foundation for Statistical Computing Available Available at: https://www.R-project.org/.
74
Ripple W. J. Estes J. A. Schmitz O. J. Constant V. Kaylor M. J. Lenz A. et al . (2016). What Is a Trophic Cascade? Trends Ecol. Evol.31, 842–849. doi: 10.1016/j.tree.2016.08.010
75
Ruitton S. Francour P. Boudouresque C. F. (2000). Relationships Between Algae, Benthic Herbivorous Invertebrates and Fishes in Rocky Sublittoral Communities of a Temperate Sea (Mediterranean). Estuar. Coast. Shelf Sci.50, 217–230. doi: 10.1006/ecss.1999.0546
76
Segerstråle S. G. (1957). Baltic Sea. Geol. Soc Am.67, 751–800.
77
Seitz R. D. (2011). Gradient Effects on Structuring of Soft-Bottom Benthic Infauna: Macoma Balthica and Predation, Recruitment, and Food Availability. J. Exp. Mar. Biol. Ecol.409, 114–122. doi: 10.1016/j.jembe.2011.08.014
78
Skabeikis A. Morkūnė R. Bacevičius E. Lesutienė J. Morkūnas J. Poškienė A. et al . (2019). Effect of Round Goby (Neogobius Melanostomus) Invasion on Blue Mussel (Mytilus Edulis Trossulus) Population and Winter Diet of the Long-Tailed Duck (Clangula Hyemalis). Biol. Invasions21, 911–923. doi: 10.1007/s10530-018-1869-y
79
Snoeijs-Leijonmalm P. Andrén E. (2017). “Why Is the Baltic Sea So Special to Live in? ,” in Biological Oceanography of the Baltic Sea. Eds. Snoeijs-LeijonmalmP.SchubertH.RadziejewskaT. (Dordrecht: Springer), 23–84.
80
Sobral P. Widdows J. (2000). Effects of Increasing Current Velocity, Turbidity and Particle-Size Selection on the Feeding Activity and Scope for Growth of Ruditapes Decussatus From Ria Formosa, Southern Portugal. J. Exp. Mar. Biol. Ecol.245, 111–125. doi: 10.1016/S0022-0981(99)00154-9
81
Strayer D. L. Adamovich B. V. Adrian R. Aldridge D. C. Balogh C. Burlakova L. E. et al . (2019). Long-Term Population Dynamics of Dreissenid Mussels (Dreissena Polymorpha and D. Rostriformis): A Cross-System Analysis. Ecosphere10, e02701. doi: 10.1002/ecs2.2701
82
Tallqvist M. (2001). Burrowing Behaviour of the Baltic Clam Macoma Balthica: Effects of Sediment Type, Hypoxia and Predator Presence. Mar. Ecol. Prog. Ser.212, 183–191. doi: 10.3354/meps212183
83
Terborgh J. Lopez L. Nuñez P. Rao M. Shahabuddin G. Orihuela G. et al . (2001). Ecological Meltdown in Predator-Free Forest Fragments. Science294, 1923–1926. doi: 10.1126/science.1064397
84
Thorlacius M. Brodin T. (2018). Investigating Large-Scale Invasion Patterns Using-Small Scale Invasion Successions-Phenotypic Differentiation of the Invasive Round Goby (Neogobius Melanostomus) at Invasion Fronts. Limnol. Oceanogr.63, 702–713. doi: 10.1002/lno.10661
85
Tomczak M. T. Müller-Karulis B. Järv L. Kotta J. Martin G. Minde A. (2009). Analysis of Trophic Networks and Carbon Flows in South-Eastern Baltic Coastal Ecosystems. Prog. Oceanogr.81, 111–131. doi: 10.1016/j.pocean.2009.04.017
86
van Deurs M. Moran N. P. Schreiber Plet-Hansen K. Dinesen G. E. Azour F. Carl H. et al . (2021). Impacts of the Invasive Round Goby (Neogobius Melanostomus) on Benthic Invertebrate Fauna: A Case Study From the Baltic Sea. NeoBiota68, 19–30. doi: 10.3897/neobiota.68.67340
87
Westerbom M. Kilpi M. Mustonen O. (2002). Blue Mussels, Mytilus Edulis, at the Edge of the Range: Population Structure, Growth and Biomass Along a Salinity Gradient in the North-Eastern Baltic Sea. Mar. Biol.140, 991–999. doi: 10.1007/s00227-001-0765-6
88
Winkelmann C. Hellmann C. Worischka S. Petzoldt T. Benndorf J. (2011). Fish Predation Affects the Structure of a Benthic Community: Fish Affect Benthic Community Structure. Freshw. Biol.56, 1030–1046. doi: 10.1111/j.1365-2427.2010.02543.x
89
Wood S. N. (2011). Fast Stable Restricted Maximum Likelihood and Marginal Likelihood Estimation of Semiparametric Generalized Linear Models: Estimation of Semiparametric Generalized Linear Models. J. R. Stat. Soc73, 3–36. doi: 10.1111/j.1467-9868.2010.00749.x
90
Worm B. Myers R. A. (2003). Meta-Analysis of Cod-Shrimp Interactions Reveals Top-Down Control in Oceanic Food Webs. Ecology84, 162–173. doi: 10.1890/0012-9658(2003)084[0162:MAOCSI]2.0.CO;2
Summary
Keywords
Baltic Sea, benthic communities, invasion ecology, round goby, top-down pressure
Citation
Nõomaa K, Kotta J, Szava-Kovats R, Herkül K, Eschbaum R and Vetemaa M (2022) Novel Fish Predator Causes Sustained Changes in Its Prey Populations. Front. Mar. Sci. 9:849878. doi: 10.3389/fmars.2022.849878
Received
06 January 2022
Accepted
25 March 2022
Published
12 May 2022
Volume
9 - 2022
Edited by
Chiara Piroddi, Joint Research Centre, Italy
Reviewed by
Pedro Morais, Florida International University, United States; José Lino Vieira De Oliveira Costa, University of Lisbon, Portugal
Updates
Copyright
© 2022 Nõomaa, Kotta, Szava-Kovats, Herkül, Eschbaum and Vetemaa.
This is an open-access article distributed under the terms of the Creative Commons Attribution License (CC BY). The use, distribution or reproduction in other forums is permitted, provided the original author(s) and the copyright owner(s) are credited and that the original publication in this journal is cited, in accordance with accepted academic practice. No use, distribution or reproduction is permitted which does not comply with these terms.
*Correspondence: Kristiina Nõomaa, kristiina.noomaa@ut.ee
This article was submitted to Marine Ecosystem Ecology, a section of the journal Frontiers in Marine Science
Disclaimer
All claims expressed in this article are solely those of the authors and do not necessarily represent those of their affiliated organizations, or those of the publisher, the editors and the reviewers. Any product that may be evaluated in this article or claim that may be made by its manufacturer is not guaranteed or endorsed by the publisher.