Abstract
Rhodoliths are round calcareous red algae that form extensive beds and associated with them are a diverse suite of species. Rhodolith beds are among the least known coastal–marine ecosystems, and even less is understood about their associated flora and fauna. Here, we present an evaluation of the biodiversity larger than 500 μm associated with rhodoliths at Isla del Coco National Park, Costa Rica, an oceanic island in the Eastern Tropical Pacific, 500 km offshore of the mainland. This research determined the influence of rhodolith degree of aggregation (distance among individual rhodolith) as well as rhodolith complexity, volume, and mass in relation to the diversity, composition, and biomass of the associated fauna. A total of 145 taxa were collected in 60 rhodolith samples. Arthropods, polychaetes, and mollusks were the dominant taxa in terms of richness, and crustaceans + acari represented >50% of the total abundance. Five potentially new species were collected in this study. Collections identified 31 new records, with 20 of them being newly reported genera for Isla del Coco. Many of the organisms found were juveniles as well as adult stages bearing eggs, demonstrating the importance of this ecosystem. The faunal composition changed along the gradient of rhodolith aggregation. Moderately aggregated rhodoliths (separated by 5 to 10 cm) had the highest diversity, with the highest averages of taxon richness and total numerical abundance and the highest faunal biomass. There were more organisms in more complex rhodoliths; nevertheless, the complexity of the rhodolith did not affect the number of taxa or total organism biomass. Larger rhodoliths, in size and mass, favored higher amounts of taxa and organisms. The rhodolith bed studied is an example of the intermediate disturbance hypothesis because the highest value of biodiversity of invertebrates was at the moderate aggregation level of rhodoliths. In this density of rhodoliths, the fauna was less exposed to hard environmental conditions and prevented dominant species.
Introduction
Rhodolith bed-forming algae are considered habitat modifiers or “bioengineering species” since they provide three-dimensional shelter for recruits as well as refuge and foraging habitat for a diversity of species (Riosmena-Rodríguez and Medina-López, 2010). Live rhodoliths can sustain a higher richness of invertebrate species than dead rhodoliths or coarse-grained (sand–gravel) sediment habitats (De Grave and Whitaker, 1999; Steller et al., 2003; Riosmena-Rodríguez et al., 2017; Stelzer et al., 2021). Rhodoliths are also biodiversity hotspots of micro- and macroalgae and are important for the establishment and maintenance of biodiversity (Fredericq et al., 2019; Stelzer et al., 2021). Rhodoliths influence the density and diversity of the sediments by providing carbonate material and organic matter (Stelzer et al., 2021).
Multiple authors have identified the fragility of the rhodolith-dominated ecosystems (Steller et al., 2003; Gabara et al., 2018). Rhodolith beds can be disturbed by a myriad of factors. Human activity, rhodolith bed characteristics (nodule density, nodule size, depth, trapped sediment), macroalgal epiphytism, and the presence of other ecosystem engineers have been described as drivers of the rhodolith-associated macrofauna (Steller et al., 2003; Veras et al., 2020; Sánchez-Latorre et al., 2020; Stelzer et al., 2021).
Rhodoliths form extensive beds between 15 and 35 m depth and have been observed as deep as 90 m at Isla del Coco National Park in Costa Rica (Cortés, 2016). There is a need for better understanding rhodolith beds as faunal habitat at Isla del Coco, because of the known fragility of these ecosystems and their importance for the maintenance of marine biodiversity. The primary goal of the present study was to determine the abundance and richness of fauna, greater than 500 μm, associated with a rhodolith bed at an oceanic island in the Eastern Tropical Pacific Ocean (Isla del Coco, Costa Rica). The secondary goal was to test if rhodolith bed structure, based on the degree of aggregation of rhodoliths, affected the diversity, abundance, richness, composition, and biomass of the associated fauna. The final goal was to determine if the structure of each rhodolith (complexity, volume, and mass) was associated with species richness, abundance, and composition of organisms that inhabit them.
Materials and Methods
Collection Site
Sampling was conducted at around 20 m depth off Punta Ulloa in Isla del Coco National Park, Costa Rica, during May of 2008 (Figure 1). This oceanic island is located about 500 km off the Central American coast in the Eastern Tropical Pacific (Cortés, 2012). The island has a diversity of shallow subtidal habitats including coral reef, rock outcrop and boulder–cobble, coarse sand, and rhodolith beds (Cortés, 2016). The bottom at the site of the study consisted mainly of coarse sand with isolated, hard substrates and coral colonies. The rhodolith bed from which the samples were taken extends for several hundred meters. More dispersed rhodoliths are found in the border of the sampling area, closest to the coast, followed by a zone with aggregated rhodoliths, separated by 5 to 10 cm, and an area of several hundred meters with rhodoliths highly aggregated (Figure 1).
Figure 1
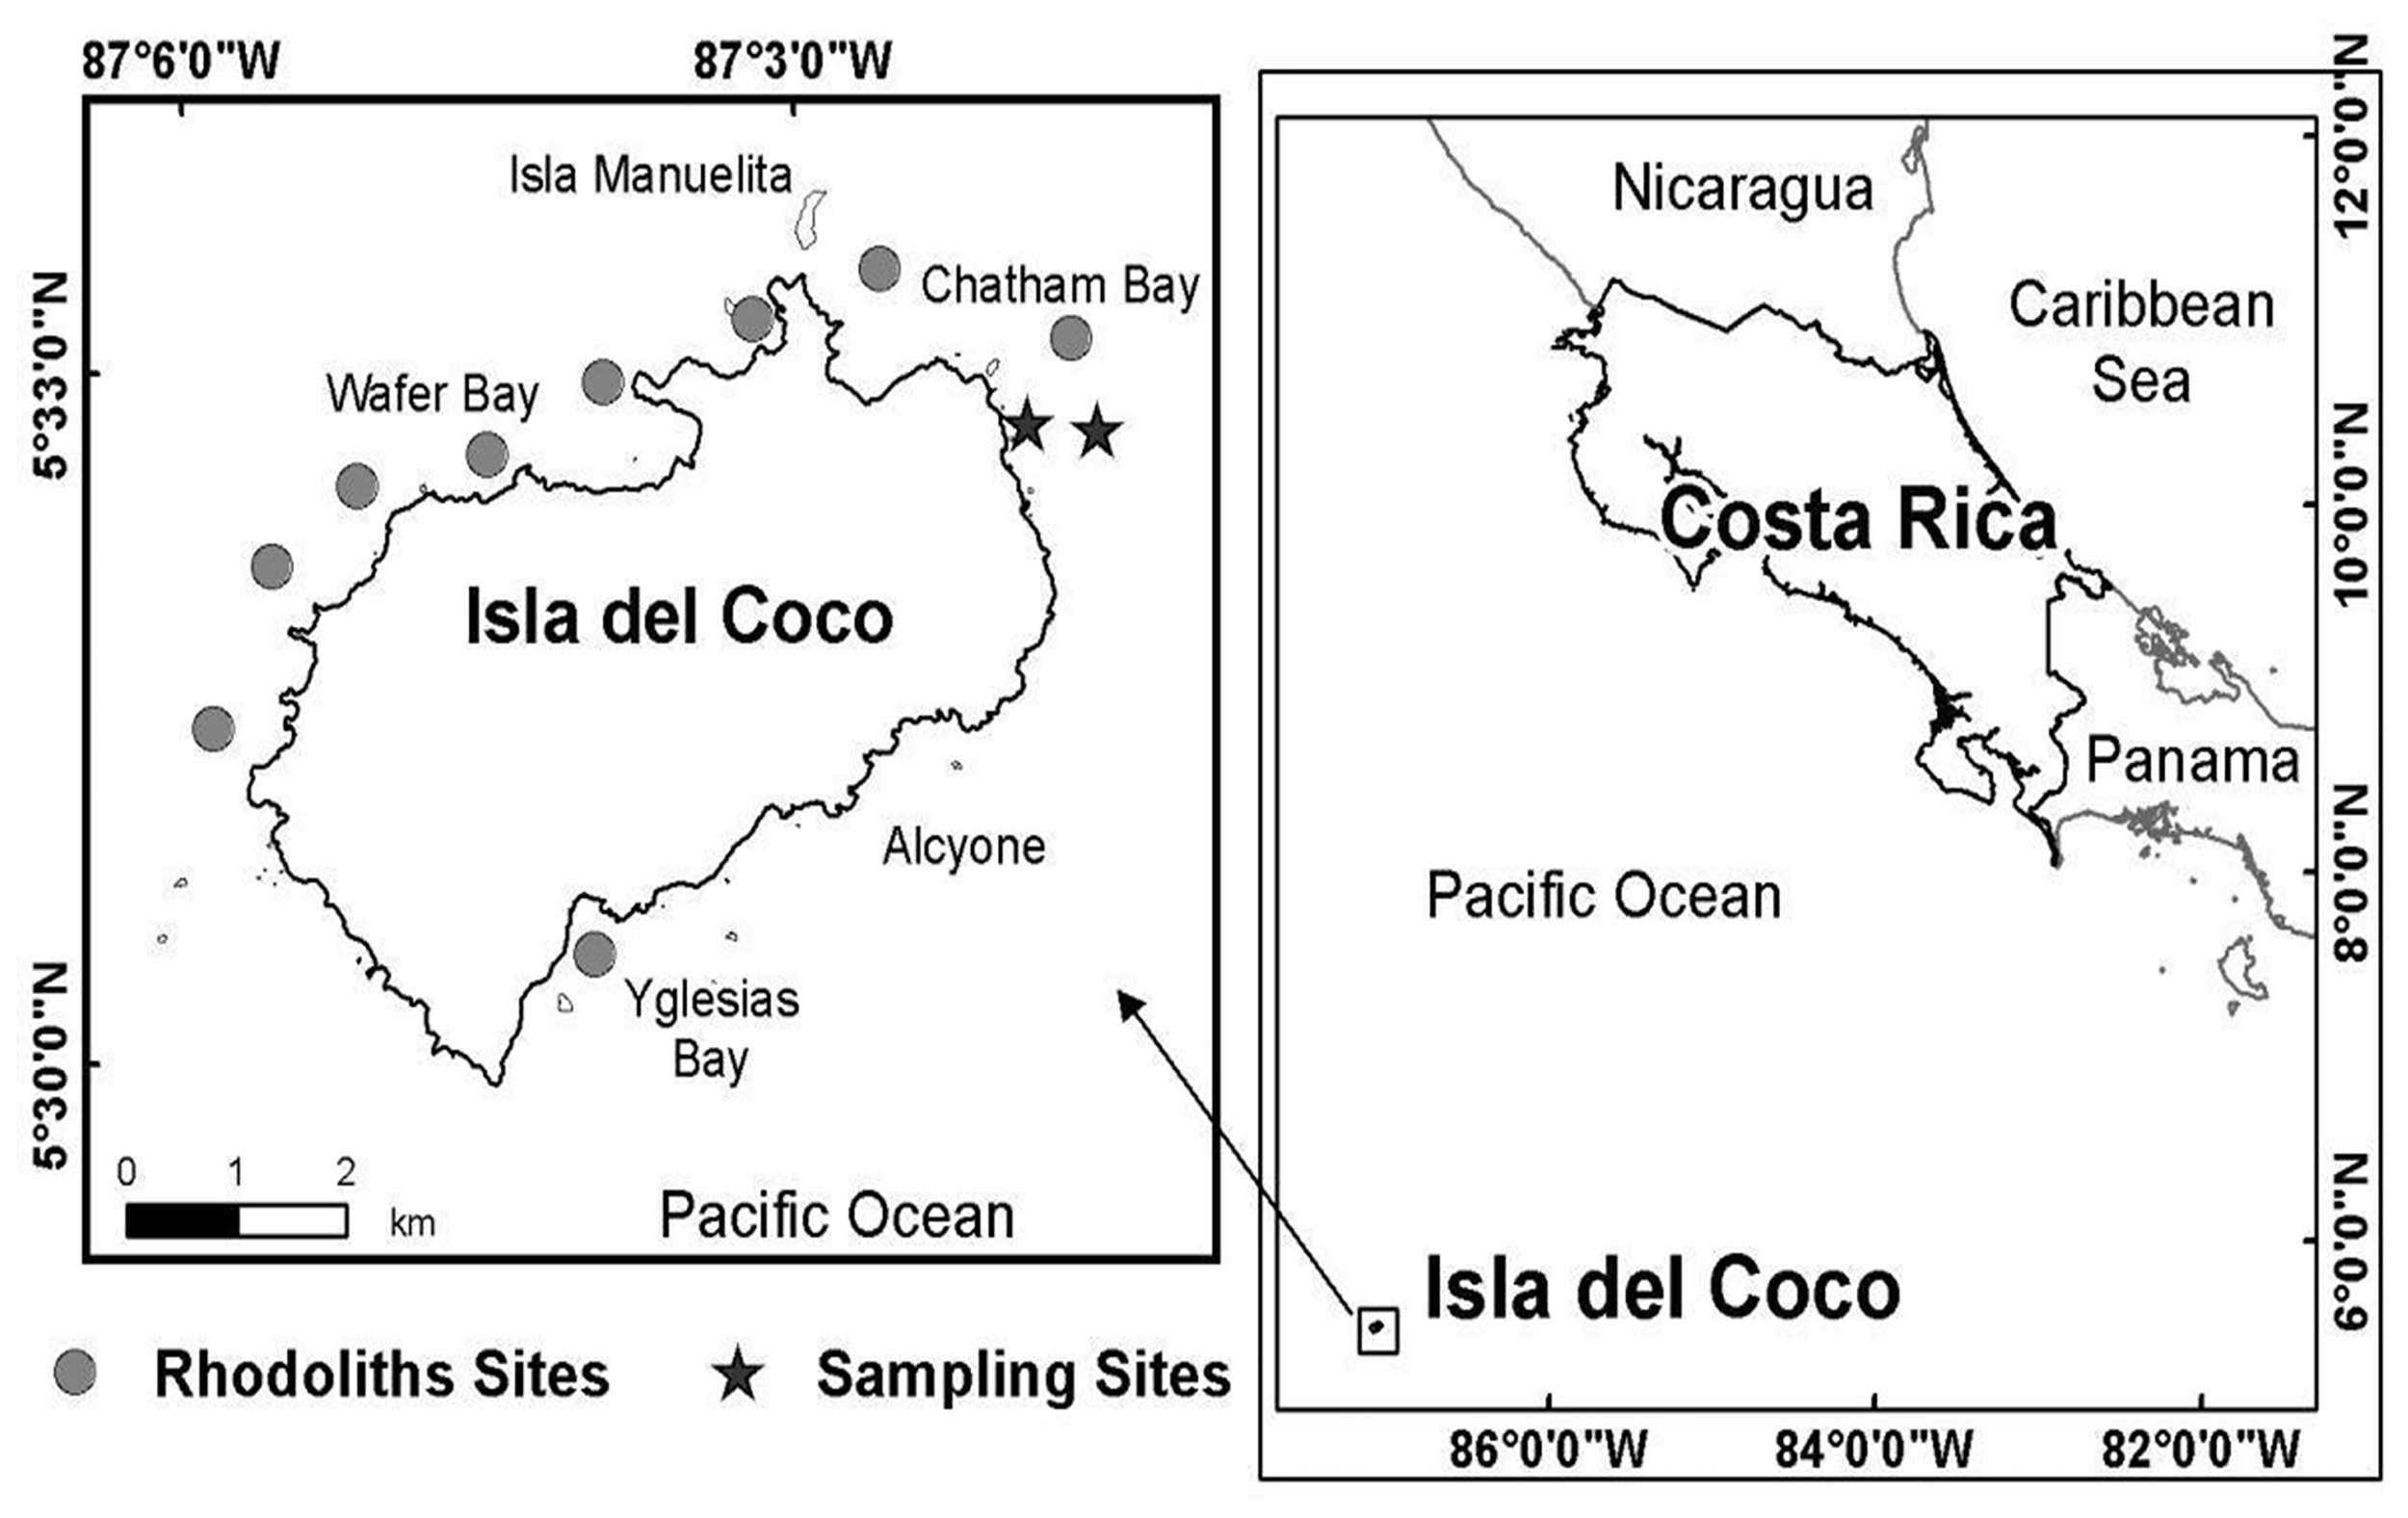
Isla del Coco, Costa Rica (Eastern Tropical Pacific). Circles are rhodolith beds and the stars correspond to the rhodolith bed sampled (two areas: one with more dispersed rhodoliths nearest to the coastline and the other with more grouped rhodoliths).
Sampling Methods and Sample Processing
Sixty rhodoliths and their associated fauna were collected from the rhodolith bed. The rhodoliths to be collected were chosen based on three spatial distribution categories. Twenty were highly aggregated rhodoliths (in direct contact with each other), and these were extracted one from each of the 20 points separated at least 1 m one from each other, all of them within an area of 50 m2; 20 moderately aggregated rhodoliths (separated by 5 to 10 cm one from another) were extracted from each of the 20 patches meeting that definition of separation along a transect of about 150 m; and 20 other rhodoliths were extracted from each of the 20 isolated patches (rhodoliths were separated more than 10 cm one from another) along a transect of about 150 m. During scuba dives, samples were carefully collected by hand and placed individually in plastic bags (no sediments). They were washed in a 500-μm sieve in the laboratory to retain benthic fauna that could be easily extracted from the rhodolith by a thorough, albeit superficial, mechanical washing. This process extracted most of the vagile fauna, those organisms with the ability to move from one site to another on their own, such as wandering polychaetes, arthropods, most mollusks, echinoderms, and some of the fish caught in internal crevices in rhodolith nodules. After that, each rhodolith was thoroughly examined in search for sessile individuals and vagile organisms kept trapped between the branches or crevices of the rhodolith nodules to pick them up directly from each rhodolith, very carefully, using tweezers. Subsequently, the elements of the macrofauna found attached to the rhodolith nodule were counted. This included sessile hydrozoans, anemones, ascidian tunicates, bryozoans, and sponges. Rhodolith nodule-attached hydrozoans, bryozoans, and sponges, all of which present a modular growth, were counted as single units (one colonial unit counted as “one individual”) to prevent counting the same organism more than once. When fragments of each morphotype of any of the organisms were found in the material retained in the sieve, if the same morphotype was not present yet attached to the rhodolith (e.g., sponges, sessile cnidarians, bryozoans), it was counted as a single unit even if more fragments of it appeared in the sieved material. Fragments of polychaetes and arthropods were not counted at least they had the anterior parts used for identification. Echinoderms were counted only when the oral disc was nearly complete (at least >60% of the oral disc present). Fragments of mollusks or empty mollusk shells were not counted.
Weight in grams of each rhodolith was recorded, as well as length, height, and width measures in centimeters to calculate the volume of the rhodolith using the approximation to an ellipsoid as explained in Duerr (1994). Rhodoliths were sawed in halves; one-half of each rhodolith was dissolved immediately in dilute HCl to collect boring organism specimens, while the other half was thoroughly checked in the internal holes, grooves, and crevices for the presence of these boring organisms. This half was then placed in a digital scanner to preserve a flat image to determine the rhodolith surface rugosity (complexity) (Figure 2). The surface rugosity (complexity) of each of the 60 rhodoliths was measured by calculating the ratio of rugose line distance (perimeter) to a straight line distance (circumference), as explained by Fuad (2010).
Figure 2
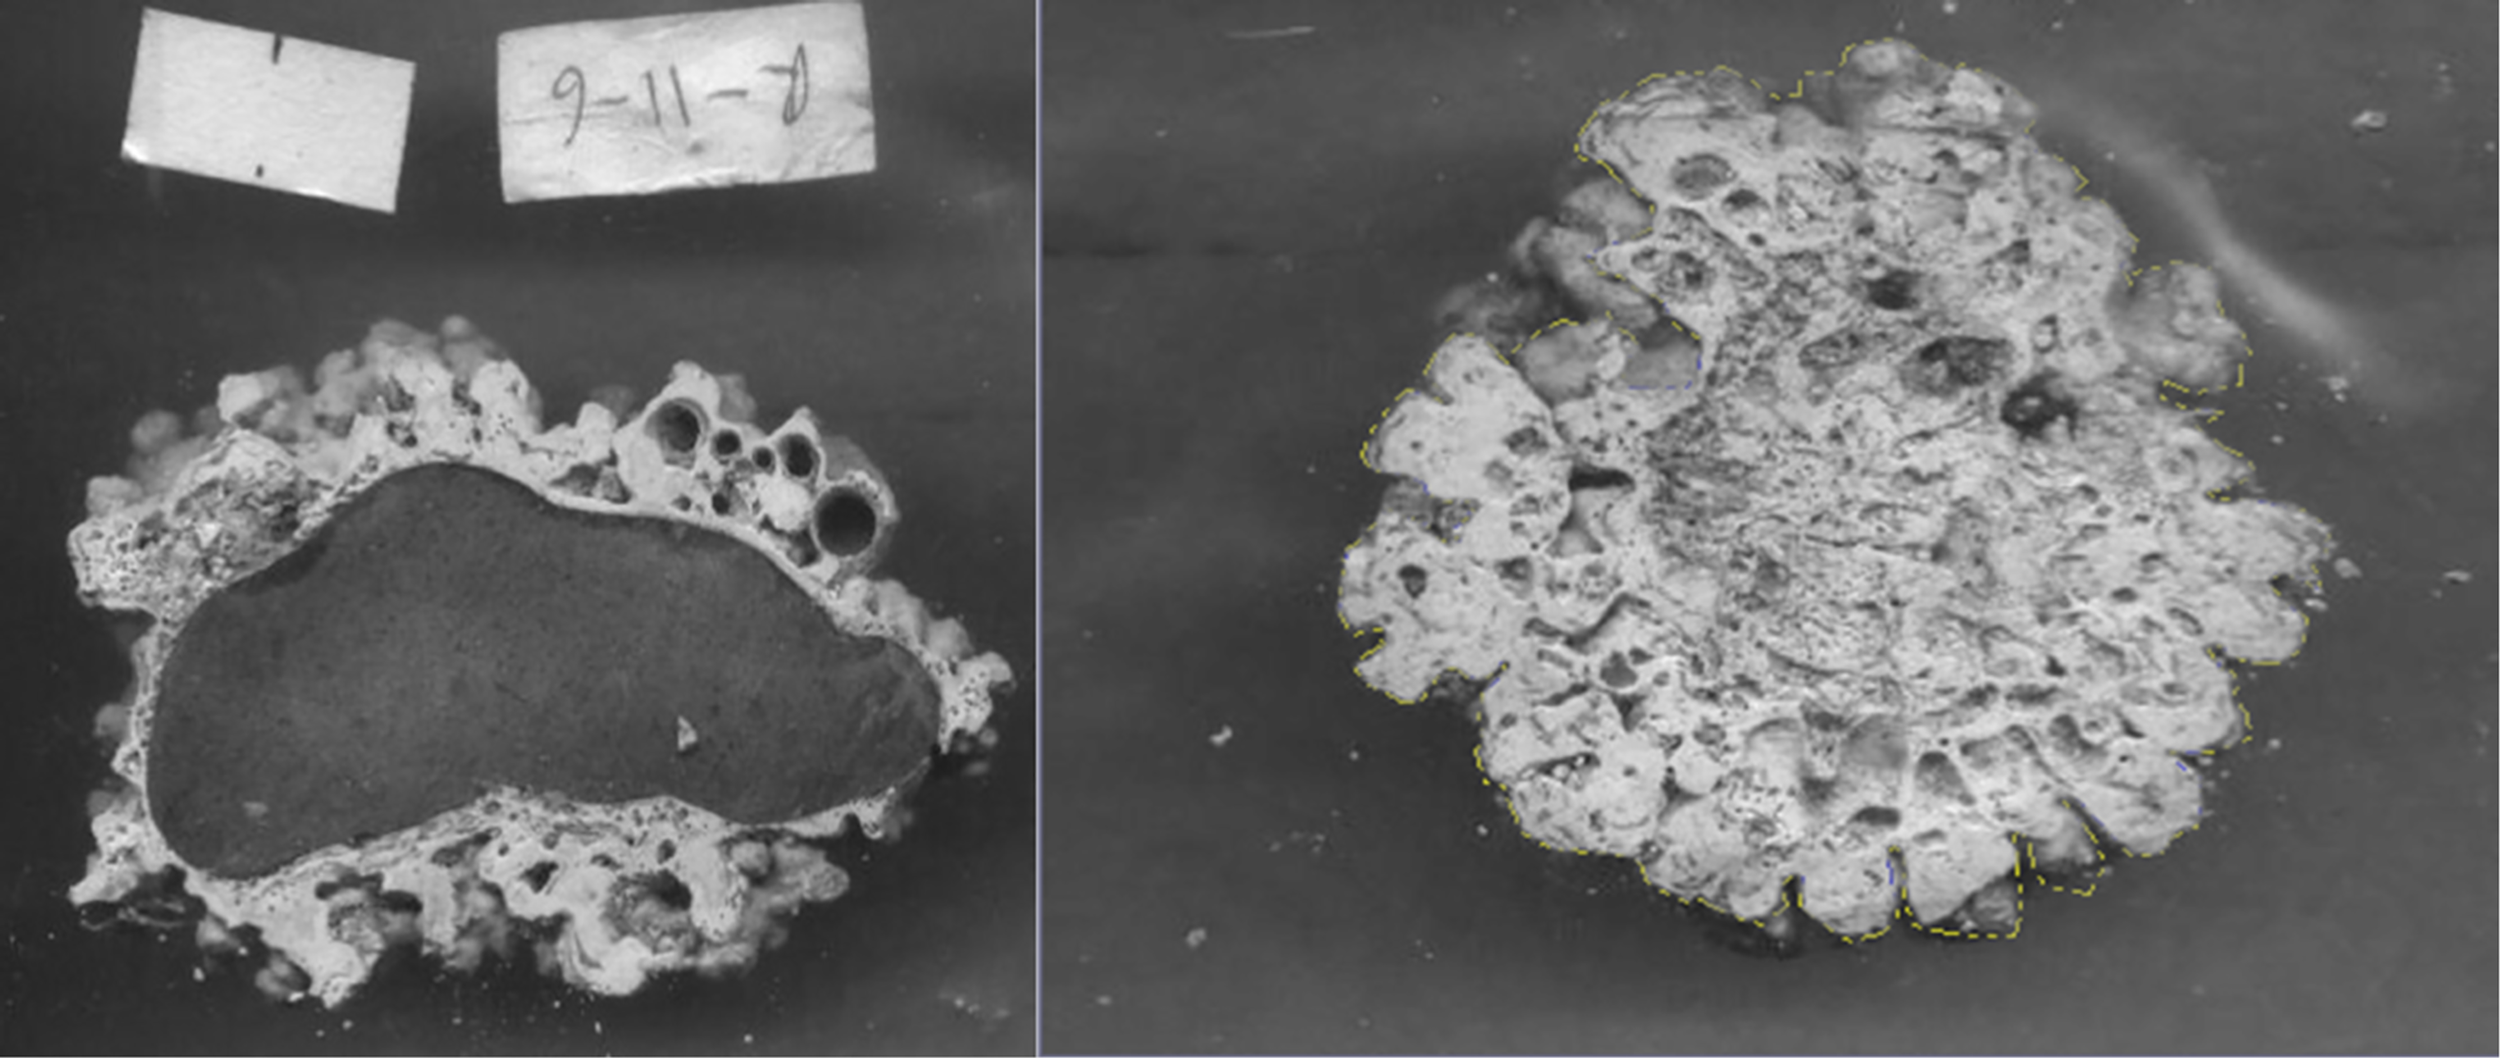
Scanned halves of sawed rhodolith from Isla del Coco to determine complexity.
The associated organisms were classified to the lowest possible taxonomic category and the number of individuals and their relative abundance were recorded.
Statistical Analysis
Testing for the Effects of Rhodolith-Forming Species on the Faunal Response Variables
A linear model (analysis of variance: ANOVA) was used to verify the existence of mean differences in species richness, total abundance, or total biomass of the fauna between the algal species of the rhodoliths. A squared root of the species richness and a cubic root of the total abundance were the transformed responses used to avoid overdispersions in each model. The analysis determines whether algae species affect faunal variables, which could modify the effect of the aggregation factor. Finally, the fitted values, residuals, and residual deviance inspection indicated that each linear model in this study follows the required assumptions of normality of residuals and homogeneity of variances (Crawley, 2007).
Evaluation of Differences in Rhodolith Nodule Characteristics (Complexity, Mass, Volume) Between the Three Levels of Aggregation
A linear model (ANOVA) was used to evaluate for the existence of mean differences in complexity, mass, or volume of the rhodoliths between the three aggregation levels (highly aggregated, moderately aggregated, and isolated patches, n = 20 in each level).
Effects of Rhodolith Aggregation Level on Faunal Response Variables (Total Biomass, Total Abundance, Species Richness)
The command “glm” in R was used to create generalized linear models (analysis of covariance: ANCOVA) (Crawley, 2007), to investigate how the aggregation factor (n = 20 in each level), rhodolith characteristics as covariates, and their interaction affect each faunal response variable: total biomass (ln transformed), total abundance (cubic-root transformed), or overall species richness (square root transformed). Previously, a Pearson index was used to identify highly correlated covariates (>0.65) to avoid the singularity in the model. The natural logarithm (ln) of the volume and the square root of the mass of the rhodoliths were highly correlated (r = 0.80). Only the ln (volume) and complexity squared of the rhodoliths were introduced in the model as covariables.
The models for these variables were fitted using the Gaussian distribution (with the identity-link function). The total biomass model was done with Gamma distribution (with the log-link function) to avoid overdispersion. Subsequent model simplification was done with the command step. It retained only the significant terms that explain mean differences or relation to the parameters.
Effects of Rhodolith Bed Structure (Level of Aggregation) Over the Macrofaunal Species Diversity and Species Composition
Species diversity was calculated for each category of aggregation with the Shannon–Wiener (H) index (ln based and compared by t-test for diversity index) and Pielou equitability (J) in the package PAST (Hammer et al., 2001).
Species composition was compared with a principal coordinates analysis (PCoA) based on the Bray–Curtis similarity index with the aggregation of rhodoliths (with three levels) as the principal factor in the package “labdsv” in R and tested with an analysis of similarities (ANOSIM, n = 20 in each aggregation level). Internal variation of faunal composition on each of these levels of aggregation was quantified with the multivariate index of dispersion using the command betadisper in R in the library “vegan.”
The contribution of particular species to differences between aggregation levels was determined using a similarity percentage routine (overall multigroup and crossed-groups SIMPER) test in the package PAST (Hammer et al., 2001; Quinn and Keough, 2002).
Mantel tests were used to identify the individual correlations of the factors of the rhodoliths (aggregation, complexity, and volume) with the species composition (Bray–Curtis matrix). Additionally, partial Mantel tests were calculated to determine if significant factors (from the previous Mantel test) are independent or partially explain the correlation with the faunal composition (Zar, 1996; Quinn and Keough, 2002). The significant factors were plotted over the PCoA ordination in labdsv in R.
Results
Taxonomic Composition of Rhodoliths
The taxonomic composition of the rhodoliths varied, with Sporolithon present in 23 of the samples, the genus Lithothamnion in 13 of the samples, an indeterminate species of rhodolith in 7 of the specimens, and a mixture of these species and Sporolithon in 16 samples. Hydrolithon onkodes was found building one sample. Rhodoliths were mainly spherical or compact (50%) or compact-platy-bladed (25%) based on Sneed and Folk classes assigned by triplot analysis for lithic materials (Graham and Midgley, 2000).
Rhodolith species presented similar mean faunal species richness (ANOVA: F = 0.30, df = 3/55, p = 0.828), similar mean faunal abundance (ANOVA: F = 0.16, df = 3/55, p = 0.942), and similar mean faunal biomass (ANOVA: F = 1.46, df = 3/55, p = 0.236). A single specimen of H. onkodes was excluded from the linear models.
Rhodolith-Associated Macrofauna
A total of 5,483 organisms and 145 taxa of fauna were found in the 60 rhodoliths sampled. Crustaceans, polychaetes, and mollusks were the dominant taxa, with crustaceans accounting for more than half of total abundance and 25.5% of total richness. Gammaridean amphipods and tanaidaceans (Leptochelia sp. and Apseudomorpha sp.) were the most abundant crustacean species inhabiting rhodoliths; amphipods, isopods, and decapods, together, constituted up to 58% of the crustacean species found. Syllidae (11 spp.), Phyllodocidadae (6 spp.), and Nereididae (1 sp.) were the best-represented polychaete families. Ceratonereis singularis was the only nereid polychaete found, but that species alone was by far the most abundant polychaete species (45% of the total polychaete species). Molluscan fauna were mainly gastropods with 34% of all mollusks represented by the pyramidellid gastropod Odostomia grijalvae, which was recorded from 53% of all samples. Cerithiopsina adamsi and Cerithiopsina sp. together with Turbo saxosus and Eulithidium diantha were also very common. Among bivalves, the most abundant was an unidentified species of Lithophaga boring in 31.6% of rhodoliths. Two species of ophiuroids dominated the echinoderm fauna: Ophiactis savigny (found in 90% of the samples) and Ophiocoma cf. alexandri (found in 66.6% of the samples) (Figure 3, and Table 1). At least five new species were found in this study, two tanaidaceans and three Paranthurid isopods, as well as 14 species, 20 genera, and 12 families newly reported for Isla del Coco and the Eastern Tropical Pacific (Table 1 and Appendix 1).
Figure 3
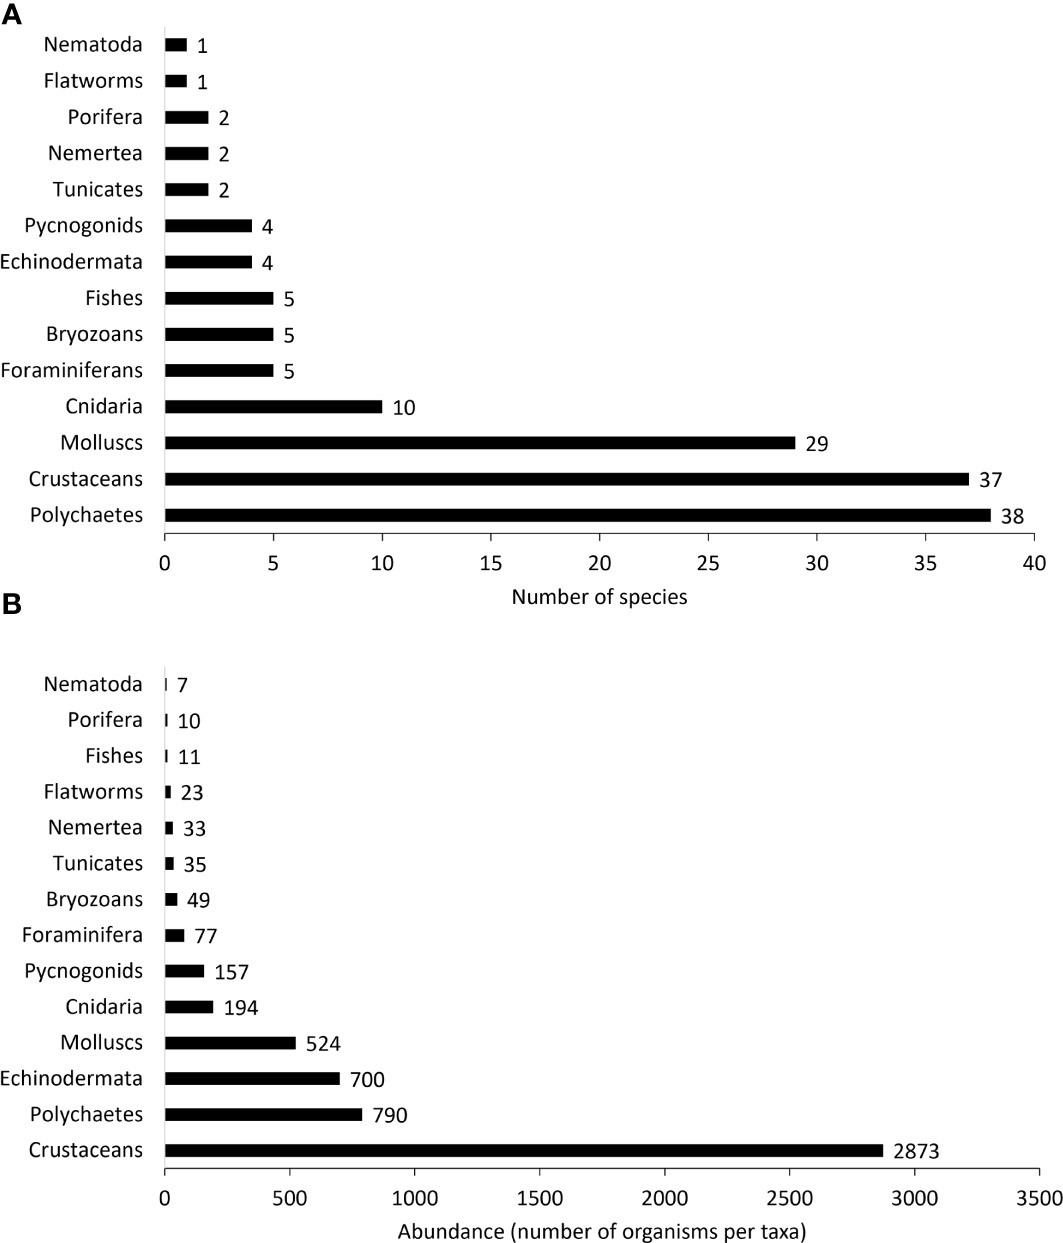
Number of morphospecies per taxon (A) and number of individuals (B) per taxon found among all the rhodolith samples.
Table 1
| Taxon | Richness | % | Abundance | % | % |
|---|---|---|---|---|---|
| Crustaceans | 37 | 25.5 | 2,873 | 52.4 | 22.8 |
| Polychaetes | 38 | 26.2 | 790 | 14.4 | 4.1 |
| Mollusks | 29 | 20 | 524 | 9.6 | 9.9 |
| Echinoderms | 4 | 2.8 | 700 | 12.8 | 20.1 |
| Cnidarians | 10 | 6.9 | 194 | 3.5 | – |
| Pycnogonids | 4 | 2.8 | 157 | 2.8 | – |
| Fish | 5 | 3.4 | 11 | 0.2 | 27.5 |
| Other faunaa | 18 | 12.4 | 234 | 4.3 | 15.6b |
Richness (number of morphospecies), abundance (number of organisms), and biomass per group of organisms associated with rhodoliths at Isla del Coco; taxa with fewer than 100 organisms (with the exception of fish, see note below) were included in “other fauna”.
Except for fish, which contribute a significant amount of biomass despite having only 11 individuals collected, taxa with few organisms (100) were included in “other fauna” (tunicates, bryozoans, nemerteans, nematodes, foraminiferans, and flatworms).
Other fauna biomass and biomass percentage include pycnogonids and cnidarians which were not separately measured.
During the sampling collections, many small fishes were seen swimming back to the rhodolith shelter while we were scuba diving. Nine out of 60 rhodoliths had fish, almost all of them found inside crevices or tunnels in the rhodolith nodule (eight hollow rhodoliths had fishes). These fishes were represented by five species, and one of them, Emblemaria piratica, is a new report for Isla del Coco. Additionally, two species of snapper fish (genus Lutjanus) and one species of Cirrhitichthys (C. oxycephalus) were encountered in the rhodoliths. Other sessile fauna found on rhodoliths included two species of sponges, two species of ascidians, and several hydrozoans and anthozoans (Appendix 1).
Although sex and maturity of macrofaunal elements were not thoroughly investigated, many of the rhodoliths sampled had one or more immature specimens, many of them being isopod and amphipod crustaceans, but also decapods, fishes, tube polychaetes, and mollusks. In 78.1% of rhodolith samples having crustaceans, there were several females of at least one species carrying eggs or embryos, and these species were mainly gammarid amphipods (8 spp., 87 females carrying eggs or embryos), isopods (4 spp., 23 carrying eggs or embryos), and tanaidaceans (11 Leptochelia sp. and 9 Apseudomorpha sp. are egg-carrying females) (Supplementary Figure S1). The number of females of each species carrying eggs or embryos as well as the average number of eggs carried by each species was recorded (Appendix 2). Additionally, eight hollow rhodoliths had fish in crevices or tunnels inside the rhodolith nodule. The two species of snapper fish and C. oxycephalus were juveniles. Adults of the mantis shrimp Neogonodactylus zacae and adults of the crabs Paractea sulcata and Micropanope maculatus were discovered in pairs of male and female, protected inside crevices of some hollow rhodolith nodules, with the female of M. maculatus having several hundreds of eggs.
Effects of Rhodolith Bed Structure (Level of Aggregation) on Rhodolith Physical Characteristics
Rhodolith complexity and volume were similar in their mean value between the three aggregation levels (Table 2). The mean value of rhodolith mass varied depending on the aggregation level. The Tukey pairwise comparisons test showed that isolated rhodoliths had a lower mean mass than the moderate aggregation level, but there were no differences between isolated and high aggregation levels nor between high and moderate aggregation levels in terms of rhodolith mass. The range of variation of each characteristic was well represented within each aggregation level of the rhodoliths.
Table 2
| Variable | Parameter | Aggregation | Linear model (ANOVA) | ||
|---|---|---|---|---|---|
| Isolated | Moderately | Highly | F, p-value | ||
| Complexity | Upper limit | 0.74 | 0.68 | 0.68 | |
| Mean | 0.68 | 0.64 | 0.64 | 0.95, 0.392 | |
| Lower limit | 0.62 | 0.59 | 0.6 | ||
| Volume (cm3) | Upper limit | 1,085.19 | 1,432 | 1,194.61 | |
| Mean | 810.51 | 1,138.52 | 947.58 | 1.74, 0.184 | |
| Lower limit | 605.36 | 905.19 | 751.63 | ||
| Mass (g) | Upper limit | 122.39 | 177.69 | 160.32 | |
| Mean | 93.87 | 147.83 | 129.1 | 3.70, 0.031* | |
| Lower limit | 69.13 | 120.72 | 101.27 | ||
Mean value and their upper and lower limits of 95% of confidence for the rhodolith characteristics by the three levels of aggregation of rhodoliths at Isla del Coco.
The p-value of the linear model is presented. The symbol (*) indicates a significant p-value. Mean values and p values are highlighted.
Effects of the Rhodolith Bed Structure (Levels of Aggregation) and Covariates on the Macrofauna Richness and Abundance
Effects on the Richness
The ANCOVA shows that the mean value of species richness was higher in moderately aggregated rhodoliths, followed by highly aggregated rhodoliths (Figure 4A). Both levels of aggregation had a higher taxon richness than the isolated rhodoliths (Table 3 and Figure 4A). No interaction was found between these covariates and aggregation level over these faunal variables, but as additive factors, the complexity and volume of rhodoliths produced a linear increase of the faunal species richness within each level of rhodolith aggregation (Table 3 and Figures 4B, C).
Figure 4
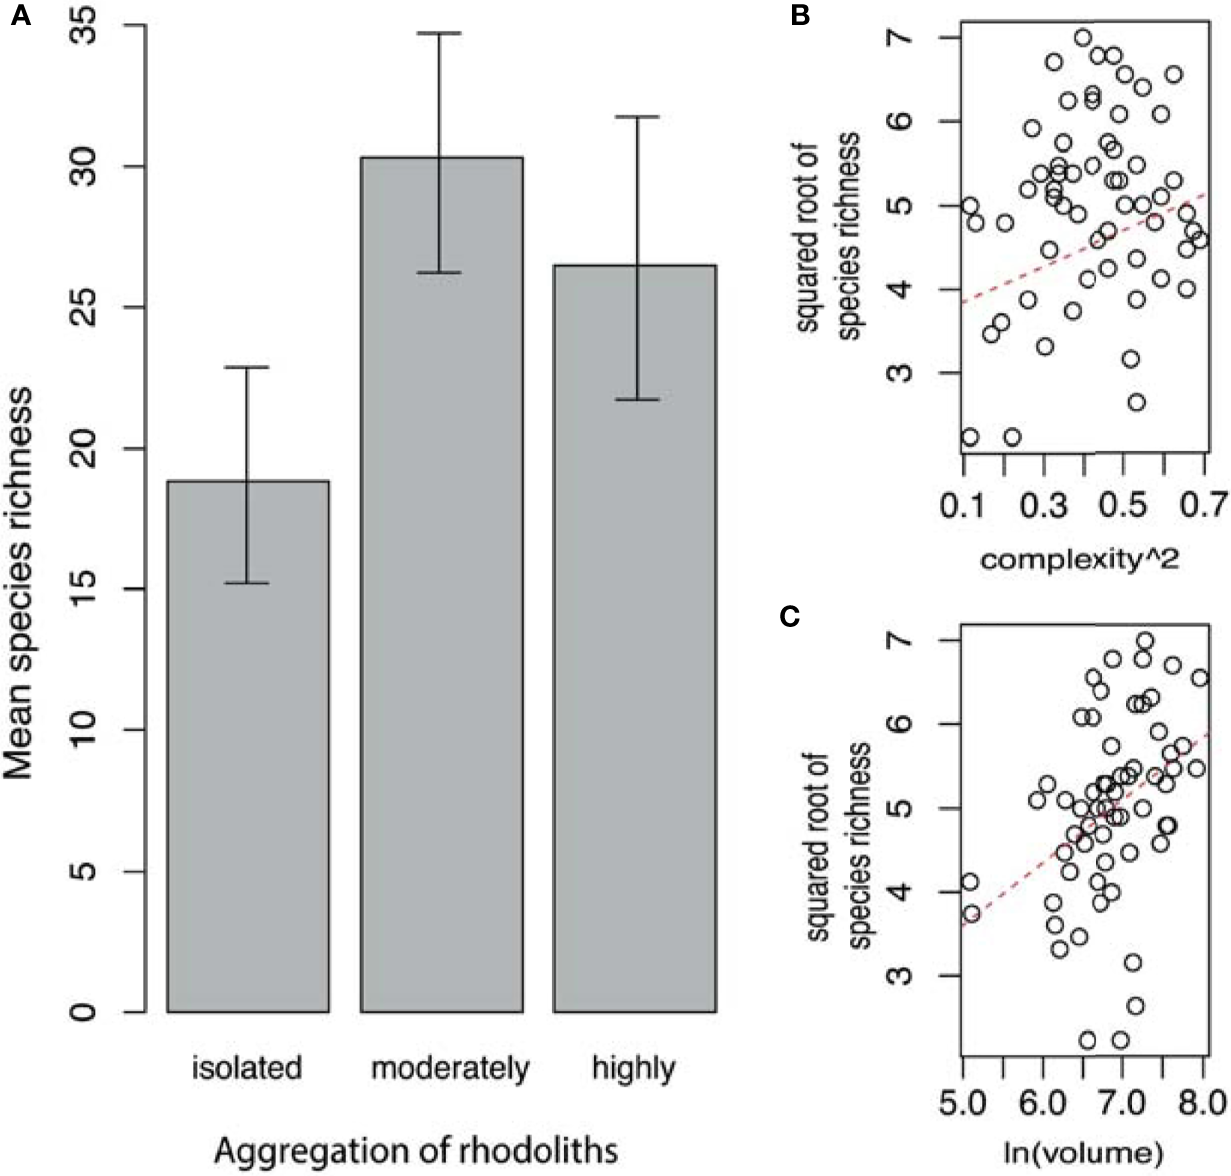
(A) Mean of fauna species richness (with 95% confidence limits) by aggregation of rhodoliths. (B) Relationship between faunal species richness and complexity of rhodoliths. (C) Relationship between faunal species richness and volume of rhodoliths (Isla del Coco, Costa Rica).
Table 3
| Coefficients: | Estimate | Std. error | t value | p |
|---|---|---|---|---|
| (Intercept) | −0.143 | 1.447 | −0.1 | 0.921 |
| Moderately vs. isolated | 1.094 | 0.304 | 3.6 | <0.001 |
| Highly vs. isolated | 0.818 | 0.296 | 2.77 | 0.008 |
| Complexity squared | 1.892 | 0.828 | 2.28 | 0.026 |
| ln (volume) | 0.539 | 0.212 | 2.54 | 0.014 |
Simplified generalized linear model (ANCOVA) for faunal species richness in the rhodoliths (Isla del Coco, Costa Rica).
Simplified model: squared root (species) ~ aggregation + complexity squared + ln (volume), family = Gaussian.
Null deviance: 71.459 on 59 degrees of freedom.
Residual deviance: 46.296 on 55 degrees of freedom.
AIC: 166.71.
Effects on the Abundance
Similarly, the highest mean abundance occurs in the moderately aggregated rhodoliths (Table 4 and Figure 5A). The mean abundance of fauna in highly aggregated and isolated rhodoliths was similar (Figure 5A). Only an additive effect of the complexity and volume of rhodoliths to increase the abundance of fauna was found (Table 4 and Figures 5B, C).
Table 4
| Coefficients: | Estimate | Std. error | t value | p |
|---|---|---|---|---|
| (Intercept) | 1.069 | 1.016 | 1.05 | 0.297 |
| Moderately vs. isolated | 0.468 | 0.214 | 2.19 | 0.033 |
| Highly vs. isolated | 0.101 | 0.208 | 0.49 | 0.629 |
| Complexity squared | 1.263 | 0.581 | 2.17 | 0.034 |
| ln (volume) | 0.378 | 0.149 | 2.54 | 0.014 |
Simplified generalized linear model (ANCOVA) for total abundance of fauna in the rhodoliths (Isla del Coco, Costa Rica).
Simplified model: Cubic root (Abundance) ~ aggregation + complexity squared + ln (volume), family = Gaussian.
Null deviance: 31.042 on 59 degrees of freedom.
Residual deviance: 22.811 on 55 degrees of freedom.
AIC: 124.25.
Figure 5
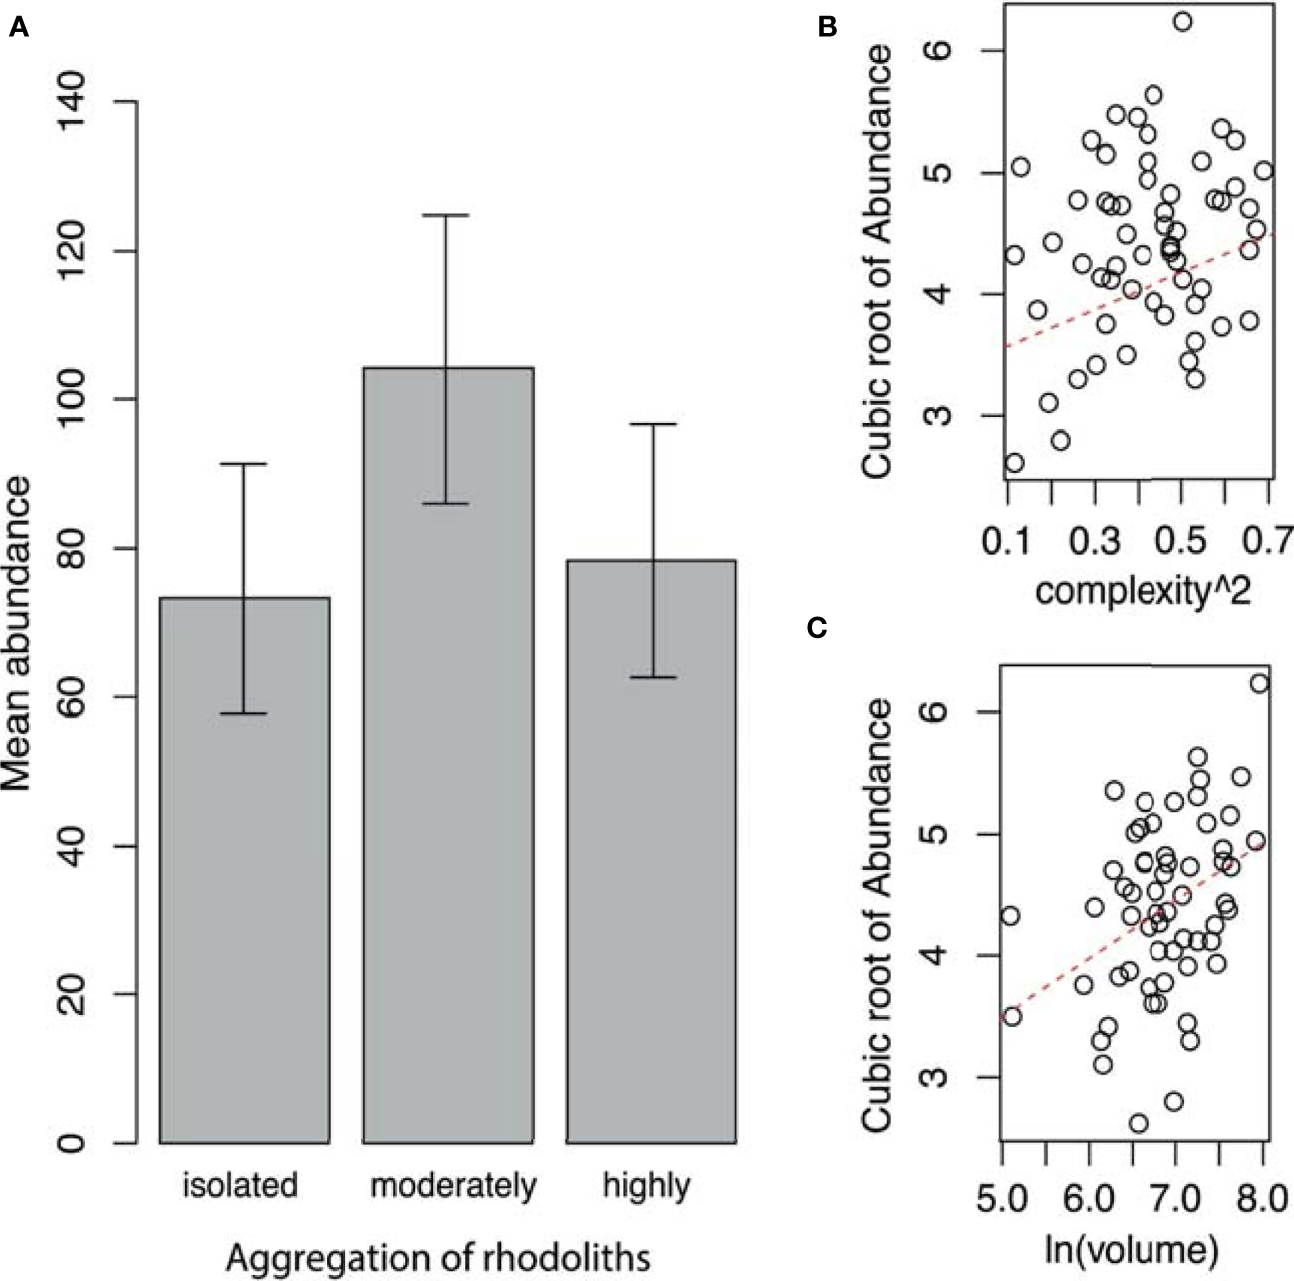
(A) Mean abundance of fauna (with 95% confidence limits) by aggregation of rhodoliths. (B) Relationship between the abundance of fauna and complexity of rhodoliths. (C) Relationship between the abundance of fauna and volume of rhodoliths (Isla del Coco, Costa Rica).
Effects of Rhodolith Bed Structure (Levels of Aggregation) and Rhodolith Nodule Volume on the Total Biomass
The ANCOVA shows that faunal biomass depends on the interaction between the aggregation level and the volume of the rhodoliths. The higher the volume of the rhodolith, the more the biomass of the fauna. The relationship changes between moderate rhodoliths where the slope is less steep than the same relationship at isolated or highly aggregated rhodoliths (Table 5 and Figure 6). This differentiated effect means a higher average of the biomass/volume ratio in the moderate rhodoliths than in the other two levels (Figure 6).
Table 5
| Coefficients: | Estimate | Std. Error | t value | p |
|---|---|---|---|---|
| (Intercept) | −9.346 | 1.41 | −6.63 | 0 |
| Moderately vs. isolated | 6.088 | 2.351 | 2.59 | 0.012 |
| Highly vs. isolated | 1.477 | 2.298 | 0.64 | 0.523 |
| Log(volume) | 1.212 | 0.21 | 5.78 | 0 |
| Moderately * log(volume) vs. isolated * log(volume) | −0.809 | 0.339 | −2.39 | 0.021 |
| Highly * log(volume) vs. isolated * log(volume) | −0.174 | 0.337 | −0.52 | 0.607 |
Simplified generalized linear model (ANCOVA) for total biomass of fauna in the rhodoliths (Isla del Coco, Costa Rica).
Simplified model: total biomass ~ aggregation + ln (volume) + aggregation * ln (volume), family = Gamma(link = log).
Null deviance: 38.793 on 59 degrees of freedom.
Residual deviance: 20.781 on 55 degrees of freedom.
AIC: 6.5618.
Figure 6
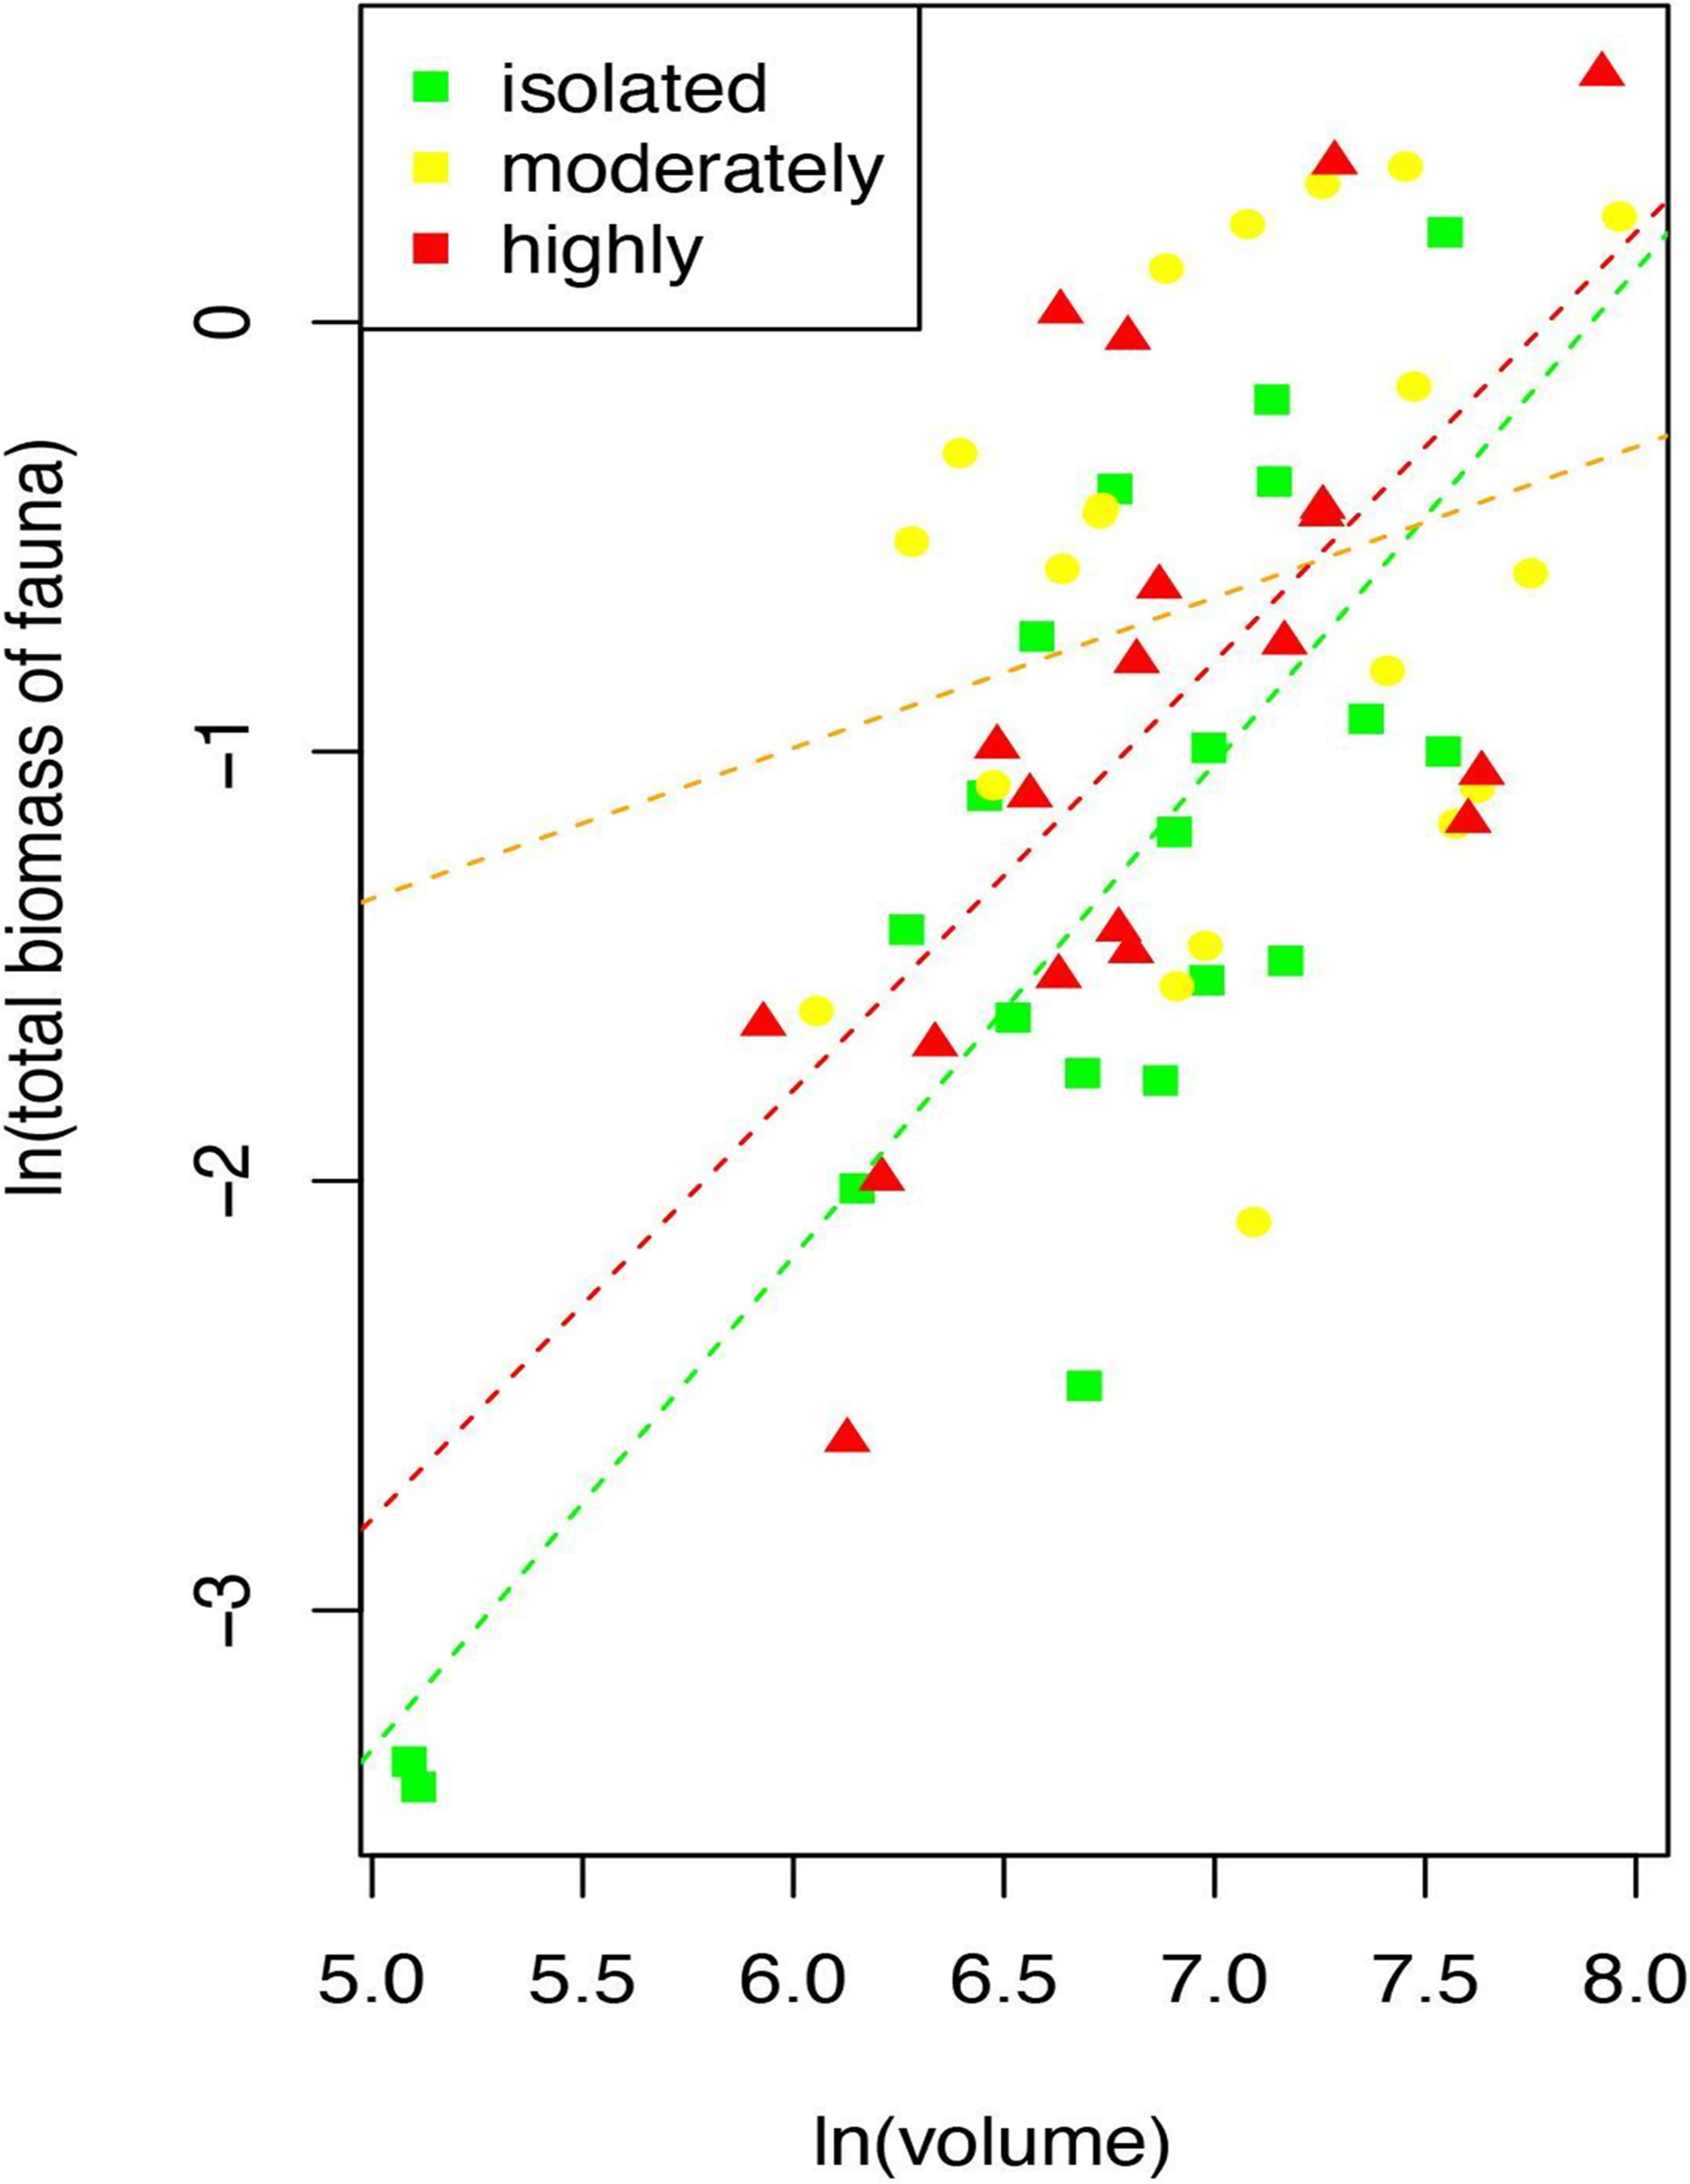
Relationship of the total biomass of fauna and volume of rhodoliths by each level of aggregation of rhodoliths (Isla del Coco, Costa Rica).
In addition to the moderate aggregation level of the rhodoliths, larger and more voluminous rhodoliths had a higher number of taxa, individual organisms, and total biomass of associated fauna based on these linear models.
Some groups contributed more to total biomass than others. Together, the most abundant groups (e.g., crustaceans, polychaetes, mollusks, and echinoderms) contributed 56.9% to total biomass. Crustaceans and echinoderms (primarily ophiuroids) were the invertebrates that contributed the most to this parameter (22.8% and 20.1%, respectively). Even though only 11 individuals of fish were collected, they accounted for 27.5% of total biomass. Given that fish were found in only a small number of rhodoliths (9 out of 60), and because it was frequently observed that the biomass of a single fish contributed significantly more than the combined biomass of other taxa for the same rhodolith, fish biomass was not included in the analyses.
Effects of Rhodolith Bed Structure (Levels of Aggregation) on Overall Diversity and Species Composition
The Shannon–Wiener diversity index was lower in isolated rhodoliths than in moderately aggregated rhodoliths (t: −7.59, df = 3,350.7, p = 0.001), and moderately aggregated rhodoliths were also more diverse than highly aggregated rhodoliths (t: 1.98, df = 3,430.6, p = 0.047). The equitability results are similar between moderately and highly aggregated rhodoliths; however, the former had greater abundance and better distribution in a greater number of species (Table 6).
Table 6
| Aggregation | Isolated | Moderately | Highly | |
|---|---|---|---|---|
| Species | Total | 104 | 119 | 115 |
| Abundance | Total | 1,591 | 2,206 | 1,686 |
| Shannon–Wiener | Upper limit 95% | 3.39 | 3.72 | 3.65 |
| H | 3.31 | 3.67 | 3.57 | |
| Lower limit 95% | 3.26 | 3.61 | 3.51 | |
| Pielou equitability | Upper limit 95% | 0.73 | 0.78 | 0.77 |
| J | 0.71 | 0.77 | 0.75 | |
| Lower limit 95% | 0.7 | 0.76 | 0.74 |
Summary of faunal species and abundance, diversity index (H), and equitability (J) by each level of aggregation of rhodoliths.
The taxon composition was different from isolated to highly aggregated rhodoliths (Figure 7A, ANOSIM, R = 0.25, p < 0.001). Within groups, faunal similarity was higher among highly aggregated rhodoliths, while isolated rhodoliths presented greater variation from one rhodolith to another (Figures 7A–C and Table 7). Abundant and well-distributed taxa like Amphipoda indet. 1 and the ophiuroid O. savigny contributed importantly to this similarity within each level of aggregation and to the overall similarity, and those species were typical of all levels of aggregation (Table 7). The nereid polychaete C. singularis was a typical species in highly and moderately aggregated rhodoliths but not in isolated rhodoliths, where the ophiuroid O. savigny was the most typical species and contributed more to the similarity in isolated patches (Table 7). Few taxa made the highest contribution to the dissimilarity between pairs of aggregation levels (Table 8). The taxon with the highest contribution to the dissimilarity between categories of aggregation was Amphipoda indet. 1, which increased in abundance from isolated to highly aggregated rhodoliths (Table 8). The taxa making the next highest level of contribution to dissimilarity between pairs of groups were the tanaidaceans Leptochelia sp. (isolated vs. moderately) and Apseudomorpha sp. (moderately vs. highly aggregated). Leptochelia was more abundant in isolated rhodoliths, while Apseudomorpha was more abundant in moderately aggregated rhodoliths (Table 8). The major groups that contributed to dissimilarity between groups were crustaceans (mainly peracarids), followed by ophiuroids and polychaetes (mobile predators). There is a higher dissimilarity percentage between isolated and highly aggregated rhodoliths, and that difference is lowest between moderately and highly aggregated rhodoliths (Table 8). The nereid polychaete C. singularis was very abundant, mainly in moderately aggregated rhodoliths, and was uncommon in isolated rhodoliths, and the relative abundances of C. singularis were very consistent along with the levels of aggregation, so its diss/SD ratio is among the highest in all levels (Table 8).
Figure 7
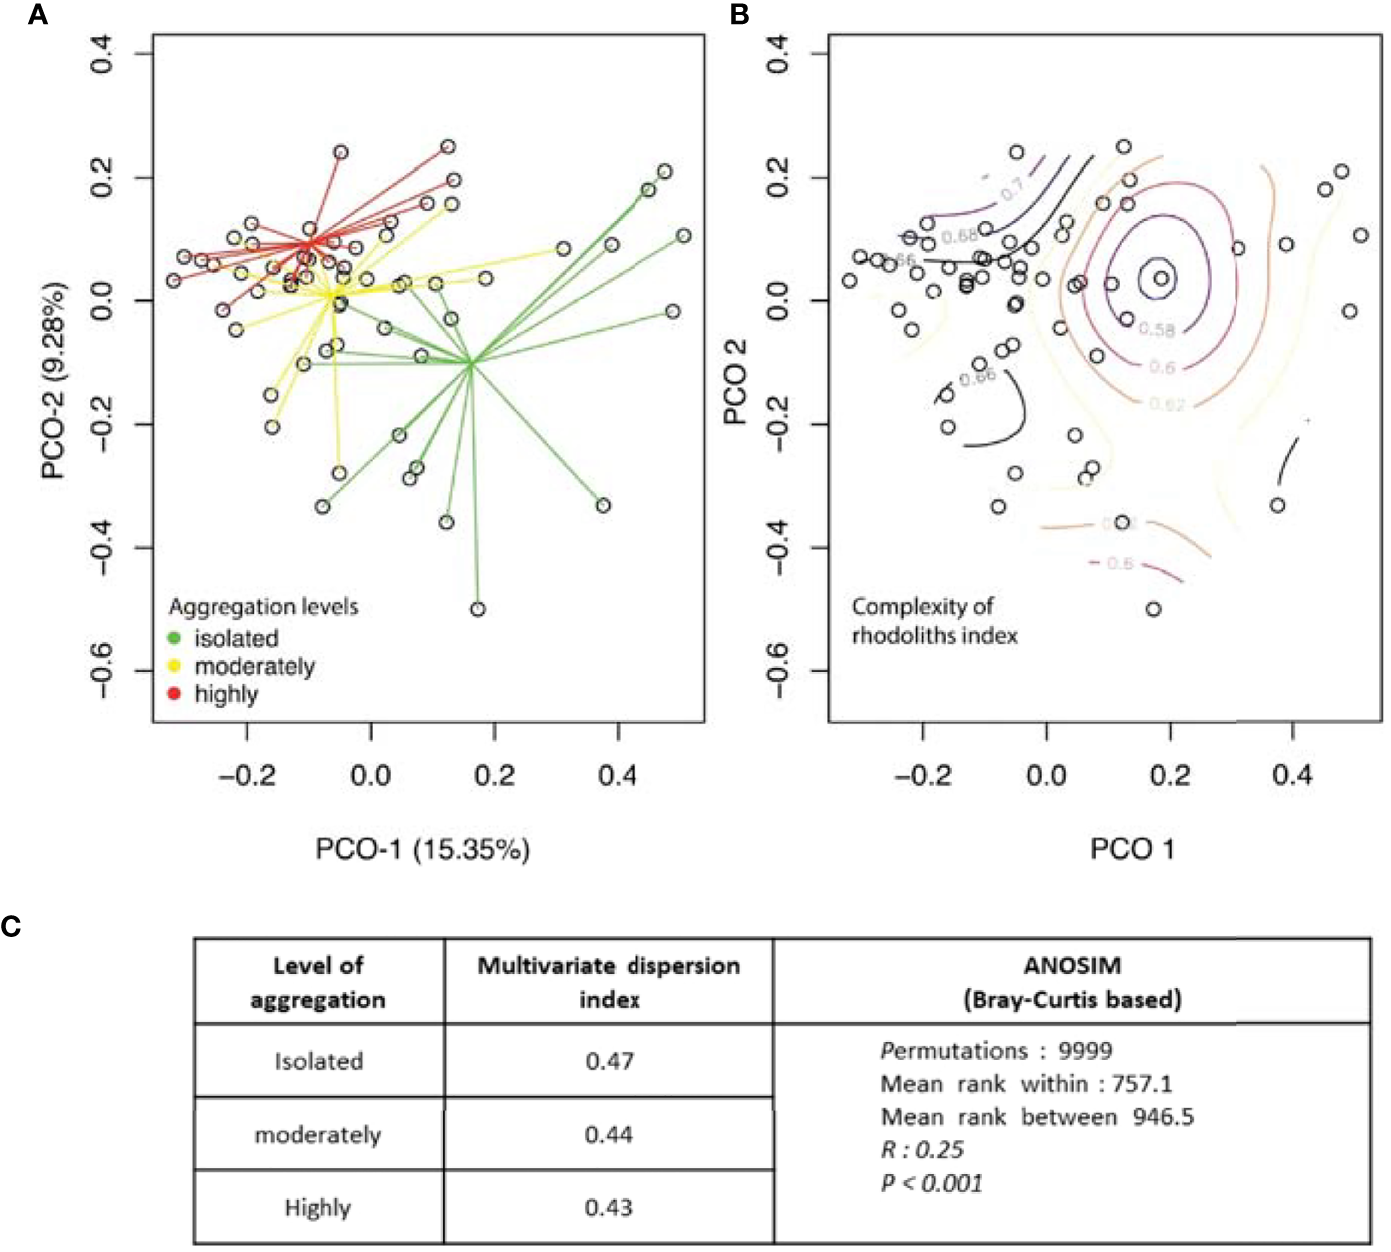
Principal coordinate analysis based on Bray–Curtis of the abundance of invertebrates in rhodolith samples by (A) the level of aggregation of the rhodolith bed and (B) the value of complexity of the rhodoliths (Isla del Coco). (C) Comparison of multivariate dispersion indexes generated by betadisper (R, library “vegan”) and PERMANOVA analysis of internal variation in species composition.
Table 7
| Group III | |||||
|---|---|---|---|---|---|
| Average similarity: 37.53 | |||||
| Species | Av. abund | Av. sim | Sim/SD | Contrib% | Cum% |
| Amphipoda indet. 1 | 18.70 | 15.04 | 1.75 | 40.08 | 40.08 |
| Ceratonereis singularis | 7.05 | 5.18 | 1.69 | 13.81 | 53.89 |
| Ophiactis savigny | 7.40 | 4.29 | 0.98 | 11.44 | 65.33 |
| Synalpheus sp. | 2.10 | 1.29 | 1.11 | 3.44 | 68.77 |
| Ophiocoma cf. alexandri | 2.30 | 0.79 | 0.49 | 2.11 | 70.88 |
| Group II | |||||
| Average similarity: 35.85 | |||||
| Species | Av. abund | Av. sim | Sim/SD | Contrib% | Cum% |
| Amphipoda indet. 1 | 16.1 | 8.9 | 1.44 | 24.84 | 24.84 |
| Ophiactis savigny | 8.15 | 4.86 | 1.19 | 13.56 | 38.4 |
| Ceratonereis singularis | 8.7 | 4.41 | 1.45 | 12.32 | 50.72 |
| Apseudomorpha sp. | 9.45 | 2.93 | 0.82 | 8.19 | 58.9 |
| Amphipoda indet. 3 | 6 | 1.88 | 0.81 | 5.23 | 64.13 |
| Leptochelia sp. | 4.55 | 1.11 | 0.75 | 3.09 | 67.22 |
| Odostomia grijalvae | 4.05 | 1.03 | 0.55 | 2.86 | 70.08 |
| Group I | |||||
| Average similarity: 32.13 | |||||
| Species | Av. abund | Av. sim | Sim/SD | Contrib% | Cum% |
| Ophiactis savigny | 10.6 | 10.16 | 1.28 | 31.63 | 31.63 |
| Amphipoda indet. 1 | 12.5 | 6.04 | 0.85 | 18.81 | 50.44 |
| Leptochelia sp. | 8.4 | 3.86 | 0.65 | 12.03 | 62.47 |
| Amphipoda indet. 3 | 6.9 | 1.71 | 0.48 | 5.34 | 67.8 |
| Pseudotanais sp. | 3.4 | 1.54 | 0.63 | 4.79 | 72.59 |
Results of the SIMPER analysis for within-group similarity.
I: isolated, II: moderately, and III: highly aggregated rhodoliths.
Av, abund, average abundance; Av, sim, average similarity; Sim/SD, similarity/standard deviation ratio; Contrib%, contribution percentage to similarity for each species; Cum%, cumulative percentage contribution to similarity for each species.
Table 8
| Dissimilarity I vs. II | Average dissimilarity 71% | Av. dissim | Diss/SD | Contrib% | Cumul% | |
|---|---|---|---|---|---|---|
| Taxon | Av. abund I | Av. abund II | ||||
| Amphipoda indet. 1 | 12.50 | 16.10 | 7.09 | 1.21 | 9.98 | 9.98 |
| Leptochelia sp. | 8.40 | 4.55 | 4.61 | 1.04 | 6.50 | 16.49 |
| Amphipoda indet. 3 | 6.90 | 6.00 | 4.45 | 0.93 | 6.28 | 22.76 |
| Apseudomorpha sp. | 1.15 | 9.45 | 4.41 | 0.95 | 6.21 | 28.98 |
| Ceratonereis singularis | 2.00 | 8.70 | 3.98 | 1.29 | 5.61 | 34.58 |
| Ophiactis savigny | 10.60 | 8.15 | 3.83 | 1.19 | 5.39 | 39.97 |
| Actiniaria indet. 1 | 3.80 | 1.85 | 2.41 | 0.67 | 3.40 | 43.37 |
| Amphipoda indet. 3 | 0.00 | 3.90 | 2.15 | 0.55 | 3.04 | 46.41 |
| Odostomia grijalvae | 0.95 | 4.05 | 2.08 | 0.83 | 2.92 | 49.33 |
| Pseudotanais sp. | 3.40 | 1.40 | 1.87 | 0.85 | 2.63 | 51.96 |
| Amphipoda indet. 2 | 2.55 | 1.90 | 1.74 | 0.79 | 2.45 | 54.41 |
| Pycnogonida indet. 1 | 3.40 | 0.50 | 1.67 | 0.43 | 2.36 | 56.77 |
| Jaeropsis sp. | 1.60 | 1.80 | 1.21 | 1.03 | 1.70 | 58.47 |
| Ophiocoma cf. alexandri | 2.05 | 1.65 | 1.19 | 0.96 | 1.67 | 60.14 |
| Dissimilarity III vs. II | Average dissimilarity 65.61% | |||||
| Taxon | Av. abund III | Av. abund II | Av. dissim | Diss/SD | Contrib% | Cumul% |
| Amphipoda indet. 1 | 18.70 | 16.10 | 6.50 | 1.34 | 9.91 | 9.91 |
| Apseudomorpha sp. | 2.05 | 9.45 | 4.20 | 0.96 | 6.40 | 16.31 |
| Ophiactis savigny | 7.40 | 8.15 | 3.71 | 1.15 | 5.66 | 21.96 |
| Ceratonereis singularis | 7.05 | 8.70 | 3.28 | 1.28 | 4.99 | 26.96 |
| Amphipoda indet. 3 | 0.45 | 6.00 | 2.87 | 0.79 | 4.37 | 31.33 |
| Odostomia grijalvae | 3.90 | 4.05 | 2.76 | 0.78 | 4.21 | 35.54 |
| Amphipoda indet. 5 | 0.90 | 3.90 | 2.11 | 0.57 | 3.21 | 38.75 |
| Leptochelia sp. | 1.15 | 4.55 | 2.05 | 0.70 | 3.13 | 41.88 |
| Ophiocoma cf. alexandri | 2.30 | 2.05 | 1.50 | 1.01 | 2.28 | 44.16 |
| W. heterocirrata | 1.95 | 1.15 | 1.31 | 0.64 | 2.00 | 46.16 |
| Amphipoda indet. 2 | 1.35 | 1.90 | 1.24 | 0.65 | 1.89 | 48.08 |
| Paranthura sp. | 1.10 | 2.05 | 1.16 | 0.68 | 1.77 | 49.83 |
| Caprellidae indet. 1 | 1.30 | 1.60 | 1.10 | 1.03 | 1.68 | 51.50 |
| Actiniaria indet. 1 | 0.70 | 1.85 | 1.01 | 0.88 | 1.55 | 53.05 |
| Synalpheus sp. | 2.10 | 1.65 | 1.00 | 0.42 | 1.52 | 56.10 |
| Colanthura sp. | 0.85 | 2.00 | 0.97 | 1.06 | 1.47 | 57.57 |
| Amphipoda indet. 4 | 0.65 | 1.80 | 0.90 | 0.91 | 1.38 | 58.95 |
| Jaeropsis sp. | 1.25 | 1.40 | 0.87 | 0.91 | 1.33 | 60.28 |
| Dissimilarity III vs. I | Average dissimilarity = 72.50 | |||||
| Taxon | Av. abund II | Av. abund I | Av. dissim | Diss/SD | Contrib% | Cumul% |
| Amphipoda indet. 1 | 18.70 | 12.50 | 9.23 | 1.23 | 12.73 | 12.73 |
| Ophiactis savigny | 7.40 | 10.60 | 5.01 | 1.16 | 6.91 | 19.64 |
| Leptochelia sp. | 1.15 | 8.40 | 4.97 | 0.92 | 6.85 | 26.50 |
| Amphipoda indet. 3 | 0.45 | 6.90 | 3.71 | 0.69 | 5.11 | 31.61 |
| Ceratonereis singularis | 7.05 | 2.00 | 3.66 | 1.51 | 5.05 | 36.66 |
| Actiniaria indet. 1 | 0.70 | 3.80 | 2.61 | 0.57 | 3.60 | 40.26 |
| Pseudotanais sp. | 1.25 | 3.40 | 2.07 | 0.79 | 2.86 | 43.11 |
| Odostomia grijalvae | 3.90 | 0.95 | 2.06 | 0.55 | 2.84 | 45.95 |
| Pycnogonida indet. 1 | 0.80 | 3.40 | 2.00 | 0.45 | 2.76 | 48.71 |
| Amphipoda indet. 2 | 1.35 | 2.55 | 1.77 | 0.81 | 2.44 | 51.15 |
| Ophiocoma cf. alexandri | 2.30 | 1.65 | 1.62 | 1.00 | 2.23 | 53.38 |
| Apseudomorpha sp. | 2.05 | 1.15 | 1.45 | 0.85 | 2.00 | 55.39 |
| W. heterocirrata | 1.95 | 0.15 | 1.26 | 0.52 | 1.74 | 59.12 |
| Synalpheus sp. | 2.10 | 0.65 | 1.21 | 1.27 | 1.66 | 58.79 |
| Colanthura sp. | 1.65 | 0.10 | 1.16 | 0.38 | 1.60 | 60.39 |
Results of the SIMPER analysis with the percentage of contribution by taxon to the dissimilarity between pairs of aggregation levels—I: isolated, II: moderately, and III: highly aggregated.
Only the highest contributors are presented. Average abundances in which each species dominates as well as the highest diss/SD ratios are highlighted.
The mean abundance of each taxon by the levels of aggregation is also presented. Only the highest contributors are presented. Average abundances in which each species dominates as well as the highest diss/SD ratios are highlighted.
Effects of Rhodolith Complexity on the Faunal Composition
In addition to the effect of aggregation levels, an effect of rhodolith complexity on the composition of fauna species was observed (Table 9 and Figure 7B). The correspondence pattern of rhodolith complexity with faunal similarity differs from the pattern by aggregation levels. Based on the small change in the r-value with the partial Mantel test (Table 9), both predictors are additive effects in determining the faunal composition of the rhodoliths. Other factors, such as volume or rhodolith species, had no effect on fauna composition (Table 9).
Table 9
| Relationship of fauna composition with | Mantel test (r) | p-value |
|---|---|---|
| Aggregation levels | 0.176 | 0.001 |
| Complexity | 0.134 | 0.026 |
| Volume | 0.001 | 0.466 |
| Species of rhodolith | 0.031 | 0.193 |
| Relationship of fauna composition with | Partial Mantel test | p-value |
| Aggregation levels controlled by complexity | 0.175 | 0.001 |
| Complexity controlled by aggregation levels | 0.132 | 0.033 |
Mantel and partial Mantel test to determine the relationship of fauna and characteristics and aggregation of the rhodoliths (Isla del Coco).
Discussion
Rhodolith-Associated Macrofauna
This is the first time that rhodolith-associated fauna has been systematically studied in low latitudes in the Neotropical Pacific region. As a result, multiple taxa are new records for the region and five specimens found in this study are possibly new species. Rhodoliths in Isla del Coco National Park show particularly high levels of diversity with 145 taxa from 60 rhodoliths sampled, compared with the well-studied regions in the Gulf of California and Brazil. Steller et al. (2003) found 52 species of rhodolith-associated fauna based on three 30-m transects and five 1-m2 quadrats in the Gulf of California. In the same region, Hinojosa-Arango and Riosmena-Rodríguez (2004) found 104 species of macrofauna in 120 rhodoliths, and Neill et al. (2015) found less than 110 species of epibenthic fauna following a methodology similar to Steller et al. (2003). In northeast Brazil, Paraíba State, Costa et al. (2021) found 60 rhodolith-associated macrofaunal species with a method based on three 100-m2 quadrats placed each in three different beaches (there was no mention on the total number of rhodoliths sampled). Prata et al. (2017) reported, from the same state, 12 species of just echinoderms (we reported here only four species). Stelzer et al. (2021) sampled the eastern ecoregion of Brazil (more than 140 rhodoliths sampled) and reported 148 macrofaunal taxa, a value similar to Isla del Coco, but in more rhodoliths sampled. Taxa groups that dominated the faunal communities found in this study were crustaceans, polychaetes, and mollusks. Similarly, previous research has revealed that the abundance and diversity (richness) of crustaceans, polychaetes, and mollusks makes them dominant taxa in the rhodolith-associated benthic communities (Hinojosa-Arango and Riosmena-Rodríguez, 2004; Neill et al., 2015; Stelzer et al., 2021; Costa et al., 2021). Although more research on the rhodolith-associated communities in Isla del Coco is needed, these numbers could indicate that Isla del Coco rhodoliths have been altered only slightly by human activity and can therefore be used in future research as a reference for an unimpacted habitat.
Regarding the faunal composition, Isla del Coco rhodoliths harbor, in general terms, a similar faunal assemblage in comparison with major tropical marine environments having a similar temperature, depth, and substrate type, with the same taxon subgroups (gammarid amphipods, isopods, tanaidaceans, syllid, phyllodocid, and nereid polychaetes; gastropod mollusks; and ophiuroids) being the most abundant and diverse (Steller et al., 2003; Hinojosa-Arango and Riosmena-Rodríguez, 2004; Costa et al., 2021).
Some fishes found in rhodoliths were juveniles, which included two species of the economically important genus Lutjanus (snapper fish). Lutjanus argentiventris is known to have ontogenetic habitat shifts, with juveniles migrating from mangroves to continue their growth in shallow rocky reefs. Rhodoliths can have a similar role as those rocky reefs in the life history of these Lutjanus species, as a suitable habitat that offers protection to these fish (Aburto-Oropeza et al., 2009). Several amphipod and decapod crustaceans were found in reproductive pairs or had eggs or larvae (Appendix 2). These results support the role of rhodoliths as breeding and nursery sites for the species found in nearby environments as it has been found in several studies (Cudney-Bueno et al., 2008; Gagnon et al., 2012; Teichert, 2014; Jørgensbye and Halfar, 2017; Navarro-Mayoral et al., 2020). It also leads to questions about how the drivers of rhodolith-associated organism diversity affect reproduction in those organisms. Rhodolith structural complexity, rhodolith size, and intactness have been found to influence larval settlement and growth of some species (e.g., scallops) (Steller and Cáceres-Martínez, 2009). Certainly, further research on faunal reproduction and ontogenetic events in rhodolith beds is needed.
Rhodolith Bed Structure Effects on Macrofauna Richness, Abundance, and Total Biomass
Values of total biomass, richness, and abundance of the macrofauna were higher in moderately aggregated rhodoliths than in the other extremes of aggregation. These results suggest a similar pattern to that proposed by the intermediate disturbance hypothesis according to which the highest values of biodiversity are reached in habitats at intermediate scales of disturbance (Connell, 1978; Wilson, 1994).
Rhodolith density is known as one of the main drivers of biodiversity associated with rhodolith beds (Veras et al., 2020; Stelzer et al., 2021). When compared, high rhodolith nodule density supports higher biodiversity than those rhodoliths in less density (Stelzer et al., 2021). In tightly packed beds, rhodoliths are in contact with each other, and there is little room to grow or to have extensive branching which limits the heterogeneity of the nodule and its associated biodiversity. Patches composed of rhodoliths far apart from each other are exposed to more perturbations of the patch, which could lead to less diversity of associated fauna. Dispersed rhodoliths could have a higher chance of being buried by sediments for a longer period than aggregated ones and could be more susceptible to tidal wave disruption and foraging of big animals (e.g., rays). In experiments in which the stability of a rhodolith patch was artificially controlled (tied vs. untied rhodoliths), windier conditions (which led to bigger effects of waves on the rhodolith beds) significantly reduced the abundance and total biomass of motile rhodolith-associated fauna, although it had neutral effects on species richness, and rhodolith densities were not controlled in those experiments (Hinojosa-Arango et al., 2009). Dispersed and unstable rhodoliths that are subject to tidal changes have a lower overall abundance of organisms and lower species richness than more stable rhodoliths under the same controlled conditions. Interestingly, this effect is specifically on motile species, while sessile species, on the contrary, increase their abundance (Hinojosa-Arango et al., 2009). This pattern of changes in species richness and abundance due to shifts in substrate stability has also been noticed in other macrophytic-dominated systems, and mobile fauna is greatly affected by these shifts (Christie et al., 2009). Under the assumptions of the intermediate disturbance hypothesis, settlement of a great diversity of new organisms would be limited in isolated rhodoliths given the distance that larvae or other dispersion forms should travel to arrive in the next rhodolith (Dial and Roughgarden, 1998). Although there is evidence that rhodolith beds play an important role in the recruitment of larval forms of invertebrate species (Riosmena-Rodríguez and Medina-López, 2010), the effects of rhodolith aggregation degree on this recruitment have received little attention. Although in this study depth was a controlled variable, other relevant rhodolith-associated macrofaunal biodiversity drivers like macroalgal biomass, bioengineers, and bioerosion, and water motion, current velocity, light, or sedimentation were not measured or controlled, and they might influence the abundance, species richness, and total biomass (Pereira-Filho et al., 2015).
Rhodolith Bed Structure Effects on Total Faunal Biomass
Total biomass was also higher in the moderately aggregated rhodoliths. Our findings indicated that faunal biomass depends on the interaction between the aggregation level and the volume of the rhodoliths, with a higher average biomass/volume ratio in the moderately aggregated rhodoliths than in the two other levels. Regarding the volume effect, densely packed rhodoliths are limited in their growing capacity, leading to less voluminous rhodolith nodules, while moderately aggregated rhodoliths have sufficient space to grow and be more voluminous. The size of rhodolith has been recognized as another rhodolith-associated fauna biodiversity driver and as a factor that influences the total biomass (Veras et al., 2020). Why isolated rhodoliths in this study had the lowest average volume is more complex to explain. Isolated rhodoliths had a significantly lower mass, and they are lighter and may be more easily affected by water motion. Other factors, such as bioengineering damage, bioerosion, or sedimentation, that could hinder their growth could also play a role in affecting rhodolith size in these isolated patches, but these were not measured.
Rhodolith Bed Structure Effects on Overall Diversity and Faunal Composition
Macrofaunal diversity measured by the Shannon–Wiener index was higher in the moderately aggregated rhodoliths when this level of aggregation was compared with either of the two other levels. This was expected given the relationships found between the level of aggregation and the abundance and richness of macrofauna species. Moderately aggregated rhodoliths had a higher and better-distributed abundance in a greater number of species.
In this study, the SIMPER and ANOSIM analyses show how motile fauna is the one that contributes the most to the difference between aggregation levels, mainly highly motile fauna such as small crustaceans. This change in the faunal composition according to the density of rhodoliths also was found by Veras et al. (2020) in Fernando de Noronha Archipelago, Brazil, and by Stelzer et al. (2021) in the Eastern Marine Ecoregion of Brazil, and in these studies, a marked change in the faunal composition was detected between the macrofaunal assemblages of highly dense and low-density rhodolith nodules. In our study, the overall dissimilarity between each pair of aggregation levels shows the highest dissimilarity between the isolated and highly aggregated rhodoliths than between either combination of moderately aggregated rhodoliths (moderately vs. isolated or moderately vs. highly aggregated). This difference in the faunal composition, higher between the extremes (isolated vs. highly aggregated), is also noticed in the PCoA plot (Figure 7A). Rhodolith density has previously been demonstrated as a significant factor influencing the composition of macrofauna associated with rhodoliths, though it appears that not all taxa are equally affected. Certain groups of polychaetes, such as eunicids and phyllodocids, and gastropod mollusks, as well as most crustaceans and ophiuroids, in rhodoliths were better predicted by this factor (Costa et al., 2021).
The highest diversity occurs at moderate levels of rhodolith aggregation. The density of moderately aggregated rhodoliths is such that, despite being influenced by the movement or burial of the rhodoliths, they are not so far apart that continuous arrival of motile organisms is possible. In rhodolith beds in the Gulf of California, the increase in stability beyond a certain point results in a lower number of species (Hinojosa-Arango and Riosmena-Rodríguez, 2004). A rhodolith bed can be in different successional stages depending on the time and degree of previous alterations, as it occurs in other marine systems (Connell, 1978; Wilson, 1994). We hypothesize that rolling rhodoliths could cause disruption and instability for the epibionts, causing many of them to die and making room for new colonizers. When a rhodolith is buried for an extended period, the number of epibionts decreases. Unbranched bryozoans and boring mollusks, on the other hand, may survive despite such disturbances. There is a higher probability that forceful enough water movements (e.g., during storms) move more regularly low-density rhodoliths and that those highly aggregated rhodoliths are less affected by those water movements, but the mass and volume of rhodoliths are also implied in these probabilities (Bosellini and Ginsburg, 1971; Marrack, 1999; Basso et al., 2009).
Isolated rhodoliths present the dominance of just a few species. The migration of organisms commonly associated with hard substrates, such as many mollusks and polychaetes, from one rhodolith to another, can be too risky, and isolated rhodoliths are surrounded by sandy substrate. These organisms would need to embark on a relatively long path through the sandy seafloor, exposed to predators before encountering another suitable hard substrate.
In very aggregated rhodolith beds, there is the potential for a rapid and continuous interchange of organisms that soon reaches a dynamic equilibrium typical of a climax community. It has been proposed that good competitors displace good dispersers in rhodolith beds in stable zones, but good dispersers are dominant in unstable zones where usually good competitors cannot tolerate disturbance (Hinojosa-Arango et al., 2009). It has been found that densely aggregated rhodoliths could limit the amount of growth of branches and bioerosion in the external surfaces of rhodoliths and that a low density of rhodoliths would permit these rhodoliths to roll more easily and suffer more erosion and branch breaking, making them less complex in the outer surfaces (Hinojosa-Arango et al., 2009).
Effects of Rhodolith Complexity on Rhodolith-Associated Macrofauna Diversity
Eight hollow rhodoliths had fishes (only one additional fish was found in a non-hollow rhodolith). Extensive branching and crevices within the rhodoliths or hollow rhodoliths (rhodoliths with little cave-like spaces inside) are known to be relevant to small fishes (Teichert, 2014). The hollows can increase the rhodolith volume and complexity, providing small fish and other taxa with suitable habitats (Gagnon et al., 2012).
In the present study, no difference in the average complexity was found according to the levels of aggregation. There are rhodoliths within the entire range of complexity within each level of aggregation. During the dives, we observed that the rhodoliths at the highest aggregation remain within an immobile matrix. Their branches are intertwined. Rhodoliths with fewer branches remain within this array. In the less-dense bed zone, there is greater freedom for some disturbance (currents or macropredators) to mobilize, bury, or unearth them. Rhodoliths might represent a mix of early to later successional stages in the moderate density zone, in contrast with the pioneer colonized or opportunist species in isolated rhodoliths and dominant or stable species in the dense bed (Johnson, 1972). The moderate aggregation level is possibly more dynamic in the species turnover in the course of time, with migration into and out to the rhodolith bed as pointed out by Hinojosa-Arango et al. (2009). This pattern is similar to a dense forest that supports greater diversity when clear patches are formed (Connell, 1978); in the case of the moderately aggregated rhodoliths, there can be both soft bottom and hard bottom fauna, while in highly dense rhodoliths, species adapted to hard substrates dominated (Otero-Ferrer et al., 2019).
Rhodolith structure has proven to be relevant for the biodiversity of associated organisms (Steller et al., 2003; Gabara et al., 2018; Fredericq et al., 2019). In this study, within each aggregation level, more complex rhodoliths had a higher species richness and abundance of organisms, concordant with the results of Steller et al. (2003) that used branch density instead of perimeter variation as an indicator of complexity. The gradient in the complexity of rhodoliths also changes the composition of macrofauna additionally to the density of the rhodolith bed, similar to the experimental results by Otero-Ferrer et al. (2019).
The biomass of macrofauna was higher in more voluminous rhodoliths because they can harbor a higher number of organisms or animals of higher body size. Moderately aggregated rhodoliths had higher biomass per volume than in the other levels. Less voluminous isolated rhodoliths can be more easily disturbed or have less probability to be colonized within the sandy bottom, i.e., insufficient niche requirements (Grinnell, 1917; Hutchinson, 1959; Schoener, 1974). To explain the differences between moderately and highly aggregated relationships with the volume of the rhodoliths and biomass, more detailed methods of measuring the complexity and availability of outer and inner space of rhodoliths are needed. Otero-Ferrer et al. (2019) found that complexity and habitat source influence the colonizers in the assemblages in different rhodolith aggregations. Interspace can allow sediment retention in the sandy bottom and animals used them for food sources, but in dense rhodolith beds, the main use is to avoid predation. Novel computerized techniques, like microtomography, offer three-dimensional models of the outer and inner complexity of a rhodolith and may be an option for future research (Torrano-Silva et al., 2015).
Conclusions
Rhodolith beds of Isla del Coco display a rich and diverse associated fauna. Our results demonstrate that moderate aggregation in rhodolith beds favors a greater diversity of associated taxa as that density permits some variation in the successional stages on rhodoliths. Physical aggregation levels and morphological characteristic variation of rhodoliths influence faunal communities adding evidence to the role of these beds in providing background heterogeneity suitable for a myriad of organisms. Because of the presence of active reproduction, adults, and juvenile stages of several of the species associated with rhodoliths, future research could use these communities as models to study the aspects of reproduction and dispersal processes.
Research on rhodolith beds of Isla del Coco is a promising source of discoveries since only a small portion of these beds has been investigated in search of their associated fauna and their ecology. This research contributes to making evident the importance of rhodolith beds for biodiversity and the need to preserve such ecologically relevant habitats.
Publisher’s Note
All claims expressed in this article are solely those of the authors and do not necessarily represent those of their affiliated organizations, or those of the publisher, the editors and the reviewers. Any product that may be evaluated in this article, or claim that may be made by its manufacturer, is not guaranteed or endorsed by the publisher.
Statements
Data availability statement
The original contributions presented in the study are included in the article/Supplementary Material. Further inquiries can be directed to the corresponding author.
Ethics statement
Ethical review and approval was not required for the animal study.
Author contributions
AS-B, JS-C, and JC contributed to the conception and design of the study. JC collected the samples. AS-B analyzed the samples and organized the database. AS-B and JS-C performed the statistical analysis. AS-B and JC wrote the first draft of the manuscript. AS-B, JS-C, and JC wrote sections of the manuscript. All authors contributed to manuscript revision and read and approved the submitted version.
Acknowledgments
This project was funded by the Vicerrectoría de Investigación, Universidad de Costa Rica (projects 808-A6-155 and 808-B0-654) and the Consejo Nacional de Rectores de las Universidades Públicas de Costa Rica (CONARE, National Council of Public University Rectors). The authors thank Peter J. Auster (University of Connecticut) for his critical review of the manuscript.
Conflict of interest
The authors declare that the research was conducted in the absence of any commercial or financial relationships that could be construed as a potential conflict of interest.
Supplementary material
The Supplementary Material for this article can be found online at: https://www.frontiersin.org/articles/10.3389/fmars.2022.858416/full#supplementary-material
Supplementary Appendix 1List of organisms found in rhodoliths from Parque Nacional Isla del Coco, Costa Rica. Indet., Indertemined taxonomy; IC, Isla del Coco.
References
1
Aburto-Oropeza O. Dominguez-Guerrero I. Cota-Nieto J. Plomozo-Lugo T. (2009). Recruitment and Ontogenetic Habitat Shifts of the Yellow Snapper (Lutjanus Argentiventris) in the Gulf of California. Mar. Biol.156 (12), 2461–2472. doi: 10.1007/s00227-009-1271-5
2
Basso D. Nalin R. Nelson C. S. (2009). Shallow-Water Sporolithon Rhodoliths From North Island (New Zealand). Palaios24 (2), 92–103. doi: 10.2110/palo.2008.p08-048r
3
Bosellini A. Ginsburg R. N. (1971). Form and Internal Structure of Recent Algal Nodules (Rhodolites) From Bermuda. J. Geol.79 (6), 669–682. doi: 10.1007/978-90-481-2639-2_249
4
Christie H. Norderhaug K. M. Fredriksen S. (2009). Macrophytes as Habitat for Fauna. Mar. Ecol. Prog. Ser.396, 221–233. doi: 10.3354/meps08351
5
Connell J. H. (1978). Diversity in Tropical Rain Forests and Coral Reefs. Science199, 1302–1310. doi: 10.1126/science.199.4335.1302
6
Cortés J. (2012). Marine Biodiversity of an Eastern Tropical Pacific Oceanic Island, Isla Del Coco, Costa Rica. Rev. Biol. Trop.60 (3), 131–185. doi: 10.15517/RBT.V6013.28356
7
Cortés J. (2016). “Isla Del Coco: Coastal and Marine Ecosystems,” in Costa Rican Ecosystems. Ed. KappelleM. (Chicago and London: University of ChicagoPress), 162–191. doi: 10.1126/science.199.4335.1302
8
Costa D. A. de Lucena R. F. P. da Silva F. D. A. da Silva G. M. B. Massei K. Christoffersen M. L. et al . (2021). Importance of Rhodoliths as Habitats for Benthic Communities in Impacted Environments. Reg. Stud. Mar. Sci.48, 102055. doi: 10.1016/j.rsma.2021.102055
9
Crawley M. J. (2007). The R Book (Hoboken, New Jersey: John Wiley & Sons).
10
Cudney-Bueno R. Prescott R. Hinojosa-Huerta O. (2008). The Black Murex Snail, Hexaplex Nigritus (Mollusca, Muricidae), in the Gulf of California, Mexico: I. Reproductive Ecology and Breeding Aggregations. Bull. Mar. Sci.83, 285–298.
11
De Grave S. Whitaker A. (1999). A Census of Maërl Beds in Irish Waters. Aquat. Conserv. Mar. Freshw. Ecosyst.9, 303–311.
12
Dial R. Roughgarden J. (1998). Theory of Marine Communities: The Intermediate Disturbance Hypothesis. Ecology79, 1412–1424. doi: 10.2307/176752
13
Duerr S. B. (1994). Quick Estimation of Pebble Volumes. J. Sediment. Res.64, 677–679. doi: 10.1306/D4267E56-2B26-11D7-8648000102C1865D
14
Fredericq S. Krayesky-Self S. Sauvage T. Richards J. Kittle R. Arakaki N. et al . (2019). The Critical Importance of Rhodoliths in the Life Cycle Completion of Both Macro- and Microalgae, and as Holobionts for the Establishment and Maintenance of Marine Biodiversity. Front. Mar. Sci.5. doi: 10.3389/fmars.2018.00502
15
Fuad M. A. Z. (2010). Coral Reef Rugosity and Coral Biodiversity: Bunaken National Park-North Sulawesi, Indonesia. Tourism60, 14–18.
16
Gabara S. S. Hamilton S. L. Edwards M. S. Steller D. L. (2018). Rhodolith Structural Loss Decreases Abundance, Diversity, and Stability of Benthic Communities at Santa Catalina Island, CA. Mar. Ecol. Prog. Ser.595, 71–88. doi: 10.3354/MEPS12528
17
Gagnon P. Matheson K. Stapleton M. (2012). Variation in Rhodolith Morphology and Biogenic Potential of Newly Discovered Rhodolith Beds in Newfoundland and Labrador (Canada). Bot. Mar.55, 85–99. doi: 10.1515/bot-2011-0064
18
Graham D. J. Midgley N. G. (2000). Graphical Representation of Particle Shape Using Triangular Diagrams: An Excel Spreadsheet Method. Earth Surf. Process. Landforms25 (13), 1473–1477. doi: 10.1002/1096-9837(200012)25:13<1473::AID-ESP158>3.0.CO;2-C
19
Grinnell J. (1917). The Niche-Relationships of the California Thrasher. Auk34, 427–433. doi: 10.2307/4072271
20
Hammer Ø. Harper D. A. T. Ryan P. D. (2001). PAST: Paleontological Statistics Software Package for Education and Data Analysis. Palaeont. Electr.4, 1–9.
21
Hinojosa-Arango G. Maggs C. A. Johnson M. P. (2009). Like a Rolling Stone: The Mobility of Maerl (Corallinaceae) and the Neutrality of the Associated Assemblages. Ecology90, 517–528. doi: 10.1890/07-2110.1
22
Hinojosa-Arango G. Riosmena-Rodríguez R. (2004). Influence of Rhodolith-Forming Species and Growth-Form on Associated Fauna of Rhodolith Beds in the Central-West Gulf of California, México. Mar. Ecol.25, 109–127. doi: 10.1111/j.1439-0485.2004.00019.x
23
Hutchinson G. E. (1959). Homage to Santa Rosalia, or Why are There So Many Kinds of Animals? Amer. Natural.93, 145–159. doi: 10.1086/282070
24
Jørgensbye H. I. Ø. Halfar J. (2017). Overview of Coralline Red Algal Crusts and Rhodolith Beds (Corallinales, Rhodophyta) and Their Possible Ecological Importance in Greenland. Polar Biol.40, 517–531. doi: 10.1007/s00300-016-1975-1
25
Johnson R. G. (1972). “Conceptual Models of Benthic Marine Communities,” in Models in Paleobiology. Ed. SchopfT. J. M. (San Francisco, California: Freeman, Cooper & Co), 148–159.
26
Marrack E. C. (1999). The Relationship Between Water Motion and Living Rhodolith Beds in the Southwestern Gulf of California, Mexico. Palaios14, 159–171. doi: 10.2307/3515371
27
Navarro-Mayoral S. Fernandez-Gonzalez V. Otero-Ferrer F. Tuya F. (2020). Spatio-Temporal Variability of Amphipod Assemblages Associated With Rhodolith Seabeds. Mar. Freshwat. Res.72 (1), 76–83. doi: 10.1071/mf19360
28
Neill K. F. Nelson W. A. D’Archino R. Leduc D. Farr T. J. (2015). Northern New Zealand Rhodoliths: Assessing Faunal and Floral Diversity in Physically Contrasting Beds. Mar. Biodiv.45, 63–75. doi: 10.1007/s12526-014-0229-0
29
Otero-Ferrer F. Mannarà E. Cosme M. Falace A. Montiel-Nelson J. A. Espino F. et al . (2019). Early-Faunal Colonization Patterns of Discrete Habitat Units: A Case Study With Rhodolith-Associated Vagile Macrofauna. Estuar. Coast. Shelf Sci.218, 9–22. doi: 10.1016/j.ecss.2018.11.020
30
Prata J. Costa D. A. Manso C. L. C. Crispim M. C. Christoffersen M. L. (2017). Echinodermata Associated to Rhodoliths From Seixas Beach, State of Paraíba, Northeast Brazil. Biota Neotrop.17 (3), e20170363. doi: 10.1590/1676-0611-BN-2017-0363
31
Pereira-Filho G. H. Francini-Filho R. B. Pierozzi I. Jr. Pinheiro H. T. Bastos A. C. Leão de Moura R. et al . (2015). Sponges and Fish Facilitate Succession from Rhodolith Beds to Reefs. Bull. Mar. Sci.91, 45–46. doi: 10.5343/bms.2014.1067
32
Quinn J. Keough M. J. (2002). Experimental Design and Data Analysis for Biologists (Cambridge and New York: Cambridge University Press).
33
Riosmena-Rodríguez R. Medina-López M. A. (2010). The Role of Rhodolith Beds in the Recruitment of Invertebrate Species in the Southwestern Gulf of Mexico. All Flesh is Green, Plant-Animal. Eds. SeckbachJ.DubinskZ. (New York: Springer), 417–428.
34
Riosmena-Rodríguez R. Nelson W. Aguirre J. (2017). Rhodolith/Maërl Beds: A Global Perspective (Cham, Switzerland: Springer Int. Publ). 319 p.
35
Sánchez-Latorre C. Triay-Portella R. Cosme M. Tuya F. Otero-Ferrer F. (2020). Brachyuran Crabs (Decapoda) Associated With Rhodolith Beds: Spatio-Temporal Variability at Gran Canaria Island. Diversity12, 223. doi: 10.3390/d12060223
36
Schoener T. W. (1974). Resource Partitioning in Ecological Communities. Science185, 27–39. doi: 10.1126/science.185.4145.27
37
Steller D. L. Cáceres-Martínez C. (2009). Coralline Algal Rhodoliths Enhance Larval Settlement and Early Growth of the Pacific Calico Scallop Argopecten Ventricosus. Mar. Ecol. Prog. Ser.396, 49–60. doi: 10.3354/meps08261
38
Steller D. L. Riosmena-Rodríguez R. Foster M. S. Roberts C. A. (2003). Rhodolith Bed Diversity in the Gulf of California: The Importance of Rhodolith Structure and Consequences of Disturbance. Aquat. Conserv. Mar. Freshwat. Ecosyst.13, S5–S20. doi: 10.1002/aqc.564
39
Stelzer P. S. Mazzuco A. C. A. Gomes L. E. Martins J. Netto S. Bernardino A. F. (2021). Taxonomic and Functional Diversity of Benthic Macrofauna Associated With Rhodolith Beds in SE Brazil. PeerJ9, e11903. doi: 10.7717/peerj.11903
40
Teichert S. (2014). Hollow Rhodoliths Increase Svalbard´s Shelf Biodiversity. Nat. Scient. Rep.4, 1–5. doi: 10.1038/srep06972
41
Torrano-Silva B. N. Gomes-Ferreira S. Oliveira M. C. (2015). Unveiling Privacy: Advances in Microtomography of Coralline Algae. Micron72, 34–38. doi: 10.1016/j.micron.2015.02.004
42
Veras P. de C. Pierozzi I. Jr. Lino J. B. Amado-Filho G. M. de Senna A. R. et al . (2020). Drivers of Biodiversity Associated With Rhodolith Beds From Euphotic and Mesophotic Zones: Insights for Management and Conservation. Perspect. Ecol. Conserv.18, 37–43. doi: 10.1016/j.pecon.2019.12.003
43
Wilson J. B. (1994). The ‘Intermediate Disturbance Hypothesis’ of Species Coexistence is Based on Patch Dynamics. New Z. J. Ecol.18, 176–181.
44
Zar J. H. (1996). Biostatistical Analysis. 3rd Edition (New Jersey: Prentice-Hall). 716 p.
Summary
Keywords
rhodoliths, intermediate disturbance, epifauna, red algae, aggregation effects
Citation
Solano-Barquero A, Sibaja-Cordero JA and Cortés J (2022) Macrofauna Associated With a Rhodolith Bed at an Oceanic Island in the Eastern Tropical Pacific (Isla del Coco National Park, Costa Rica). Front. Mar. Sci. 9:858416. doi: 10.3389/fmars.2022.858416
Received
19 January 2022
Accepted
18 March 2022
Published
25 April 2022
Volume
9 - 2022
Edited by
Ana Cristina Rebelo, Instituto Hidrográfico, Portugal
Reviewed by
Scott Gabara, University of Alaska System, United States; Guilherme Henrique Pereira-Filho, Universidade Federal de São Paulo, Brazil
Updates
Copyright
© 2022 Solano-Barquero, Sibaja-Cordero and Cortés.
This is an open-access article distributed under the terms of the Creative Commons Attribution License (CC BY). The use, distribution or reproduction in other forums is permitted, provided the original author(s) and the copyright owner(s) are credited and that the original publication in this journal is cited, in accordance with accepted academic practice. No use, distribution or reproduction is permitted which does not comply with these terms.
*Correspondence: Jorge Cortés, jorge.cortes@ucr.ac.cr
This article was submitted to Marine Ecosystem Ecology, a section of the journal Frontiers in Marine Science
†ORCID: Alberto Solano-Barquero, orcid.org/0000-0002-8800-1205; Jeffrey A. Sibaja-Cordero, orcid.org/0000-0001-5323-356X; Jorge Cortés, orcid.org/0000-0001-7004-8649
Disclaimer
All claims expressed in this article are solely those of the authors and do not necessarily represent those of their affiliated organizations, or those of the publisher, the editors and the reviewers. Any product that may be evaluated in this article or claim that may be made by its manufacturer is not guaranteed or endorsed by the publisher.