Abstract
A trial was conducted to analyze the effect of the inclusion of yeast and spent grain obtained from breweries in feeds for rainbow trout (Oncorhynchus mykiss), taking into account the availability of these by-products, produced in large quantities in Europe. The ingredients were assayed in both dried and hydrolyzed format and compared with a commercial dried or hydrolyzed yeast. According to the results, the inclusion of 20% yeast and 15% spent grain in the feed, formulated with only 15% inclusion of fish meal, produced similar results in growth among all the groups, a food conversion significantly lower for the control and spent grain formulated feeds, and rainbow trout muscle composition similar to the fish fed with a control commercial feed and showed a protein digestibility of 87%–89% without differences with the commercial yeast. Hydrolysis of the ingredients had no effects on the protein digestibility of the feeds. Protein digestibility of the ingredients was lower for spent grain. An inclusion rate not higher than 15% for spent grain is recommended. These industrial by-products can be a good source to reduce the use of plant-based ingredients and increase the sustainability of both sectors, brewery industry, and aquaculture.
Introduction
According to Food and Agriculture Organization (FAO) statistics for 2020 total aquaculture production in 2018 accounted for 82.1 million tonnes (51.3 million inland and 30.8 million of marine aquaculture). The contribution of aquaculture to fish production reached 46% in 2018 with inland aquaculture, producing the highest quantities of farmed fish (57.2% of world total) mainly produced in freshwater (FAO, 2020). Whole fish and fish by-products are used in high quantities to produce fish meal and fish oil for animal feeding, and according to FAO, 2020, the sustainability of aquaculture depends on the use of other new ingredients to replace these fish-derived products. New ingredients need to be highly digestible to boost fish performance and reduce waste production, and they must be available in regular quantities and at competitive prices (Gatlin et al., 2007). Several protein sources have been used in recent years in experimental aquafeeds for freshwater and marine finfish, mostly derived from microalgae (Sarker et al., 2020) or insects (Cardinaletti et al., 2019; Randazzo et al., 2021a; Randazzo et al., 2021b). Terrestrial animal by-products have also been used although they are not considered acceptable by consumers (Naylor et al., 2009). As feed covers the largest cost of production in aquaculture that can reach 50%–70% of fish farmers production costs like in salmon (Ashe and Oglend, 2016), reducing the feed cost without compromising the quality or health of cultured fish may lead to a significant reduction in the total cost. That is the reason why, in the last decade, the interest in industrial by-products recovery, especially in those locally available and low-cost, to be used as alternative ingredients in feed, has increased significantly (Barrows et al., 2008).
More than 1.95 billion hectoliters of beer are produced worldwide (Conway, 2019), generating large amounts of organic waste, mostly spent yeast (BSY), and grain (BSG) that are considered high-quality ingredients for feeds due to their high content of protein, approximately 20% dry weight (DW) in the case of BSG (Robertson. et al., 2010; Aliyu and Bala, 2011; McCarthy et al., 2013) and 40%–50% DW for BSY (Mussatto. et al., 2006; Thomas and Rahman, 2006; Mussatto, 2009; Levic et al., 2010; Zhou et al., 2018).
In Europe (Eurostat, 2020) over 34 billion liters of beer containing alcohol were produced in 2020, equivalent to approximately 77 liters per inhabitant. BSG accounts for approximately 85% of all residues produced by the brewing industry (Aliyu and Bala, 2011), whereas BSY accounts for maximum 15% of total by-products generated (Kerby and Vriesekoop, 2017). These wastes from breweries are reused as terrestrial animal feed or for the production of bioethanol (Djuragic et al., 2010; Buffington, 2014). Several publications in recent years have identified these by-products as alternative ingredients in feeds for farmed fish in Europe (Oliva-Teles and Gonçalves, 2001; Cheng et al., 2004; Kaur and Saxena, 2004; Ozório et al., 2012; Castro et al., 2013; Sealey et al., 2014; Campos et al., 2018; Zhou et al., 2018; Zhang et al., 2018).
Brewers’ spent grain is the major (approximately 85% in weight) by-product of beer industry (Mussatto et al., 2006). It has been used not only as human and livestock food (Murdock et al., 1981; Faccenda et al., 2017; Mussato et al., 2014) but also as feed ingredient for the ongrowing of crustaceans (Muzinic et al., 2004) and fish (Yamamoto et al., 1994; Cheng et al., 2004; Kaur and Saxena, 2004; Campos et al., 2018; Jayant et al., 2018) due to its hight content in protein and fiber as well as lipids, minerals, and vitamins (Mussatto et al., 2006; Mussato et al., 2014).
Brewers’ spent yeast is the second largest by-product from brewing, and its disposal is considered an environmental problem. Several authors (Oliva-Teles and Gonçalves., 2001; Ebrahim and Abou-Seif, 2008; Ozório et al., 2012; Sealey et al., 2014) cited this by-product as a potential alternative to fish meal in the feed for cultured fish, porcine, and ruminants (Huige, 2006). Brewer’s yeast is a source of protein, vitamins, and minerals (Ovie and Eze, 2014), and other bioactive compounds such as β-glucans, mannan oligosaccharides, vitamins, minerals, and nucleic acids (Ferreira et al., 2010) are also present in high quantities in this by-product.
The digestibility of these two ingredients has already been published by Nazzaro et al. (2021). The main objectives of the present study were as follows: 1) to establish the inclusion rate of hydrolyzed and non-hydrolyzed BSG and BSY and 2) to validate their use as aquafeed ingredients for rainbow trout (Oncorhynchus mykiss), as a model for carnivorous freshwater fish.
Materials and methods
Ingredients and experimental diet preparation
Mahou San Miguel, a Spanish brewery located in Lérida (Spain), provided the by-products that were stabilized before its inclusion in aquafeeds as in Nazzaro et al. (2021) and hydrolyzed as in San Martin et al. (2020). Four ingredients were obtained: (1) dried spent yeast (DSY; Saccharomyces cerevisiae), (2) hydrolyzed spent yeast (HSY), (3) dried spent grain (DSG), and (4) hydrolyzed spent grain (HSG) with a moisture lower than 10%. A commercial dried and hydrolyzed yeast was obtained from Aplicaciones Biológicas a la Nutrición S.L. (ABN, Madrid, Spain), being included in the feeds at the same rate as BSY, to compare the digestibility of this commercial yeast with that obtained from BSY and to evaluate its effects on fish growth.
The diets were formulated and extruded (4-mm die diameter, 5- to 6-mm pellet diameter) at Institute of Agrifood Research and Technology (IRTA, Mas Bové, Tarragona, Spain). The extrusion (Rosal extruder, model RS50, Spain) was carried out at 700 rpm with a final temperature of 110°C at 140 kg/h using 20% water vapor to reach 85°C–90°C at precondition. The diets were formulated using a commercial fish meal (Super Prime 70 LT, Corpesca, Spain) to meet the nutritional requirements of rainbow trout (FAO, 2020) (Table 1). Yttrium oxide (Y2O3, Sigma Aldrich, Spain) was used as an inert marker (0.2 g kg−1) for the evaluation of digestibility. All the feeds were iso-proteic and iso-lipidic and were formulated including 10% and 20% of DSY, HSY, dried yeast from ABN company (DYABN), and hydrolyzed yeast from ABN (HYABN) and 7.5% and 15% of DSG and HSG to the basal mixture (Table 1). Feeds including the commercial yeast from ABN have the same formulation and inclusion rate (10% and 20%) than the feeds with brewery SY included. This new ingredients were included in the feeds replacing gluten and plant-derived meals.
Table 1
| Ingredient (g) | CTRL | DSY 10 | HSY 10 | DSY 20 | HSY 20 | DSG 7.5 | HSG 7.5 | DSG 15 | HSG 15 |
|---|---|---|---|---|---|---|---|---|---|
| Soy bean meal | 6.00 | 4.06 | 4.06 | 1.00 | 1.00 | 6.00 | 6.00 | 2.52 | 2.52 |
| Wheat gluten | 21.78 | 19.52 | 19.52 | 16.78 | 16.78 | 20.40 | 20.40 | 18.40 | 18.40 |
| Soycomealf | 17.00 | 17.00 | 17.00 | 17.00 | 17.00 | 17.00 | 17.00 | 17.00 | 17.00 |
| Fish meala | 15.00 | 15.00 | 15.00 | 15.00 | 15.00 | 15.00 | 15.00 | 15.00 | 15.00 |
| Fish oilc | 7.75 | 7.50 | 7.50 | 7.38 | 7.38 | 7.74 | 7.74 | 7.72 | 7.72 |
| Soya oil | 5.85 | 5.78 | 5.78 | 5.77 | 5.77 | 5.91 | 5.91 | 6.12 | 6.12 |
| Lutavit C Aquastab 35 % | 0.01 | 0.01 | 0.01 | 0.01 | 0.01 | 0.01 | 0.01 | 0.01 | 0.01 |
| Dicalcium Phosphateg | 0.83 | 0.70 | 0.70 | 0.65 | 0.65 | 0.75 | 0.75 | 0.65 | 0.65 |
| Choline chloridef | 0.27 | 0.27 | 0.27 | 0.27 | 0.27 | 0.27 | 0.27 | 0.27 | 0.27 |
| Lysine HCl | 0.36 | 0.09 | 0.09 | 0.20 | 0.20 | ||||
| Mineral mixd | 0.10 | 0.10 | 0.10 | 0.10 | 0.10 | 0.10 | 0.10 | 0.10 | 0.10 |
| Vitamin premixd | 0.10 | 0.10 | 0.10 | 0.10 | 0.10 | 0.10 | 0.10 | 0.10 | 0.10 |
| Wheat starchb | 15.95 | 16.77 | 16.77 | 13.60 | 13.60 | 17.66 | 17.66 | 14.65 | 14.65 |
| Soy lecithin | 2.00 | 2.00 | 2.00 | 2.00 | 2.00 | 2.00 | 2.00 | 2.00 | 2.00 |
| Ytrium oxidee | 0.02 | 0.02 | 0.02 | 0.02 | 0.02 | 0.02 | 0.02 | 0.02 | 0.02 |
| Brewer’s spent grain | 7.50 | 7.50 | 15.00 | 15.00 | |||||
| Brewer's spent yeast | 10.00 | 10.00 | 20.00 | 20.00 | |||||
| Total Fish meal | 15.00 | 15.00 | 15.00 | 15.00 | 15.00 | 15.00 | 15.00 | 15.00 | 15.00 |
| Total Vegetable meal | 44.78 | 40.58 | 40.58 | 34.78 | 34.78 | 50.90 | 50.90 | 52.92 | 52.92 |
| FM/FO | 15/7.7 | 15/7.5 | 15/7.5 | 15/7.4 | 15/7.4 | 15/7.7 | 15/7.7 | 15/7.7 | 15/7.7 |
| Crude protein (% DW) | 45.46 | 43.57 | 44.52 | 44.86 | 43.23 | 44.07 | 44.19 | 43.48 | 43.70 |
| Crude fat (%DW)) | 15.50 | 15.65 | 16.24 | 16.41 | 16.00 | 16.25 | 16.92 | 16.38 | 17.43 |
| Water (%) | 91.50 | 91.55 | 91.60 | 91.70 | 91.90 | 91.60 | 92.10 | 92.00 | 92.20 |
| Ash (%DW) | 5.30 | 5.35 | 5.70 | 5.80 | 5.60 | 5.65 | 5.70 | 5.30 | 5.50 |
Formulation of feeds used in the trial.
The same formulation was used for dried and hydrolyzed yeast and spent grain. Changes in corn gluten, wheat gluten, and soybean meal, to account for total plant meal inclusion, were made to ensure diets were isonitrogenous. CTRL, control diet; DSY, dried spent yeast; HSY: hydrolyzed spent yeast; DSG, dried spent grain; HSG, hydrolyzed spent grain; DYABN, dried commercial yeast from ABN; HYABN, hydrolyzed commercial yeast from ABN. Total vegetable meal includes the amounts of spent grain added to DSG and HSG feeds.
A. Super Prime LT fishmeal Corpesca, Chile.
B. Cargill, Brenntag, Spain.
C. Eurocoyal, Barcelona, Spain.
D. Tecnovit, Tarragona, Spain.
E. Sigma, Spain.
F. Andres Pintaluba S.A., Spain.
Fish rearing and fecal collection
Rainbow trout specimens were obtained from Aiguanatura dels Ports (Tarragona, Spain) transported to IRTA by road and kept in quarantine for 14 days and fed using the Premium commercial feed for rainbow trout from Skretting. Trouts were distributed in twenty-two 200-L fiber glass tronco-conical tanks with a purge system to collect uneaten feed pellets, in groups of 15 fish (body weight 77.90 ± 8.97 g) per tank. The tanks were supplied with filtered freshwater in a recirculation system (IRTAMar™) and maintained at 20°C with natural light and photoperiod and salinity of 1.5 ppt.
At the end of the trial, all the fish were individually weighted and the growth calculated using relative growth rate (RGR, %) and specific growth rate (SGR, %) as in the formula:
where Wi and Wf are the fish weight at the beginning (Wi) and at the end (Wf) of the feeding period, and t is the time (days) between Wf and Wi.
Five fish per tank were dissected, and liver was weighted to calculate hepatosomatic index (HSI) as in the following formula:
HSI = Weight of liver of fish/Body weight of fish × 100
The experimental diets were randomly assigned to the tanks and fed in triplicates, once per day, during 60 days using Arvotec (Finland) automatic feeders. The amount of feed was calculated according to the theoretical weight of the fish and the feeding tables provided by Skretting. Every day, the feed provided was registered, as well as the uneaten feed, collected every day from the bottom center drain of the tanks, dried in an oven for 24 h, and weighted to calculate feed conversion ratio (FCR) and protein efficiency ratio (PER).
In the case of the fish fed with ABN commercial yeast only, one replicate per treatment was used due to the high number of tanks used in the trial and because the main purpose of including this treatment was to compare the digestibility of both types of yeast (commercial vs. obtained from brewery).
Feces were collected by abdominal stripping (as described by Nazzaro et al., 2021) in anesthetized fish (MS 222, 47 ppm, 5-min exposure, Pharmaq, Spain), in alternate days during 2 weeks, to collect enough quantities for chemical and Ytrium analyses, before the final sampling and carried out in all the tanks fed with the control and brewery by-products ingredients. Fecal samples were freeze-dried and stored at −20°C until chemical analyses.
In the final sampling (day 60), five fish per tank were eviscerated, and the weight of viscera and liver was recorded. Samples of whole liver and muscle taken using a standardized cut (2 cm wide cut behind the dorsal fin on the left lateral side of the fish) were collected and kept at −20°C for biochemical analyses.
The ADCs of the experimental diets were calculated according to Maynard et al. (1979) using only the feeds with the highest inclusion rate (20% for DY and 15% for SG)
The ADCs of the test ingredients were estimated according to NRC (2011):
Where:
ADCtest = ADC (%) of the experimental diet;
ADCref = ADC (%) of the reference diet;
Dref = g/kg nutrient (or MJ/kg gross energy) of the reference diet (DM basis);
Ding = g/kg nutrient (or MJ/kg gross energy) of the test ingredient (DM basis).
Chemical analyses
The feces samples were dehydrated by freeze-drying (LyoAlfa 6, Telstar, USA) before chemical analyses to avoid nutritional losses or alterations. The biochemical analyses of the diets, ingredients, feces, and muscle and liver of the fish were performed in duplicates according to the standard methods of the Association of Official Analytical Chemists (AOAC, 2006). Dry matter (105°C for 14 h, AOAC 925.09), ash incineration in a muffle furnace (Nabertherm, Germany 500°C for 5 h, AOAC, 942.05), crude protein (Dumas’s procedure using Nitrogen analyser FP-528 Leco, USA, AOAC 968.06, with N correction factor of 6.25), and crude fat (Büchi Extraction System B-811, Switzerland, AOAC 920.39) were analyzed in all the samples obtained. Acid catalyzed transmethylation (Christie, 1982) and purification of methyl esters (TLC plates) were carried out before the fatty acid analysis carried out by gas–liquid chromatography (Thermo TraceGC, Villalta et al., 2005). Ytrium oxide content in diets and feces was determined according to Garantun-Tjeldsto et al. (2006) by inductively coupled plasma–mass spectrometry (Agilent Technologies 7700x).
Data analysis
All the biochemical analyses were carried out in duplicates using pooled samples of each tank. In the case of commercial yeast with only one replicate, the results were not considered in the comparisons among treatments.
Initial and final weight (n = 60), HSI (n = 3), growth rates (SGR and RGR, n = 3), feed conversion (FCR, n = 3), protein efficiency (PER, n = 3), biochemical composition of muscle and liver (n = 3), and apparent digestibility coefficient (ADC) data (n = 2) were tested for normality of variances using Levene’s test before being submitted to a one-way analyses of variance (ANOVA) using Sigma Plot 12.0 program (Systat Software, Inc., USA). The differences were considered statistically significant if P< 0.05 after using a Holm-Sidak post hoc test to perform pair wise comparisons of means.
Results
Table 1 shows the formulation and proximate composition of the feeds used in the study including brewery by-products, and the formulation used for the inclusion of spent yeast (SY) was also used for the formulation using yeast from a commercial company (ABN, Spain). Table 2 shows the composition of the brewery by-products used in the trial.
Table 2
| DSY | HSY | DSG | HSG | |
|---|---|---|---|---|
| Dry matter (DM, g/kg) | 941.90 | 890.50 | 920.00 | 981.10 |
| Ash (g/kg DM) | 42.36 | 43.46 | 39.13 | 61.05 |
| Crude protein (g/kg DM) | 478.50 | 463.11 | 247.07 | 217.92 |
| Crude fat (g/kg DM) | 3.74 | 5.01 | 84.23 | 116.81 |
| Gross energy (MJ/kg) | 19.90 | 19.92 | 21.69 | 20.65 |
| Phosphorus (g/kg DM) | 9.66 | 9.77 | 5.33 | 3.47 |
| Crude fiber (g/kg DM) | 6.79 | 6.96 | 187.83 | 165.94 |
| Starch (g/kg DM) | 218.60 | 225.15 | 39.02 | 34.96 |
| Vitamin B2 (ppm) | 2.76 | 5.61 | 0.43 | 1.43 |
| β-glucan (g/kg DM) | 80.9 | 90.4 | 0.88 | 0.00 |
| Essential amino acids (g/kg DM) | ||||
| Arginine | 25.16 | 23.81 | 12.83 | 10.70 |
| Histidine | 12.10 | 11.45 | 6.52 | 5.61 |
| Lysine | 31.74 | 28.86 | 9.57 | 7.34 |
| Threonine | 24.31 | 23.47 | 9.13 | 8.05 |
| Isoleucine | 23.46 | 22.68 | 10.22 | 8.05 |
| Leucine | 35.14 | 33.69 | 24.78 | 18.45 |
| Valine | 26.54 | 25.27 | 12.72 | 10.50 |
| Methionine | 8.17 | 7.75 | 5.11 | 3.87 |
| Phenylalanine | 23.04 | 22.46 | 14.46 | 11.31 |
| Non-essencial amino acids (g/kg DM) | ||||
| Tyrosine | 17.20 | 15.72 | 9.57 | 8.05 |
| Aspartic acid | 47.88 | 45.82 | 17.17 | 14.47 |
| Glutamic acid | 60.30 | 58.28 | 52.39 | 36.90 |
| Alanine | 29.41 | 28.30 | 15.11 | 11.72 |
| Glycine | 18.90 | 18.30 | 8.80 | 7.95 |
| Proline | 22.30 | 21.22 | 25.11 | 18.24 |
| Hydroxyproline | <0.3 | <0.3 | <0.3 | <0.3 |
| Serine | 25.37 | 24.26 | 11.20 | 8.77 |
Proximate composition and amino acid profile of the ingredients derived from the brewery industry [spent yeast (SY) and spent grain (SG)] dried (D) and hydrolyzed (H), used in the formulation of the feed.
Final weight was significantly higher for DSY and HSY groups (Table 3), although SGR and RGR were not significantly different among the groups of fish fed with brewery by-products (DSY, HSY, DSG, and HSG) included at two different levels and those fed with the control diet (CTRL). FCR and PER results were significantly lower for the CTRL and HSG-fed groups, whereas those fed with spent yeast (DSY and HSY) show the highest values.
Table 3
| Initial weight (g) | Final weight (g) | HSI | SGR | RGR | FCR | PER | ||||||||
|---|---|---|---|---|---|---|---|---|---|---|---|---|---|---|
| Av | SD | Av | SD | Av | SD | Av | SD | Av | SD | Av | SD | Av | SD | |
| CTRL | 79.33 | 8.65 | 174.28 | 34.56 b | 2.03 | 0.61 b | 1.29 | 0.05 | 119.44 | 6.67 | 1.29 | 0.05 b | 1.19 | 0.07 b |
| DSY10% | 77.10 | 9.33 | 217.88 | 48.84 a | 4.71 | 2.05 a | 1.70 | 0.19 | 200.95 | 8.53 | 1.81 | 0.05 a | 2.01 | 0.09 a |
| DSY20% | 77.42 | 10.07 | 219.68 | 28.75 a | 3.76 | 0.88 ab | 1.71 | 0.09 | 184.13 | 15.25 | 1.71 | 0.09 a | 1.84 | 0.15 a |
| HSY10% | 78.82 | 9.60 | 217.37 | 45.87 a | 4.26 | 1.28 ab | 1.66 | 0.05 | 175.33 | 8.80 | 1.66 | 0.05 a | 1.75 | 0.09 a |
| HSY20% | 77.56 | 9.67 | 222.80 | 31.48 a | 4.46 | 1.44 a | 1.73 | 0.04 | 187.30 | 7.42 | 1.73 | 0.04 a | 1.87 | 0.07 a |
| DSG7.5% | 77.95 | 8.80 | 193.38 | 37.55 ab | 2.94 | 1.51 ab | 1.49 | 0.11 | 148.11 | 16.11 | 1.49 | 0.11 ab | 1.48 | 0.16 ab |
| DSG15% | 77.63 | 7.52 | 192.90 | 29.14 ab | 2.88 | 0.88 ab | 1.49 | 0.03 | 148.48 | 5.30 | 1.49 | 0.03 ab | 1.48 | 0.05 ab |
| HSG7.5% | 77.39 | 8.79 | 178.40 | 38.85 b | 2.14 | 0.53 b | 1.37 | 0.04 | 130.66 | 5.53 | 1.37 | 0.03 b | 1.31 | 0.06 b |
| HSG15% | 77.92 | 8.37 | 175.73 | 39.02 b | 2.32 | 0.53 b | 1.33 | 0.15 | 125.08 | 20.14 | 1.33 | 0.15 b | 1.25 | 0.20 b |
| DYABN10% | 77.41 | 9.55 | 206.19 | 62.02 ab | 3.30 | 0.73 ab | 1.61 | 166.37 | 1.61 | 1.66 | ||||
| DYABN20% | 78.13 | 10.06 | 228.63 | 43.21a | 2.50 | 0.07 ab | 1.76 | 192.62 | 1.76 | 1.93 | ||||
| HYABN10% | 77.19 | 8.10 | 216.36 | 35.36 ab | 4.07 | 0.85 ab | 1.69 | 180.31 | 1.69 | 1.80 | ||||
| HYABN20% | 78.15 | 10.45 | 202.94 | 38.58 ab | 3.47 | 0.79 ab | 1.56 | 159.67 | 1.56 | 1.60 | ||||
| ANOVA | P < 0.001 | P < 0.001 | P=0.007 | P=0.07 | P < 0.001 | P < 0.001 | ||||||||
Initial and final weight of rainbow trout used in the inclusion trial (n = 60 per treatment) and results in hepatosomatic index (HSI; five fish per tank, n = 3), specific growth rate (SGR; n = 3), relative growth rate (RGR; n = 3), feed conversion ratio (FCR; n = 3), and protein efficiency ratio (PER; n = 3).
Different letters indicate statistically significant differences (ANOVA, P < 0.05, n = 3). CTRL, control diet; DSY, dried spent yeast; HSY, hydrolyzed spent yeast; DSG, dried spent grain; HSG, hydrolyzed spent grain; DYABN, dried commercial yeast from ABN; HYABN, hydrolyzed commercial yeast from ABN. Fish fed with commercial yeast from ABN were not included in the statistics; only one tank was used per treatment.
ADCs of the feeds and ingredients are shown in Table 4. Digestibility of protein was 86.6%–89.9% in the experimental diets, being higher in the case of CTRL. The ADC of lipids varied from 80.9% to 88.7%, and the lowest digestibility was found for CTRL and the highest for the spent yeast (both dried and hydrolyzed), although no significant differences were detected (ANOVA, P = 0.053, n = 2).
Table 4
| Apparent Digestibility of the Feed | |||||||
|---|---|---|---|---|---|---|---|
| CTRL | DSY 20% | HSY 20% | DSG 15% | HSG 15% | DYABN 20% | HYABN 20% | |
| Protein | 89.86±1.70 | 86.63±2.35 | 86.80±2.40 | 87.62±2.66 | 86.63±2.44 | 87.71±1.23 | 87.15±1.17 |
| Lipids | 80.87±1.67 | 87.44±1.76 | 88.65±1.65 | 84.20±1.81 | 82.07±1.53 | 85.86±2.05 | 86.14±2.06 |
| Apparent Digestibility Coefficients of Ingredients | |||||||
| DSY 20% | HSY 20% | DSG 15% | HSG 15% | DYABN 20% | HYABN 20% | ||
| Protein | 74.52±1.62a | 75.37±1.47a | 65.10±2.90b | 49.93±3.23c | 78.62±1.27a | 76.09±1.35a | |
Apparent digestibility coefficients of feeds and ingredients (Av±SD) used in the inclusion trial.
DSY: Dried spent yeast. HSY: Hydrolysed spent yeast. DSG: Dried spent grain. HSG: Hydrolysed spent grain. DYABN: Dried commercial yeast from ABN. HYABN: Hydrolysed commercial yeast from ABN. Different letters indicate significant differences (ANOVA, P<0.001, n=2).
Protein digestibility coefficients were higher than 75% for SY and the commercial yeast (YABN), whereas SG had statistically significant lower values between 50% and 65%. No improvement in digestibility of the ingredients was obtained after hydrolysis of yeast and spent grain.
Muscle and liver protein and lipid content results are shown in Table 5. A significantly higher protein content was recorded in the muscle of fish fed with HSY included at 20% and HYABN commercial yeast included at 10%, showing values approximately 71%–72%, and the lowest values were obtained in the fish from DSG, HSG, and CTRL groups. Lipids were higher in the muscle (10% lipids) of fish from DSY 20 group, whereas the lowest values were found in CTRL, HSG 7.5, and HYABN 10 (5.6% lipids). In the liver, the highest protein content (52%–54% DW) was recorded in DSG 7.5 and HSG 15 groups, whereas it was lower in those fed with DSY and HSY included at 10% and 20%, as well as in the fish fed with HYABN at 10%. Lipid content was higher in in the liver of fish fed with DYABN included at 10% (15.5% lipids) and lower in those fed with HSY at 10% (9% lipids) with the rest of the groups showing levels between 11% and 14%.
Table 5
| MUSCLE | LIVER | |||||||
|---|---|---|---|---|---|---|---|---|
| Total Lipids (% DW) | Protein (% DW) | Total Lipids (% DW) | Protein (% DW) | |||||
| Av | SD | Av | SD | Av | SD | Av | SD | |
| CTRL | 5.62 | 0.22 d | 62.13 | 0.57 c | 14.84 | 0.21 ab | 45.09 | 1.56 b |
| DSY 10% | 6.67 | 0.22 c | 69.83 | 3.27 ab | 11.02 | 0.21 c | 38.97 | 1.00 c |
| DSY 20% | 10.74 | 0.02 a | 64.97 | 0.98 abc | 11.34 | 0.57 c | 38.67 | 0.46 c |
| HSY 10% | 7.74 | 0.03 c | 64.66 | 1.82 abc | 9.59 | 0.14 d | 39.11 | 0.83 c |
| HSY 20% | 9.33 | 0.03 b | 72.3 | 3.00 a | 11.63 | 0.11 c | 39.75 | 0.18 c |
| DSG 7.5% | 8.88 | 0.39 b | 67.3 | 3.81 abc | 13.32 | 0.34 b | 52.14 | 0.33 a |
| DSG 15% | 7.24 | 0.05 c | 61.43 | 2.46 c | 13.87 | 0.14 b | 44.36 | 0.81 b |
| HSG 7.5% | 5.61 | 0.19 d | 60.47 | 3.64 c | 13.4 | 0.17 b | 48.66 | 1.67 b |
| HSY 15% | 8.13 | 0.35 bc | 68.43 | 0.80 abc | 14.42 | 0.47 b | 54.24 | 0.33 a |
| DYABN 10% | 9.35 | 0.54 b | 65.41 | 4.06 abc | 15.47 | 0.32 a | 47.17 | 0.36 b |
| DYABN 20% | 6.71 | 0.21 c | 62.08 | 0.64 b | 11.6 | 0.03 c | 41.58 | 1.25bc |
| HYABN 10% | 5.63 | 0.23 d | 71.05 | 1.08 a | 10.97 | 0.01 c | 38.65 | 1.08 c |
| HYABN 20% | 9.16 | 0.32 b | 62.75 | 2.89 b | 11.97 | 0.28 c | 45.93 | 0.01 b |
| ANOVA | P<0.001 | P<0.001 | P<0.001 | P<0.001 | ||||
Protein and lipid content (% dry weight. DW) of the muscle and liver of rainbow trout fed the experimental diets.
Different letters indicate significant differences (ANOVA, P<0.05, n=3). DSY: Dried spent yeast, HSY: Hydrolysed spent yeast, DSG: Dried spent grain, HSG: Hydrolysed spent grain, DYABN: Dried commercial yeast from ABN, HYABN: Hydrolysed commercial yeast from ABN.
Tables 6 , 7, 8 show the fatty acid profile of feeds, muscle, and liver, respectively. Muscle and liver fatty acid content reflected the fatty acid composition of the feeds used. Figure 1 summarizes the fatty acid profile of the muscle with all the groups showing similar profiles although the muscle of fish fed with spent yeast (dried or hydrolyzed) included at 20% shows a lower N-3 PUFA content and higher MUFA, the fish fed with spent grain show higher levels of N-6, and those fed with DSY included at 10% show a profile closer to the CTRL.
Table 6
| CTRL | DSY 10% | DSY 20% | HSY 10 % | HSY 20% | DSG 7.5% | DSG 15% | HSG 7.5% | HSG 15% | DYABN 10% | DYABN 20% | HYABN 10% | HYABN 20% | ||||||||||||||
|---|---|---|---|---|---|---|---|---|---|---|---|---|---|---|---|---|---|---|---|---|---|---|---|---|---|---|
| Av | SD | Av | SD | Av | SD | Av | SD | Av | SD | Av | SD | Av | SD | Av | SD | Av | SD | Av | SD | Av | SD | Av | SD | Av | SD | |
| Total FAs (mg/g Lipids) | 614.69 | 27.91 | 614.24 | 2.31 | 604.38 | 1.19 | 616.51 | 6.75 | 632.68 | 0.62 | 619.25 | 0.72 | 607.02 | 13.15 | 606.12 | 6.07 | 640.44 | 1.47 | 541.24 | 18.19 | 597.55 | 36.97 | 552.15 | 11.87 | 561.70 | 30.71 |
| 14:0 | 1.67 | 0.15 | 1.07 | 0.14 | 1.16 | 0.34 | 1.50 | 0.00 | 1.36 | 0.00 | 1.45 | 0.34 | 1.31 | 0.01 | 1.33 | 0.29 | 1.25 | 0.06 | 1.30 | 0.04 | 1.18 | 0.06 | 1.05 | 0.26 | 1.06 | 0.23 |
| 16:0 | 18.80 | 0.10 | 17.54 | 0.63 | 17.53 | 0.68 | 18.68 | 0.16 | 17.70 | 0.10 | 18.08 | 0.10 | 18.03 | 0.01 | 18.26 | 0.69 | 17.87 | 0.23 | 17.58 | 0.46 | 17.69 | 0.14 | 17.10 | 0.17 | 17.65 | 0.08 |
| 18:0 | 4.68 | 0.37 | 4.14 | 0.25 | 4.10 | 0.04 | 4.14 | 0.13 | 3.86 | 0.06 | 4.04 | 0.16 | 3.95 | 0.07 | 4.14 | 0.04 | 4.11 | 0.04 | 3.99 | 0.07 | 4.59 | 0.16 | 4.17 | 0.26 | 4.51 | 0.14 |
| 22:0 | 0.26 | 0.02 | 0.24 | 0.02 | 0.22 | 0.04 | 0.24 | 0.01 | 0.29 | 0.09 | 0.26 | 0.01 | 0.28 | 0.00 | 0.24 | 0.07 | 0.28 | 0.02 | 0.22 | 0.00 | 0.21 | 0.04 | 0.25 | 0.03 | 0.24 | 0.01 |
| Total SAT | 25.96 | 0.32 a | 23.59 | 0.87 ab | 23.67 | 1.02 ab | 25.33 | 0.27 ab | 23.33 | 0.12 ab | 24.25 | 0.37ab | 24.11 | 0.07 ab | 24.32 | 0.80 ab | 24.15 | 0.26 ab | 23.73 | 0.33 ab | 24.32 | 0.02 ab | 23.12 | 0.29 b | 23.80 | 0.53 ab |
| 16:1 | 2.67 | 0.16 | 2.58 | 0.11 | 2.73 | 0.04 | 3.40 | 0.37 | 3.09 | 0.38 | 2.50 | 0.18 | 2.45 | 0.23 | 2.47 | 0.17 | 2.30 | 0.00 | 2.84 | 0.27 | 2.83 | 0.16 | 2.51 | 0.03 | 2.87 | 0.01 |
| 18:1n-9 | 24.31 | 1.81 | 24.27 | 0.63 | 24.67 | 0.38 | 24.46 | 0.45 | 24.70 | 0.17 | 23.91 | 0.07 | 23.74 | 0.66 | 23.54 | 0.12 | 23.78 | 0.09 | 24.43 | 0.45 | 24.49 | 0.01 | 24.79 | 0.07 | 24.53 | 0.33 |
| Total MUFA | 28.39 | 1.85 | 28.14 | 0.58 | 28.54 | 0.46 | 29.41 | 0.93 | 29.01 | 0.25 | 27.63 | 0.27 | 27.43 | 1.02 | 27.26 | 0.06 | 27.36 | 0.21 | 28.46 | 0.14 | 28.46 | 0.20 | 28.52 | 0.08 | 28.61 | 0.24 |
| 18:2n-6 | 33.27 | 0.92 | 33.66 | 0.20 | 33.67 | 0.51 | 29.37 | 0.05 | 33.40 | 0.78 | 34.99 | 0.19 | 35.36 | 0.57 | 35.38 | 0.74 | 36.19 | 0.29 | 33.66 | 0.04 | 32.97 | 0.09 | 34.15 | 0.06 | 33.45 | 0.62 |
| 18:3n-6 | 0.61 | 0.07 | 0.43 | 0.02 | 0.36 | 0.07 | 0.61 | 0.28 | 0.43 | 0.09 | 0.29 | 0.04 | 0.40 | 0.01 | 0.33 | 0.09 | 0.35 | 0.02 | 0.40 | 0.17 | 0.40 | 0.08 | 0.71 | 0.26 | 0.37 | 0.04 |
| 20:4n-6 | 0.32 | 0.05 | 0.33 | 0.01 | 0.34 | 0.04 | 0.29 | 0.02 | 0.27 | 0.03 | 0.28 | 0.03 | 0.28 | 0.01 | 0.24 | 0.03 | 0.34 | 0.00 | 0.27 | 0.00 | 0.34 | 0.03 | 0.33 | 0.01 | ||
| Total n-6 PUFA | 33.88 | 0.98 b | 34.41 | 0.27 b | 34.35 | 0.43 b | 30.32 | 0.37 c | 34.12 | 0.67 b | 35.56 | 0.12 a | 36.04 | 0.59 a | 35.99 | 0.64 a | 36.78 | 0.30 a | 34.40 | 0.14 b | 33.64 | 0.17 b | 35.20 | 0.30 a | 34.16 | 0.67 b |
| 18:3n-3 | 3.01 | 0.16 | 3.25 | 0.05 | 3.33 | 0.04 | 3.12 | 0.21 | 3.25 | 0.02 | 3.38 | 0.12 | 3.15 | 0.06 | 3.36 | 0.12 | 3.31 | 0.02 | 3.10 | 0.19 | 3.34 | 0.05 | 3.25 | 0.11 | 3.28 | 0.05 |
| 20:5n-3 | 3.45 | 0.64 b | 4.20 | 0.05 ab | 3.91 | 0.12 ab | 4.73 | 0.10 a | 4.16 | 0.44 ab | 3.64 | 0.16 b | 3.39 | 0.16 b | 3.65 | 0.06 b | 3.22 | 0.28 b | 3.95 | 0.02 ab | 3.95 | 0.17 ab | 3.76 | 0.29 ab | 3.99 | 0.23 ab |
| 22:6n-3 | 5.27 | 0.38 b | 6.31 | 0.11 a | 6.16 | 0.02 a | 7.05 | 0.03 a | 6.09 | 0.10 a | 5.44 | 0.39 b | 5.73 | 0.54 ab | 5.37 | 0.15 b | 5.14 | 0.05 b | 6.21 | 0.18 a | 6.08 | 0.22 a | 6.04 | 0.18 a | 6.00 | 0.08 a |
| Total n-3 PUFA | 11.73 | 1.19 b | 13.83 | 0.02 ab | 13.40 | 0.15 ab | 14.90 | 0.29 a | 13.49 | 0.53 ab | 12.52 | 0.75 b | 12.37 | 0.35 b | 12.38 | 0.09 b | 11.68 | 0.35 b | 13.37 | 0.33 ab | 13.54 | 0.04 ab | 13.11 | 0.66 ab | 13.39 | 0.10 ab |
| Total PUFA | 45.61 | 2.17 | 48.23 | 0.29 | 47.76 | 0.57 | 45.22 | 0.66 | 47.61 | 0.15 | 48.08 | 0.63 | 48.41 | 0.94 | 48.37 | 0.73 | 48.45 | 0.05 | 47.77 | 0.19 | 47.18 | 0.21 | 48.31 | 0.37 | 47.55 | 0.77 |
Fatty acid composition (% of total FAs, only main fatty acids and totals are included) of the feeds used in the trial.
Different letters indicate significant differences (ANOVA, P<0.05, n=3). DSY: Dried spent yeast, HSY: Hydrolysed spent yeast, DSG: Dried spent grain, HSG: Hydrolysed spent grain, DYABN: Dried commercial yeast from ABN, HYABN: Hydrolysed commercial yeast from ABN.
Table 7
| CTRL | DSY 10% | DSY 20% | HSY 10% | HSY 20% | DSG 7.5% | DSG 15% | HSG 7.5% | HSG 15% | DYABN 10% | DYABN 20% | HYABN 10% | HYABN 20% | ||||||||||||||
|---|---|---|---|---|---|---|---|---|---|---|---|---|---|---|---|---|---|---|---|---|---|---|---|---|---|---|
| Av | SD | Av | SD | Av | SD | Av | SD | Av | SD | Av | SD | Av | SD | Av | SD | Av | SD | Av | SD | Av | SD | Av | SD | Av | SD | |
| Total FAs (mg/g Lipids) | 634.92 | 5.71 | 612.17 | 7.80 | 650.01 | 21.16 | 654.08 | 17.07 | 643.00 | 7.31 | 648.14 | 8.07 | 630.52 | 27.46 | 657.32 | 12.91 | 659.71 | 12.91 | 622.60 | 6.81 | 661.74 | 3.10 | 648.85 | 12.06 | 608.02 | 7.72 |
| 16:0 | 20.09 | 0.57 | 20.95 | 0.06 | 20.03 | 0.08 | 21.71 | 0.25 | 20.27 | 0.47 | 21.15 | 0.27 | 19.65 | 0.07 | 20.70 | 0.15 | 20.23 | 0.25 | 20.16 | 0.00 | 20.28 | 0.67 | 21.42 | 0.34 | 20.35 | 0.16 |
| 18:0 | 4.92 | 0.12 | 4.75 | 0.05 | 5.07 | 0.07 | 4.93 | 0.12 | 5.26 | 0.13 | 4.80 | 0.09 | 4.90 | 0.02 | 4.72 | 0.03 | 4.89 | 0.06 | 5.00 | 0.24 | 4.90 | 0.13 | 5.02 | 0.12 | 5.21 | 0.07 |
| Total SAT | 27.03 | 0.40c | 28.18 | 0.13bc | 27.45 | 0.06c | 29.30 | 0.19a | 28.03 | 0.66b | 28.58 | 0.14bc | 26.76 | 0.04c | 27.64 | 0.30c | 27.31 | 0.22c | 27.61 | 0.10c | 27.36 | 1.07bc | 28.84 | 0.19b | 27.86 | 0.28bc |
| 16:1 | 2.70 | 0.15 | 3.94 | 0.02 | 4.12 | 0.05 | 4.60 | 0.12 | 4.05 | 0.16 | 3.81 | 0.04 | 2.91 | 0.04 | 3.03 | 0.17 | 2.89 | 0.02 | 4.43 | 0.08 | 3.42 | 0.12 | 3.50 | 0.07 | 4.06 | 0.05 |
| 18:1n-9 | 21.94 | 0.83 | 21.66 | 0.14 | 26.02 | 0.22 | 23.08 | 0.30 | 24.81 | 0.23 | 23.42 | 0.05 | 22.10 | 0.38 | 21.43 | 0.12 | 22.48 | 0.16 | 24.51 | 0.19 | 23.21 | 0.11 | 20.27 | 0.07 | 25.93 | 0.10 |
| 18:1n-7 | 2.73 | 0.12 | 3.16 | 0.13 | 3.51 | 0.07 | 3.68 | 0.16 | 3.52 | 0.28 | 3.16 | 0.36 | 3.15 | 0.27 | 2.68 | 0.66 | 3.13 | 0.30 | 3.38 | 0.06 | 2.99 | 0.35 | 2.93 | 0.04 | 3.26 | 0.21 |
| Total MUFA | 28.64 | 0.89c | 30.07 | 0.06c | 35.22 | 0.23a | 32.81 | 0.25b | 33.93 | 0.62ab | 31.73 | 0.38bc | 29.52 | 0.05c | 28.42 | 0.39c | 29.78 | 0.17c | 33.75 | 0.16ab | 31.07 | 0.31b | 28.07 | 0.18c | 34.81 | 0.31a |
| 18:2n-6 | 19.21 | 0.35 | 18.67 | 0.01 | 19.62 | 0.29 | 16.06 | 0.04 | 19.68 | 0.43 | 20.49 | 0.22 | 21.06 | 0.10 | 21.11 | 0.00 | 21.53 | 0.19 | 18.93 | 0.30 | 17.91 | 1.10 | 16.78 | 0.37 | 18.78 | 0.14 |
| 20:4n-6 | 1.02 | 0.02 | 0.76 | 0.00 | 0.70 | 0.04 | 0.79 | 0.05 | 0.67 | 0.03 | 0.76 | 0.06 | 0.82 | 0.00 | 0.94 | 0.04 | 0.72 | 0.09 | 0.68 | 0.02 | 0.87 | 0.21 | 0.96 | 0.01 | 0.72 | 0.02 |
| Total n-6 PUFA | 20.98 | 0.27b | 19.80 | 0.03c | 20.74 | 0.22b | 17.26 | 0.08c | 20.74 | 0.46ab | 21.81 | 0.29a | 22.38 | 0.10a | 22.61 | 0.01a | 22.80 | 0.25a | 19.95 | 0.30c | 19.14 | 1.30c | 18.12 | 0.41c | 19.94 | 0.05c |
| 18:3n-3 | 1.87 | 0.07 | 2.03 | 0.02 | 2.09 | 0.12 | 1.78 | 0.04 | 1.99 | 0.18 | 2.06 | 0.06 | 2.14 | 0.05 | 1.89 | 0.02 | 2.12 | 0.11 | 2.07 | 0.03 | 2.23 | 0.11 | 1.80 | 0.10 | 2.03 | 0.01 |
| 20:4n-3 | 0.39 | 0.03 | 0.31 | 0.02 | 0.33 | 0.00 | 0.28 | 0.01 | 0.29 | 0.01 | 0.26 | 0.01 | 0.33 | 0.04 | 0.28 | 0.05 | 0.28 | 0.01 | 0.29 | 0.01 | 0.29 | 0.01 | 0.32 | 0.00 | 0.26 | 0.01 |
| 20:5n-3 | 2.87 | 0.23 a | 2.23 | 0.09c | 1.79 | 0.06d | 2.20 | 0.10c | 1.93 | 0.02cd | 2.30 | 0.00c | 2.37 | 0.00c | 2.56 | 0.05b | 2.18 | 0.10c | 1.85 | 0.03d | 2.19 | 0.08c | 2.45 | 0.03b | 1.76 | 0.03d |
| 22:5n-3 | 0.92 | 0.01 | 0.75 | 0.06 | 0.63 | 0.00 | 0.71 | 0.07 | 0.67 | 0.02 | 0.76 | 0.04 | 0.78 | 0.02 | 0.84 | 0.01 | 0.73 | 0.00 | 0.61 | 0.03 | 0.76 | 0.03 | 0.72 | 0.02 | 0.62 | 0.01 |
| 22:6n-3 | 16.81 | 1.25b | 16.11 | 0.42b | 11.27 | 0.23c | 15.15 | 0.44b | 11.88 | 0.66c | 11.91 | 0.07c | 15.18 | 0.11b | 15.17 | 0.15b | 14.25 | 0.05b | 13.46 | 0.26bc | 16.39 | 0.45b | 19.25 | 0.89a | 12.25 | 0.02c |
| Total n-3 PUFA | 23.35 | 1.56a | 21.95 | 0.22b | 16.59 | 0.04c | 20.63 | 0.36b | 17.31 | 0.82c | 17.89 | 0.22a | 21.35 | 0.09b | 21.33 | 0.08b | 20.11 | 0.30b | 18.72 | 0.32 | 22.39 | 0.55 | 24.97 | 0.76 | 17.39 | 0.01 |
| Total PUFA | 44.33 | 1.29 | 41.75 | 0.19 | 37.33 | 0.18 | 37.88 | 0.44 | 38.04 | 1.28 | 39.70 | 0.51 | 43.73 | 0.01 | 43.94 | 0.09 | 42.91 | 0.05 | 38.67 | 0.02 | 41.53 | 0.75 | 43.09 | 0.35 | 37.33 | 0.04 |
| DHA/EPA | 5.85 | 0.03a | 7.24 | 0.49b | 6.31 | 0.34ab | 6.90 | 0.52a | 6.16 | 0.42ab | 5.17 | 0.03a | 6.42 | 0.04ab | 5.93 | 0.18ab | 6.54 | 0.27ab | 7.27 | 0.001b | 7.48 | 0.46b | 7.86 | 0.45b | 6.94 | 0.14b |
| EPA/ARA | 2.81 | 0.16 | 2.95 | 0.12 | 2.56 | 0.22 | 2.78 | 0.31 | 2.89 | 0.17 | 3.05 | 0.24 | 2.90 | 0.01 | 2.72 | 0.05 | 3.04 | 0.50 | 2.74 | 0.03 | 2.58 | 0.53 | 2.54 | 0.04 | 2.44 | 0.11 |
| n-3/n-6 | 1.11 | 0.09b | 1.11 | 0.01b | 0.80 | 0.01a | 1.20 | 0.01b | 0.83 | 0.02a | 0.82 | 0.00a | 0.95 | 0.01a | 0.94 | 0.00a | 0.88 | 0.02a | 0.94 | 0.03a | 1.17 | 0.11b | 1.38 | 0.07c | 0.87 | 0.00a |
Fatty acid composition (% of total FAs, only main fatty acids and totals are included) of the muscle of the fish collected at the end of the trial.
Different letters indicate significant differences (ANOVA, P<0.05, n=3). DSY: Dried spent yeast, HSY: Hydrolysed spent yeast, DSG: Dried spent grain, HSG: Hydrolysed spent grain, DYABN: Dried commercial yeast from ABN, HYABN: Hydrolysed commercial yeast from ABN
Table 8
| CTRL | DSY 10% | DSY 20% | HSY 10% | HSY 20% | DSG 7.5% | DSG 15% | HSG 7.5% | HSG 15% | DYABN 10% | DYABN 20% | HYABN 10% | HYABN 20% | ||||||||||||||
|---|---|---|---|---|---|---|---|---|---|---|---|---|---|---|---|---|---|---|---|---|---|---|---|---|---|---|
| Av | SD | Av | SD | Av | SD | Av | SD | Av | SD | Av | SD | Av | SD | Av | SD | Av | SD | Av | SD | Av | SD | Av | SD | Av | SD | |
| Total FAs (mg/g Lipids) | 538.51 | 4.70 | 512.01 | 2.37 | 542.67 | 4.44 | 525.88 | 6.76 | 524.95 | 5.35 | 522.46 | 6.73 | 523.34 | 10.17 | 538.31 | 1.86 | 524.15 | 3.97 | 531.38 | 2.20 | 539.89 | 21.46 | 569.52 | 7.86 | 578.82 | 13.70 |
| 16:0 | 16.80 | 0.21 | 15.28 | 0.23 | 15.38 | 0.10 | 16.76 | 0.19 | 15.73 | 1.06 | 18.33 | 0.19 | 19.51 | 0.26 | 18.69 | 0.54 | 20.23 | 0.59 | 20.90 | 0.91 | 18.12 | 0.46 | 15.84 | 0.09 | 15.61 | 0.41 |
| 18:0 | 7.48 | 0.36 | 7.14 | 0.19 | 7.48 | 0.07 | 7.24 | 0.00 | 7.08 | 0.08 | 8.94 | 0.14 | 8.85 | 0.14 | 8.23 | 0.05 | 9.53 | 0.05 | 9.94 | 0.14 | 8.06 | 0.04 | 6.91 | 0.14 | 8.01 | 0.01 |
| Total SAT | 25.30 | 0.53b | 23.87 | 0.07b | 23.88 | 0.13b | 25.29 | 0.28b | 24.11 | 1.50b | 28.29 | 0.37ab | 29.37 | 0.25ab | 27.83 | 0.68ab | 30.74 | 0.57a | 32.04 | 1.17a | 27.01 | 0.64ab | 24.03 | 0.21b | 24.45 | 0.43b |
| 16:1 | 1.35 | 0.08 | 3.26 | 0.10 | 2.71 | 0.04 | 2.46 | 0.03 | 2.65 | 0.26 | 1.78 | 0.07 | 1.99 | 0.14 | 1.66 | 0.09 | 1.46 | 0.06 | 3.85 | 0.69 | 1.91 | 0.46 | 2.97 | 0.12 | 2.31 | 0.28 |
| 18:1n-9 | 13.44 | 0.62 | 17.44 | 0.10 | 16.67 | 0.21 | 15.81 | 0.14 | 17.67 | 0.23 | 14.11 | 0.19 | 18.61 | 0.36 | 14.40 | 0.15 | 15.22 | 0.42 | 24.75 | 0.45 | 15.53 | 0.27 | 15.83 | 0.10 | 14.38 | 0.07 |
| 18:1n-7 | 2.05 | 0.00 | 3.08 | 0.04 | 2.97 | 0.19 | 3.30 | 0.00 | 2.82 | 0.16 | 2.46 | 0.12 | 2.69 | 0.05 | 2.40 | 0.23 | 2.44 | 0.21 | 3.85 | 0.03 | 2.79 | 0.22 | 3.13 | 0.04 | 2.45 | 0.11 |
| Total MUFA | 19.49 | 0.99c | 26.49 | 0.01b | 25.43 | 0.02b | 25.59 | 0.21b | 26.36 | 0.21b | 21.09 | 0.11bc | 25.96 | 0.45b | 20.59 | 0.37c | 21.48 | 0.69bc | 36.24 | 1.17a | 23.26 | 0.65b | 24.82 | 0.04b | 21.98 | 0.05bc |
| 18:2n-6 | 9.26 | 0.24 | 7.78 | 0.00 | 7.62 | 0.10 | 6.12 | 0.03 | 7.94 | 0.62 | 8.71 | 0.06 | 13.25 | 0.49 | 10.91 | 0.09 | 10.89 | 0.66 | 9.04 | 0.20 | 8.23 | 0.06 | 6.31 | 0.00 | 7.88 | 0.12 |
| 20:4n-6 | 4.20 | 0.07 | 4.18 | 0.09 | 4.84 | 0.11 | 4.19 | 0.06 | 4.26 | 0.35 | 4.78 | 0.07 | 3.27 | 0.14 | 4.14 | 0.08 | 4.21 | 0.10 | 2.61 | 0.22 | 4.63 | 0.17 | 4.63 | 0.09 | 5.50 | 0.05 |
| Total n-6 PUFA | 15.58 | 0.01bc | 15.01 | 0.55bc | 14.88 | 0.13bc | 12.45 | 0.04c | 14.50 | 0.85bc | 15.75 | 0.01bc | 18.97 | 0.33a | 16.93 | 0.01ab | 17.56 | 0.93a | 13.88 | 0.55bc | 15.24 | 0.53bc | 13.07 | 0.10bc | 16.13 | 0.17b |
| 18:3n-3 | 0.55 | 0.00 | 0.36 | 0.01 | 0.36 | 0.02 | 0.32 | 0.00 | 0.46 | 0.02 | 0.45 | 0.01 | 0.83 | 0.03 | 0.63 | 0.01 | 0.61 | 0.08 | 0.46 | 0.00 | 0.35 | 0.02 | 0.29 | 0.03 | 0.33 | 0.03 |
| 20:5n-3 | 2.75 | 0.01a | 1.95 | 0.06b | 1.98 | 0.03b | 1.92 | 0.01b | 1.97 | 0.13b | 2.68 | 0.08a | 1.95 | 0.02b | 2.64 | 0.10a | 2.36 | 0.04a | 1.10 | 0.38d | 1.76 | 0.09c | 1.71 | 0.10c | 1.93 | 0.01b |
| 22:5n-3 | 0.78 | 0.01 | 0.59 | 0.01 | 0.56 | 0.02 | 0.56 | 0.02 | 0.64 | 0.01 | 0.70 | 0.04 | 0.52 | 0.01 | 0.67 | 0.06 | 0.55 | 0.05 | 0.31 | 0.09 | 0.49 | 0.01 | 0.54 | 0.05 | 0.56 | 0.01 |
| 22:6n-3 | 33.46 | 1.39a | 30.27 | 0.41a | 30.65 | 0.11a | 32.52 | 0.01a | 30.35 | 0.68a | 29.02 | 0.41a | 20.64 | 1.03b | 28.85 | 0.91ab | 24.92 | 0.11b | 14.73 | 1.38c | 30.27 | 0.63ab | 33.99 | 0.18a | 32.75 | 0.62a |
| Total n-3 PUFA | 37.74 | 1.40a | 33.26 | 0.47a | 33.69 | 0.10a | 35.43 | 0.02a | 33.55 | 0.83a | 33.02 | 0.43a | 24.11 | 1.03b | 32.98 | 1.06a | 28.59 | 0.20ab | 16.69 | 1.86c | 32.98 | 0.71ab | 36.63 | 0.08a | 35.70 | 0.64a |
| Total PUFA | 53.32 | 1.41 | 48.27 | 0.07 | 48.56 | 0.23 | 47.89 | 0.02 | 48.05 | 1.67 | 48.77 | 0.43 | 43.08 | 0.70 | 49.91 | 1.04 | 46.15 | 1.12 | 30.57 | 2.41 | 48.22 | 1.24 | 49.69 | 0.18 | 51.83 | 0.46 |
| DHA/EPA | 12.15 | 0.48a | 15.55 | 0.30b | 15.48 | 0.20b | 16.90 | 0.11bc | 15.42 | 0.65b | 10.83 | 0.18a | 10.56 | 0.40a | 10.93 | 0.05a | 10.57 | 0.15a | 14.01 | 3.55b | 17.21 | 0.51bc | 19.86 | 1.21bc | 16.95 | 0.26bc |
| EPA/ARA | 0.66 | 0.01ab | 0.47 | 0.01ab | 0.41 | 0.00ab | 0.46 | 0.01ab | 0.24 | 0.30a | 0.56 | 0.01b | 0.60 | 0.02b | 0.64 | 0.01ab | 0.56 | 0.00b | 0.42 | 0.11ab | 0.38 | 0.01ab | 0.37 | 0.03ab | 0.35 | 0.00ab |
| n-3/n-6 | 2.42 | 0.09b | 2.22 | 0.11b | 2.26 | 0.01b | 2.85 | 0.01b | 2.32 | 0.01b | 2.10 | 0.03b | 1.27 | 0.08a | 1.95 | 0.06ab | 1.63 | 0.07a | 1.20 | 0.09a | 2.16 | 0.03b | 2.80 | 0.01b | 2.21 | 0.06b |
Fatty acid composition (% of total FAs, only main fatty acids and totals are included) of the liver of the fish collected at the end of the trial.
Different letters indicate significant differences (ANOVA, P<0.05, n=3). DSY: Dried spent yeast, HSY: Hydrolysed spent yeast, DSG: Dried spent grain, HSG: Hydrolysed spent grain, DYABN: Dried commercial yeast from ABN, HYABN: Hydrolysed commercial yeast from ABN
Figure 1
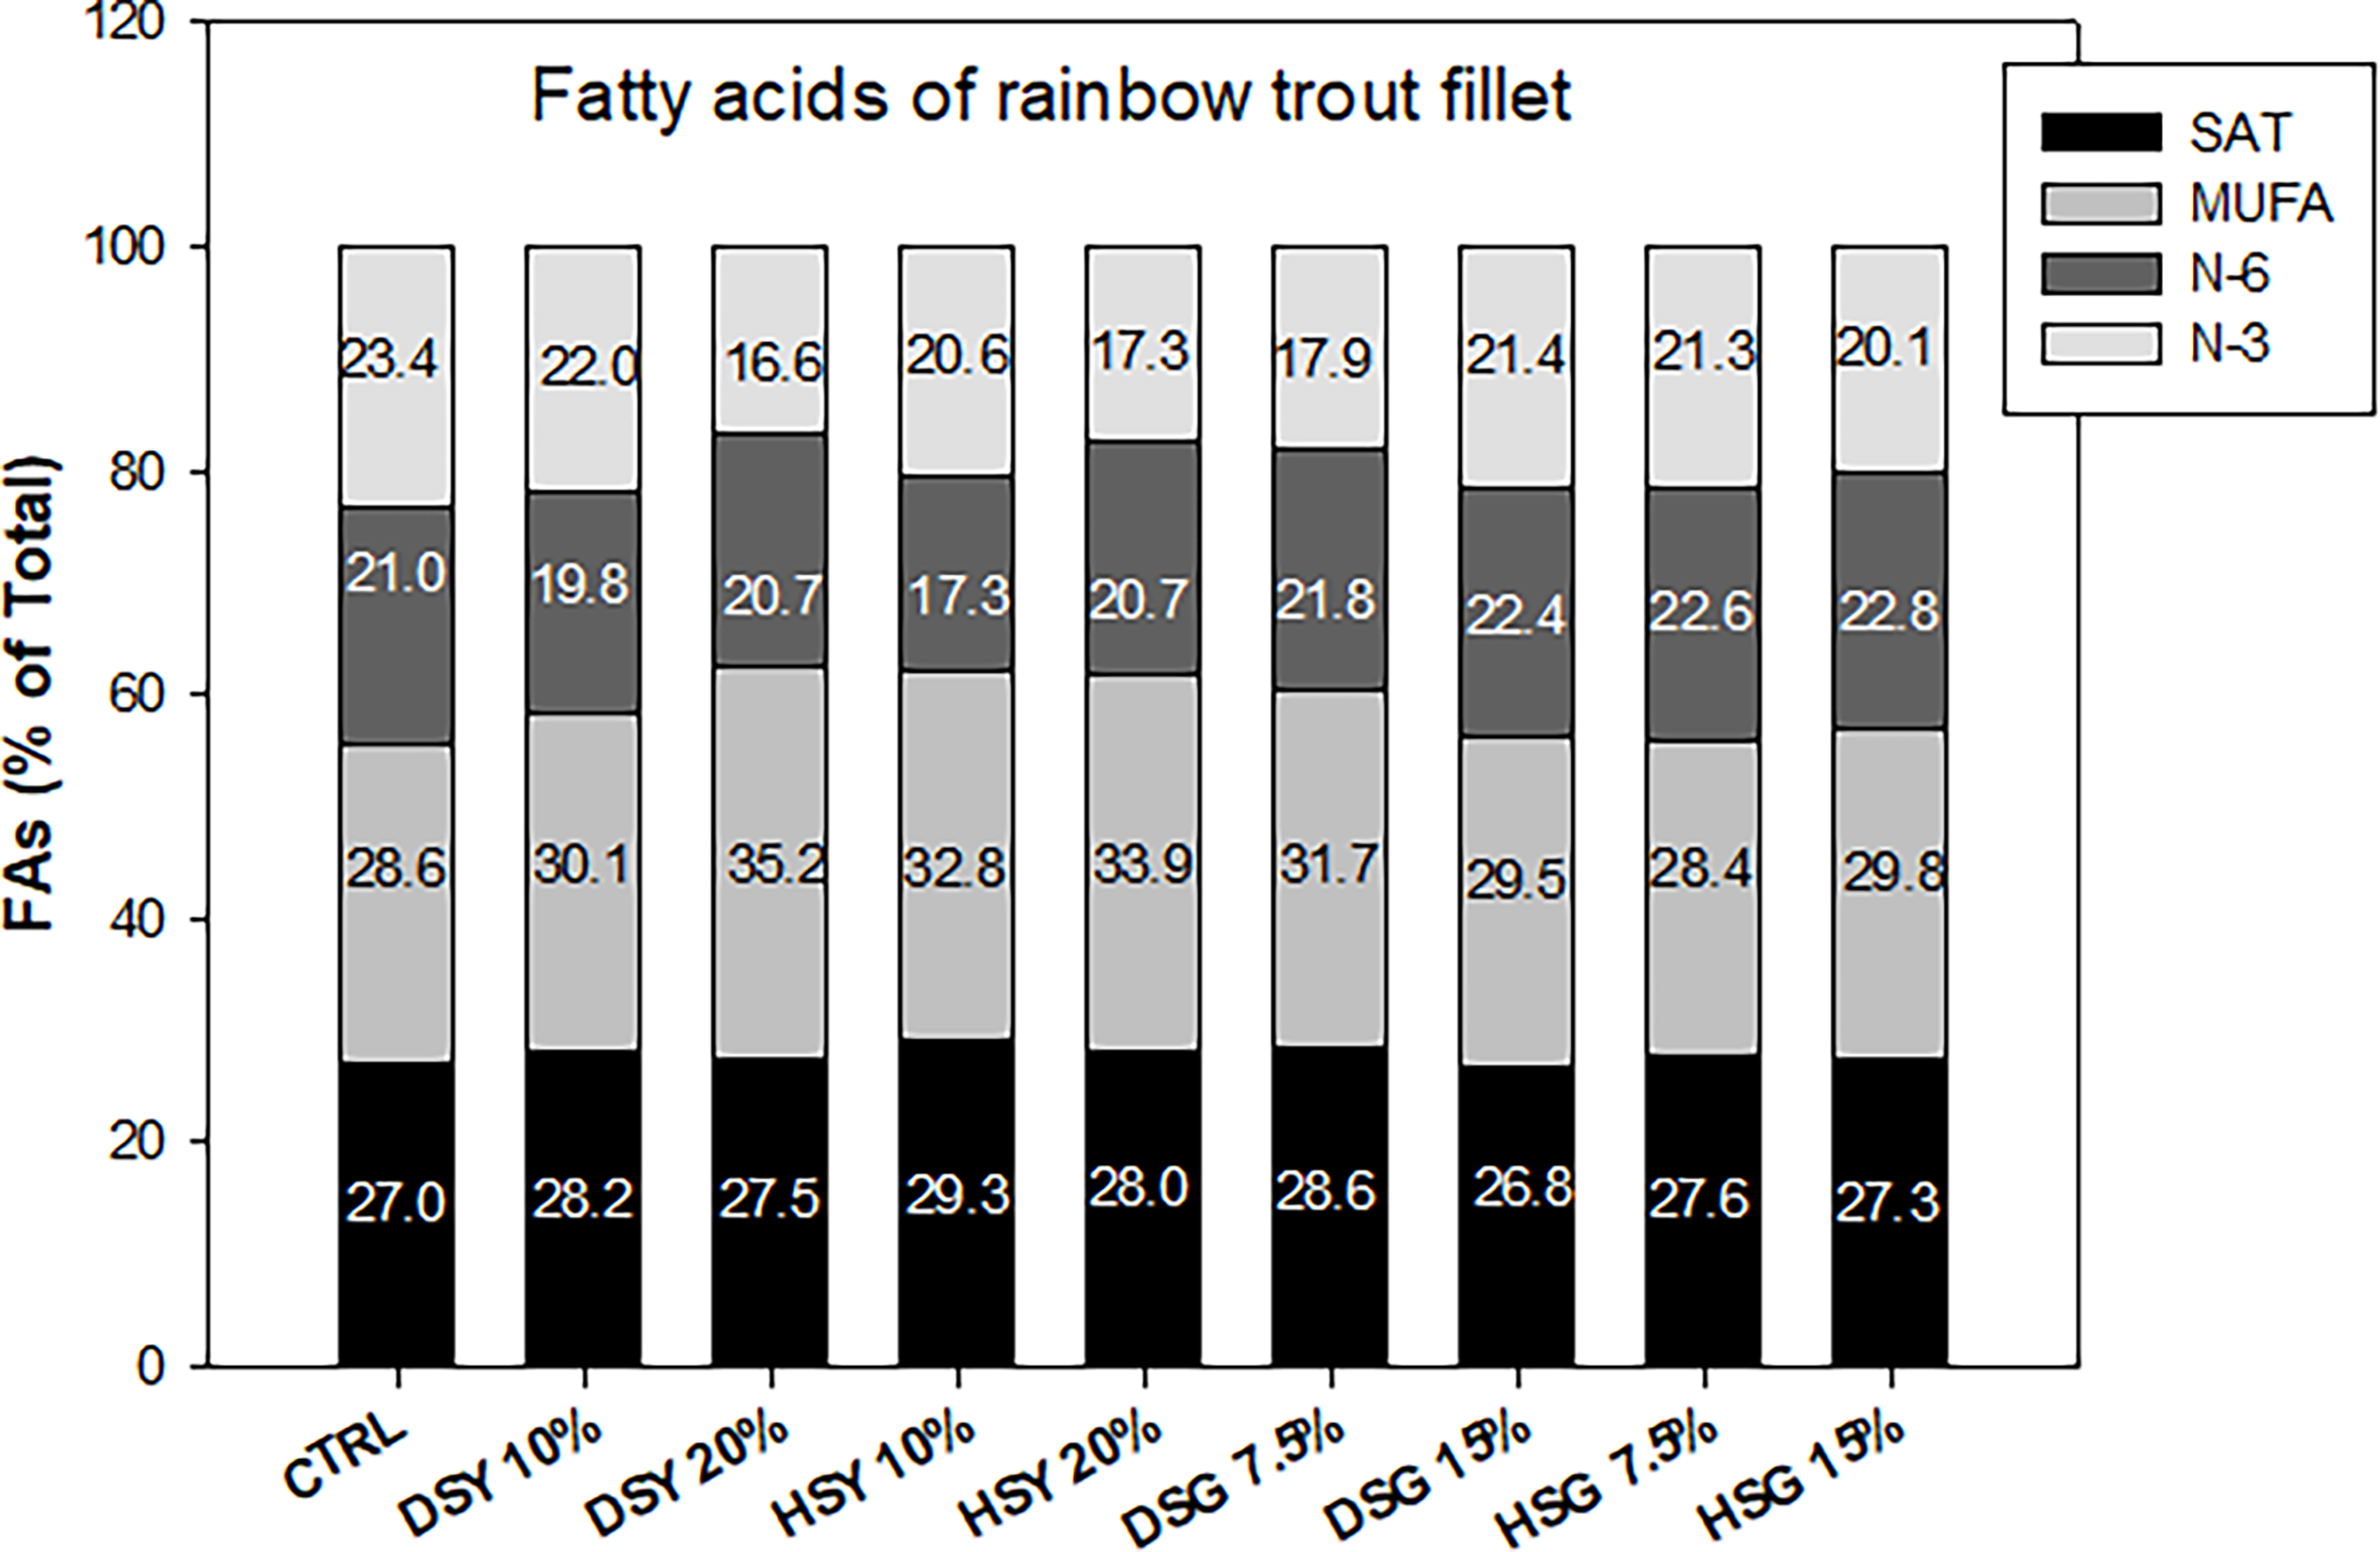
Fatty acid composition of the muscle of rainbow trout fed with the experimental diets. SAT, saturated; MUFA, monounsaturated; N-3, omega-3; N-6, omega-6 fatty acids.
Discussion
In the last years, considerable efforts have been made to look for alternative ingredients to fish meal and oil, and most of the research focused in looking for sustainable ingredients to reduce wastes. Several products such as fish trimmings (Stevens et al., 2018), insects (IPIFF, 2018), algae (Loveday, 2019), and by-products derived from the processing industry and microbial biomass (Hua et al., 2019) have centered most of this research. Brewery by-products have also been considered as good ingredients for marine and freshwater fish culture, because of their content of protein (40%–50% for spent yeast), lipids, vitamin B2, β-glucans, and mannan-oligosaccharides. Recently, a review by Agboola et al. (2021) about the use of yeast in feed production and fish aquaculture suggested the need for a large-scale production of yeast at affordable cost. In the case of breweries, spent yeast and spent grain are produced in very high quantities, but they need to be dewatered and dried before being used in aquafeeds. San Martin et al. (2020) designed these processes of dewatering and drying, reducing energy consumption, being more economical and environmentally sustainable, and the quantities of DSY and grain can now provide a higher contribution in satisfying the protein demand of the global aquafeed industry. This was one of the objectives of the project LIFE-Brewery together with the trials carried out with gilthead sea bream (Estévez et al., 2021) and the present trial with rainbow trout, to show that, once these brewery by-products are processed, they can be used as ingredients in aquafeeds for high-value fish such as salmon, rainbow trout, or European sea bass and gilthead seabream. The main objective of the present study was to evaluate the inclusion of these products in rainbow trout feeds and re-evaluate the digestibility of both ingredients and feeds. Thus, the ADC values obtained in the present study were higher than those published by Nazzaro et al. (2021) probably as a consequence of the improvements introduced in the mechanical dewatering and drying processes, reducing the manipulation of spent yeast.
Brewer’s yeast can be considered a good replacer of fish meal and plat-based proteins (Rumsey et al., 1990; Rumsey et al., 1991; Oliva-Teles and Gonçalves, 2001) in aquafeeds, and it has been included in commercial diets for several fish species, including salmonids (Ferreira et al., 2010). Similar to the results of the present study in rainbow trout, Rumsey et al., (1991) found that, when brewer’s yeast was included at up to 25% of the diet, fish growth and feed conversion were better than with the control feed. Higher levels of brewer’s yeast were less palatable, but fish did not appear to be adversely affected. More recent studies using grain distiller’s dried yeast from the ethanol industry in feeds for rainbow trout showed that 37.5% replacement of fish meal protein and 18% replacement of total dietary protein did not reduce fish performance (Hauptman et al., 2014; Sealey et al., 2015).
Spent grain is the main solid waste produced by the beer industry (Farcas et al., 2017) reaching up to 85% of breweries by-products. It is daily produced in large breweries, and, due to its high moisture content and transport cost, it is generally used in the neighborhood of the breweries as animal feed or as a compost. There are not many publications related to the use of this raw material in aquafeeds, but, in a publication by Hertrampf and Piedad-Pascual (2012), they recommended not to include it in high amounts in the feeds due to its high fiber content and the low pelletizing ability and poor durability of the pellet. It has been mostly used in freshwater fish feeds (carp and Nile tilapia; Kaur and Saxena, 2004) with good results in growth and conversion. Cheng et al. (2004) found similar results as in the present trial using spent grain in the diet for rainbow trout, whereas other authors (Overland et al., 2013; Welker et al., 2014) found also that using dried grains (mostly maize) from the fuel ethanol industry replacing plant ingredients in diets for rainbow trout has good results in terms of growth and conversion, improved the protein digestibility of the diets, and did not have any effect on intestine structure and function.
The results obtained in the present study show that SY inclusion levels up to 20% produced very good results in rainbow trout growth, with final weights significantly higher than those of CTRL group, although no differences in SGR and RGR were observed. FCR and PER had significantly higher values for the fish fed with SY probably due to its lower digestibility compared with CTRL. In the case of SG, the results in final weight were similar to CTRL and SY-fed fish especially in the case of DSG, without differences in SGR and RGR, and, in this case, FCR was similar to that found for the CTRL group. In all the cases, the inclusion of brewery derived by-products did not affect fish final composition. Muscle composition at the end of the study shows a higher protein content in the fish fed with HSY included at 20% and a higher lipid levels in the fish fed with DSY included at 20%, as well as omega-3 fatty acid profile similar to those found in the fish fed with the control/commercial feed. In a previous study carried out with gilthead seabream (Estévez et al., 2021) using feeds with SY included up to 30%, very good results in growth and conversion were obtained even when the fish meal content was reduced to 10% in the formulation. However, in the same study using SG included up to 20%–30%, the growth of seabream and feed digestibility were reduced due to the high fiber content of SG. In that case, the final recommendation for seabream was the inclusion of 30% brewers’ SY with a reduction in the use of fish meal, whereas for SG, the inclusion should not be higher than 15%.
As a conclusion, the inclusion of 20% of brewers’ SY or 15% SG in the feed for carnivorous freshwater fish (rainbow trout) resulted in a higher final weight without differences in growth rates (SGR and RGR) than that obtained using a commercial feed, showing also good protein digestibility and food conversion. Final muscle nutritional composition was very similar to the results obtained for the control group, including the fatty acid composition. These by-products are produced in large quantities in Europe, and considering the results obtained, they can be considered a potential new source of protein and increase the sustainability of both brewery and aquaculture sectors. The valorization of Brewers’ by-products as ingredients for the formulation of aquafeeds has an important favorable effect both on brewers and aquaculture environmental impact. In this regard, the comparison between the aquafeeds obtained using these by-products as ingredients and commercial aquafeed showed significant benefits, including a 6% reduction in climate change (Iñarra et al., 2022).
Funding
The authors acknowledge funding from Life BREWERY project (LIFE16ENV/ES/000160) that is co-funded by LIFE European Environment Programme.
Acknowledgments
All the brewer’s by-products samples that have been used in this study have been provided by Mahou San Miguel company. Thanks are also due to Pau Sanchez, Sandra Molas, Marta Sastre, and Maria Curto for their help in fish maintenance and biochemical analyses and to Ramon Fontanillas for his help in the formulation of the feeds.
Publisher’s note
All claims expressed in this article are solely those of the authors and do not necessarily represent those of their affiliated organizations, or those of the publisher, the editors and the reviewers. Any product that may be evaluated in this article, or claim that may be made by its manufacturer, is not guaranteed or endorsed by the publisher.
Statements
Data availability statement
The original contributions presented in the study are included in the article/supplementary material. Further inquiries can be directed to the corresponding author.
Ethics statement
The animal study was reviewed and approved by Generalitat de Catalunya Ethics Committee.
Author contributions
AE carried out the trials with the fish, took samples and analysed the fillet and liver and wrote the manuscript; DS and BI work with the dewatering and drying of the spent yeast and spent grain and helped in writing the manuscript; LP formulated and prepared the feeds used in the trial and collaborate in writing the paper. All authors contributed to the article and approved the submitted version.
Conflict of interest
The authors declare that the research was conducted in the absence of any commercial or financial relationships that could be construed as a potential conflict of interest.
References
1
Agboola J. O. Overland M. Skrede A. Hansen J. O. (2021). Yeast as a major protein-rich ingredient in aquafeeds: a review of the implications for aquaculture production. Rev. Aquaculture13, 949–970. doi: 10.1111/raq.12507
2
Aliyu S. Bala M. (2011). Brewer's spent grain: A review of its potentials and applications. Afr. J. Biotechnol.10, 324–331. doi: 10.5897/AJBx10.006
3
AOAC (2006) . Official methods of analysis of AOAC international (18th edition) (Gaithersburg: MD: AOAC).
4
Ashe F. Oglend A. (2016). The relationship between input-factor and output prices in commodity industries: The case of Norwegian salmon aquaculture. J. commodity markets1, 35–47. doi: 10.1016/j.jcomm.2015.11.001
5
Barrows F. T. Bellis D. Krogdahl A. Silverstein J. T. Herman E. M. Sealey W. M. et al . (2008). Report of the plant products in aquafeed strategic planning workshop: An integrated, interdisciplinary research roadmap for increasing utilization of plant feedstuffs in diets for carnivorous fish. Rev. Fisheries Sci.16, 449–455. doi: 10.1080/10641260802046734
6
Buffington J. (2014). The economic potential of brewer’s spent grain (BSG) as a biomass feedstock. Adv. Chem. Eng. Sci.4, 308–318. doi: 10.4236/aces.2014.43034
7
Campos I. Matos E. Aragão C. Pintado M. Valente L. M. P. (2018). Apparent digestibility coefficients of processed agro-food by-products in European seabass (Dicentrarchus labrax) juveniles. Aquaculture Nutr.24, 1274–1286. doi: 10.1111/anu.12665
8
Cardinaletti G. Randazzo B. Messina M. Zarantoniello M. Giorgini E. Zimbelli A. et al . (2019). Effects of graded dietary inclusion level of full-fat Hermetia illucens prepupae meal in practical diets for rainbow trous (Oncorhynchus mykiss). Animals9, 251. doi: 10.3390/ani9050251
9
Castro C. Pérez-Jiménez A. Coutinho F. Pousão-Ferreira P. Brandão T. M. Oliva-Teles A. et al . (2013). Digestive enzymes of meagre (Argyrosomus regius) and white seabream (Diplodus sargus). Effects dietary brewer’s spent yeast supplementation. Aquaculture416–417, 322–327.
10
Cheng Z. J. Hardy R. W. Huige N. J. (2004). Apparent digestibility coefficients of nutrients in brewer’s and rendered animal by-products for rainbow trout (Oncorhynchus mykiss (Walbaum)). Aquaculture Res.35, 1–9. doi: 10.1111/j.1365-2109.2004.00941.x
11
Christie W. W. (1982). Lipid analysis (Oxford, UK: Pergamon), 207.
12
Conway J. (2019) Beer production worldwide from 1998 to 2018. Available at: https://www.statista.com/statistics/270275/worldwide-beer-production/.
13
Djuragic O. Levic J. Serdanovic S. (2010). Use of new feed from brewer by-products for breeding layers. Rom. Biotech. Lett.15, 5559–5565.
14
Ebrahim M. S. M. Abou-Seif R. A. (2008). Fish meal replacement by yeast protein (Saccharomyces cerevisiae) supplemented with biogenic l-carintine as a source of methionine plus lysine mixture in feed for Nile tilapia (Oreochromis niloticus) fingerlinges. 8th Int. Symposium Tilapia Aquaculture2008, 999–1099.
15
Estévez A. Padrell L. Iñarra B. Orive M. San Martin D. (2021). Brewery by-products (yeast and spent grain) as protein sources in gitlhead seabream (Sparus aurata) feeds. Aquaculture543, 736921. doi: 10.1016/j.aquaculture.2021.736921
16
EUROSTAT (2020) Happy international beer day. Available at: https://ec.europa.eu/eurostat/web/products-eurostat-news/-/EDN-20200807.
17
Faccenda A. Zambom M. A. Castagnara D. D. Avila A. S. Fernandes T. Eckstein E. I. et al . (2017). Use of dried brewers' grains instead of soybean meal to feed lactating cows. Rev. Bras. Zootecnia46, 39–46. doi: 10.1590/s1806-92902017000100007
18
FAO. 2020 Nutritional requirements of rainbow trout. Available at: http://www.fao.org/fishery/affris/species-profiles/rainbow-trout/nutritional-requirements/en/.
19
Farcas A. C. Socaci S. A. Mudura E. Dulf F. V. Vodnar D. C. Tofana M. et al . (2017). “Exploitation of brewing industry wastes to produce functional ingredients,” in Brewing technology. Ed. KanauchiM. (London: InTech). doi: 10.5775/intechopen.69231
20
Ferreira I.M.P.L.V.O. Pinho O. Vieira E. Tavarela J. G. (2010). Brewer's Saccharomyces yeast biomass: Characteristics and potential applications. Trends Food Sci. Technol.21, 77–84. doi: 10.1016/j.tifs.2009.10.008
21
Garantun-Tjeldsto O. Otera H. Julshamn K. (2006). Food ingestion in juvenile cod estimated by inert lanthanide markers - effects of food particle size. ICES J. Mar. Sci.63, 311–319. doi: 10.1016/j.icesjms.2005.11.008
22
Gatlin D. M. Barrows F. T. Brown P. Dabrowski K. Gaylord T. G. Hardy R. W. et al . (2007). Expanding the utilization of sustainable plant products in aquafeeds: A review. aquaculture research. Aquac Res. 38, 551–579. doi: 10.1111/j.1365-2109.2007.01704.x
23
Hauptman B. S. Barrows F. T. Block S. S. Gaylord T. G. Paterson J. A. Rawles S. D. et al . (2014). Evaluation of grain distillers dried yeast as a fish meal substitute in practical-type diets of juvenile rainbow trout. Oncorhynchus mykiss. Aquaculture432, 7–14. doi: 10.1016/j.aquaculture.2014.03.026
24
Hertrampf J. W. Piedad-Pascual F. (2012). Handbook of ingredients for aquaculture feeds (Switzerland: Springer Science & Business Media), 572.
25
Hua K. Cobcroft J. M. Cole A. Condon K. Jerry D. R. Mangott A. et al . (2019). The future of aquatic protein: Implications for protein sources in aquaculture diets. One Earth1, 316–329. doi: 10.1016/j.oneear.2019.10.018
26
Huige. N. J. (2006). “Brewery by-products and effluents,” in Handbook of brewing. Eds. Priest.F. G.StewartG. G. (Boca Raton: CRC Press), 656e713.
27
Iñarra B. San Martin D. Ramos S. Cidad M. Estévez A. Fenollosa R. et al . (2022). Ecodesign of new circular economy scheme for brewer's side streams. Sustain. Chem. Pharm.18, 100727.
28
IPIFF (2018). The European sector today: Challenges, opportunities and regulatory landscape (Brussels: IPIFF Publication), 16.
29
Jayant M. Hassan M. A. Srivastava P. P. Meena D. K. Kumar P. Kumar A. et al . (2018). Brewer’s spent grains (BSGs) as feedstuff for striped catfish, Pangasianodon hypophthalmus fingerlings: An approach to transform waste into wealth. J. Cleaner Production199, 716–722. doi: 10.1016/j.jclepro.2018.07.213
30
Kaur V. I. Saxena P. K. (2004). Incorporation of brewery waste in supplementary feed and its impact on growth in some carps. Bioresource Technol.91, 101–104. doi: 10.1016/S0960-8524(03)00073-7
31
Kerby C. Vriesekoop F. (2017). An overview of the utilisation of brewery by-products as generated by british craft breweries. Beverages3, 24. doi: 10.3390/beverages3020024
32
Levic. J. Djuragic. O. Sredanovic. S. (2010). Use of new feed from brewery by-products for breeding layers. Romanian Biotechnol. Lett.15, 5559–5565.
33
Loveday S. M. (2019). Plant protein ingredients with full functionality potential. Nutri. Bull.45, 321–327. doi: 10.1111/nbu.12450
34
Maynard L. A. Loosli J. K. Hintz H. F. Warner R. G. (1979). Animal nutrition (New York, NY: McGraw-Hill).
35
McCarthy A. L. O'Callaghan Y. C. Piggott C. O. Fitzgerald R. J. O'Brien N. M. (2013). Brewers' spent grain; bioactivity of phenolic component,its role in animalnutrition and potential incorporation in functional foods: areview. Proc.Nutrition Soc72, 117–125. doi: 10.1017/S0029665112002820
36
Murdock F. R. Hodgson A. S. Robert E. Riley (1981). Nutritive value of wet brewers grains for lactating dairy cows. J. Dairy Sci.64, 1826–1832. doi: 10.3168/jds.S0022-0302(81)82771-3
37
Mussatto S. I. (2009). “Biotechnological potential of brewing industry by-products,” in Biotechnology for agro-industrial residues utilisation: utilisation of agro-residues. Eds. NigamP. S. N.PandeyA. (Dordrecht: Springer), 313–326. doi: 10.1007/978-1-4020-9942-7_16
38
Mussatto S. I. (2014). Brewer's spent grain: Valuable feedstock for industrial applications. J. Sci. Food Agric.94, 1264–1275. doi: 10.1002/jsfa.6486
39
Mussatto. S. I. Dragone. G. Roberto. I. C. (2006). Brewers’ spent grain: Generation. characteristics and potential applications. J. Cereal Sci.43, 1–14. doi: 10.1016/j.jcs.2005.06.001
40
Muzinic L. A. Thompson K. R. Morris A. Webster C. D. Rouse D. B. Manomaitis L. (2004). Partial and total replacement of fish meal with soybean meal and brewers' grains with yeast in practical diets for Australian red claw crayfish Cherax quadricarinatus. Aquaculture230, 359–376. doi: 10.1016/S0044-8486(03)00420-4
41
Naylor R. L. Hardy R. W. Bureau D. P. Chiu A. Elliott M. Forster I. et al . (2009). Feeding aquaculture in an era of finite resources. Proc. Natl. Acad. Sci.106, 15103–15110. doi: 10.1073/pnas.0905235106
42
Nazzaro J. San Martin D. Perez-Vendrell A. M. Padrell L. Iñarra B. Orive M. et al . (2021). Apparent digestibility coefficients of brewer's by-products used in feeds for rainbow trout (Oncorhyncus mykiss) and gilthead seabream (Sparus aurata). Aquaculture530, 735796. doi: 10.1016/j.aquaculture.2020.735796
43
Oliva-Teles. A. Gonçalves. P. (2001). Partial replacement of fishmeal by brewers yeast (Saccharomyces cerevisae) in diets for sea bass (Dicentrarchus labrax) juveniles. Aquaculture.202 (3–4), 269–278.
44
Øverland M. Karlsson A. Mydland L. T. Romarheim O. H. Skrede A. (2013). Evaluation of Candida utilis, kluyveromyces marxianus and Saccharomyces cerevisiae yeasts as protein sources in diets for Atlantic salmon (Salmo salar). Aquaculture 402-403pp, 1–7.
45
Ovie S. O. Eze S. S. (2014). Utilization of Saccharomyces cerevisiae in the partial replacement of fishmeal in Clarias gariepinus diets. Int. J. Adv. Agric. Res.2, 83–88.
46
Ozório. R. O. A. Portz. L. Borghesi. R. Cyrino. J. E. P. (2012). Effects of dietary yeast (saccharomyces cerevisia) supplementation in practical diets of tilapia (oreochromis niloticus). Animals2 (1), 16–24.
47
Randazzo B. Cardinaletti G. Cerri R. Giorgini E. Belloni A. Contó M. et al . (2021b). Hermetia illucens and poultry by-product meals as alternatives to plant protein sources in gilthead seabream (Sparus aurata) diet: A multidisciplinary study on gish gut status. Animals11, 677. doi: 10.3390/ani11030677
48
Randazzo B. Zarantoniello M. Gioacchini G. Cardinaletti G. Belloni A. Giorgini E. et al . (2021a). Physiological response of rainbow trout (Oncorhynchus mykiss) to graded levels of Hermetia illucens or poultry by-product as single or combined substitute ingredients to dietary plant proteins. Aquaculture538, 736550. doi: 10.1016/j.aquaculture.2021.736550
49
Robertson. J. A. I’Anson. K. J. A. Treimo. J. Faulds. C. B. Brocklehurst. T. F. Eijsink. V. G. H. et al . (2010). Profiling brewers’ spent grain for composition and microbial ecology at the site of production. LWT - Food Sci. Technol.43 (6), 890–896. doi: 10.1016/j.lwt.2010.01.019
50
Rumsey G. L. Hughes. S.G. Smith. R.R. Kinsella. J.E. (1990). Use of dietary yeast Saccharomyces cerevisiae nitrogen by lake trout. J. World Aquacult. Soc.21(3), 205–209.
51
Rumsey G. L. Hughes. S.G. Smith. R.R. Kinsella. J.E. Shetty. K.J. (1991). Digestibility and energy values of intact, disrupted and extracts from brewer’s dried yeast fed to rainbow trout Oncorhynchus mykiss. Anim. Feed Sci. Technol.33, 185–193.
52
San Martin D. Orive M. Iñarra B. Castelo J. Estévez A. Nazzaro J. et al . (2020). Brewers' spent yeast and grain protein hydrolysates as second-generation feedstuff for aquaculture feed. Waste Biomass Valorization.11, 5307–5320. doi: 10.1007/s12649-020-01145-8
53
Sarker P. K. Kapuscinski A. R. McKuin B. Fitzgerald D. S. Nash H. M. Greenwood C. (2020). Microalgae-blend tilapia feed eliminates fishmeal and fish oil, improves growth, and is cost viable. Sci. Rep.10, 19328. doi: 10.1038/s41598-020-75289-x
54
Sealey W. M. O'Neill T. J. Peach J. T. Gaylord T. G. Barrows F. T. Block S. S. (2015). Refining inclusion levels of grain distiller's dried yeast in commercial-type and plant-based diets for juvenile rainbow trout, Oncorhynchus mykiss. J. World Aquaculture Soc.46 (4), 434–444. doi: 10.1111/jwas.12199
55
Sealey. W. M. Rawles. S. D. Block. S. S. Paterson. J. A. Hauptman. B. S. Barrows. F. T. et al . (2014). Evaluation of grain distillers dried yeast as a fish meal substitute in practical-type diets of juvenile rainbow trout Oncorhynchus mykiss. Aquaculture432, 7–14. doi: 10.1016/j.aquaculture.2014.03.026
56
Stevens J. R. Newton R. W. Tlusty M. Little D. C. (2018). The rise of aquaculture by-products: increasing food production, value, and sustainability through strategic utilisation. Mar. Policy90, 115–124. doi: 10.1016/j.marpol.2017.12.027
57
Thomas. C. R. Rahman. K. R. (2006). Brewery wastes. strategies for sustainability. A review. Aspects Appl. Biol.80, 147–153.
58
Villalta M. Estévez A. Bransden M. P. Bell J. G. (2005). The effect of graded concentrations of idetary DHA on growth, survival and tissue fatty acid profile of Senegal sole (Solea senegalensis) larvae during the Artemia feeding period. Aquculture249, 353–365. doi: 10.1016/j.aquaculture.2005.03.037
59
Welker T. L. Lim C. Barrows F. T. Liu K. (2014). Use of distiller´s dried grains with solubles (DDGS) in rainbow trout feeds. Anim. Feed Sc. Tech.195, 47–57. doi: 10.1016/j.anifeedsci.2014.05.011
60
Yamamoto T. Marcouli P. A. Unuma T. Akiyama T. (1994). Utilization of malt protein flour in fingerling rainbow trout diets. Fish. Sci.60, 455–460. doi: 10.2331/fishsci.60.455
61
Zhang P. Cao S. Zou T. Han D. Liu H. Jin J. et al . (2018). Effects of dietary yeast culture on growth performance. Immune response Dis. resistance gibel carp (Carassius auratus gibelio CAS III). Fish Shellfish Immunol.82, 400–407. doi: 10.1016/j.fsi.2018.08.044
62
Zhou M. Liang R. Mo J. Yang S. Gu N. Wu Z. et al . (2018). Effects of brewer’s yeast hydrolysate on the growth performance and the intestinal bacterial diversity of largemouth bass (Micropterus salmoides). Aquaculture484, 139–144. doi: 10.1016/j.aquaculture.2017.11.006
Summary
Keywords
Brewery by-products, valorisation, circular economy, protein digestibility, protein substitution, rainbow trout, fillet quality
Citation
Estévez A, Padrell L, Iñarra B, Orive M and San Martin D (2022) Brewery by-products (yeast and spent grain) as protein sources in rainbow trout (Oncorhynchus mykiss) feeds. Front. Mar. Sci. 9:862020. doi: 10.3389/fmars.2022.862020
Received
25 February 2022
Accepted
11 August 2022
Published
05 September 2022
Volume
9 - 2022
Edited by
Ikram Belghit, Norwegian Institute of Marine Research (IMR), Norway
Reviewed by
Houguo Xu, Yellow Sea Fisheries Research Institute (CAFS), China; Marta Silva, Norwegian Institute of Marine Research (IMR), Norway
Updates
Copyright
© 2022 Estévez, Padrell, Iñarra, Orive and San Martin.
This is an open-access article distributed under the terms of the Creative Commons Attribution License (CC BY). The use, distribution or reproduction in other forums is permitted, provided the original author(s) and the copyright owner(s) are credited and that the original publication in this journal is cited, in accordance with accepted academic practice. No use, distribution or reproduction is permitted which does not comply with these terms.
*Correspondence: Alicia Estévez, alicia.estevez@irta.es
This article was submitted to Marine Fisheries, Aquaculture and Living Resources, a section of the journal Frontiers in Marine Science
Disclaimer
All claims expressed in this article are solely those of the authors and do not necessarily represent those of their affiliated organizations, or those of the publisher, the editors and the reviewers. Any product that may be evaluated in this article or claim that may be made by its manufacturer is not guaranteed or endorsed by the publisher.