Abstract
Microplastics (MPs) have emerged as a pollutant of significant global concern. The sandy beach is a fragile environment that deserves our special attention with regard to MP contamination, as this area is a hotspot that accumulates large quantities of plastic waste. Notably, our current understanding of the MP distribution on beaches and the scale of contamination is far from sufficient. Hence, this study investigated the occurrence and characteristics of MPs on 14 beaches along the coast of South China. The MPs were ubiquitously distributed in the sand, most were small, less than 1 mm. A total of 18 types of polymers were identified in the sand, suggesting that diverse types of MPs are present on the beaches. Polyethylene, polypropylene, and polystyrene were the dominant types of MPs in most of our sampling sites. The MP abundance was higher in the upper layers (0–20 cm) of the beach than in the deeper layers (20–40 cm) of the sampling site when characterized by depth (Yangjiang beach). Our study demonstrates the extent and severity of MP pollution on the beaches of South China and provides implications for future remediation measures. More effort is needed to clarify the vertical distribution of MPs on beaches, especially for those MPs less than 1 μm.
Introduction
Microplastics (MPs) and nanoplastics (NPs), respectively, defined as synthetic solid particles or polymeric matrices ranging in size from 1 μm to 5 mm and less than 1 μm (Frias and Nash, 2019), have emerged as a pollutant of significant global concern (Thompson et al., 2004; Ivar do Sul and Costa, 2014). The sources, transport, and fates of MPs have been intensively studied in the past decade (Burns and Boxall, 2018; Beiras and Schönemann, 2020; Wang et al., 2021). Evidence has shown that they are ubiquitous in the environment, including in remote areas such as the polar regions and deep ocean (Lusher et al., 2015; Li et al., 2020). However, due to constraints in the sampling, identification, and quantification techniques (Hidalgo-Ruz et al., 2012), our understanding of the mechanisms underlying MP distribution and their scale of contamination is still limited. Much more effort is needed to understand the impacts of MPs on different ecosystems.
The sandy beach is one of those ecosystems that deserves our attention with regard to MP contamination. The beach ecosystem is an extremely dynamic environment where the physical structure of the habitat is determined by interactions between the sand, waves, and tides (McLachlan and Defeo, 2017). This dynamic habitat is home to a diversity of species which are extremely mobile and adaptable to changing conditions (Brown and McLachlan, 2002). Sandy beach ecosystems make up almost half of the world’s ice-free ocean coastline and function as a social–ecological system (Defeo et al., 2021). It is also a fragile environment facing many threats including erosion and anthropogenic disturbance. Millions of tons of plastic waste enter the ocean every year from rivers, with many of them ending up in coastal areas (Galgani et al., 2015; Jambeck et al., 2015; Peng et al., 2021). In addition, beaches are a leisure hotspot and subject to intense recreational activities that generate large amounts of plastic litter. Inadequate waste management, littering, and illegal dumping result in build-ups of plastic litter on beaches (Silva-Cavalcanti et al., 2009). The aging and weathering of this plastic litter can generate a substantial amount of MPs which could then be transported to the sea or deposited in the sand (Andrady, 2015). Meanwhile, the sublittoral zone of beach areas is subject to strong wave action, where huge volumes of seawater spread on the beach surface and then rapidly drain back to the sea due to the high permeability of the sand (McLachlan and Defeo, 2017). During this process, MPs in the seawater could be trapped and accumulate in the sand, making sandy beaches a sink for MPs.
There have been reports of MP contamination on beach surfaces worldwide, and alarming levels of MPs have been reported (Li et al., 2018; Tiwari et al., 2019; De-la-Torre et al., 2020; Mazariegos-Ortíz et al., 2020; Patchaiyappan et al., 2021). While abundance and distribution of MPs have been characterized in beach sand, vertical distribution of MPs on beaches has received relatively less attention. Investigating vertical distribution is important to understand the migration of MPs in the beach environment. In addition, it should be noted that most of previous studies have identified the MPs by visual identification under a microscope on the basis of plastic color and shape. Such a method is labor intensive and inefficient for counting MPs, especially micro-sized MPs. An overestimation of MP contamination is also possible when using these techniques due to false positive identifications (Shim et al., 2017). Due to the limitations of traditional methods, early studies only focused on large-sized MPs and were limited to a few common plastics such as polyethylene (PE), polypropylene (PP), polyamide, polyethylene terephthalate (PET), polystyrene (PS), and polyvinyl chloride (Li et al., 2018; Yaranal et al., 2021). The abundance of MPs beyond these polymer types has thus far rarely been reported for beaches. Therefore, our understanding of the MP distribution and fate on beaches is far from adequate.
In this study, we aimed to assess the distribution and characteristics of MPs on the beaches of South China. Sand samples were collected from 14 beaches along the coast of South China. Large MPs (usually > 800 μm) were characterized using Fourier transform infrared-attenuated total reflection (FTIR-ATR) spectroscopy. Smaller-sized MPs (<800 μm) were enumerated using a cutting-edge μ-FTIR technique combined with a Wizards feature that characterizes micron-sized plastics in an automatic, direct, and continuous way (Chai et al., 2020). To gain a better understanding of the MP distribution on beaches, we also examined the vertical distribution of MPs at one of the sampling sites. Our study demonstrates the extent and severity of MP pollution on the beaches of South China and provides implications for future remediation measures.
Materials and Methods
Study Sites
Sand samples were collected at ebb tide from 14 beaches along the southeast coast of China from December 2020 to March 2021. The locations of the sampling sites are shown in Figure 1, and detailed information for each site is provided in Supplementary Table 1. The investigated sand beach included Lianhuafeng (LHF), Nansha (NS), Shayuchong (SYC), Xiaomeisha (XMS), Jiaochangwei (JCW), Dongchong (DC), Youganwan (YGW), Xiangluwan (XLW), Wanweijintan (WWJT), Yintan (YT), Nanjicun (NJC), Yerong (YR), Yudaitan (YDT), and Beiluowan (BLW). At each site, surface sands (<5 cm depth) were sampled from three sublittoral locations that were at least 5 m apart from each other using a pre-cleaned glass beaker. To observe the vertical distribution of the MPs, a stainless-steel corer was used on the Yangjiang beach (Site 14; Figure 1 and Supplementary Table 1) to collect sand samples from different layers (0–10, 10–20, 20–30, and 30–40 cm depths). All sand samples were wrapped in aluminum foil before transport to the laboratory. The samples were dried in an oven at 60°C for 24 h before sieving through 5 mm stainless-steel mesh to remove large particles.
FIGURE 1
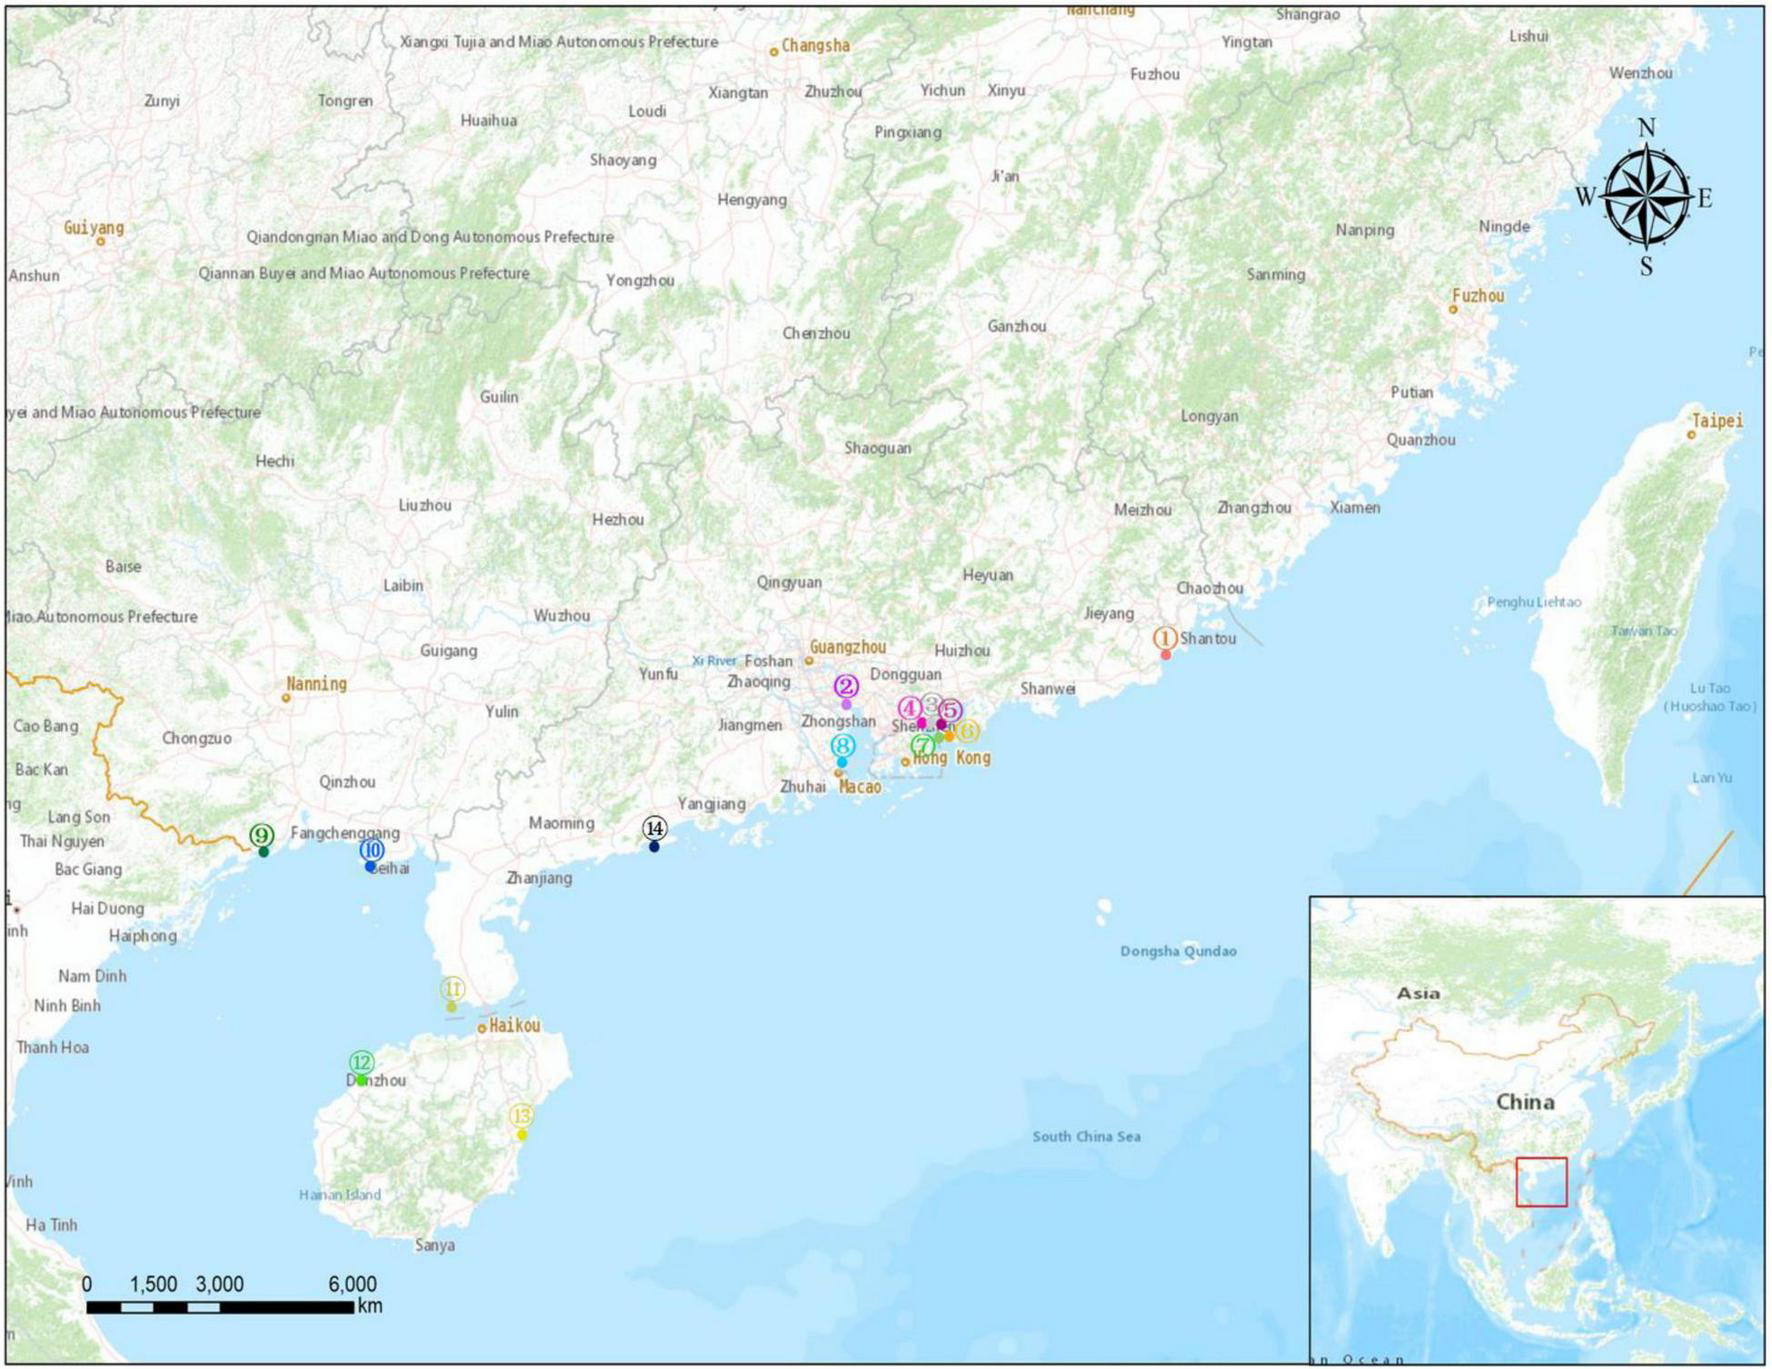
Map showing the locations of the 14 sampled beaches. Detailed information for each sampling site is given in Supplementary Table 1.
Extraction of Microplastics From the Sand
A two-step air-induced overflow extraction procedure was used to separate the MPs from the sand as described by Nuelle et al. (2014). A continuous flow and floating separation apparatus, which is composed of an air-induced overflow and a 1,200-mesh stainless steel sieve (c.a. 11 μm), was set up following Nuelle et al.’s descriptions. The extraction was performed without oxidation as the samples contained little organic material. The separation of the MPs was performed based on the fluidization of the sediments in a saturated sodium chloride (NaCl, ρ = 1.2 g⋅cm–3) solution and passed through the 1,200-mesh stainless steel sieve. This reduced the sample mass for the second density separation step by flotation. The particles retained in the sieve were resuspended by a saturated sodium iodide solution (NaI, ρ = 1.6 g⋅cm–3) and again filtered through the 1,200-mesh sieve. The collected particles were rinsed with distilled water to remove salts, dried at 60°C, and transferred to a clean glass petri dish. All samples were wrapped in aluminum foil and stored in a drying cabinet until further analysis in the laboratory.
Enumeration, Classification, and Characterization of the Microplastics
Large MPs (usually > 800 μm) were selected and examined under a stereomicroscope (SteREO Discovery.V20, Zeiss, Germany). These particles were analyzed by Axio Vision SE64 Rel.49 software and classified into five size categories: <1 mm, 1–2 mm, 2–3 mm, 3–4 mm, and 4–5 mm. The MPs were further analyzed using a FTIR spectrometer (NicoletiS50, Thermo Fisher, Waltham, MA, United States) equipped with a built-in ATR accessory. The FTIR spectra were recorded between 500 and 4000 cm–1 with 16 scans per sample and a resolution of 4 cm–1. All spectra were compared with a database (HR Hummel Polymer and Additives) to identify the texture of the MPs.
Small MPs (<800 μm) were identified with a μ-FTIR (Nicolet iN10 MX, Thermo Fisher, United States) spectrometer equipped with a deuterated triglycine sulfate detector. The spectrum was set in the range of 675–4,000 cm–1 and the collection time was set at 3 s. The MPs were evenly spread across a gold-coated microslide and scanned 16 times at a resolution of 8 cm–1. The results were analyzed with the Particles Wizards in OMNIC Picta software (Thermo Fisher, United States).
Quality Control
To minimize sample contamination, all sampling containers and labware for extractions were cleaned with Milli-Q water and dried before use. The samples, solution, and labware were covered or immediately wrapped with aluminum foil when they were not in use.
To test the recovery of our analytical procedure, PE, PP, PET, and polyformaldehyde with a size range of 100 μm to 5 mm were prepared and homogenized with a sand sample. The mixture was analyzed with the described procedure, and recoveries of between 93.4 and 96.8% were obtained.
Statistical Analysis
Microplastic abundance is presented as the number of MP particles per dry mass of sand [numbers (n)⋅kg–1]. Data analysis was performed using SPSS 18.0 for Windows (SPSS Inc., Chicago, IL, United States).
Results and Discussion
Size Distribution and the Abundance of Microplastics on the Beach Surface
The MP concentrations in the sand samples are shown in Table 1. MPs were detected in all beach samples and ranged from 93.3 to 4433.3 n⋅kg–1 (dry weight basis). The lowest MP concentration (93.3 n⋅kg–1) was observed at the SZ-YGW site, a private beach with much less tourist activity, while the highest MP concentration was detected in SZ-JCW (4433.3 n⋅kg–1), a famous tourist region in the Greater Bay Area in China. As suggested by the large standard deviations for the data, the MP concentrations in the samples were highly variable, even in those collected from the same site (Table 1). The concentrations also varied by two orders of magnitude (Table 1), reflecting the different human disturbances and MP inputs at these sites. Overall, our data indicates that the spatial distribution of MPs is rather heterogeneous on the beaches.
TABLE 1
| Site no. | Site name | 4–5 mm | 3–4 mm | 2–3 mm | 1–2 mm | <1 mm | Total |
| 1 | ST-LHF | 6.7 ± 11.5 | 20.0 ± 20.0 | 40.0 ± 40.0 | 0.0 ± 0.0 | 546.7 ± 758 | 613.3 ± 823.7 |
| 2 | GZ-NS | 120.0 ± 17.3 | 143.3 ± 41.6 | 183.3 ± 23.1 | 100.0 ± 36.1 | 1096.7 ± 270.2 | 1643.3 ± 285.9 |
| 3 | SZ-SYC | 0.0 ± 0.0 | 0.0 ± 0.0 | 0.0 ± 0.0 | 0.0 ± 0.0 | 2160.0 ± 485.4 | 2160.0 ± 485.4 |
| 4 | SZ-XMS | 6.7 ± 11.5 | 13.3 ± 15.3 | 23.3 ± 40.4 | 46.7 ± 80.8 | 1286.7 ± 465.8 | 1376.7 ± 611.6 |
| 5 | SZ-JCW | 0.0 ± 0.0 | 0.0 ± 0.0 | 0.0 ± 0.0 | 0.0 ± 0.0 | 4433.3 ± 4822.5 | 4433.3 ± 4822.5 |
| 6 | SZ-DC | 0.0 ± 0.0 | 0.0 ± 0.0 | 0.0 ± 0.0 | 0.0 ± 0.0 | 606.7 ± 670.0 | 606.7 ± 670.0 |
| 7 | SZ-YGW | 0.0 ± 0.0 | 0.0 ± 0.0 | 0.0 ± 0.0 | 0.0 ± 0.0 | 93.3 ± 90.2 | 93.3 ± 90.2 |
| 8 | ZH-XLW | 6.7 ± 11.5 | 46.7 ± 64.3 | 20.0 ± 34.6 | 26.7 ± 46.2 | 266.7 ± 246.8 | 366.7 ± 181.5 |
| 9 | FCG-WWJT | 140.0 ± 207.8 | 146.7 ± 133.2 | 113.3 ± 120.6 | 86.7 ± 61.1 | 560.0 ± 275.0 | 1046.7 ± 291.4 |
| 10 | BH-YT | 0.0 ± 0.0 | 0.0 ± 0.0 | 0.0 ± 0.0 | 0.0 ± 0.0 | 526.7 ± 397.2 | 526.7 ± 397.2 |
| 11 | ZJ-NJC | 0.0 ± 0.0 | 0.0 ± 0.0 | 0.0 ± 0.0 | 0.0 ± 0.0 | 2586.7 ± 2773.6 | 2586.7 ± 2773.6 |
| 12 | DZ-YR | 13.3 ± 23.1 | 6.7 ± 11.5 | 0.0 ± 0.0 | 0.0 ± 0.0 | 526.7 ± 704.7 | 546.7 ± 739.3 |
| 13 | QH-YDT | 0.0 ± 0.0 | 0.0 ± 0.0 | 0.0 ± 0.0 | 0.0 ± 0.0 | 565.0 ± 798.7 | 565.0 ± 798.7 |
Size distribution and abundance of microplastics (MPs; n kg–1) in the surface sand (0–5 cm) collected from the beach along the coasts of South China.
While the presence and abundance of MPs on beaches have been investigated worldwide, the reported values have varied greatly (Li et al., 2018; Tiwari et al., 2019; De-la-Torre et al., 2020; Mazariegos-Ortíz et al., 2020; Patchaiyappan et al., 2021). This reflects not only the degree of MP contamination, but also the bias of different methodologies. Dekiff et al. (2014) examined the spatial distribution of small potential MPs by optical analysis and only detected 1.0–2.0 n⋅kg–1 in the beach sand. Also using an optical microscope, Laglbauer et al. (2014) investigated the quality, size, and quantity of MPs in the shoreline and sublittoral sands from six beaches in Slovenia. They reported that the median MP density was higher in the infralittoral zone (155.6 n⋅kg–1) than on the shoreline (133.3 n⋅kg–1). Combining microscopic and FTIR methods, Yu et al. (2016) reported that the abundance of MPs on the Bohai Sea beach (located in north China) was in the range of 102.9–163.3 n⋅kg–1, whereas the mean concentration of MPs on several sandy beaches in south China has been reported to be 3,266.0 ± 6,390.8 n⋅kg–1 (Li et al., 2018). However, the identification of MPs in the latter study was based only on a magnifier with 10 × magnification. Using a combination of FTIR and a staining method, Godoy et al. (2020) detected 45.0 ± 24.7 n⋅kg–1, 31.5 ± 21.5 n⋅kg–1, and 22.0 ± 23.2 n⋅kg–1 at the La Herradura, Motril, and La Rábita beaches, respectively, in Spain. Using optical fluorescence microscopy, Raman spectroscopy, and field emission scanning electron microscopy with energy dispersion spectroscopy, Yaranal et al. (2021) found that the MP concentrations on five beaches in the Indian state of Karnataka ranged from 264 ± 62 to 1002 ± 174 n⋅kg–1, for an average MP abundance on the beaches of 664 ± 114 n⋅kg–1. MP contamination in sediments can be a suitable reference for beach sand, and Phuong et al. (2018) have provided a detailed summary of MP concentrations in sediments around the world. A range of 50–2,000 n⋅kg–1 is commonly observed in marine sediments, although results up to several thousand n⋅kg–1 have also been reported.
Our data are relatively higher than those reported above for beach and sediment environments. However, a direct comparison with earlier results is rough or not statistically feasible due to the different performances of the techniques applied in these studies. Differences in the minimum size dimensions of the MPs captured by various studies is one fundamental constraint to comparing across studies (Ross et al., 2021). In our study, large-sized particles were observed and classified with a stereomicroscope (SteREO Discovery.V20, Zeiss, Germany), while the micron-sized plastics were characterized individually with μ-FTIR. A novel Wizard function quickly located all particles and determined the optimal aperture size for each particle. The length, width, number, and best materials matching the MP specimens were automatically collected by the software (Figure 2), providing a quick and effective identification of the small MPs in the sand. This could be the reason the range (93.3–4,433.3 n⋅kg–1) reported here is on the high end of previously reported MP concentrations in sediments and beach sand. It should be noted that the application of μ-FTIR spectroscopy for MP identification is generally limited to MPs larger than 10 μm. For those MPs smaller than this limit, the irregular shape of the particles may produce reflection errors, making the spectrum matching more challenging (Zarfl, 2019).
FIGURE 2
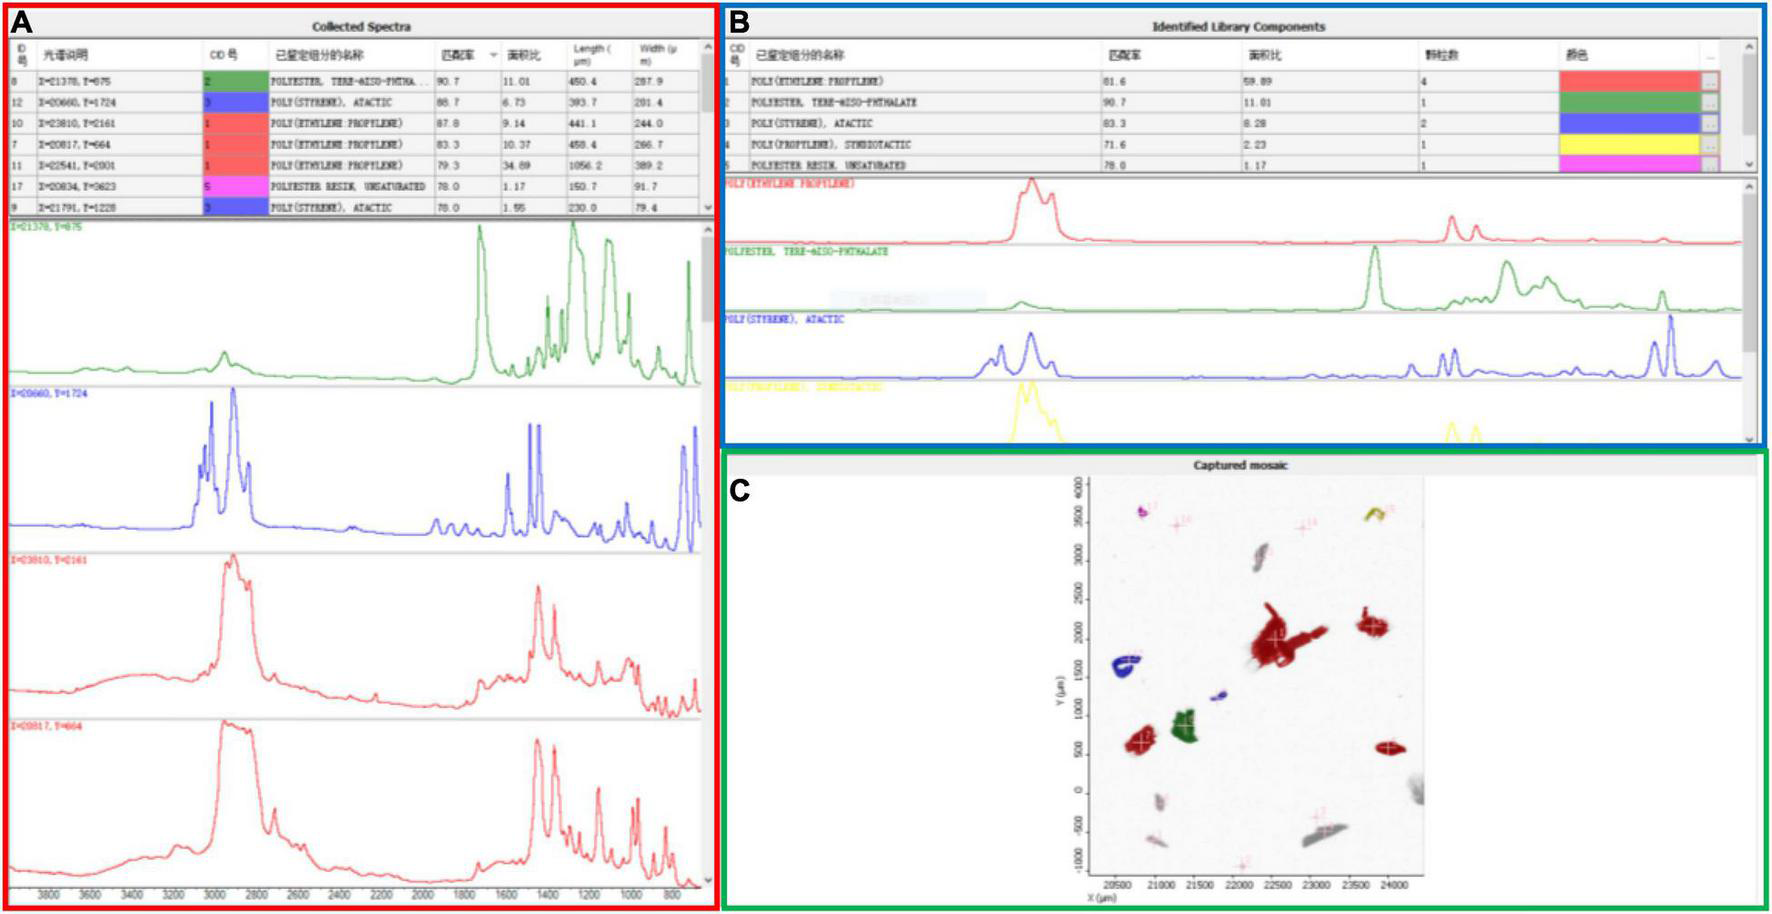
Representative analysis results for MPs collected from beach. The same color indicates the information from the same particle. (A) Collected spectra and information of each particle under the μ-Fourier transform infrared (μ-FTIR) spectroscopy, including particle position, identified component name, matching degree, and the length and width of the particle; (B) identified library components of these particles, reporting the number of particles; (C) scan results for gold-coated microslide with micron-size particles.
Characterization of Microplastics in the Beach Sand
Representative pictures of the MPs are shown in Figure 3. The MPs varied in size, color, shape, and texture, and some were coated or attached to unknown materials, possibly biofilms or organic debris. The abundance and size distribution of the total MPs and the different types of MPs are provided in Tables 1, 2, respectively. Smaller-sized MPs were much more abundant than larger ones (Table 1). In fact, most of the MPs detected in the sand were sized at less than 1 mm (Figure 4). All of the MPs were in this size class at the SZ-YC, SZ-JCW, SZ-YGW, BH-YT, ZJ-NJC, and QH-YDT sites. In GZ-NS, ZH-XLW, and FCG-WWJT, 3–4 mm sized MPs contributed around 5–10% of the total MPs. Such skewed size distributions are commonly observed for MPs in different environments (Liu et al., 2018; Scheurer and Bigalke, 2018; Zhang and Liu, 2018). Due to its good water permeability, beach sand can also act as a filter to retain small plastic particles in seawater. In addition, MPs can be continuously generated from the weathering of larger plastic debris on the beach. Their exposure to sunlight, frequent wave disturbance, and sand abrasion might also make the disintegration of plastic debris more common here than in other environments. Although the beach is a place accumulating substantial amounts of plastic waste and MPs from both the land and sea, much remains unknown about the effects of the plastic fragments and MPs on beach organisms. There is evidence that small MPs can be potentially ingested by sand-dwelling organisms such as crabs, polychaetes, and bivalves (Van Cauwenberghe and Janssen, 2014; Horn et al., 2020; Knutsen et al., 2020), which could be further transferred along food chains and affect human health (Mercogliano et al., 2020).
FIGURE 3
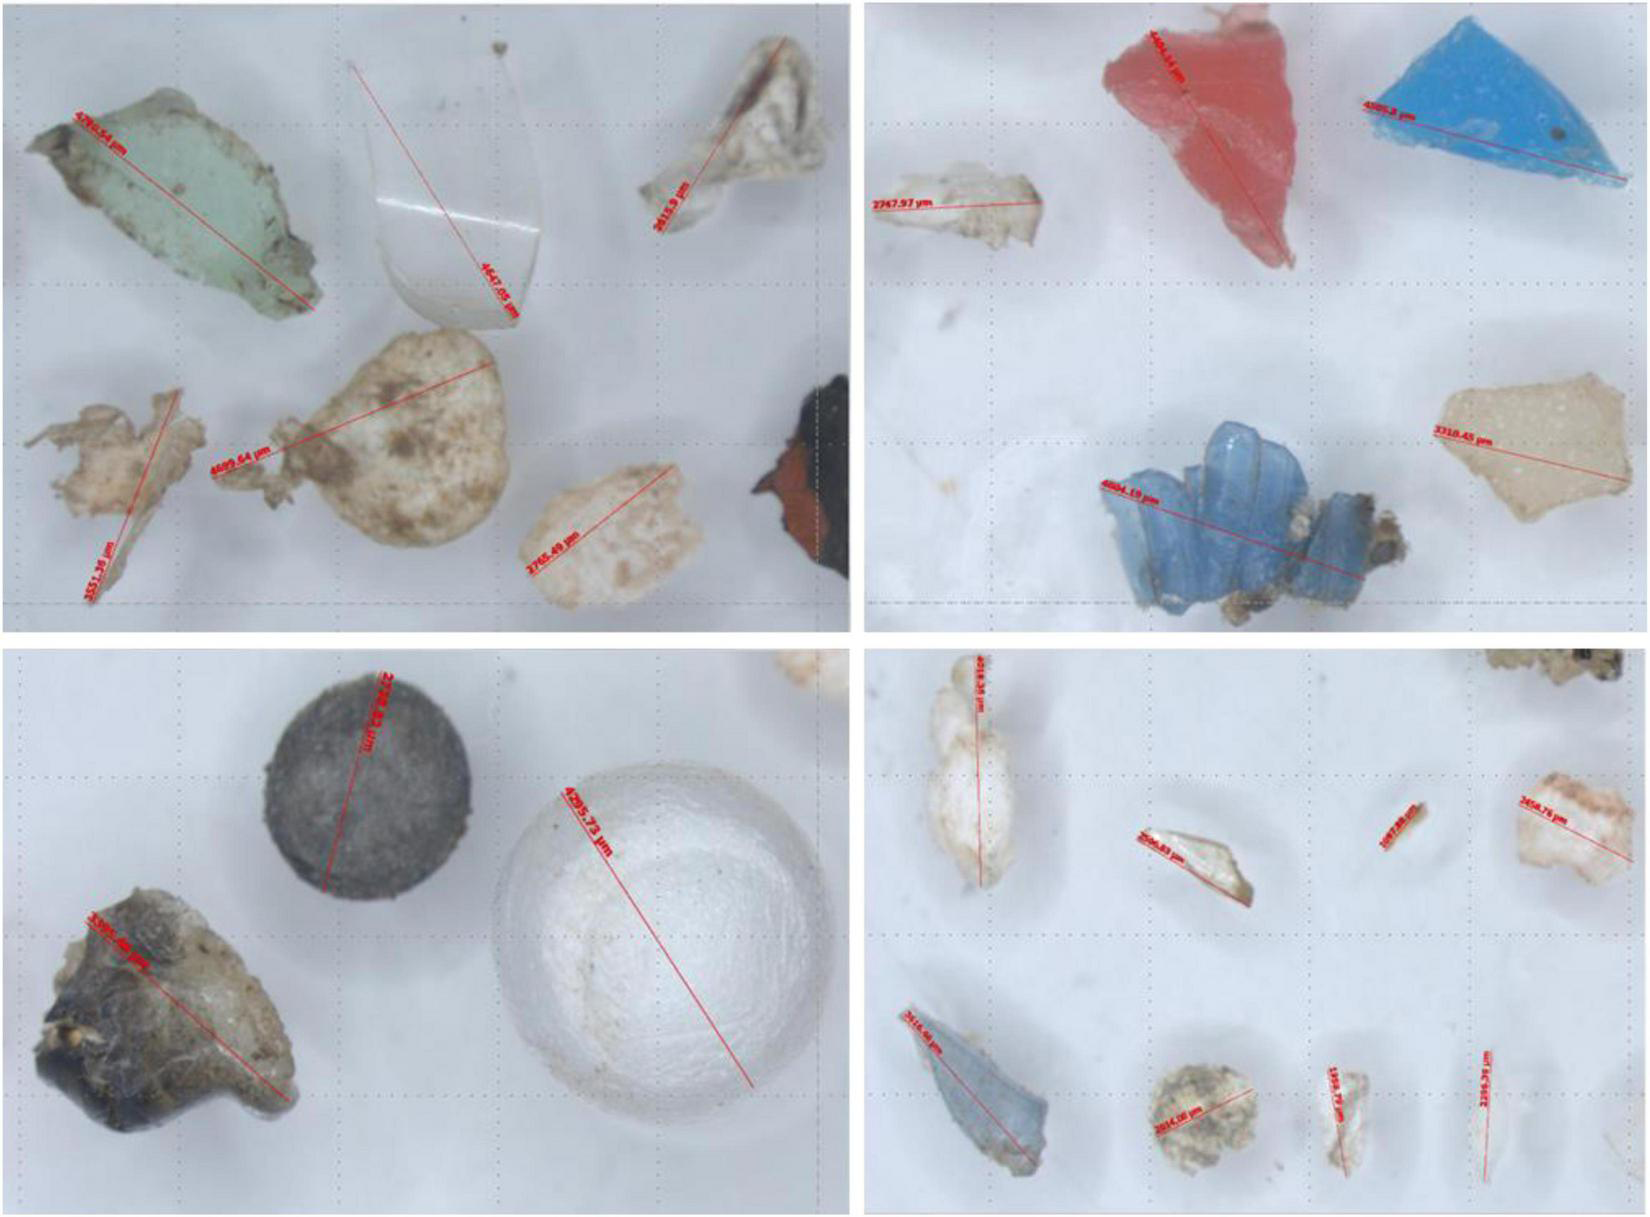
Pictures of microplastics (MPs) observed on the beaches of South China.
TABLE 2
| Site no. |
Site name |
PE | PS | PVC | PP | PP + PE | epoxy resin | PA | ABS | POM | PET | PU | AB | PTFE | AS | A | EVA | PBT | PMMA |
| 1 | ST-LHF | 146.7 ± 204.3 |
413.3 ± 612.3 |
6.7 ± 11.5 |
0.0 ± 0.0 |
0.0 ± 0.0 |
6.7 ± 11.5 |
13.3 ± 11.5 |
0.0 ± 0.0 |
0.0 ± 0.0 |
26.7 ± 30.6 |
6.7 ± 11.5 |
0.0 ± 0.0 |
0.0 ± 0.0 |
0.0 ± 0.0 |
0.0 ± 0.0 |
0.0 ± 0.0 |
0.0 ± 0.0 |
0.0 ± 0.0 |
| 2 | GZ-NS | 646.7 ± 105.0 |
556.7 ± 205.0 |
63.3 ± 50.3 |
116.7 ± 20.8 |
53.3 ± 35.1 |
140.0 ± 149.3 |
40.0 ± 45.8 |
3.3 ± 5.8 |
3.3 ± 5.8 |
16.7 ± 15.3 |
3.3 ± 5.8 |
0.0 ± 0.0 |
0.0 ± 0.0 |
0.0 ± 0.0 |
0.0 ± 0.0 |
0.0 ± 0.0 |
0.0 ± 0.0 |
0.0 ± 0.0 |
| 3 | SZ-SYC | 613.3 ± 144.7 |
140.0 ± 69.3 |
106.7 ± 80.8 |
280.0 ± 260.0 |
0.0 ± 0.0 |
693.3 ± 541.2 |
233.3 ± 387.0 |
13.3 ± 11.5 |
0.0 ± 0.0 |
60.0 ± 0.0 |
6.7 ± 11.5 |
0.0 ± 0.0 |
6.7 ± 11.5 |
0.0 ± 0.0 |
6.7 ± 11.5 |
0.0 ± 0.0 |
0.0 ± 0.0 |
0.0 ± 0.0 |
| 4 | SZ-XMS | 286.7 ± 210.1 |
473.3 ± 380.7 |
173.3 ± 102.1 |
116.7 ± 73.7 |
10.0 ± 17.3 |
180.0 ± 105.8 |
56.7 ± 41.6 |
10.0 ± 17.3 |
3.3 ± 5.8 |
26.7 ± 20.8 |
6.7 ± 11.5 |
10.0 ± 10.0 |
16.7 ± 28.9 |
6.7 ± 11.5 |
0.0 ± 0.0 |
0.0 ± 0.0 |
0.0 ± 0.0 |
0.0 ± 0.0 |
| 5 | SZ-JCW | 1093.3 ± 731.1 |
420.0 ± 539.3 |
26.7 ± 30.6 |
2300.0 ± 3724.6 |
0.0 ± 0.0 |
53.3 ± 30.6 |
133.3 ± 41.6 |
0.0 ± 0.0 |
0.0 ± 0.0 |
380.0 ± 363.9 |
20.0 ± 34.6 |
0.0 ± 0.0 |
0.0 ± 0.0 |
0.0 ± 0.0 |
0.0 ± 0.0 |
6.7 ± 11.5 |
0.0 ± 0.0 |
0.0 ± 0.0 |
| 6 | SZ-DC | 460.0 ± 624.8 |
6.7 ± 11.5 |
0.0 ± 0.0 |
33.3 ± 11.5 |
0.0 ± 0.0 |
0.0 ± 0.0 |
6.7 ± 11.5 |
0.0 ± 0.0 |
0.0 ± 0.0 |
93.3 ± 41.6 |
0.0 ± 0.0 |
0.0 ± 0.0 |
0.0 ± 0.0 |
0.0 ± 0.0 |
0.0 ± 0.0 |
0.0 ± 0.0 |
6.7 ± 11.5 |
0.0 ± 0.0 |
| 7 | SZ-YGW | 53.3 ± 50.3 |
0.0 ± 0.0 |
0.0 ± 0.0 |
13.3 ± 11.5 |
0.0 ± 0.0 |
0.0 ± 0.0 |
0.0 ± 0.0 |
0.0 ± 0.0 |
0.0 ± 0.0 |
26.7 ± 30.6 |
0.0 ± 0.0 |
0.0 ± 0.0 |
0.0 ± 0.0 |
0.0 ± 0.0 |
0.0 ± 0.0 |
0.0 ± 0.0 |
0.0 ± 0.0 |
0.0 ± 0.0 |
| 8 | ZH-XLW | 73.3 ± 11.5 |
160.0 ± 111.4 |
0.0 ± 0.0 |
93.3 ± 113.7 |
0.0 ± 0.0 |
0.0 ± 0.0 |
0.0 ± 0.0 |
0.0 ± 0.0 |
0.0 ± 0.0 |
33.3 ± 41.6 |
0.0 ± 0.0 |
0.0 ± 0.0 |
6.7 ± 11.5 |
0.0 ± 0.0 |
0.0 ± 0.0 |
0.0 ± 0.0 |
0.0 ± 0.0 |
0.0 ± 0.0 |
| 9 | FCG-WWJT | 246.7 ± 220.3 |
440.0 ± 610.2 |
40.0 ± 20.0 |
233.3 ± 253.2 |
0.0 ± 0.0 |
0.0 ± 0.0 |
20.0 ± 34.6 |
0.0 ± 0.0 |
0.0 ± 0.0 |
46.7 ± 80.8 |
0.0 ± 0.0 |
0.0 ± 0.0 |
20.0 ± 20.0 |
0.0 ± 0.0 |
0.0 ± 0.0 |
0.0 ± 0.0 |
0.0 ± 0.0 |
0.0 ± 0.0 |
| 10 | BH-YT | 320.0 ± 290.5 |
46.7 ± 23.1 |
26.7 ± 46.2 |
33.3 ± 41.6 |
0.0 ± 0.0 |
0.0 ± 0.0 |
6.7 ± 11.5 |
0.0 ± 0.0 |
0.0 ± 0.0 |
86.7 ± 50.3 |
6.7 ± 11.5 |
0.0 ± 0.0 |
0.0 ± 0.0 |
0.0 ± 0.0 |
0.0 ± 0.0 |
0.0 ± 0.0 |
0.0 ± 0.0 |
0.0 ± 0.0 |
| 11 | ZJ-NJC | 2260.0 ± 2605.9 |
20.0 ± 20.0 |
20.0 ± 20.0 |
240.0 ± 140.0 |
0.0 ± 0.0 |
0.0 ± 0.0 |
0.0 ± 0.0 |
0.0 ± 0.0 |
0.0 ± 0.0 |
33.3 ± 11.5 |
0.0 ± 0.0 |
6.7 ± 11.5 |
6.7 ± 11.5 |
0.0 ± 0.0 |
0.0 ± 0.0 |
0.0 ± 0.0 |
0.0 ± 0.0 |
0.0 ± 0.0 |
| 12 | DZ-YR | 133.3 ± 197.3 |
146.7 ± 236.9 |
0.0 ± 0.0 |
100.0 ± 100.0 |
0.0 ± 0.0 |
0.0 ± 0.0 |
0.0 ± 0.0 |
0.0 ± 0.0 |
0.0 ± 0.0 |
26.7 ± 46.2 |
113.3 ± 196.3 |
0.0 ± 0.0 |
0.0 ± 0.0 |
0.0 ± 0.0 |
0.0 ± 0.0 |
0.0 ± 0.0 |
0.0 ± 0.0 |
26.7 ± 46.2 |
| 13 | QH-YDT | 375.0 ± 513.9 |
20.0 ± 23.1 |
5.0 ± 10.0 |
140.0 ± 228.0 |
0.0 ± 0.0 |
0.0 ± 0.0 |
0.0 ± 0.0 |
0.0 ± 0.0 |
0.0 ± 0.0 |
15.0 ± 30.0 |
0.0 ± 0.0 |
0.0 ± 0.0 |
5.0 ± 10.0 |
0.0 ± 0.0 |
0.0 ± 0.0 |
0.0 ± 0.0 |
0.0 ± 0.0 |
5.0 ± 10.0 |
Types and abundance of MPs (n kg–1) in the surface sand (0–5 cm) collected from the beach along the coasts of South China.
Abbreviations for the MPs: PE, polyethylene; PS, polystyrene; PVC, polyvinyl chloride; PP, polypropylene; PP + PE, the mixture of PP + PE; PA, polyamide; ABS, the copolymer of acrylonitrile-butadiene-styrene; POM, polyoxymethylene; PET, polyethylene terephthalate; PU, polyurethane; AB, the copolymer of acrylonitrile-butadiene; PTFE, polytetrafluoroethylene; AS, the copolymer of acrylonitrile- styrene; A, acrylonitrile; EVA, ethylene-vinyl acetate; PBT, polybutylene terephthalate; PMMA, polymethyl methacrylate.
FIGURE 4
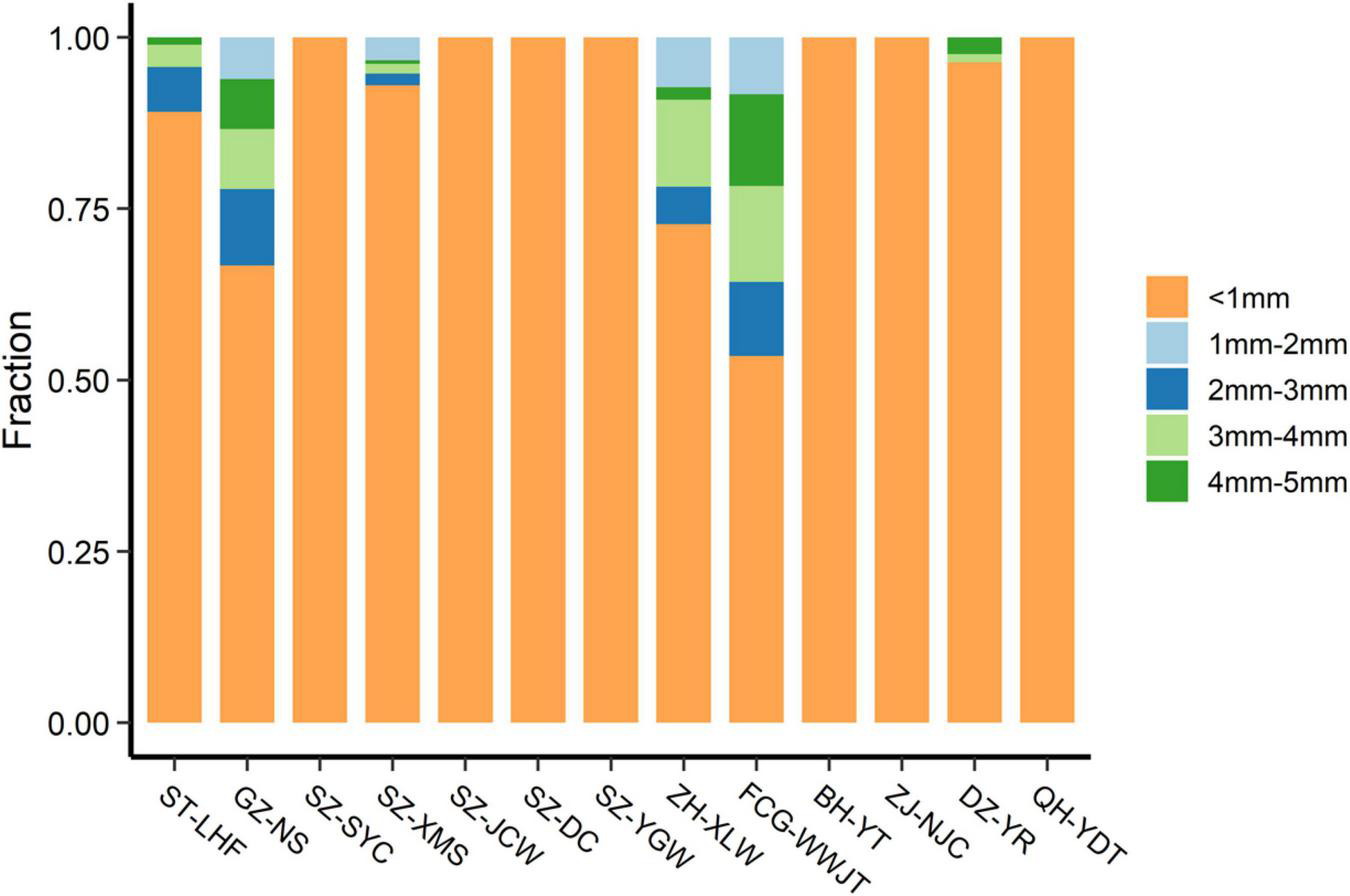
Proportion of MPs in different size at each sampling site.
Previous studies have only reported a few types of MPs, most of which were mainly based on size, color, or shape, while others have mainly focused on PE, PP, polyamide, PET, PS, and polyvinyl chloride (Li et al., 2018; Zhou et al., 2019; Yaranal et al., 2021). In our study, the texture of the MPs was analyzed by both FTIR-ATR and μ-FTIR analyses. A total of 18 polymers was detected in the sand samples, including various engineering plastics and modified plastics (Table 2 and Figure 5). Besides the above common plastics, acrylonitrile butadiene styrene, epoxy resin, polyformaldehyde, polytetrafluoroethylene, and poly (butylene terephthalate) were also detected in the sand, although their abundances were much lower. To the best of our knowledge, this is the most comprehensive report of MP diversity in beach environments.
FIGURE 5
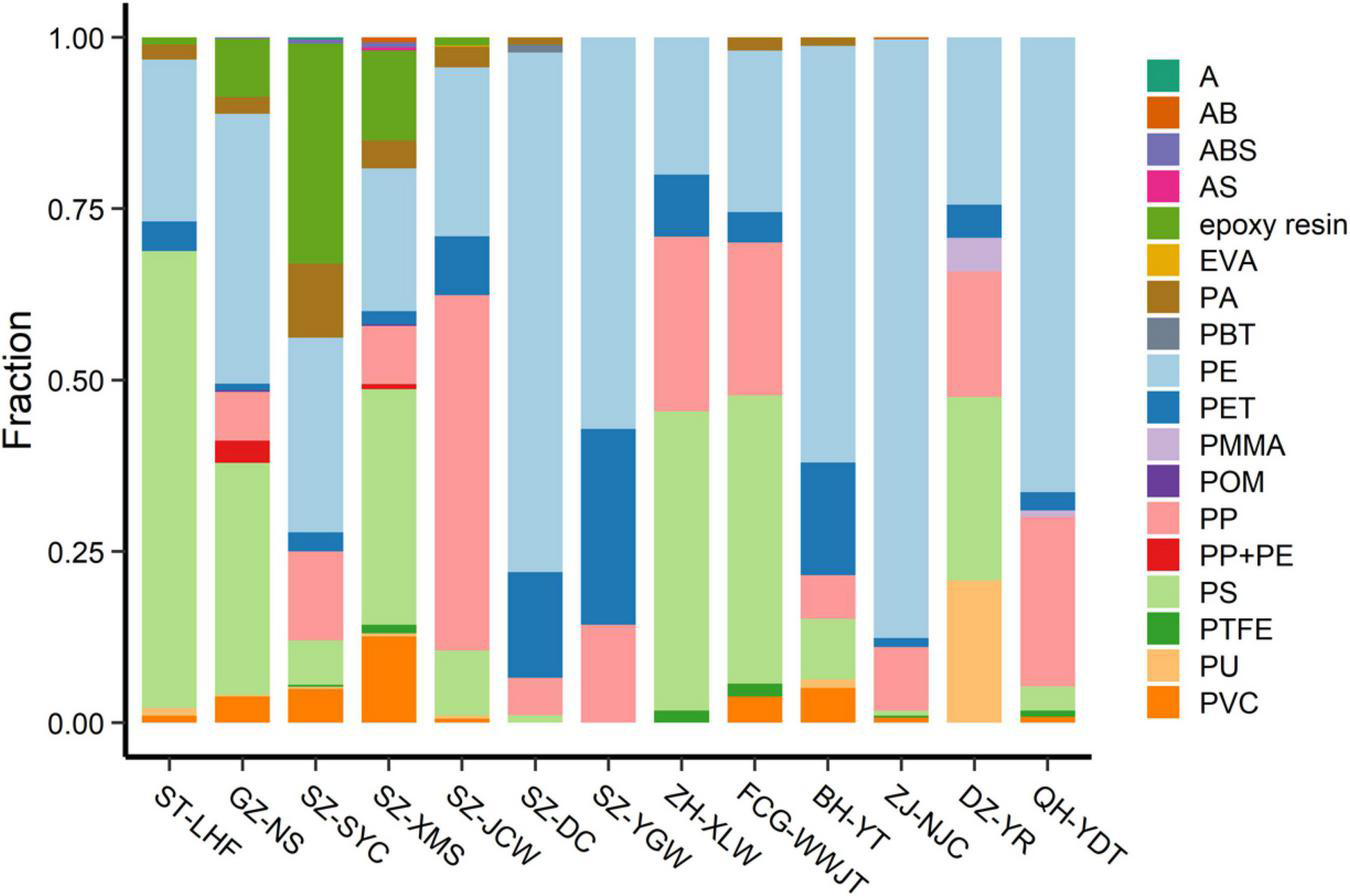
Percentage of different MPs at each sampling site. Abbreviations for the MPs: PE, polyethylene; PS, polystyrene; PVC, polyvinyl chloride; PP, polypropylene; PP + PE, the mixture of PP + PE; PA, polyamide; ABS, the copolymer of acrylonitrile-butadiene-styrene; POM, polyoxymethylene; PET, polyethylene terephthalate; PU, polyurethane; AB, the copolymer of acrylonitrile-butadiene; PTFE, polytetrafluoroethylene; AS, the copolymer of acrylonitrile- styrene; A, acrylonitrile; EVA, ethylene-vinyl acetate; PBT, polybutylene terephthalate; PMMA, polymethyl methacrylate.
Generally, PE, PP, and PS comprised a major portion of the MPs on the beaches (Figure 5). The abundance of PE, PP, and PS was 53.3–2,260.0 n⋅kg–1, 0–2,300 n⋅kg–1, 0–556.7 n⋅kg–1, respectively. Polyethylene accounted for 19–86% of the total counts, while PS contributed 26–66% at the ST-LHF, GZ-NS, SZ-XMS, ZH-XLW, FCG-WWJT, and DZ-YRST sites. Polypropylene was another important type of MP contamination at the SZ-JCW, ZH-XLW, FCG-WWJT, DZ-YRST, and QH-YDT sites, contributing 18–51% of the total MPs. At SZ-YC, epoxy resin, a class of reactive prepolymers and polymers that contain epoxide groups contributed nearly 30% of the total MPs. This kind of polymer was generally absent at most other sites, suggesting a point source could exist nearby. Overall, our study demonstrated that the MPs on the beaches were much more diverse than previous reports suggest.
Vertical Profile of Microplastics in the Beach Sand
The vertical distribution of MPs on the YJ-BLW beach is shown in Table 3 and Figure 6. The MP abundances were 26.0 ± 1.7, 53.3 ± 45.2, 5.3 ± 5.0, and 11.7 ± 10.6 n⋅kg–1 at the 0–10, 10–20, 20–30, and 30–40 cm depths, respectively. There was no significant difference between the 0–10 and 10–20 cm layers. However, the MP concentration was significantly higher in the two surface layers (0–20 cm) than in the deeper layers (20–40 cm, p < 0.01), suggesting a slow migration of the MPs downward. Figure 6 shows the depth-dependent abundance of the different MPs. Again, the largest proportion was PE. The MPs in the uppermost layer appeared more diverse than those in the other layers. As all of the MPs here were less than 1 mm, there was no significant difference in terms of the size distribution among the four layers. Because μ-FTIR is more effective in identifying MPs larger than 10 μm (Zarfl, 2019), much remains unknown about the vertical distribution of MPs smaller than this limit, especially for nanoplastics which are smaller than 1 μm. Whether the deeper layers of beaches are a sink for nanoplastics deserves further study in the future.
TABLE 3
| Depth | PE | PS | PVC | PP | PP + PE | epoxy resin | PA | ABS | POM | PET | PU | AB | PTFE | AS | A | EVA | PBT | PMMA | Total |
| 0–10 cm | 12.3 ± 7.5 |
2.0 ± 2.0 |
0.3 ± 0.6 |
1.0 ± 1.7 |
0.0 ± 0.0 |
0.33 ± 0.58 |
0.3 ± 0.6 |
0.0 ± 0.0 |
0.0 ± 0.0 |
6.7 ± 6.4 |
0.0 ± 0.0 |
0.0 ± 0.0 |
2.3 ± 1.5 |
0.0 ± 0.0 |
0.7 ± 0.6 |
0.0 ± 0.0 |
0.0 ± 0.0 |
0.0 ± 0.0 |
26.0 ± 1.7 |
| 10–20 cm | 37.3 ± 51.1 |
1.0 ± 1.0 |
2.0 ± 2.7 |
4.3 ± 2.9 |
0.0 ± 0.0 |
0.0 ± 0.0 |
0.0 ± 0.0 |
0.0 ± 0.0 |
0.0 ± 0.0 |
5.3 ± 1.2 |
0.3 ± 0.6 |
0.0 ± 0.0 |
3.0 ± 3.6 |
0.0 ± 0.0 |
0.0 ± 0.0 |
0.0 ± 0.0 |
0.0 ± 0.0 |
0.0 ± 0.0 |
53.3 ± 45.2 |
| 20–30 cm | 1.3 ± 1.5 |
1.3 ± 1.5 |
0.7 ± 0.6 |
1.0 ± 1.0 |
0.0 ± 0.0 |
0.0 ± 0.0 |
0.0 ± 0.0 |
0.0 ± 0.0 |
0.0 ± 0.0 |
0.7 ± 1.2 |
0.0 ± 0.0 |
0.0 ± 0.0 |
0.3 ± 0.6 |
0.0 ± 0.0 |
0.0 ± 0.0 |
0.0 ± 0.0 |
0.0 ± 0.0 |
0.0 ± 0.0 |
5.3 ± 5.0 |
| 30–40 cm | 7.7 ± 7.0 |
0.0 ± 0.0 |
0.7 ± 1.2 |
0.7 ± 0.6 |
0.0 ± 0.0 |
0.0 ± 0.0 |
0.0 ± 0.0 |
0.0 ± 0.0 |
0.0 ± 0.0 |
1.7 ± 1.5 |
0.0 ± 0.0 |
0.0 ± 0.0 |
0.7 ± 1.2 |
0.0 ± 0.0 |
0.3 ± 0.6 |
0.0 ± 0.0 |
0.0 ± 0.0 |
0.0 ± 0.0 |
11.7 ± 10.6 |
Vertical distribution of different MPs on the beach of Yangjiang (n kg–1).
Abbreviations for the MPs: PE, polyethylene; PS, polystyrene; PVC, polyvinyl chloride; PP, polypropylene; PP + PE, the mixture of PP + PE; PA, polyamide; ABS, the copolymer of acrylonitrile-butadiene-styrene; POM, polyoxymethylene; PET, polyethylene terephthalate; PU, polyurethane; AB, the copolymer of acrylonitrile-butadiene; PTFE, polytetrafluoroethylene; AS, the copolymer of acrylonitrile- styrene; A, acrylonitrile; EVA, ethylene-vinyl acetate; PBT, polybutylene terephthalate; PMMA, polymethyl methacrylate.
FIGURE 6
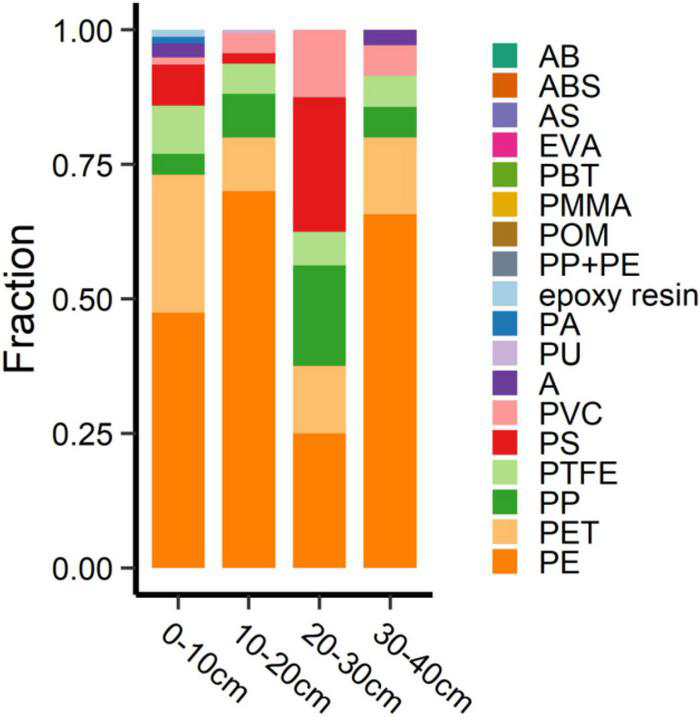
Depth-dependent percentage of different MPs at the Yangjiang beach. Abbreviations for the MPs: PE, polyethylene; PS, polystyrene; PVC, polyvinyl chloride; PP, polypropylene; PP + PE, the mixture of PP + PE; PA, polyamide; ABS, the copolymer of acrylonitrile-butadiene-styrene; POM, polyoxymethylene; PET, polyethylene terephthalate; PU, polyurethane; AB, the copolymer of acrylonitrile-butadiene; PTFE, polytetrafluoroethylene; AS, the copolymer of acrylonitrile- styrene; A, acrylonitrile; EVA, ethylene-vinyl acetate; PBT, polybutylene terephthalate; PMMA, polymethyl methacrylate.
Conclusion
This study described the distribution and characteristics of MPs on 14 beaches located on the coast of South China. Our results detected a ubiquitous distribution of MPs in the sand from the surface layers to a depth of 40 cm. Most of the beach MPs were small in size, particularly less than 1 mm. A total of 18 types of polymers were identified in the sand, suggesting that the types of MPs on beaches are much more diverse than indicated in previous reports. Polyethylene and PS comprised a major portion of the MPs on the beach, and at the site examined by depth, they were more abundant in the upper layers of the beach than in the deeper layers. More efforts are needed to clarify the vertical distribution of MPs in beach sand, especially for those MPs less than 1μm.
Publisher’s Note
All claims expressed in this article are solely those of the authors and do not necessarily represent those of their affiliated organizations, or those of the publisher, the editors and the reviewers. Any product that may be evaluated in this article, or claim that may be made by its manufacturer, is not guaranteed or endorsed by the publisher.
Statements
Data availability statement
The original contributions presented in the study are included in the article/Supplementary Material, further inquiries can be directed to the corresponding author.
Author contributions
BC: field sampling, conceived and designed the research, performed the experiments, analyzed data, and wrote the manuscript. YL: performed the experiments, analyzed data, and wrote the manuscript. LW, X-TZ, FC, and JM: field sampling and analyzed data. Y-PW: performed the experiments and analyzed data. KP: conceived and designed the research and wrote the manuscript. All authors contributed to the article and approved the submitted version.
Funding
This work was supported by the Shenzhen Science and Technology Innovation Commission of China (JCYJ20180507182227257 and KQTD20180412181334790), the Guangxi Key R&D Program of China (GUIKE AB20297018), Guangdong Basic and Applied Basic Research Foundation (2019A1515011630), the Fundamental Research Funds for the Central Universities of China (21621054), and Medical Scientific Research Foundation of Guangdong Province of China (20191118142729581).
Conflict of interest
The authors declare that the research was conducted in the absence of any commercial or financial relationships that could be construed as a potential conflict of interest.
Supplementary material
The Supplementary Material for this article can be found online at: https://www.frontiersin.org/articles/10.3389/fmars.2022.863652/full#supplementary-material
References
1
Andrady A. L. (2015). “Persistence of plastic litter in the oceans,” in Marine anthropogenic litter, edsBergmannM.GutowL.KlagesM. (Cham: Springer), 57–72. 10.1007/978-3-319-16510-3_3
2
Beiras R. Schönemann A. M. (2020). Currently monitored microplastics pose negligible ecological risk to the global ocean.Sci. Rep.10:22281.
3
Brown A. C. McLachlan A. (2002). Sandy shore ecosystems and the threats facing them: some predictions for the year 2025.Environ. Conserv.2962–77. 10.1017/s037689290200005x
4
Burns E. E. Boxall A. B. (2018). Microplastics in the aquatic environment: evidence for or against adverse impacts and major knowledge gaps.Environ. Toxicol. Chem.372776–2796.
5
Chai B. Wei Q. She Y. Lu G. Dang Z. Yin H. (2020). Soil microplastic pollution in an e-waste dismantling zone of China.Waste Manag.118291–301. 10.1016/j.wasman.2020.08.048
6
Defeo O. McLachlan A. Armitage D. Elliott M. Pittman J. (2021). Sandy beach social–ecological systems at risk: regime shifts, collapses, and governance challenges.Front. Ecol. Environ.19564–573. 10.1002/fee.2406
7
Dekiff J. H. Remy D. Klasmeier J. Fries E. (2014). Occurrence and spatial distribution of microplastics in sediments from Norderney.Environ. Pollut.186248–256. 10.1016/j.envpol.2013.11.019
8
De-la-Torre G. E. Dioses-Salinas D. C. Castro J. M. Antay R. Fernández N. Y. Espinoza-Morriberón D. et al (2020). Abundance and distribution of microplastics on sandy beaches of Lima, Peru.Mar. Pollut. Bull.151:110877. 10.1016/j.marpolbul.2019.110877
9
Frias J. P. G. L. Nash R. (2019). Microplastics: finding a consensus on the definition.Mar. Pollut. Bull.138145–147. 10.1016/j.marpolbul.2018.11.022
10
Galgani F. Hanke G. Maes T. (2015). “Global distribution, composition and abundance of marine litter,” in Marine anthropogenic litter, edsBergmannM.GutowL.KlagesM. (Cham: Springer), 29–56. 10.1007/978-3-319-16510-3_2
11
Godoy V. Prata J. C. Blázquez G. Almendros A. I. Duarte A. C. Rocha-Santos T. et al (2020). Effects of distance to the sea and geomorphological characteristics on the quantity and distribution of microplastics in beach sediments of Granada (Spain).Sci. Total Environ.746:142023. 10.1016/j.scitotenv.2020.142023
12
Hidalgo-Ruz V. Gutow L. Thompson R. C. Thiel M. (2012). Microplastics in the marine environment: a review of the methods used for identification and quantification.Environ. Sci. Technol.463060–3075. 10.1021/es2031505
13
Horn D. A. Granek E. F. Steele C. L. (2020). Effects of environmentally relevant concentrations of microplastic fibers on Pacific mole crab (Emerita analoga) mortality and reproduction.Limnol. Oceanogr. Lett.574–83. 10.1002/lol2.10137
14
Ivar do Sul J. A. Costa M. F. (2014). The present and future of microplastic pollution in the marine environment.Environ. Pollut.185352–364. 10.1016/j.envpol.2013.10.036
15
Jambeck J. R. Geyer R. Wilcox C. Siegler T. R. Perryman M. Andrady A. et al (2015). Plastic waste inputs from land into the ocean.Science347768–771. 10.1126/science.1260352
16
Knutsen H. Cyvin J. B. Totland C. Lilleeng Ø Wade E. J. Castro V. et al (2020). Microplastic accumulation by tube-dwelling, suspension feeding polychaetes from the sediment surface: a case study from the Norwegian Continental Shelf.Mar. Environ. Res.161:105073. 10.1016/j.marenvres.2020.105073
17
Laglbauer B. J. Franco-Santos R. M. Andreu-Cazenave M. Brunelli L. Papadatou M. Palatinus A. et al (2014). Macrodebris and microplastics from beaches in Slovenia.Mar. Pollut. Bull.89356–366. 10.1016/j.marpolbul.2014.09.036
18
Li D. Liu K. Li C. Peng G. Andrady A. L. Wu T. et al (2020). Profiling the vertical transport of microplastics in the West Pacific Ocean and the East Indian Ocean with a novel in situ filtration technique.Environ. Sci. Technol.5412979–12988. 10.1021/acs.est.0c02374
19
Li J. Zhang H. Zhang K. Yang R. Li R. Li Y. (2018). Characterization, source, and retention of microplastic in sandy beaches and mangrove wetlands of the Qinzhou Bay, China.Mar. Pollut. Bull.136401–406. 10.1016/j.marpolbul.2018.09.025
20
Liu M. Lu S. Song Y. Lei L. Hu J. Lv W. et al (2018). Microplastic and mesoplastic pollution in farmland soils in suburbs of Shanghai, China.Environ. Pollut.242855–862. 10.1016/j.envpol.2018.07.051
21
Lusher A. L. Tirelli V. O’Connor I. Officer R. (2015). Microplastics in Arctic polar waters: the first reported values of particles in surface and sub-surface samples.Sci. Rep.51–9. 10.1038/srep14947
22
Mazariegos-Ortíz C. de los Ángeles Rosales M. Carrillo-Ovalle L. Cardoso R. P. Muniz M. C. Dos Anjos R. M. (2020). First evidence of microplastic pollution in the El Quetzalito sand beach of the Guatemalan Caribbean.Mar. Pollut. Bull.156:111220. 10.1016/j.marpolbul.2020.111220
23
McLachlan A. Defeo O. (2017). The ecology of sandy shores.Cambridge, Massachusetts: Academic press.
24
Mercogliano R. Avio C. G. Regoli F. Anastasio A. Colavita G. Santonicola S. (2020). Occurrence of microplastics in commercial seafood under the perspective of the human food chain. A review.J. Agric. Food Chem.685296–5301. 10.1021/acs.jafc.0c01209
25
Nuelle M. T. Dekiff J. H. Remy D. Fries E. (2014). A new analytical approach for monitoring microplastics in marine sediments.Environ. Pollut.184161–169. 10.1016/j.envpol.2013.07.027
26
Patchaiyappan A. ZakiAhmed S. Dowarah K. Khadanga S. S. Singh T. Jayakumar S. et al (2021). Prevalence of microplastics in the sediments of Odisha beaches, southeastern coast of India.Mar. Pollut. Bull.167:112265. 10.1016/j.marpolbul.2021.112265
27
Peng Y. Wu P. Schartup A. T. Zhang Y. (2021). Plastic waste release caused by COVID-19 and its fate in the global ocean.Proc. Natl. Acad. Sci. U. S. A.118:e2111530118. 10.1073/pnas.2111530118
28
Phuong N. N. Poirier L. Lagarde F. Kamari A. Zalouk-Vergnoux A. (2018). Microplastic abundance and characteristics in French Atlantic coastal sediments using a new extraction method.Environ. Pollut.243228–237. 10.1016/j.envpol.2018.08.032
29
Ross P. S. Chastain S. Vassilenko E. Etemadifar A. Zimmermann S. Quesnel S. A. et al (2021). Pervasive distribution of polyester fibres in the Arctic Ocean is driven by Atlantic inputs.Nat. Commun.121–9. 10.1038/s41467-020-20347-1
30
Scheurer M. Bigalke M. (2018). Microplastics in Swiss floodplain soils.Environ. Sci. Technol.523591–3598. 10.1021/acs.est.7b06003
31
Shim W. J. Hong S. H. Eo S. E. (2017). Identification methods in microplastic analysis: a review.Anal. Methods91384–1391. 10.1039/c6ay02558g
32
Silva-Cavalcanti J. S. Barbosa de Araujo M. C. Ferreira da Costa M. (2009). Plastic litter on an urban beach—a case study in Brazil.Waste Manag. Res.2793–97. 10.1177/0734242X08088705
33
Thompson R. C. Olsen Y. Mitchell R. P. Davis A. Rowland S. J. John A. W. et al (2004). Lost at sea: where is all the plastic?Science304838–838.
34
Tiwari M. Rathod T. D. Ajmal P. Y. Bhangare R. C. Sahu S. K. (2019). Distribution and characterization of microplastics in beach sand from three different Indian coastal environments.Mar. Pollut. Bull.140262–273. 10.1016/j.marpolbul.2019.01.055
35
Van Cauwenberghe L. Janssen C. R. (2014). Microplastics in bivalves cultured for human consumption.Environ. Pollut.19365–70. 10.1016/j.envpol.2014.06.010
36
Wang C. Zhao J. Xing B. (2021). Environmental source, fate, and toxicity of microplastics.J. Hazard. Mater.407:124357. 10.1016/j.jhazmat.2020.124357
37
Yaranal N. A. Subbiah S. Mohanty K. (2021). Distribution and characterization of microplastics in beach sediments from Karnataka (India) coastal environments.Mar. Pollut. Bull.169:112550. 10.1016/j.marpolbul.2021.112550
38
Yu X. Peng J. Wang J. Wang K. Bao S. (2016). Occurrence of microplastics in the beach sand of the Chinese inner sea: the Bohai Sea.Environ. Pollut.214722–730. 10.1016/j.envpol.2016.04.080
39
Zarfl C. (2019). Promising techniques and open challenges for microplastic identification and quantification in environmental matrices.Anal. Bioanal. Chem.4113743–3756. 10.1007/s00216-019-01763-9
40
Zhang G. S. Liu Y. F. (2018). The distribution of microplastics in soil aggregate fractions in southwestern China.Sci. Total Environ.64212–20.
41
Zhou Y. Liu X. Wang J. (2019). Characterization of microplastics and the association of heavy metals with microplastics in suburban soil of central China.Sci. Total Environ.694:133798. 10.1016/j.scitotenv.2019.133798
Summary
Keywords
microplastics, contamination, beach, μ-FTIR, South China
Citation
Chai B, Li Y, Wang L, Zhang X-T, Wan Y-P, Chen F, Ma J, Lan W and Pan K (2022) Microplastic Contamination on the Beaches of South China. Front. Mar. Sci. 9:863652. doi: 10.3389/fmars.2022.863652
Received
27 January 2022
Accepted
25 February 2022
Published
25 March 2022
Volume
9 - 2022
Edited by
Xiangrong Xu, South China Sea Institute of Oceanology (CAS), China
Reviewed by
Bin Xia, Chinese Academy of Fishery Sciences (CAFS), China; Huifeng Wu, Yantai Institute of Coastal Zone Research (CAS), China
Updates
Copyright
© 2022 Chai, Li, Wang, Zhang, Wan, Chen, Ma, Lan and Pan.
This is an open-access article distributed under the terms of the Creative Commons Attribution License (CC BY). The use, distribution or reproduction in other forums is permitted, provided the original author(s) and the copyright owner(s) are credited and that the original publication in this journal is cited, in accordance with accepted academic practice. No use, distribution or reproduction is permitted which does not comply with these terms.
*Correspondence: Ke Pan, panke@szu.edu.cn
†These authors have contributed equally to this work
This article was submitted to Marine Pollution, a section of the journal Frontiers in Marine Science
Disclaimer
All claims expressed in this article are solely those of the authors and do not necessarily represent those of their affiliated organizations, or those of the publisher, the editors and the reviewers. Any product that may be evaluated in this article or claim that may be made by its manufacturer is not guaranteed or endorsed by the publisher.