Abstract
We examine the main drivers that may elevate biomass and biodiversity of non-chemosynthetic benthic megafauna of the lower bathyal (800-3500m depth) of the Mid-Atlantic Ridge in the North Atlantic Ocean (MAR). Specifically: 1. Primary production in surface waters (10°-48°N) from remote sensing data 2002-2020 over the MAR was not significantly different from abyssal regions to the east and west. We reject the hypothesis that presence of a mid ocean ridge may enhance surface primary production. 2. The quantity of particulate organic matter reaching the sea floor was estimated as a proportion of surface export production scaled by bathymetry. Flux was 1.3 to 3.0 times greater on the MAR as a function of shorter vertical transport distance from the surface than on adjacent abyssal regions. 3. Depth variation effect on species richness. Demersal fishes living between 41° and 60°N showed a maximum of species richness at 2000 m depth and linear increase in regional (Gamma) diversity of 32 species per 1,000 m elevation of the MAR above the abyss. Elevated topography provides niches for species that cannot otherwise survive. 4. Substrate heterogeneity. The MAR >95% covered with soft sediment with frequent hard rocky patches spaced at a mean nearest neighbour distance of <500 m. Over 90% were <1 km apart. Animals are readily able to disperse between such patches increasing biodiversity through the additive effect of soft and hard substrate fauna on the MAR. 5. Presence of a biogeographic overlap zone. The MAR harbours bathyal species known from Western Atlantic and Eastern Atlantic continental slopes with meridional asymmetry resulting in bias toward predominance of Eastern species. The mix of species contributes to increased diversity to the east of the MAR. Multiple factors support increase in biomass and biodiversity on the MAR. Biological data are almost entirely absent from 12° to 33°N, the part of the MAR which may be mined for polymetallic sulphide ore deposits. This study enables some predictions of biomass and biodiversity but there is urgent need for intensive biological sampling across the MAR throughout the proposed mining areas south of the Azores.
Introduction
The global mid ocean ridge system is one of the largest geomorphological features on the planet. It extends over 65,000 km through all the major oceans (Searle, 2013). The elevated seafloor in mid-ocean regions hosts greater biomass and biodiversity than the surrounding abyssal plains located between 3500 - 6500 m depth (UNESCO, 2009; Vecchione et al., 2010). Much attention has been directed to the specialized chemosynthetically sustained communities living on hydrothermal vent systems distributed along the ridge axis (Van Dover, 2000). However, most of the biomass on the ridge system is dependent on the sinking export of particulate organic matter derived from plankton production occurring in the sunlit surface layers of the ocean (Priede et al., 2013a). This photosynthetically dependent fauna comprises representatives of all forms of deep-sea life, including interstitial and burrowing species living in sediments, surface browsers, sessile species attached to hard substrates, and predators on and above the sea floor.
Here we consider the diversity and abundance of sessile and mobile megafauna including demersal fishes living at lower bathyal depths (800-3500 m) as defined by UNESCO (2009). Although the energy source for this fauna is export production from the surface, how this is transformed into biomass and diversity is determined by factors related to the topography of the MAR and processes of colonisation. Patterns of primary production in the surface layers and export of organic carbon to the seafloor can be regarded as fundamental drivers. Elevation of the sea floor, diversity of substrates, hydrography and biographic considerations are additional drivers that support enhanced benthic biomass and biodiversity on the MAR compared with the adjacent abyssal plains. Our study focusses on following main drivers
Primary Production in Surface Waters Over the MAR
Water flow around oceanic islands (Pollard et al., 2007) and seamounts (White et al., 2008) can result in advection of nutrients to surface layers, enhancing primary production and increased export flux to the deep-sea floor. However, White et al. (2008) point out that evidence for enhancement effects over seamounts is highly variable and inconclusive. Furthermore, phytoplankton blooms in the vicinity of islands occur at some distance from the islands themselves as nutrients are carried downstream on prevailing currents (Pollard et al., 2007; Messié et al., 2020). Over the relatively shallow northern Reykjanes segment of the MAR, there is evidence of localised elevated primary production compared with the adjacent Central Irminger Sea and Iceland Basin (Miller et al., 2013; Tilstone et al., 2014). Here we undertake a more extensive evaluation of patterns of primary production and export flux over the MAR between 10° and 48°N.
Export Production Over the MAR
A major pathway for export of primary production from the surface layers to the deep sea is the continuous rain of particulate organic carbon (POC). This flux is attenuated with depth by consumption, respiration, and remineralization in the water column so that typically only 1-5% of export production reaches abyssal depths (Deuser et al., 1990; Lampitt and Antia, 1997; Smith et al., 2009). Muller-Karger et al. (2005) quantified the global POC flux arriving on the sea floor and buried in the sediments by estimating the net primary production (NPP) from remote sensing data and applying a depth-dependent exponential decay model. This analysis showed the importance of shallow ocean margins for carbon sequestration in the context of the global ocean carbon cycle. Here we extend this model to estimate the magnitude and variability of the sinking POC flux on the MAR compared with surrounding abyssal areas. We also examine the potential influence of this deep sea POC flux on benthic biomass.
Depth Variability in the MAR
Deep-sea animals generally have preferred depths resulting in restricted distributions within narrow depth ranges due to hydrostatic pressure tolerance (Macdonald, 2021) and hydrographic conditions, bottom substrate and interspecific competition (Rowe and Menzies, 1969; King et al., 2006). Perez et al. (2020) show that on the São Paulo Ridge in the SW Atlantic topography-related deep-water flow dynamics and interfaces between water masses at different depths are the main drivers of benthic megafauna distribution. Living cold water corals occur within a narrow range seawater density found at particular depths in the NE Atlantic (Dullo et al., 2008) and aggregations of zooplankton and fish tend to occur over abrupt topographies (Genin, 2004). In some cases, there are fundamental physiological depth limitations, for example amongst fishes few sharks can survive at depths greater than 3000 m (Priede et al., 2006; Treberg and Speers-Roesch, 2016). On continental slopes these depth limits result in species turnover, or species replacement along the depth gradient hence increasing Beta diversity (Rex and Etter, 2010). On continental slopes, both invertebrates (Rex and Etter, 2010) and fishes (Priede et al., 2010) show a maximum of species diversity at mid-slope depths. Here we analyse the trends in biodiversity with depth on the Mid-Atlantic Ridge.
Substrate Heterogeneity on the MAR
The MAR is an undersea mountain range, but despite the rugged topography, Niedzielski et al. (2013) found that between 42° and 56°N it is 95% sediment covered with relatively smooth contours including flat terraces. The slow seafloor spreading rate at the MAR (Searle, 2013) has allowed 50-250 m thick sediment to accumulate on the MAR (Straume et al., 2019) at a rate of a few centimetres per year (Restreppo et al., 2020) obscuring most of the underlying hard oceanic crust. Riehl et al. (2020) highlight the importance of relatively rare exposed abyssal rock patches that can support sessile deep-sea fauna such as Bryozoa, Porifera, or Cnidaria. They estimate that fracture zones provide over 260,000 km2 of hard rock habitat, equivalent to ca. 0.5% of area in the deep North Atlantic. Niedzielski et al. (2013) found that 4% of the MAR was exposed hard rock, including vertical cliffs and rocky outcrops, providing a greater area of hard substrate than available on the surrounding abyssal plains. Here we extend this analysis to examine the spatial distribution of rocky patches to evaluate whether colonisation by sessile fauna is enhanced by reduced dispersal distances and hence greater connectivity between suitable habitats.
Biogeographic Overlap Zones in and Around the MAR
Dispersal of benthic species from the continental slope into the open ocean (on island slopes, seamounts, and mid-ocean ridges) may occur in two stages (Mironov, 2014; Mironov et al., 2015): first, dispersal goes along the continental slope, and second, some species with adaptations to the open-ocean environment disperse from the near-continental zone into the open ocean. There are significant differences in the near-continental environment and the environment of the open ocean. For example, in the open ocean there is a decrease in the amount of organic matter, both in the water column and in sediments (Sokolova, 2000) as well as discontinuities in substrate composition at certain slope depths. As a result, the number of bathyal species decreases beyond a maximum diversity depth in the near-continental zone (Rex and Etter, 2010). In the Atlantic Ocean, colonisation occurs from continental slopes in the West and in the East, with biodiversity gradually decreasing towards the open ocean. Where the East and West Atlantic faunas meet on the Mid-Atlantic Ridge there may be an increase in mid-ocean biodiversity. Furthermore, the distance between the MAR and nearest continental slopes may give rise to population isolation and endemism amongst some of the fauna. Here we review the evidence for biogeographic mid-ocean domain effects that may explain biodiversity observed on the MAR. (Figure 1).
Figure 1
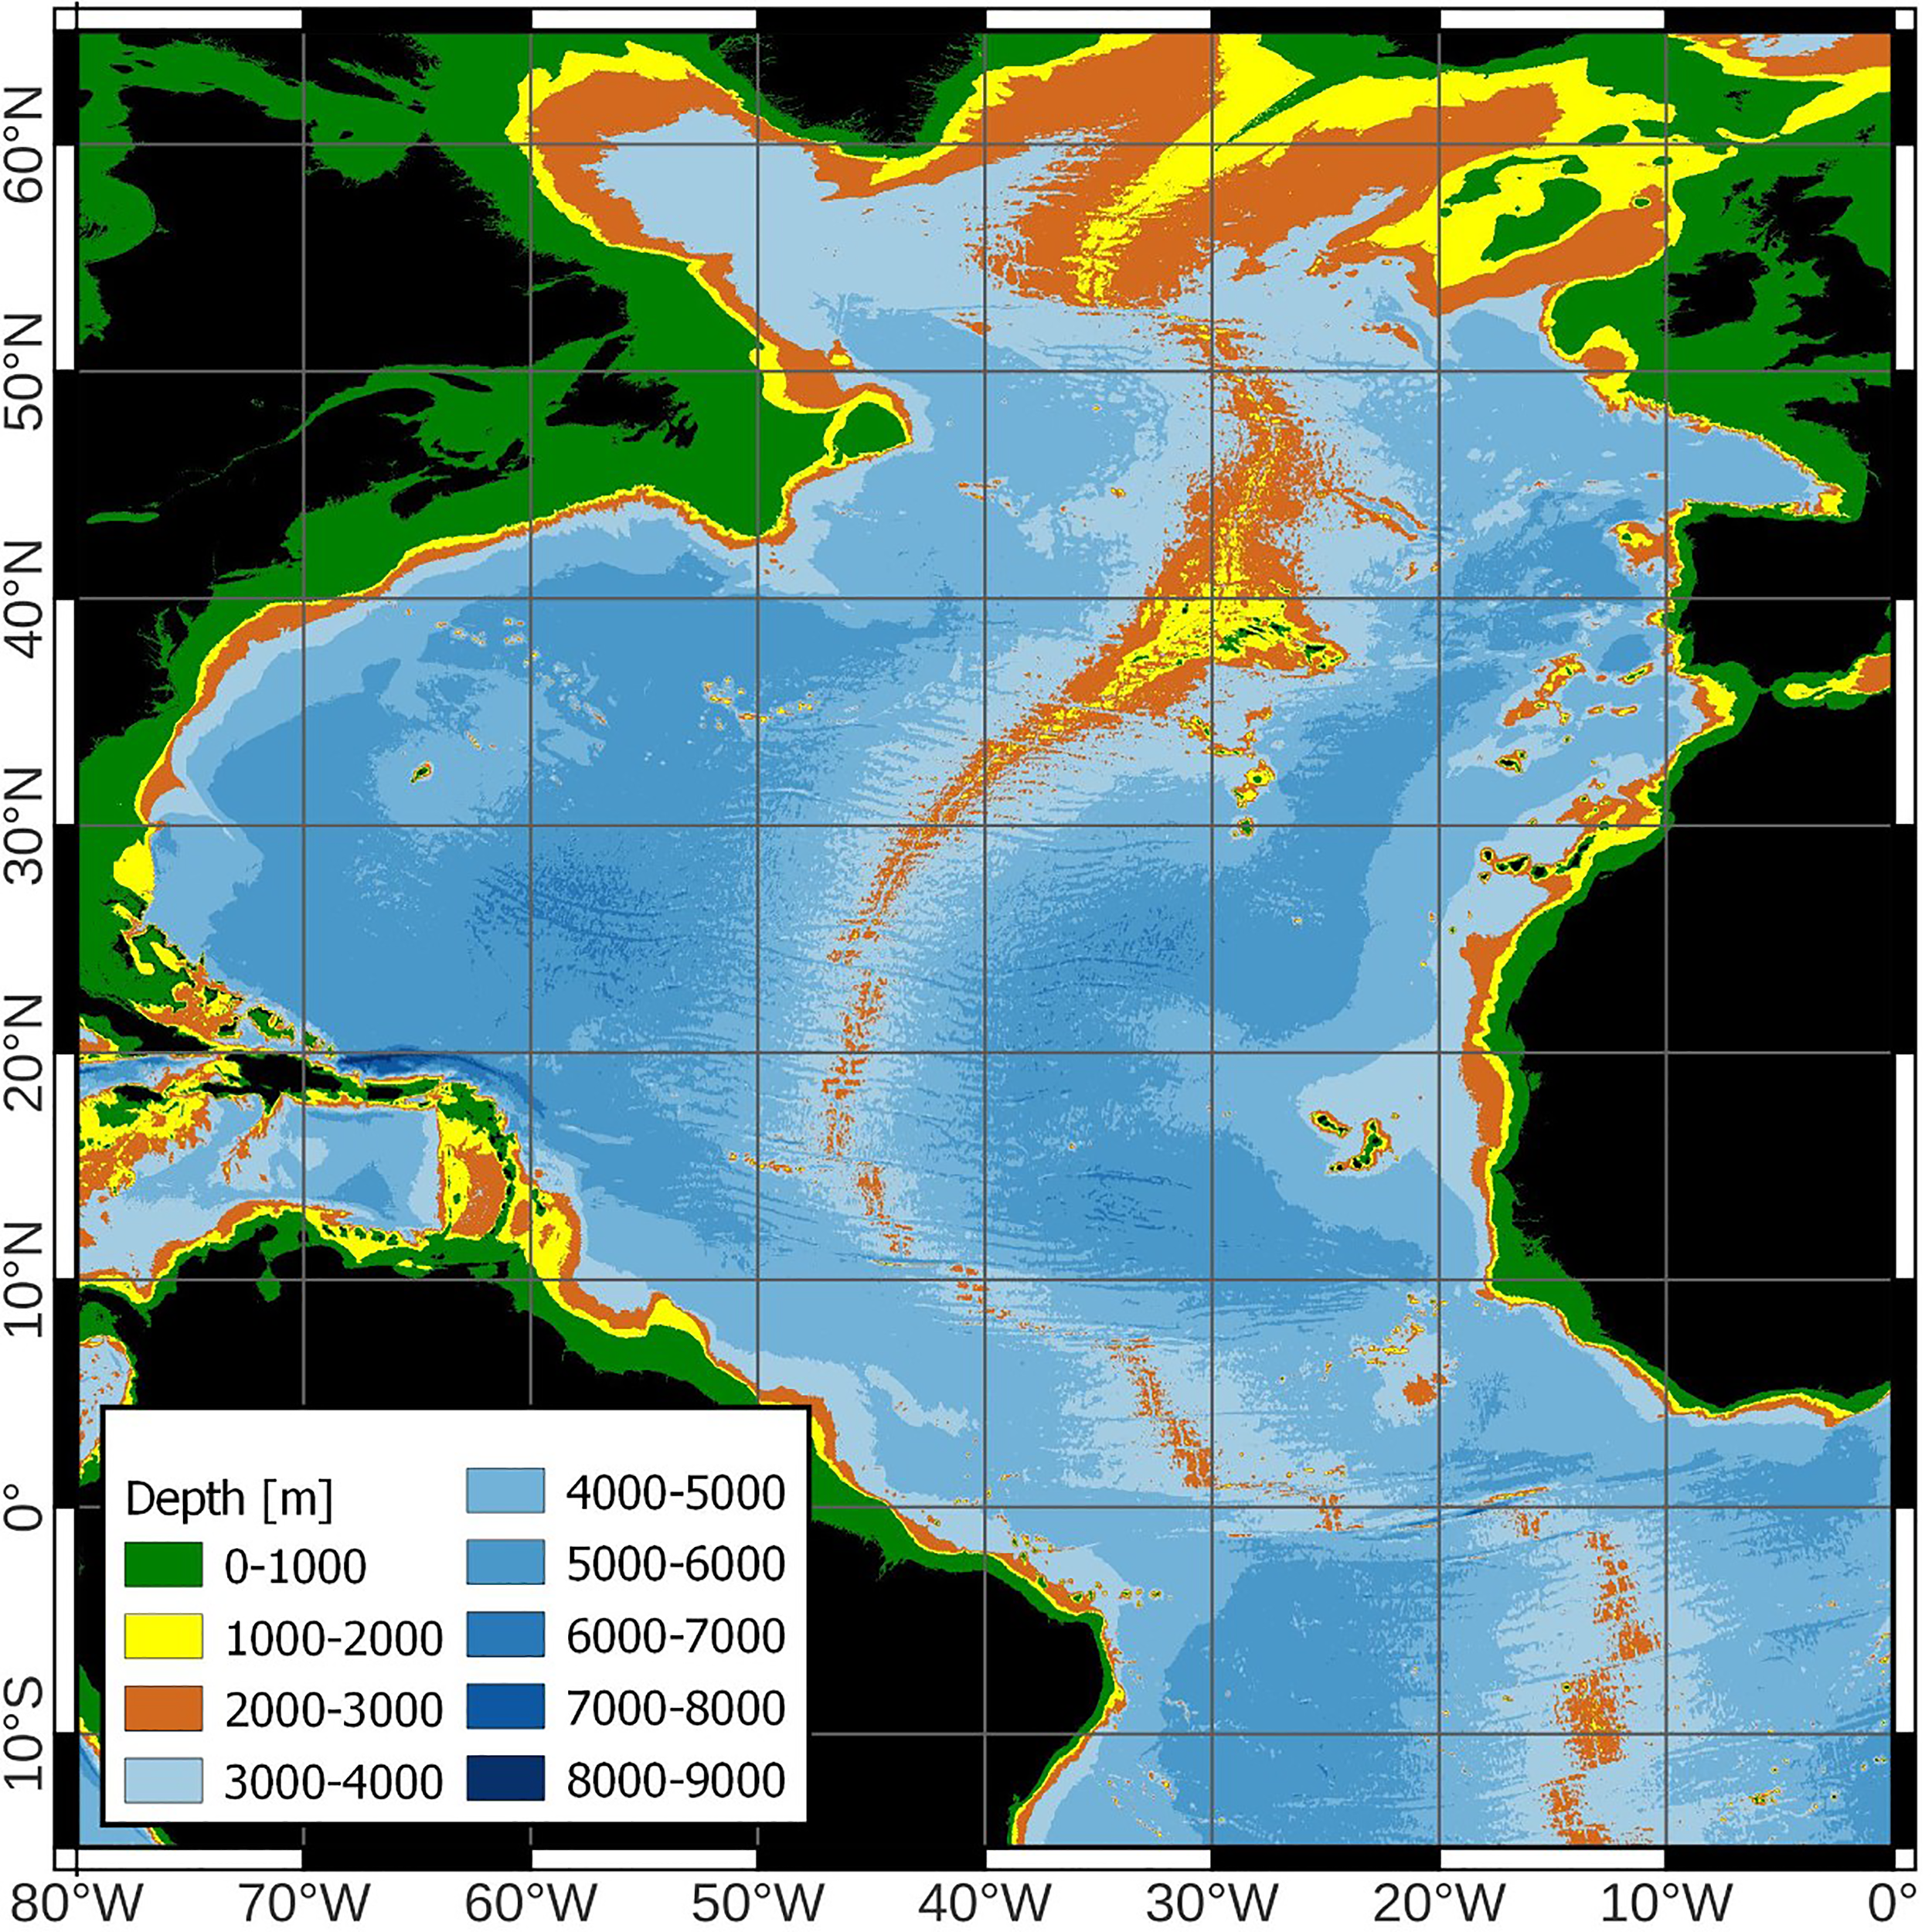
Chart of the North Atlantic Ocean showing the Mid-Atlantic Ridge.
Scope of this Study
Here we examine patterns of net primary production (NPP) and sinking particulate organic carbon (POC) flux for the part of the MAR between 10° and 48°N using satellite remote sensing. The area to the south was excluded because it is influenced by the North Equatorial Current and a strong ocean colour signal from the Amazon River plume (Muller-Karger et al., 1995). The area north of 48° was excluded because of limitations in the availability of ocean colour satellite data products with seasons (see below). The MAR area to the north has been the subject of extensive previous research (Read et al., 2010; Miller et al., 2013; Tilstone et al., 2014). The part of the MAR between 12°N and 33°N which is being explored for mining of polymetallic sulphides under the auspices of the International Seabed Authority (Billett et al., 2019) is within this area examined using satellite data, but we have limited data on the benthic fauna for this region.
The rest of the analyses in this paper are largely derived from two major studies carried out on the MAR as part of the Census of Marine Life: MAR-ECO and ECOMAR. MAR-ECO sampled the area of the MAR between the Azores and Iceland during expeditions from different nations including a two-month voyage by the Norwegian RV GO Sars in 2004 (Bergstad et al., 2008a; Vecchione et al., 2010). ECOMAR contributed to MAR-ECO with voyages by the UK RRS James Cook focussing on two transects across the MAR at ca. 49°N and 54°N, south and north of the Charlie-Gibbs Fracture Zone respectively during 2007-2010 (Gebruk et al., 2013; Priede et al., 2013b).
The distribution of demersal fish species is analysed in detail because for this component of the bottom fauna there is data available over the greatest depth range (Porteiro et al., 2017). This analysis is combined with a new assessment of the distribution of substrate patches in this area of the MAR from 42° to 56°N. Aspects of the benthic megafauna on different substrates surveyed by MAR-ECO and ECOMAR are discussed with reference to previous publications (Gebruk, 2008; Gebruk et al., 2010; Alt et al., 2013; Bell et al., 2013; Gebruk et al., 2013; Jones et al., 2013; Bell et al., 2016; Alt et al., 2019) but no new analyses are presented.
Materials and Methods
Net Primary Production and Particulate Organic Carbon Flux
NPP and POC flux were derived from remote sensing data collected using the NASA Aqua satellite MODIS (Moderate Resolution Imaging Spectro-radiometer) sensor for the North Atlantic between 10° and 48°N. The area to the north of 48°N is not processed by the standard NASA MODIS Ocean colour algorithms during winter months due to low ocean reflectance caused by low sun elevations. Time series of monthly (arithmetic) mean regional NPP observations, in units of (gC.m-2.day-1), were extracted from the standard Vertically Generalised Production Model (VGPM) (Behrenfeld and Falkowski, 1997) products distributed by the Ocean Productivity program at Oregon State University (Ocean Productivity, 2022). The monthly mean NPP values were based on near-surface chlorophyll concentration, daytime sea surface temperatures, and cloud-corrected incident daily photosynthetically active radiation (PAR) estimates derived from the MODIS sensor (global grid size of 2,160 x 4,320 pixels: MODIS reprocessing version R2018). In order to use a complete time series of NPP products without breaks in monthly coverage, we used the MODIS VGPM NPP products covering 1 August 2002 through 31 July 2020, or 18 complete annual cycles. MODIS suffered a short-lived malfunction that led to a gap in coverage for August and September 2020, and we did not use subsequent observations to avoid incomplete annual cycles in the analyses.
Global POC flux to the ocean bottom, in units of (gC m-2 day-1), was estimated following the approach of Muller-Karger et al. (2005). We used an exponential decay function of the monthly mean gridded MODIS NPP datasets to compute global maps of the sinking POC flux using the Pace et al. (1987) model (i.e., flux(Z) = 3.523*NPP*Z-0.734), where Z are ocean bottom depths at each cell of the NPP grids. Depths were based on the ETOPO1 global relief model of the Earth’s surface. For this study, we excluded all data of the ocean bathymetry shallower than 800 m. Thus, the area examined follows the widely accepted definition of “lower bathyal” 800-3500 m (UNESCO, 2009). For the purposes of this analysis, we did not introduce a lag in the POC flux relative to the NPP observations. The commonly accepted average velocity for bulk POC is of the order of 100 m day-1 (Deuser et al., 1990). Since our averaging time step is a month, there is somewhat of a smear in the actual settling of particles to the bottom at depths >2,000 m between months. The analysis also does not account for episodic rapid settling of massive surface blooms (e.g., Conte et al., 1998; Thunell et al., 2007; Lorenzoni et al., 2012).
NPP and POC flux data were extracted from the gridded global fields to construct several summary time series. For example, data for each dataset were extracted in transects and polygons. Polygons were used to derive monthly mean values over the geographic area covered by the polygon. Only POC fluxes in areas deeper than 800 m were included in our analyses, while all pixels with valid data were included in similar transects and polygons for the NPP monthly means.
Three polygons were defined: West, MAR, and East (Figure 2) spanning the latitudinal range from 10°N to 48°N. The MAR polygon was defined as the region between smoothed boundaries at 3500 m depth west and east of the ridge, corresponding to lower bathyal with depths shallower than 800 m removed. The West and East polygons represent the abyssal regions of the North Atlantic on either side of the ridge from 3500 m to maximum depth either side of the MAR. To define the polygons, depth measurements were made at 2.5° latitudinal intervals except in regions of complex topography (e.g., at fracture zones) where more frequent points were used. Following preliminary inspection of the data, these polygons were further subdivided into three latitudinal strata, North 48°-40°N, Azores 40°-32.5°N and South 32.5°-10°N. Three transects were also extracted for analysis, specifically two latitudinal transects at 25°N (58.5°W to 32.5° W) and 47°N (40.25° W to 14.34° W), and one transect along the axis of the ridge from 48°N to 10°N.
Figure 2
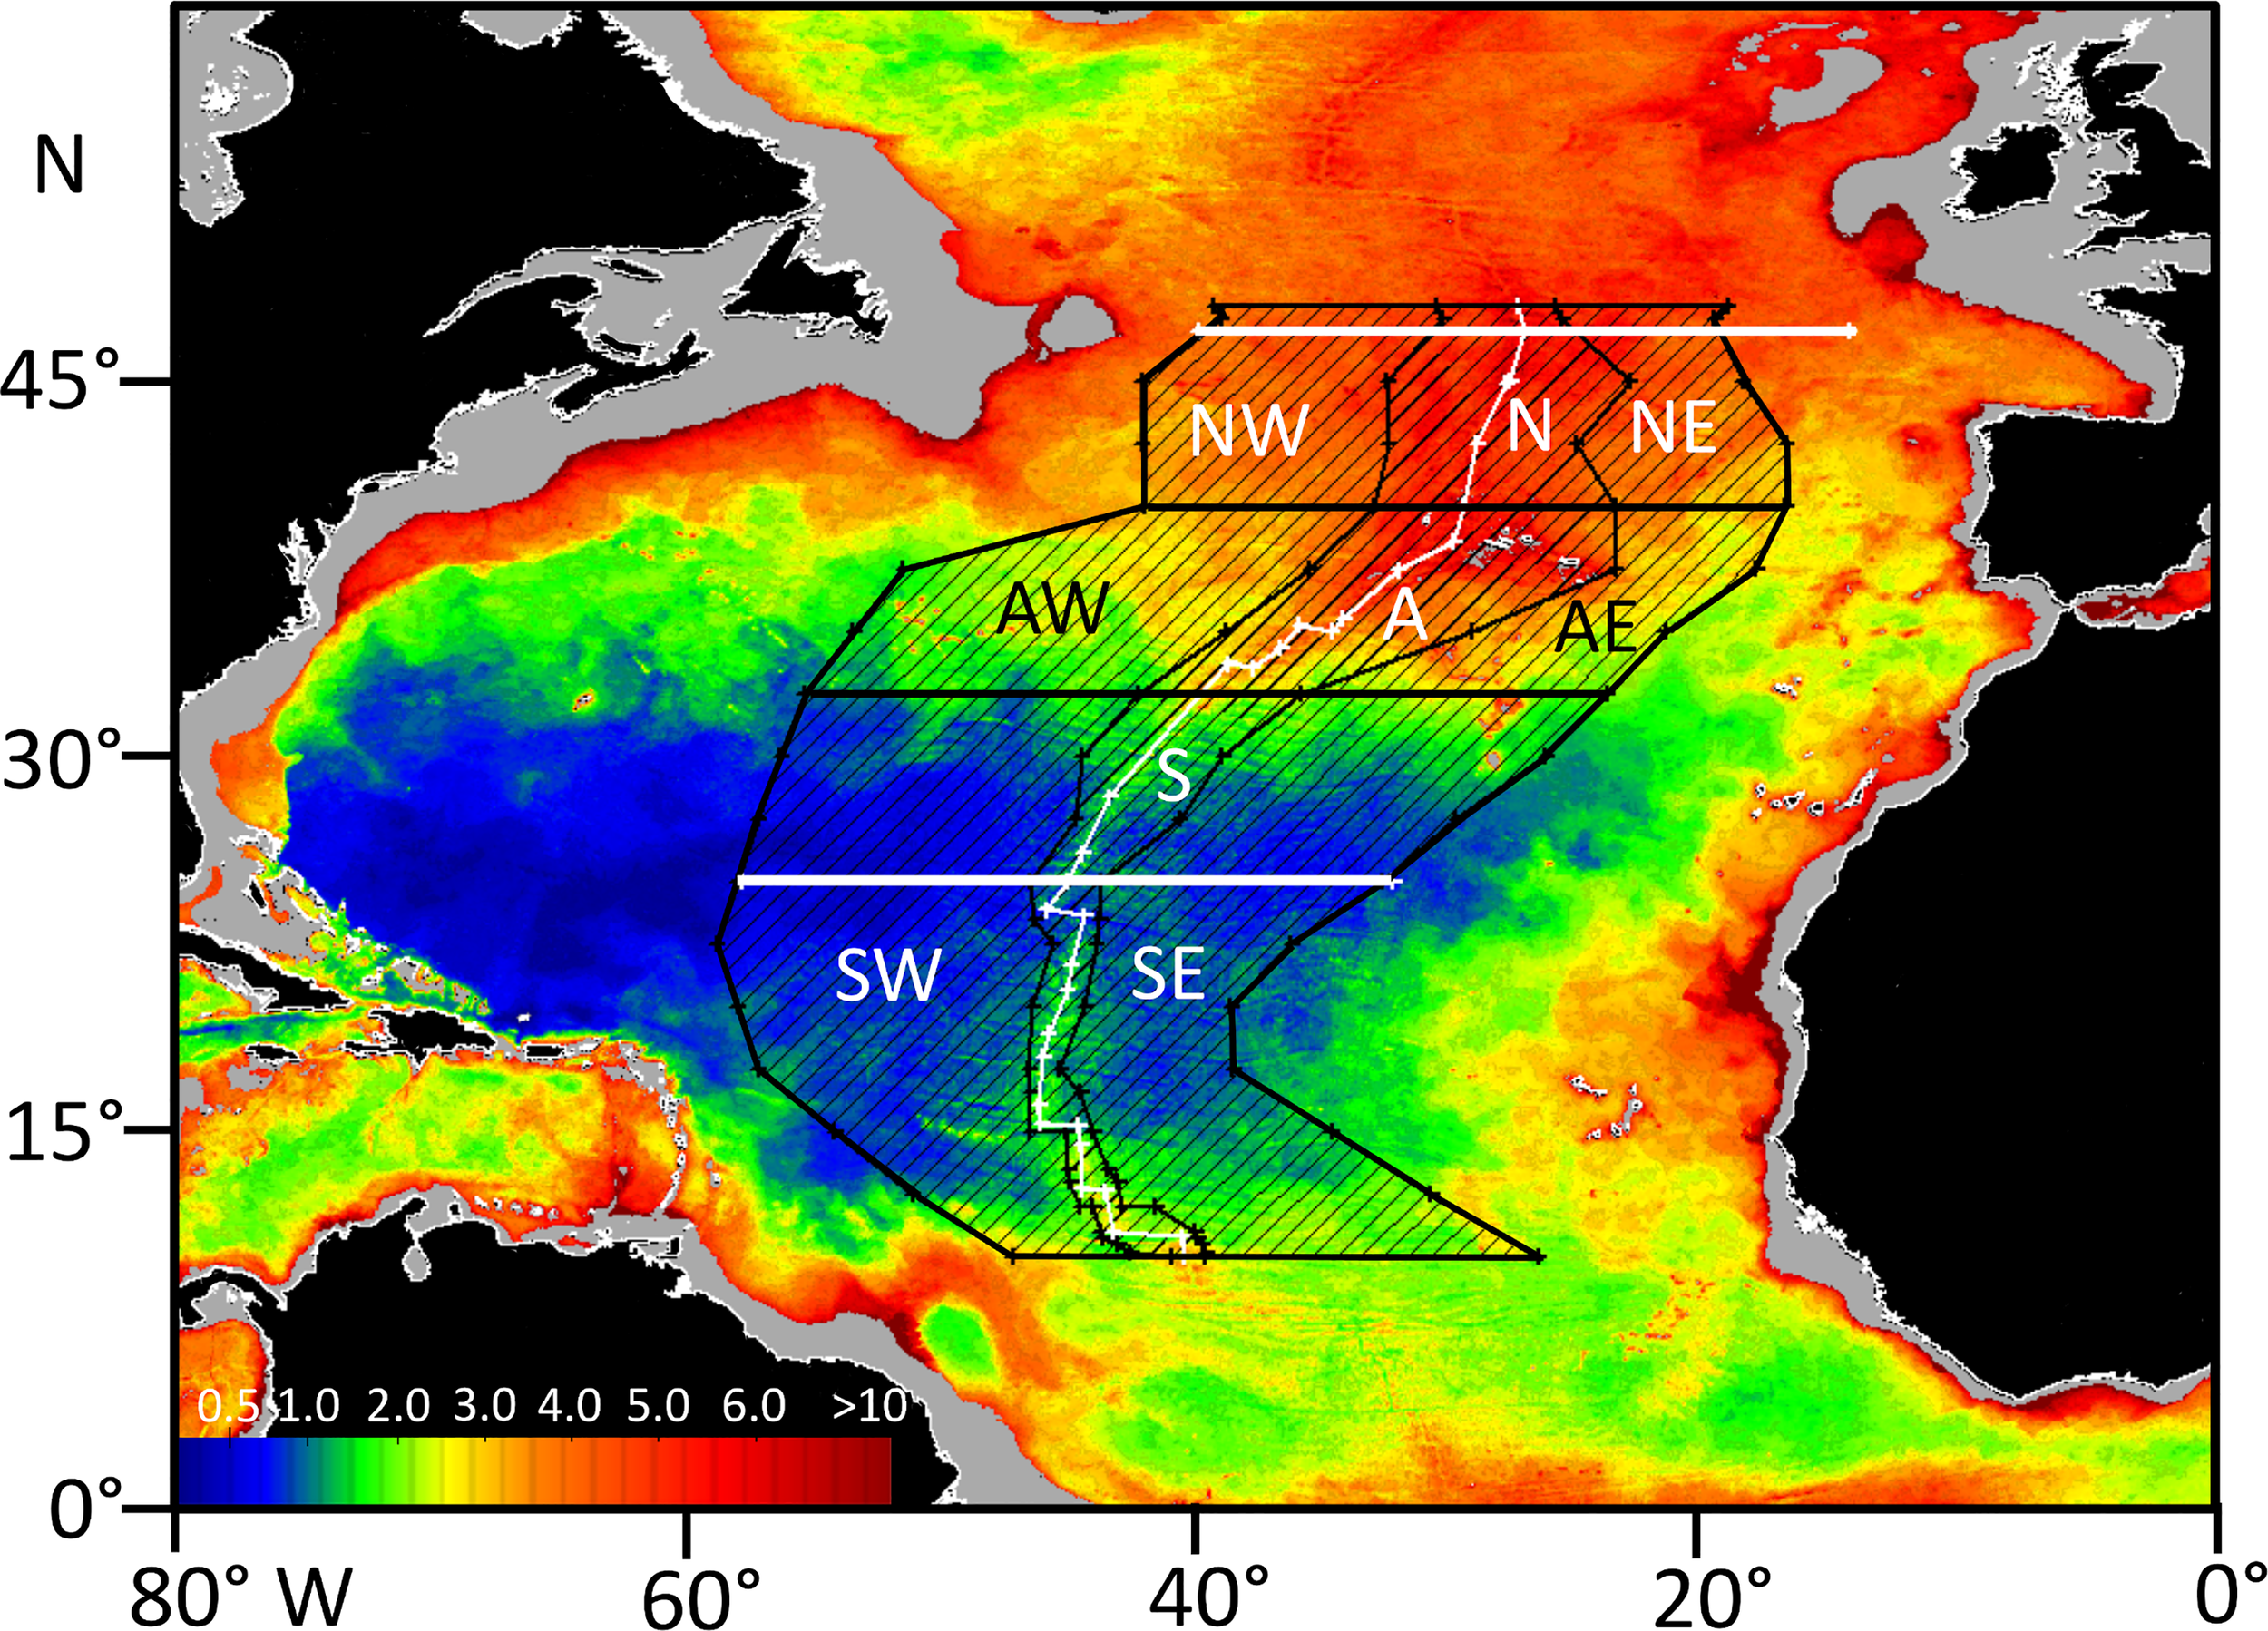
Mean Daily Particulate Organic Carbon Flux (mg C.m-2.day-1) to the sea floor in the North Atlantic calculated for October 2002. The three polygons for remote sensing analysis of net primary production (NPP) and particulate organic carbon flux (POC), West, MAR and East are shown together with three latitudinal strata, North (NW, N, NE) Azores (AW, A, AE) and South (SW, S, SE). The MAR polygon is defined as the area enclosing lower bathyal depths (3500-800 m depth) on either side of the ridge. The West and East polygon outer boundaries correspond to the deepest points either side of the ridge. The thick white lines are latitudinal transects at 25°N and 47°N. The thin white line is the axis of the MAR.
Demersal Fish Depth Distribution
Data on demersal fish species, including minimum and maximum depths of occurrence on the Mid-Atlantic Ridge between the Azores and Iceland (41°-60°N), were extracted from the compilation by Porteiro et al. (2017) of fishes captured during cruises by the RV G.O. Sars and MS Loran as part of the MAR-ECO programme in 2004. Designation of demersal species was based on capture in bottom trawls and bottom-set long lines broadly following Bergstad et al. (2008b). All members of the family Alepocephalidae (slickheads) were included plus six species of Platytroctidae (searsids) that were represented in bottom trawls. Platytroctidae are not normally considered demersal but those included here for analysis are considered to be associated with the MAR on the basis of capture in bottom trawls (Porteiro et al., 2017) or designation as benthopelagic in Fishbase (Froese and Pauly, 2021). This gave a total of 100 species (Table 3). The maximum depth in Porteiro et al. (2017) is 4300m and in Bergstad et al. (2008b) 3527 m. For species with a known distribution at greater depths, their ranges were extended according to data for the abyssal North Atlantic presented in Priede et al. (2010), and a maximum depth for one species Porogadus miles taken from Fishbase (Froese and Pauly, 2021).
Hard Substrate Distribution Analysis
The analysis of Niedzielski et al. (2013) was extended to evaluate the distances between adjacent hard rock patches on the MAR. Steep areas with slope >30° were used as proxies for hard rock patches, since video surveys had shown these to be 66.9% sediment free.
In order to characterise the empirical distribution of nearest distances between steep (>30°) slope patches of sea floor, a geographic information system (GIS) analysis of sea floor topography was carried out. Digital elevation models (DEMs) of parts of the MAR – i.e. bathymetric data sets acquired during cruises of the RV G.O. Sars in 2004 (Wenneck et al., 2008) and the RRS James Cook in 2007 (Priede et al., 2013b) – were processed in QGIS software v. 3.20.3 Odense. Seven transects, spatially corresponding to transects 1L–7L presented by Niedzielski et al. (2013), were analysed. The data had varying spatial resolutions, ranging between 42 and 59 m for RV G.O. Sars (five data sets) and between 99 and 100 m for the RRS James Cook (two data sets).
Each of seven DEMs was processed separately. First, slope rasters were computed. Second, they were reclassified into new rasters with two classes: steep slopes (ones corresponded to slope values greater than 30°) and flat terrain or non-steep slopes (zeros corresponded to slope values between 0° and 30°). Third, the reclassified rasters were converted to vector polygons. Fourth, from the newly produced vector data sets, polygons coded as ones (steep slopes) were selected, and therefore vector maps of steep patches were generated. Next, geometries of the resulting vector layers were corrected. Such data became input to the subsequent nearest neighbour analysis.
To compute nearest distances between steep slope patches, geometries of polygons which represented steep slopes were approximated by centroids. That was conducted in QGIS NNJoin plugin. The same tool was also used to calculate the nearest distance between the joined features – each steep slope vector data set was joined with itself, and the approximation of geometry by centroids was enabled. For each transect, nearest distances were recorded in a newly created field in the attribute table. The data were exported to XLSX format and then saved as TXT files. Since the resolutions of the available bathymetric data sets were dissimilar and fitted two groups – (1) the RV G.O. Sars (42, 44, 47, 54 and 59 m) and (2) the RRS James Cook (99 and 100 m) – the histograms of nearest distances between steep slope patches were produced jointly for five transects provided by the RV G.O. Sars and jointly for two transects provided by the RRS James Cook.
Results
Net Primary Production
For the entire area considered in the North Atlantic between 10° and 48°N, there was a strong seasonal cycle of NPP. The peak occurred predominantly in May-June each year in the North (Figure 3A), March-April in the Azores (Figure 3B), and February-March in the South (Figure 3C). There was strong trend of decrease In NPP from North to South, from an overall 18 year mean of 625 mgC.m-2.day-1 in the Northern stratum, to 432 mgC.m-2.day-1 around the Azores and 227 mgC.m-2.day-1 in the South. In the Northern stratum there was no significant difference in NPP between, the West, MAR, and Eastern polygons (Table 1). In the Azores stratum there was no significant difference between the West and the MAR polygons but NPP in the East was significantly (9%) lower. In the south there was a small but highly significant trend of increase in NPP from a mean of 208 mgC.m-2.day-1 in the west to 245 mgC.m-2.day-1 in the east. Inspection of the NPP data for the transect at 25°N confirms this pattern of increase towards the east (Figure 4). There was no evidence of elevated NPP over the axis of the ridge in either of the transects at 25° and 47°N.
Figure 3
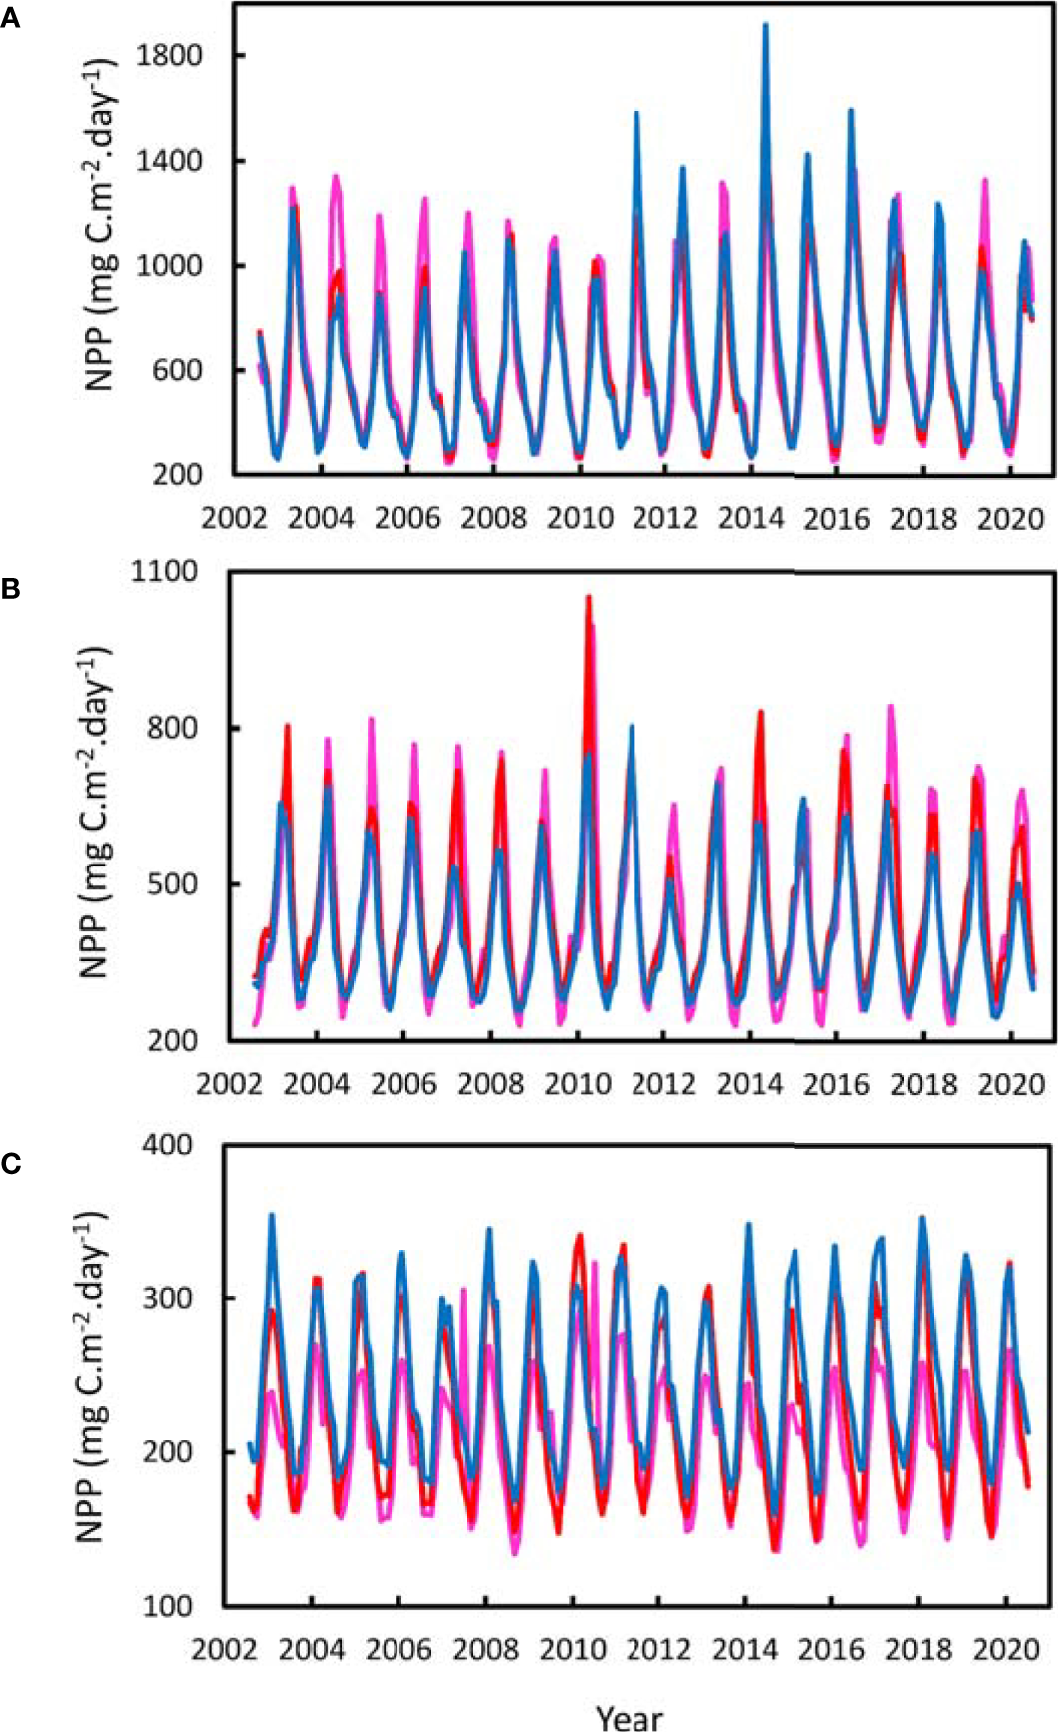
Monthly Net Primary Production (NPP) for the years 2002-2020. (A) Northern Stratum 40°-48°N, (B) Azores Stratum 32.5°-40°N, (C) Southern Stratum 10°-32.5°N. Red line - MAR Polygon, Pink line – West Polygon. Blue line - East Polygon.
Table 1
| Northern Stratum | |||
|---|---|---|---|
| West | MAR | East | |
| Mean | 630.62 | 613.36 | 631.46 |
| SD | 40.01 | 53.48 | 75.92 |
| P | Significance | ||
| ANOVA | 0.60 | NS | |
| Azores Stratum | |||
| West | MAR | East | |
| Mean | 442.67 | 448.30 | 406.49 |
| SD | 23.56 | 27.58 | 26.59 |
| P | Significance | ||
| ANOVA | <0.0001 | *** | |
| Post Hoc West v MAR | 0.53 | NS | |
| Post Hoc East v MAR | <0.001 | ** | |
| Post Hoc West v East | <0.0001 | *** | |
| Southern Stratum | |||
| West | MAR | East | |
| Mean | 207.65 | 229.17 | 245.46 |
| SD | 12.55 | 7.43 | 7.88 |
| P | Significance | ||
| ANOVA | <0.0001 | *** | |
| Post Hoc West v MAR | <0.0001 | *** | |
| Post Hoc East v MAR | <0.0001 | *** | |
| Post Hoc West v East | <0.0001 | *** | |
Comparison of surface net primary production (NPP) mg C.m-2.day-1 over the Mid- Atlantic Ridge (MAR) and adjacent abyssal regions West and East during 2002-2020 for the three latitudinal strata shown in Figure 2.
Results of Analysis of Variance and posthoc t-tests with Bonferroni correction are given. *** highly significant P <0.0001, ** significant P <0.001, NS, not significant.
Figure 4
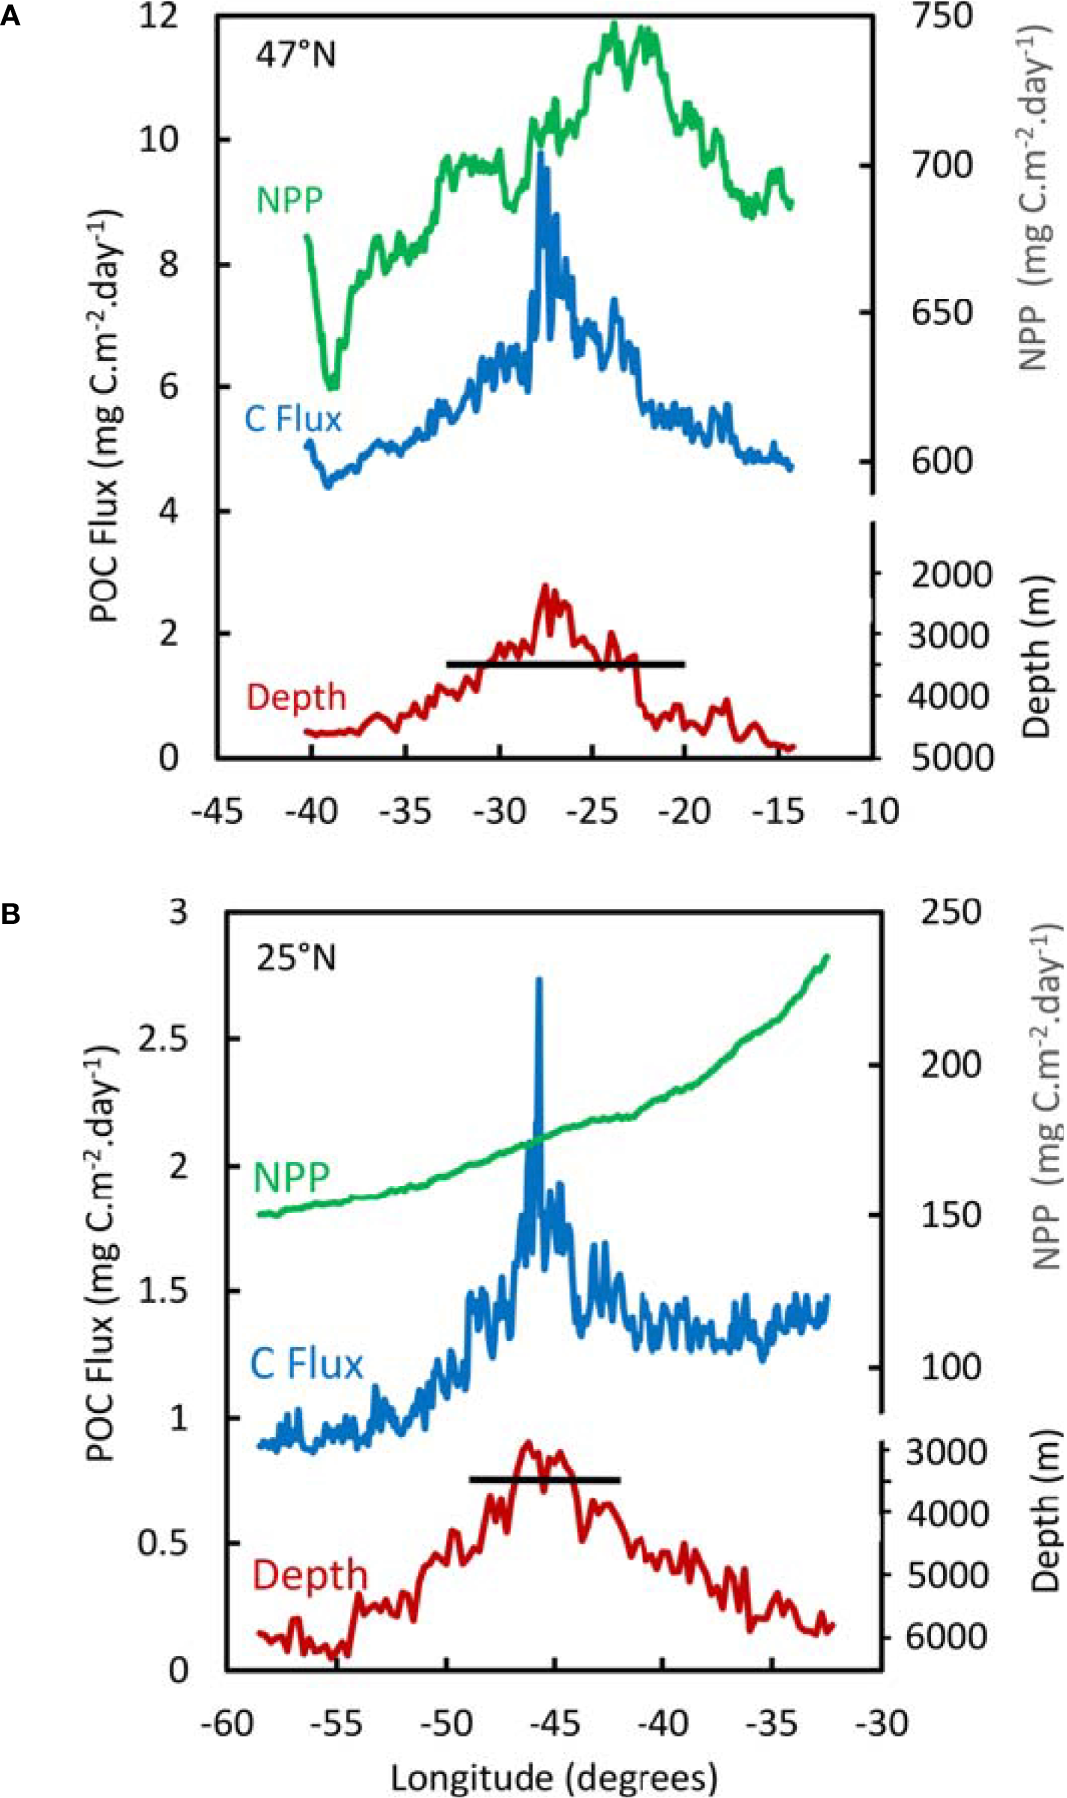
Mean NPP and POC Flux during the years 2002-2020 along transects across the MAR at 47°N (A) and 25°N (B). The horizontal black line indicates 3500 m depth, the boundary of the lower bathyal zone.
In the transect at 47°N, there was a peak in average NPP (Figure 4A) around 350 km east of the ridge summit. This is associated with high values of NPP in the east from 2011 onwards (Figure 3A), the location of which was highly variable and could not be regarded as a consistent phenomenon associated with the topography of the MAR. We found no evidence of elevated NPP over the axis of the MAR.
Particulate Organic Carbon Flux
The POC flux to the bottom of the North Atlantic between 10° and 48°N showed an annual cycle and decrease from North to South reflecting the temporal and latitudinal trends in NPP (Figure 5). In the Northern and Azores strata there was no significant difference between POC flux to the west and east of the MAR (Table 2). In the southern stratum the POC flux was significantly higher in the East than in the West. At all latitudes the POC flux was significantly higher over the MAR than in the abyssal regions to the west and east. In the Northern stratum the mean POC flux was 31% higher, 65% higher in the Azores stratum and 32% in the south. In the abyssal regions, east and west of the ridge, an average of 0.75% of surface production was predicted to be deposited on the seafloor. On the MAR itself this amounted to an overall average 0.92-1.1% of NPP.
Figure 5
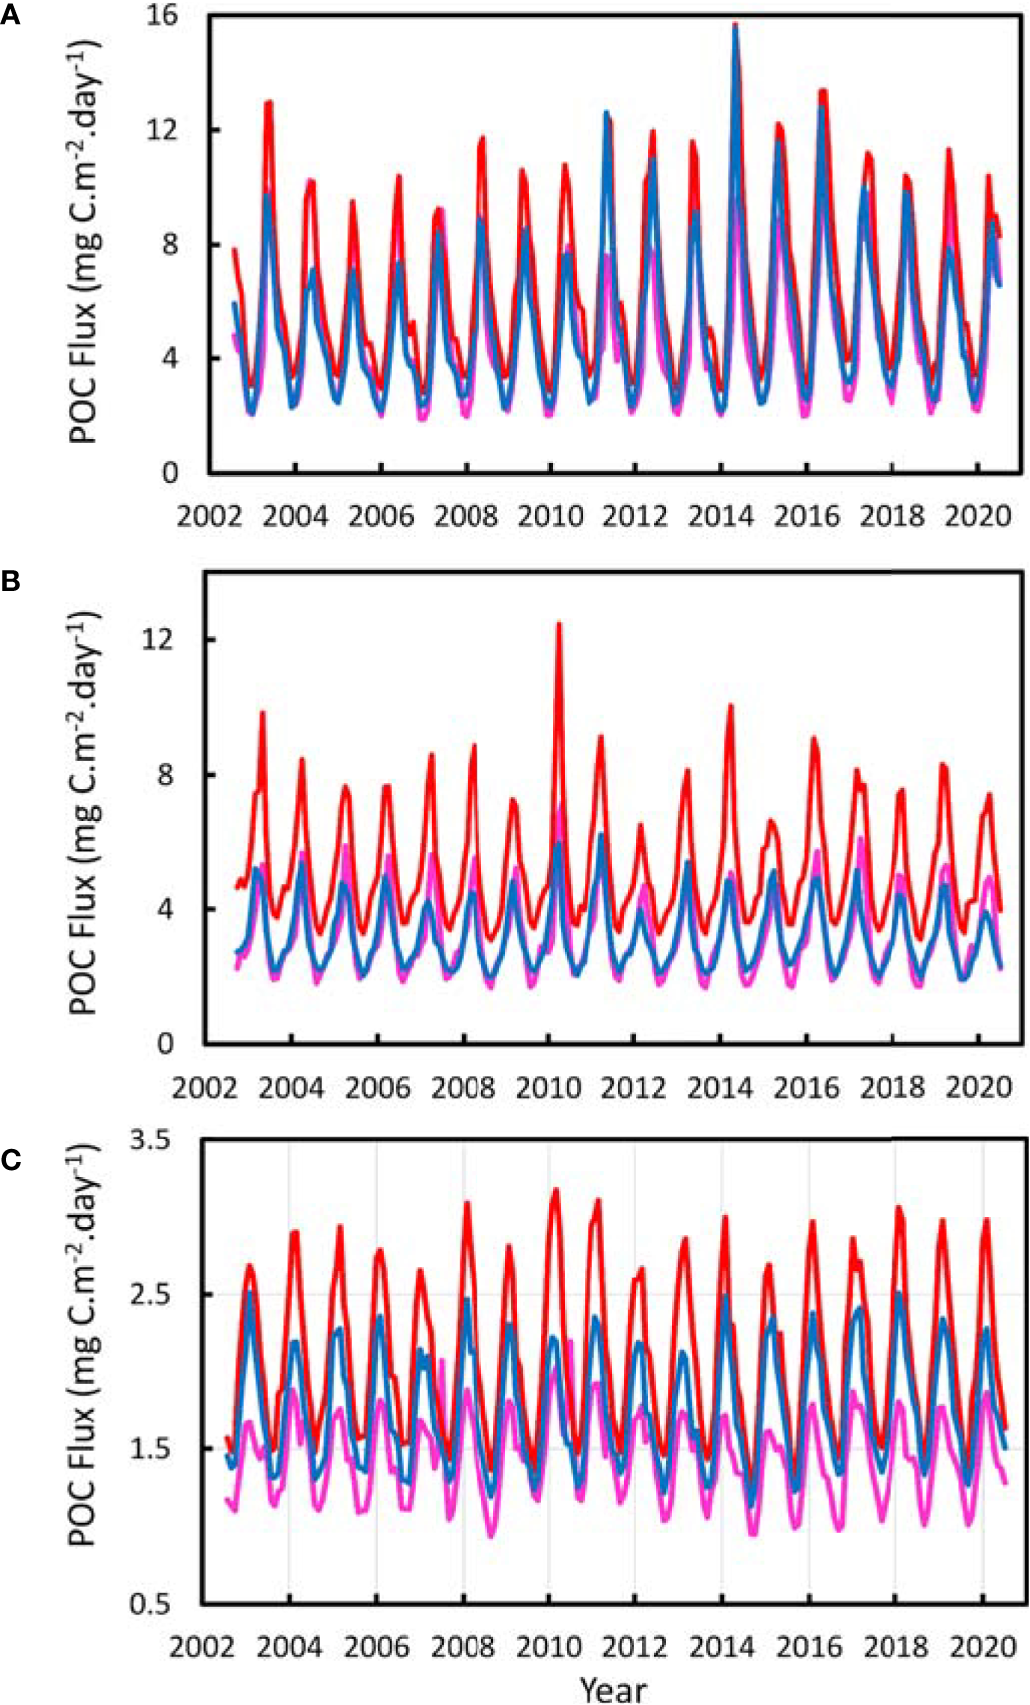
Monthly Particulate Organic Carbon Flux (POC Flux) reaching the sea floor for the years 2002-2020. (A) Northern Stratum 40°-48°N, (B) Azores Stratum 32.5°-40°N, (C) Southern Stratum 10°-32.5°N. Red line - MAR Polygon, Pink line – West Polygon. Blue line - East Polygon.
Table 2
| Northern Stratum | |||
|---|---|---|---|
| West | MAR | East | |
| Mean | 4.85 | 6.49 | 5.08 |
| SD | 0.31 | 0.57 | 0.62 |
| P | Significance | ||
| ANOVA | <0.0001 | *** | |
| Post Hoc West v MAR | <0.0001 | *** | |
| Post Hoc East v MAR | <0.0001 | *** | |
| Post Hoc West v East | 0.18 | NS | |
| Azores Stratum | |||
| West | MAR | East | |
| Mean | 3.23 | 5.30 | 3.20 |
| SD | 0.17 | 0.32 | 0.21 |
| P | Significance | ||
| ANOVA | <0.0001 | *** | |
| Post Hoc West v MAR | <0.0001 | *** | |
| Post Hoc East v MAR | <0.0001 | *** | |
| Post Hoc West v East | 0.62 | NS | |
| Southern Stratum | |||
| West | MAR | East | |
| Mean | 1.45 | 2.11 | 1.75 |
| SD | 0.08 | 0.07 | 0.05 |
| P | Significance | ||
| ANOVA | <0.0001 | *** | |
| Post Hoc West v MAR | <0.0001 | *** | |
| Post Hoc East v MAR | <0.0001 | *** | |
| Post Hoc West v East | <0.0001 | *** | |
Comparison of particulate organic carbon flux (POC Flux) mgC.m-2.day-1 over the Mid- Atlantic Ridge (MAR) and adjacent abyssal regions West and East during 2002-2020 for the three latitudinal strata shown in Figure 2.
Results of Analysis of Variance and posthoc t-tests with Bonferroni correction are given. *** highly significant P <0.0001, NS, not significant.
On the transect across the MAR at 25°N, the predicted POC flux on the summit was 2.73 mgC.m-2.day-1 compared with minimum values of 0.86 mgC.m-2.day-1 to the west and 1.23 mgC.m-2.day-1 to the east (Figure 4B). At 47°N, the summit flux was 9.78 mgC.m-2.day-1 compared with minimum values of 4.39 mgC.m-2.day-1 to the west and 4.68 mgC.m-2.day-1 to the east. The predicted POC flux strongly follows the bathymetry, resulting in peak values over the MAR summits up to 2-3 times higher than on abyssal slopes on either side of the ridge.
Examining the trend in POC flux from north to south along the axis of the ridge (Figure 6), there was a decrease from values of 6-13 mgC.m-2.day-1 north of the Azores to a minimum of less than 2 mgC.m-2.day-1 around 25°N (also evident in Figures 2, 5). In the Northern stratum, there is a strong seasonal cycle in POC flux with up to 13-fold change between winter and summer, whereas in the southern stratum the seasonal cycle was attenuated to a 1.5-2.3-fold amplitude.
Figure 6
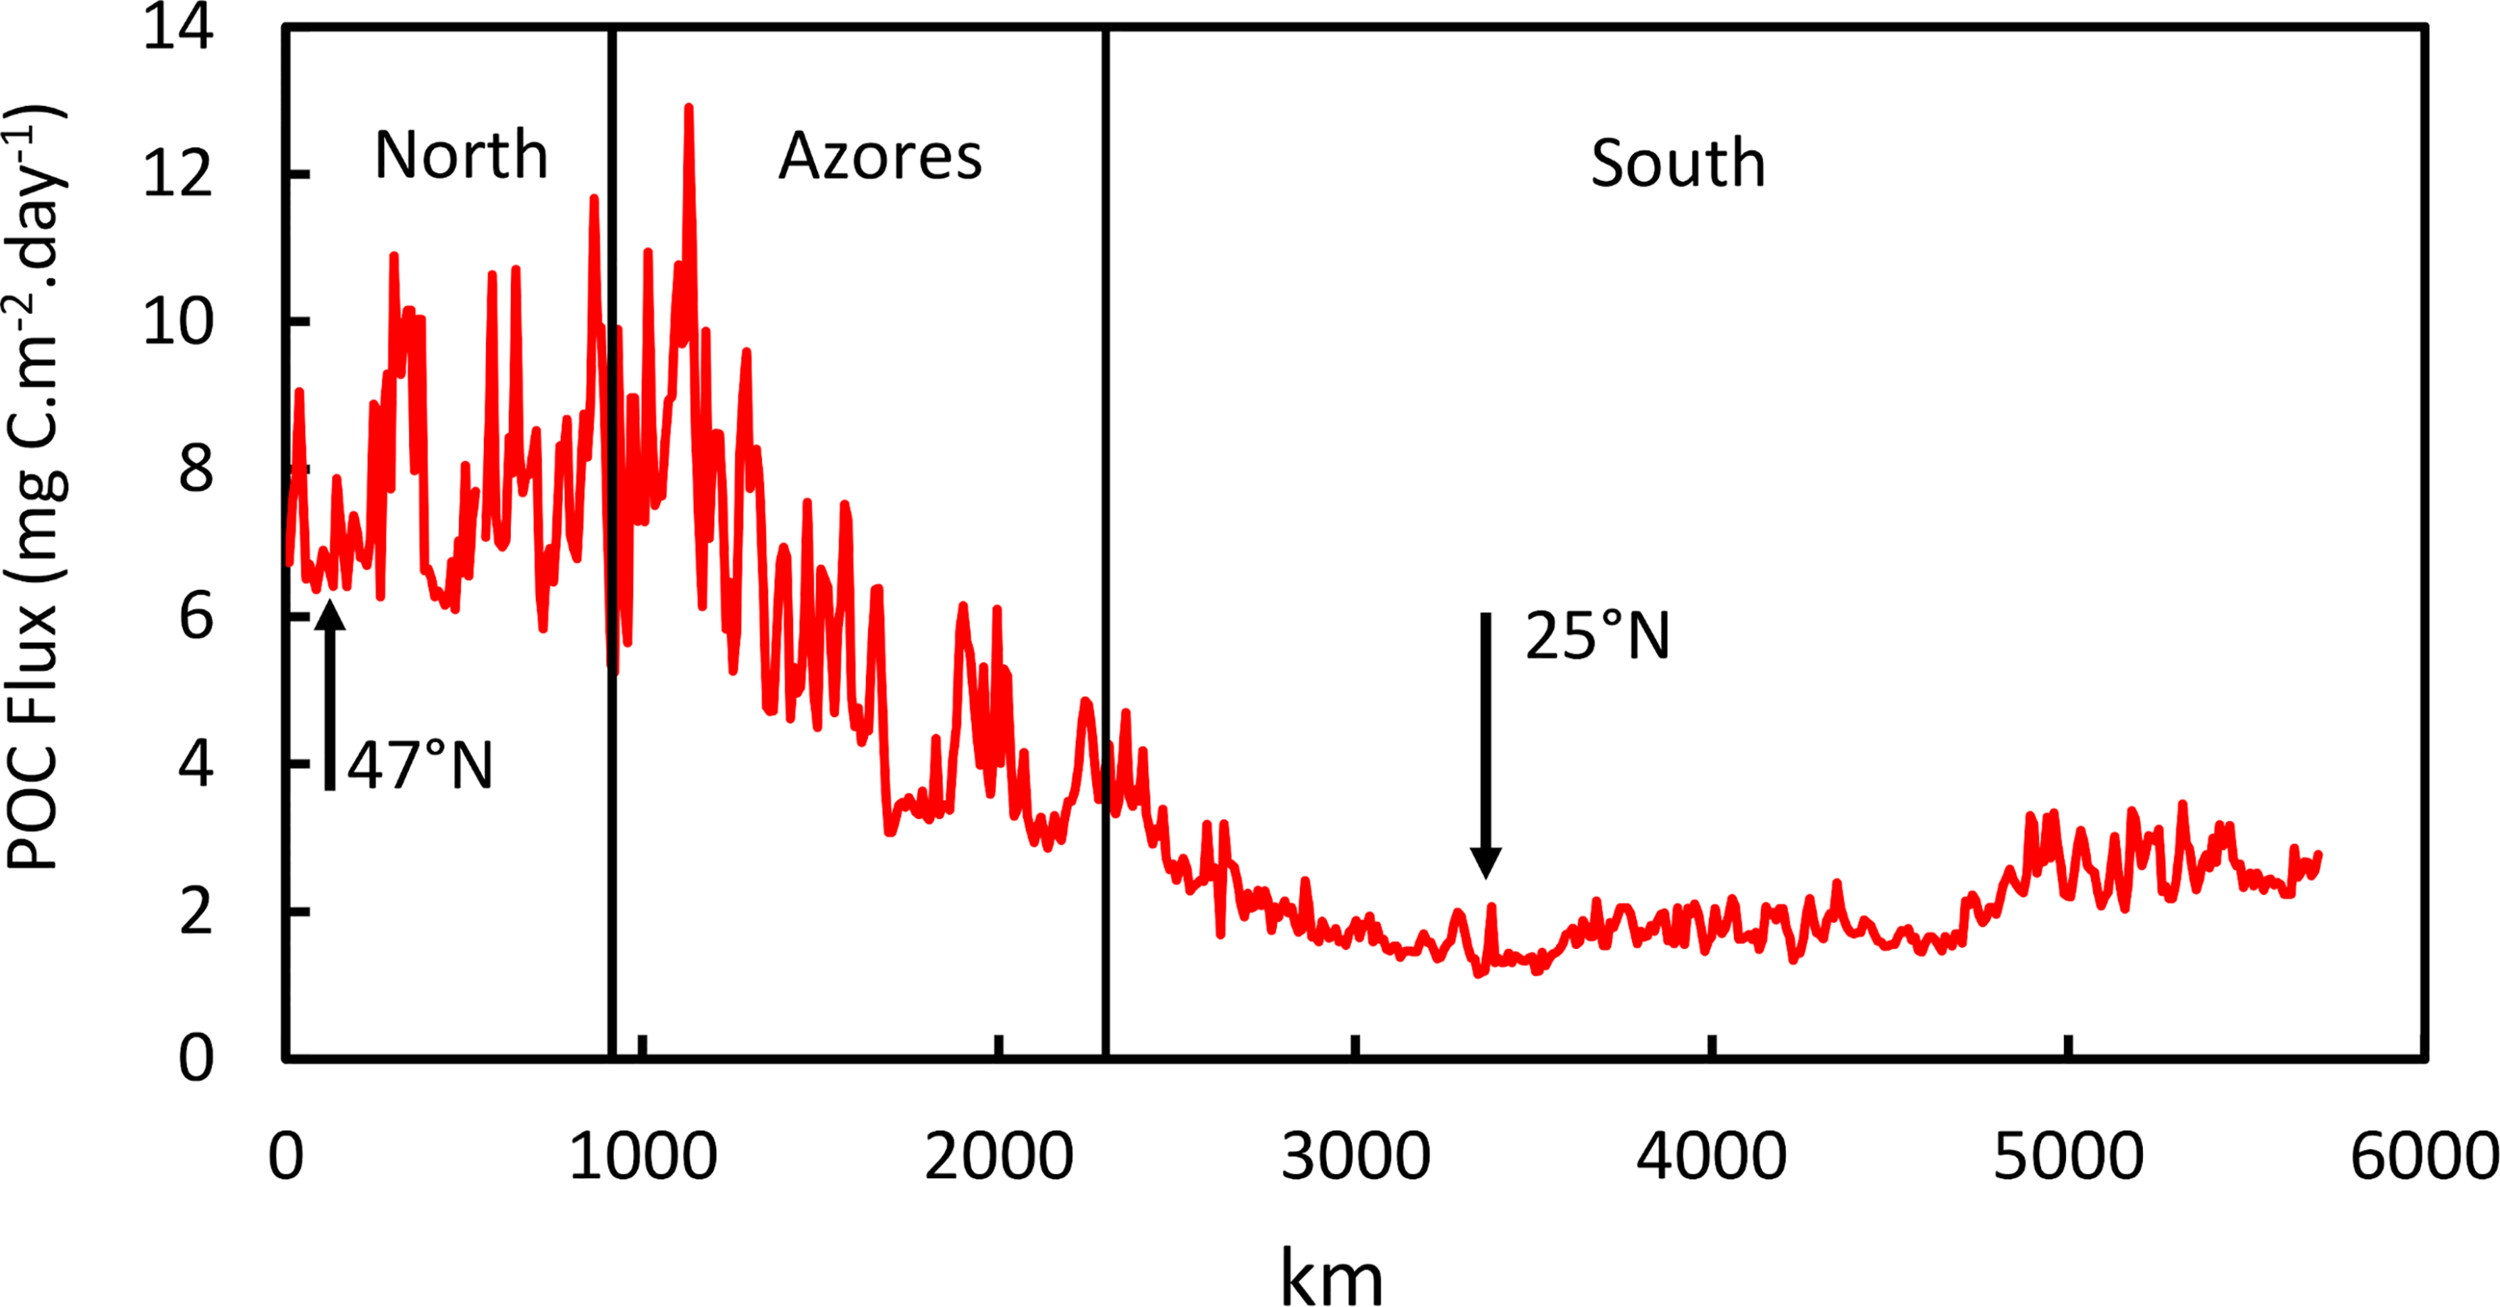
Mean POC Flux during the years 2002-2020 along the axis of the MAR from 48°N (0 km) to 10°N across the three latitudinal strata, North, Azores and South. Arrows at 47°N and 25°N are locations of transects in shown in Figure 4.
Demersal Fish Depth Distribution
Figure 7 and Table 3 show the depth ranges of species ranked in order of minimum depth of occurrence. The first eight species with minimum depths between the sea surface and 450 m were all benthopelagic species caught in pelagic net tows over the MAR as well as by bottom long-lines and trawls on the MAR itself. These included five Platytroctids, one Alepocephalid (Xenodermichthys copei), one macrourid (Coryphaenoides rupestris) and the wolffish (Anarhichas denticulatus). Of the shallowest twenty species associated with summits of the MAR, the majority, 18 were benthopelagic. Furthermore, benthopelagic species were found at all depths comprising 35% of species ranked >20. Overall, 47% of species were benthopelagic.
Figure 7
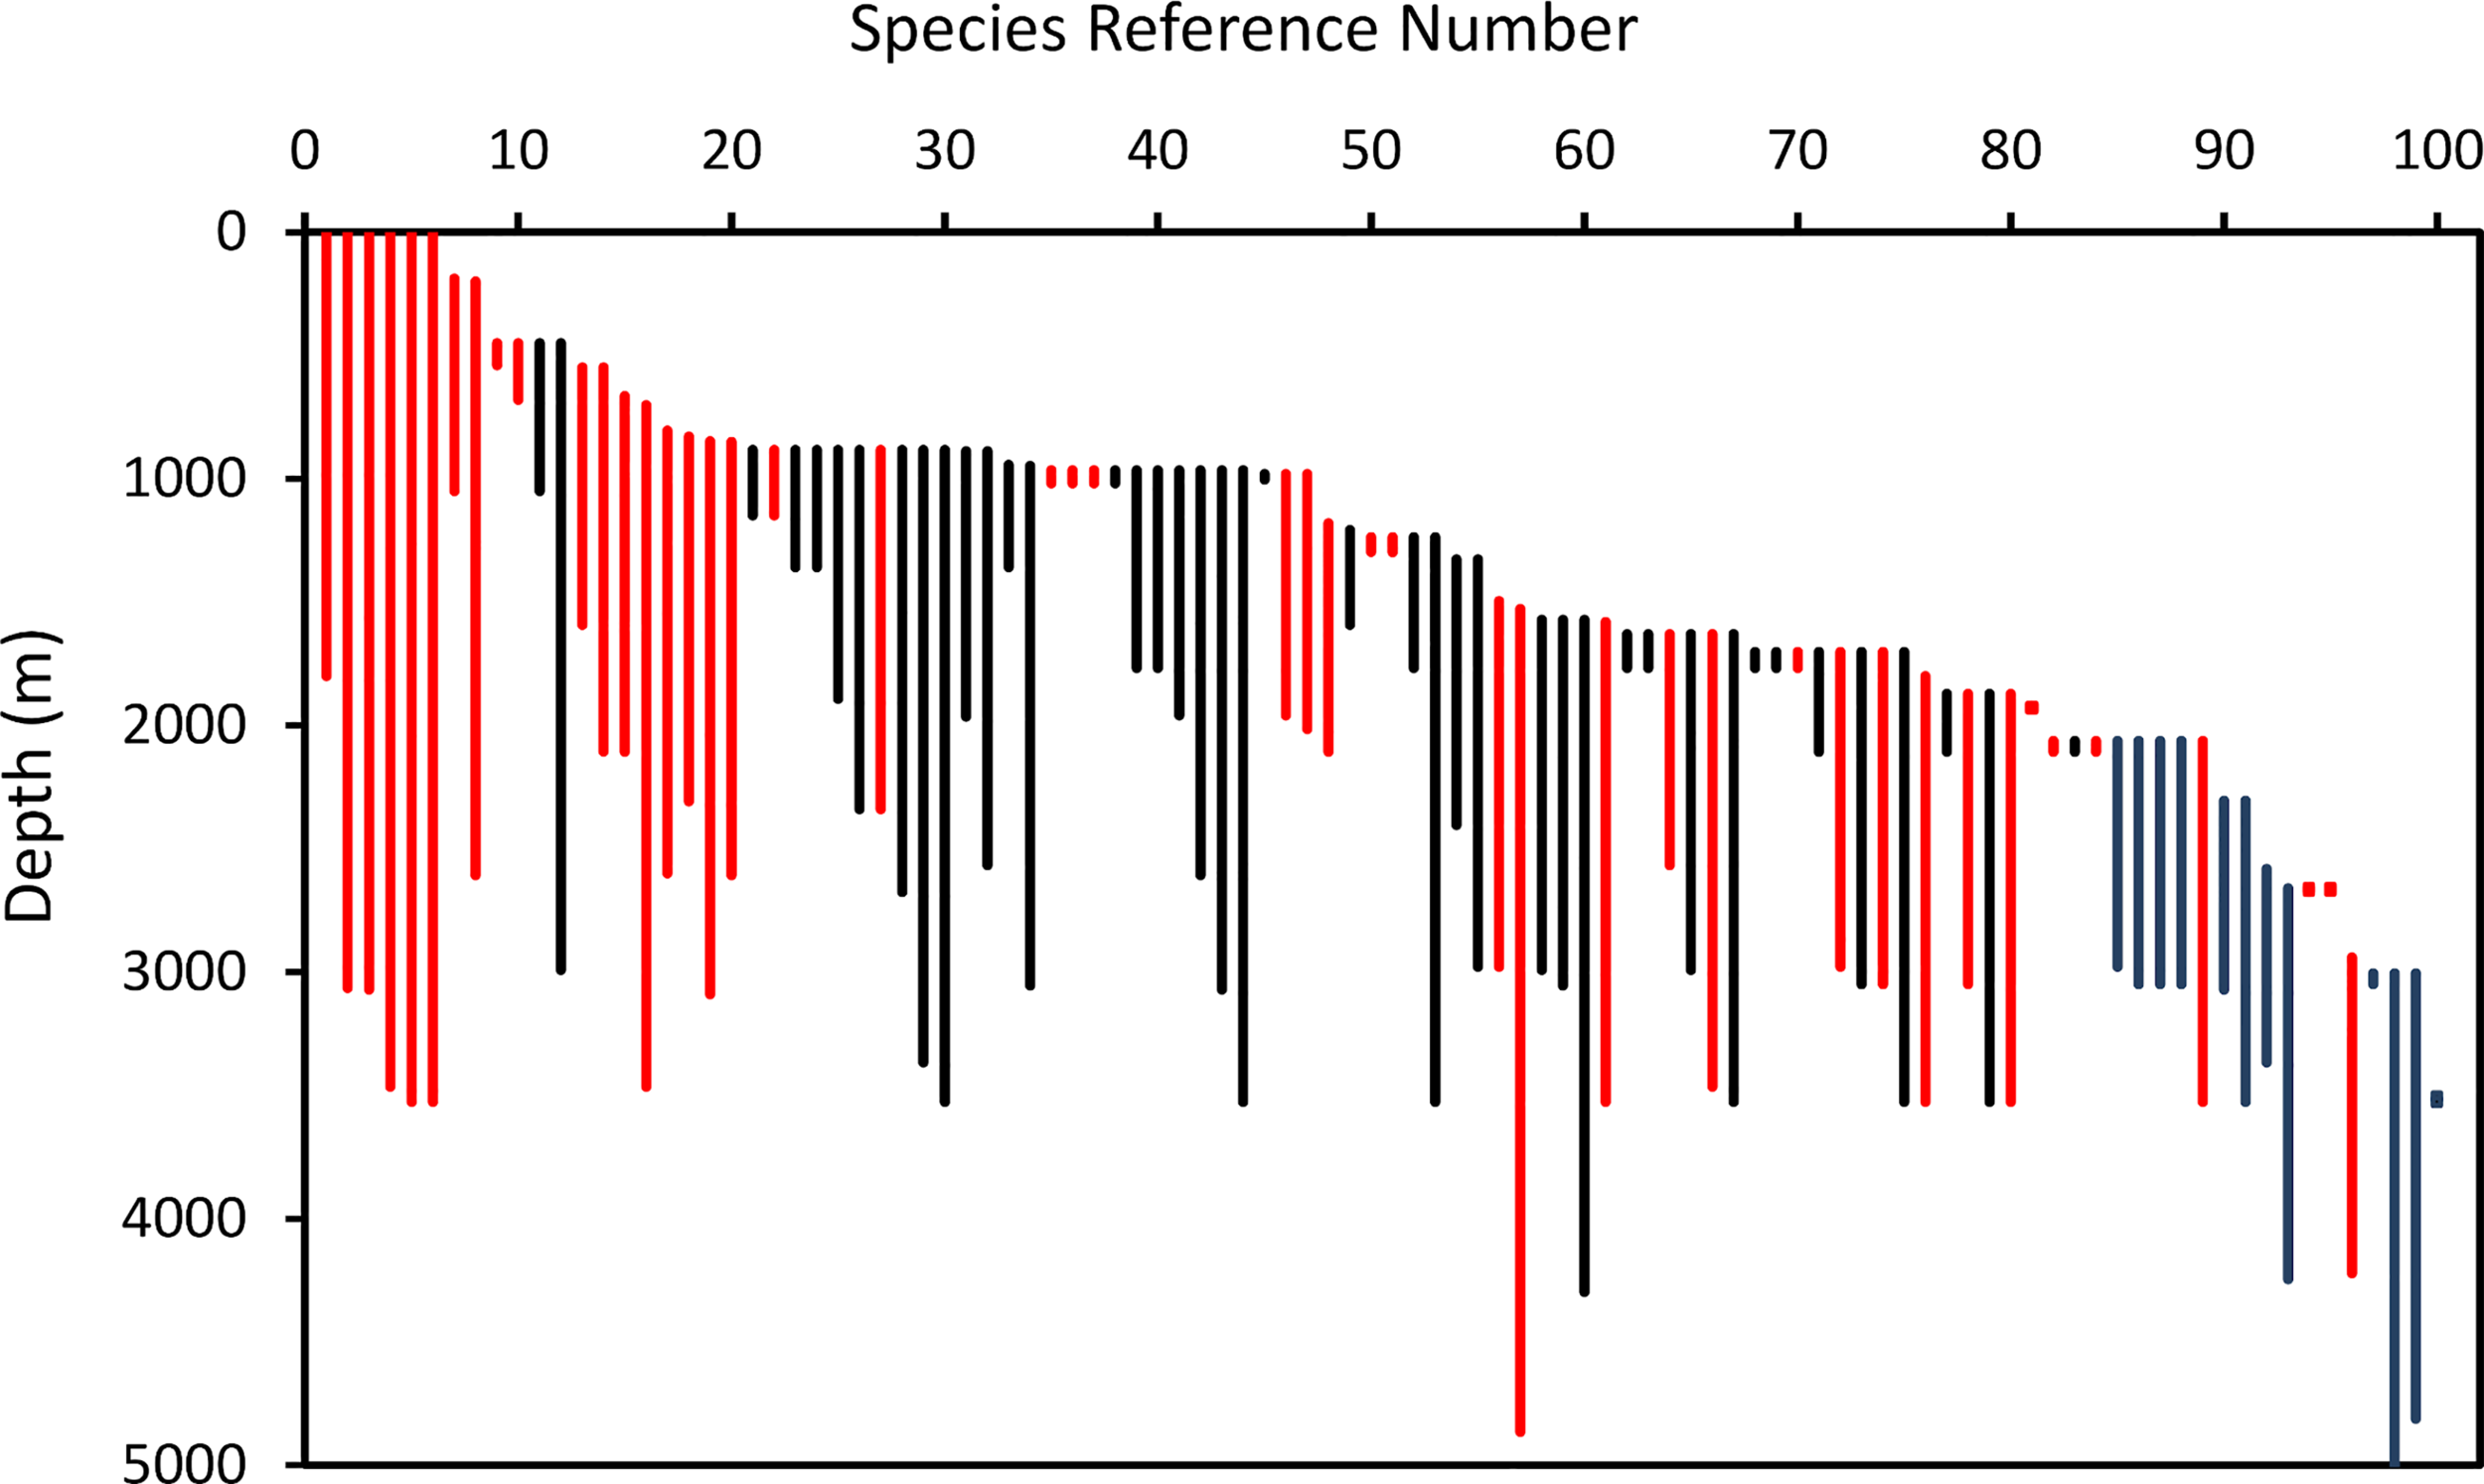
Depth ranges of 100 species of demersal (black) and benthopelagic (red) fishes on the North Mid- Atlantic Ridge, ranked in order of minimum depth of occurrence. (The key to species is in Table 3).
Table 3
| Ref | Family | Species name | Depths (m) | |||
|---|---|---|---|---|---|---|
| Min | Max | MaxX | ||||
| 1 | Platytroctidae | Holtbyrnia macrops Maul, 1957 | 0 | 1800 | †‡ | |
| 2 | Platytroctidae | Searsia koefoedi Parr, 1937 | 0 | 3065 | †‡ | |
| 3 | Platytroctidae | Normichthys operosus Parr, 1951 | 0 | 3071 | †‡ | |
| 4 | Alepocephalidae | Xenodermichthys copei (Gill, 1884) | 0 | 3465 | †‡ | |
| 5 | Macrouridae | Coryphaenoides rupestris Gunnerus, 1765 | 0 | 3527 | †‡ | |
| 6 | Platytroctidae | Holtbyrnia anomala Krefft, 1980 | 0 | 3527 | †‡ | |
| 7 | Anarhichadidae | Anarhichas denticulatus Krøyer, 1845 | 188 | 1050 | †‡ | |
| 8 | Platytroctidae | Maulisia argipalla Matsui and Rosenblatt, 1979 | 200 | 2607 | †‡ | |
| 9 | Phycidae | Phycis blennoides (Brünnich, 1768) | 450 | 540 | ‡ | |
| 10 | Sebastidae | Sebastes norvegicus (Ascanius, 1772) | 450 | 680 | ‡ | |
| 11 | Lotidae | Brosme brosme (Ascanius, 1772) | 450 | 1050 | ||
| 12 | Etmopteridae | Etmopterus princeps Collett, 1904 | 450 | 2992 | ||
| 13 | Moridae | Lepidion eques (Günther, 1887) | 549 | 1592 | ‡ | |
| 14 | Macrouridae | Macrourus berglax Lacepède, 1801 | 549 | 2106 | ‡ | |
| 15 | Moridae | Halargyreus johnsonii Günther, 1862 | 665 | 2107 | † | |
| 16 | Platytroctidae | Maulisia microlepis Sazonov and Golovan, 1976 | 702 | 3465 | † | |
| 17 | Alepocephalidae | Bajacalifornia megalops (Lütken, 1898) | 805 | 2600 | †‡ | |
| 18 | Macrouridae | Bathygadus melanobranchus Vaillant, 1888 | 829 | 2308 | † | |
| 19 | Moridae | Antimora rostrata (Günther, 1878) | 848 | 3090 | ‡ | |
| 20 | Alepocephalidae | Photostylus pycnopterus Beebe, 1933 | 850 | 2607 | †‡ | |
| 21 | Centrophoridae | Centroscymnus owstonii Garman, 1906 | 883 | 1149 | ||
| 22 | Moridae | Mora moro (Risso, 1810) | 883 | 1149 | ‡ | |
| 23 | Centrophoridae | Deania calcea (Lowe, 1839) | 883 | 1358 | ||
| 24 | Pseudotriakidae | Pseudotriakis microdon de Brito Capello, 1868 | 883 | 1358 | ||
| 25 | Centrophoridae | Centroselachus crepidater (Barbosa du Bocage and de Brito Capello, 1864) | 883 | 1892 | ||
| 26 | Centrophoridae | Centroscymnus coelolepis Barbosa du Bocage and de Brito Capello, 1864 | 883 | 2340 | ||
| 27 | Moridae | Lepidion guentheri (Giglioli, 1880) | 883 | 2340 | ‡ | |
| 28 | Chimaeridae | Hydrolagus pallidus Hardy and Stehmann, 1990 | 883 | 2675 | ||
| 29 | Centrophoridae | Centrophorus squamosus (Bonnaterre, 1788) | 883 | 3366 | ||
| 30 | Synaphobranchidae | Histiobranchus bathybius (Günther, 1877) | 883 | 3527 | ||
| 31 | Synaphobranchidae | Synaphobranchus kaupii Johnson, 1862 | 888 | 1964 | ||
| 32 | Rajidae | Amblyraja jenseni (Bigelow and Schroeder, 1950) | 888 | 2567 | ||
| 33 | Pentanchidae | Galeus murinus (Collett, 1904) | 944 | 1358 | ||
| 34 | Chimaeridae | Hydrolagus affinis (de Brito Capello, 1868) | 948 | 3055 | ||
| 35 | Trichiuridae | Aphanopus carbo Lowe, 1839 | 966 | 1019 | ‡ | |
| 36 | Trachichthyidae | Hoplostethus atlanticus Collett, 1889 | 966 | 1019 | ‡ | |
| 37 | Oreosomatidae | Neocyttus helgae (Holt and Byrne, 1908) | 966 | 1019 | † | |
| 38 | Rajidae | Rajella bigelowi (Stehmann, 1978) | 966 | 1019 | ||
| 39 | Macrouridae | Coelorinchus labiatus (Köhler, 1896) | 966 | 1767 | ||
| 40 | Notacanthidae | Notacanthus bonaparte Risso, 1840 | 966 | 1767 | ||
| 41 | Pentanchidae | Apristurus manis (Springer, 1979) | 966 | 1959 | ||
| 42 | Notacanthidae | Notacanthus chemnitzii Bloch, 1788 | 966 | 2607 | ||
| 43 | Alepocephalidae | Alepocephalus agassizii Goode and Bean, 1883 | 966 | 3071 | ||
| 44 | Notacanthidae | Polyacanthonotus rissoanus (De Filippi and Verany, 1857) | 966 | 3527 | ||
| 45 | Moridae | Guttigadus latifrons (Holt and Byrne, 1908) | 981 | 1003 | ||
| 46 | Halosauridae | Aldrovandia phalacra (Vaillant, 1888) | 981 | 1959 | ‡ | |
| 47 | Liparidae | Psednos groenlandicus Chernova, 2001 | 981 | 2015 | † | |
| 48 | Alepocephalidae | Rouleina attrita (Vaillant, 1888) | 1180 | 2107 | †‡ | |
| 49 | Pentanchidae | Apristurus microps (Gilchrist, 1922) | 1208 | 1592 | ||
| 50 | Macrouridae | Nezumia sclerorhynchus (Valenciennes, 1838) | 1237 | 1296 | ‡ | |
| 51 | Macrouridae | Trachyrincus murrayi Günther, 1887 | 1237 | 1297 | ‡ | |
| 52 | Ipnopidae | Bathypterois dubius Vaillant, 1888 | 1237 | 1767 | ||
| 53 | Bathysauridae | Bathysaurus ferox Günther, 1878 | 1237 | 3527 | ||
| 54 | Moridae | Lepidion schmidti Svetovidov, 1936 | 1327 | 2404 | ||
| 55 | Alepocephalidae | Alepocephalus australis Barnard, 1923 | 1327 | 2979 | ||
| 56 | Alepocephalidae | Bathytroctes microlepis Günther, 1878 | 1496 | 2979 | †‡ | |
| 57 | Macrouridae | Coryphaenoides armatus (Hector, 1875) | 1528 | 4300 | 4865 | ‡ |
| 58 | Somniosidae | Somniosus microcephalus (Bloch and Schneider, 1801) | 1572 | 2992 | ||
| 59 | Arhynchobatidae | Bathyraja richardsoni (Garrick, 1961) | 1572 | 3055 | ||
| 60 | Ophidiidae | Spectrunculus grandis (Günther, 1877) | 1572 | 3366 | 4298 | |
| 61 | Macrouridae | Coryphaenoides mediterraneus (Giglioli, 1893) | 1580 | 3527 | ‡ | |
| 62 | Ipnopidae | Bathypterois phenax Parr, 1928 | 1630 | 1767 | ||
| 63 | Bythitidae | Cataetyx laticeps Koefoed, 1927 | 1630 | 1767 | ||
| 64 | Alepocephalidae | Narcetes stomias (Gilbert, 1890) | 1630 | 2567 | ‡ | |
| 65 | Macrouridae | Coryphaenoides guentheri (Vaillant, 1888) | 1630 | 2992 | ||
| 66 | Macrouridae | Coryphaenoides brevibarbis (Goode and Bean, 1896) | 1630 | 3465 | ‡ | |
| 67 | Halosauridae | Halosauropsis macrochir (Günther, 1878) | 1630 | 3527 | ||
| 68 | Macrouridae | Bathygadus favosus Goode and Bean, 1886 | 1702 | 1767 | ||
| 69 | Alepocephalidae | Conocara macropterum (Vaillant, 1888) | 1702 | 1767 | ‡ | |
| 70 | Macrouridae | Sphagemacrurus hirundo (Collett, 1896) | 1702 | 1767 | ||
| 71 | Pentanchidae | Apristurus profundorum (Goode and Bean, 1896) | 1702 | 2107 | ||
| 72 | Synaphobranchidae | Ilyophis brunneus Gilbert, 1891 | 1702 | 2979 | ‡ | |
| 73 | Aphyonidae | Aphyonus gelatinosus Günther, 1878 | 1702 | 3050 | ||
| 74 | Alepocephalidae | Conocara murrayi (Koefoed, 1927) | 1702 | 3050 | ‡ | |
| 75 | Macrouridae | Coryphaenoides leptolepis Günther, 1877 | 1702 | 3527 | ||
| 76 | Alepocephalidae | Bathytroctes macrolepis Günther, 1887 | 1800 | 3527 | ‡ | |
| 77 | Liparidae | Paraliparis nigellus Chernova and Møller, 2008 | 1872 | 2107 | ||
| 78 | Alepocephalidae | Narcetes erimelas Alcock, 1890 | 1872 | 3050 | ‡ | |
| 79 | Macrouridae | Coryphaenoides carapinus Goode and Bean, 1883 | 1872 | 3527 | ||
| 80 | Alepocephalidae | Rinoctes nasutus (Koefoed, 1927) | 1872 | 3527 | ‡ | |
| 81 | Chimaeridae | Chimaera monstrosa Linnaeus, 1758 | 1929 | 1929 | ||
| 82 | Alepocephalidae | Leptoderma macrophthalmum Byrkjedal et al., 2011 | 2063 | 2107 | ‡ | |
| 83 | Ophidiidae | Penopus microphthalmus (Vaillant, 1888) | 2063 | 2107 | ||
| 84 | Macrouridae | Squalogadus modificatus Gilbert and Hubbs, 1916 | 2063 | 2107 | ‡ | |
| 85 | Stephanoberycidae | Acanthochaenus luetkenii Gill, 1884 | 2063 | 2979 | ‡ | |
| 86 | Alepocephalidae | Alepocephalus productus Gill, 1883 | 2063 | 3050 | ||
| 87 | Ipnopidae | Bathypterois grallator (Goode and Bean, 1886) | 2063 | 3050 | ||
| 88 | Macrouridae | Paracetonurus flagellicauda (Koefoed, 1927) | 2063 | 3050 | ||
| 89 | Notacanthidae | Polyacanthonotus challengeri (Vaillant, 1888) | 2063 | 3527 | ‡ | |
| 90 | Rhinochimaeridae | Harriotta haeckeli Karrer, 1972 | 2306 | 3071 | ||
| 91 | Ophidiidae | Spectrunculus crassus (Vaillant, 1888) | 2306 | 3527 | ||
| 92 | Arhynchobatidae | Bathyraja pallida (Forster, 1967) | 2582 | 3366 | ||
| 93 | Platytroctidae | Bathysaurus mollis Günther, 1878 | 2660 | 2670 | ||
| 94 | Ophidiidae | Lamprogrammus niger Alcock, 1891 | 2660 | 2670 | ‡ | |
| 95 | Alepocephalidae | Talismania mekistonema Sulak, 1975 | 2660 | 2670 | ‡ | |
| 96 | Alepocephalidae | Bathytroctes michaelsarsi Koefoed, 1927 | 2941 | 2955 | 4222 | ‡ |
| 97 | Macrouridae | Asthenomacrurus victoris Sazonov and Shchherbachev, 1982 | 3005 | 3050 | ||
| 98 | Ophidiidae | Porogadus miles Goode and Bean, 1885 | 3005 | 3050 | 5050* | |
| 99 | Ophidiidae | Holcomycteronus squamosus (Roule, 1916) | 3005 | 3527 | 4812 | |
| 100 | Macrouridae | Coryphaenoides profundicolus (Nybelin, 1957) | 3505 | 3527 | 4865 | |
Demersal and Benthopelagic Fishes of the Mid Atlantic Ridge (41°-60°N) ranked in order of minimum depth of occurrence.
Minimum and maximum depth data from Porteiro et al. (2017). Maxx: additional data from Priede et al. (2010). *data from Fishbase (Froese and Pauly, 2021), † also captured in pelagic trawl (Porteiro et al., 2017), ‡ benthopelagic according to Fishbase (Froese and Pauly, 2021).
Demersal species richness shows a peak of over 50 species present at 2000 m (Figure 8A). Examining this in cumulative form (Figure 8B) the total number of species increases with height of the ridge. Fitting a linear relationship from 1000 to 4000 m depth predicts, 2.5 species were present at 4000m, 35 species up to 3000m, 67 species up to 2000 m and 99 species up to 1000 m.
Figure 8
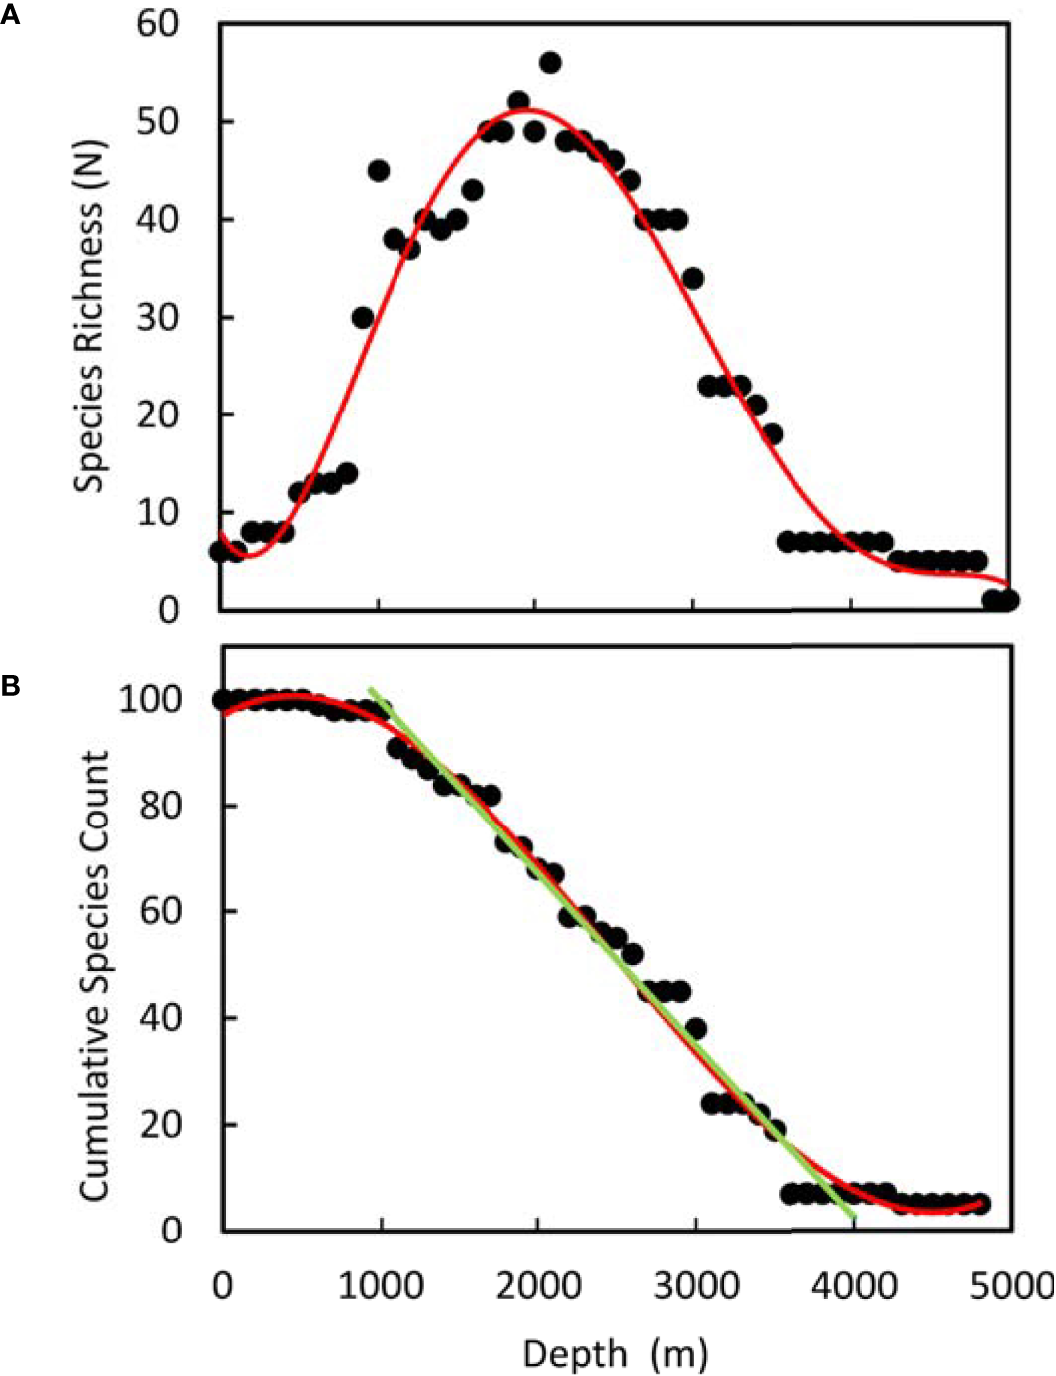
Species richness on the Mid-Atlantic Ridge (41°-60°N) derived from the depth range data in Figure 6 and Table 3 assuming species occurrence is continuous between maximum and minimum observed depth. (A) Total species per 100m depth stratum. Red line - fitted polynomial. (B) Cumulative species count from maximum to minimum depth, Red line- fitted polynomial. Green line: Linear relationship 1000 - 4000m depth: y = -0.0323x + 131.69 R² = 0.984.
Twenty species of Chondrichthyes were caught including Chimaeras, Sharks, and Rays distributed from the ridge summit down to a maximum bottom depth of 3366 m, where the Leafscale gulper shark (Centrophorus squamosus) and Pale ray (Bathyraja pallida) were recorded. Twenty-one families of teleosts were recorded, the most speciose being: Macrouridae (18 species), Alepocephalidae (17 species), Moridae (7 species), Ophidiidae (6 species) and Platytroctidae (6 species).
Hard Substrate Distribution Analysis
The bathymetric surveys comprised a series of transects across the summit of the MAR at latitudes from 41.5°N to 56°N within the region between the Azores and the Reykjanes Ridge (Niedzielski et al., 2013). Within this area, 11,237 discrete patches of steep terrain with slope > 30° were identified which corresponds to 0.91 steep patches km-2 over an estimated total survey area of 10,268 km2. Niedzielski et al. (2013) estimate that within each patch, an average of 67% of the area would be exposed hard rock. The mean nearest neighbour distance between patches was 409 m (SD 454 m) for the RRS James Cook data, and 199 m (SD 268 m) for the RV GO Sars data (Figure 9). The medians were 266 and 127 m respectively, and the most isolated patch in the combined data set was 10,595 m from its nearest neighbour. The overwhelming majority of nearest neighbour distances were less than 1,000 m; 91.9% and 98.7% for the RRS James Cook and RV GO Sars data respectively.
Figure 9
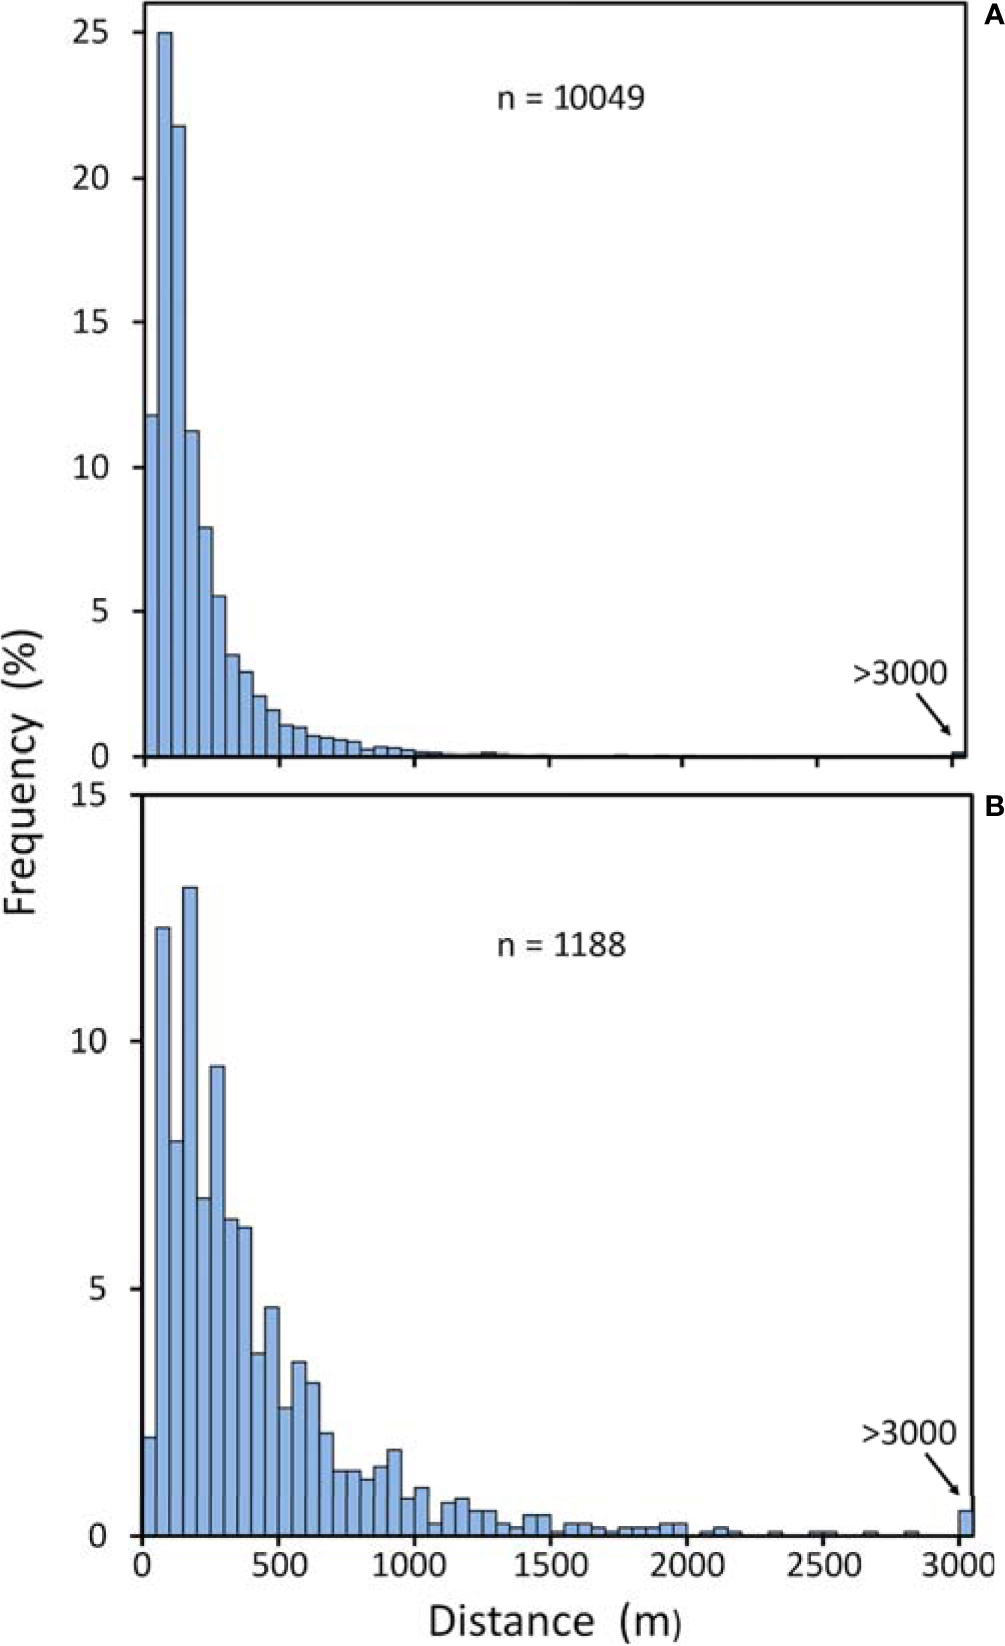
Nearest neighbour distances between centroids of steep slope (>30°) patches from transects across at the MAR at 41.5°N to 56°N. (A) Data from the RV GO Sars (42-59m resolution). (B) Data from the RRS James Cook (99-100m resolution).
Discussion
Net Primary Production and Particulate Organic Carbon Flux Over the MAR
The mean net primary production (NPP) on the MAR (3,500 -800 m depth) was not significantly different from that in adjacent waters over the abyssal regions (>3500 m depth) either side of the ridge. Therefore, the hypothesis that the presence of the ridge directly enhances surface productivity is rejected. In the NE Atlantic, significant spring enhancement of primary production has been observed over the Gorringe seamount, where the summit is in the photic zone, about 30 m below the surface (Oliveira et al., 2016). In a global analysis, based on remote sensing over seamounts, Leitner et al. (2020) found evidence of long-term decadal time-scale persistent surface chlorophyll enhancement in 27% of summits ≤100 m below the surface and 6% of summits ≤1000 m depth. Our results show that such seamount-induced chlorophyll enhancement (SICE) does not generally occur over the MAR, most of which is too deep to produce any observable effect at the surface.
The predicted particulate organic carbon flux arriving on the seafloor was 31-65% higher on the MAR lower bathyal than in the adjacent abyssal regions to the east and west. Peak values on the summits averaged 2-3 times higher the flux observed in the abyss. This increase in POC flux is explained by elevation of the sea floor of the MAR and the shorter vertical distance over which POC flux is attenuated with depth. Increased supply of organic carbon is likely to support higher biomass and abundance of benthic fauna.
After initial colonisation of a hypothetical new segment of ridge, there is probably a positive feedback effect further increasing biomass through active biological processes. For example, near the summits most of the demersal fishes present are bentho-pelagic species (Figure 7) which actively forage in the water column over the ridge capturing prey in the mesopelagic and surface layers, thus actively transporting additional organic matter to the MAR. Many invertebrates including sessile fauna such as corals as well as mobile species capture planktonic and nektonic prey from the waters surrounding the MAR. These active processes may be particularly enhanced by the vast pelagic biomass of the deep-scattering layers impinging on MAR particularly during their diurnal descent to their maximum depth (Genin et al., 1994; Fock et al., 2002).
There is a trend of decrease in POC flux from North to South (Figures 2, 4–6). According to the Longhurst (1998) biogeographic representation of the ocean our Northern stratum (40°-48°N) intersects the North Atlantic Drift Province (NADR), which is the region of greatest seasonal oscillation in NPP in the world’s ocean. The Azores stratum (40°-32.5°N) is within the North Atlantic Subtropical Gyre Province (NAST). The southern stratum (32.5°-10°N) is in the Trade Wind Biome of the North Atlantic Tropical Gyral Province (NATR) which has the lowest NPP in the North Atlantic (Longhurst, 1998). The part of the MAR being explored for mining of polymetallic sulphides (12°N - 33°N) is within the southern stratum and experiences relatively low organic carbon input compared to areas North of the Azores.
Biodiversity - Depth Relationships
Analysis of demersal fish with depth (Figure 8) shows a maximum of species-richness at around 2,000 m, followed by a decline towards abyssal depths. This is similar to patterns described for a variety of taxa on continental slopes including gastropods, polychaetes, bivalves, cumaceans, invertebrate megafauna and fish (Rex, 1981). A maximum of species richness at mid-slope depths is a widespread phenomenon (Gage and Tyler, 1991). For demersal fishes in the NE Atlantic on the slopes of the Porcupine Seabight, Priede et al. (2010) found a species richness maximum at around 1,500 m depth. The diversity maximum on the MAR is at greater depth than on the slopes, possibly reflecting absence of habitat at shallow depths on the MAR.
The total number of demersal fish species present across the MAR in the North Atlantic (100 species) is close to that observed in the Porcupine Seabight (108). However, the present dataset for the MAR spans a wide latitudinal range (41°-60°N) with some species only occurring in part of the survey area. For example, Macrourus berglax is mainly a northern species, whereas Histiobranchus bathybius only occurs south of 52°N.
Bergstad et al, (2008b) suggested that some species may be exclusively observed either on the Western or Eastern slope of the ridge. Biodiversity in our analysis is however greater than would be expected based on previous observations at any given location along the MAR. The fish fauna of the MAR are relatively less well studied than those on continental slopes (Porteiro et al., 2017), so the species inventory may not be complete. Haedrich and Merrett (1988) list a total of 338 deep demersal fish species in the North Atlantic, although this includes species living at shallower depths than available on the MAR. In an analysis of a subset of the present data, Bergstad et al. (2008b) found a general decrease in abundance, biomass, and species number with depth. They also documented a change in dominant species with depth. Their cluster analysis revealed six species groups segregated by depth and latitude but with no clear zonation by depth.
Figure 8B shows that there is an increase in total number of species with increase in height of the MAR above the abyssal plains. The slope of the linear regression corresponds to an increase in total species of 32 species per 1000 m. On the Porcupine abyssal plain to the east of the MAR, Priede et al. (2010) recorded 10 demersal fish species at depths >4500 m. By providing depth niches for different species, the bathymetry of the MAR has a major effect on mid ocean deep-sea fish biodiversity.
Substrate Heterogeneity
Distances Between Rocky Substrate Patches
In a previous study, Niedzielski et al. (2013) showed that over 95% of the MAR between 41.5°N and 56°N is covered in sediment. This provides habitat for burrowing species, interstitial infauna, and browsing megafauna. Flat plains filled with soft sediment comprised 38% of the area surveyed, arranged in a series of terraces on either side of the axis of the ridge. This new analysis shows that although hard substrate occupies less than 5% of the MAR area, the distance between neighbouring patches is typically less than 500 m and over 90% of patches are less than 1 km away from their nearest neighbour (Figure 9). We conclude that for successful dispersal of fauna between patches of suitable habitat the animals need to be able to move, or broadcast eggs or larvae to be carried over distances of 200 to 1,000 m.
The difference in spatial resolution between the RRS James Cook (ca. 100 m) and RV GO Sars (ca, 50 m) is a complicating factor that cannot be resolved without new data. Nevertheless, it is evident that hard substrate patches are relatively close to one another on the MAR. Furthermore, within each steep slope pixel there are likely to be multiple patches of hard substrate areas, including isolated single rocks, exposed summits or near-vertical cliff faces.
We assume that transport by bottom currents is an important mechanism for dispersal of hard substrate fauna. Priede et al. (2013a) measured tidal currents up to 0.05 m.s-1 with long-term currents up to 0.025 m.s-1 on the flanks of the ridge. Dale and Inall (2015) showed that topography has an important influence, and recorded above-bottom tidal flows of up to 0.1 m.s-1. A transport speed of 0.05 m.s-1 or 180 m.h-1 is sufficient to allow movement between most patches of hard substrate within one tidal cycle. Long term residual flow of 0.02 m.s-1 would result in transport over a distance of 1.73 km.day-1.
Riehl et al. (2020) emphasise the importance of fracture zones in providing rare patches of rocky substrate at abyssal depths. In the North Atlantic there are approximately 65 fracture zones between the equator and 60°N (Müller and Roest, 1992). This would give an average distance between fracture zones of 135 km; it is evident that on the MAR, distances between rocky patches are shorter, and hence connectivity much enhanced compared with the abyss.
Connectivity Processes
In the previous section we show that to ensure effective connectivity of populations across the MAR hard substrate fauna need to be able to disperse over distances of 200-1000m. Connectivity of benthic species is the result of larval dispersal, settlement and recruitment leading to recruitment into the adult population (Metaxas and Saunders, 2009). This depends on hydrographic conditions and the presence of suitable habitat for the larvae, including the type of bottom substrate (hard or soft), within a viable distance given motility and directionality of the organisms and currents.
A major factor is the duration of the larvae development either as planktonic larvae (i.e. Planktonic Larval Duration- PLD) or on the substrate if it is a crawler; and the ability to survive until the next suitable habitat (travel distance). Planula larvae of the octocoral Drifa glomerulata, for example, are demersal and actively probe the substratum immediately upon release whereas other species drift between the water column and seabed usually settling after 1-30 days (Sun et al., 2010). The few studies that exist show that species with a 24 h pelagic larval phase can disperse around one kilometre, and species with a longer pelagic phase can travel hundreds of kilometres (Shanks, 2009).
The distance that the larvae can travel is also dependent on whether the larva is planktotrophic; able to feed in the water column enabling longer travel distance, or lecithotrophic, dependent entirely on food reserves (e.g. in the yolk sac) in which case travelling distances may be shorter (Danovaro et al., 2014). Little is known about the larval biology of deep-sea benthic species such as octocorals. Knowledge is limited to some brooding species, with very short PLD (Sun et al., 2010) while others are broadcast-spawners that have different larval characteristics and dispersal capabilities (Rakka et al., 2021). Some authors showed that for sponges a short PLD is an advantage (surviving better, growing faster and with a more regular shape), confirming the hypothesis that long-lived larvae bring fewer reserves to the post-settlement period (Maldonado and Young, 1999). A review by Young (2003) showed that pelagic lecithotrophy, rather than brooding, is the main reproductive mode in the deep sea.
The results presented here (Figure 9) show that the distance between centroids of hard substrate patches is generally less than 1km. Dispersal over such distances is readily achieved by larvae of many deep-sea species and suggests a high degree of connectivity between patches of suitable habitat for sessile benthic species. The rugged topography of MAR can create areas of strong turbulent near-bed currents (Dale and Inall, 2015). Such flows may enhance food supply and provide favourable conditions for the settlement of suspension-feeding fauna, such as cold-water corals and sponges (Mortensen et al., 2008). Larval rearing experiments showed that without aeration, larvae of octocorals have a strong negative buoyancy, remaining at the bottom (Rakka et al., 2021), showing the importance of seabed currents for larval dispersal.
Most of the hard substrate species on the MAR are indicators of vulnerable marine ecosystems, which are characterised as long living, low fecundity and slow growing (ICES, 2020). Short distances between neighbouring hard substrate patches favour connectivity. However, dispersal over larger distances to seamounts or the ocean margin (Figure 1) depend on mesoscale phenomena, such as eddies or benthic storms (Vic et al., 2018). The close spacing between hard substrate patches enables them to be used as stepping-stones for faunal dispersal over long distances as hypothesised for the chains of seamounts (Miller and Gunasekera, 2017)
Hard Substrate Megafauna of the MAR
Hard substratum on the Mid-Atlantic Ridge takes many forms from exposed rocks on otherwise fine sediment areas to extensive vertical walls of basalt on the ridge scarps (Figure 10). Organisms have been observed living attached to and in association with all these forms of hard substratum (Bell et al., 2016; Alt et al., 2019). Indeed, even small boulders can support extensive communities of large megafauna, such as stalked crinoids and sponges (Craig et al., 2011). Despite these occurrences, hard substratum is generally absent from flat areas and relatively rare (1.6% of area) in gently sloping areas in the vicinity of the Charlie-Gibbs Fracture Zone (Alt et al., 2019) and likely elsewhere (Niedzielski et al., 2013). These sedimented plains with low slopes make up most of the MAR area (flat: 37.7% and gentle slopes: 56.7%; Niedzielski et al., 2013). Even the limited additional heterogeneity offered in the sloping sites may contribute to the enhanced species richness found in the majority of these areas (Alt et al., 2019) for there are many species that live attached to hard substratum. Even the limited additional heterogeneity offered in the sloping sites may contribute to the enhanced species richness found in the majority of these areas (Alt et al., 2019) for there are many species that live attached to hard substratum. While there is a rapid decrease in the density of deepwater corals with depth below about 1,300 m in the MAR (Mortensen et al., 2008), many of the distinctive and large taxa living on hard substrata are observed across multiple surveys at similar depth bands (Morris et al., 2012; Gebruk and Krylova, 2013; Bell et al., 2016). This suggests that at least some species have widespread distributions across patches of suitable habitat within particular depth horizons. In the ECOMAR video surveys at 2500 m depth, Linley et al. (2013) found no consistent relationship between fish distribution and seafloor slopes with different substrates but around the Azores, Parra et al. (2017) report a general preference for mixed sediments, sandy and rocky areas, with low fish numbers on muddy areas.
Figure 10
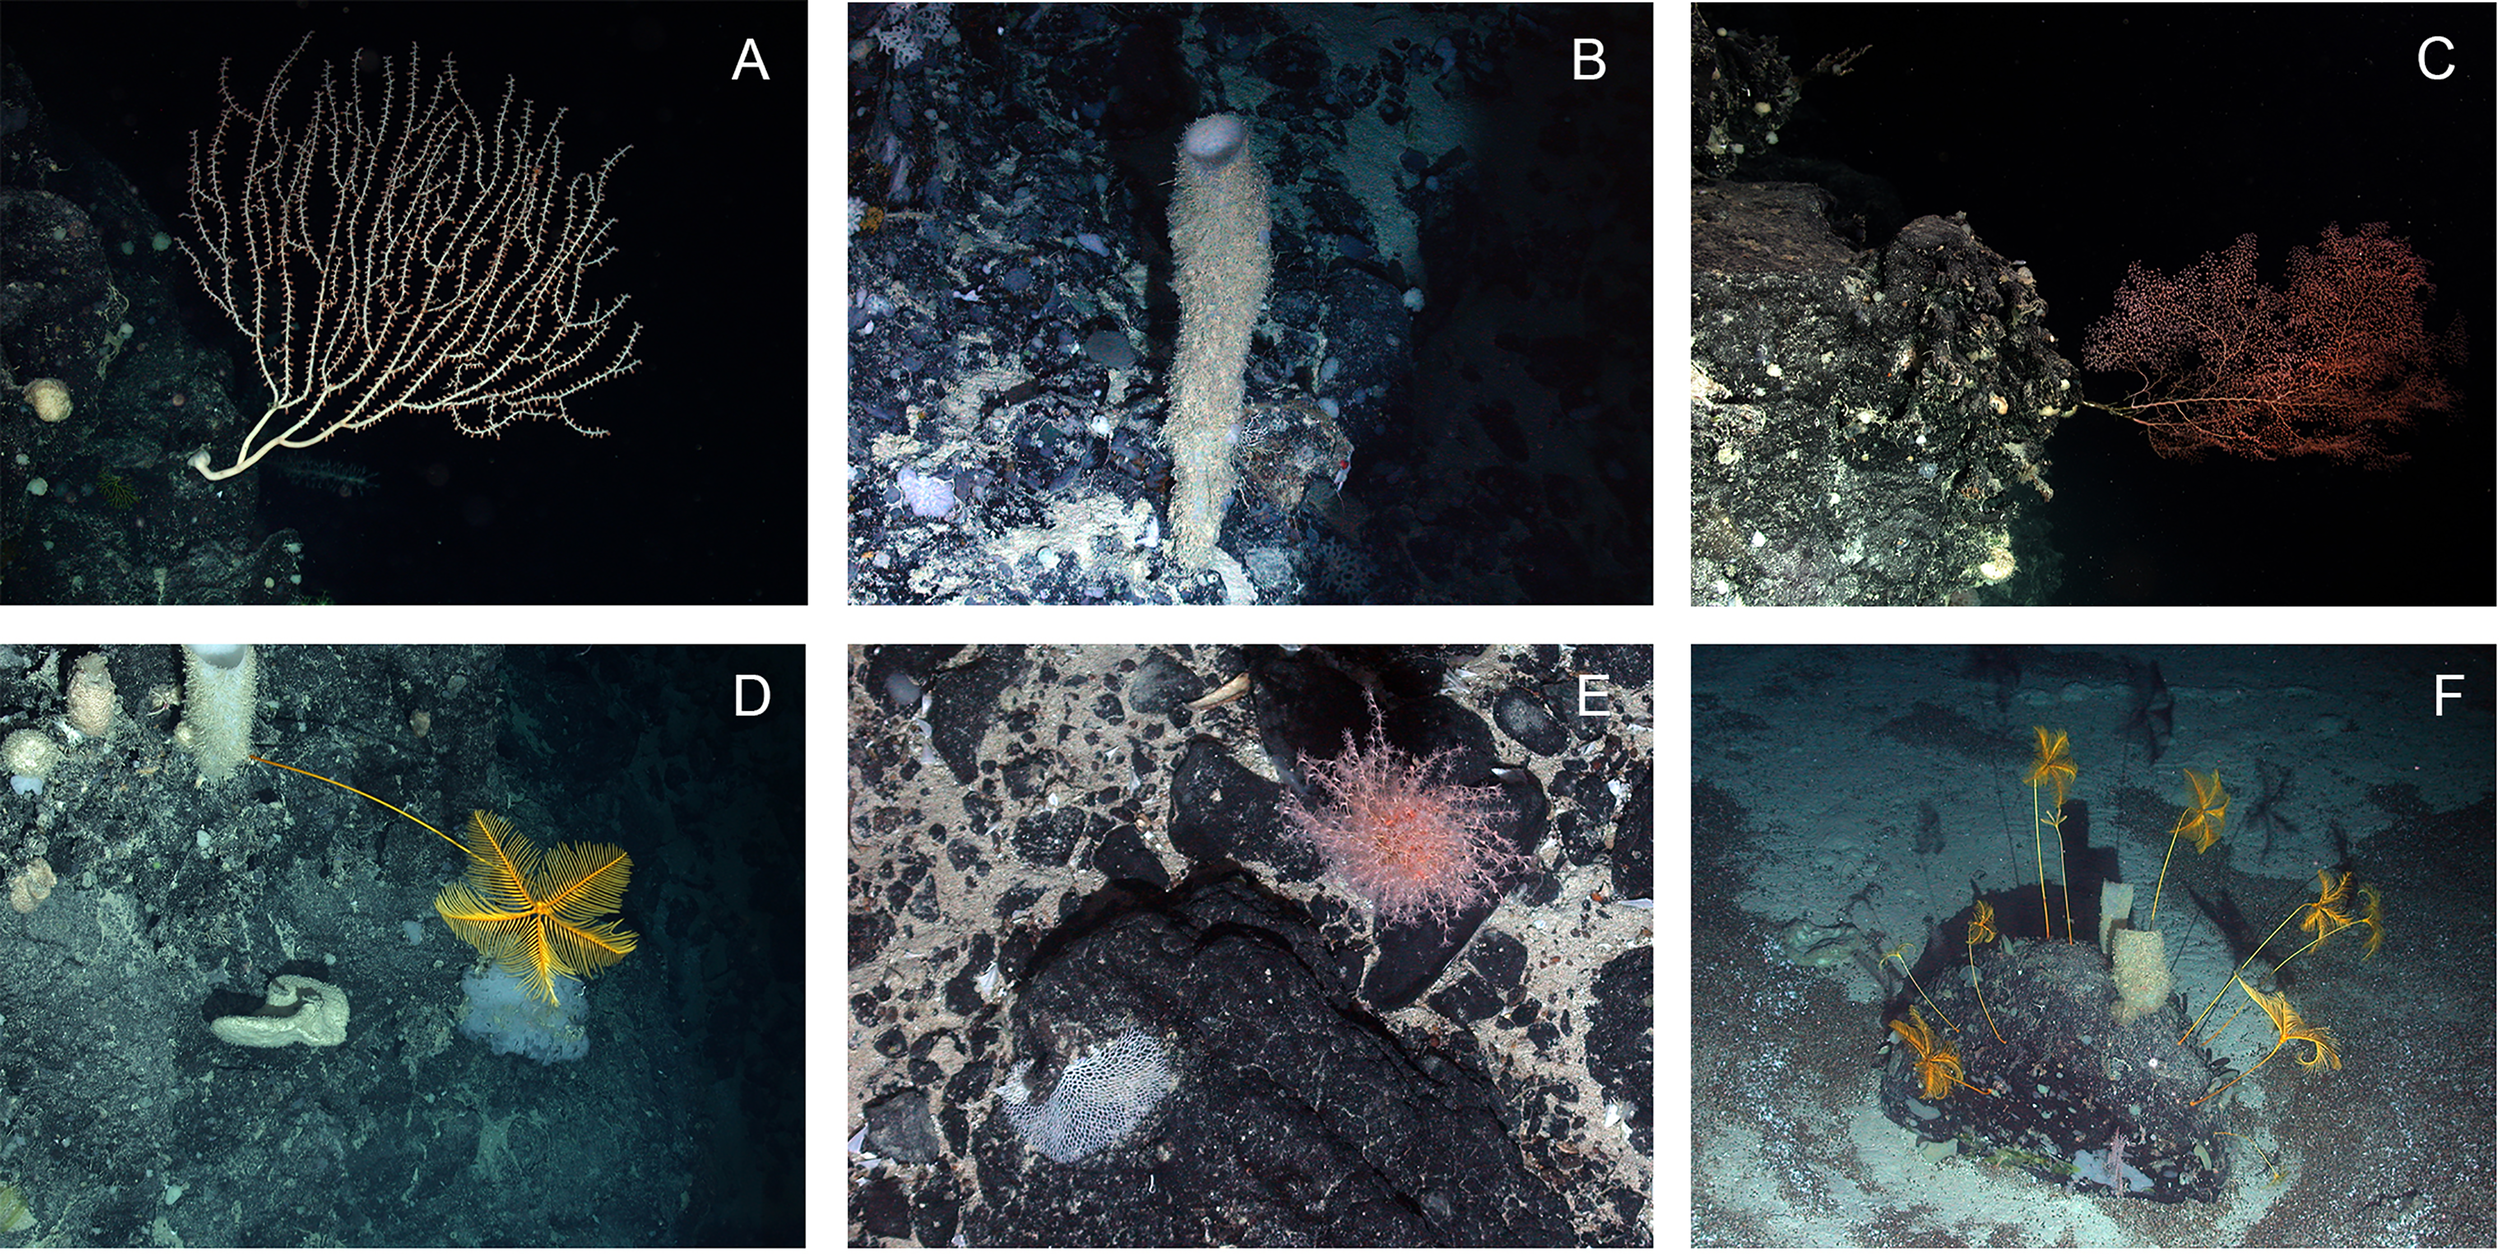
Examples of species associated with rocky substratum on the northern Mid-Atlantic Ridge. Dive number indicated with D in caption. (A) Isididae sp. on steep rock wall D173; (B) Sponge on rock wall D159; (C)Chrysogorgia sp. on steep rock wall D173; (D)Anachalypsicrinus nefertiti on rocky wall D173; (E) Unknown octocoral on rock in mixed substratum area D178; (F) soft sediment with pteropod thanatocoenoses and boulder with multiple crinoids (Anachalypsicrinus nefertiti) and sponges D178. Images collected on two dives during ECOMAR cruise JC048: Dive 173 (station 40, ECOMAR SW Site, Date 21 June 2010, 48° 44.118 N 28° 39.335 W, 2623-2428 m depth) and Dive 178 (station 53, ECOMAR SE Site, Date 27 June 2010, 49° 1.439 N 27° 41.264, 2442-2630 m depth).
Soft Sediment Megafauna
In the ECOMAR study areas (49°N & 54°N), soft sediments in flat and gentle (<30°) slopes were predominantly clay to coarse sand with fine silt (1-10 µm) (Alt et al., 2019). At 49°N, south of the Charlie-Gibbs Fracture Zone, accumulations of pteropod shells were common. The seafloor was disturbed in most areas by the traces of megafauna (Lebensspuren), which covered between around 5 and 10% of the seabed area (Bell et al., 2013). These Lebensspuren consisted of mounds, burrows, tracks, faecal casts, body impressions and depressions caused by animal activity (Bell et al., 2013). The proportions of these types were variable between areas. A total of 58 distinct Lebensspuren types could be differentiated (Bell et al., 2013).
The faunal communities inhabiting soft sediments on the Mid-Atlantic Ridge, at least in the ECOMAR and MARECO areas, were dominated by echinoderms. Holothurians were the most abundant of these and include at least 55 species (Gebruk, 2008; Rogacheva et al., 2013). Sponges and cnidarians were also abundant (Gebruk et al., 2010; Alt et al., 2019). There was some spatial heterogeneity in the available species-level data from benthic trawl surveys of the MAR. However, it is difficult to separate ecological differences in the limited amounts of semi-quantitative trawl data. In the case of the trawl surveys of the MARECO area (41.5°N to 56°N) (Gebruk et al., 2010) and the smaller ECOMAR area around the Charlie Gibbs Fracture Zone (Alt et al., 2013), there were a total of 226 species of invertebrates named, with 193 species in the MARECO dataset (Gebruk et al., 2010) and 90 species (excluding unclear identifications) in the ECOMAR dataset (Alt et al., 2013). The two areas had 58 species in common. The best studied and likely most comparable taxon in those datasets, the echinoderms, had a total of 118 named species between the two studies, of which 50 were shared.
Biodiversity and Substrate Heterogeneity
Since hard and soft substrates provide habitat for distinctive assemblages of species it is reasonable to assume that a heterogeneous environment with both kinds of substrate should have higher biodiversity through an additive effect. There are differences between studies in the habitat that contributes most to the biodiversity of the region. Studies of the megafauna (Figure 11) of the Charlie-Gibbs fracture zone between 1700 – 4500 m depth using the submersibles Mir-1 and Mir-2 (Felley et al., 2008; Gebruk and Krylova, 2013) observed more morphospecies (29) associated with rocks than with soft sediment (16). In contrast, in the ECOMAR study areas at ca. 2500 m depth on the flanks of the MAR (49°N and 54°N), the steeper rocky areas appear to have a generally lower density and lower species richness in the same surface area of flat and gently sloping sediment (Bell et al., 2016 and Alt et al., 2019), with most faunal groups having at least an order of magnitude lower density in rocky areas. However, not all taxa followed this trend, with both sponges and cnidarians being particularly abundant on rocky areas (Bell et al., 2016) and occurring at densities of similar orders of magnitude to the flatter sediment-covered areas. Rocky areas in all studies had distinct morphospecies, for example at the ECOMAR sites 15 morphospecies were observed in rocky areas (Bell et al., 2016) that were not seen in flatter areas (Alt et al., 2019). Some motile species usually associated with soft sediments, such as holothurians (Rogacheva et al., 2013) and enteropneusts (Jones et al., 2013) were seen in rocky areas. The differences between these results are likely related to faunal variation associated with depth, as even in the Mir datasets (Gebruk and Krylova, 2013) the ca. 2500 m depth band had particularly high richness of sediment-associated fauna.
Figure 11
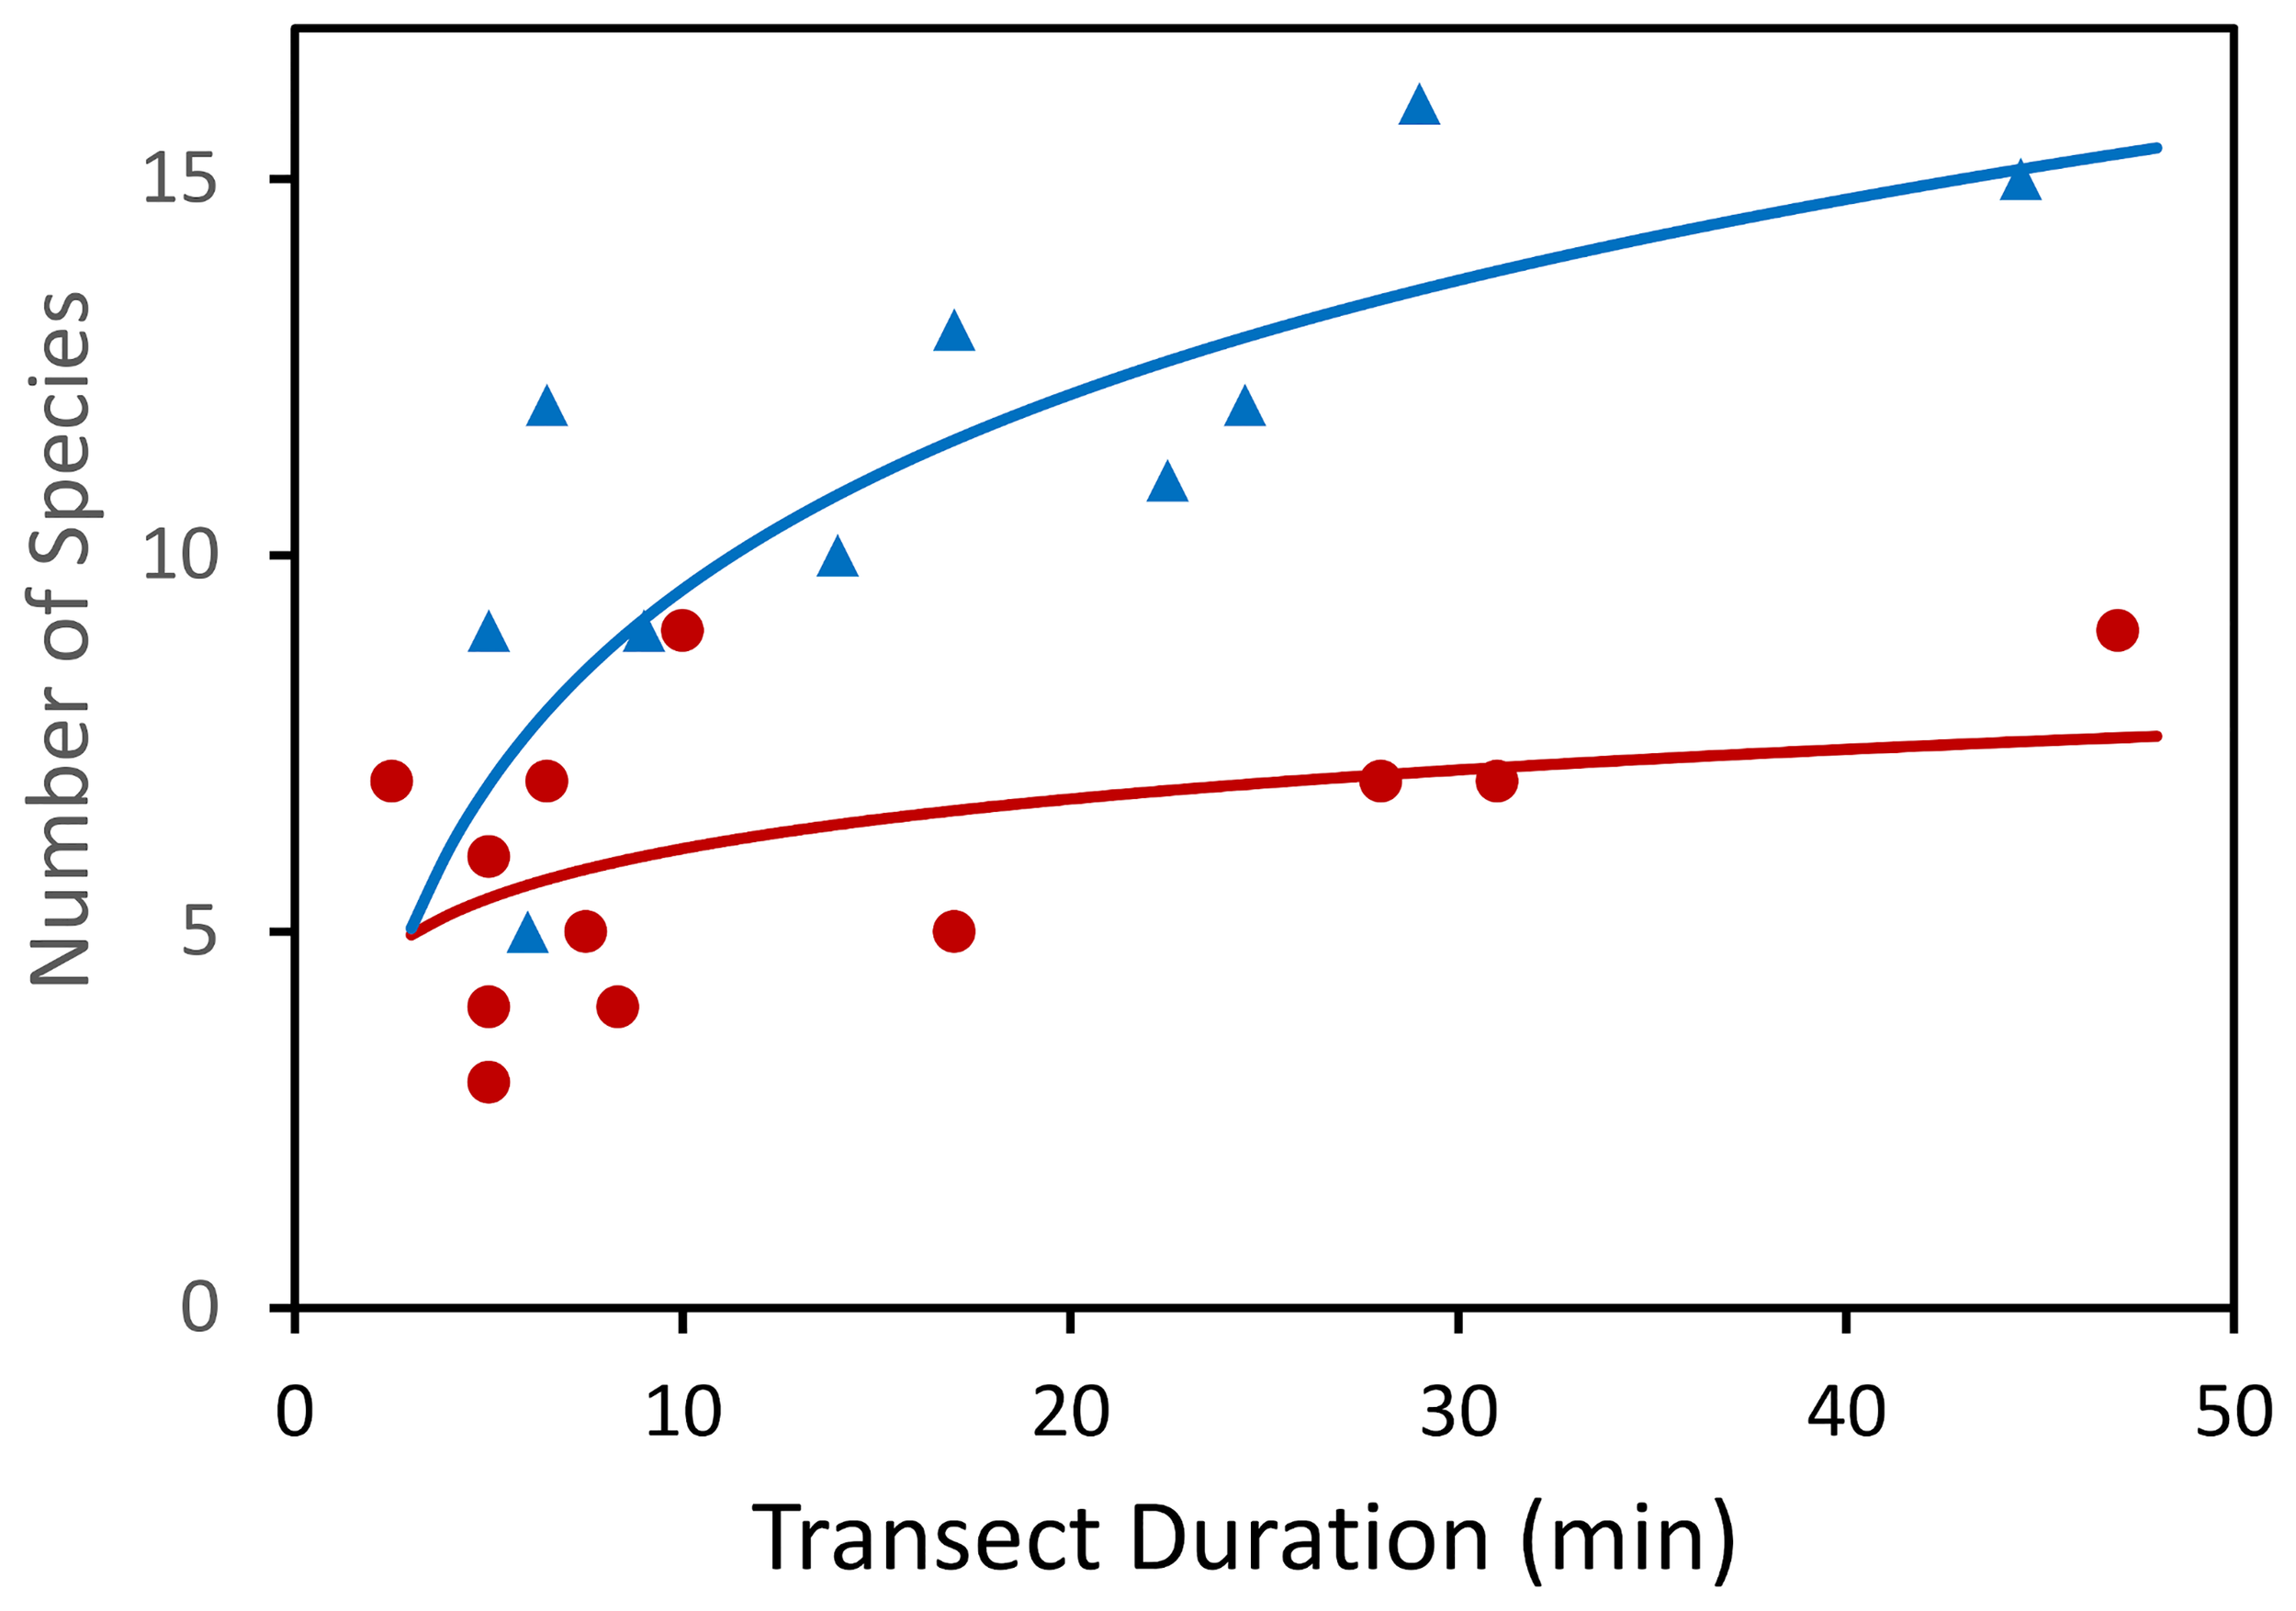
Number of species observed during video transects across hard and soft substrates of the Charlie Gibbs Fracture Zone. Circles dark red – soft sediment. Triangles blue – hard rock. (After Gebruk and Krylova, 2013).
One reason for higher species diversity on rocks may be the association between species: some species provide a substrate to others, for example comatulid crinoids and ophiuroids settle on gorgonian corals (Gebruk and Krylova, 2013). In a region of the MAR between the southern part of the Reykjanes Ridge and the Azores (~45°N), 10 times more corals were found on rocky areas than sediment-covered areas (Morris et al., 2012) and areas with corals hosted 1.6 times more megafaunal taxa than areas without corals (Mortensen et al., 2008).
Biogeographic Patterns
In the North Atlantic, the MAR accounts for 46% of the lower bathyal at depths from 800 to 3500 m (Niedzielski et al., 2013). The ridge provides habitat for bathyal species that also occur on Western Atlantic and Eastern Atlantic continental slopes. For fish and invertebrates, there is some prevalence of Eastern Atlantic species on the MAR (Mironov, 2006; Priede et al., 2013a).
The overall pattern of distribution of bathyal species in the open Atlantic Ocean is complicated. There are no commonly accepted schemes of regionalization of the bathyal in the Atlantic (see Dinter, 2001). Few existing schemes are based on differing approaches and therefore are not comparable. Moreover, approaches to zonation are not always clearly explained. The variety of approaches in marine biogeography was examined and structured by Mironov (2013), who distinguished three main biogeographic frameworks differing in the subject of study and methods. The first approach deals with species ranges - “faunistic” (or “biotic”) approach after Mironov. The second is the “biocenotic” approach, it deals with communities (or biocenoces). The third is designated as “landscape” and considers environmental parameters. In the faunistic approach, the main criterion of a biogeographic boundary is a zone of crowding of species range boundaries. In the biocenotic approach, the criterion of a boundary is the difference between local biotas commonly revealed using cluster analysis (based on such parameters as species abundance, biomass and diversity). In the landscape approach, boundaries usually correspond to pronounced gradients of physical-chemical parameters.
Proposed schemes of zonation differ significantly. Based on environmental parameters, Watling et al. (2013) distinguished a single unit “North Atlantic Province” at depths 800-3500 m south of the sub-Polar front in the North Atlantic. Regionalization of the Atlantic bathyal based on the distribution of species is more complicated (Briggs, 1974; Mironov, 1994; Zezina, 1997; Dinter, 2001; Watling et al., 2013).
Mironov (1994) suggested a scheme of faunistic regionalization of sublittoral and bathyal of the ocean based on the distribution of echinoid species and the scheme of Briggs (1974) (Figure 12A). A notable feature in the scheme of Mironov is the “meridional asymmetry” in the distribution of species across the open ocean in the east-west direction. Thus, in the Atlantic Ocean, the West Atlantic species are distributed in the open oceanic regions more widely than the East Atlantic species (Mironov, 1989; Mironov, 2006). Some of the West Atlantic species’ ranges extend eastward up to the seamounts and islands of the Eastern Atlantic, whereas the East Atlantic ranges extend westward only up to the Mid-Atlantic Ridge. Using data on distribution of cnidaria (corals) Watling and Lapointe (2022) propose division of the North Atlantic lower bathyal biogeographic province into eastern and western units. However, these east-west patterns in the North Atlantic are true only for latitudes north of ~30°N. To the south the ridge in the Atlantic goes deeper with little space for species living at depths shallower than 2000 m (Figure 1). South of 30°N the meridional asymmetry between areas to the west and to the east of the MAR in the North Atlantic is more pronounced: the limit of distribution of western and eastern species shifts closer to the African coast and goes by the Cabo Verde Islands (Figure 12B). In the scheme of pelagic provinces (Spalding et al., 2012), there is also asymmetry in the North Atlantic with the border between the North Central Atlantic and Canary Current provinces stretching from Canary Islands to south off Cabo Verde.
Figure 12
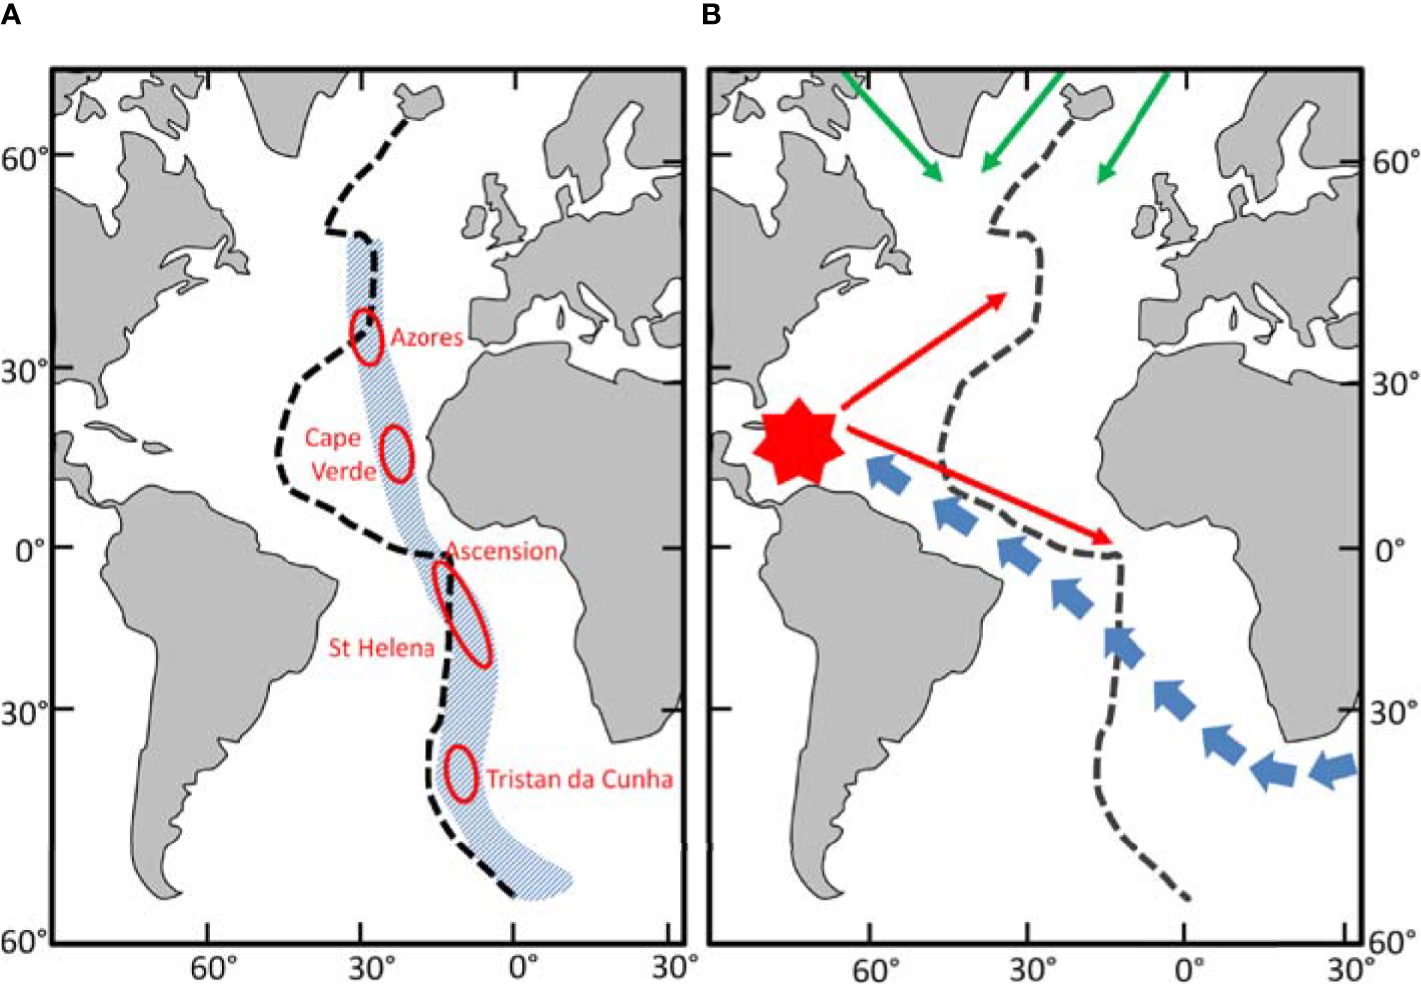
Biogeography of the Atlantic Ocean. Dashed line Mid-Atlantic Ridge. (A) The faunistic boundary where East & West Atlantic species meet (Blue shaded area). Red Ovoids – Exotic regions. (After Mironov, 1994). (B) Pattern of late Cenozoic (from 10 MYA) colonisation of the Atlantic Ocean bathyal and sublittoral. Blue arrows –from Indo-West Pacific centre of re-distribution. Red symbol – West Atlantic centre of re-distribution. Green arrows – from the North Pacific via the Arctic Ocean (After Mironov, 2006).
According to Mironov and Krylova (2006), the effect of meridional asymmetry is a result of marine fauna distribution from “centres of redistribution”. The concept of a “centre of redistribution” is a development of the formerly more widely used Darwinian concept of “centre of origin” of fauna (Croizat et al., 1974). To become a centre of redistribution, an area passes stages of fauna accumulation, speciation, and dispersal. In the post-Tethys history, there were three main centres of redistribution of the sublittoral and bathyal faunas: the Indo-Malayan, the North-West Pacific, and the West Atlantic (Mironov, 2006; Mironov and Krylova, 2006). The higher the species richness in the “centre of redistribution”, the further stretch the ranges of species dispersing from this centre into the adjacent ocean. The West Atlantic fauna is only slightly richer than that of the East Atlantic (however, in some taxa the difference is rather strong - see Zezina, 1997), therefore the meridional asymmetry in the North Atlantic is less pronounced than in the Pacific where the West Pacific fauna successfully disperses far into the ocean across the East Pacific barrier.
Conclusions
Multiple factors influence biomass and biodiversity on the Mid-Atlantic Ridge. Our results show that there is no enhancement of NPP over the ridge region compared with adjacent deeper areas of the Atlantic Ocean. However, on average, POC flux arriving on the ridge is estimated to be 31-65% higher than in adjacent regions and up to three times greater on the summits. Generally, deep-sea standing stocks of macrofauna are strongly correlated with POC flux (Smith et al., 1997; Rex and Etter, 2010) so high biomass can be expected over the MAR. The relationship between biomass and productivity is not simple or the same everywhere. Leduc et al. (2012) found a unimodal relationship with a biodiversity peak at intermediate biomass of deep-ocean nematodes. Elevation of the mid-ocean floor provides niches for a wide variety of demersal fishes culminating in a regional or gamma biodiversity more than 10 times higher than on an equivalent area of abyssal sea floor. Other benthic taxa are probably similarly affected. Substrate heterogeneity on the MAR is increased by the presence of hard rocky patches. Although these represent a small percentage of sea floor area, they are frequent, with an average spacing of <500 m conducive to dispersal of specialist hard substrate fauna hence increasing biodiversity (Zeppilli et al., 2016). Biogeographically the MAR is located at the interface between Eastern and Western Atlantic biota further increasing biodiversity.
Currently much interest in the environment of the MAR is concerned with the potential impacts of deep-sea mining of polymetallic sulphide ore deposits that occur on the axis of the ridge associated with active and extinct hydrothermal vent sites (Washburn et al., 2019). Contract areas for development of mining on the MAR are concentrated within the latitudinal range 12° to 33°N. All the biological information on the MAR analysed in this paper is from the MAR-ECO and ECOMAR projects that sampled between 41 and 60°N. From the general principles reviewed in this study it is possible to predict that, in view of the low productivity of surface waters south of the Azores, low POC flux and greater depth, the biomass is likely to be at least an order of magnitude lower in the mining contract areas than reported for the MAR-ECO areas in Priede et al. (2013a). Inspection of the Ocean Biodiversity Information System (OBIS, 2022) reveals a severe lack of data for the MAR south of 33°N. There may also be different species present compared to the more northerly areas including species new to science in the mining contract areas. To a large extent the ecology of the deep part of the MAR south of the Azores is unknown and there is an urgent need for studies across the ridge in this region at all depths from the summits to the abyssal areas on either side.
Funding
IGP was financially supported by the Atlantic REMP project, funded by the European Union through service contract no.EASME/EMFF/2017/1.3.1.1 - SI2.775068. FMK was supported by NASA, United States (grant numbers NNX14AP62A and 80NSSC20K0017); NSF, United States (grant numbers 1762493 and 1728913); NOAA, United States Integrated Ocean Observing System (grant numbers NA19NOS0120199 and NA16NOS0120018), DJ received support from NERC through National Capability funding to NOC as part of the Climate Linked Atlantic Section Science (CLASS) programme, grant number NE/R015953/1. DJ received funding from UK Natural Environment Research Council through the Seabed Mining And Resilience To EXperimental impact (SMARTEX) project (Grant Reference NE/T003537/1). AC received support from the Operational Program AZORES 2020, through the Fund 01-0145-FEDER-000140 “MarAZ Researchers: Consolidate a body of researchers in Marine Sciences in the Azores” of the European Union. AC also acknowledges funds through the FCT – Foundation for Science and Technology, I.P., under the project OKEANOS UIDB/05634/2020 and UIDP/05634/2020.
Publisher’s Note
All claims expressed in this article are solely those of the authors and do not necessarily represent those of their affiliated organizations, or those of the publisher, the editors and the reviewers. Any product that may be evaluated in this article, or claim that may be made by its manufacturer, is not guaranteed or endorsed by the publisher.
Statements
Data availability statement
Publicly available datasets were analyzed in this study. This data can be found here: Ocean Productivity (2022)http://sites.science.oregonstate.edu/ocean.productivity/Porteiro et al. (2017) Fishes of the Northern Mid-Atlantic Ridge collected during the MAR-ECO cruise in June-July 2004: an annotated checklist. Arquipelago. Life and Marine Sciences. Supplement 10: iii +125 pp.
Author contributions
IP Led the writing process and analysed demersal fish biodiversity, FM-K analysed net primary production and POC fluxes, TN analysed substrate patch distributions, AG, DJ, and AC contributed review material. All authors participated in writing and editing the text and approved the final, submitted manuscript.
Acknowledgments
Thanks to Claudia H. S. Alt and James B. Bell for providing the original datasets behind their papers on the ECOMAR area for comparative analysis.
Conflict of interest
The authors declare that the research was conducted in the absence of any commercial or financial relationships that could be construed as a potential conflict of interest.
References
1
Alcock A. W. (1890). Natural History Notes From H. M. Indian Marine Survey Steamer `Investigator,' Commander R. F. Hoskyn, R. N., Commanding. – No. 18. On the Bathybial Fishes of the Arabian Sea, Obtained During the Season 1889-1890. Ann. Mag. Nat. Hist. (Series 6)6 (34), 295–311.
2
Alcock A. W. (1891). Class Pisces. In: II.–Natural History Notes From H. M. Indian Marine Survey Steamer `Investigator,' Commander R. F. Hoskyn, R. N., Commanding.–Series II., No. 1. On the Results of Deep-Sea Dredging During the Season 1890-91. Ann. Mag. Nat. Hist. (Series 6).8 (43/44), 119–138.
3
Alt C. H. S. Kremenetskaia A. Gebruk A. V. Gooday A. J. Jones D. O. B. (2019). Bathyal Benthic Megafauna From the Mid-Atlantic Ridge in the Region of the Charlie-Gibbs Fracture Zone Based on Remotely Operated Vehicle Observations. Deep-sea. Res. Pt. I.145, 1–12. doi: 10.1016/j.dsr.2018.12.006
4
Alt C. H. S. Rogacheva A. Boorman B. Alan Hughes J. Billett D. S. M. Gooday A. J. et al . (2013). Trawled Megafaunal Invertebrate Assemblages From Bathyal Depth of the Mid-Atlantic Ridge (48°–54°N). Deep-sea. Res. Pt. II.98B, 326–340. doi: 10.1016/j.dsr2.2013.02.003
5
Ascanius P. (1772). Icones Rerum Naturalium, Ou Figures Enluminées D'histoire Naturelle Du Nord. Pt. 2, 8 (Copenhagen), pp., Pls. 11–20.
6
Barbosa du Bocage J. V. de Brito Capello F. (1864). Sur Quelques Espèces Inédites De Squalidae De La Tribu Acanthiana, Gray, Qui Fréquentent Les Côtes Du Portugal. Proc. Zool. Soc. Lond.1864, 260–263.
7
Barnard K. H. (1923). Diagnoses of New Species of Marine Fishes From South African Waters. Ann. S. Afr. Mus.13, 439–445.
8
Beebe W. (1933). Deep-Sea Isospondylous Fishes. Two New Genera and Four New Species. Zoologica13 (8), 159–167.
9
Behrenfeld M. J. Falkowski P. G. (1997). Photosynthetic Rates Derived From Satellite-Based Chlorophyll Concentration. Limnol. Oceanogr.42, I–20. doi: 10.4319/lo.1997.42.1.0001
10
Bell J. B. Alt C. H. S. Jones D. O. B. (2016). Benthic Megafauna on Steep Slopes at the Northern Mid-Atlantic Ridge. Mar. Ecol.37, 1290–1302. doi: 10.1111/maec.12319
11
Bell J. B. Jones D. O. B. Alt C. H. S. (2013). Lebensspuren of the Bathyal Mid-Atlantic Ridge. Deep-Sea. Res. Pt. II.98B, 341–351. doi: 10.1016/j.dsr2.2012.09.004
12
Bergstad O. A. Falkenhaug T. Astthorsson O. S. Byrkjedal I. Gebruk A. V. Piatkowski U. et al . (2008a). Towards Improved Understanding of the Diversity and Abundance Patterns of the Mid-Ocean Ridge Macro- and Megafauna. Deep-Sea. Res.Pt.II55, 1–5. doi: 10.1016/j.dsr2.2007.10.001
13
Bergstad O. A. Menezes G. Høines Å. S. (2008b). Demersal Fish on a Mid-Ocean Ridge: Distribution Patterns and Structuring Factors. Deep-Sea. Res.Pt.II55, 185–202. doi: 10.1016/j.dsr2.2007.09.005
14
Bigelow H. B. Schroeder W. C. (1950). New and Little Known Cartilaginous Fishes From the Atlantic. Bull. Mus. Comp. Zool.103 (7), 385–408.
15
Billett D. S. M. Jones D. O. B. Weaver P. P. E. (2019). “Improving Environmental Management Practices in Deep-Sea Mining,” in Environmental Issues of Deep-Sea. Ed. SharmaR. (Switzerland AG: Springer Nature), pp 403–pp 446. doi: 10.1007/978-3-030-12696-4_15
16
Bloch M. E. (1788). Ueber Zwey Merkwürdige Fischarten. Abhandlungen Der Böhmischen Gesellschaft der Wissenschaften, 3, 278–282.
17
Bloch M. E. Schneider J. G. (1801). M. E. Blochii, Systema Ichthyologiae Iconibus Cx Ilustratum. Post Obitum Auctoris Opus Inchoatum Absolvit, Correxit, Interpolavit Jo. Gottlob Schneider, Saxo. Berolini. Sumtibus Auctoris Impressum Et Bibliopolio Sanderiano Commissum. i–lx + 1-584, Pls. 1-110.
18
Bonnaterre J. P. (1788). Tableau Encyclopédique Et Methodique Des Trois Règnes De La Nature (Paris: Ichthyologie. Panckoucke), i–lvi + 1-215, Pls. A-B + 1-100.
19
Briggs J. C. (1974). Marine Zoogeography (New York: McGraw Hill Book Co), 475 p.
20
Brünnich M. T. (1768). Ichthyologia Massiliensis, Sistens Piscium Descriptiones Eorumque Apud Incolas Nomina. Accedunt Spolia Maris Adriatici. Hafniae Et Lipsiae. Ichthyologia Massiliensis, Sistens Piscium Descriptiones Eorumque Apud Incolas Nomina. I-Xvi + 1-110.
21
Byrkjedal I. Poulsen J. Y. Galbraith J. (2011). Leptoderma Macrophthalmum N.Sp., a New Species of Smooth-Head (Otocephala: Alepocephalidae) From the Mid Atlantic Ridge. Zootaxa2876, 49–56.
22
Chernova N. V. (2001). A Review of the Genus Psednos (Pisces, Liparidae) With Description of Ten New Species From the North Atlantic and Southwestern Indian Ocean. Bull. Mus. Comp. Zool.155 (10), 477–507.
23
Chernova N. V. Møller P. R. (2008). A New Snailfish, Paraliparis Nigellus Sp. Nov. (Scorpaeniformes, Liparidae), From the Northern Mid-Atlantic Ridge – With Notes on Occurrence of Psednos in the Area. Mar. Biol. Res.4, 368–375.
24
Collett R. (1889). Diagnoses De Poissons Nouveaux Provenant Des Campagnes De "L'Hirondelle." III.– Description D'une Espèce Nouvelle Du Genre Hoplostethus. Bull. Soc Zool. Fr.14, 306.
25
Collett R. (1896). Poissons Provenant Des Campagnes Du Yacht "L'Hirondelle" (1885-1888). Résultats Des Campagnes Scientifiques Accomplies Sur Son Yacht Par Albert I, Prince Souverain De Monaco. Résultats Des Campagnes Scientifiques Du Prince De Monaco. Fasc. 10: i–viii + 1-198, Pls. 1-6.
26
Collett R. (1904). Diagnoses of Four Hitherto Undescribed Fishes From the Depths South of the Faroe Islands. Forh. Vidensk.-Selsk. Kristiania.9, 1–7.
27
Conte M. H. Weber J. C. Ralph N. (1998). Episodic Particle flux in the Deep Sargasso Sea:an Organic Geochemical Assessment. Deep-Sea. Res. I.45, 1819–1841. doi: 10.1016/S0967-0637(98)00046-6
28
Craig J. Jamieson A. J. Bagley P. M. Priede I. G. (2011). Naturally Occurring Bioluminescence on the Deep-Sea Floor. J. Mar. Syst.88 (4), 563–567. doi: 10.1016/j.jmarsys.2011.07.006
29
Croizat L. Nelson G. Rosen D. E. (1974). Centers of Origin and Related Concepts. Syst. Zool.23, 265–287. doi: 10.2307/2412139
30
Dale A. C. Inall M. E. (2015). Tidal Mixing Processes Amid Small-Scale, Deep-Ocean Topography. Geophys. Res. Lett.42, 484–491. doi: 10.1002/2014GL062755
31
Danovaro R. Snelgrove P. V. R. Tyler P. (2014). Challenging the Paradigms of Deep-Sea Ecology. Trends Ecol. Evol.29, 464–475. doi: 10.1016/j.tree.2014.06.002
32
de Brito Capello F. (1868). Descripção De Dois Peixes Novos Provenientes Dos Mares De Portugal. Jornal do Sciências Mathemáticas Phys. e Naturaes Lisboa1 (4), 314–317, Pl. 5.
33
De Filippi F. Verany J. B. (1857). Sopra Alcuni Pesci Nuovi O Poco Noti Del Mediterraneo. Memorie Accad. Sci. Torino (Ser. 2)18, 187–199.
34
Deuser W. G. Muller-Karger F. E. Evans R. H. Brown O. B. Esaias W. E. Feldman G. C. (1990). Surface-Ocean Color and Deep-Ocean Carbon Flux: How Close a Connection? Deep-Sea. Res.37, 1331–1343. doi: 10.1016/0198-0149(90)90046-X
35
Dinter W. P. (2001). Biogeography of the OSPAR Maritime Area (Bonn: Federal Agency for Nature Conservation), 167 p.
36
Dullo W. Flogell S. Ruggerberg A. (2008). Cold-Water Coral Growth in Relation to the Hydrography of the Celtic and Nordic European Continental Margin. Mar. Ecol. Prog. Ser.371, 165–176. doi: 10.3354/meps07623
37
Felley J. D. Vecchione M. Wilson R. R. (2008). Small-Scale Distribution of Deep-Sea Demersal Nekton and Other Megafauna in the Charlie-Gibbs Fracture Zone of the Mid-Atlantic Ridge. Deep-Sea. Res.Pt.II55, 153–160. doi: 10.1016/j.dsr2.2007.09.021
38
Fock H. Matthiessen B. Zidowitz H. von Westernhagen H. (2002). Diel and Habitat- Dependent Resource Utilisation by Deep Sea Fishes at the Great Meteor Seamount: Niche Overlap and Support for the Sound Scattering Layer Interception Hypothesis. Mar. Ecol.-Prog. Ser.244, 219–233. doi: 10.3354/meps244219
39
Forster G. R. (1967). A New Deep-Sea Ray From the Bay of Biscay. J. Mar. Biol. Assoc. U.K.47 (2), 281–286.
40
Froese R. Pauly D. (Eds.) (2021). FishBase (World Wide Web electronic publication). Available at: www.fishbase.org. version (08/2021).
41
Gage J. D. Tyler P. (1991). Deep-Sea Biology: A Natural History of Organisms at the Deep-Sea Floor (Cambridge, England: Cambridge University Press).
42
Garman S. (1906). New Plagiostomia. Bull. Mus. Comp. Zool.46 (11), 203–208.
43
Garrick J. A. F. (1961). Studies on New Zealand Elasmobranchii. Part XIII–A New Species of Raja From 1,300 Fathoms. Trans. R. Soc New Z.88 (4), 743–748.
44
Gebruk A. V. (2008). Holothurians (Holothuroidea, Echinodermata) of the Northern Mid-Atlantic Ridge Collected by the G.O.Sars MAR-ECO Expedition With Descriptions of Four New Species. Mar. Biol. Res.4, 48–60. doi: 10.1080/17451000701842898
45
Gebruk A. Budaeva N. E. King N. (2010). Bathyal Benthic Fauna of the Mid-Atlantic Ridge Between the Azores and the Reykjanes Ridge. J. Mar. Biol. Assoc. UK.90, 1–14. doi: 10.1017/S0025315409991111
46
Gebruk A. V. Krylova E. M. (2013). Megafauna of the Charlie–Gibbs Fracture Zone (Northern Mid-Atlantic Ridge) Based on Video Observations. J. Mar. Biol. Assoc. UK.93 (5), 1143–1150. doi: 10.1017/S0025315412001890
47
Gebruk A. V. Priede I. G. Fenchel T. Uiblein F. (2013). Benthos of the Sub-Polar Front Area on the Mid- Atlantic Ridge: Results of the ECOMAR Project. Mar. Biol. Res.9, 443–446. doi: 10.1080/17451000.2012.749999
48
Genin A. (2004). Bio-Physical Coupling in the Formation of Zooplankton and Fish Aggregations Over Abrupt Topographies. J. Mar. Syst.50, 3– 20. doi: 10.1016/j.jmarsys.2003.10.008
49
Genin A. Greene C. Haury L. Wiebe P. Gal G. Kaartvedt S. et al . (1994). Zooplankton Patch Dynamics: Daily Gap Formation Over Abrupt Topography. Deep-Sea. Res. Pt. I.41, 941–951. doi: 10.1016/0967-0637(94)90085-X
50
Giglioli E. H. (1880). On Haloporphyrus Lepidion (Risso). Nat. (London)21 (531), 202.
51
Giglioli E. H. (1893). Di Una Nuova Specie Di Macruride Appartenente Alla Fauna Abissale Del Mediterraneo. Zool. Anz.16 (428), 343–345.
52
Gilbert C. H. (1890). A Preliminary Report on the Fishes Collected by the Steamer Albatross on the Pacific Coast of North America During the Year 1889, With Descriptions of Twelve New Genera and Ninety-Two New Species. Proc. U. S. Natl. Mus.13 (797), 49–126.
53
Gilbert C. H. (1891). Descriptions of Apodal Fishes From the Tropical Pacific. In: Scientific Results of Explorations by the U. S. Fish Commission Steamer Albatross. Proc. U. S. Natl. Mus.14 (856), 347–352.
54
Gilbert C. H. Hubbs C. L. (1916). Report on the Japanese Macrouroid Fishes Collected by the United States Fisheries Steamer "Albatross" in 1906, With a Synopsis of the Genera. Proc. U. S. Natl. Mus51 (2149), 135–214.
55
Gilchrist J. D. F. (1922). Deep-Sea Fishes Procured by the S.S. "Pickle" (Part I). Report Fisheries and Marine Biological Survey, Union of South Africa, 2. 41–79.
56
Gill T. N. (1883). Diagnosis of New Genera and Species of Deep-Sea Fish-Like Vertebrates. Proc. U. S. Natl. Mus.6 (380), 253–260.
57
Gill T. N. (1884). Three New Families of Fishes Added to the Deep-Sea Fauna in a Year. Am. Nat.18 (4), 433.
58
Goode G. B. Bean T. H. (1883). Reports on the Results of Dredging Under the Supervision of Alexander Agassiz, on the East Coast of the United States, During the Summer of 1880, by the U. S. Coast Survey Steamer "Blake," Commander J. R. Bartlett, U. S. N., Commanding. Bull. Mus. Comp. Zool.10 (5), 183–226.
59
Goode G. B. Bean T. H. (1885). Descriptions of New Fishes Obtained by the United States Fish Commission Mainly From Deep Water Off the Atlantic and Gulf Coasts. Proc. U. S. Natl. Mus.8 (543), 589–605.
60
Goode G. B. Bean T. H. (1886). Reports on the Results of Dredging ... In the Gulf of Mexico (1877-78) and in the Caribbean Se-80), by the U.S. Coast Survey Steamer "Blake," ... XXVIII.–Description of Thirteen Species and Two Genera of Fishes From the "Blake" Collection. Bull. Mus. Comp. Zool.12 ( 5), 153–170.
61
Goode G. B. Bean T. H. (1896). Oceanic Ichthyology, a Treatise on the Deep-Sea and Pelagic Fishes of the World, Based Chiefly Upon the Collections Made by the Steamers Blake, Albatross, and Fish Hawk in the Northwestern Atlantic, With an Atlas Containing 417 Figures. Special Bulletin U. S. National Museum No. 2: Text: I-Xxxv + 1-26 + 1-553, Atlas: I-Xxiii, 1-26, 123 Pls.
62
Gunnerus J. E. (1765). Efterretning Om Berglaxen, En Rar Norsk Fisk, Som Kunde Kaldes: Coryphaenoides Rupestris. Der Trondhiemske Selskabs Skrifter, 3, 50–58.
63
Günther A. (1862). Catalogue of the Fishes in the British Museum. Catalogue of the Acanthopterygii, Pharyngognathi and Anacanthini in the Collection of the British Museumv. 4 (London: British Museum), i–xxi + 1-534.
64
Günther A. (1877). Preliminary Notes on New Fishes Collected in Japan During the Expedition of H. M. S. `Challenger.'Ann. Mag. Nat. Hist. (Series 4) 20 (119), 433–446.
65
Günther A. (1878). Preliminary Notices of Deep-Sea Fishes Collected During the Voyage of H. M. S. `Challenger'. Ann. Mag. Nat. Hist. (Series 5)2, 17–28.
66
Günther A. (1887). Report on the Deep-Sea Fishes Collected by H. M. S. Challenger During the Years 1873-76. Report on the Scientific Results of the Voyage of Voyage H. M. S. Challenger22 (pt 57), i–lxv + 1-268, Pls. 1-66.
67
Haedrich R. L. Merrett N. R. (1988). Summary Atlas of Deep-Living Fishes in the North Atlantic. J. Nat. Hist.22, 1325–1362. doi: 10.1080/00222938800770811
68
Hardy G. S. Stehmann M. F. W. (1990). A New Deep-Water Ghost Shark, Hydrolagus pallidus N. Sp. (Holocephali, Chimaeridae), From the Eastern North Atlantic, and Redescription of Hydrolagus Affinis (De Brito Capello, 1867). Archiv für Fischereiwissenschaft40 (3), 229–248.
69
Hector J. (1875). Descriptions of Five New Species of Fishes Obtained in the New-Zealand Seas by H. M. S -"Challenger" Expedition, July 1874. Ann. Mag. Nat. Hist. (Series 4)15 (85), 78–82.
70
Holt E. W. L. Byrne L. W. (1908). New Deep-Sea Fishes From the South-West Coast of Ireland. Ann. Mag. Nat. Hist. (Series8) 1 (1), 86–95.
71
ICES . (2020). ICES/NAFO Joint Working Group on Deep-Water Ecology (WGDEC). ICES. Sci. Rep.2:62, 171. doi: 10.17895/ices.pub.6095
72
Johnson J. Y. (1862). Descriptions of Some New Genera and Species of Fishes Obtained at Madeira. Proc. Zool. Soc. Lond.1862 (pt 2), 167–180.
73
Jones D. O. B. Alt C. H. S. Priede I. G. Reid W. D. K. Wigham B. D. Billett D. S. M. et al . (2013). Deep-Sea Surface-Dwelling Enteropneusts From the Mid-Atlantic Ridge: Their Ecology, Distribution and Mode of Life. Deep-Sea. Res.Pt.II98B, 374–387. doi: 10.1016/j.dsr2.2013.05.009
74
Karrer C. (1972). Die Gattung Harriotta Goode and Bean, 1895(Chrondrichthyes, Chimaeriformes, Rhinochimaeridae). Mit Beschreibung Einer Neuen Art Aus Dem Nordatlantikv. 48 (Mitteilungen aus dem Zoologischen Museum in Berlin), 203–221.
75
King N. Bagley P. M. Priede I. G. (2006). Depth Zonation and Latitudinal Distribution of Deep Sea Scavenging Demersal Fishes of the Mid-Atlantic Ridge, 42°-53°N. Marine. Ecol. Prog. Ser.319, 263–274. doi: 10.3354/MEPS319263
76
Koefoed E. (1927). Fishes From the Sea-Bottom. Scientific Results of the Michael Sars North Atlantic Deep-Sea Expedition 19104(1),1–148.
77
Köhler R. (1896). Résultats Scientifiques De La Campagne Du "Caudan" Dans Le Golfe De Gascogne – Aout-Septembre. 1895 – Poissons. Ann. Univ. Lyon26,475–526.
78
Krefft G. (1980). A New Species of Holtbyrnia Parr (Searsiidae, Salmoniformes) From the Northern Atlantic Ocean. Archiv für Fischereiwissenschaft31 (2), 53–62.
79
Krøyer H. N. (1845). Preliminary Report. Overs. Kongel. Danske Vidensk. Selsk. Forh. Medlemmers Arbeider (Kjøbenhavn), 1844(8), 139–141.
80
Lacepède B. G. E. (1801). Histoire Naturelle Des Poissonsv. 3 (Plassan, Paris), i–lxvi + 1-558, Pls. 1-34.
81
Lampitt R. S. Antia A. N. (1997). Particle Flux in Deep Seas: Regional Characteristics and Temporal Variability. Deep-Sea. Res. Pt. I.44, 1377–1403. doi: 10.1016/S0967-0637(97)00020-4
82
Leduc D. Rowden A. A. Bowden D. A. Probert P. K. Pilditch C. A. Nodder S. D. (2012). Unimodal Relationship Between Biomass and Species Richness of Deep-Sea Nematodes: Implications for the Link Between Productivity and Diversity. Mar. Ecol.-Prog. Ser.454, 53. doi: 10.3354/meps09609
83
Leitner A. B. Neuheimer A. B. Drazen J. C. (2020). Evidence for Long-Term Seamount-Induced Chlorophyll Enhancements. Sci. Rep.10, 12729. doi: 10.1038/s41598-020-69564-0
84
Linley T. D. Alt C. H. S. Jones D. O. B. Priede I. G. (2013). Bathyal Demersal Fishes of the Charlie-Gibbs Fracture Zone Region (49°–54°N) of the Mid-Atlantic Ridge: III. Results From Remotely Operated Vehicle (ROV) Video Transects. Deep-Sea. Res.Pt.II98B, 407–411. doi: 10.1016/j.dsr2.2013.08.013
85
Linnaeus C. (1758). Systema Naturae, Ed. X. (Systema Naturae Per Regna Tria Naturae, Secundum Classes, Ordines, Genera, Species, Cum Characteribus, Differentiis, Synonymis, Locis. Tomus I. Editio Decima, Reformata.) Holmiae, v. 1. i–ii + 1-824.
86
Longhurst A. (1998). Ecological Geography of the Sea (San Diego CA: Academic Press).
87
Lorenzoni L. Benitez-Nelson C. R. Thunell R. C. Hollander D. Varela R. Astor Y. et al . (2012). Potential Role of Event-Driven Sediment Transport on Sediment Accumulation in the Cariaco Basin, Venezuela. Mar. Geol.307-310, 105–110. doi: 10.1016/j.margeo.2011.12.009
88
Lowe R. T. (1839). A Supplement to a Synopsis of the Fishes of Madeira. Proc. Zool. Soc. Lond.1839 (pt 7), 76–92.
89
Lütken C. F. (1898). The Ichthyological Results. Danish Ingolf Expedition, II. Copenhagen, 215-254. Pls. 1–Pls. 4.
90
Macdonald A. (2021). Life at High Pressure: In the Deep Sea and Other Environments (Heidelberg: Springer), 470pp, ISBN: ISBN13: 9783030675868.
91
Maldonado M. Young C. M. (1999). Effects of the Duration of Larval Life on Postlarval Stages of the Demosponge Sigmadocia Caerulea. J. Exp. Mar. Biol. Ecol.232, 9 –21. doi: 10.1016/S0022-0981(98)00076-8
92
Matsui T. Rosenblatt R. H. (1979). Two New Searsid Fishes of the Genera Maulisia and Searsia (Pisces: Salmoniformes). Bull. Mar. Sci.29 (1), 62–78.
93
Maul G. E. (1957). Further Additions to the Previously Revised Family Searsidae. Bol. Mus. Munic. Funcha.10, 5–21.
94
Messié M. Petrenko A. Doglioli A. M. Aldebert C. Martinez E. Koenig G. et al . (2020). The Delayed Island Mass Effect: How Islands can Remotely Trigger Blooms in the Oligotrophic Ocean. Geophys. Res. Lett.47, e2019GL085282. doi: 10.1029/2019GL085282
95
Metaxas A. Saunders M. (2009). Quantifying the “Bio-” Components in Biophysical Models of Larval Transport in Marine Benthic Invertebrates: Advances and Pitfalls. Biol. Bull.216, 257–272. doi: 10.1086/BBLv216n3p257
96
Miller K. Gunasekera R. A. (2017). Comparison of Genetic Connectivity in Two Deep Sea Corals to Examine Whether Seamounts are Isolated Islands or Stepping Stones for Dispersal. Sci. Rep.7, 46103. doi: 10.1038/srep46103
97
Miller P. I. Read J. F. Dale A. C. (2013). Thermal Front Variability Along the North Atlantic Current Observed Using Satellite Microwave and Infrared Data. Deep-Sea. Res.Pt.II98, 244–256. doi: 10.1016/j.dsr2.2013.08.014
98
Mironov A. N. (1989). Meridional Asymmetry and Marginal Effect in Distribution of Sea Urchins in Open Ocean Regions. Okeanologiya29 (5), 845–854.
99
Mironov A. N. (1994). Bottom Faunistic Complexes 0f Oceanic Islands and Seamounts. Transactions of the P.P. Shirshov Institute of Oceanology Vol. 129 (In Russian: Trudy Instituta Okeanologii), 7–16. English summary.
100
Mironov A. N. (2006). Centers of Marine Fauna Redistribution. Entomol. Rev.86 (1), S32–S34. doi: 10.1134/S0013873806100034
101
Mironov A. N. (2013). Biotic Complexes of the Arctic Ocean. Invertebrate. Zool.10 (1), 3–48. doi: 10.15298/invertzool.10.1.02
102
Mironov A. N. (2014). “The Influence of Redistribution Biota Centers on the Bottom Fauna in the Central Oceanic Regions,” in The World Ocean.Vol. II.Physics, Chemistry and Biology of the Ocean. Eds. LobkovskyL. I.NigmatulinR. I. (Moscow: Scientific World), 264–280. (In Russian).
103
Mironov A. N. Krylova E. M. (2006). “Origin of the Fauna of the Meteor Seamounts, North-Eastern Atlantic,” in Biogeography of the North Atlantic Seamounts. Eds. MironovA. N.GebrukA. V.SouthwardA. J. S. (Moscow: KMK Sci. Press), 22–57.
104
Mironov A. N. Minin K. V. Dilman A. B. (2015). Abyssal Echinoid and Asteroid Fauna of the North Pacific. Deep-Sea. Res.Pt.II111, 357–375. doi: 10.1016/j.dsr2.2014.08.006
105
Morris K. Tyler P. A. Murton B. Rogers A. D. (2012). Lower Bathyal and Abyssal Distribution of Coral in the Axial Volcanic Ridge of the Mid-Atlantic Ridge at 45°N. Deep-Sea. Res. Pt. I.62, 32–39. doi: 10.1016/j.dsr.2011.11.009
106
Mortensen P. B. Buhl-Mortensen L. Gebruk A. V. Krylova E. M. (2008). Occurrence of Deepwater Corals on the Mid-Atlantic Ridge Based on MAR-ECO Data. Deep-sea. Res.Pt.II55, 142 – 152. doi: 10.1016/j.dsr2.2007.09.018
107
Muller-Karger F. E. Richardson P. L. McGillicuddy D. (1995). On the Offshore Dispersal of the Amazon’s Plume in the North Atlantic. Deep-Sea. Res. Pt. I.42, 2127–2137. doi: 10.1016/0967-0637(95)00085-2
108
Muller-Karger F. E. Varela R. Thunell R. Luerssen R. Hu C. Walsh J. J. (2005). The Importance of Continental Margins in the Global Carbon Cycle, Geophys. Res. Lett.32, L01602. doi: 10.1029/2004GL021346
109
Müller R. D. Roest W. R. (1992). Fracture Zones in the North Atlantic From Combined Geosat and Seasat Data. J. Geophys. Res.97 (B3), 3337–3350. doi: 10.1029/91JB02605
110
Niedzielski T. Høines Å. Shields M. A. Linley T. Priede I. G. (2013). A Multi-Scale Investigation Into Sea Floor Topography of the Northern Mid-Atlantic Ridge Based on Geographic Information System Analysis. Deep-Sea. Res.Pt.II98B, 231–243. doi: 10.1016/j.dsr2.2013.10.006
111
Nybelin O. (1957). Deep-Sea Bottom Fishes. Reports of the Swedish Deep-Sea Expedition 1947-1948, v. 2 (Zool.) (fasc. 3) (art. 20), 247–345, Pls. 1-7.
112
OBIS . (2022). Ocean Biodiversity Information System (Intergovernmental Oceanographic Commission of UNESCO). Available at: www.obis.org (Accessed January 11, 2022).
113
Ocean Productivity (2022). Available at: http://sites.science.oregonstate.edu/ocean.productivity/ (Accessed January 11, 2022).
114
Oliveira A. P. Coutinho T. P. Cabeçadas G. Brogueira M. J. Coca J. Ramos M. et al . (2016). Primary Production Enhancement in a Shallow Seamount (Gorringe — Northeast Atlantic). J. Mar. Syst.164, 13–29. doi: 10.1016/j.jmarsys.2016.07.012
115
Pace M. Knauer G. Karl D. Martin J. (1987). Primary Production, New Production and Vertical Flux in the Eastern Pacific Ocean. Nature325, 803– 804. doi: 10.1038/325803a0
116
Parr A. E. (1928). Deepsea Fishes of the Order Iniomi From the Waters Around the Bahama and Bermuda Islands. With Annotated Keys to the Sudididae, Myctophidae, Scopelarchidae, Evermannellidae, Omosudidae, Cetomimidae and Rondeletidae of the World. (Scientific Results of the Third Oceanographic Expedition of the "Pawnee" 1927.) Vol. 3 (Bulletin of the Bingham Oceanographic Collection Yale University), 1–193.
117
Parr A. E. (1937). Concluding Report on Fishes. With Species Index for Articles 1-7 (Fishes of the Third Oceanographic Expedition of the “Pawnee”) Vol. 3 (Bulletin of the Bingham Oceanographic Collection Yale University), 1–79.
118
Parr A. E. (1951). Preliminary Revision of the Alepocephalidae, With the Introduction of a New Family, Searsidae. Am. Mus. Novit.1531, 1–21.
119
Parra H. E. Pham C. K. Menezes G. M. Rosa A. Tempera F. Morato T. (2017). Predictive Modeling of Deep-Sea Fish Distribution in the Azores. Deep-Sea. Res. II.145, 49–60. doi: 10.1016/j.dsr2.2016.01.004
120
Perez J. A. A. Gavazzoni L. de Souza L. H. P. Sumida P. Y. G. Kitazato H. (2020). Deep-Sea Habitats and Megafauna on the Slopes of the São Paulo Ridge, SW Atlantic. Front. Mar. Sci.7. doi: 10.3389/fmars.2020.572166
121
Pollard R. Sanders R. Lucas M. Statham P. (2007). The Crozet Natural Iron Bloom and Export Experiment (CROZEX). Deep-Sea. Res.Pt.II54, 1905–1914. doi: 10.1016/j.dsr2.2007.07.023
122
Porteiro F. M. Sutton T. T. Byrkjedal I. Orlov A. M. Heino M. Menezes G. and Bergstad O. A. (2017). Fishes of the Northern Mid-Atlantic Ridge Collected During the MAR-ECO Cruise in June-July 2004: An Annotated Checklist. Arquipelago Life Marine. Sci.Supplement 10, iii +125.
123
Priede I. G. Bergstad O. A. Miller P. I. Vecchione M. Gebruk A. Falkenhaug T. et al . (2013a). Does Presence of a Mid Ocean Ridge Enhance Biomass and Biodiversity? PloS One8 (5), e61550. doi: 10.1371/journal.pone.0061550
124
Priede I. G. Billett D. S. M. Brierley A. S. Hoelzel A. R. Inall M. Miller P. I. et al . (2013b). The Ecosystem of the Mid-Atlantic Ridge at the Sub-Polar Front and Charlie Gibbs Fracture Zone; ECO-MAR Project Strategy and Description of the Sampling Program 2007–2010. Deep-Sea. Res.Pt.II98B, 220–230. doi: 10.1016/j.dsr2.2013.06.012
125
Priede I. G. Froese R. Bailey D. M. Bergstad O. A. Collins M. A. Dyb J. E. et al . (2006). The Absence of Sharks From Abyssal Regions of the World’s Oceans. Proc. R. Soc B.273, 1435–1441. doi: 10.1098/rspb.2005.3461
126
Priede I. G. Godbold J. A. King N. J. Collins M. A. Bailey D. M. Gordon J. D. M. (2010). Deep-Sea Demersal Fish Species Richness in the Porcupine Seabight, NE Atlantic Ocean: Global and Regional Patterns. Mar. Ecol.31, 247–260. doi: 10.1111/j.1439-0485.2009.00330.x
127
Rakka M. Godinho A. Orejas C. Carreiro-Silva M. (2021). Embryo and Larval Biology of the Deep-Sea Octocoral Dentomuricea Aff. Meteor Under Different Temperature Regimes. PeerJ9, e11604. doi: 10.7717/peerj.11604
128
Read J. F. Pollard R. T. Miller P. I. Dale A. C. (2010). Circulation and Variability of the North Atlantic Current in the Vicinity of the Mid-Atlantic Ridge. Deep-Sea. Res. Pt. I.57, 307–318. doi: 10.1016/j.dsr.2009.11.010
129
Restreppo G. A. Wood W. T. Phrampus B. J. (2020). Oceanic Sediment Accumulation Rates Predicted via Machine Learning Algorithm: Towards Sediment Characterization on a Global Scale. Geo-Mar. Lett.40, 755–763. doi: 10.1007/s00367-020-00669-1
130
Rex M. A. (1981). Community Structure in the Deep-Sea Benthos. Annu. Rev. Ecol. Evol. Syst.12, 331–353. doi: 10.1146/annurev.es.12.110181.001555
131
Rex M. A. Etter R. (2010). Deep-Sea Biodiversity: Pattern and Scale (Cambridge MA: Harvard University Press), 354.
132
Riehl T. Wölfl A.-C. Augustin N. Devey C. W. Brandt A. (2020). Discovery of Widely Available Abyssal Rock Patches Reveals Overlooked Habitat Type and Prompts Rethinking Deep-Sea Biodiversity. Proc. Natl. Acad. Sci. U. S. A117 (27), 15450–15459. doi: 10.1073/pnas.1920706117
133
Risso A. (1810). Ichthyologie De Nice, Ou Histoire Naturelle Des Poissons Du Département Des Alpes Maritimes (Paris: F. Schoell), i–xxxvi + 1-388, Pls. 1-11.
134
Risso A. (1840). Observations Sur Quelques Poissons De La Mer De Nice. Archiv für Naturgeschichte6 (pt. 1), 376–393, Pl. 10.
135
Roule L. (1916). Notice Préliminaire Sur Quelques Espèces Nouvelles Ou Rares Des Poissons Provenant Des Croisières De S. A. S. Le Prince De Monaco. Bull. Inst. océanogr. (Monaco)320, 1–32.
136
Rogacheva A. Gebruk A. Alt C. H. S. (2013). Holothuroidea of the Charlie Gibbs Fracture Zone Area, Northern Mid-Atlantic Ridge. Mar. Biol. Res.9 (5-6), 587–623. doi: 10.1080/17451000.2012.750428
137
Rowe G. T. Menzies R. J. (1969). Zonation of Large Benthic Invertebrates in the Deep-Sea Off the Carolinas. Deep-Sea. Res.16, 531–537. doi: 10.1016/0011-7471(69)90041-2
138
Sazonov Y. Golovan G. A. (1976). New Species of Fishes of the Family Searsiidae (Salmoniformes, Alepocephaloidei) From the Eastern Atlantic Ocean. Tr. Inst. Okeanol. im. P. P. Shirshova Akad. Nauk SSSR104, 7–12.
139
Sazonov Y. Shcherbachev Y. (1982). A Preliminary Review of Grenadiers Related to the Genus Cetonurus Günther (Gadiformes, Macrouridae). Description of New Taxa Related to the Genera Cetonurus Günther and Kumba Marshall. Voprosy Ikhtiologii22 (5), 707–721.
140
Searle R. (2013). Mid-Ocean Ridges (Cambridge, England: Cambridge University Press). 978-1-107-01752-8.
141
Shanks A. L. (2009). Pelagic Larval Duration and Dispersal Distance Revisited. Biol. Bull.216 (3), 373–385. doi: 10.1086/BBLv216n3p373
142
Smith C. R. Berelson W. DeMaster D. J. Dobbs F. C. Hammond D. Hoover D. J. et al . (1997). Latitudinal Variations in Benthic Processes in the Abyssal Equatorial Pacific: Control by Biogenic Particle Flux. Deep-Sea. Res.Pt.II44, 2295–2317. doi: 10.1016/S0967-0645(97)00022-2
143
Smith K. Ruhl H. A. Bett B. J. Billett D. S. M. Lampitt R. S. Kaufmann R. S. (2009). Climate, Carbon Cycling, and Deep-Ocean Ecosystems. Proc. Natl. Acad. Sci. U.S.A106, 19211–19218. doi: 10.1073/pnas.0908322106
144
Sokolova M. N. (2000). Feeding and Trophic Structure of the Deep-Sea Macrobenthos (Washington D.C: Smithsonian Institution Libraries).
145
Spalding M. D. Agostini V. A. Rice J. Grant S. M. (2012). Pelagic Provinces of the World: A Biogeographic Classification of the World’s Surface Pelagic Waters. Ocean. Coast. Manage.60, 19–30. doi: 10.1016/j.ocecoaman.2011.12.016
146
Springer S. (1979). A Revision of the Catsharks, Family Scyliorhinidae. NOAA (National Oceanic and Atmospheric Administration) Technical Report NMFS (National Marine Fisheries Service) Circular, 422, 1–152.
147
Stehmann M. F. W. (1978). Raja "Bathyphila", Eine Doppelart Des Subgenus Rajella: Wiederbeschreibung Von R. Bathyphila Holt & Byrne, 1908Und Raja Bigelowi Spec. Nov. (Pisces, Rajiformes, Rajidae). Archiv für Fischereiwissenschaft29 (1/2), 23–58.
148
Straume E. O. Gaina C. Medvedev S. Hochmuth K. Gohl K. Whittaker J. M. et al . (2019). GlobSed: Updated Total Sediment Thickness in the World’s Oceans. Geochem. Geophys. Geosystems.20, 1756–1772. doi: 10.1029/2018GC008115
149
Sulak K. J. (1975). Biological Results of the University of Miami Deep-Sea Expeditions. 111. Talismania Mekistonema, a New Atlantic Species of the Family Alepocephalidae (Pisces: Salmoniformes). Bull. Mar. Sci.25 (1), 88–93.
150
Sun Z. Hamel J. F. Mercier A. (2010). Planulation Periodicity, Settlement Preferences and Growth of Two Deep-Sea Octocorals From the Northwest Atlantic. Mar. Ecol.-Prog. Ser.410, 71–87. doi: 10.3354/meps08637
151
Svetovidov A. N. (1936). Lepidion Schmidti, Eine Neue Fischart. Zool. Anz.113, 266–269.
152
Thunell R. C. Benitez-Nelson C. R. Varela R. Astor Y. Muller-Karger F. E. (2007). Particulate Organic Carbon Fluxes Along Upwelling-Dominated Continental Margins: Rates and Mechanisms. Global Biogeochem. Cycles.21, GB1022. doi: 10.1029/2006GB002793
153
Tilstone G. H. Miller P. I. Brewin R. J. W. Priede I. G. (2014). Enhancement of Primary Production in the North Atlantic Outside of the Spring Bloom, Identified by Remote Sensing of Ocean Colour and Temperature. Remote Sens. Environ.148, 77–86. doi: 10.1016/j.rse.2013.04.021
154
Treberg J. R. Speers-Roesch B. (2016). Does the Physiology of Chondrichthyan Fishes Constrain Their Distribution in the Deep Sea? J. Exp. Biol.219, 615–625. doi: 10.1242/jeb.128108
155
UNESCO (2009). Global Open Oceans and Deep-Sea Bed (GOODS)—Biogeographic Classification (Paris: UNESCO-IOC (IOC Technical Series, 84).
156
Vaillant L. L. (1888). Expéditions Scientifiques Du "Travailleur" Et Du "Talisman" Pendant Les Années 1880, 1881, 1882, 1883 Poissons. Paris. 1-406, Pls. 1–28.
157
Valenciennes A. (1838). “Ichthyologie Des Îles Canaries, Ou Histoire Naturelle Des Poissons Rapportés Par Webb & Berthelot,” in Histoire Naturelle Des Îles Canaries, vol. 2. Eds. WebbP. B.BerthelotS. (Paris), 1835–1850.
158
Van Dover C. L. (2000). The Ecology of Deep-Sea Hydrothermal Vents (Princeton New Jersey USA: Princeton University Press), 424pp.
159
Vecchione M. Bergstad O. A. Byrkjedal I. Falkenhaug T. Gebruk A. V. Godø O. R. et al . (2010). “Biodiversity Patterns and Processes on the Mid-Atlantic Ridge,” in Life in the World’s Oceans: Diversity, Distribution, and Abundance. Ed. McIntyreA. D. (Oxford: Blackwell), 103–121.
160
Vic C. Gula J. Roullet G. Pradillon F. (2018). Dispersion of Deep-Sea Hydrothermal Vent Effluents and Larvae by Submesoscale and Tidal Currents. Deep-Sea. Res. Pt. I.133, 1–18. doi: 10.1016/j.dsr.2018.01.001
161
Washburn T. W. Turner P. J. Durden J. M. Jones D. O. B. Weaver P. Van Dover C. L. (2019). Ecological Risk Assessment for Deep-Sea Mining. Ocean. Coast. Manag.176, 24–39. doi: 10.1016/j.ocecoaman.2019.04.014
162
Watling L. Guinotte J. Clark M. R. Smith C. R. (2013). A Proposed Biogeography of the Deep Ocean Floor. Prog. Oceanogr.111, 91–112. doi: 10.1016/j.pocean.2012.11.003
163
Watling L. Lapointe A. (2022). Global Biogeography of the Lower Bathyal (700–3000 M) as Determined From the Distributions of Cnidarian Anthozoans. Deep-Sea. Res. Part I. 181, 103703. doi: 10.1016/j.dsr.2022.103703
164
Wenneck T. Falkenhaug T. Bergstad O. A. (2008). Strategies, Methods, and Technologies Adopted on the R.V. G.O. Sars MAR-ECO Expedition to the Mid-Atlantic Ridge in 2004. Deep-Sea. Res. II.55, 6–28. doi: 10.1016/j.dsr2.2007.09.017
165
White M. Bashmachnikov I. Aristegui J. Martins A. M. (2008). “Physical Processes and Seamount Productivity,” in Seamounts: Ecology, Fisheries and Conservation. Ed. PitcherT. J.MoratoT.HartP. J. B.ClarkM. R.HagganN.SantosR. S. (Oxford: Blackwell), 65–84. doi: 10.1002/9780470691953.ch4
166
Young C. M. (2003). “Reproduction, Development and Life-History Traits,” in Ecosystems of the Deep Oceans, Vol. 28. Of Ecosystems of the World. Ed. TylerP. A. (Amsterdam: Elsevier), 381–426.
167
Zeppilli D. Pusceddu A. Trincardi F. Danovaro R. (2016). Seafloor Heterogeneity Influences the Biodiversity–Ecosystem Functioning Relationships in the Deep Sea. Sci. Rep.6, 26352. doi: 10.1038/srep26352
168
Zezina O. N. (1997). Biogeography of the Bathyal Zone. Adv. Mar. Biol.32, 390–428. doi: 10.1016/S0065-2881(08)60020-6
Summary
Keywords
mid-ocean ridge, deep-sea, biodiversity, organic carbon flux, sediment fauna, biogeography, primary production
Citation
Priede IG, Muller-Karger FE, Niedzielski T, Gebruk AV, Jones DOB and Colaço A (2022) Drivers of Biomass and Biodiversity of Non-Chemosynthetic Benthic Fauna of the Mid-Atlantic Ridge in the North Atlantic. Front. Mar. Sci. 9:866654. doi: 10.3389/fmars.2022.866654
Received
31 January 2022
Accepted
01 March 2022
Published
05 April 2022
Volume
9 - 2022
Edited by
Philip Weaver, Seascape Consultants Ltd., United Kingdom
Reviewed by
Teresa Radziejewska, University of Szczecin, Poland; Jose Angel Alvarez Perez, Universidade do Vale do Itajaí, Brazil
Updates
Copyright
© 2022 Priede, Muller-Karger, Niedzielski, Gebruk, Jones and Colaço.
This is an open-access article distributed under the terms of the Creative Commons Attribution License (CC BY). The use, distribution or reproduction in other forums is permitted, provided the original author(s) and the copyright owner(s) are credited and that the original publication in this journal is cited, in accordance with accepted academic practice. No use, distribution or reproduction is permitted which does not comply with these terms.
*Correspondence: Imants G. Priede, i.g.priede@abdn.ac.uk
This article was submitted to Deep-Sea Environments and Ecology, a section of the journal Frontiers in Marine Science
Disclaimer
All claims expressed in this article are solely those of the authors and do not necessarily represent those of their affiliated organizations, or those of the publisher, the editors and the reviewers. Any product that may be evaluated in this article or claim that may be made by its manufacturer is not guaranteed or endorsed by the publisher.