Abstract
Marine biofilms are functional communities that shape habitats by providing a range of structural and functional services integral to coastal ecosystems. Impacts of climate change on biological aspects of such communities are increasingly studied, but impacts on the chemicals that mediate key interactions of biofilm organisms have largely been overlooked. Acyl-homoserine lactones (AHLs), crucial bacterial signals within biofilms, are known to degrade through pH and temperature-dependent hydrolysis. However, the impact of climate change on AHLs and thus on biofilm form and function is presently unknown. This study investigates the impact of changes in pH and temperature on the hydrolysis rate, half-life time and quantitative abundance of different AHLs on daily and seasonal timescales for current conditions and future climate change scenarios.We established the mathematical relationships between pH, hydrolysis rates/half-life times and temperature, which revealed that natural daily pH-driven changes within biofilms cause the greatest fluctuations in AHL concentration (up to 9-fold). Season-dependant temperature enhanced or reduced the observed daily dynamics, leading to higher winter and lower summer concentrations and caused a shift in timing of the highest and lowest AHL concentration by up to two hours. Simulated future conditions based on climate change projections caused an overall reduction of AHL degradation and led to higher AHL concentrations persisting for longer across both the daily and seasonal cycles.This study provides valuable quantitative insights into the theoretical natural dynamics of AHL concentrations. We highlight critical knowledge gaps on the scale of abiotic daily and seasonal fluctuations affecting estuarine and coastal biofilms and on the biofilms’ buffering capacity. Detailed experimental studies of daily and seasonal dynamics of AHL concentrations and assessment of the potential implications for a suite of more complex interactions are required. Substantial fluctuations like those we show in this study, particularly with regards to concentration and timing, will likely have far reaching implications for fundamental ecosystem processes and important ecosystem services such as larval settlement and coastal sediment stabilisation.
1 Introduction
Climate change caused by anthropogenic carbon dioxide (CO2) emissions is predicted to significantly change the physical and chemical parameters of our waterbodies across Earth. Assuming a business-as-usual scenario (RCP8.5), ocean surface pH is predicted to drop by 0.4 pH units until the end of this century, a process called ocean acidification (IPCC, 2019). In the same timeframe, sea surface temperature is predicted to rise by more than 4°C (IPCC, 2019). While the range of change is within conditions previously experienced on Earth, the rate of change is unprecedented, with severe impacts on the form and function of the environment and organisms becoming apparent.
One recently discovered effect of ocean acidification on the biospehere is that it can severely affect the molecular properties of chemical signals that mediate the interactions of marine organisms and their daily life (Roggatz et al., 2016). An average change of 0.4 pH units was found to render peptides involved in crab brood-care non-functional (Roggatz et al., 2016) and impair hermit crabs in their ability to locate food effectively, likely due to the same reason (Roggatz et al., 2019). Fishes such as sea bass and sea bream also show significant reduction in their ability to receive chemical signals in reduced pH conditions (Porteus et al., 2018; Velez et al., 2019). When a chemical signal is transported from the source or sender to the receiving organisms, it is subject to the environmental conditions within which it is transported and will therefore inevitably be affected by the surroundings. Climate driven changes to these surroundings will thus likely have a suite of poorly understood impacts on signals used for chemical communications between organisms.
Biofilms are ubiquitously distributed worldwide within estuarine and coastal settings, providing a range of structural and functional services that are integral to coastal ecosystems and morphological stability (Decho, 2000; Anderson, 2016). N-acyl-homoserine lactones (AHLs) are key signalling molecules used by bacteria in cell-cell communication and play a crucial role in biofilm formation and the production of extracellular polymeric substances (EPS) (Dobretsov et al., 2009). The importance of these signals in marine, estuarine and coastal microbial mats and biofilms, however, only came into focus in the past 20 years. In 2002, the production of AHLs within Roseobacter and Marinobacter strains isolated from marine snow was reported for the first time (Gram et al., 2002). Since then a variety of AHL producing microorganisms, mainly gram-negative bacteria, have been isolated from marine biofilms [for overviews see Lami (2019); Antunes et al. (2019)]. Due to the very low concentration of AHLs in environmental samples, only few studies managed to identify and quantify these compounds directly. Decho et al. (2009) extracted, identified and quantified nine different AHLs from stromatolite microbial mats, of which C6-, C8- and C10-HSL were particularly abundant. Tait et al. (2009) were able to extract AHLs from rock-pool pebble-biofilms averaging a concentration of approximately 600 pmol cm-2 and found C8- and C10-HSL to dominate. More recently, AHLs were also quantified in intertidal marine sediments with C8-, C10- and C12-HSL dominating the profile (Stock et al., 2021). Besides their presence in marine bacterial biofilms, where AHLs mediate the bacteria-bacteria interactions via quorum sensing, it was shown that AHLs are further involved in a number of cross-kingdom interactions (Williams, 2007). C10-HSL, its 3-oxo and 3-OH forms, have been found to mediate interactions between benthic diatoms and bacteria (Yang et al., 2016a) while a range of AHLs from C6-HSL to C14-HSL and their hydroxyl- and oxo-forms were found to act as attractants for larvae of macro algae (Tait et al., 2005; Joint et al., 2007) and biofouling or bioturbating fauna (Tait and Havenhand, 2013) (see Figure 1A for an overview of AHL-mediated interactions).
Figure 1
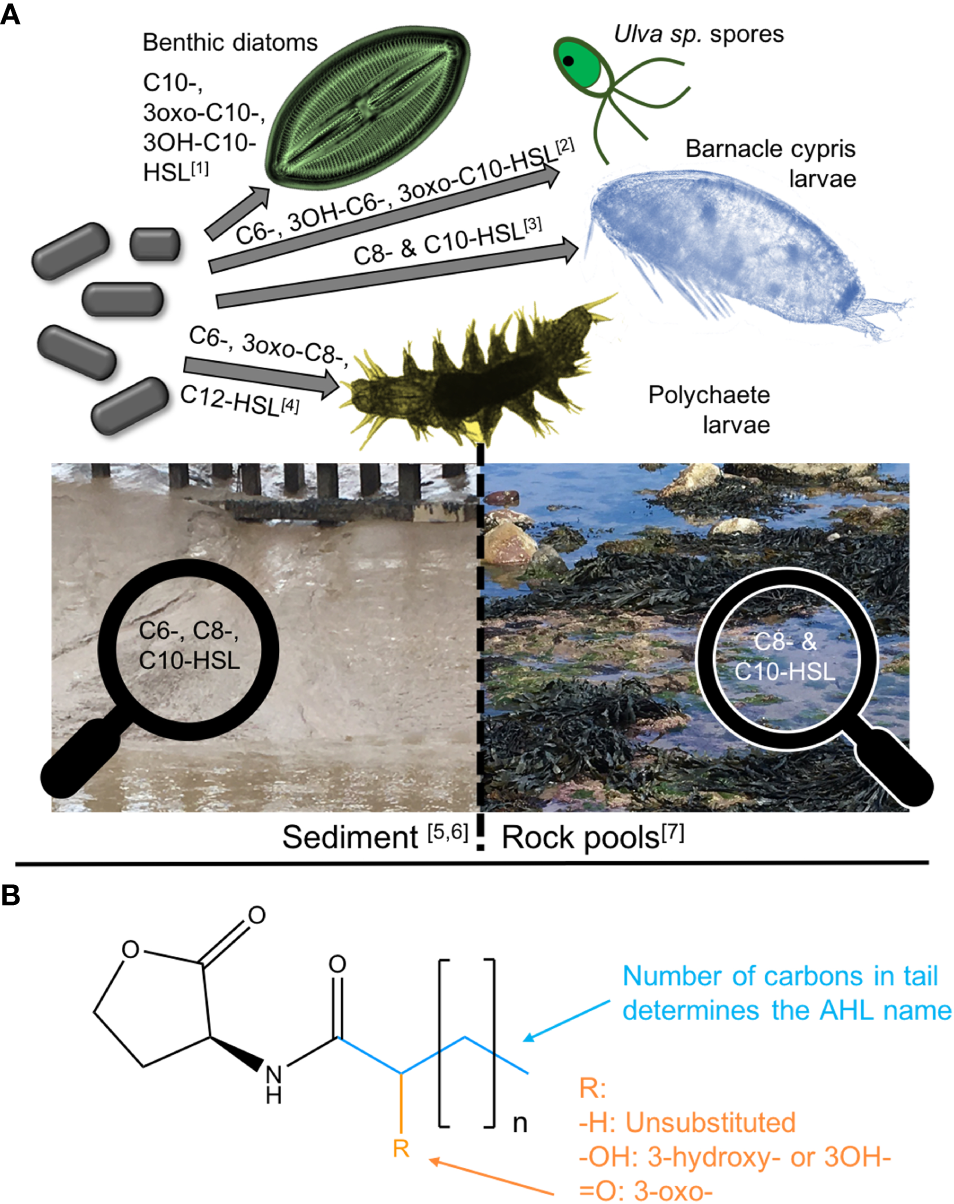
Overview of AHL-mediated interactions, their presence in different environments and their basic chemical structure.(A) gives an overview of bacterial AHLs that are known to mediate interactions with selected algae and invertebrates, and indicates important AHLs for different marine habitats.(B) shows the basic structure of AHLs and explains the nomenclature with the number of carbons in the blue tail giving the name and the substitution at R in orange determining the AHL class. References: [1] Yang et al. (2016a), [2] Joint et al. (2007), [3] Tait and Havenhand (2013), [4] Huang et al. (2007), [5] Decho et al. (2009), [6] Stock et al. (2021) and [7] Tait et al. (2009). Barnacle larvae picture by Kent Berntsson taken from Larsson et al. (2016) and polychaete larvae picture taken from Wang et al (2020).
All N-acyl-homoserine lactones follow a common structure consisting of a homoserine lactone ring, which is N-acylated with a fatty acyl group at the α-position (Chhabra et al., 2005). The fatty acid group can be of variable acyl chain lengths (usually 4 to 18 carbons), saturation levels and oxidation states, belonging to either the N-acyl, N-(3-oxoacyl) or N-(3- hydroxyacyl) class (Chhabra et al., 2005) (see Figure 1B). In this study, names of AHLs are abbreviated in the common way by using Cx or Cx-HSL (interchangeably) with x = number of carbons. Importantly, this structure makes AHLs susceptible to change with pH. In fact, only AHLs with chain lengths of C ≥ 4 persist long enough to convey a signal (Yates et al., 2002; Hmelo and Van Mooy, 2009). The pH-dependent, base-catalysed hydrolysis of the lactone ring transforms the AHL into the corresponding N-acylhomoserine, which no longer functions as a chemical signal (Yates et al., 2002; Joint, 2002). This reaction is further accelerated by increasing temperatures (Yates et al., 2002). AHLs are therefore assumed to be short-lived signalling cues, especially those with short side chains of six carbons or less, which degrade quickly in marine environments with pH > 7 (Hmelo, 2017). Degradation of AHLs in seawater was established experimentally by Tait et al. (2005) and Hmelo and Van Mooy (2009) for AHLs with a range of chain lengths and substitutions. Decho et al. (2009) went one step further and measured the pH profile within microbial mats under natural conditions and then experimentally quantified the half-life time of some AHLs in different pH conditions during laboratory studies. They established a significant degradation of the shorter chain AHLs in the laboratory and in the natural microbial mat during daytime in the field, and subsequently linked their observations to the significant daily pH fluctuations they observed within the biofilm. However, despite numerous publications highlighting and studying the influence of environmental physical parameters on AHL signalling in general, the impact of naturally fluctuating abiotic conditions within and in the surrounding of biofilms remains undetermined, as highlighted by Decho and Gutierrez (2017) as well as Hmelo (2017) in recent reviews. The impacts of seasonal variations, and/or climate change scenarios, have not been addressed to date.
This study therefore investigates the impact of changes in pH and temperature on the quantitative abundance of different AHLs for daily and seasonal conditions in the context of current and future climate change scenarios. First, the mathematical relationships between pH and each specific AHL hydrolysis rate k and half-life time t1/2 as well as the influence of temperature on k and t1/2 are established. Then the change in AHL hydrolysis rate, half-life time and relative concentration is calculated for daily fluctuations within the biofilm, for seasonal variations of conditions and for average ocean conditions based on climate change projections. Finally, the scale of influence through natural fluctuations and changes due to climate change are compared and the implications for interactions mediated through AHLs are discussed in terms of the ecosystem services and stability of coastal and estuarine systems.
2. Materials and Methods
2.1 AHL Hydrolysis Kinetics and pH
The degradation of AHLs due to hydrolysis in water (also called lactonolysis) follows a pseudo first-order reaction. For the neutral and alkaline hydrolysis of interest in the context of this study, the reaction follows a BAC2 mechanism as described by Gómez-Bombarelli et al. (2013). The reaction can be described as
where AHL stands for N-acyl-homoserine lactone and AHS for the corresponding N-acyl homoserine. With the reaction taking place in water, the hydrolysis rate k at any given condition can be calculated as:
following the pseudo-first order as shown by Ziegler et al. (2019). The hydrolysis rate k can further be converted into half-life time t1/2 using
However, the hydrolysis rate and half-life time of AHLs are molecule-specific and further dependent on pH, temperature and the length of their alkyl-chain (Yates et al., 2002).
2.1.1 Dependence of the Hydrolysis Rate k on pH
As can be seen from eqn. (1), the concentration of hydroxide anions ([OH−]) and therefore pH plays a central part in the hydrolysis of AHLs. Limited [OH−] will slow hydrolysis down while higher concentrations or even excess of [OH−] will accelerate the ring-opening reaction. In order to obtain a general mathematical relationship for the dependency of k on pH, we formulate the pH-dependent rate kpH based on eqn. (1) as
The concentration of hydroxide anions is linked to pH through
and
so
Considering in this context [H2O]=10−14 and substituting [H2O] and [OH−] into eqn. (4) yields
which can then be expressed as a linear relationship by multiplying with the negative decadic logarithm
to describe the link between the AHL/AHS ratio and pH.
In order to establish the AHL-specific coefficients for this equation, the data published by Ziegler et al. (2019) has been used, who measured the pH-specific hydrolysis rates of C4, C6, C8, C6-oxo and C8-oxo by 1H NMR spectroscopy in D2O at pH 7.0, 7.9, 9.2 and 9.5 at room temperature (22°C). The rates were plotted as negative decadic logarithm versus the pH in IGOR pro (v6.37) and a linear least-square fit function was obtained. The slope of the fit function represents the coefficient, which can subsequently be used to calculate the AHL-specific kpH at any given pH.The same analysis was performed for data obtained by Decho et al. (2009), who published the half-life time of C6, C8, C10, C12 and C14 at pH 6.18, 7.2, 8.2, 8.7 and 9.55 recorded at 26°C. The t1/2 data was converted into k using eqn. (3) and analysed as described above.
2.1.2 Dependence of the Half-Life Time t1/2 on pH
For the dependence of the AHL-specific half-life time t1/2 on pH, a similar relationship as for the hydrolysis rate can be established by substituting eqn. (3) into eqn. (11).
and rearranging to
Like for kpH, the data sets by Ziegler et al. (2019) and Decho et al. (2009) were used. For consistency, all times were transformed to minutes.
2.2 AHL Hydrolysis Kinetics and Temperature
The impact of temperature on biological and chemical processes is often expressed through a temperature coefficient (mostly for steps of 10°C, hence Q10). It assumes, that the reaction rate (or in this study the hydrolysis rate k) depends exponentially on the temperature T. For a 1°C temperature change, Q1 can be expressed as
where k1 and k2 are the hydrolysis rates at two different temperatures, T1 and T2, respectively. The temperature step of 1°C is represented by the 1 in the exponential fraction.
Based on the investigations of Yates et al. (2002), who report the hydrolysis rates for C4, C6, C8 and C6-oxo at a stable pH and 22 or 37°C, the temperature coefficient per 1°C was calculated using eqn. (15).
2.2.1 Dependence of the Hydrolysis Rate k on T
To account for the impact of temperature on the hydrolysis rate, the rates obtained for C4, C6, C8 and C6-oxo at any given pH were shifted to the desired temperature by multiplication with the coefficient according to the temperature difference. For example, to shift k of C6-HSL obtained at pH 8.2 and 26°C to a more relevant temperature of 16 or 20°C, k was multiplied by Q−10 or Q−6, respectively.
2.2.2 Dependence of the Half-Life Time t1/2 on T
For the influence of T on t1/2, the same approach was taken based on the data of Yates et al. (2002). The reported relative hydrolysis rates were transformed into half-life times prior to the calculation of the t1/2-influencing coefficient.
2.3 Quantification of Change to k, t1/2 and [AHL] for Natural Conditions and Climate Change Scenarios
2.3.1 Definition of Relevant Natural pH and Temperature Ranges
Physical aquatic parameters, such as temperature and pH, fluctuate considerably in natural environments like estuaries (Baumann et al., 2015; Baumann and Smith 2018). Defining relevant pH and T ranges is therefore crucial. Although AHL-producing bacteria in biofilms are assumed to be well-buffered from the surroundings (de Carvalho, 2018), pH conditions within the biofilm can vary considerably due to the presence of photosynthetic co-inhabitors such as diatoms (Decho et al., 2009). Decho et al. (2009) showed that within the first millimetres of a marine biofilm, pH can fluctuate between an acidic pH 6.8 at night and alkaline pH of 9.4 during the day at a stable external pH. This pattern can be translated into a sinus function that represents pH over the course of a day:
with t specifying the hour of the day out of 24.
2.3.2 Natural Conditions in the Humber Estuary
Abiotic water parameters, such as pH and temperature, have been measured over the past years within and surrounding the Humber estuary (UK). For this study the dataset for pH and temperature measured at Spurnpoint, Saltend Jetty and Albert Dock from 1995 to 2005 was used as it provided a suitable consistency and sufficient frequency of measurements across the required seasonal timeframe (see supplementary data files). Data was pooled and plotted with respect to the day within the year it was obtained, before being analysed for apparent fluctuations. pH showed some variation (pH 7.78±0.23), but no clear temporal or spatial pattern is evident. Temperature data (11.15±4.86°C) showed a clear seasonal pattern and was subsequently fitted with a sinus function in IGORpro (v6.3).
2.3.3 Relevant Climate Change Scenarios
Based on the latest IPCC report, global average surface ocean pH is currently assumed as pH 8.1 and predicted to drop by 0.4 units to pH 7.7 by the end of this century (IPCC, 2019). Global average surface ocean temperature is currently at 16°C (NOAA, 2020) and predicted to rise to 20°C by 2100 (IPCC, 2019). Assuming any average changes predicted with climate change would translate to the biofilm environment unaltered (i.e. cause a baseline shift), the natural pH conditions in the biofilm by the year 2100 could be shifted to range from 6.4 to 9.0 and temperature could be increased by up to 4°C.
2.3.4 Calculation of Scenario-Specific k , t1/2 and Relative [AHL]
For this part only the effects for C6 and C8 were evaluated as data for these two AHLs with regards to pH and temperature influences was most reliable. To account for potential experimental uncertainties, the hydrolysis rate and half-life time data for C6 and C8 obtained by Decho et al. (2009) and Ziegler et al. (2019) was combined after adjusting the NMR-based data of Ziegler and co-workers to the temperature used for Decho and co-workers’ experiments (based on the temperature coefficients obtained through Yates et al. (2002)) and accounting for the kinetic isotope effect (KIE) of D2O compared to water () by multiplying Ziegler’s hydrolysis rates by 0.5 and the respective half-life times by 2 (Ziegler et al., 2019). The combined dataset was then plotted against pH and subjected to the analyses described above to obtain the respective linear correlation coefficients.
Then, for each specifically defined condition (e.g. each datapoint of the seasonal Humber dataset or each combination of average climate change conditions), the pH and T-dependent hydrolysis rate k and the respective half-live time t1/2 were calculated based on eqn. (12) and (14) and the corresponding temperature coefficients based on (15). Differences between maximum, average and minimum of fluctuating conditions or between current and future average conditions were calculated and expressed in plain numbers as well as % (relative to average or current conditions). Monthly averages for seasonal variations were calculated and expressed as ± standard error of mean (SEM). Seasonal trends for hydrolysis rate and half-life time across the year were analysed by fitting a sine function (IGORpro v6.3) based on the observations that temperature the is most influencing factor.
For each climate change scenario the AHL concentration over time (minutes) was calculated based on a classic exponential decay equation and assuming an AHL start concentration of 1, so
using the respective hydrolysis rate k adjusted for pH and T of the scenario in question.
For the daily periodical fluctuations, a constant hourly production of [AHL] = 1 was assumed and summing up all produced and from decay remaining hour-specific AHL concentrations [calculated based on eqn. (16)] yielded the overall relative [AHL] for each hour of the day.
3 Results
3.1 Numerical pH-Dependence of Hydrolysis Rate and Half-Live Time
For the investigated pH range between 6.0 and 10.0, there was a clear linear impact of pH on the hydrolysis rate when plotted at negative log-scale (Figure 2). The same could be observed for half-life time (Figure S1). With increasing pH, −log(k) decreased, corresponding to an increase of the hydrolysis rate k. At lower pH conditions the hydrolysis rate is slower.
Figure 2
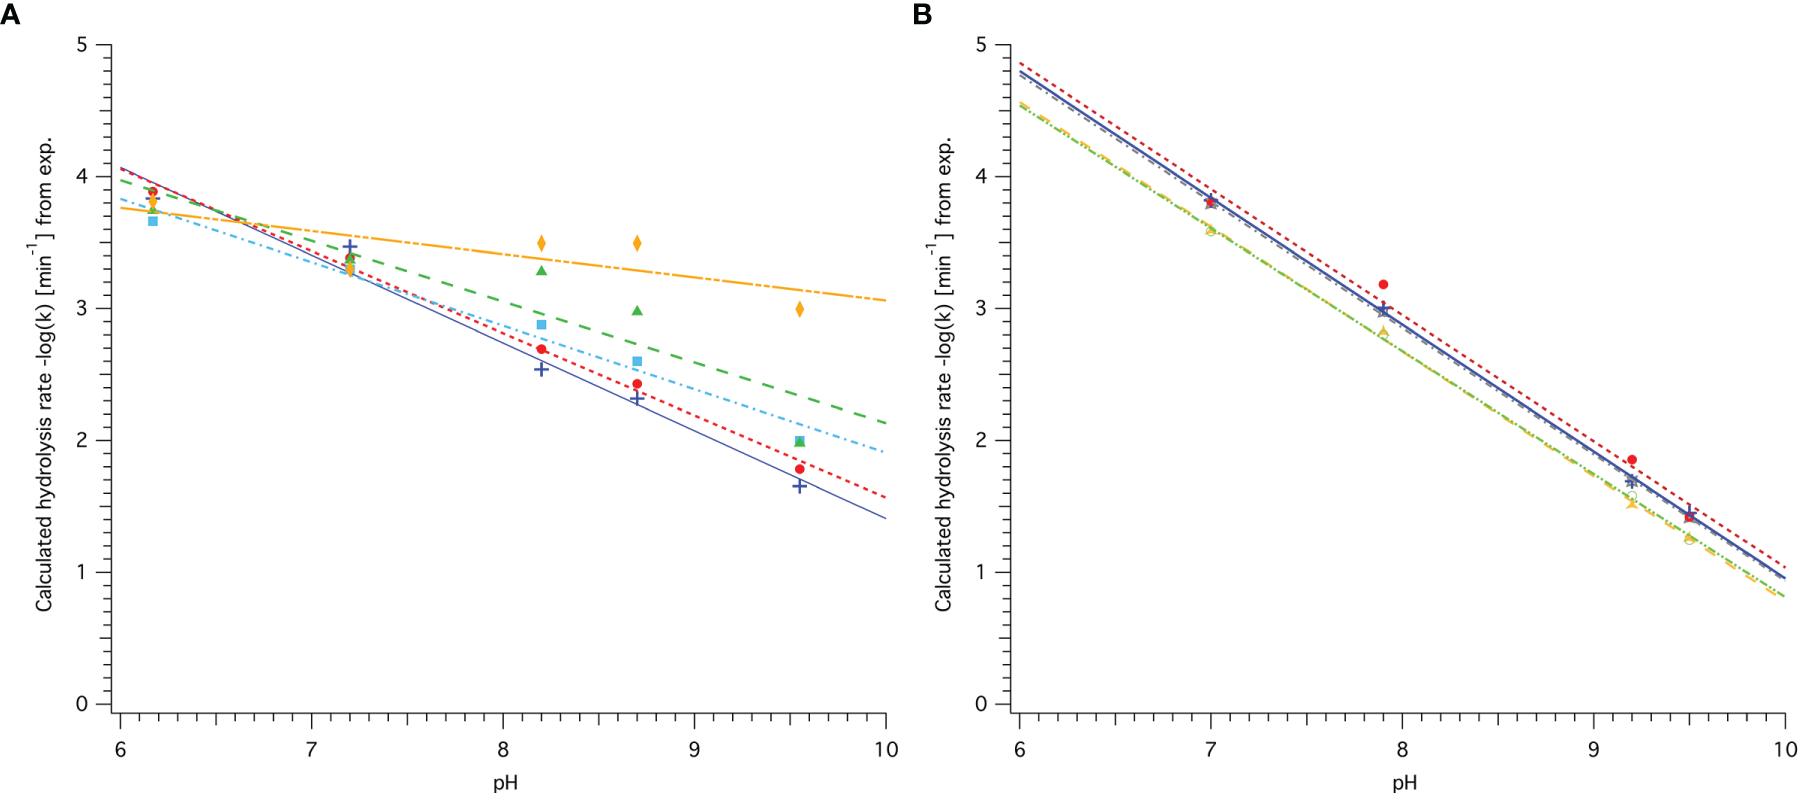
pH-dependence of hydrolysis rate k for different AHLs. (A) Based on data published by Decho et al. (2009) for C6 (blue, crosses), C8 (red, circles), C10 (light blue, squares), C12 (green, triangles) and C14 (orange, diamonds). (B) Based on data published Ziegler et al. (2019) for C4 (grey, stars), C6 (blue, crosses), C8 (red, circles), C6-oxo (orange, triangles) and C8-oxo (light green, open circles). Coefficients for linear least-square fit following the equation −log(k)=a×pH+C are detailed in Table 1.
The steeper slope observed for AHLs with shorter acyl-chain length based on the data by Decho et al. (2009) indicates a greater impact of pH on the hydrolysis rate than for AHLs with longer acyl-chains with more than 8 carbons (see also slope coefficient a in Table 1). For C10-HSL the slope was 0.14 lower than for C8-HSL, a significant reduction by more than 22%. In addition, an overall faster abiotic hydrolysis rate for shorter chain AHLs is reflected by the calculated k at pH 8.0 in Table 1. For AHLs with 8 carbons or less, the parameters are similar, suggesting a similar impact of pH and similar rate of abiotic hydrolysis (see (A) and (B) in Figure 2). AHLs with a 3-oxo-group in the side chain had a faster hydrolysis rate at each point across the pH range, but were equally affected by pH (similar slope). It has to be noted that the least-square linear fit obtained for C6, C8 and C10 data by Decho et al. (2009) as well as for all data by Ziegler et al. (2019) was very good (R2>0.95), while the linear regression obtained for C12 and C14 was not as good or even poor and the subsequently calculated data, such as k at any pH, should be interpreted with caution. It also has to be taken into consideration that rates obtained based on either dataset are only representative for the respective conditions. While Decho et al. (2009) obtained their rates in water at 26°C based on subsequent GC-MS analyses in 0.5 h steps, Ziegler et al. (2019) performed NMR experiments at 22°C in D2O and determined k based on sampling in steps of 4 min. Hence the obtained parameters for C6 and C8 by both groups are not directly comparable without temperature and solvent adjustment.
Table 1
| AHL | a | C | R2 | k at pH 8.0 (x 10-3)[min-1] | Source data |
|---|---|---|---|---|---|
| C6 | -0.67 ± 0.06 | 8.1 ± 0.4 | 0.980 | 1.8 | Decho et al. (2009)* |
| C8 | -062 ± 0.03 | 7.8 ± 0.2 | 0.994 | 1.4 | |
| C10 | -0.48 ± 0.04 | 6.7 ± 0.4 | 0.975 | 1.4 | |
| C12 | -0.5 ± 0.1 | 6.7 ± 0.9 | 0.822 | 2.0 | |
| C14 | -0.18 ± 0.08 | 4.9 ± 0.7 | 0.592 | 0.3 | |
| C4 | -0.96 ± 0.01 | 10.5 ± 0.1 | 0.999 | 1.4 | Ziegler et al. (2019)** |
| C6 | -0.97 ± 0.02 | 10.6 ± 0.2 | 0.999 | 1.2 | |
| C8 | -0.96 ± 0.07 | 10.6 ± 0.6 | 0.989 | 1.2 | |
| C6-oxo | -0.95 ± 0.02 | 10.2 ± 0.2 | 0.999 | 2.5 | |
| C8-oxo | -0.93 ± 0.02 | 10.2 ± 0.2 | 0.999 | 2.2 |
Coefficients (± SD) of the relationship between hydrolysis rate k and pH expressed as linear equation of the form -log(k) = a x pH + C, valid for the pH range from 6.0 to 10.0.
For the half-life time the same linear impact of pH could be observed when plotted at positive log-scale (Figure S1). Increased pH results in a shorter half-life time, which is also illustrated in Table 2. pH has a stronger effect on short acyl-chain AHLs, which also have an overall shorter half-life, for example comparing C6, C8 and C10 at pH 8.0. As half-life time and hydrolysis rate can be simply inter-converted using equation (3), the observed trends are thus essentially the same.
Table 2
| AHL | b | D | R2 | t1/2 at pH 8.0[min] | Source data |
|---|---|---|---|---|---|
| C6 | -0.67 ± 0.06 | 7.9 ± 0.4 | 0.980 | 347 | Decho et al. (2009)* |
| C8 | -0.62 ± 0.03 | 7.6 ± 0.2 | 0.994 | 437 | |
| C10 | -0.48 ± 0.04 | 6.6 ± 0.4 | 0.975 | 575 | |
| C12 | -0.5 ± 0.1 | 6.6 ± 0.9 | 0.822 | 398 | |
| C14 | -0.18 ± 0.08 | 4.7 ± 0.7 | 0.592 | 1820 | |
| C4 | -0.97 ± 0.02 | 10.5 ± 0.1 | 0.999 | 550 | Ziegler et al. (2019)** |
| C6 | -0.97 ± 0.02 | 10.5 ± 0.2 | 0.999 | 550 | |
| C8 | -0.96 ± 0.07 | 10.4 ± 0.6 | 0.989 | 525 | |
| C6-oxo | -0.95 ± 0.02 | 10.1 ± 0.2 | 0.999 | 316 | |
| C8-oxo | -0.93 ± 0.02 | 10.0 ± 0.2 | 0.999 | 302 |
Coefficients (± SD) of the relationship between half-life time t1/2 and pH expressed as linear equation of the form log( t1/2) = b x pH + D, valid for the pH range from 6.0 to 10.0.
The impact of temperature on the hydrolysis of C4, C6, C8 and C6-oxo has already been established by Yates et al. (2002). Based on their data, the general temperature coefficients shown in Table 3 can be calculated, indicating that for every degree of temperature increase, the hydrolysis rate k will increase by a factor of 1.03 to 1.08 and half-lives will decrease accordingly. The impact of temperature decreases with increasing acyl-chain length. The presence of an oxo-side chain reduces the impact of temperature by approximately 0.01.
Table 3
| AHL | Q1 for k | Q1 for t1/2 |
|---|---|---|
| C4 | 1.08 | 0.93 |
| C6 | 1.07 | 0.93 |
| C8 | 1.03 | 0.97 |
| C6-oxo | 1.06 | 0.94 |
Temperature-dependent factors for hydolysis rate k and half-life time t1/2 for a + 1°C temperature increase derived from data by Yates et al. (2002).
To obtain the most representative data basis for further analysis, we combined the naturally relevant data obtained by Decho et al. (2009) with the more chemically accurate, time-resolved data by Ziegler et al. (2019) for C6 and C8. For both of these AHLs, the pH (Decho et al., 2009; Ziegler et al., 2019) and temperature (Yates et al., 2002) influences on their abiotic decay have been established. Comparability of both data sets was ensured by accounting for the kinetic isotope effect of D2O compared to H2O and adjustment of the temperature by employing the coefficients from Table 3. Individual data points were then plotted and analysed as above, yielding linear regression equations with a very good fit (R2>0.95) as shown in Figure 3 (detailed fit parameters specified in Table S6).
Figure 3
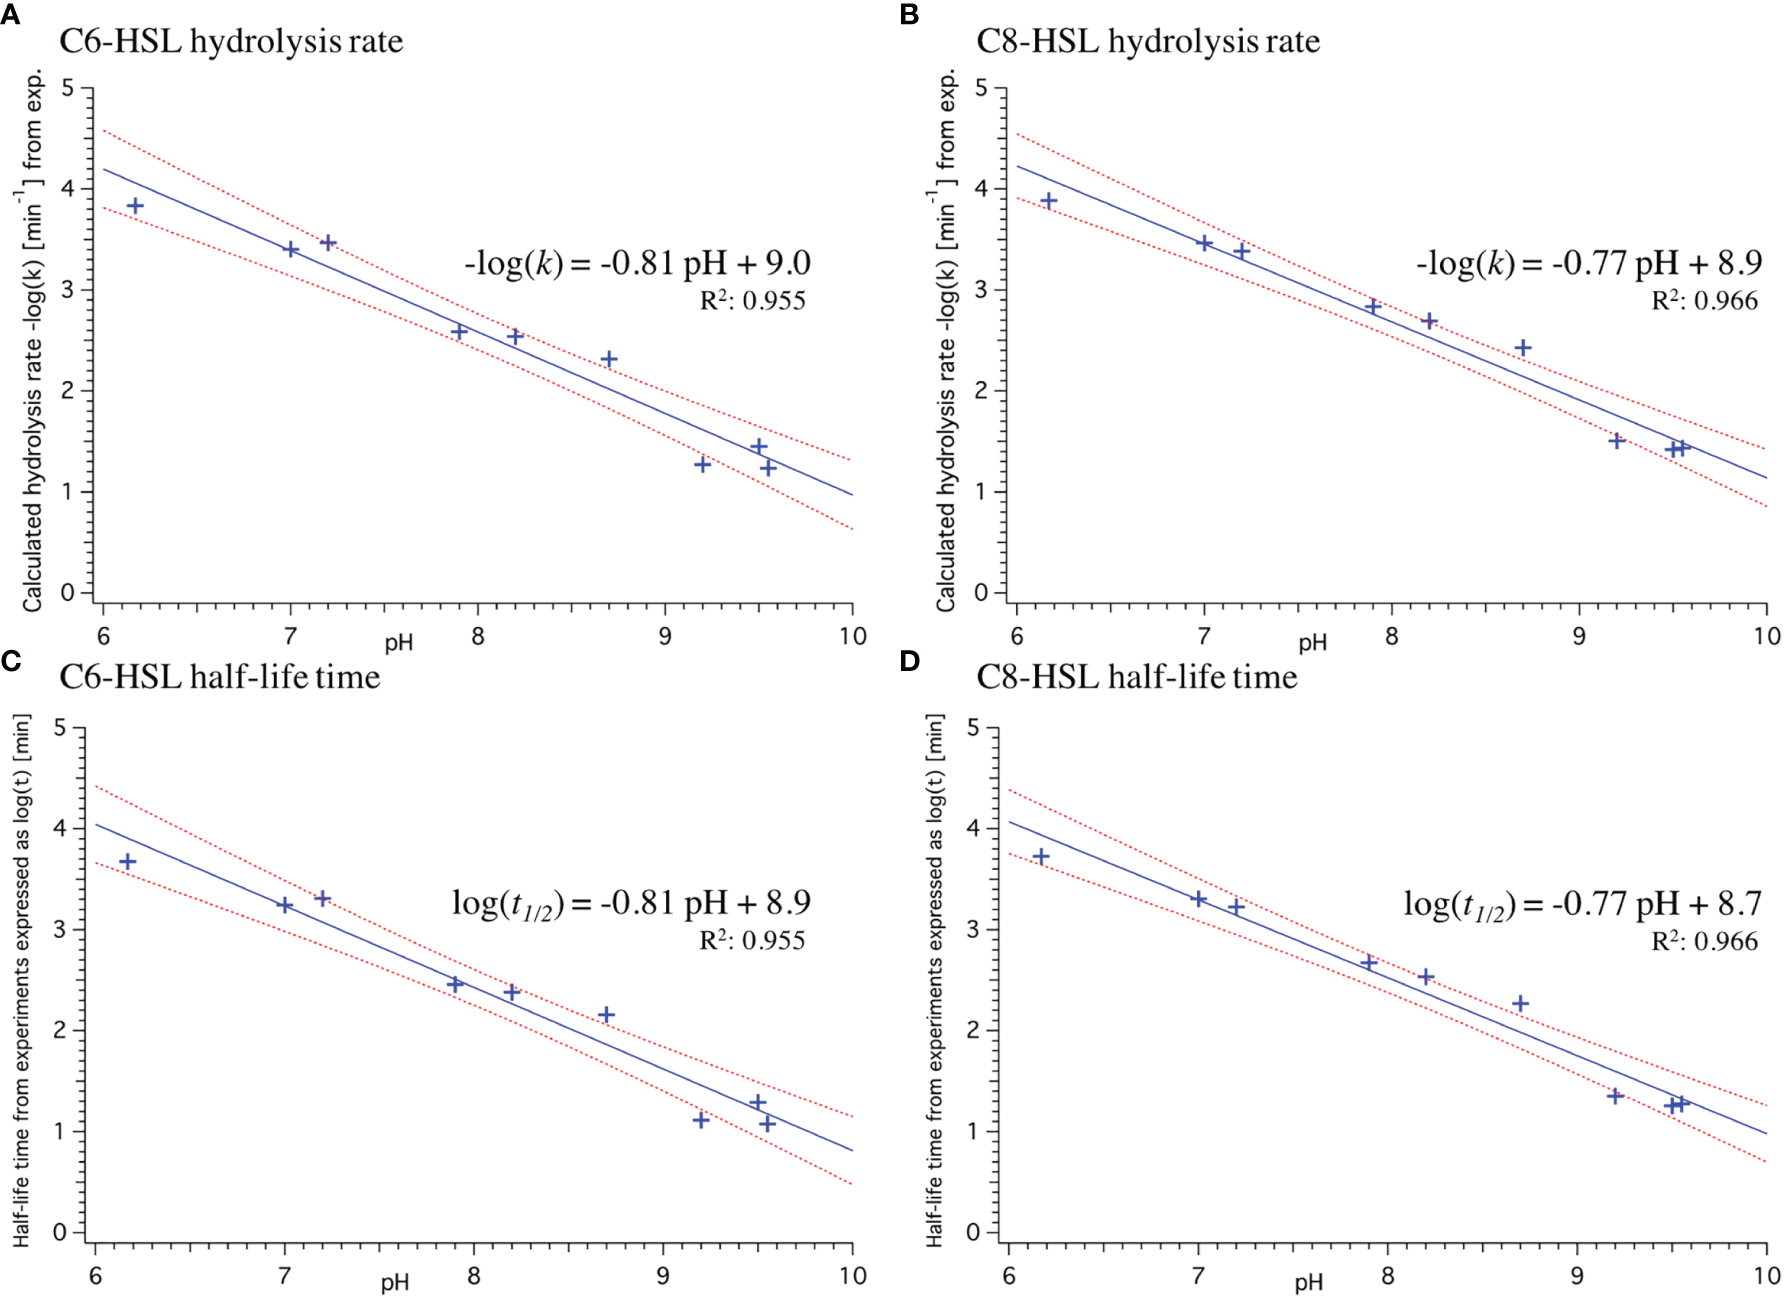
pH-dependence of hydrolysis rate k(A, B) and half-life time t1/2(C, D) for C6- and C8-HSL with a pooled dataset including measurements from Decho et al. (2009) and temperature adjusted data from Ziegler et al. (2019) for which the kinetic isotope effect in D2O was accounted for. Linear least-square fit (blue line) yielded the respective equation. Red dashed lines indicate 95% confidence bands on fit and R2 value indicates goodness of fit (the closer to 1 the better). Standard deviation of fit coefficients is specified in Table S6.
3.2 AHL Hydrolysis in Current and Future Average Conditions
In current average ocean sea-surface pH and temperature conditions, the hydrolysis rate k of C6- and C8-HSL is considerably faster by 0.70×10⁻³ and 0.75×10⁻³ per minute compared to future ocean conditions. This means that in average conditions predicted by the IPCC under a RCP8.5 ‘business-as-usual’ scenario for the year 2100 (IPCC, 2019), the hydrolysis rate for these two AHLs will be 38% and 45% slower compared to today, respectively (Table 4). In turn, the half-life time of both AHLs will be increased in future by 61% for C6-HSL and 82% for C8-HSL compared to today. This equals an increase in half-life time by more than 4 or even more than 5 hours, respectively, compared to the half-life time in current conditions.
Table 4
| Current average conditions: 16°C, pH 8.1 | Average conditions in the year 2100*: 20°C, pH 7.7 | Difference due to climate change | Relative change in future conditions compared to today | |||||
|---|---|---|---|---|---|---|---|---|
| AHL | k [10-3 min-1] | t1/2 [min] | k [10-3 min-1] | t1/2 [min] | Δk [10-3 min-1] | Δ t1/2 [min] | k | t1/2 |
| C6 | 1.85 | 428 | 1.15 | 690 | -0.70 | 261 | -38% | +61% |
| C8 | 1.66 | 381 | 0.91 | 694 | -0.75 | 314 | -45% | +82% |
Hydrolysis rate and half-life time of C6- and C8-HSL in average current and future conditions.
The difference in hydrolysis rate/half-life time between current and future average conditions also results in a noticeable difference in the decay of C6-HSL and C8-HSL over the course of 10 hours, as shown in Figure 4. Due to climate change, there will be less abiotic hydrolysis of both AHLs. In average future conditions at pH 7.7 and 20°C, there will be 17.2% more C6-HSL and 21.0% more C8-HSL after 10 hours compared to current average ocean conditions. The concentration of C6 and C8-HSL reached in current conditions after 10 hours is only reached after more than 16 or 18 hours in future conditions, respectively, resulting in the chemical signals lasting for up to 8 hours longer.
Figure 4
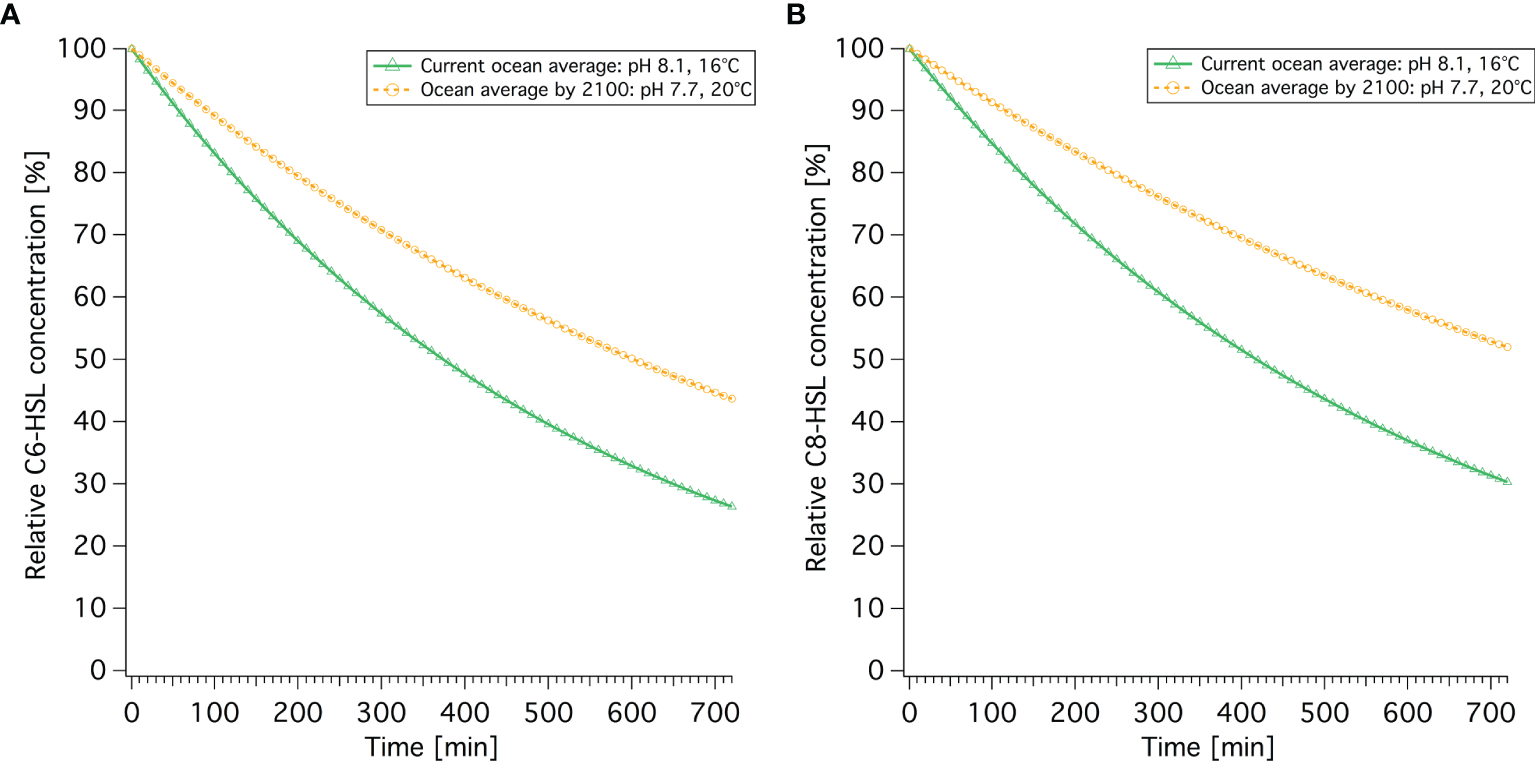
Current and future AHL concentrations over time for (A) C6-HSL and (B) C8-HSL. Decay is based on the respective hydrolysis rate stated in Table 4.
3.3 AHL Hydrolysis Dynamics in Fluctuating Conditions - Quantification of Natural Variability
While average changes are important to gain an impression of the overall impact of ocean acidification and increased temperature, the natural variability within a system at different levels of spatial and temporal resolution can be equally important in order to obtain a holistic picture and understand baseline variability.
3.3.1 Variability Within the Biofilm Due to Daily pH Fluctuation
Measurements by Decho et al. (2009) in marine stromatolite mats in the Bahamas revealed substantial daily pH fluctuations of up to 2.6 pH units despite an external stable pH of around 8. Assuming that a relative shift of the external pH (-0.4 units) would equally translate to the pH fluctuations within the biofilm allows a prediction of the impact of future pH-conditions (Figure 5). Temperature was kept constant in this instance.
Figure 5
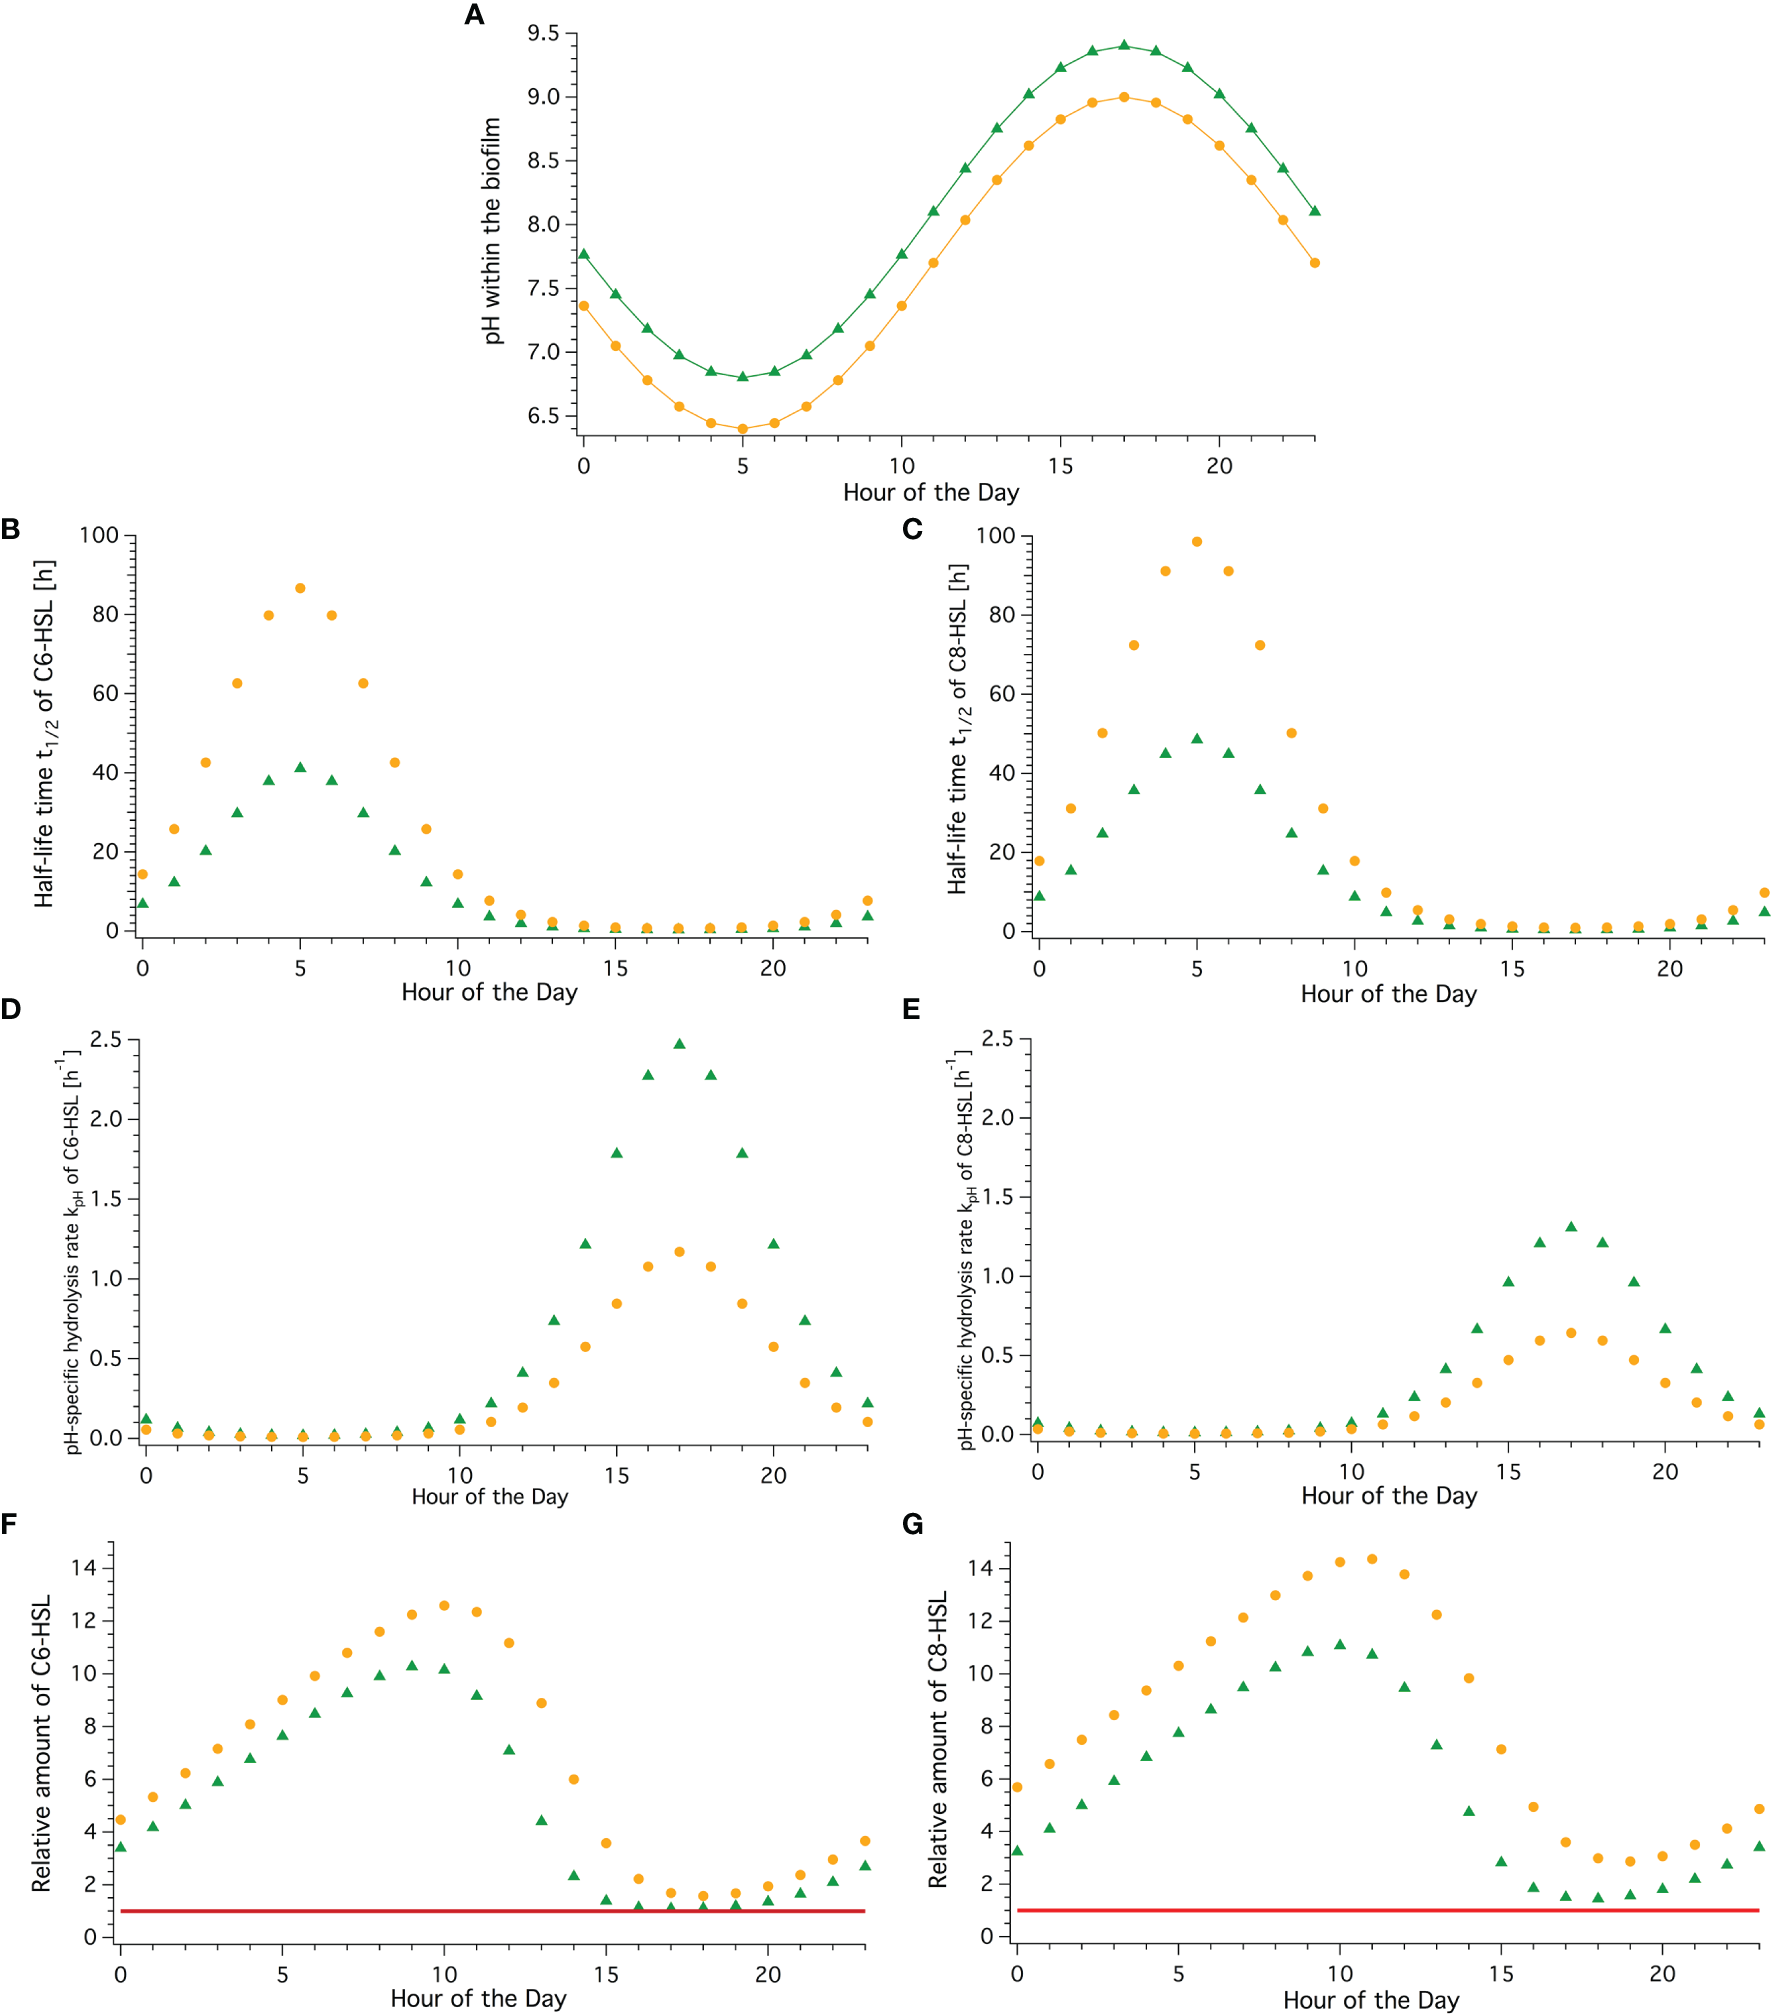
Current and future concentrations of C6-HSL and C8-HSL over a daily pH-cycle within a biofilm. Green triangles represent values in current conditions, yellow dots represent values in the year 2100 with predicted reduction in pH due to climate change. (A) Periodically fluctuating pH-conditions based on Decho et al. (2009) assuming stable temperature. (B, C) Half-life time in hours across a daily cycle for C6- and C8-HSL, respectively. (D, E) Hydrolysis rate kpH over the course of the day for C6- and C8-HSL, respectively. (F, G) Relative amount of C6- and C8-HSL for every hour in a daily cycle. Amount produced is normalized to 1 (red line), so relative amount value reflects multitude of produced amount (accumulation).
Half-life time was greatest and hydrolysis rate slowest at 5:00 am in the morning, coinciding with the lowest pH value. Likewise, the lowest half-life time and fastest hydrolysis rate were observed at 17:00 in the afternoon when the highest pH is reached (green data points in Figure 5).
Over the course of the day in current conditions, the half-life time of C6-HSL was found to range from over 41 hours in the early morning to as little as 19 minutes in the afternoon. For C8-HSL, t1/2 similarly ranged between 48.5 hours and 29 minutes. The hydrolysis rate displays the inverse trend ranging from 0.01 h−1 in the early morning to 2.47 h−1 in the afternoon for C6-HSL and a range from 0.01 h−1 to 1.31 h−1 for C8-HSL, respectively. Assuming a constant production (normalised to 1) and summing up produced and remaining AHL amounts taking the different hydrolysis rates into account, fluctuating daily AHL concentration patterns become apparent. In current conditions, the C6-HSL concentration reaches the highest level with 10.3 times the produced amount at 9:00 am and drops to the lowest amount at 5 pm. For C8-HSL a similar pattern with slightly shifted timings (lag) is observed with a maximum exceeding 11 times the produced amount at 10 am and a minimum at 6 pm. This means that the AHLs accumulate to amounts over a magnitude higher than what is produced over the course of the night and into the morning before they degrade back to amounts close to the baseline level. While accumulation happens over a timeframe of 16 hours, degradation happens twice as quickly, within 8 hours.
In future conditions expected for the year 2100, half-life time and hydrolysis rate show the same patterns, coinciding with highest and lowest pH conditions as can be expected (Figure 5, orange points). However, the linear shift of -0.4 pH units does not translate linearly, leading to more than double the half-life time at any given hour compared to the current conditions, and less than half the hydrolysis rate. This results in significantly higher levels of C6- and C8-HSL being present throughout under these future scenarios. C6-HSL accumulates for 16 hours to 12.6 times the amounts produced under current conditions, and is then degraded within 8 hours. Compared to current conditions, that’s 2.3 times the produced amount of C6-HSL at peak time in future conditions. Bacteria in future conditions could produce 18% less C6-HSL throughout the day to reach the same maximum concentration as in current conditions. For C8-HSL the differences for future compared to current conditions are even greater, with 14.4 times the produced amount at peak hour, 3.3 more than in current conditions. To achieve the same maximum peak concentration in future conditions, bacteria could produce 23% less C8-HSL throughout than in current conditions. Furthermore, the time at which maximum accumulation and lowest level of AHL is observed in future conditions is shifted by one hour for both AHLs. The 16h accumulation and 8h degradation phases stay the same. Hence the reduction in pH due to ocean acidification can be expected to increase the baseline level of AHL concentration if the same level of production is maintained and shift the timing of the accumulation cycle.
3.3.2 Seasonal Variability Based on the Example of the Humber Estuary Conditions
Fluctuating conditions affecting habitats in coastal areas and estuaries, especially where there is significant tidal influence and/or fluvial input, were also found for the Humber estuary. The pH was found to vary between 7.2 and 8.4 without a clear seasonal pattern and mostly driven by tidal effects. Some very low pH values between pH 6 and 7 were measured early and late in the year, correlated to heavy rainfall events. Temperature, in contrast, had a clear seasonal trend, as expected, and could be fitted with a sinus equation with an average temperature of 10.99 (±0.07)°C and an amplitude of 6.5 (±0.1)°C (see Figures 6A, B). The pH and temperature adjusted half-life times and hydrolysis rates of C6-HSL calculated for each datapoint show the significant impact of the seasonal temperature pattern on these two parameters, but also reveal that there is a strong dependence on the pH causing large variability within a shorter than seasonal amount of time (days). Half-life time of C6-HSL throughout the year in the Humber estuary was found to be 23 hours on average, varying by ±13 hours due to seasonal influences (±57%) (Figure 6C). The hydrolysis rate was calculated to be on average 0.05 h−1, varying depending on season by ±0.024 h−1 (±48%). Especially during the summer month the combined pH and high temperature conditions seem to cause fairly high hydrolysis rates (>0.1 h−1) compared to the rest of the year (Figure 6D). When averaged across all data points for each month, the half-life time and hydrolysis rate showed significant differences across the year. Half-life time of C6-HSL in autumn and winter (Oct to Mar) exceeded 20 hours and was significantly longer than in spring or summer (April to September)(Figure 6E, green bars). This was inversely reflected in the hydrolysis rate showing highest rates from April to September ranging between 0.05 and 0.08 h−1 (Figure 6F, green bars). Shifting temperature by +4°C and pH by -0.4 units for every datapoint in line with IPCC predictions for conditions in 2100 results in significantly increased half-life times, which are on average 61% longer than those calculated for current conditions following the same seasonal pattern, and the hydrolysis rate in future conditions is on average 38% slower (Figures 6E, F, orange bars).
Figure 6
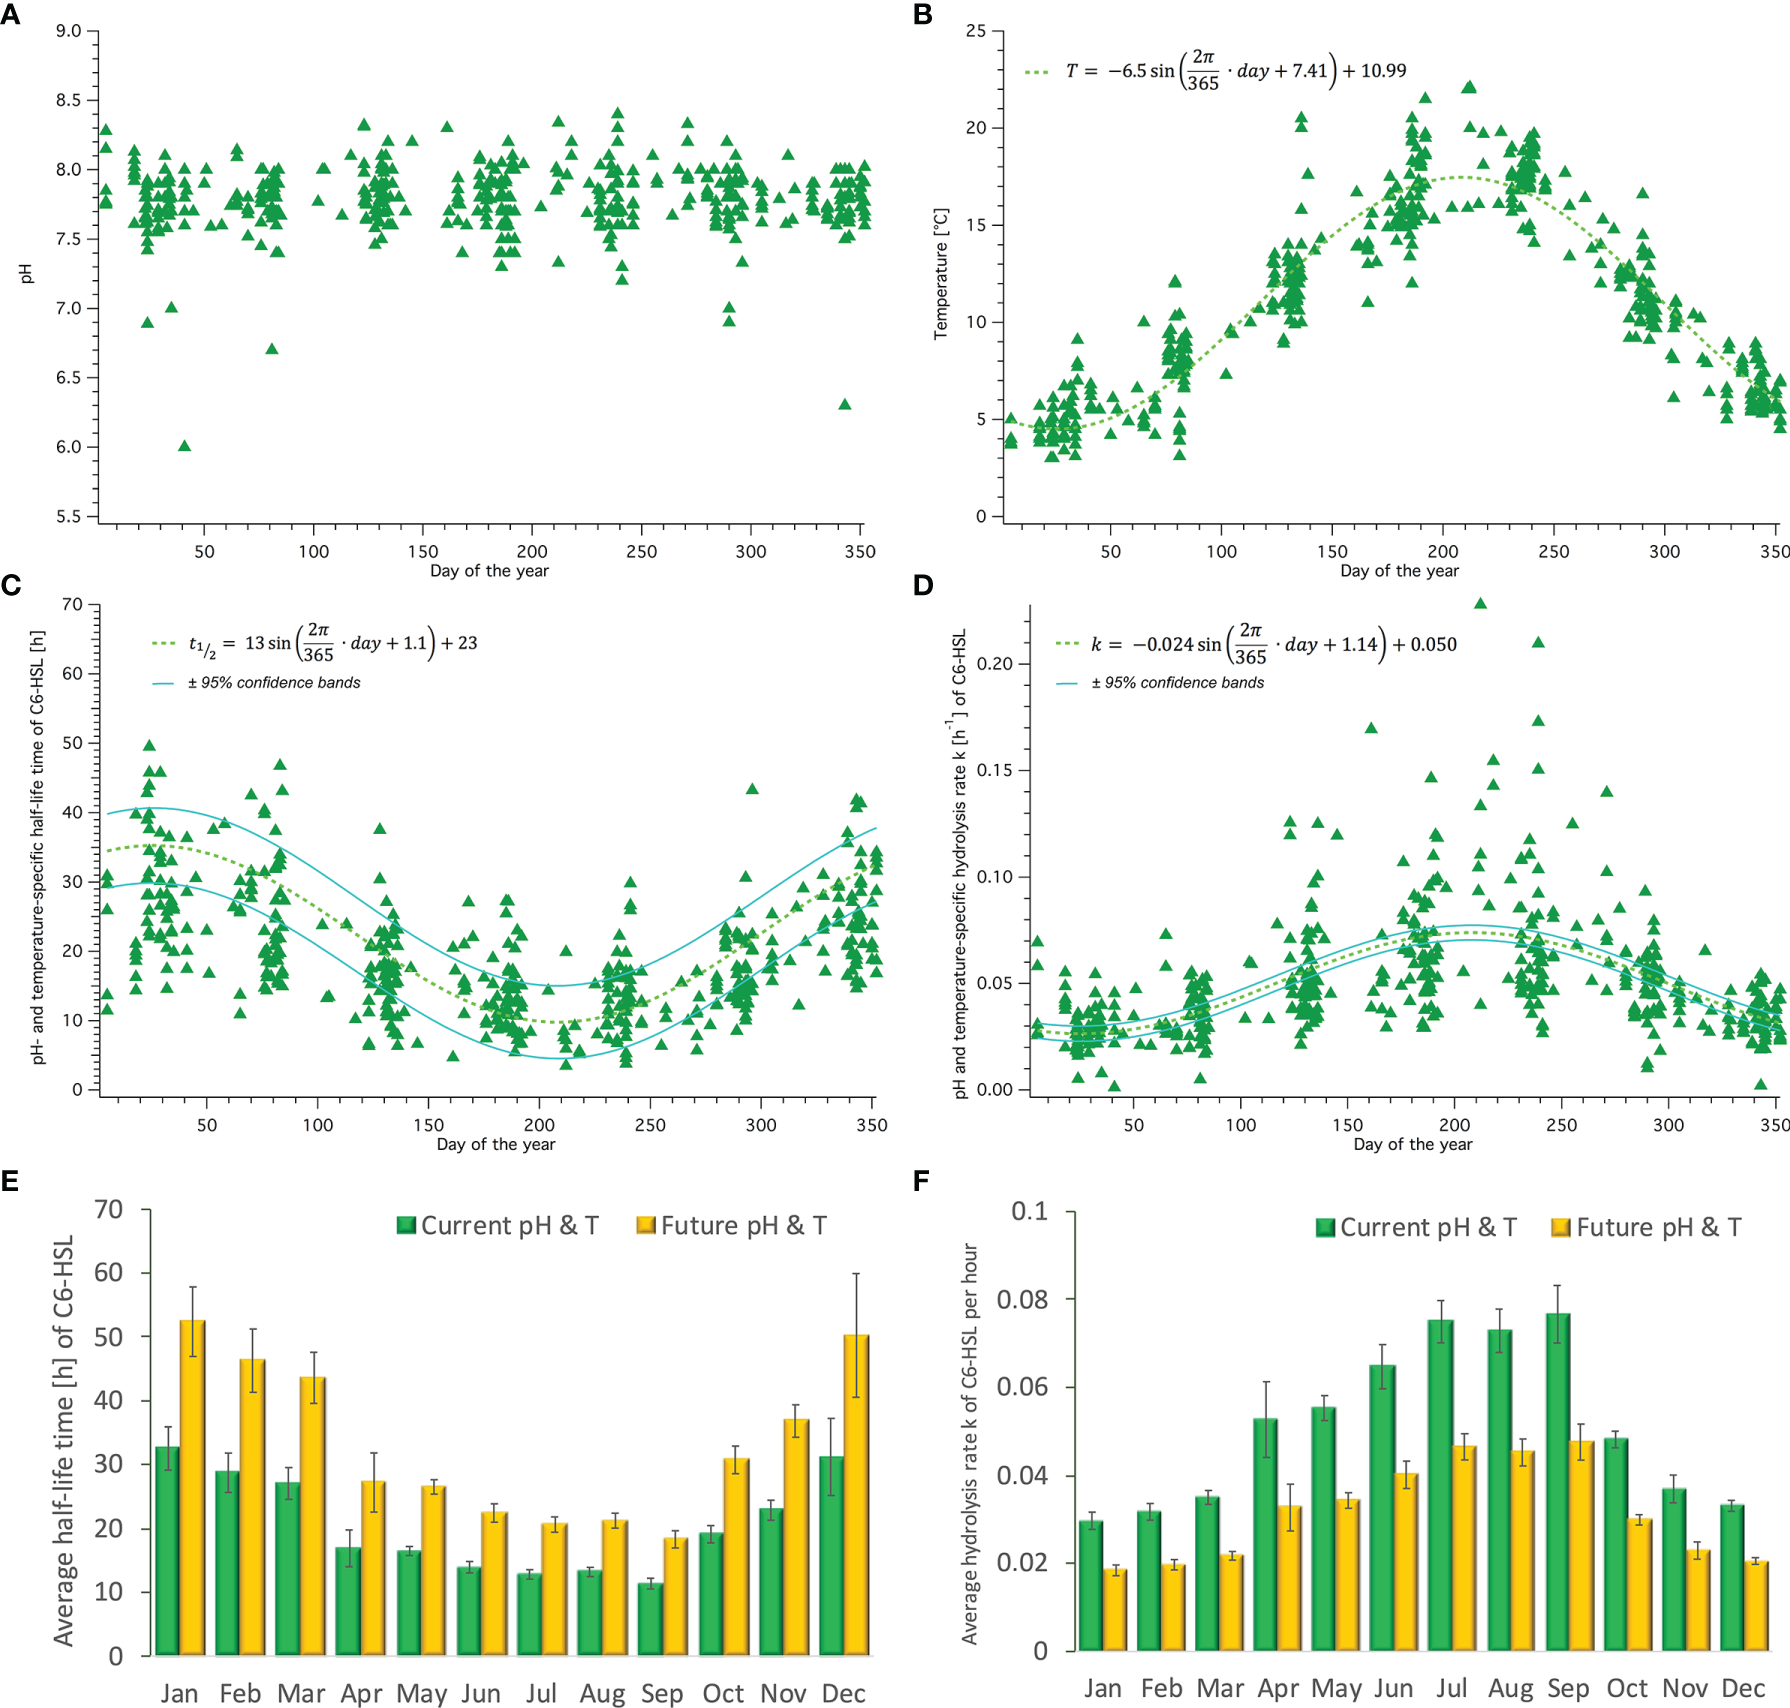
Seasonal fluctuations of pH, temperature, C6-HSL half-life time and hydrolysis rate over the year. (A) pH and (B) temperature measured within the Humber estuary (1995-2005) across the annual cycle. Trend of (C) half-life time and (D) hydrolysis rate of C6-HSL across the year assuming Humber conditions. Average (± SEM) monthly half-life time (E) and hydrolysis rate (F) for current (green) and future (yellow, based on average IPCC prediction of RCP8.5) Humber conditions.
3.3.3 Combined Seasonal and Daily Fluctuations With a Perspective on Future Conditions
Seasonal differences in the water surrounding the biofilms with the AHL-producing bacteria are also potentially reflected inside the biofilm. To assess and visualise the impact of external pH and temperature conditions on the daily fluctuations within the biofilm for each month (including average, maximum and minimum conditions), the respective hydrolysis rates were calculated for C6-HSL based on equation (16) and the corresponding parameters determining kC6 from Figure 3A as well as the respective temperature coefficient. Results are shown in Figure 7. From January to April the impact of external factors was broadly comparable and highest pH and temperature conditions resulted in a hydrolysis rate of around 1 h−1 in the afternoon at peak pH within the biofilm. Minimum pH conditions at low and high temperatures resulted in very low hydrolysis rates. From May onwards the hydrolysis rates, especially in highest pH and temperature conditions, increase considerably, but there is also a larger variability of hydrolysis rates depending on the external conditions. Rates in November and December are lower again with less variability, similar to those in spring. It further becomes apparent that both, pH and temperature have a considerable impact on the hydrolysis rate within the biofilm.
Figure 7
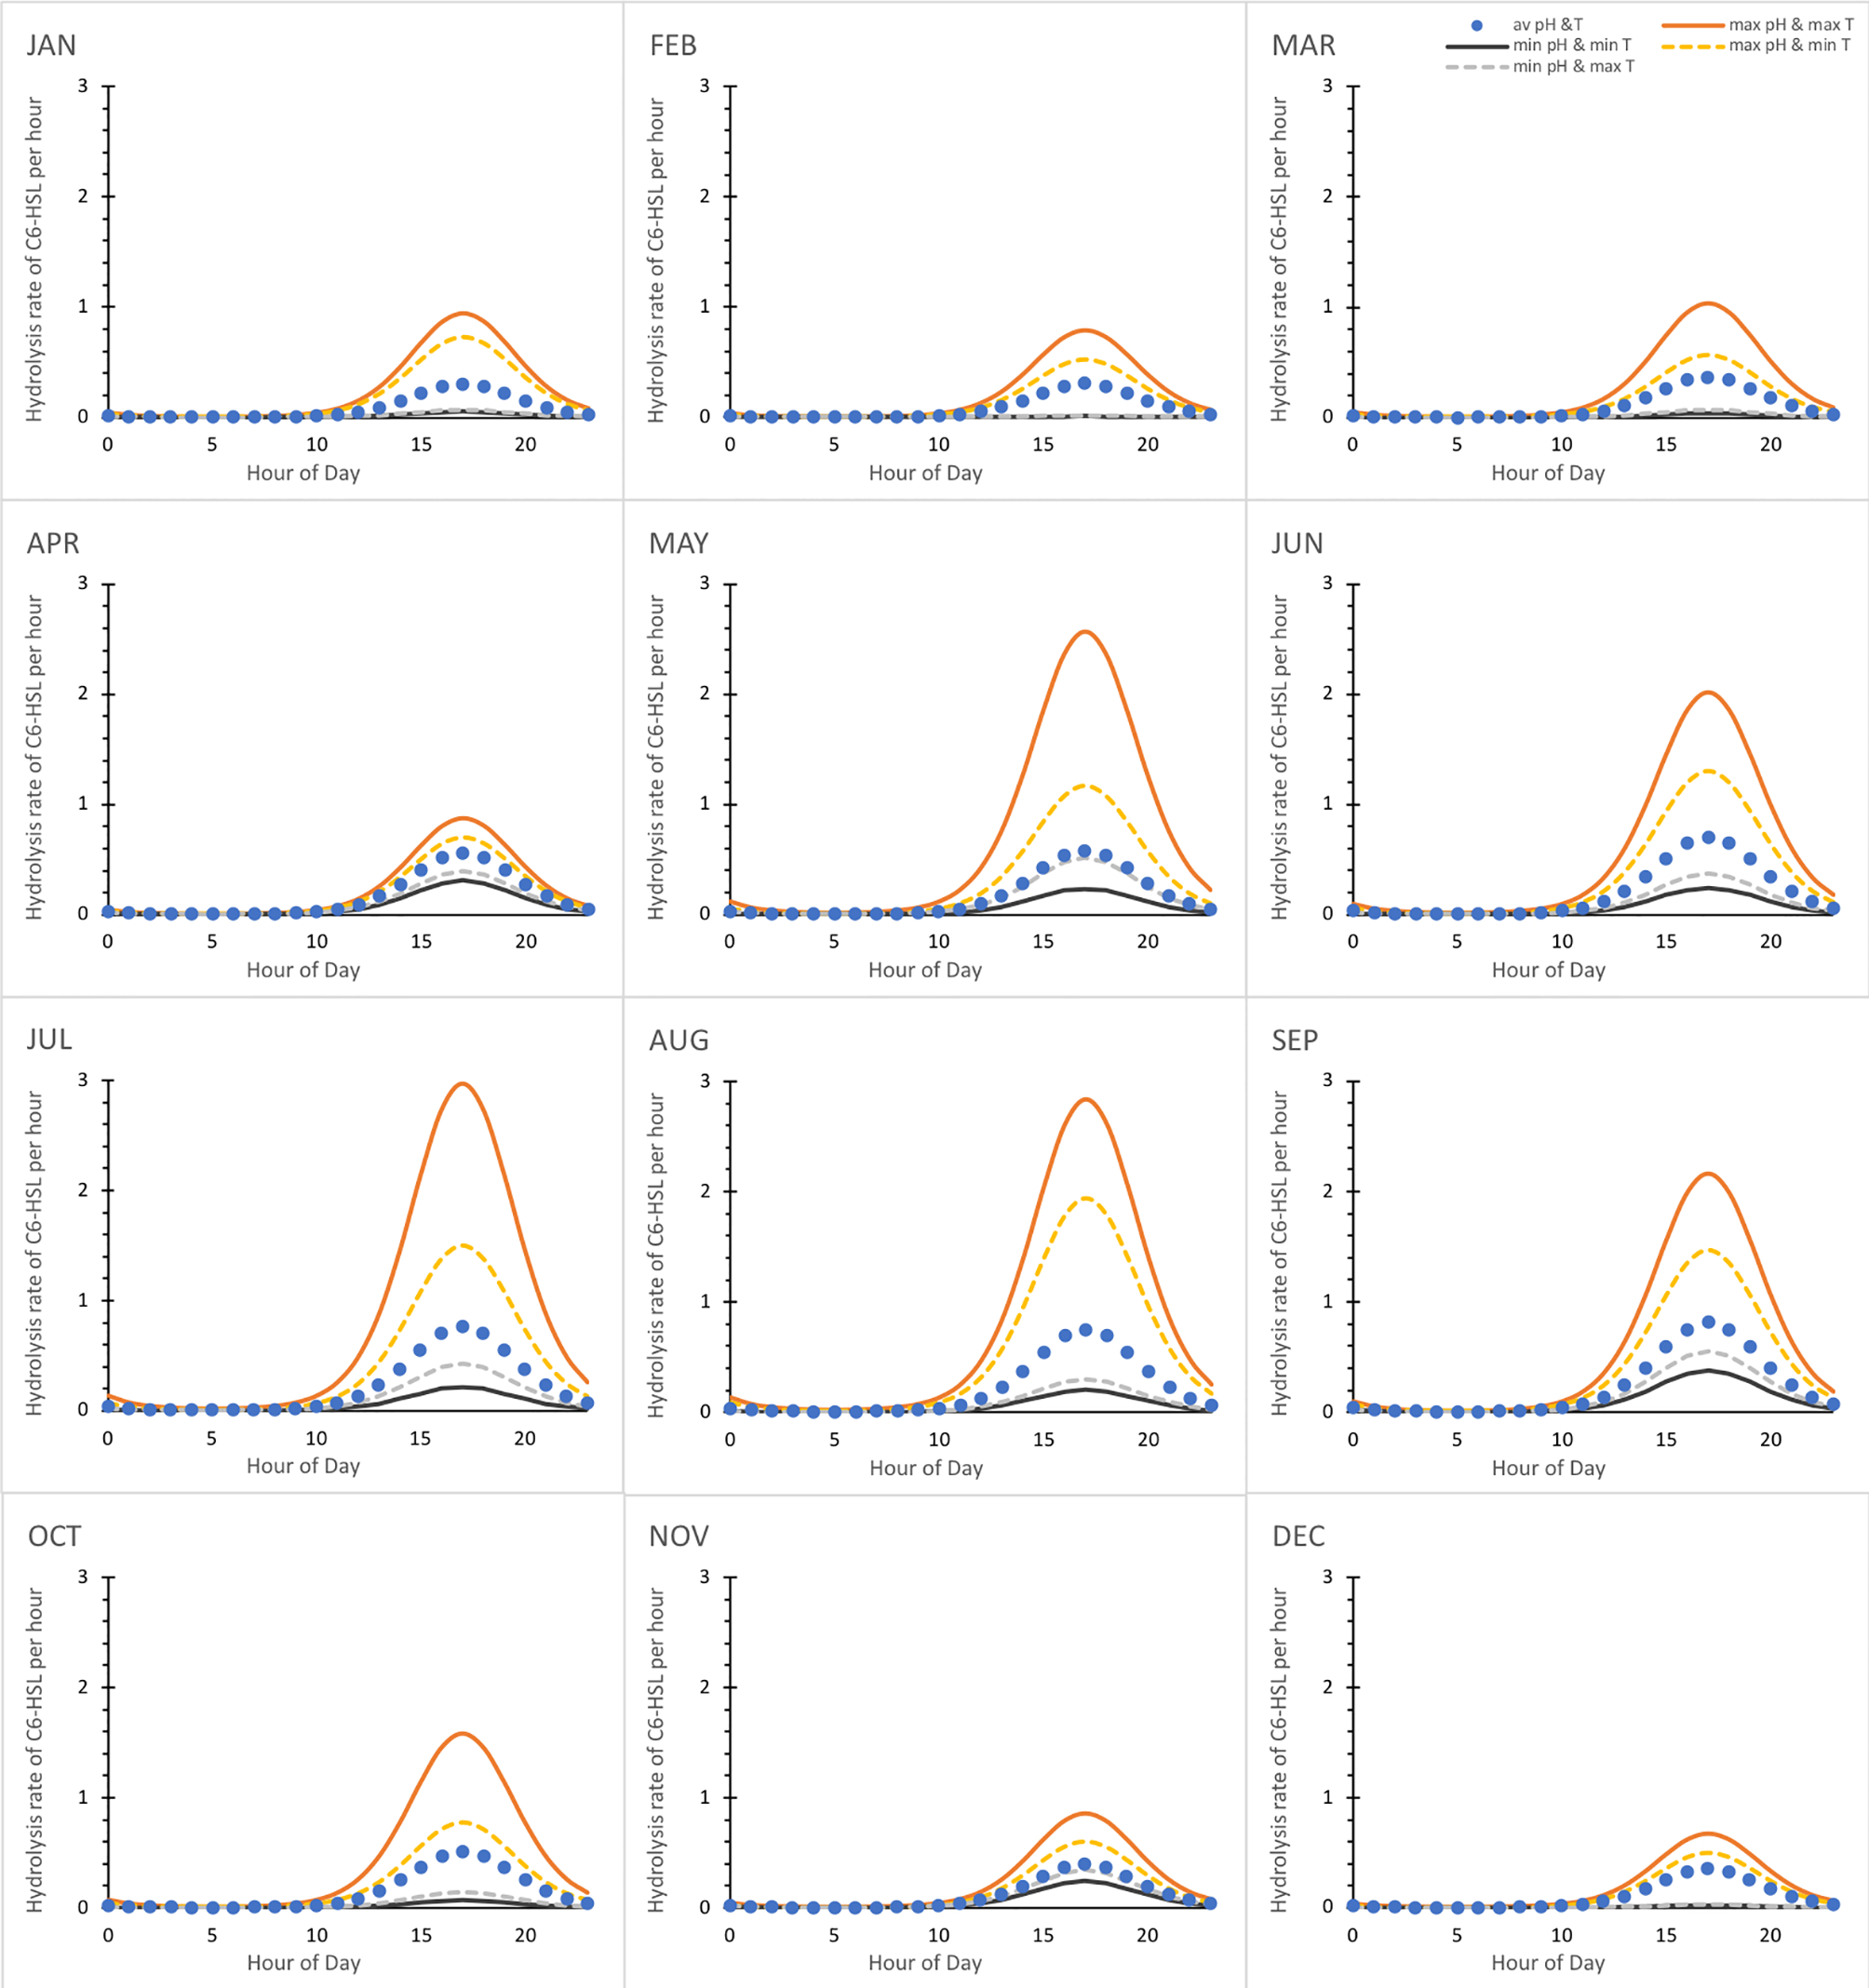
Daily fluctuation of C6-HSL hydrolysis rate for average, minimum and maximum pH and temperature conditions each month. Hydrolysis rate k is given in values per hour and calculated based on equation (16) and the seasonal average, maximum or minimum pH and temperature conditions of the Humber estuary dataset assuming that they translate unchanged to the biofilm as baseline conditions.
The seasonal effects on the daily dynamics of the C6-HSL hydrolysis rate within the biofilm will ultimately be reflected in the amount of C6-HSL that accumulates or degrades, as shown in Figure 8. Relative levels of C6-HSL are highest in January and February, and lowest in July/August/September. During winter, C6-HSL amounts accumulating within the biofilm can exceed 20 times the amount of what is produced. In contrast, during summer peak C6-HSL only reaches levels of about 14 times the produced amount. This reflects a considerable seasonal variability of the AHL amount.
Figure 8
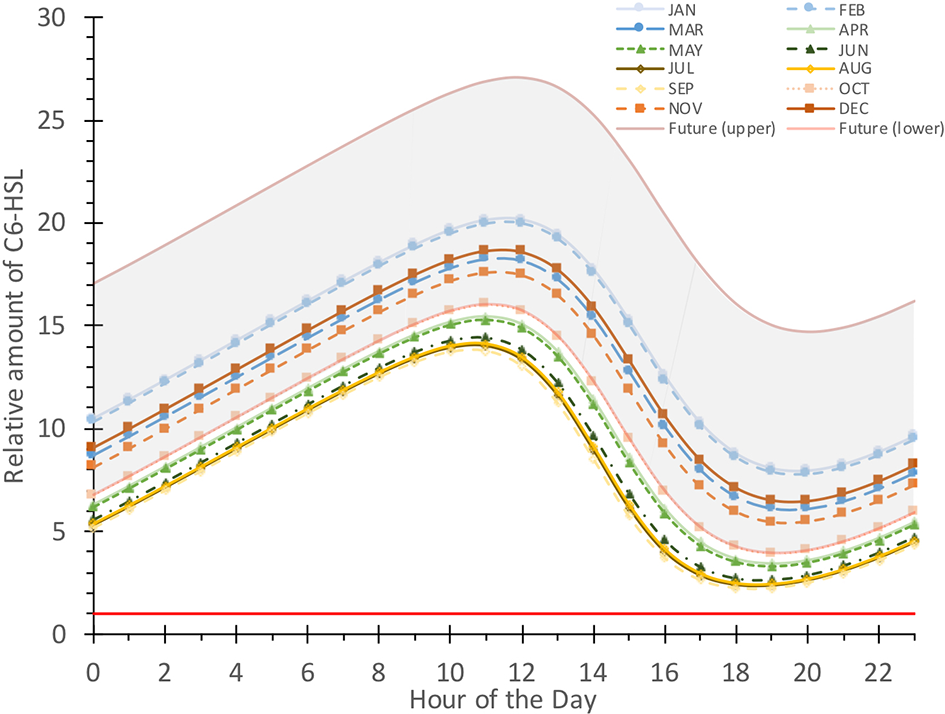
Comparison of daily fluctuating relative C6-HSL concentration for average pH and temperature conditions each month. Relative amount is calculated based on a normalized production of 1 (red line) and current conditions within the Humber estuary for every month (averaged). The projected future range of the fluctuation is shown in grey with the upper and lower boundaries representing January (upper) and September (lower) C6-HSL amounts calculated for conditions shifted by the IPCC RCP8.5 prediction (-0.4 pH, +4°C).
In addition to the variability in the accumulating and degraded amount, there is a considerable shift in timing when the maximum or minimum C6-HSL level is reached. In January and February, peak C6-HSL levels are reached at noon and minimal levels occur at 8 pm. From March to December the maximum levels are already reached an hour earlier (11 am) and degrade to the minimum within 9 hours in the case of March and December, or 8 hours to a minimum at 7 pm in April to August, October and November. In September, the minimum level is reached already after 7 hours at 6 pm. The differences in the timeframes of C6-HSL degradation highlights the considerable seasonal impact on the dynamics of this signalling system.
Placing this seasonal range in the context of future conditions by adjusting the relevant pH and temperature values relative to the IPCC RCP8.5 prediction (-0.4 pH, +4°C) yields a substantial shift of the C6-HSL amounts, which are found to accumulate at even higher levels, and up to 27 times the levels produced amount during winter and 16 times the produced amount in summer, the latter being comparable to October levels under current conditions. Minimum levels are also raised compared to current conditions. Timings were found to be affected by seasonal differences, as observed for the current conditions.These results highlight the substantial impact of climate change on the dynamics of AHLs like C6-HSL which far exceed naturally occurring variation found in current conditions.
4 Discussion
The key purpose of this study was to investigate theoretically how the degradation of AHLs is affected by abiotic environmental changes. We established a numerical relationship between pH and AHL hydrolysis rate/half-life time and calculated temperature coefficients for all relevant conditions based on collated published data. By comparing the impact of pH and temperature on AHL concentration individually and combined at different timescales, this study reveals that natural daily and seasonal, as well as projected climate change associated abiotic changes, all have the potential to considerably influence the dynamics of AHLs in biofilms and thus impact biofilm form and function.
4.1 The Daily Rhythm of AHL Dynamics Driven by pH and the Importance of Other Influencing Factors
Within a daily timeframe, a cycle of accumulation and degradation of AHLs occurs in a rhythmic pattern arising from the impact of the natural pH fluctuations inside the biofilm, based on the hydrolysis rate. Higher pH in the afternoon, thought to be caused by the photosynthetic activity of biofilm-associated phototrophic organisms (Decho et al., 2009), leads to a sharp increase in the hydrolysis rate and in turn to an up to 3 times faster degradation of the AHL molecules (Figures 5D-F). This pH-driven dynamics can be enhanced or reduced to a small extent by temperature (Figure 7). Declining pH during hours with little or no light, and hence little photosynthetic activity within the biofilm, slows down the hydrolysis rates and results in much longer half-live times of the AHL molecules during the early hours prior to sunrise (Figures 5B, C). AHL concentrations reach their peak in the late morning and their lowest level in the late afternoon (Figures 5F, G). This dynamic does not directly mirror the timing of lowest and highest pH, but the highly increased hydrolysis rate at peak pH diminishes the available AHLs very quickly so that the lowest AHL concentrations occur shortly after the pH maximum.
To validate our theoretical results, we compared the difference in concentration of C8-AHL between 6 am and 5 pm, the times when actual measurements were taken by Decho et al. (2009). They analytically determined the C8-AHL concentration in the morning to be 6.5±0.8 ppb, 1.8 times (±0.5) higher than in the afternoon (3.6±0.9 ppb) (Decho et al., 2009). Our calculations yield a 5.3-times higher concentration in the morning than in the evening for the same times, exceeding the experimental results approximately 2-fold. There are a number of potential reasons for this theoretical overestimation of the AHL difference in our approach: inconsistent AHL production, deviations of the dynamics-determining parameters, and additional AHL degradation through other mechanisms. Firstly, for our calculation we assumed a consistent level of AHL production throughout the day. It is, however, likely that AHL production and excretion by bacteria occur inconsistently and locally (Decho and Gutierrez, 2017) as it forms part of their cell-cell communication. This may vary across a daily cycle and is known to potentially depend on other internal and external factors, such as cell density and distribution, composition and physical characteristics of the surrounding medium, available carbon sources and oxygen limitation amongst many others (Boyer and Wisniewski-Dyé, 2009). Infrequent production would cause a reduced amount of accumulating AHLs and therefore a smaller difference. Secondly, less pronounced dynamics of AHLs in nature could also be caused through deviations from the parameters used in our calculations, particularly the hydrolysis rate. An underestimation of the naturally occurring hydrolysis rate could have caused the greater amounts of AHLs accumulating in our calculations. The hydrolysis rate we employ is based on an averaged value derived from abiotic laboratory experiments published by Decho et al. (2009) and Ziegler et al. (2019). This rate does not take into account any naturally occurring temperature fluctuations, which might have influenced the natural hydrolysis and hence analytically measured AHL concentrations. Unlike for pH, temperature fluctuations were not quantified and reported across the daily timeframe for the experimental data, limiting our possibility to take them into account in this calculation used for comparison. The laboratory experiments underlying the hydrolysis rate were further conducted with different chemical methods (extraction + GC/MS vs. NMR), which is why we combined and averaged the respective results for a more representative rate. It might be that the slightly faster rates determined using GC/MS (Decho et al., 2009) are closer to those in the field compared to the rates obtained through NMR measurements in D2O and subsequent conversion (Ziegler et al., 2019) (see Table 1 for comparison). It is, however, interesting to note that other experiments aiming to identify degradation rates of AHLs in seawater found significantly lower rates (Hmelo and Van Mooy, 2009; Tait and Havenhand, 2013). Tait and Havenhand (2013) determined the degradation of C6-HSL and C8-HSL in seawater at 18°C to be 1.5 (±0.2)%/hour and 1.0 (±0.5)%/hour, respectively. These rates are by a factor of 6 to 7 slower than those reported by Decho and coworkers for pH 8.2, but similar to those reported by Hmelo and Van Mooy (2009) (pH 7.9), who suggest that AHL degradation in seawater might be slower than in non-marine media. An underestimation of the hydrolysis rate in our approach is therefore unlikely to explain the discrepancies between our calculated difference and the naturally observed difference. Thirdly, the detectable amount of AHL and its accumulation could be affected by other diminishing factors such as leaking of AHL from the biofilm, enzymatic AHL degradation or metabolisation by other organisms (Lami, 2019). This additional loss could account for the 66% smaller AHL difference observed in nature compared to our calculated result. While leaking can be expected to be comparably low due to the protective EPS matrix of natural biofilms (Boyer and Wisniewski-Dyé, 2009), it does occur to some extent (Tait et al., 2005) as evidenced by several AHL-induced interactions with settling macro-organisms (see Tait and Havenhand (2013) and Lami (2019) for overview). These interactions require sensing of AHLs by the macro-organism in the water column from a distance to the biofilm. Also, AHLs with shorter chain lengths (e.g. C4, C6) are less hydrophobic and consequently diffuse more rapidly into the surrounding than longer-chain AHLs (Tait et al., 2005; Boyer and Wisniewski-Dyé, 2009). Besides leakage, biotic degradation of AHLs through enzymes is a factor that could explain a substantial part of the difference between our calculations and the experimentally determined AHL levels as it is known to play a key role in bacterial biofilms (Boyer and Wisniewski-Dyé, 2009). Hmelo and Van Mooy (2009) found 54% of C6-HSL degradation in seawater to be likely caused by enzymatic activity. Because AHLs serve as fundamental cell-cell communication in many bacteria, disruption of this communication pathway by quenching AHLs enzymatically provides competitive benefits for other bacteria and is in fact widespread (Dong and Zhang, 2005; Boyer and Wisniewski-Dyé, 2009). Two major types of AHL quenching enzymes have been described, lactonases and acylases (Grandclément et al., 2016), which hydrolyse the lactone ring (Dong et al., 2000-03-28, Dong et al., 2002) or cleave the amide bond of the AHL ‘tail’ (Lin et al., 2003), respectively. While these enzymes work across a wide range of environmental conditions (Mayer et al., 2015), some were found to follow a steep pH-dependent optimum curve (Wang et al., 2019), potentially adding to the complexity of the pH-dependent daily dynamics of AHLs.
Despite the likely influence of other AHL degrading factors in nature as shown by the direct comparison, our investigation reveals that abiotic AHL degradation through hydrolysis linked to a daily cyclic pH pattern plays an important role, yielding results in the same order of magnitude as comparable experimental measurements. Our results overestimate the difference by a factor that matches the 50 to 60% AHL observed to be lost through enzymatic degradation (Hmelo and Van Mooy, 2009). In turn, this means that abiotic hydrolysis accounts for at least 1/3 or more of the observable dynamics. For subsequent interpretation of our results, the importance of other influencing factors, however, has always to be taken into consideration. It also has to be noted that there is an apparent lack of biofilm parameters and abiotic conditions that are monitored continuously or regularly for a daily timeframe and local context, e.g. near sediment or rocky colonised surfaces. We therefore suggest a focus of future measurements on the daily patterns of natural pH and temperature in direct relation to AHL concentrations with hourly intervals within the natural habitat of interest, for example surface biofilms on sediment or rocky substrate.
4.2 Seasonal Impacts on AHL Dynamics Driven by Temperature
AHL hydrolysis rate and half-life time showed a clear seasonal pattern across the year with results in hydrolysis rate varying by 48% and half-life time by 57% largely due to the temperature influence. Significantly higher hydrolysis rates in spring and summer, and, in contrast, half-life time exceeding 20 hours in autumn and winter, clearly mimic the temperature pattern. The change in hydrolysis rate between winter and summer exceeds a factor of 2, suggesting that seasonal conditions impact AHL dynamics in a way that is likely reflected in the overall dynamics, despite other influences. Combining seasonal and daily fluctuations in pH and temperature revealed that seasonal differences are reflected in the daily patterns and subsequently cause a shift in the daily cycle. In summer, AHL levels accumulate to only 70% of winter levels, taking an hour longer to do so and becoming degraded within only 7 hours, so one hour quicker than in winter. In addition, maximum AHL concentration in summer is reached two hours earlier in the day than in winter, shifting the timing of the cycle.
Our calculations for combined seasonal and daily dynamics assume a direct translation and addition of external conditions to the internal conditions within the biofilm. This means that external temperature was assumed to represent biofilm temperature and the external pH at any given date was used as the midline point for the biofilm-internal pH curve modelled with an amplitude of 1.3 across the day based on Decho et al. (2009). External pH and temperature changes might, however, be compensated by the biofilm-surrounding chemical matrix of EPS, which is assumed to buffer pH fluctuations (de Carvalho, 2018) and extreme temperatures (van der Merwe et al., 2009). To what extent biofilms are able to actually compensate external abiotic conditions, however, is currently poorly understood and requires dedicated experiments, which simultaneously and systematically measure external and internal pH and temperature gradients in situ. Due to the afore mentioned other influencing factors, small seasonal differences indicated in our calculations need to be interpreted with caution. In a recent field study assessing the concentration of C8, C10 and C12-HSL in surface sediment of an intertidal mudflat, Stock et al. (2021) found AHL concentrations in samples from February and April to not differ significantly. This contrasts the small but significant theoretical increase in average hydrolysis rate we obtained for April compared to February based on the data for the Humber estuary assuming similar seasonal patterns of both estuaries. Similar AHL levels for February and April further fits with the very similar daily hydrolysis rate profiles we obtained. To actually assess season-dependent AHL dynamics, further sampling over the summer, autumn and winter months would be required. The substantial differences between summer and winter we obtained, however, do suggest the potential for significant dynamics differences between these two seasons.
4.3 pH and Temperature as Combined Factors - Enhancing or Compensating Effects Depend on the Timeframe
While changes in pH dominate AHL dynamics within a daily timeframe, we observed temperature to particularly influence AHL degradation patterns in a seasonal context. Depending of the combination of these two factors, however, the hydrolysis rate can be sped up or slowed down. An increase in temperature increases the hydrolysis rate (Yates et al., 2002). Higher pH also leads to a higher hydrolysis rate (Decho et al., 2009; Ziegler et al., 2019). Highest hydrolysis rates and consequently fastest degradation of AHLs can therefore be expected in the late afternoon and early evening during the summer months. In contrast, lowest hydrolysis rates and almost no degradation can be assumed for night and early hours in winter. These patterns can be observed as expected from our calculations of daily hydrolysis rates for each month (Figure 7). The combined effect of temperature and pH is therefore clearly time-dependent on a daily and seasonal scale due to the corresponding natural fluctuations.
Climate change is predicted to result in higher temperatures and lower pH conditions (IPCC, 2019). The temperature-associated increase in hydrolysis rate is opposed by a pH-related reduction, which might result in effects cancelling each other out. However, our results reveal that the effect of pH exceeds the effect of temperature, resulting in a clear reduction in AHL hydrolysis and hence increased AHL concentrations for any of the future scenarios calculated.
4.4 Climate Change Impacts - Small Average Changes in the Context of Large Natural Abiotic Fluctuations Do Matter for AHL Dynamics
Looking at the impact of predicted average climate change related reduction in ocean pH and increase in sea surface temperature revealed an overall decrease in the hydrolysis rate of C6- and C8-AHLs in future oceans. This results in higher levels of the AHLs being present for longer in the environment (Figure 4). Combining daily, seasonal and future parameters also clearly indicates the impact on AHL dynamics across these different timescales (Figure 8). Future average changes in temperature and pH might seem small compared to the natural range of these parameters (+4°C compared to a natural seasonal temperature range of 13°C (31%), -0.4 pH compared to a daily pH range of 2.6 (15%)). But, while reflecting the daily and seasonal patterns, the future scenario results in even higher levels of C6-HSL, reaching more than 1.4 times the levels present under current conditions, and causes levels to never fall below current October levels by exceeding current winter levels by more than 30%.
The buffering of external conditions by the biofilm discussed previously and potential limitations due to our assumption of a direct translation of external factors to biofilm-internal conditions also apply in the context of future conditions. We further applied the projected average future changes in pH and temperature directly to the current natural ranges, resulting in a shifted range. An increasing number of studies, however, indicates that pH conditions are not only expected to shift but also considerably increase in variability (Takeshita et al., 2015), emphasizing pH extremes. In addition, marine heatwaves are predicted to become more frequent and last longer (IPCC, 2019). Our results might therefore simplify and potentially underestimate the influence of future ocean conditions.
4.5 Applicability of Results to Other AHLs
We focused in this study on C6 and C8-HSL due to their documented presence and functions in marine biofilms (Dobretsov et al., 2009; Decho et al., 2009; Stock et al., 2021) and the availability of sufficient data to determine pH and temperature impacts numerically. It is, however, important to note that the hydrolysis rate and the extent of pH and temperature influence depend on the chain-length of the AHL (Yates et al., 2002; Decho et al., 2009; Ziegler et al., 2019), which is also reflected in our results (Tables 1, 2). Shorter chain AHLs, namely C4 and C6-HSL, degrade faster with higher hydrolysis rates than AHLs with side chains of 8 or more carbons (Yates et al., 2002; Boyer and Wisniewski-Dyé, 2009; Decho et al., 2009). AHLs with a 3-oxo substitution, in contrast, degrade faster than their unsubstituted counterparts (Yates et al., 2002; Hmelo and Van Mooy, 2009) due to an additional abiotic degradation pathway via a Claisen-like condensation to tetramic acids (Kaufmann et al., 2005). For long-chain AHLs with longer half-life times, it can therefore be assumed that abiotic hydrolysis plays a minor role in signal termination and that most of these signals are degraded through enzymes to ensure termination of the signal within a relevant time frame. The impact of fluctuating conditions and the resulting daily and seasonal dynamics shown here for C6 and C8-HSL may therefore not be as pronounced for longer-chain AHLs. But impacts of pH and temperature might be indirectly reflected in AHL concentrations as they might influence the kinetics of degrading enzymes (Wang et al., 2019). AHL-quenching enzymes AiiA & Est isolated from a Altererythrobacter sp. strain from a marine beach (Red Sea) were found to actively cleave 3-oxo-C12-HSL in pH conditions between pH 5-10 or pH7 to >10, respectively (Wang et al., 2019). However, optimum quenching activity was reached at pH 8 or 9 with significant reductions in activity for pH <8 (Wang et al., 2019). A reduction by on average 0.4 pH units with ocean acidification could result in approx. 25% reduction in enzyme activity based on extrapolation of the data by Wang et al. (2019). This adds another layer of complexity by potentially enhancing the observed higher AHL concentrations in future conditions due to reduced quenching. Interestingly, our results also reveal that the extent by which future conditions affect the abiotic hydrolysis rate or half-life time increases with increasing chain length (see Figure 4). This is likely caused by the reduced compensating impact of the temperature influence on the hydrolysis rate (less acceleration) in relation to the impact of pH (reduces k), as longer AHLs are also less sensitive to elevated temperatures (Yates et al., 2002; Boyer and Wisniewski-Dyé, 2009). This results in a greater increase in concentration of AHLs with longer chains compared to shorter chain ones subjected to the same pH change. To more conclusively understand and estimate the impact of future conditions as well as natural fluctuations on AHL dynamics across the range of chain lengths and un-/substituted molecules, measurements of abiotic and biotic degradation under set environmental parameters need to be conducted.
4.6 Biological and Wider Implications of AHL Dynamics in Current and Future Oceans
In the context of the substantial current fluctuations in AHL concentrations on daily and seasonal timescales, the impact of future ocean conditions shown in our results poses the question how an overall increase in concentrations and a change in timing of the AHL peak may affect marine, coastal and estuarine biofilms and their functioning.
For bacteria-bacteria interactions, the AHL communication system is finely tuned with AHL threshold concentrations for bacterial growth and adhesion ranging from 10 ng/L to 10 μg/L (0.5-0.3 pM to nM) depending on biofilm composition and bacteria (Wang et al., 2021). If higher AHL concentrations will prevail for longer in future conditions, as suggested by our results, bacteria would benefit, because less of the respective AHL needs to be produced to achieve the same threshold within the same timeframe. Likewise, if production remains unchanged, threshold concentrations would be reached faster or with a lower cell density, and the signal would be able to travel for a longer distance from the source (Hmelo and Van Mooy, 2009), making AHL-signalling more efficient. These potential impacts of future conditions were also hypothesised Hmelo (2017). The enhanced longevity of AHL signals might boost biofilm formation, biofilm growth through enhanced bacterial cell growth and replication, and bacterial EPS and enzyme production (Dobretsov et al., 2009; Hmelo, 2017). The range of the daily dynamics of C6 and C8-AHL in our study exceeds a factor of 10, which is even further enhanced in future conditions. Assuming that bacteria operate close to their concentration thresholds to maintain meaningful signalling, the daily cycle could lead to times during which AHL-signalling is facilitated (night and early morning) or prevented (afternoon) due to the conditions within the biofilm caused by the autotrophic co-habiting organisms. It has to be taken into account that increased levels in AHLs could be counteracted through an increase in populations of organisms that are able to quench AHL signalling, such as Shewanella spp. (Tait et al., 2009), but increasing AHL concentrations were previously found to not spark a higher rate of quorum quenching per se (Ma et al., 2018). A similar conclusion on the possibility of AHLs being involved in the timing of interactions was also reached by Decho et al. (2009), Hmelo (2017) and Decho et al. (2011), with the latter establishing natural concentration differences across the daily cycle close to threshold concentrations in a range of 13 pmol/g dry sediment for C8-HSL and 3.8 nmol/g dry sediment for C10-HSL. However, the shift to the cycle’s timing by an hour due to future conditions, as identified in our study, would likely have very limited impact, given that the current natural seasonal changes affect peak AHL times by up to two hours as discussed above.
Apart from enhancing the bacteria-bacteria interactions, higher and more stable AHL concentrations would also impact other interactions of importance in a biofilm context. Greater signalling power of C10-AHL, for example, could boost the formation of diatom-biofilms, as it has been shown to promote chlorophyll a concentrations and diatom-derived EPS production (Yang et al., 2016a). But threshold concentrations required to trigger increased carbohydrate levels in diatom biofilms (0.1 mg/L; 0.4 μM) or enhanced diatom growth (1 mg/L; 4 μM) are an order of magnitude higher than concentrations triggering bacteria-bacteria interactions (Yang et al., 2016a; Wang et al., 2021). With our results suggesting a maximum increase of AHL concentration by approx. 20%, it is likely that these changes due to future ocean conditions alone will not impact these interactions substantially. However, they might enhance AHL accumulation at key times within the daily and seasonal cycles and thereby act synergistically to considerably strengthen and/or prolong the signal. The same applies for interactions with macro-organisms. Concentrations of around 5 μM necessary to induce the settlement of cypris larvae of Balanus improvisus (Tait and Havenhand, 2013) and more than 100 μM to trigger exploratory behaviour of the polychaete H. elegans (Huang et al., 2007) might be exceeded earlier, at a lower bacteria density or reach further into the water column and hence trigger more settlement of macro-organisms due to signal enhancement through future conditions.
Future prolongation of signal life-span might, however, also pose issues: the short chain AHLs used as a form of short-messaging system in bacterial biofilms (Boyer and Wisniewski-Dyé, 2009; Hmelo, 2017) would not degrade as readily under future conditions and hence become less suitable for instant messaging. This might also affect the ratio of short- and long-chain AHLs in mixtures, which is hypothesised to play a role in complex settlement interactions with zoospores (Tait et al., 2009). Due to their important role in the establishment of biofouling communities, higher AHL concentrations sustained for longer might also make biofouling of surfaces more common (Dobretsov et al., 2009; Hmelo, 2017).
Signalling via AHLs is involved in fundamental biogeochemical and ecological processes in marine ecosystems, such as the remineralisation, dissolution or disaggregation of sinking particulate organic carbon, nutrient cycling, initial colonisation of surfaces and settlement of marine organisms (see Hmelo (2017) for an overview). Changes to these processes would be of global significance. And we hypothesise that there is another fundamental ecosystem service likely to be affected by changes to AHL dynamics: biologically-mediated sediment stabilisation. Marine biofilms, in particular the EPS they produce, and the presence of vegetation and/or bioturbating organisms have been established as key factors in sediment stabilisation within coastal and especially tidal marine ecosystems and estuaries, such as saltmarsh and mudflat habitats (Redzuan and Milow, 2019). AHLs are known to be of great importance in mediating biofilm communities, for example by inducing growth of diatoms (Yang et al., 2016a) or boosting EPS production (Yang et al., 2016b), and mediate the interactions with associated organisms like macroalgae (Tait et al., 2005) and bioturbating worms (Huang et al., 2007). We therefore suggest that AHLs could be crucial mediators and quantitative changes to AHL concentrations can affect the sediment stability and thus highlight the need for more work to fully explore these important impacts.
5 Conclusion
Our study reveals that pH- and temperature-dependent abiotic hydrolysis of the key bacterial chemical signal class of AHLs leads to substantial theoretical dynamics of these important chemical signals in biofilms across daily and seasonal timescales. The work additionally highlights how these variations are amplified by a switch to projected future conditions caused by climate change. Our results indicate the importance of these abiotic drivers in the context of current natural fluctuations and other biotic influences on the AHL dynamics, showing that future ocean conditions likely result in higher AHL concentrations being present for longer, but within similar daily and seasonal cycles. The chemical dynamics of AHLs on different timescales could lead to changes in the timing of AHL-mediated processes and associated behaviours like the settlement of micro- and macro-fouling organisms. Future changes might not only enhance settlement, but also increase sediment stability by impacting estuarine biofilms. However, more detailed studies on the buffering capacity of biofilms with regards to external conditions on daily and seasonal timescales need to be conducted. The natural dynamics and importance of enzymatic degradation and other quorum quenching mechanisms in relation to abiotic hydrolytic degradation in intertidal and estuarine biofilms need to be established for the full range of relevant AHLs with different chain lengths that are present in those biofilms. Direct links between AHLs and sediment stability due to cohesion through biofilms remain to be established.
Funding
This work was funded by ERC-2016-COG GEOSTICK (Project ID: 725955) and CCR acknowledges funding through a University of Hull Vice-Chancellor Research Fellowship.
Publisher’s Note
All claims expressed in this article are solely those of the authors and do not necessarily represent those of their affiliated organizations, or those of the publisher, the editors and the reviewers. Any product that may be evaluated in this article, or claim that may be made by its manufacturer, is not guaranteed or endorsed by the publisher.
Statements
Data availability statement
The original contributions presented in the study are included in the article/Supplementary Material. Further inquiries can be directed to the corresponding authors.
Author contributions
CR and DP derived the idea, CR collated the data, conducted the modelling and wrote the first draft, CR and DP both contributed to the review of the final version.
Conflict of interest
The authors declare that the research was conducted in the absence of any commercial or financial relationships that could be construed as a potential conflict of interest.
Supplementary material
The Supplementary Material for this article can be found online at:
https://www.frontiersin.org/articles/10.3389/fmars.2022.882428/full#supplementary-material
References
1
Anderson R. O. (2016). Marine and Estuarine Natural Microbial Biofilms: Ecological and Biogeochemical Dimensions. AIMS Microbiol.2, 304–331. doi: 10.3934/microbiol.2016.3.304
2
Antunes J. Leão P. Vasconcelos V. (2019). Marine Biofilms: Diversity of Communities and of Chemical Cues. Environ. Microbiol. Rep.11, 287–305. doi: 10.1111/1758-2229.12694
3
Baumann H. Smith E. M. (2018). Quantifying Metabolically Driven pH and Oxygen Fluctuations in US Nearshore Habitats at Diel to Interannual Time Scales. Estuaries Coasts41, 1102–1117. doi: 10.1007/s12237-017-0321-3
4
Baumann H. Wallace R. B. Tagliaferri T. Gobler C. J. (2015). Large Natural Ph, CO2and O2 Fluctuations in a Temperate Tidal Salt Marsh on Diel, Seasonal, and Interannual Time Scales. Estuaries Coasts38, 220–231. doi: 10.1007/s12237-014-9800-y
5
Boyer M. Wisniewski-Dyé F. (2009). Cell–cell Signalling in Bacteria: Not Simply a Matter of Quorum: Cell–cell Signalling in Bacteria. FEMS Microbiol. Ecol.70, 1–19. doi: 10.1111/j.1574-6941.2009.00745.x
6
Chhabra S. Phillip B. Eberl L. Williams P. Cámara M. (2005). “Extracellular Communication in Bacteria,” in Chemistry of Pheromones and Other Semiochemicals 2. Ed. SchulzS. (Berlin: Springer), 279–315.
7
de Carvalho C. C. C. R. (2018). Marine Biofilms: A Successful Microbial Strategy With Economic Implications. Front. Mar. Sci.5. doi: 10.3389/fmars.2018.00126
8
Decho A. W. (2000). Microbial Biofilms in Intertidal Systems: An Overview. Continental Shelf Res.20, 1257–1273. doi: 10.1016/S0278-4343(00)00022-4
9
Decho A. W. Frey R. L. Ferry J. L. (2011). Chemical Challenges to Bacterial AHL Signaling in the Environment. Chem. Rev.111, 86–99. doi: 10.1021/cr100311q
10
Decho A. W. Gutierrez T. (2017). Microbial Extracellular Polymeric Substances (EPSs) in Ocean Systems. Front. Microbiol.8. doi: 10.3389/fmicb.2017.00922
11
Decho A. W. Visscher P. T. Ferry J. Kawaguchi T. He L. Przekop K. M. et al . (2009). Autoinducers Extracted From Microbial Mats Reveal a Surprising Diversity of N -Acylhomoserine Lactones (AHLs) and Abundance Changes That may Relate to Diel pH. Environ. Microbiol.11, 409–420. doi: 10.1111/j.1462-2920.2008.01780.x
12
Dobretsov S. Teplitski M. Paul V. (2009). Mini-Review: Quorum Sensing in the Marine Environment and Its Relationship to Biofouling. Biofouling25, 413–427. doi: 10.1080/08927010902853516
13
Dong Y.-H. Gusti A. R. Zhang Q. Xu J.-L. Zhang L.-H. (2002). Identification of Quorum-Quenching N -Acyl Homoserine Lactonases From Bacillus Species. Appl. Environ. Microbiol.68, 1754–1759. doi: 10.1128/AEM.68.4.1754-1759.2002
14
Dong Y.-H. Xu J.-L. Li X.-Z. Zhang L.-H. (2000). AiiA, an Enzyme That Inactivates the Acylhomoserine Lactone Quorum-Sensing Signal and Attenuates the Virulence of Erwinia Carotovora. Proc. Natl. Acad. Sci.97, 3526–3531. doi: 10.1073/pnas.060023897
15
Dong Y.-H. Zhang L.-H. (2005). Quorum Sensing and Quorum-Quenching Enzymes. J. Microbiol.43, 101–109.
16
Gómez-Bombarelli R. Calle E. Casado J. (2013). Mechanisms of Lactone Hydrolysis in Neutral and Alkaline Conditions. J. Organic Chem.78, 6868–6879. doi: 10.1021/jo400258w
17
Gram L. Grossart H.-P. Schlingloff A. Kiørboe T. (2002). Possible Quorum Sensing in Marine Snow Bacteria: Production of Acylated Homoserine Lactones by Roseobacter Strains Isolated From Marine Snow. Appl. Environ. Microbiol.68, 4111–4116. doi: 10.1128/AEM.68.8.4111-4116.2002
18
Grandclément C. Tannières M. Moréra S. Dessaux Y. Faure D. (2016). Quorum Quenching: Role in Nature and Applied Developments. FEMS Microbiol. Rev.40, 86–116. doi: 10.1093/femsre/fuv038
19
Hmelo L. R. (2017). Quorum Sensing in Marine Microbial Environments. Annu. Rev. Mar. Sci.9, 257–281. doi: 10.1146/annurev-marine-010816-060656
20
Hmelo L. Van Mooy B. (2009). Kinetic Constraints on Acylated Homoserine Lactone-Based Quorum Sensing in Marine Environments. Aquat. Microbial Ecol.54, 127–133. doi: 10.3354/ame01261
21
Huang Y.-L. Dobretsov S. Ki J.-S. Yang L.-H. Qian P.-Y. (2007). Presence of Acyl-Homoserine Lactone in Subtidal Biofilm and the Implication in Larval Behavioral Response in the Polychaete Hydroides Elegans. Microbial Ecol.54, 384–392. doi: 10.1007/s00248-007-9210-9
22
IPCC , 2019: IPCC Special Report on the Ocean and Cryosphere in a Changing Climate [ PörtnerH.-O.RobertsD.C.Masson-DelmotteV.ZhaiP.TignorM.PoloczanskaE.MintenbeckK.AlegríaA.NicolaiM.OkemA.PetzoldJ.RamaB.WeyerN.M. (eds.)].
23
Joint I. (2002). Cell-To-Cell Communication Across the Prokaryote-Eukaryote Boundary. Science298, 1207–1207. doi: 10.1126/science.1077075
24
Joint I. Tait K. Wheeler G. (2007). Cross-Kingdom Signalling: Exploitation of Bacterial Quorum Sensing Molecules by the Green Seaweed Ulva. Philos. Trans. R. Soc. B: Biol. Sci.362, 1223–1233. doi: 10.1098/rstb.2007.2047
25
Kaufmann G. F. Sartorio R. Lee S.-H. Rogers C. J. Meijler M. M. Moss J. A. et al . (2005). Revisiting Quorum Sensing: Discovery of Additional Chemical and Biological Functions for 3-Oxo-N-Acylhomoserine Lactones. Proc. Natl. Acad. Sci.102, 309–314. doi: 10.1073/pnas.0408639102
26
Lami R. (2019). “Quorum Sensing in Marine Biofilms and Environments,” in Quorum Sensing (London: Elsevier), 55–96. doi: 10.1016/B978-0-12-814905-8.00003-4
27
Larsson A. I. Granhag L. M. Jonsson P. R. (2016) Instantaneous Flow Structures and Opportunities for Larval Settlement: Barnacle Larvae Swim to Settle. PLoS ONE11(7): e0158957. doi: 10.1371/journal.pone.0158957
28
Lin Y.-H. Xu J.-L. Hu J. Wang L.-H. Ong S. L. Leadbetter J. R. et al . (2003). Acyl-Homoserine Lactone Acylase From Ralstonia Strain XJ12b Represents a Novel and Potent Class of Quorum-Quenching Enzymes: Quorum-Quenching AHL-Acylase. Mol. Microbiol.47, 849–860. doi: 10.1046/j.1365-2958.2003.03351.x
29
Ma H. Ma S. Hu H. Ding L. Ren H. (2018). The Biological Role of N-Acyl-Homoserine Lactone-Based Quorum Sensing (QS) in EPS Production and Microbial Community Assembly During Anaerobic Granulation Process. Sci. Rep.8. doi: 10.1038/s41598-018-34183-3
30
Mayer C. Romero M. Muras A. Otero A. (2015). Aii20j, a Wide-Spectrum Thermostable N-Acylhomoserine Lactonase From the Marine Bacterium Tenacibaculum Sp. 20j, can Quench AHL-Mediated Acid Resistance in Escherichia Coli. Appl. Microbiol. Biotechnol.99, 9523–9539. doi: 10.1007/s00253-015-6741-8
31
NOAA (2020). State of the Climate: Global Climate Report for Annual 2019 ( National Centers for Environmental Information (NCEI). Available at: https://www.ncdc.noaa.gov/sotc/global/201913.
32
Porteus C. S. Hubbard P. C. Uren Webster T. M. van Aerle R. Canário A. V. M. Santos E. M. et al . (2018). Near-Future CO2 Levels Impair the Olfactory System of a Marine Fish. Nat. Climate Change8, 737–743. doi: 10.1038/s41558-018-0224-8
33
Redzuan N. S. Milow P. (2019). The Potential of Microphytobenthos in Sediment Biostabilisation of Aquatic Ecosystems: An Overview. Aquaculture, Aquarium, Conservation and Legislation, 12(3), 748–755
34
Roggatz C. C. Fletcher N. Benoit D. M. Algar A. C. Doroff A. Wright B. et al . (2019). Saxitoxin and Tetrodotoxin Bioavailability Increases in Future Oceans. Nat. Climate Change9, 840–844. doi: 10.1038/s41558-019-0589-3
35
Roggatz C. C. Lorch M. Hardege J. D. Benoit D. M. (2016). Ocean Acidification Affects Marine Chemical Communication by Changing Structure and Function of Peptide Signalling Molecules. Global Change Biol.22, 3914–3926. doi: 10.1111/gcb.13354
36
Stock F. Cirri E. Nuwanthi S. G. L. I. Stock W. Ueberschaar N. Mangelinckx S. et al . (2021). Sampling, Separation, and Quantification of N -Acyl Homoserine Lactones From Marine Intertidal Sediments. Limnol. Oceanogr.: Methods19, 145–157. doi: 10.1002/lom3.10412
37
Tait K. Havenhand J. (2013). Investigating a Possible Role for the Bacterial Signal Molecules N-Acylhomoserine Lactones in Balanus Improvisus Cyprid Settlement. Mol. Ecol.22, 2588–2602. doi: 10.1111/mec.12273
38
Tait K. Joint I. Daykin M. Milton D. L. Williams P. Camara M. (2005). Disruption of Quorum Sensing in Seawater Abolishes Attraction of Zoospores of the Green Alga Ulva to Bacterial Biofilms. Environ. Microbiol.7, 229–240. doi: 10.1111/j.1462-2920.2004.00706.x
39
Tait K. Williamson H. Atkinson S. Williams P. Cámara M. Joint I. (2009). Turnover of Quorum Sensing Signal Molecules Modulates Cross-Kingdom Signalling. Environ. Microbiol.11, 1792–1802. doi: 10.1111/j.1462-2920.2009.01904.x
40
Takeshita Y. Frieder C. A. Martz T. R. Ballard J. R. Feely R. A. Kram S. et al . (2015). Including High-Frequency Variability in Coastal Ocean Acidification Projections. Biogeosciences12, 5853–5870. doi: 10.5194/bg-12-5853-2015
41
van der Merwe P. Lannuzel D. Nichols C. M. Meiners K. Heil P. Norman L. et al . (2009). Biogeochemical Observations During the Winter–Spring Transition in East Antarctic Sea Ice: Evidence of Iron and Exopolysaccharide Controls. Mar. Chem.115, 163–175. doi: 10.1016/j.marchem.2009.08.001
42
Velez Z. Roggatz C. C. Benoit D. M. Hardege J. D. Hubbard P. C. (2019). Short- and Medium-Term Exposure to Ocean Acidification Reduces Olfactory Sensitivity in Gilthead Seabream. Front. Physiol.10. doi: 10.3389/fphys.2019.00731
43
Wang H. Hagemann A. Reitan K. I. Handå A. Uhre M. Malzahn A. M. (2020) Embryonic and larval development in the semelparous Nereid polychaete Hediste diversicolor (OF Müller, 1776) in Norway: Challenges and perspectives. Aquaculture Research. 2020;51, 4135–4151. doi: 10.1111/are.14756
44
Wang T.-N. Guan Q.-T. Pain A. Kaksonen A. H. Hong P.-Y. (2019). Discovering, Characterizing, and Applying Acyl Homoserine Lactone-Quenching Enzymes to Mitigate Microbe-Associated Problems Under Saline Conditions. Front. Microbiol.10. doi: 10.3389/fmicb.2019.00823
45
Wang J. Liu Q. Dong D. Hu H. Wu B. Ren H. (2021). AHLs-Mediated Quorum Sensing Threshold and its Response Towards Initial Adhesion of Wastewater Biofilms. Water Res.194, 116925. doi: 10.1016/j.watres.2021.116925
46
Williams P. (2007). Quorum Sensing, Communication and Cross-Kingdom Signalling in the Bacterial World. Microbiology153, 3923–3938. doi: 10.1099/mic.0.2007/012856-0
47
Yang C. Fang S. Chen D. Wang J. Liu F. Xia C. (2016a). The Possible Role of Bacterial Signal Molecules N-Acyl Homoserine Lactones in the Formation of Diatom-Biofilm (Cylindrotheca Sp.). Mar. pollut. Bull.107, 118–124. doi: 10.1016/j.marpolbul.2016.04.010
48
Yang J. Wu D. Li A. Guo H. Chen H. Pi S. et al . (2016b). The Addition of N-Hexanoyl-Homoserine Lactone to Improve the Microbial Flocculant Production of Agrobacterium Tumefaciens Strain F2, an Exopolysaccharide Bioflocculant-Producing Bacterium. Appl. Biochem. Biotechnol.179, 728–739. doi: 10.1007/s12010-016-2027-6
49
Yates E. A. Philipp B. Buckley C. Atkinson S. Chhabra S. R. Sockett R. E. et al . (2002). N-Acylhomoserine Lactones Undergo Lactonolysis in a pH-, Temperature-, and Acyl Chain Length-Dependent Manner During Growth of Yersinia Pseudotuberculosis and Pseudomonas Aeruginosa. Infection Immun.70, 5635–5646. doi: 10.1128/IAI.70.10.5635-5646.2002
50
Ziegler E. W. Brown A. B. Nesnas N. Palmer A. G. (2019). Abiotic Hydrolysis Kinetics of N-Acyl-L-Homoserine Lactones: Natural Silencing of Bacterial Quorum Sensing Signals. Eur. J. Organic Chem.2019, 2850–2856. doi: 10.1002/ejoc.201900322
Summary
Keywords
pH-sensitive signal, quantitative assessment, environmental impact, AHL hydrolysis, biofilm, quorum sensing, cell-cell signals, chemical communication
Citation
Roggatz CC and Parsons DR (2022) Potential Climate Change Impacts on the Abiotic Degradation of Acyl-Homoserine Lactones in the Fluctuating Conditions of Marine Biofilms. Front. Mar. Sci. 9:882428. doi: 10.3389/fmars.2022.882428
Received
28 February 2022
Accepted
07 June 2022
Published
01 August 2022
Volume
9 - 2022
Edited by
Michael A. Savka, Rochester Institute of Technology, United States
Reviewed by
Anton Hartmann, Ludwig Maximilian University of Munich, Germany; Surajit Das, National Institute of Technology Rourkela, India
Updates
Copyright
© 2022 Roggatz and Parsons.
This is an open-access article distributed under the terms of the Creative Commons Attribution License (CC BY). The use, distribution or reproduction in other forums is permitted, provided the original author(s) and the copyright owner(s) are credited and that the original publication in this journal is cited, in accordance with accepted academic practice. No use, distribution or reproduction is permitted which does not comply with these terms.
*Correspondence: Christina C. Roggatz, C.Roggatz@hull.ac.uk
This article was submitted to Marine Biogeochemistry, a section of the journal Frontiers in Marine Science
Disclaimer
All claims expressed in this article are solely those of the authors and do not necessarily represent those of their affiliated organizations, or those of the publisher, the editors and the reviewers. Any product that may be evaluated in this article or claim that may be made by its manufacturer is not guaranteed or endorsed by the publisher.