Abstract
Framework-forming scleractinian cold-water corals (CWCs) act as ecosystem engineers, building and supporting biodiversity hotspots in the deep sea worldwide. While spatial patterns and drivers of species distributions have been evaluated on modern CWC reefs, little is known about how reef diversity is affected by habitat variability over geologic time – the scale at which CWC reefs initiate, thrive, and decline. Using three CWC reef sediment cores as species diversity archives, we investigated temporal trends of molluscan diversity over the last ~13 kyr from a CWC mound in the Alboran Sea (western Mediterranean Sea) to evaluate (a) how spatial patterns of CWC-associated diversity are recorded in reef sediments, (b) the potential of CWC reefs as biodiversity hotspots when coral growth is flourishing and when it is not, and (c) which palaeoceanographic conditions or habitat characteristics may be driving biodiversity. Our results reveal that at the ecosystem scale ecological differences between CWC habitats are more pronounced than ecological signatures of molluscan assemblages associated with intervals of CWC framework (flourishing growth) or non-framework (negligible CWC growth). However, within habitats, significant differences emerge between these assemblages with lower molluscan diversity associated with flourishing CWC growth. Significant negative correlations between molluscan diversity and palaeoceanographic conditions conducive for CWC growth (high food availability, strong hydrodynamics, optimal bottom-water temperatures and salinities, and high aggradation rates indicative of flourishing CWC growth also imply that CWC growth and relevant environmental conditions contribute to reduced molluscan diversity. Additionally, high coral volume, used here as a proxy for habitat structural complexity, is positively correlated with molluscan diversity just as high habitat complexity is in living CWC reefs. Altogether, these patterns detected over geologic time resemble those observed spatially across living CWC reefs today – where competition with resources, particularly food, prevents high reef biodiversity in the immediate vicinity of dense living CWC colonies. Overall, our study demonstrates that (1) ecological paradigms of living CWCs are preserved in their sedimentary record, (2) flourishing CWC growth and conditions promoting CWC growth drive habitat-scale diversity patterns, and (3) a geological approach can be applied to study long-term diversity dynamics in CWC ecosystems.
1 Introduction
From arborescent acroporid corals in tropical reefs to towering redwoods in Pacific Northwest forests, key species play significant roles in the definition and functioning of ecosystems worldwide. The decline or loss of such iconic species from their ecosystem may trigger cascading ecological effects, including changes in species interactions, biodiversity, and ecosystem function (e.g., Cramer et al., 2021; Soland et al., 2021). Like tropical reefs and redwood forests, cold-water coral (CWC) reefs in the deep sea (>200 m water depth) are considered biodiversity hotspots (Henry and Roberts, 2017). With their complex branching morphologies, framework-forming scleractinian CWCs act as ecosystem engineers, providing multiple habitats and ecological niches for a myriad of organisms from microbial life to benthic invertebrates and pelagic predators (e.g., Freiwald et al., 2004; Buhl-Mortensen et al., 2010; Henry et al., 2013; Buhl-Mortensen et al., 2017a; Buhl-Mortensen et al., 2017b; Kazanidis et al., 2021a). The demise or stagnation of a CWC reef is typically marked by a decline in coral growth, minimal to no living coral cover, and potential collapse and/or burial of the aragonitic reef structure (Roberts et al., 2006; Wienberg et al., 2010; Vad et al., 2017). The question remains whether the loss of the iconic living CWCs also equates to the loss of the reef as a biodiversity hotspot.
The biodiversity of CWC reefs spans the trophic food web and rivals that of shallow-water coral reefs (Rossi et al., 2017). The spatial distribution of species varies significantly across a CWC reefscape due to the physical zonation of reef habitats defined by variations in substrate composition and complexity as well as exposure to food-supplying currents, water depth, and ecological interactions (e.g., Henry and Roberts, 2007; Henry et al., 2010; Buhl-Mortensen et al., 2017a; Henry and Roberts, 2017; Corbera et al., 2019; Price et al., 2019). Benthic biodiversity is greatest where living coral cover is reduced and patchy due to greater availability and diversity of resources including substrate composition, benthic structure, and food sources than where living coral cover is high (Henry and Roberts, 2017; Corbera et al., 2019). Although broad spatial and short-term temporal patterns of CWC reef biodiversity have been investigated (Purser, 2015; Huvenne et al., 2016; Boolukos et al., 2019; Kazanidis et al., 2021b), little is known how diversity responds to ecosystem changes, such as the loss of living coral cover, on geologic timescales.
CWC reefs are dynamic ecosystems over both space and time. The distribution and proliferation of CWC reefs is driven by a suite of physico-chemical conditions, including seawater temperature, salinity, dissolved oxygen concentrations, and pH (Davies et al., 2008; Davies and Guinotte, 2011; Flögel et al., 2014; Büscher et al., 2017). Of further importance are the presence of geomorphological features providing substrate (e.g., submarine ridges, canyons, seamounts; Wheeler et al., 2007) and enhanced turbulence, strong bottom-water currents (Dorschel et al., 2007; Mienis et al., 2007; De Clippele et al., 2018; Juva et al., 2020), and the availability and supply of food (e.g., phytoplankton, zooplankton, particulate organic matter; Duineveld et al., 2004; Mienis et al., 2007; Davies et al., 2009). The availability and supply of food is controlled by surface and export productivity and hydrodynamic conditions (e.g., internal waves and tides, down-welling, geostrophic currents; White et al., 2005; Thiem et al., 2006; White and Dorschel, 2010).
Over millennia (or longer), CWC reefs on continental margins (~200 – 1000 m water depth) may form geobiological structures called CWC mounds that rise to a few hundreds of meters above the seafloor and span hundreds to thousands of meters in length (e.g., Kenyon et al., 2003; Mienis et al., 2006; Wheeler et al., 2007; Wienberg et al., 2018; Steinmann et al., 2020). These mounds result from the cyclic positive feedback of living branching CWCs baffling suspended sediments, which are then deposited and stabilize coral branches (Roberts et al., 2009; Wienberg and Titschack, 2017; Wang et al., 2021). The interlocking coral branch framework in turn acts to stabilize the sediments on and below the seafloor, limiting sediment mixing such as by internal waves or bioturbation. With sustained food and sediment supply promoted by strong hydrodynamics and turbulent conditions as well as adequate physico-chemical conditions, CWC mounds can develop for thousands to millions of years – recording in some cases multiple phases of coral growth and mound formation (Kano et al., 2007; Wienberg et al., 2018; Raddatz et al., 2020; Corbera et al., 2021; Fentimen et al., 2022). Consequently, CWC mounds provide an important archive to study the history of CWC reefs and their diversity.
Here, we evaluate molluscan diversity from CWC mound sediment cores in the Alboran Sea (western Mediterranean Sea) during the last ~13 kyr to (a) assess how spatial patterns of CWC reef diversity are preserved in CWC mound sediments, (b) investigate the potential of CWC reefs as biodiversity hotspots over time when coral growth is flourishing and when it is not, and (c) determine which palaeoceanographic conditions or habitat characteristics may be driving diversity. Molluscs were selected for this study because they are well-preserved in the sedimentary record, their ecological traits are relatively well known, and they are a common constituent in CWC ecosystems (Henry and Roberts, 2017; Rueda et al., 2019; Kazanidis et al., 2021b). This study provides the first quantitative, down-core ecological analysis of molluscs associated with CWC reefs and demonstrates the feasibility of a geological approach to investigate the long-term development of CWC reef biodiversity.
2 Materials and methods
2.1 Sediment core materials
The sediment cores used for this study were recovered from the East Melilla Coral Province (EMCP), one of three known CWC mound provinces in the Alboran Sea in the western Mediterranean Sea (Figure 1; Comas and Pinheiro, 2007; Lo Iacono et al., 2014; Corbera et al., 2019). In the northern EMCP, CWC mounds occur as three steep elongated coral ridges called the Brittlestar Ridges I-III that rise 50 – 150 m above the seafloor to water depths of 375 – 475 m and span up to 20 km in length (Hebbeln, 2019 and references therein). In 2009 during expedition POS 385 by the German research vessel R/V Poseidon, three on-mound gravity cores recovered material from different geomorphological settings on Brittlestar Ridge I (BRI) – GeoB13728-1, upper flank (343 m water depth); GeoB13729-1, lower flank (442 m water depth); and GeoB13730-1, mound top (338 m water depth; Figure 1B; Hebbeln et al., 2009). Each core is ~12 cm in diameter, and their lengths are 364 cm (GeoB13728-2), 447 cm (GeoB13729-1), and 434 cm (GeoB13730-1; Figure 1B). The sediment cores are composed of variable amounts of well-preserved coral fragments embedded in a homogenous, gray-brown hemipelagic clayey mud (Fink et al., 2013). CWCs are predominantly the framework-forming species Desmophyllum pertusum (recently reassigned from the genus Lophelia; Addamo et al., 2016), with lesser contributions by Madrepora oculata, Dendrophyllia spp., and the solitary coral Desmophyllum dianthus (Fink et al., 2013). An off-mound sediment core (GeoB13731-1) containing no CWC material was collected from the vicinity of BRI (Figure 1B) for the purpose of reconstructing palaeoceanographic conditions spanning the duration of the on-mound cores using conventional palaeoceanographic proxies including those for bottom-water temperature, δ18O seawater (a conventional proxy for paleosalinity; Mohtadi et al., 2014), oxygenation, hydrodynamics, and food availability (benthic foraminifera accumulation rate) (Fink et al., 2013; Portilho-Ramos et al., 2022).
Figure 1
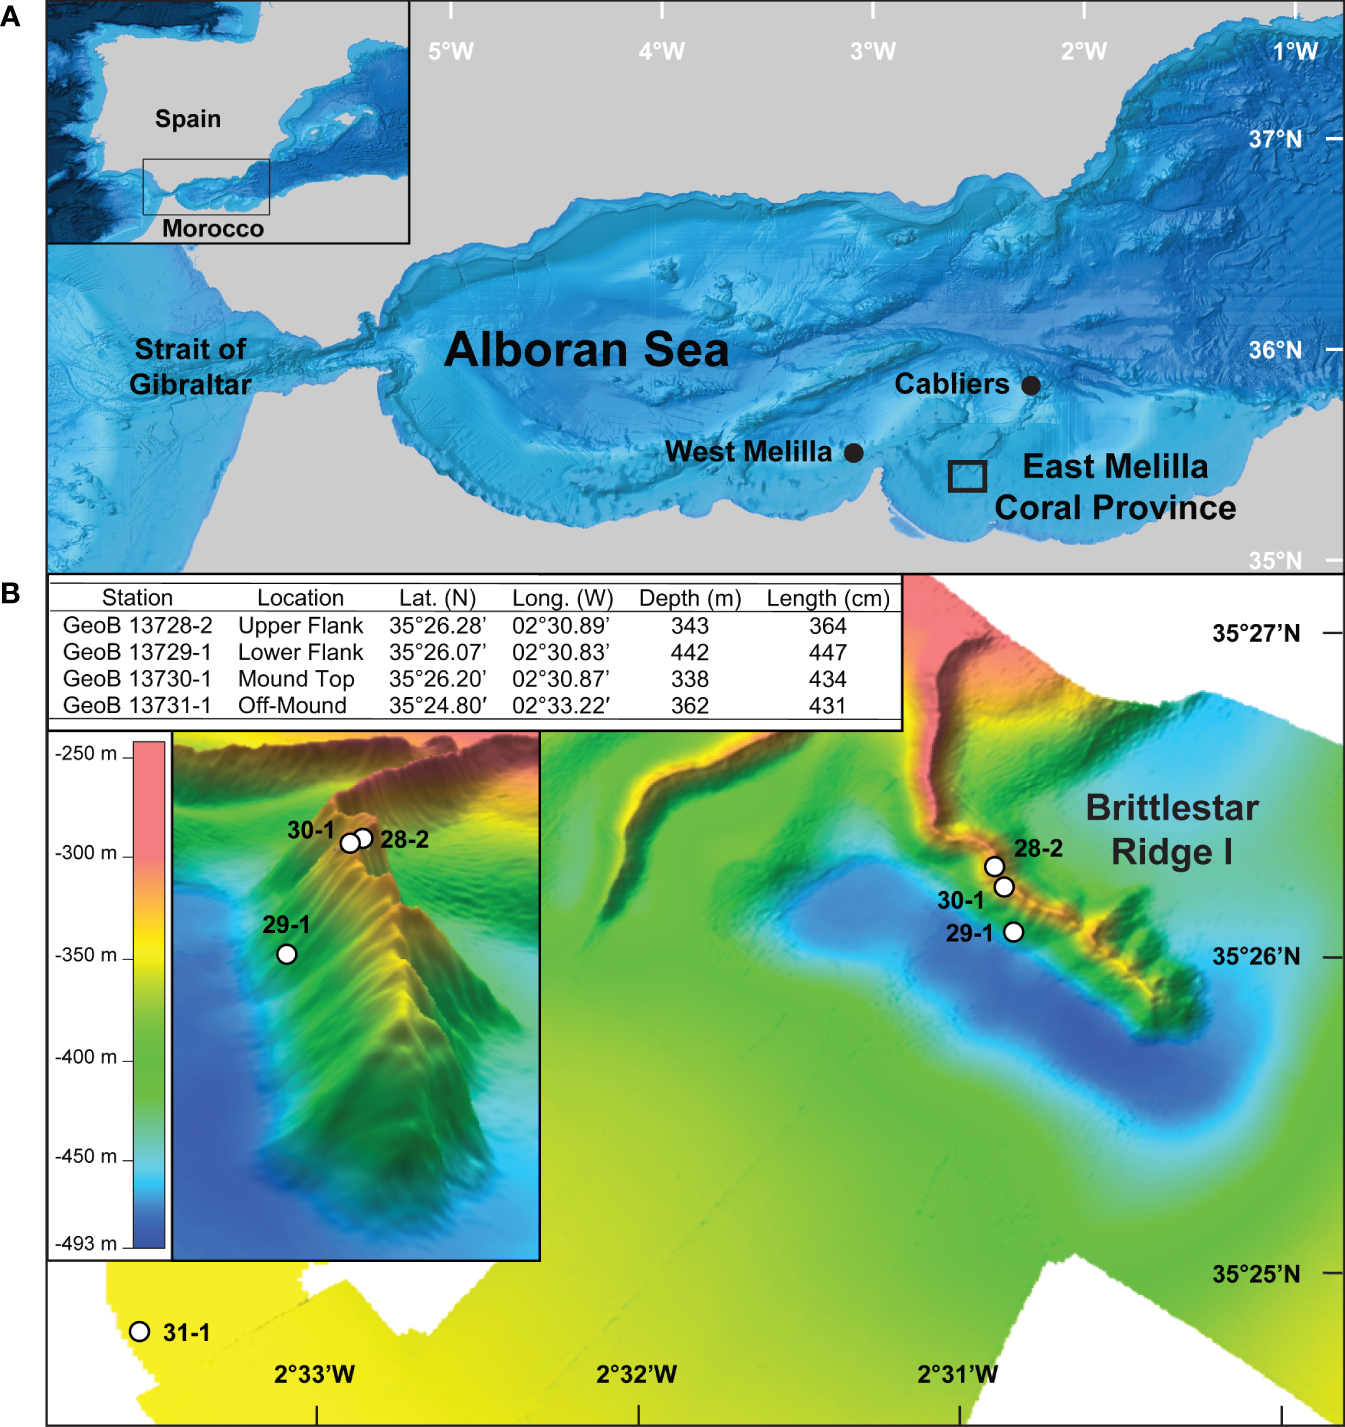
(A) Locality map of the Alboran Sea and East Melilla Coral Province as well as other known cold-water coral (CWC) mound provinces, West Melilla and Cabliers. (B) Bathymetry map of the CWC mound Brittlestar Ridge I in the East Melilla Coral Province with locations of the on-mound CWC reef sediment cores (GeoB13728-2, GeoB13729-1, and GeoB13730-1, labeled as 28-2, 29-1, and 30-1, respectively) and the off-mound sediment core (GeoB13731-1, labeled as 31-1; located in the far lower left corner) used for palaeoceanographic reconstructions (Fink et al., 2013; Portilho-Ramos et al., 2022). Inset in (B) provide core metadata and the location of the on-mound cores in profile.
2.2 CT scans
For this study, computer tomography (CT) scan data were generated for cores GeoB13728-2 and GeoB13730-1 (following Titschack et al., 2015; Titschack et al., 2016) and utilized from previous publications for core GeoB13729-1 (Titschack et al., 2016; Wang et al., 2021). CT data were used to provide greater quantitative data regarding the location, volume, size, and orientation of coral fragments in each core as well as sediment density. CT data were used to define coral preservation patterns, namely differentiating between core intervals dominated by coral framework (representing flourishing coral growth) or non-framework such as coral rubble or sediment patches (representing negligible coral growth) (Titschack et al., 2015; Titschack et al., 2016; Wang et al., 2019). The CT data also informed strategic sampling of coral fragments for age dating (e.g., where coral preservation patterns changed) and helped to refine the age models of the on-mound cores (e.g., indication of hiatuses and intervals of continuous coral growth). For further details about CT methodologies and data processing, see Figure S1.
2.3 U/Th dating
U/Th ages were obtained from 20 coral fragments (D. pertusum) among cores GeoB13728-2 and GeoB13730-1 to increase the resolution of the core chronologies previously established by a combination of AMS 14C ages and U/Th ages (Fink et al., 2013; Wang et al., 2021) and to refine the timings of flourishing coral growth (following Wienberg et al., 2018). CWC fragments were sampled at various core depths and U/Th dated according to the procedures described in detail by Wefing et al. (2017), using decay constants 2013. Coral fragments were cleaned mechanically and chemically prior to the measurements according to a procedure described by Frank et al. (2004). Sample preparation, chemical purification of the Th and U fractions, and mass spectrometric analyses were carried out at the Institute for Environmental Physics (IUP, University of Heidelberg, Germany) using a multi-collector inductivity coupled plasma mass spectrometer (ThermoFisher Neptune plus). Absolute U/Th dates were considered reliable, when measured 232Th concentrations were <10 ng/g and the initial δ234U values ranged between ±10‰ compared to the value of modern Mediterranean seawater (149.0‰; according to Border (2020) Mediterranean water masses are elevated by ~1 – 2‰ in δ234U compared to the Atlantic). AMS 14C ages (Fink et al., 2013) were re-calibrated using the CALIB8.2 software (Stuiver et al., 2021). For the calibration, we applied the MARINE20 calibration curve (Heaton et al., 2020) with a local reservoir age correction of ΔR= -90 ± 80 years accounting for a deglacial to Holocene marine reservoir age of R= 370 ± 40 years (according to Siani et al., 2000; Siani et al., 2001; Reimer and McCormac, 2002). All U/Th and AMS 14C ages are reported as kiloyears before present (kyr BP, Present = 1950 CE). Age models and mound aggradation rates were calculated for each sediment core primarily using U/Th ages and age-to-age calculation whenever coral ages were in strict chronological order.
2.4 Molluscan diversity
To evaluate molluscan diversity, bulk sediment samples of 10-cm core intervals (~565 cm3) were taken every 20 cm along the entire length of the working half of each sediment core, starting from the core top. Sediment samples were wet sieved over 2 mm, 1 mm, and 63 μm sieves. Biogenic fractions >2 mm were cleaned by sonication and included fragments and whole specimens of cold-water corals, molluscs (bivalves and gastropods), brachiopods, echinoids, barnacles, and crustaceans. The median ages of molluscan samples were determined from the age models.
All bivalve and gastropod specimens >2 mm in any dimension were identified to the lowest possible taxonomic level, typically species (Fretter and Graham, 1976; Fretter and Graham, 1977; Fretter and Graham, 1978a; Fretter and Graham, 1978b; Fretter and Graham, 1980; Fretter and Graham, 1981; Fretter and Graham, 1982; Fretter and Graham, 1984; Huber, 2010; Cossignani and Ardovini, 2011; Huber, 2015) and counted per sample. Using the minimum number of individuals (MNI) approach (Gilinsky and Bennington, 1994), a quantifiable specimen was defined as a single bivalve valve with a complete beak or gastropod with an intact apex. Bivalve abundances were halved, yielding a total number of individuals to account for that any bivalve individual could contribute two valves to the sedimentary record. To mitigate variations in sample size and varying sedimentation rates, which can influence total shell abundances, abundance data (raw counts) were converted to proportional data (relative abundance) per sample (Kidwell, 2013; Arkle and Miller, 2018). Because ecological variations may manifest in ways other than changes in species abundances, species were combined into functional trait groups according to their feeding and mobility habits. Feeding groups comprised carnivore (including corallivores and spongivores), parasite, chemosynthetic, deposit feeder, and filter (suspension) feeder. Mobility groups consisted of mobile epifauna, mobile infauna, and sessile (attached and boring) taxa.
2.5 Palaeoceanographic and habitat parameters
To investigate potential environmental drivers of molluscan diversity, we compiled two datasets – one of local palaeoceanographic parameters relevant to CWC growth and one of local habitat characteristics. The dataset of palaeoceanographic parameters was based on conventional palaeoceanographic proxies obtained from the off-mound core GeoB13731-1 recovered in close vicinity to BRI (Figure 1; Table S1; see data and methods described in detail by Fink et al., 2013; Portilho-Ramos et al., 2022). The dataset of local habitat characteristics was based on CT data obtained from all three on-mound cores (partly previously published by Titschack et al., 2016; Wang et al., 2021). The palaeoceanographic dataset was temporally correlated to the molluscan samples, and the habitat characteristics dataset was stratigraphically correlated with the molluscan samples (except for aggradation rates, which were temporally correlated) for subsequent ecological analyses. Palaeoceanographic parameters include bottom-water temperature, δ18O seawater (salinity), oxygenation, and hydrodynamics (current strength) as well as food availability interpreted from surface ocean productivity (organic matter exported to the seafloor measured as the benthic foraminifera accumulation rate, BFAR).
The dataset of habitat characteristics was calculated from the CT scan data for each of the on-mound cores (GeoB13728-2, GeoB13730-1: this study; GeoB13729-1: Titschack et al., 2016; Wang et al., 2021) and from coral ages for coral mound aggradation rates. The parameters calculated from CT scan data include coral fragment volume (as a percentage relative to the volume of sediment matrix) and the percentage of coral branch orientations divided into three categories: 0 – 30° (horizontal, indicative of coral rubble), 30 – 60° (semi-vertical, indicative of partially collapsed coral colonies), and 60 – 90° (vertical, indicative of coral growth position). Coral volume is considered here as a proxy for habitat structural complexity, which has been positively correlated with biodiversity in living CWC reefs (Price et al., 2019). The distribution of coral branch orientation is considered another measure for habitat structural complexity, with more coral branches preserved in growth position (60 – 90°) hypothesized to provide greater habitat complexity (and thereby support more diversity) than low-lying coral rubble (0 – 30°). Because CT analyses comprise coral clast data spanning 5-cm intervals (Titschack et al., 2016), coral volume and branch orientation data were extracted from the median depth within each molluscan sample. Additionally, CWC mound aggradation rates were calculated from the age models of each core to evaluate vertical mound formation, which may also influence the diversity and effect the time-averaging on molluscan data.
2.6 Numerical and statistical analyses of palaeoecological and palaeoceanographic data
To assess for ecological trends in the molluscan data within and among the cores, analyses were replicated for molluscan species, feeding groups, and mobility groups, using the total molluscan assemblage (bivalves and gastropods combined) per sample. Bivalves and gastropods could not be analyzed separately due to the small number of specimens per sample and particularly the small number of gastropods per sample. However, variations in the abundances of bivalves and gastropods in samples can be inferred from their differing feeding and mobility traits.
To determine how well local diversity is accounted for, coverage-based rarefaction curves evaluating species composition and sample size in each core were generated using the iNext package in R (Hsieh et al., 2016; Shimadzu, 2018). For ecological trends within each core, the Simpson diversity (D) index (1 – D) was calculated for all samples individually and for each core overall, with values ranging from 0 to 1 (with 0 corresponding to low diversity and 1 to high diversity; Oksanen et al., 2018). Samples within and among cores were compared using a Bray-Curtis pairwise similarity coefficient and nonparametric multidimensional scaling (nMDS) (Bray and Curtis, 1957; Clarke and Warwick, 2001). To test for significant similarities among samples, the analysis of similarity (ANOSIM) was conducted with samples grouped by core and by whether a sample corresponds with an interval of CWC framework (flourishing coral growth) or non-framework (negligible coral growth). ANOSIM R values vary from 0 (no differences among groups) to 1 (samples within a group are more similar than to those from another group; Clarke and Warwick, 2001).
To identify environmental drivers of molluscan assemblages (species, feeding, and mobility groups), we used rotational vector fitting of the described palaeoceanographic parameters (bottom-water temperature, δ18O seawater (salinity), oxygenation, and hydrodynamics and food availability) and habitat characteristic parameters (coral volume, coral branch orientation, and mound aggradation rate) datasets in combination with nMDS ordinations of the Bray-Curtis dissimilarity matrices for all samples within each core (e.g., Mihaljević et al., 2017). Before analysis, we tested for the correlations among parameters using Spearman’s correlation coefficient. For any pairs of parameters correlated with a rho value > ± 0.8, one parameter was excluded from analysis; all combinations of non-correlated parameters were analyzed. Spearman’s rank-order correlation was also used to test the relationship and significance of parameter trends with those of the diversity of species, feeding, and mobility groups as well as the abundances of individual feeding and mobility groups. All analyses were performed in the program R 4.1.1 using the ‘vegan’ package (R Core Team, 2021). For all analyses, statistical significance was determined at p = 0.05.
3 Results
3.1 Definition of CWC growth intervals using CT data and coral ages
Intervals of CWC framework (FW) and non-framework (NFW) are defined quantitatively using CT and coral age data (Supplementary Figure 1). Overall, CWC clast size ranges are similar among the three cores: -5.82 to -3.25 Φ (mean: -4.69 Φ) in GeoB13728-2, -5.29 to -3.13 Φ (mean: -4.39 Φ) in GeoB13729-1, and -5.56 to -3.48 Φ (mean: -4.87 Φ) in GeoB13730-1 (Figure S1). FW intervals are characterized by large mean clast sizes < -4.25 Φ (> 1.9 cm) and variable coral branch orientations with abundant maxima up to 90°. These intervals of coral FW can be subdivided into those with primarily upright CWC FW (abundant maxima >45°) and those with slightly collapsed CWC FW (maxima distributed between 0 and 90°). For analysis, all upright and slightly collapsed CWC FW intervals are collectively considered as FW intervals. In contrast, intervals of NFW (both coral rubble and sediment patches) are distinguished by smaller mean clast sizes > -4.35 Φ (< 2.0 cm) and variable orientations with few maxima that are generally <45°. For analysis, NFW intervals of coral rubble and sediment patches are collectively considered NFW.
The combination of U/Th (Table 1: Wang et al., 2021; this study) and AMS 14C (Table S1: previously published in Fink et al., 2013) coral ages reveal that each core spans slightly different time intervals in the history of the coral mound: 13.2 ± 0.03 – 2.9 ± 0.2 kyr BP in core GeoB13728-2 (upper flank), 12.1 ± 0.04 – 8.9 ± 0.02 kyr BP in core GeoB13729-1 (lower flank), and 13.2 ± 0.2 – 2.5 ± 0.24 kyr BP in core GeoB13730-1 (mound top). Although U/Th and AMS 14C coral ages complement one another, age models were calculated based on linear interpolation (age-to-age) between U/Th ages within each core because these values have smaller errors than AMS 14C ages and are in most cases within the error ranges of the AMS 14C ages in each core (Figure 2A). AMS 14C ages were only used in the age models where they are stratigraphically and chronologically consistent with U/Th ages and where U/Th ages are lacking, e.g., at 2 cm core depth in core GeoB13728-2 and at 343 and 427 cm core depth in core GeoB13730-1 (Table S1). In core GeoB13729-1, AMS 14C coral ages at 3 and 49 cm core depth were used instead of a U/Th coral age at 21 cm, which was used to calculate core chronology by Wang et al. (2021). We used the coral ages at 3 and 49 cm core depth because (a) these ages are in better alignment than the coral age at 21 cm with the trajectory of ages below 49 cm, including being within error of the underlying U/Th age at 74 cm, and (b) it is possible that the relatively young U/Th age at 21 cm is not in situ (i.e., it was dragged downcore during the drilling and processing of the core).
Table 1
| Core ID (GeoB) | Core Depth (cm) | Lab ID | 232Th (ng/g) | ± (abs.) | δ234Ui (‰) | ± (abs.) | Agecorr. (years) | ± | Agecorr. (years BP) | ± | Reference |
|---|---|---|---|---|---|---|---|---|---|---|---|
| 13728-2 | 16 | IUP-10798 | 0.4034 | 0.0006 | 148.9 | 0.4 | 3,490 | 16 | 3,420* | 16 | This study |
| 13728-2 | 29 | IUP-10799 | 0.2643 | 0.0004 | 147.6 | 0.5 | 11,577 | 29 | 11,507* | 29 | This study |
| 13728-2 | 62 | IUP-10800 | 0.3760 | 0.0005 | 148.4 | 0.5 | 10,891 | 30 | 10,821 | 30 | This study |
| 13728-2 | 98 | IUP-10801 | 0.2987 | 0.0004 | 149.9 | 0.4 | 12,893 | 35 | 12,823* | 35 | This study |
| 13728-2 | 217 | IUP-10802 | 0.4463 | 0.0005 | 149.6 | 0.3 | 12,406 | 29 | 12,336 | 29 | This study |
| 13728-2 | 242 | IUP-10803 | 0.4251 | 0.0006 | 148.7 | 0.3 | 12,965 | 28 | 12,895* | 28 | This study |
| 13728-2 | 285 | IUP-10804 | 0.2640 | 0.0004 | 149.4 | 0.4 | 13,034 | 30 | 12,964* | 30 | This study |
| 13728-2 | 314 | IUP-10805 | 0.2698 | 0.0006 | 149.5 | 0.4 | 13,162 | 47 | 13,092* | 47 | This study |
| 13728-2 | 326 | IUP-10806 | 0.3891 | 0.0006 | 148.9 | 0.4 | 13,243 | 32 | 13,173* | 32 | This study |
| 13728-2 | 354 | IUP-10807 | 0.2482 | 0.0004 | 148.5 | 0.4 | 13,087 | 30 | 13,017 | 30 | This study |
| 13729-1 | 21 | IUP-10867 | 0.3524 | 0.0006 | 148.9 | 0.9 | 9,017 | 24 | 8,947* | 24 | Wang et al., 2021 |
| 13729-1 | 74 | IUP-10868 | 1.4072 | 0.0021 | 147.0 | 0.5 | 10,478 | 62 | 10,408* | 62 | Wang et al., 2021 |
| 13729-1 | 91 | IUP-10869 | 0.3231 | 0.0006 | 147.2 | 1.1 | 10,516 | 35 | 10,446* | 35 | Wang et al., 2021 |
| 13729-1 | 159 | IUP-10870 | 0.2796 | 0.0005 | 148.6 | 0.6 | 10,834 | 31 | 10,764* | 31 | Wang et al., 2021 |
| 13729-1 | 231 | IUP-10871 | 0.2466 | 0.0004 | 149.3 | 0.8 | 10,985 | 29 | 10,915 | 29 | Wang et al., 2021 |
| 13729-1 | 269 | IUP-10872 | 0.2919 | 0.0005 | 149.0 | 0.5 | 10,928 | 31 | 10,858* | 31 | Wang et al., 2021 |
| 13729-1 | 331 | IUP-10873 | 5.1048 | 0.0084 | 147.9 | 0.5 | 10,603 | 200 | 10,533 | 200 | Wang et al., 2021 |
| 13729-1 | 395 | IUP-10874 | 0.3038 | 0.0007 | 149.4 | 0.6 | 11,492 | 41 | 11,422* | 41 | Wang et al., 2021 |
| 13729-1 | 413 | IUP-10875 | 0.3923 | 0.0009 | 150.5 | 0.6 | 12,183 | 38 | 12,113 | 38 | Wang et al., 2021 |
| 13729-1 | 426 | IUP-10876 | 0.2332 | 0.0005 | 148.8 | 0.6 | 12,179 | 38 | 12,109* | 38 | Wang et al., 2021 |
| 13730-1 | 14 | IUP-10877 | 0.3588 | 0.0008 | 147.5 | 0.5 | 10,123 | 31 | 10,053* | 31 | This study |
| 13730-1 | 25 | IUP-10878 | 0.2383 | 0.0005 | 148.9 | 0.5 | 10,268 | 28 | 10,198* | 28 | This study |
| 13730-1 | 73 | IUP-10879 | 0.2046 | 0.0003 | 148.9 | 0.4 | 10,693 | 23 | 10,623* | 23 | This study |
| 13730-1 | 131 | IUP-10880 | 0.1886 | 0.0004 | 148.8 | 0.7 | 10,800 | 33 | 10,730* | 33 | This study |
| 13730-1 | 155 | IUP-10881 | 0.1945 | 0.0004 | 148.9 | 1.1 | 11,056 | 35 | 10,986* | 35 | This study |
| 13730-1 | 218 | IUP-10882 | 0.1749 | 0.0003 | 147.1 | 0.6 | 11,296 | 31 | 11,226 | 31 | This study |
| 13730-1 | 239 | IUP-10883 | 0.2318 | 0.0004 | 147.5 | 0.5 | 11,150 | 27 | 11,080* | 27 | This study |
| 13730-1 | 261 | IUP-10884 | 0.2404 | 0.0005 | 147.3 | 0.5 | 11,366 | 28 | 11,296* | 28 | This study |
| 13730-1 | 372 | IUP-10885 | 0.4493 | 0.0010 | 148.1 | 0.4 | 13,054 | 36 | 12,984* | 36 | This study |
| 13730-1 | 387 | IUP-10886 | 0.2329 | 0.0005 | 149.6 | 0.6 | 13,166 | 42 | 13,096* | 42 | This study |
U/Th dates and uranium and thorium isotope concentrations and ratios obtained from cold-water coral fragments (Desmophyllum pertusum) collected from sediment cores GeoB13728-2, GeoB13729-1, and GeoB13730-1.
U/Th ages were converted to calendar kiloyears before present (kyr BP) by subtracting 1950 (“present” benchmark for radiocarbon dating) from the year the U/Th measurements were conducted (2020); conversions were done to make U/Th ages comparable with previously published AMS 14C dates (Fink et al., 2013). Ages used for calculating age models and aggradation rates (in combination with some AMS 14C dates in Table S1) are indicated with asterisks.
Figure 2
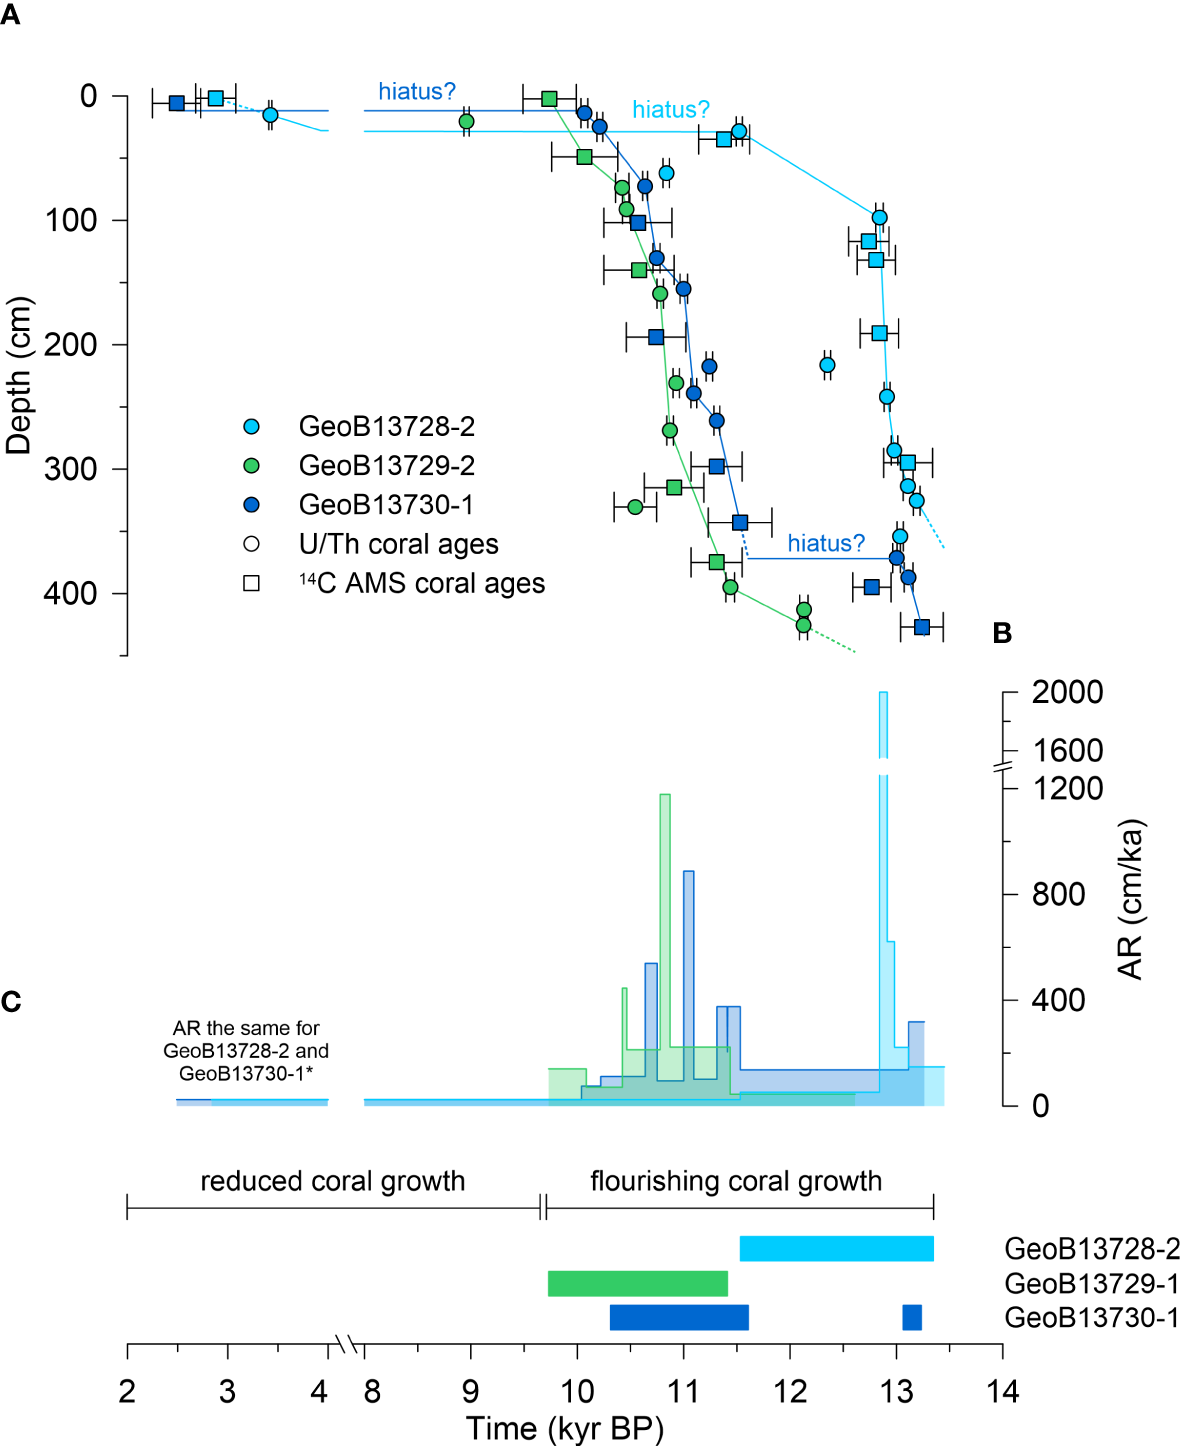
(A) Coral ages (in thousands of years before present) versus core depth. Dashed lines represent extrapolated values based on age models. Circles represent U/Th ages from this study and Wang et al. (2021). Squares represent AMS 14C ages from Fink et al. (2013). (B) Coral mound aggradation rates (AR). Colors for cores correspond with those in (A, C). (C) Intervals of flourishing coral growth interpreted from timings of rapid mound formation and coral framework in upright and/or slightly collapsed position (Supplementary Figure 1). Note that the x-axis breaks from 8 – 4 kyr BP. * see Section 3.1 for explanation.
In all cores, a few non-chronological U/Th ages had to be excluded from age-to-age calculations (Table 1) as it is the case for many other coral mound deposits (e.g., Matos et al., 2017; Fentimen et al., 2022; Wienberg et al., 2022). In core GeoB13728-2, ages from core depths of 62, 217, and 354 cm were excluded because these ages exhibit a distinct offset to the general age trend of all other U/Th ages that is independently supported by several AMS 14C ages in that core. In core GeoB13729-1, the U/Th age at 331 cm was disregarded because it contains an enhanced 232Th concentration of > 5 ng/g (Table 1), indicating diagenetic alteration. Additionally, the U/Th ages at 231 and 413 cm of this core were excluded from age-to-age calculations because they exhibit overlapping error ranges with the underlying U/Th ages at 269 and 426 cm, respectively. Minor age reversals are to be expected in coral mound environments due to the frequent physical breakdown of coral framework caused by framework weakening by bioerosion and overloading resulting from ongoing coral growth. Both of these processes of framework breakdown lead to minor non-stratigraphic mixing of coral fragments in cold-water coral sediment deposits (Frank et al., 2009; Eisele et al., 2011; Titschack et al., 2016; Matos et al., 2017; Wienberg et al., 2018; Fentimen et al., 2022). Consequently, these minor age reversals only lead to small uncertainties in the age model. In core GeoB13730-1, following the same argumentation as above, the U/Th age at 218 cm was disregarded for age-to-age calculations because it represents a minor age reversal of only 147 years.
By aligning coral ages and CT data, intervals of core dominated by coral FW and rapid coral mound formation on BRI were defined with FW1 – FW4 from 13.3 – 11.5 kyr BP in core GeoB13728-2 (upper flank) with two brief NFW interruptions at ~12.9 and ~12.8 kyr BP (see text below), with FW1 – FW3 from 11.4 – 9.7 kyr BP in core GeoB13729-1 (lower flank), and with FW1 from 13.3 – 13.1 and with FW2 from 11.6 – 10.3 kyr BP in core GeoB13730-1 (mound top) (Figures 2A, C; Figure S1). In core GeoB13730-1, FW2 was subdivided into FW2a, FW2b, and FW2c for more detailed analysis and interpretation of FW2; these subdivisions represent nearly equal groupings of molluscan assemblages and are not based on any geological or chronological signals in the core. Intervals of core dominated by NFW occur with NFW1 from 13.4 – 13.3 kyr BP, NFW2 from 12.879 – 12.875, NFW3 from 12.837 – 12.832 kyr BP), and NFW4 from 3.9 – 2.8 kyr BP in core GeoB13728-2; with NFW1 from 12.6 – 11.4 kyr BP in core GeoB13729-1, and with NFW1 from 13.1 – 13.0 and with NFW2 from 10.3 – ≤ 2.5 kyr BP in core GeoB13730-1 (Figure S1). Because there is only one coral age (at 6 cm) available above the hiatus at 12.5 cm in core GeoB13730-1, we cannot calculate or extrapolate an age for the core top and the entire duration of the upper NFW interval. Therefore, the youngest age in the core and the age of the upper NFW interval is ≤ 2.5 kyr BP, the AMS 14C age at 6 cm. Using the newly defined and dated intervals of coral FW and NFW, the median ages of molluscan assemblages (previously referred to as samples) were calculated. These assemblages range from ~13.3 – 3 kyr BP in core GeoB13728-2, ~12.1 – 9.8 kyr BP in core GeoB13729-1, and ~13.2 – 2.5 kyr BP in core GeoB13730-1 (Table S2).
Aggradation rates were calculated age-to-age using the same U/Th (and in some cases AMS 14C ages) used to calculate age models (Figure 2B, Table 1, Table S1). The aggradation rate for NFW4 in the upper 29 cm in core GeoB13728-2 was extrapolated to NFW2 in the upper 35 cm in core GeoB13730-1. This was done because (a) there is only one coral age in the upper 35 cm in core GeoB13730-1, preventing an age-to-age calculation of the aggradation rate for this core interval, and (b) the mound top (core GeoB13730-1) and upper flank (core GeoB13728-2) are adjacent CWC habitats with similar patterns and timings of coral preservation (Figure S1). In all cores, peak aggradation rates (GeoB13728-2: 2,002 cm/ka, GeoB13729-1: 1,178 cm/ka, GeoB13730-1: 889 cm/ka) coincide with FW intervals, whereas aggradation rates during NFW intervals are relatively low (GeoB13728-2: <53 cm/ka, GeoB13729-1: 44 cm/ka, GeoB13730-1: < 137 cm/ka).
3.2 Molluscan diversity
In total, 3,324 molluscan specimens were identified from the three cores, including 234 gastropod specimens (and individuals) and 3,090 bivalve specimens (1,545 individuals) (Table S3). Collectively, these specimens represent 35 gastropod and 29 bivalve species. The most abundant species among all assemblages are the bivalves Heteranomia squamula and Hiatella arctica, contributing 50% and 27% of all specimens, respectively.
Rarefaction indicates that diversity is closer to being fully accounted for in Cores GeoB13728-2 and GeoB13730-1 than in Core GeoB13729-1 (Figure 3). The diversity of species, feeding, and mobility groups are dynamic in each core (Figures 4A–C), with the highest overall core diversity for species, feeding, and mobility groups in core GeoB13729-1. During intervals of CWC FW, species, feeding, and mobility group diversities are variable and typically include the lowest diversity values in each core. The proportional abundances of individual feeding and mobility groups are also highly dynamic in each core (Figures 4D–I). Nearly all assemblages, during intervals of both CWC FW and NFW, are dominated by filter feeders and sessile taxa. During intervals of CWC FW, mean abundances of filter feeders and sessile taxa within molluscan assemblages range between 64 and 89% (GeoB13728-2: 89%, GeoB13729-1: ~65%, GeoB13730-1: ~89%). During intervals of NFW these abundances decrease slightly in cores GeoB13728-2 (86%) and GeoB13729-1 (62 – 65%) and dramatically in core GeoB13730-1 (67%). During intervals of NFW the abundances of other feeding and mobility groups increase, particularly mobile carnivores and deposit feeders (Tables S4, S5).
Figure 3
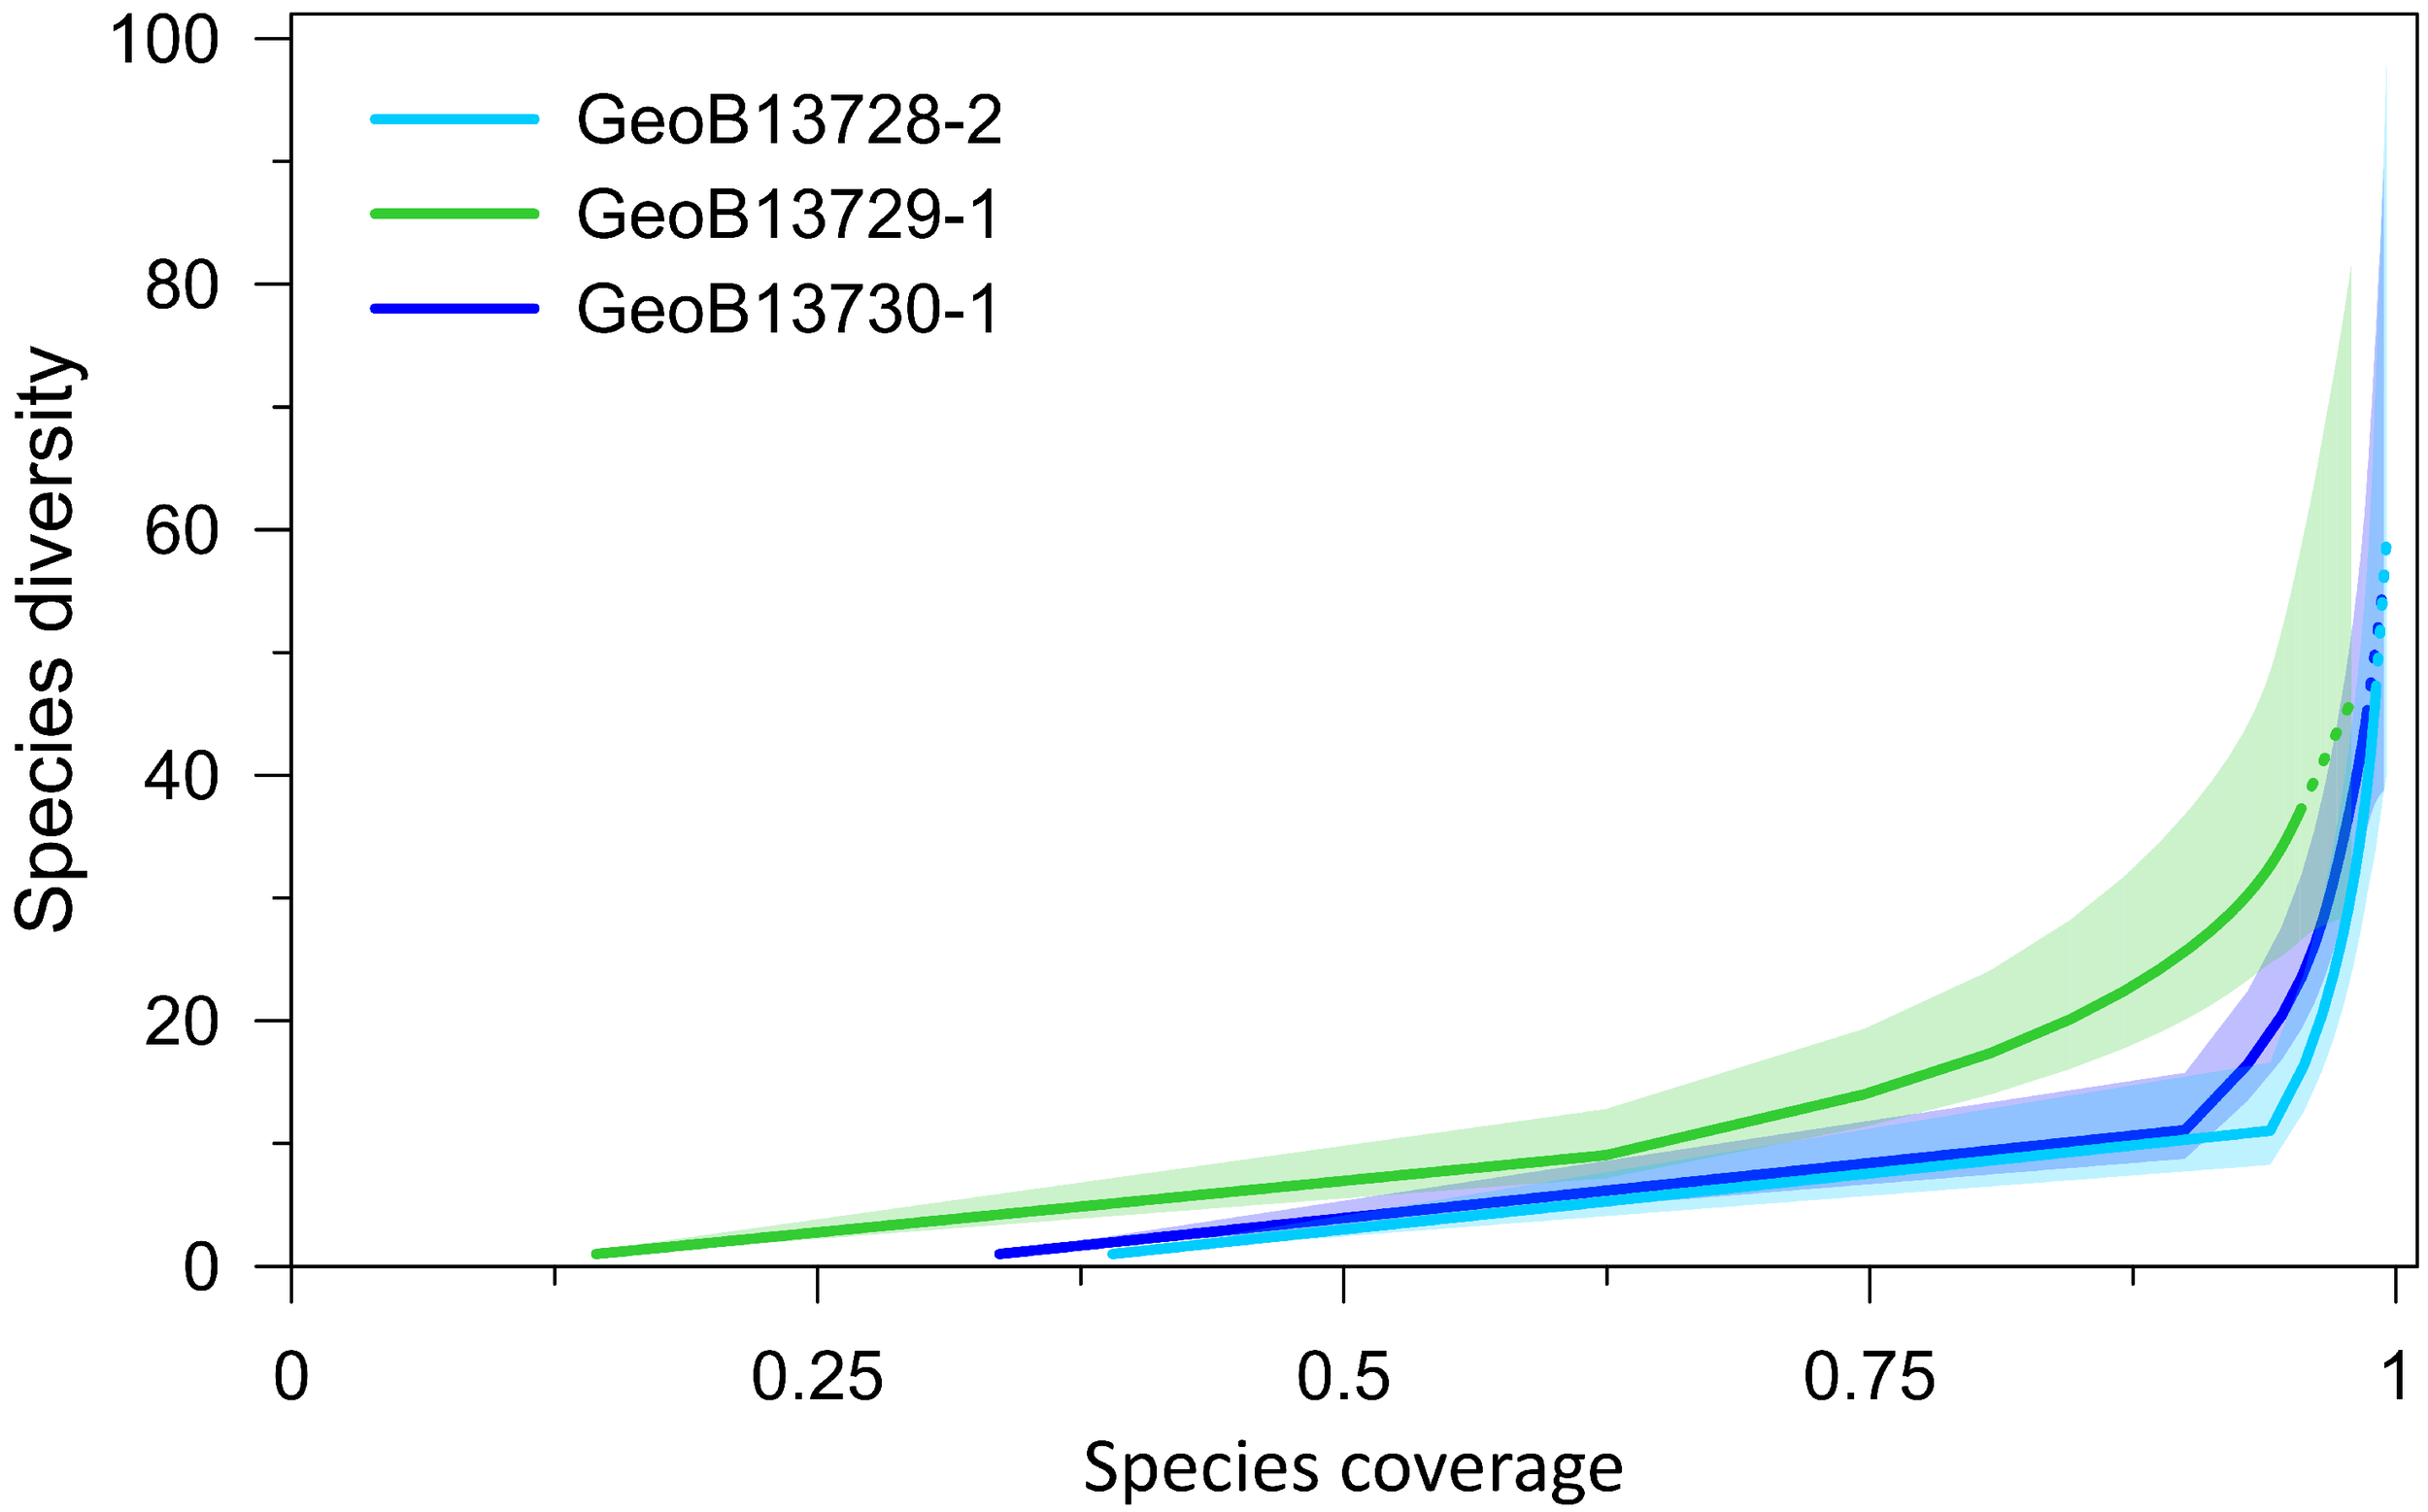
Coverage-based species rarefaction curves for each core. Solid lines represent observed data. Dashed lines represent extrapolated trends. Shading corresponds to 95% confidence intervals (Hsieh et al., 2016).
Figure 4
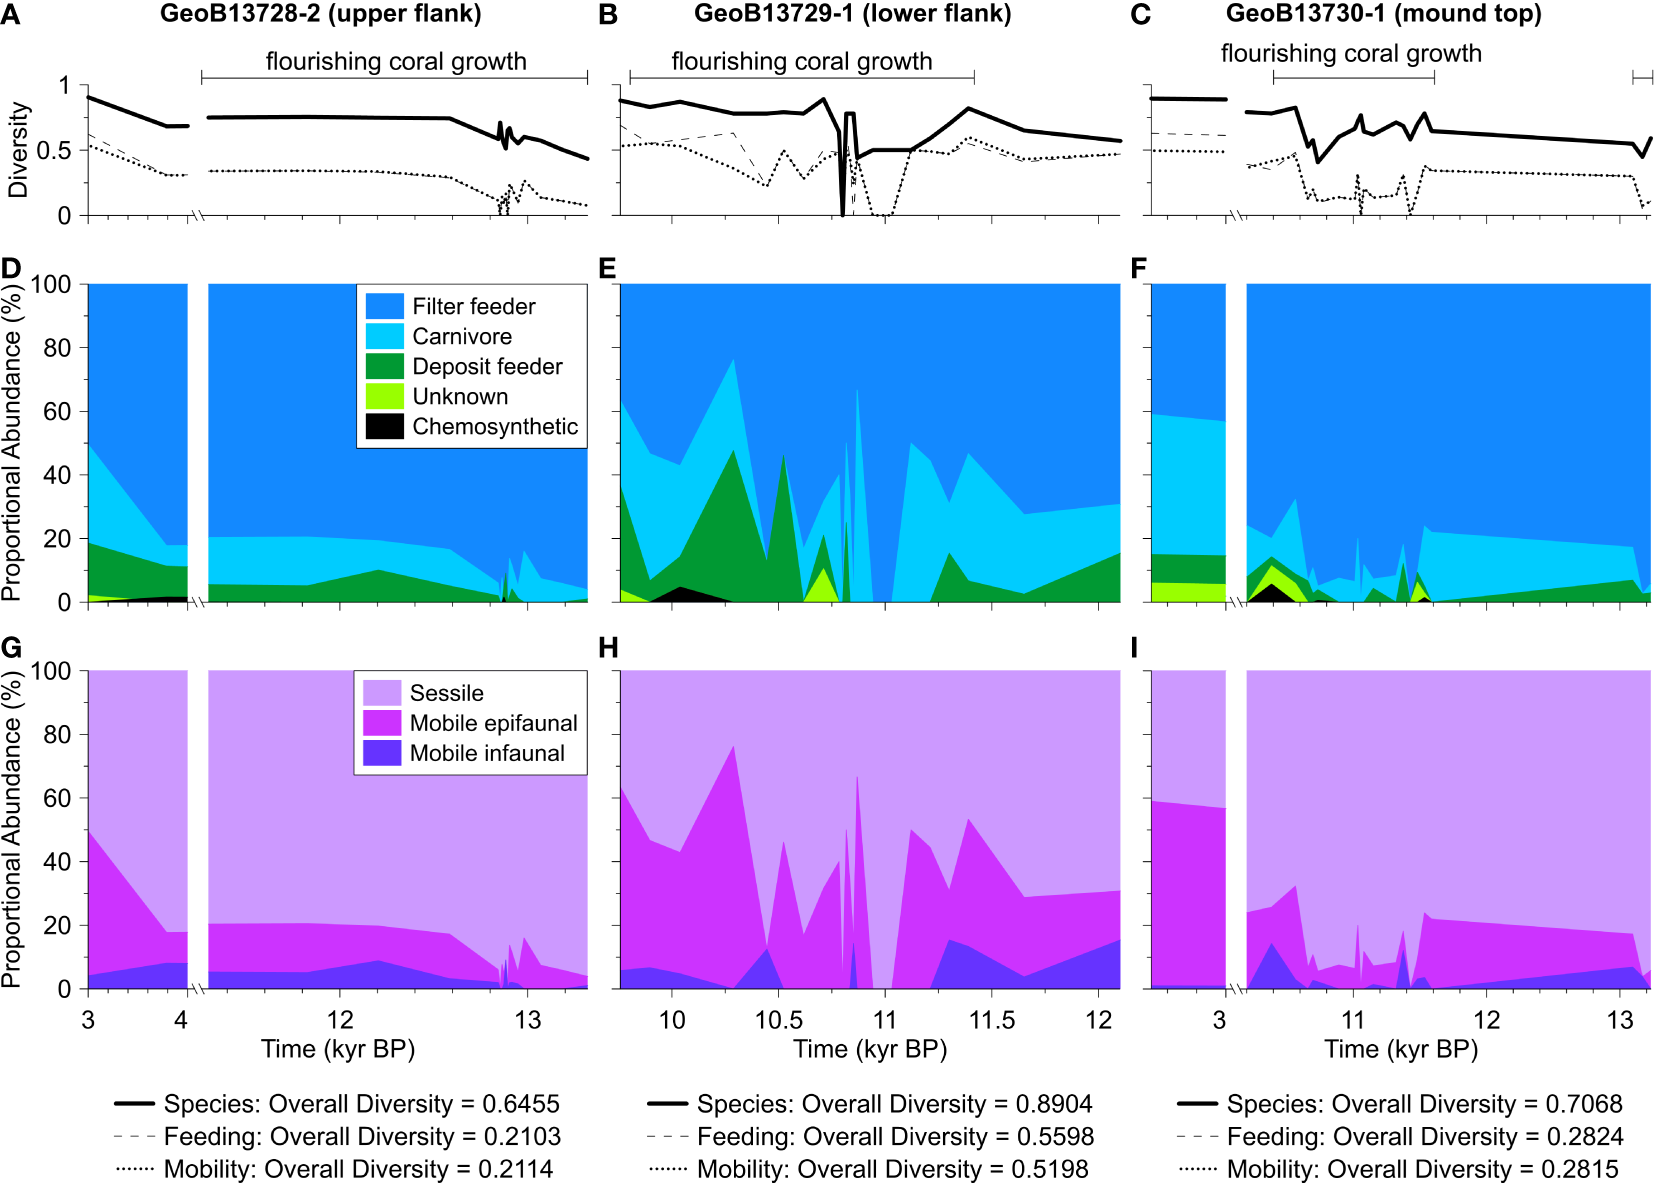
Molluscan ecological data for cores GeoB13728-2, GeoB13729-1, and GeoB13730-1. (A-C) Diversity indices for molluscan species, feeding groups, and mobility groups in each assemblage (sample) and for each core overall (see values below plots). Proportional abundances of (D-F) feeding groups and (G-I) mobility groups in each assemblage. The legend for (D-F) is in (D), and legend for (G-I) is in (G). Note that the x-axis breaks from 11.3 – 4.0 kyr BP (thousands of years before present) in figures (A, D, G) and from 10.2 – 3.0 kyr BP in figures (C, F, I). These axes breaks are based on coral ages and interpolated ages of molluscan assemblages.
When all assemblages from the three cores are analyzed collectively, there is some overlap in the composition of the molluscan assemblages (for species, feeding, and mobility groups), from both intervals of CWC FW and NFW, among the three cores (Figure 5). Despite this overlap, ANOSIM analyses determine that these assemblages are significantly different among the three cores for species, feeding, and mobility groups but not between intervals of FW and NFW (Figure 5). In contrast, when molluscan assemblages are analyzed individually within each core (Figure 6), assemblages are significantly different between intervals of CWC FW and NFW in cores GeoB13728-2 and GeoB13730-1 for feeding and mobility groups as well as for species in core GeoB13730-1. In core GeoB13729-1, there are no significant differences between FW and NFW assemblages.
Figure 5
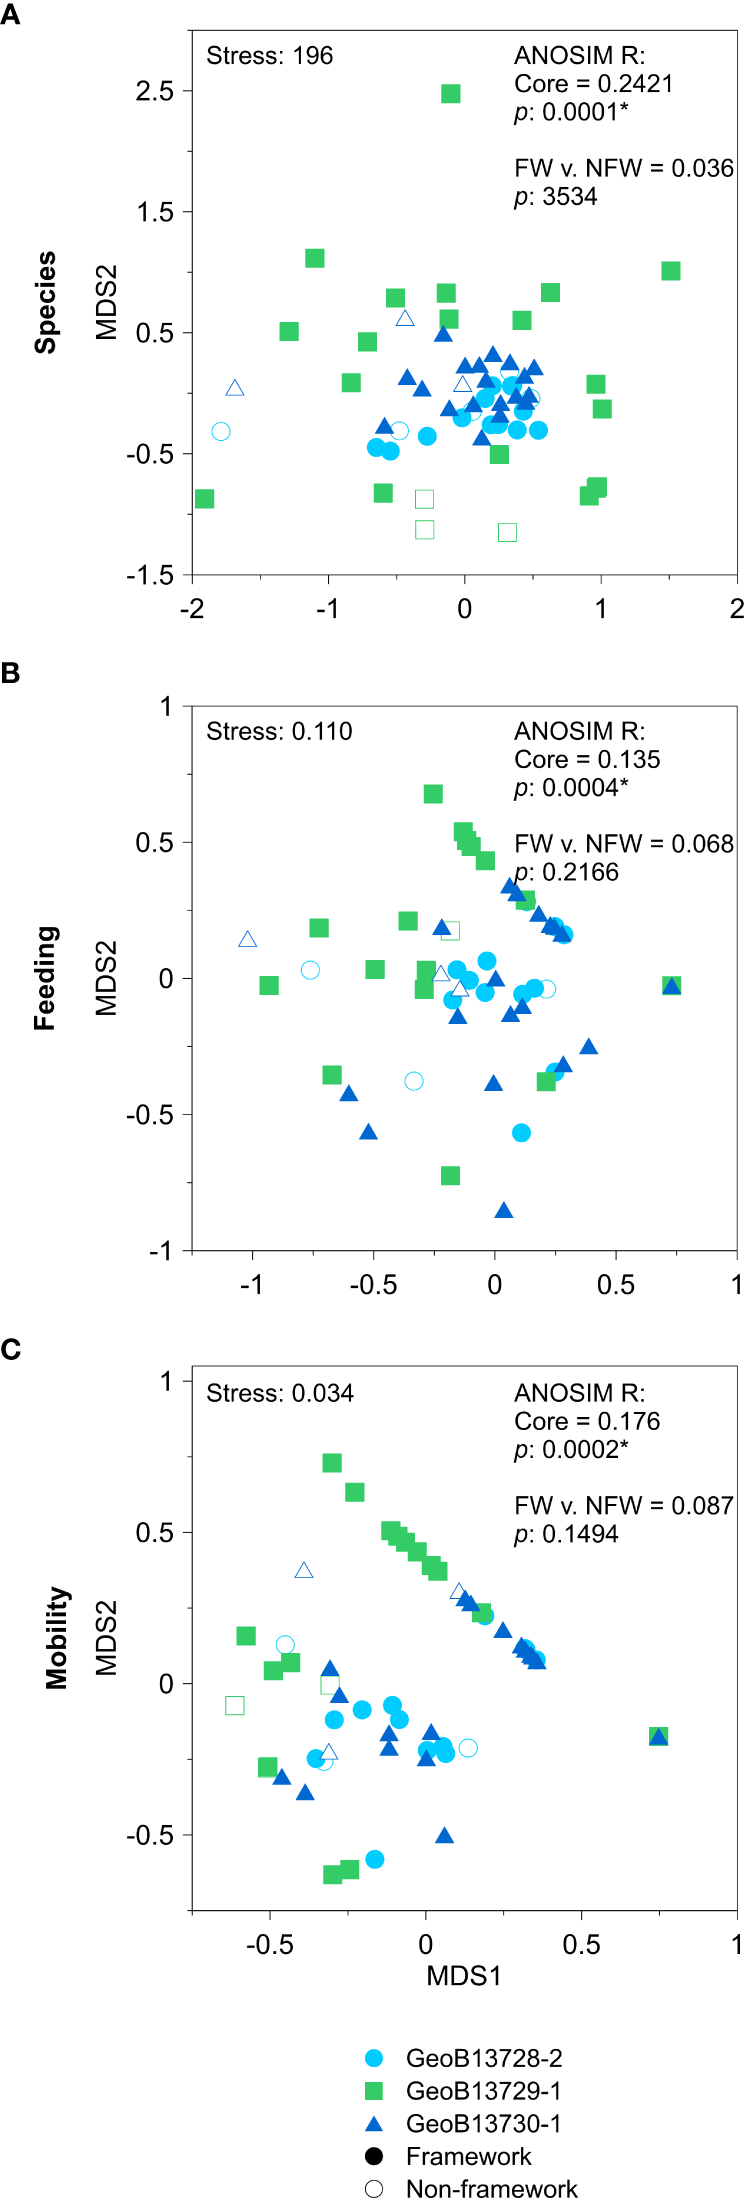
Non-parametric multi-dimensional (nMDS) scaling plots of all molluscan assemblages from all cores for (A) species, (B) feeding, and (C) mobility groups. ANOSIM R and p-values for analyses testing for differences between cores (Cores) and between assemblages associated with intervals of coral framework versus non-framework (FW vs. NFW) are provided within each relevant plot.
Figure 6
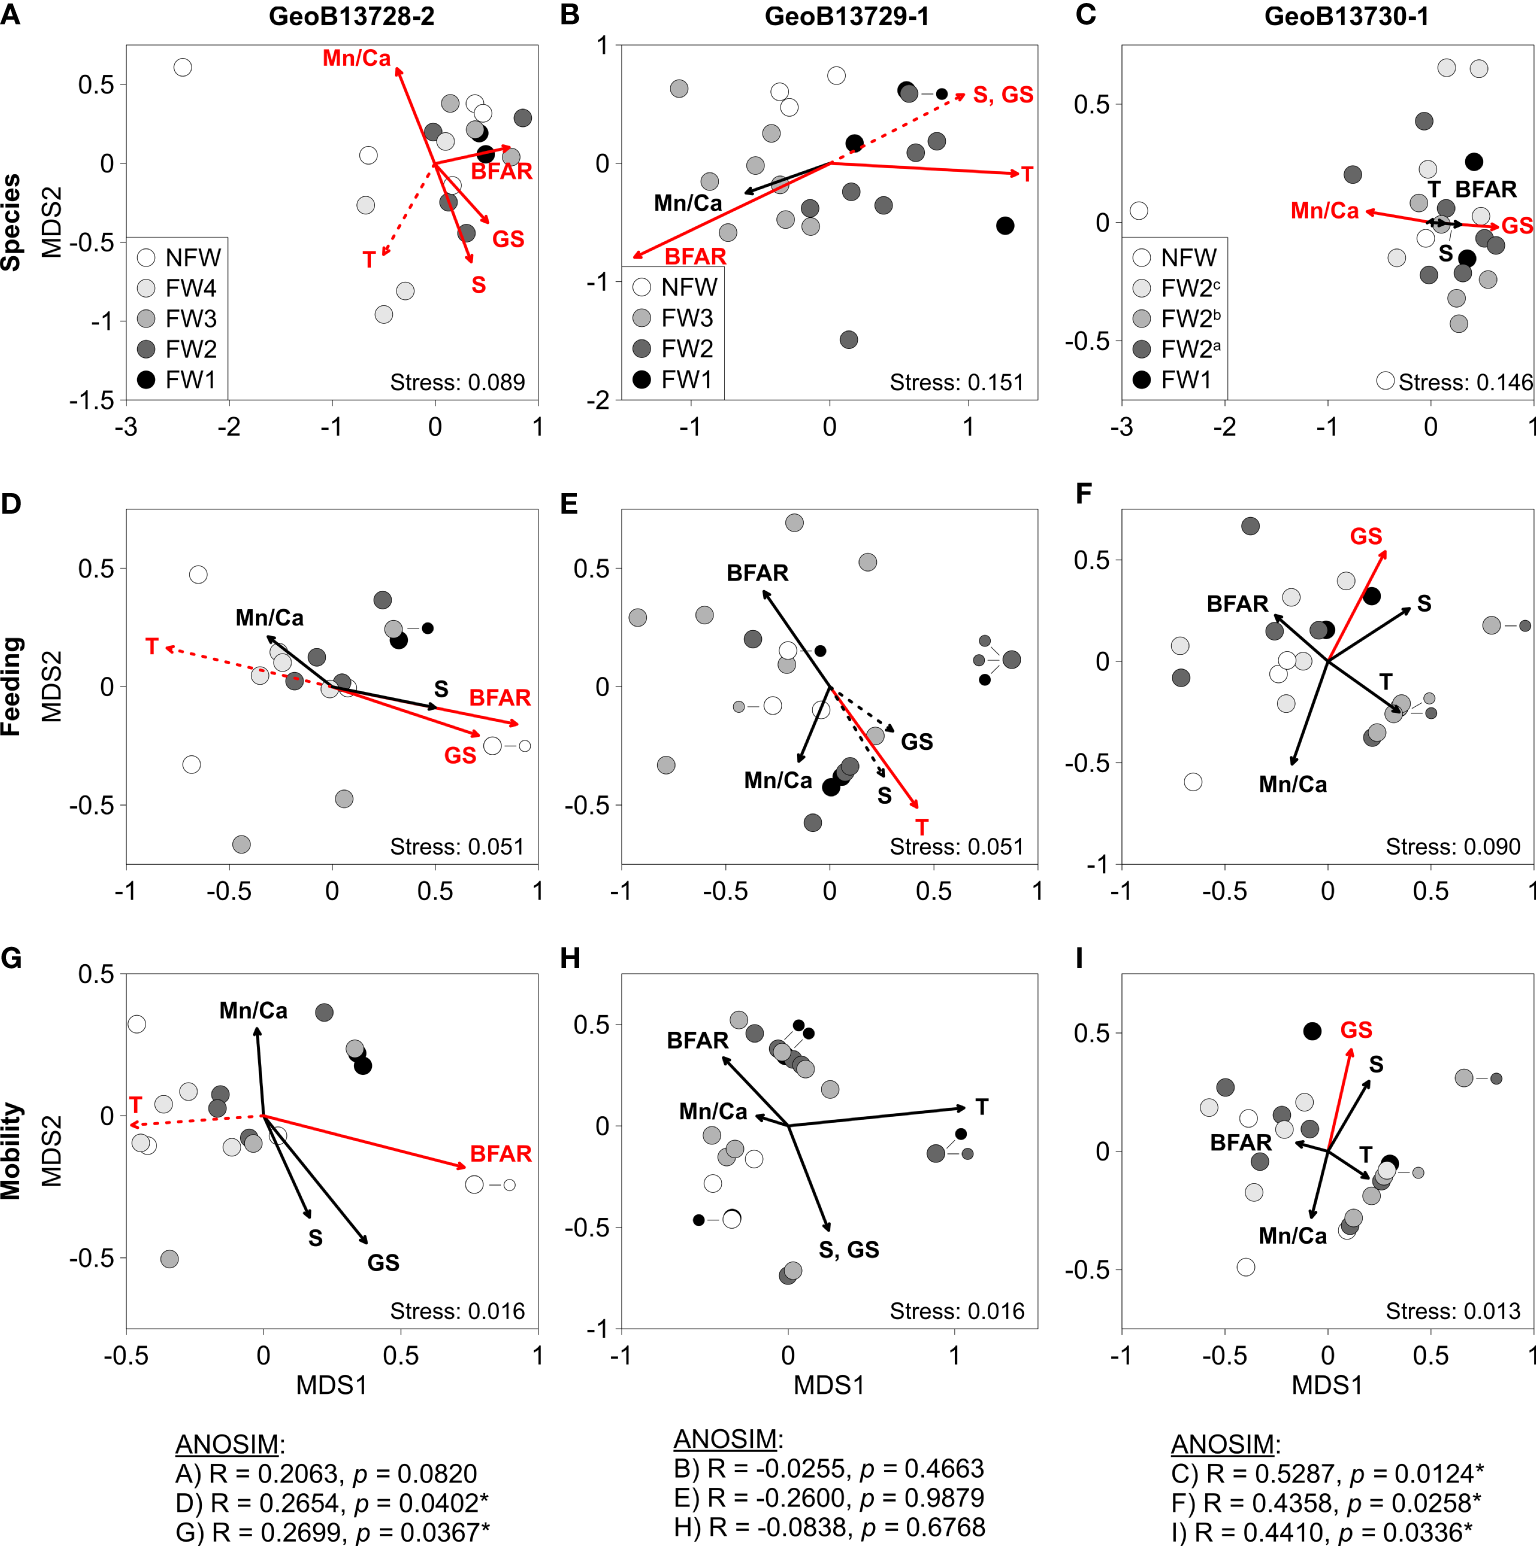
Non-parametric multi-dimensional scaling (nMDS) plots of molluscan species (A, D, G), feeding groups (B, E, H), and mobility groups (C, F, I) with rotational vector fitting of palaeoceanographic parameters for cores GeoB13728-2, GeoB13729-1, and GeoB13730-1. Color coding of molluscan assemblages (circles) corresponds with intervals of coral framework (FW) and non-framework (NFW) identified in Supplementary Figure 1. For core GeoB13730-1, FW2 is subdivided into three (nearly) equal groups due to the large number of assemblages within FW2. Vectors point towards molluscan assemblages with which palaeoceanographic data are correlated. Red vectors indicate significant correlations between palaeoceanographic data and molluscan data. Vectors with dashed lines indicate results from additional runs of the EnvFit analysis, for which palaeoceanographic parameters in the first runs were excluded due to significant correlations among parameters. See Tables S6, S7 for parameter correlations and vector p-values, respectively. Palaeoceanographic parameters (measured from the off-mound core GeoB13731-1): BFAR – benthic foraminifera accumulation rate, a proxy for surface ocean productivity and organic matter exported to the seafloor (i.e. food availability) (Portilho-Ramos et al., 2022); GS – mean grain size, a proxy for hydrodynamics (current strength) (Fink et al., 2013); Mn/Ca – ratio of Mn/Ca in benthic foraminifera, a proxy for bottom-water oxygenation (Portilho-Ramos et al., 2022); T – Mg/Ca ratio in benthic foraminifera, a proxy for bottom-water temperature (Portilho-Ramos et al., 2022); δ18O seawater – in benthic foraminifera, a proxy for bottom-water salinity (Portilho-Ramos et al., 2022). ANOSIM R and p-values corresponding with each plot (A-I) and testing for differences between assemblages associated with intervals of coral framework (FW) versus non-framework (NFW) are provided below the plots. * indicates a significant correlation.
3.3 Palaeoceanographic drivers of molluscan diversity
For each of the cores, at least one pair of palaeoceanographic parameters (Figures S2A–E) are correlated, which required multiple iterations of rotational vector fitting analyses (Tables S6, S7). Despite differences, there are some broadly similar relationships among the cores between molluscan assemblage compositions and palaeoceanographic and habitat parameters. Spearman correlation results generally support the findings of vector fitting analyses (Table 2, Table S8). To standardize and detect subtle molluscan ecological relationships associated with vector fitting analyses, molluscan diversity values per assemblage are categorized as low, moderate, and high based on the numerical distribution of species, feeding, and mobility diversity values among all cores (Tables S3-5 and Figure S3). Categories of low, moderate, and high are nearly evenly distributed among the data. Species diversity values range from 0.41 – 0.91 with one assemblage yielding a diversity of 0.00. Therefore, for species diversity, low diversity ranges from (0.0) 0.40 – 0.60, moderate diversity from 0.60 – 0.80, and high diversity from 0.80 – 1.00. In contrast, feeding diversity values span from 0.00 – 0.69 and mobility diversity values from 0.00 – 0.60. Accordingly, for feeding and mobility diversity, low diversity ranges from 0.0 – 0.2, moderate diversity from 0.2 – 0.4, and high diversity from 0.4 – 0.7.
Table 2
| Diversity | Abundances | ||||||||
|---|---|---|---|---|---|---|---|---|---|
| Species | Feeding | Mobility | FF | CN | DF | SS | ME | MI | |
| GeoB13728-2 | |||||||||
| BFAR | – | – | – | + | – | + | – | ||
| T | + | + | + | – | + | + | – | + | + |
| AR | – | – | + | – | – | + | – | ||
| GeoB13729-1 | |||||||||
| BFAR | + | ||||||||
| GS | – | ||||||||
| T | – | – | – | ||||||
| δ18O | – | ||||||||
| AR | – | ||||||||
| CVol | + | + | |||||||
| GeoB13730-1 | |||||||||
| T | – | ||||||||
| AR | – | ||||||||
| CVol | + | ||||||||
| C-30 | + | ||||||||
Significant Spearman correlations between palaeoceanographic and habitat characteristic parameters with molluscan diversity (species, feeding, and mobility groups) and proportional abundances of molluscan traits.
+ indicates a positive relationship. – indicates a negative relationship. See Table S8 for all rho coefficients and p-values. Molluscan traits: FF – filter feeder, CN – carnivore, DF – deposit feeder, SS – sessile, ME – mobile epifaunal, MI – mobile infaunal. Palaeoceanographic parameters (measured from the off-mound core GeoB13731-1): BFAR – benthic foraminifera accumulation rate, a proxy for surface ocean productivity and organic matter exported to the seafloor (i.e. food availability) (Portilho-Ramos et al., in revision); GS – mean grain size, a proxy for hydrodynamics (current strength) (Fink et al., 2013); Mn/Ca – ratio of Mn/Ca in benthic foraminifera, a proxy for bottom-water oxygenation (Portilho-Ramos et al., in revision); T – ratio of Mg/Ca in benthic foraminifera, a proxy for bottom-water temperature (Portilho-Ramos et al., in revision); δ18O seawater – in benthic foraminifera, a proxy for bottom-water salinity (Portilho-Ramos et al., 2022). Habitat characteristic parameters: AR – mound aggradation rate calculated from AMS 14C coral ages (Fink et al., 2013) and U/Th coral ages converted to kyr BP (this study and Wang et al., 2021); CVol – coral volume (percentage of total core volume); C-30 – percentage of coral branches orientated 0-30°; C-60 – percentage of coral branches orientated 30-60°; C-90 – percentage of coral branches orientated 60-90°. Coral volume and orientation data extracted from CT data (this study: GeoB13728-2, 13730-1; Titschack et al., 2016: GeoB13729-1). For full results, see Table S8.
3.3.1 Species
In cores GeoB13728-2 and GeoB13729-1, relatively high bottom-water temperature, δ18O seawater (salinity), and hydrodynamics are significantly correlated with low – moderately diverse species assemblages from intervals of CWC FW (Figures 6A, B). Relatively high temperatures (12.5 – 13.7° C) and δ18O seawater (δ18O seawater = 1.5 – 2.2 ‰) are generally associated with low – moderately diverse assemblages (Diversity (D) = 0.50 – 0.75) composed of 80 – 95% sessile filter feeders in FW4 in core GeoB13728-2 and mostly low – moderately diverse assemblages (D = 0.44 – 0.78) containing 33 – 100% sessile filter feeders in FW1 and FW2 in core GeoB13729-1 (Figures S1, S2; Tables S2, S3). In core GeoB13729-1, high δ18O seawater (1.9 – 2.2 ‰) are also associated with low and high diversity assemblages (D = 0.57 – 0.82) comprised of 47 – 73% sessile filter feeders from NFW1. In core GeoB13728-2, relatively strong hydrodynamics (grain size (GS) ≥ 23 μm) and high food availability (benthic foraminifera accumulation rate (BFAR) = ~14,500 – 16,300 shells cm-2 kyr-1) are linked to low – moderately diverse FW1, FW2, and FW3 assemblages (D = 0.50 – 0.67) with high abundances of sessile filter feeders (84 – 95%). In core GeoB13729-1, relatively strong hydrodynamics (GS = 16 – 18 μm) are correlated with low – moderately diverse FW1 and FW2 assemblages (D = 0.5 – 0.7) with 44 – 100% sessile filter feeders, while slightly stronger hydrodynamics (GS = 19 – 23 μm) are correlated with low and high diversity NFW assemblages (D = 0.57 – 0.82) with 47 – 73% sessile filter feeders. In core GeoB13729-1, high food availability (BFAR = ~15,800 – 23,600 shells cm-2 kyr-1) is typically related to high diversity FW3 assemblages (D = 0.78 – 0.89) containing 24 – 88% sessile filter feeders. Additionally, in core GeoB13728-2, relatively low bottom-water oxygenation (Mn/Ca ratios: 69.5 – 74.5 μmol mol -1) is correlated primarily with the two youngest (3.8 and 3.0 kyr BP) NFW assemblages in the core containing moderate – high diversity (D = 0.68 – 0.91) and 25 – 26% sessile filter feeders. Overall, species diversity in core GeoB13728-2 is significantly positively correlated with temperature and negatively correlated with food availability, whereas in core GeoB13729-1 species diversity is signzzZificantly positively correlated with food availability and negatively correlated with temperature, δ18O seawater (salinity), and hydrodynamics (Table 2; Table S8).
In core GeoB13730-1, relatively strong hydrodynamics (GS = 17 – 23 μm) are significantly associated with low – moderately diverse FW1, FW2a and FW2b assemblages (D = 0.45 – 0.78) containing 76 – 100% sessile filter feeders (Figure 6C; Figures S1, S2; Tables S2, S3). In contrast, low bottom-water oxygenation (minimum = 96.4 μmol mol-1) is primarily significantly correlated with the youngest NFW assemblage (2.5 kyr BP) in the core, which yields the highest diversity (D = 0.89) and lowest abundance of sessile filter feeders (41%) recorded in the core.
3.3.2 Feeding and mobility groups
A subset of the palaeoceanographic parameters correlated with species assemblages are also significantly associated with feeding and mobility group assemblages. Relatively moderately high food availability (BFAR = ~14,300 – 14,600 shells cm-2 kyr-1) and strong hydrodynamics (GS = ~24 μm) are significantly correlated with NFW2 and NFW3 assemblages containing no feeding diversity (D = 0.00) and 100% sessile filter feeders in core GeoB13728-2 (Figure 6D; Figures S1, S2; Tables S2, S4). In contrast, relatively high temperatures (12.8 – 13.7° C) are associated with FW1 and FW2 assemblages that yield moderate – high feeding diversity (D = 0.29 – 0.63) with 33 – 100% sessile filter feeders in core GeoB13729-1 (Figures 6E; Figures S2; Table S2, S4). As with core GeoB13728-2, relatively strong hydrodynamics (GS ≥ 22 μm) are linked to FW1 assemblages with very low feeding diversity (D = 0.05 – 0.11) and high abundances of sessile filter feeders (94 – 97%) in core GeoB13730-1 (Figure 6F, S1, S2; Tables S2, S4). In core GeoB13728-2, feeding diversity and the abundance of deposit feeders are significantly negatively correlated with food availability and positively correlated with temperature, while the abundance of filter feeders is positively correlated with food availability and negatively correlated with temperature; the abundance of carnivores is also positively correlated with temperature (Table 2; Table S8). In cores GeoB13729-1 and GeoB13730-1, the abundance of deposit feeders is significantly negatively correlated with temperature, while feeding diversity in core GeoB13729-1 is negatively correlated with temperature (Table 2; Table S8).
Among mobility assemblages, moderately high food availability (BFAR = ~14,300 – 14,600 shells cm-2 kyr-1) is significantly correlated with NFW assemblages yielding no mobility diversity (D = 0.00) and 100% sessile taxa in GeoB13728-2 (Figure 6G; Figures S1, S2; Tables S2, S5). In core GeoB13730-1, relatively strong hydrodynamics (GS = ~23 μm) are associated with FW1 assemblages with low diversity (D = 0.07 – 0.11) and high abundances of sessile taxa (94 – 96%) (Figure 6I; Figure S1; Tables S2, S5). Overall, in core GeoB13728-2, mobility diversity and the abundance of mobile infaunal molluscs are significantly negatively correlated with food availability and positively correlated with temperature, while the abundance of sessile taxa are positively correlated with food availability and negatively correlated with temperature; the abundance of mobile epifaunal molluscs is also positively correlated with temperature (Table 2; Table S8).
3.4 Habitat drivers of molluscan diversity
In all cores, high coral volume relative to values throughout each core (GeoB13728-2: ~30 – 63%; GeoB13729-1: 27 – 35%; GeoB13730-1: 28 – 35%) is significantly associated with species, feeding, and/or mobility assemblages from intervals of both CWC FW and NFW (Figure 7; Figure S2F-H; Table S2). These assemblages mostly yield moderate – high species diversity (D = 0.57 – 0.91), moderate – high feeding diversity (D = 0.0.29 – 0.69), and low – high mobility diversity (D = 0.14 – 0.54) and are typically characterized by relatively lower abundances of sessile filter feeders (37 – 92%) (Tables S3-S5). Overall, species and feeding diversity in core GeoB13729-1 and the abundance of mobile infaunal taxa in core GeoB13730-1 are significantly positively correlated with coral volume (Table 2; Table S8). The abundance of deposit feeders in core GeoB13730-1 is also positively correlated with the volume of coral branches with orientations 0 – 30°.
Figure 7
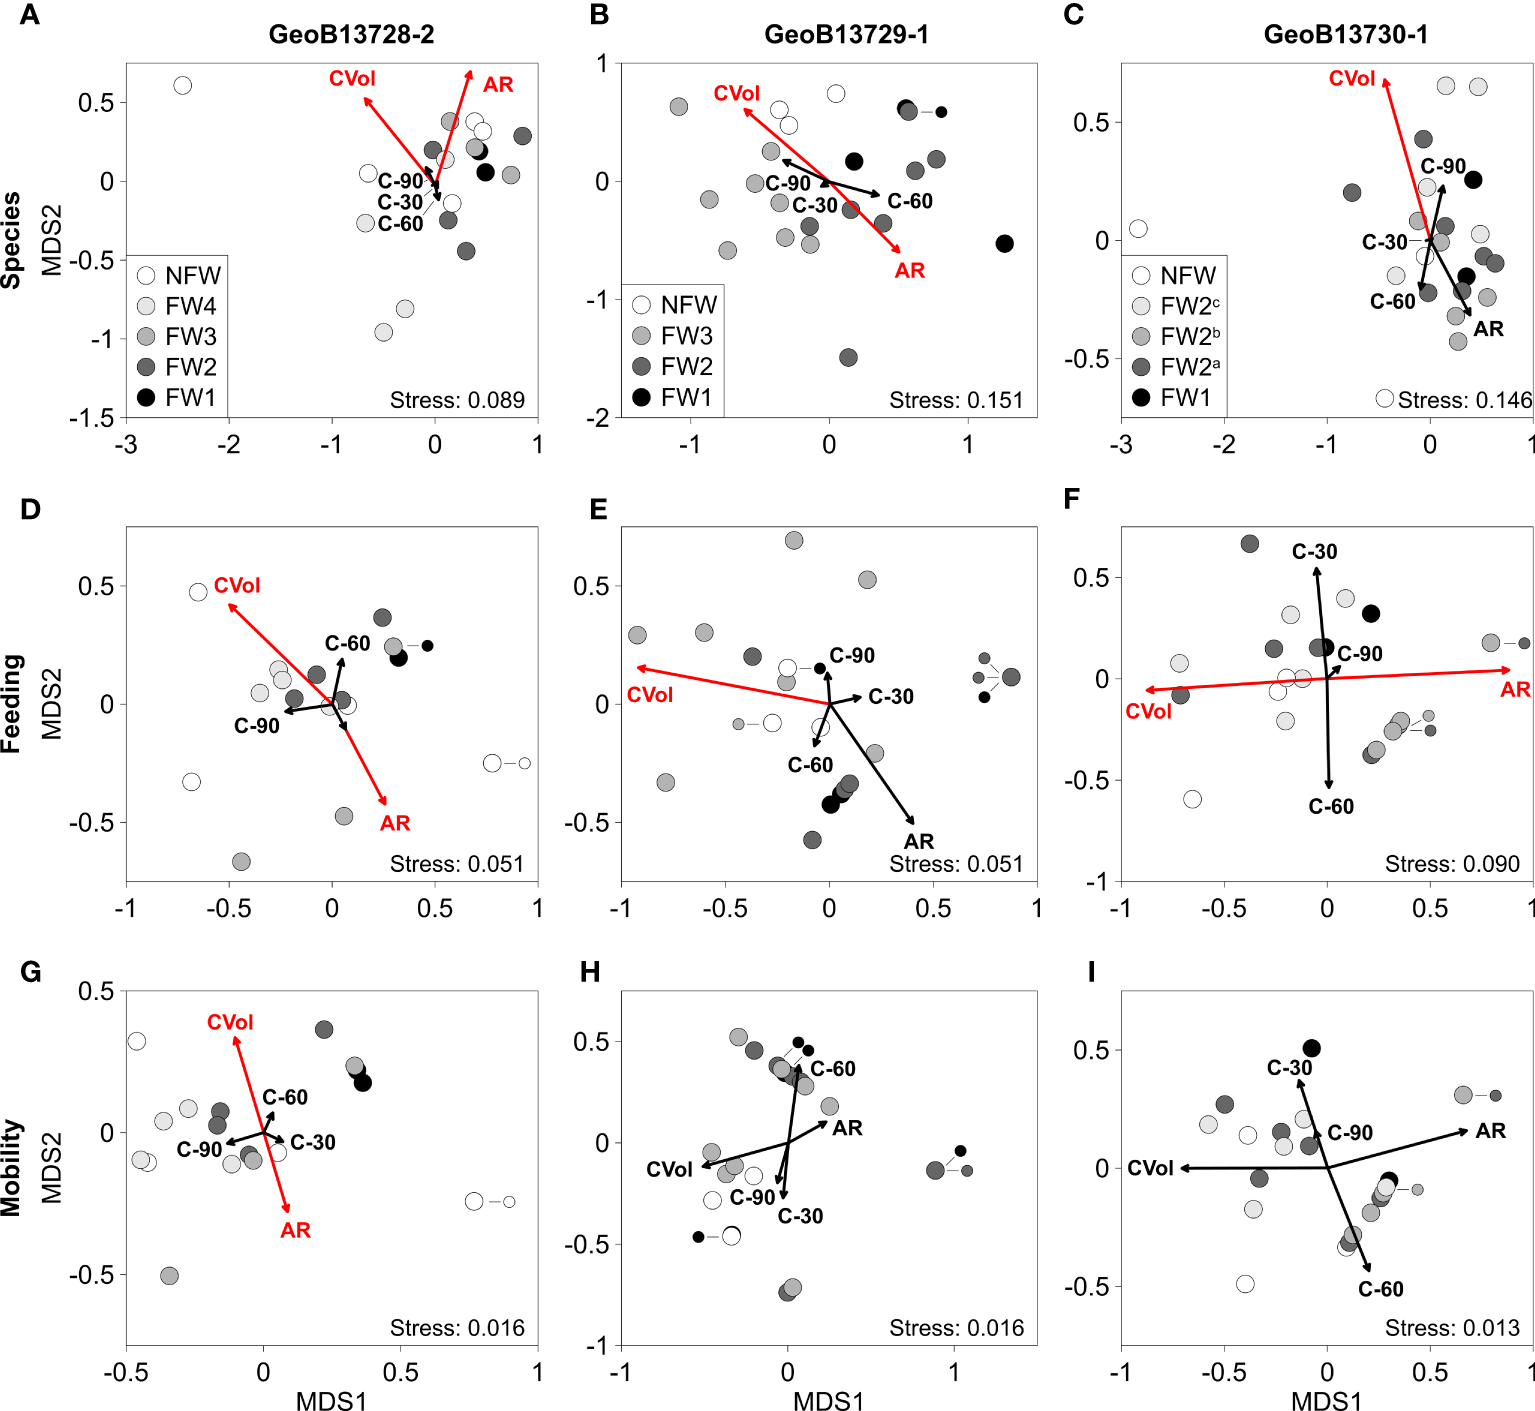
Non-parametric multi-dimensional scaling (nMDS) plots of molluscan species (A, D, G), feeding groups (B, E, H), and mobility groups (C, F, I) with rotational vector fitting of habitat characteristic parameters for cores GeoB13728-2, GeoB13729-1, and GeoB13730-1. Color coding of molluscan assemblages (circles) corresponds with intervals of coral framework (FW) and non-framework (NFW) identified in Supplementary Figure 1. For core GeoB13730-1, FW2 is subdivided into three (nearly) equal groups due to the large number of assemblages within FW2. See Figure 6 for description of vectors. Habitat characteristic parameters: AR – mound aggradation rate calculated from AMS 14C coral ages (Fink et al., 2013) and U/Th coral ages converted to kyr BP (this study and Wang et al., 2021); CVol – coral volume (percentage of total core volume); C-30 – percentage of coral branches orientated 0-30°; C-60 – percentage of coral branches orientated 30-60°; C-90 – percentage of coral branches orientated 60-90°. Coral volume and orientation data extracted from CT data (this study: GeoB13728-2, GeoB13730-1; Titschack et al., 2016: GeoB13729-1).
In cores GeoB13728-2 and GeoB13730-1, relatively high mound aggradation rates occurring primarily in tandem with intervals of CWC FW are significantly associated with low – moderately diverse species and/or feeding assemblages (Figure 2B; Figure 7; Figure S2; Tables S2–S5). In core GeoB13728-2, the highest aggradation rates (622 – 2,003 cm kyr-1) correspond with low – moderately diverse (D = 0.51 – 0.65) species and feeding assemblages with 91 – 95% sessile filter feeders during FW2, FW3, NFW2, and NFW3 (Figures 7A, D; Figure S2; Tables S2–S5). In core GeoB13730-1, the highest aggradation rate (889 cm kyr-1) is correlated with low – moderate feeding diversity (D = 0.00 – 0.38) particularly in FW2b assemblages with 80 – 100% sessile filter feeders (Figure 7F; Figure S2; Tables S2, S4, S5). Overall, aggradation rate is significantly negatively correlated with feeding and mobility diversity and the abundance of carnivores, deposit feeders, and mobile taxa and positively correlated with the abundance of filter feeders and sessile taxa in core GeoB13728-2 (Table 2; Table S8). The abundances of deposit feeders in cores GeoB13729-1 and GeoB13730-1 are significantly negatively correlated with aggradation rate (Table 2; Table S8).
4 Discussion
The dynamic and ephemeral nature of CWC reefs highlights the need to understand these ecosystems and their role as biodiversity hotspots in the deep sea. CWC mound sediment cores provide a unique glimpse into the temporal trends, drivers, and diversity of CWC ecosystems over geologic time – the scale at which CWC reefs initiate, thrive, and decline. Our results reveal that at the ecosystem scale ecological signatures of different CWC habitats on a coral mound are more pronounced than ecological differences between assemblages associated with intervals of coral FW and NFW, when CWC growth is flourishing and when it is not. However, at the habitat scale, significant ecological differences emerge between assemblages from intervals of CWC FW and NFW, as do correlations between molluscan assemblages and palaeoceanographic and habitat characteristic parameters.
4.1 Spatial ecological patterns
4.1.1 Regionally
With more than 60 species of molluscs identified among the three cores, the diversity of the BRI CWC mound in the Alboran Sea is within the range of molluscan diversity recovered from surface sediments in other CWC habitats in the Mediterranean Sea and the adjacent Gulf of Cádiz, which range from 44 – 200 species (Crocetta and Spanu, 2008; Negri and Corselli, 2016; Hoffman and Freiwald, 2017; Global Biodiversity Information Facility (GBIF), 2022a). Coverage-based rarefaction curves indicate that diversity is not fully accounted for across the BRI CWC ecosystem despite large sample volumes (~565 cm3) that generally span 5 – 325 years (Table S2). This result is interpreted to reflect the considerable spatial habitat heterogeneity (Henry and Roberts, 2017) within the CWC ecosystem and limited diameter of our gravity cores (~12 cm). Increasing sample sizes, by using whole round core samples and/or collecting additional replicate cores, would likely better capture the benthic diversity associated with this heterogeneous ecosystem. To date, there have been no extensive surveys to quantify molluscan diversity in CWC habitats in the Alboran Sea (Rueda et al., 2019), so we can offer no direct quantitative comparison between modern CWC-associated molluscan diversity in the region and that detected in our sediment cores. However, several species that characterize both Atlantic and Mediterranean CWC habitats also occur in our sediment core assemblages. Some of these species include the bivalves Asperarca nodulosa, Bathyarca philippiana, Delectopecten vitreus, Heteranomia squamula, Karnekampia sulcata, and Spondylus gussonii and the gastropods Danilia tinei, Putzeysia wiseri, and species of Mitrella (Rueda et al., 2019 and references therein).
4.1.2 Locally
At the ecosystem scale, several patterns emerge indicating different ecological signatures corresponding with the three CWC habitats studied. For instance, ANOSIM analyses for species, feeding, and mobility groups all yield significant differences in molluscan composition among the three cores. Higher abundances of molluscs in the mound top and upper flank cores likely reflect the longer duration of these cores (~13.2 – 2.5 kyr BP), allowing for a longer time interval for the accumulation of shells, than in the lower flank core, which spans only a few thousands of years (~12.1 – 9.7 kyr BP). Additionally, higher molluscan diversity in the lower flank core than in the mound top and upper flank cores alludes to spatial ecological variability documented across living CWC reefs, particularly CWC reefs on topographic highs (e.g., CWC mounds, seamounts, ridges) that tend to have habitat and biodiversity differentiation along a depth gradient and in relation to oceanographic conditions (Henry et al., 2010; Henry et al., 2014a; Henry and Roberts, 2017; Corbera et al., 2019).
In many living CWC mound ecosystems, benthic biodiversity tends to be greater on mound flanks than on mound tops – just as we have documented in the sediment cores (e.g., Henry and Roberts, 2007; Corbera et al., 2019; De Clippele et al., 2019). Presumably, high diversity would inhabit CWC mound tops where hydrodynamics are typically stronger and the availability of food is greater than on the less-exposed mound flanks (Freiwald et al., 2004; Huvenne et al., 2005; Davies et al., 2009; Lo Iacono et al., 2018). However, for these same reasons, living CWCs preferentially and opportunistically colonize mound tops and upper flanks (Mueller et al., 2014; Corbera et al., 2019), outcompeting other benthic organisms for resources (e.g., food, settlement space) and thereby limiting biodiversity in these areas (Henry and Roberts, 2017). As a result, higher biodiversity of CWC-associated fauna occurs just beyond areas of dense living coral cover, where the substrate is characterized by a combination of living and dead coral framework (Henry and Roberts, 2007; Corbera et al., 2019; De Clippele et al., 2019). Along with offering reduced competition with living corals for food and space, these coral degradation zones amplify ecological niches by providing a range of hard and soft substrates, sheltered cavities, and foraging grounds for various endo- and epifauna and benthic predators (Mortensen and Fosså, 2006; Buhl-Mortensen et al., 2010; Buhl-Mortensen et al., 2017a; Henry and Roberts, 2017).
At first glance, our ecological findings suggest that higher diversity in the lower flank core than in the mound top and upper flank cores is likely due to reduced competition with living CWCs for food and substrate and an increase in ecological niches typically available in a coral degradation zone. However, CT data and aggradation rates show that the lower flank core is largely composed of CWC framework and mound formation was rapid. Together these data signify flourishing coral growth throughout much of the lower flank core and not a coral degradation zone. With what is currently known about the distribution and drivers of CWC reef-associated fauna (Henry and Roberts, 2017; Corbera et al., 2019), how is it possible that relatively high molluscan diversity coincided and cohabitated with flourishing coral growth? We hypothesize that the lower flank experienced particularly strong hydrodynamics that delivered exceptionally high amounts of suspended food that exceeded the amount of food the CWCs in contact with the currents could consume, resulting in “leftovers” for other CWC reef fauna including molluscs. The presence of a deep moat along the western flank of the BRI coral mound where the lower flank core (GeoB13729-1) was collected (Figure 1B), supports this hypothesis. Strong bottom-water hydrodynamics would have carved this moat, and such conditions are often associated with the transportation and delivery of high amounts of suspended food (White et al., 2005; Thiem et al., 2006; White and Dorschel, 2010). The currents were apparently not so strong though as to inhibit CWCs from capturing suspended prey, given their proliferation on the lower flank (Purser et al., 2010; Orejas et al., 2016; Hennige et al., 2021). A surplus of food after CWCs took their share would have created ecological niches for benthic taxa not typically possible among living CWC colonies (Henry and Roberts, 2017), resulting in greater diversity on the lower flank than on and near the mound top where CWCs also thrived but currents, and potentially food supply, was lower.
The predominance of sessile filter feeders, particularly the bivalves Heteranomia squamula and Hiatella arctica, in nearly all assemblages suggests that these taxa are well-adapted for living across the CWC ecosystem. Their fixed life mode and method of filtering suspended food from currents are well-suited for the high-flow regimes and ample supply of suspended organic matter typically prevailing around CWC reefs (e.g., Mortensen and Fosså, 2006; Henry and Roberts, 2007; Rosso et al., 2010). Very high abundances of sessile filter feeders and few occurrences of mobile foragers and carnivores in the mound top and upper flank cores indicate that food availability was largely limited to suspended particles, with minimal food reaching the substrate. In contrast, higher abundances of mobile foraging and carnivorous molluscs in the lower flank core suggest a more diverse and ample food supply, in which more food reached the seafloor (Mortensen and Fosså, 2006; Buhl-Mortensen et al., 2010; Stalder et al., 2015; Henry and Roberts, 2017; Fentimen et al., 2020). Thus, the availability of food appears to have played an important role in creating ecological niches and driving diversity distribution across the CWC ecosystem.
4.2 Temporal ecological patterns
Although not detectable at the ecosystem scale among habitats, comparisons of molluscan assemblages within cores (within habitats) reveal significant differences between those from intervals of CWC FW and NFW. In the mound top and upper flank cores, molluscan assemblages from intervals of flourishing CWC growth are characterized by low diversity, high abundances of sessile filter feeders, and common occurrences of molluscs known to be specialists within living CWC framework such as the carnivorous gastropods Emarginula and Coralliophila (Bouchet & Warén, 1985; Gofas et al., 2011). This ecological signature resembles that of living reefs where living CWC cover is dense, competition is high, and ecological niches are few (Henry and Roberts, 2017). In contrast, assemblages from intervals of non-framework yield higher diversity and contain greater abundances of mobile deposit feeders and carnivores, like the ecological signature in coral degradation zones on living reefs where competition with CWCs is reduced, ecological niches are more diverse and abundant, and biodiversity is higher than where living corals thrive (e.g., Mortensen and Fosså, 2006; Buhl-Mortensen et al., 2010; Buhl-Mortensen et al., 2017a; Buhl-Mortensen et al., 2017b; Corbera et al., 2019). Overall, these patterns from the cores indicate that the sedimentary record of CWC reefs preserve ecological paradigms documented spatially on living CWC reefs. In this study, these ecological signals were recorded stratigraphically (vertically) as areas of living reef with flourishing coral growth transitioned over time to coral degradation zones (non-framework rubble and sediments) – and in some instances back to areas of flourishing coral growth. This finding also demonstrates that declining CWC reef ecosystems can contain relatively high diversity by providing a greater availability of ecological niches (facilitating colonization by different taxa) when competition with CWCs is reduced. The lack of a significant difference between molluscan assemblages from intervals of CWC FW and NFW in the lower flank core is likely attributable to the described surplus of food available along the lower flank, which enabled relatively high molluscan diversity even when living corals thrived.
4.2.1 Palaeoceanographic drivers of diversity
In the upper flank and mound top cores, significant correlations between high food availability and or strong hydrodynamics with low to moderately diverse molluscan species assemblages from FW intervals suggest that even when food was abundant it was not reaching the substrate and available for use by benthic taxa. These results suggest that thriving CWCs were likely consuming most of the suspended food before it reached the substrate (Henry and Roberts, 2017). Negative correlations between food availability and the abundances of deposit feeders and mobile infauna support this interpretation as do positive correlations between food availability and the abundances of filter feeders and sessile taxa – organisms with traits similar to CWCs. In the case of the lower flank core, a positive correlation between food availability and molluscan diversity during FW3 when CWCs were flourishing likely reflects the hypothesized surplus of food delivered to the exposed lower mound habitat by exceptionally strong bottom currents. However, relatively less food availability and lower molluscan diversity during other intervals of flourishing coral growth in the lower flank core (FW1 and FW2) align with the negative relationships between food availability and diversity observed in the mound top and upper flank cores. Altogether, these findings reflect the importance of high food availability and strong hydrodynamics for thriving CWC reefs (Duineveld et al., 2004; White et al., 2005; Thiem et al., 2006; Mienis et al., 2007; Davies et al., 2009; White and Dorschel, 2010; Wienberg et al., 2010; Duineveld et al., 2012; Mienis et al., 2012); and the effect that declines in these conditions and CWC growth positively affects reef diversity (Henry and Roberts, 2007; Henry and Roberts, 2017; Corbera et al., 2019; De Clippele et al., 2019; Fentimen et al., 2020).
Variable correlations between bottom-water temperature and molluscan diversity suggest that temperature is likely not the most important environmental factor contributing to the ecological dynamics captured in the sediment cores. Some low diversity molluscan assemblages from FW intervals in the upper flank core are significantly correlated with bottom-water temperatures near the uppermost end of CWC tolerance ranges in the Mediterranean Sea (13.9° C), suggestive of conditions in which CWCs would have flourished (Freiwald et al., 2004; Freiwald et al., 2009; Naumann et al., 2014). This finding aligns with the relationship of thriving CWC growth limiting benthic diversity in the immediate vicinity of the living corals (Henry and Roberts, 2007; Henry and Roberts, 2017; Corbera et al., 2019; De Clippele et al., 2019). However, relatively high bottom-water temperatures are also associated with more diverse molluscan assemblages in the same core. Collectively, these results suggest that bottom-water temperature does not have as strong of a connection to CWC growth and ecological competition in these sediment cores as food availability and hydrodynamics (Freiwald et al., 2004; Freiwald et al., 2009; Naumann et al., 2014; Portilho-Ramos et al., 2022).
Variable and few significant correlations between bottom-water salinity and oxygenation with molluscan diversity suggest that these parameters had minimal effect on reef diversity at BRI. The most abundant sessile filter feeding taxa in the sediment cores have been found in a wide range of habitats, from the upper shelf to the deep-sea, throughout the Mediterranean Sea and north Atlantic Ocean (Global Biodiversity Information Facility (GBIF), 2022b; Global Biodiversity Information Facility (GBIF), 2022c). Such extensive geographic and environmental ranges suggest that these molluscs have wide limits for their temperature and salinity tolerances and that the conditions at BRI were within these tolerance ranges (Ali, 1970). Additionally, it does not appear that oxygenation is a particularly limiting condition for molluscan diversity at BRI given that high molluscan diversity corresponds with relatively low bottom-water oxygenation, a condition that is more likely to cause low benthic diversity (Levin et al., 2006; Zettler et al., 2009). The alignment of high molluscan diversity with low bottom-water oxygenation and negligible CWC growth suggests that the molluscan diversity patterns reported here are driven more by other ecosystem changes, namely the availability of food and patterns in CWC growth, rather than direct physiological responses of molluscs to changes in palaeoceanographic parameters.
4.2.2 Habitat drivers of diversity
The association of relatively high coral volume with typically moderately – highly diverse species, feeding, and mobility assemblages in all cores partly aligns with a paradigm on living CWC reefs: where habitat structure is more diverse and without dense living CWCs, benthic diversity is higher (Price et al., 2019). Our results differ from this paradigm though in that high coral volume and diversity in the sediment cores occur during both intervals of CWC FW and NFW. This discrepancy suggests that coral volume is not a fully diagnostic parameter for differentiating intervals of FW and NFW (Wang et al., 2021). However, the positive relationship between coral volume and diversity in all cores as in living reefs signifies that coral volume may be a reasonable measure of habitat structure in CWC reef sedimentary records, and, if so, high coral volume likely benefited molluscan diversity by creating more complex habitat structures and thus more ecological niches, even when CWC growth was flourishing (e.g., Mortensen and Fosså, 2006; Buhl-Mortensen et al., 2010; Buhl-Mortensen et al., 2017a; Buhl-Mortensen et al., 2017b; Henry and Roberts, 2017).
Significant correlations between high aggradation rates with (a) low molluscan species diversity, (b) low abundances of multiple feeding and mobility groups, and (c) high abundances of filter feeders and sessile taxa may be because high aggradation rates correspond with intervals of flourishing coral growth (CWC FW), and flourishing coral growth tends to limit reef diversity in its immediate vicinity due to competition for food resources (Henry and Roberts, 2017). A potential concern is that low aggradation rates could also result in greater time averaging of molluscan shells, meaning that diversity may simply be amplified when sedimentation and mound formation are slow (Kidwell, 1998). In the upper flank core, significant negative correlations between aggradation rate and feeding diversity, mobility diversity, and the abundances of carnivores, deposit feeders, and all mobile fauna could suggest that low diversity is related to less time averaging when aggradation rates are high (e.g., >100 cm kyr-1) (Wang et al., 2021). Given these associations, it is possible that time averaging influences some of the diversity patterns and ecological relationships observed in the upper flank core. In contrast, aggradation rate is barely correlated with molluscan datasets in the mound top and lower flank cores, suggesting that the potential of time averaging is of minimal concern for these cores (habitats). Collectively, these results demonstrate that low aggradation rates are not clearly nor exclusively responsible for high diversity across the CWC ecosystem. This is however an important consideration when investigating the timing and causes for diversity dynamics on CWC reefs. Therefore, we suggest future studies investigate the relationship among benthic fossil records, mound aggradation rates, and time averaging by conducting rigorous age dating of benthic fossils such as molluscan shells. Given the lack of conclusive, ubiquitous correlation between aggradation rate and diversity in all cores of this study as well as the numerous correlations tying molluscan diversity to patterns of CWC FW and NFW, we suggest that the observed relationship between aggradation rate and diversity is more reflective of variations in CWC growth patterns than simply time averaging of the shells.
5 Conclusions
In providing the first quantitative ecological assessment of molluscan diversity in CWC reef sediment cores, our study demonstrates the utility of a geological approach for investigating long-term diversity dynamics in CWC reefs. Our findings indicate that at the ecosystem scale ecological differences between CWC habitats are more pronounced than ecological signatures of intervals of CWC FW and NFW. Yet within habitats, ecological differences are detectable between molluscan assemblages associated with CWC FW and NFW. Also at the habitat scale, it is apparent that molluscan diversity and assemblage composition are significantly correlated with palaeoceanographic conditions and habitat structure characteristics that indicate that molluscan diversity is generally suppressed when CWC growth is flourishing and boosted when CWC growth declines. The exception to this is when food availability surpasses what CWCs need to flourish, resulting in “leftovers” for other benthic taxa to utilize and diversify concurrently as is suggested with the lower flank core. These correlations between CWC-associated fauna and CWC growth align with ecological paradigms on living CWC reefs (Henry and Roberts, 2017; Fentimen et al., 2020) and demonstrate that flourishing CWC growth and conditions related to CWC growth drive local diversity patterns across CWC ecosystems and over time. These results also suggest that CWC reefs may continue to act as diversity hotspots for some taxa even after the iconic living CWCs cease to dominate the habitat.
How long a stagnant CWC reef may continue to harbor high diversity is likely highly variable, both spatially and temporally, depending on the persistence of optimal oceanographic conditions, exposure of habitat structure, and ecological interactions (Buhl-Mortensen et al., 2010; Buhl-Mortensen et al., 2017a; Henry and Roberts, 2017; Hennige et al., 2020; Kazanidis et al., 2021a; Hennige et al., 2021). Although a stagnant CWC reef may still function as a biodiversity hotspot for some fauna for some time, it should be noted that other ecosystem functions, such as carbon sequestration (Titschack et al., 2016) or providing nursery grounds for pelagic fauna (Rossi et al., 2017), may also decline with decreasing living CWC cover. As such, the ecosystem as a whole will be modified. However, the persistence of CWC reefs as biodiversity hotspots after coral growth declines implies that even stagnant reefs may play an important role in the assembly and distribution of biodiversity in the deep sea by providing biological refuges for some taxa (Henry et al., 2014b). Using this study as a framework, fossils of other taxa and ancient DNA (Cordier et al., 2022) could be used to test hypotheses related to the CWC faunal community more broadly and to the connectivity of living and stagnant reefs over geologic time and their role in supporting biogeographic trends in the deep sea.
Statements
Data availability statement
The original contributions presented in the study are included in the article/Supplementary Material. The ecological data for the study are provided in the supplemental files, and the files with the geological data and chronology calculations are with PANGAEA. For details and inquiries about these, please direct them to the to the corresponding author.
Author contributions
CK, DH, CW, and JT contributed to conception and design of the study. CK collected molluscan samples. CK and LH processed samples. JT conducted CT-scanning and data processing. RP-R prepared palaeoceanographic data. CW organized and processed coral age dating. CK performed statistical analysis and wrote the first draft of the manuscript with contributions by CW. All authors contributed to manuscript revision, read, and approved the submitted version.
Funding
Research funding was provided to CK by the Cluster of Excellence “The Ocean Floor – Earth’s Uncharted Interface” at the MARUM Center for Marine Environmental Sciences. RP-R received financial support from the European Union’s Horizon 2020 iAtlantic project (Grant 818123).
Acknowledgments
We thank the nautical and scientific crews during RV Poseidon cruise POS 385 for on-board assistance, the Deutsche Forschungsgemeinschaft (DFG) for providing ship time for cruise POS 385, and the Cluster of Excellence “The Ocean Floor – Earth’s Uncharted Interface” for research funding. RP-R acknowledges the financial support from the European Union’s Horizon 2020 iAtlantic project (Grant 818123). We kindly acknowledge the GeoB Core Repository at the MARUM Center for Marine Environmental Sciences (University of Bremen) for providing sediment cores and sample material. We greatly appreciate lab support from S. Janssen with sample processing, René Eichstädter, Norbert Frank, and Andrea Schröder-Ritzrau for conducting, curating and interpreting U-series results. We also value constructive discussions with H. Wang, L. Dupont, A. Tobben, and K. Arkle.
Conflict of interest
The authors declare that the research was conducted in the absence of any commercial or financial relationships that could be construed as a potential conflict of interest.
Publisher’s note
All claims expressed in this article are solely those of the authors and do not necessarily represent those of their affiliated organizations, or those of the publisher, the editors and the reviewers. Any product that may be evaluated in this article, or claim that may be made by its manufacturer, is not guaranteed or endorsed by the publisher.
Supplementary material
The Supplementary Material for this article can be found online at: https://www.frontiersin.org/articles/10.3389/fmars.2022.895946/full#supplementary-material
References
1
Addamo A. M. Vertino A. Stolarski J. García-Jiménez R. Taviani M. Machordom A. (2016). Merging scleractinian genera: The overwhelming genetic similarity between solitary Desmophyllum and colonial Lophelia. BMC Evol. Biol.16, 108. doi: 10.1186/s12862-016-0654-8
2
Ali R. M. (1970). The influence of suspension density and temperature on the filtration rate of Hiatella arctica. Mar. Biol.6, 291–302. doi: 10.1007/BF00353662
3
Arkle K. Miller A. (2018). Evidence for stratigraphy in molluscan death assemblages preserved in seagrass beds: St. Croix, U.S. virgin islands. Paleobiology44 (1), 155–170. doi: 10.1017/pab.2017.26
4
Boolukos C. M. Lim A. O’Riordan R. M. Wheeler A. J. (2019). Cold-water corals in decline – a temporal (4 year) species abundance and biodiversity appraisal of complete photomosaiced cold-water coral reef on the Irish margin. Deep Sea Res. Part I: Oceanogr. Res. Pap.146, 44–54. doi: 10.1016/j.dsr.2019.03.004
5
Border E. C. (2020). Variability of δ234U in the Mediterranean Sea, Amazon estuary, and Atlantic ocean. Ph.D. thesis (Heidelberg (Germany: Heidelberg University). doi: 10.11588/heidok.00028744
6
Bouchet P. Warén A. (1985). Revision of the northeast Atlantic bathyal and abyssal neogastropoda, excluding turridae. Bollettino Malacol.Supplement 1, 121–296. doi: 10.5962/bhl.title.140763
7
Bray J. R. Curtis J. T. (1957). An ordination of the upland forest communities of southern Wisconsin. Ecol. Monogr.27, 325–349. doi: 10.2307/1942268
8
Buhl-Mortensen P. Buhl-Mortensen L. Purser A. (2017a). “Trophic ecology and habitat provision in cold-water coral ecosystems,” in Marine animal forests: The ecology of benthic biodiversity hotspot. Eds. RossiS.BramantiL.GoriA.OrejasC. (Cham, Switzerland: Springer), 919–944. doi: 10.1007/978-3-319-21012-4_20
9
Buhl-Mortensen L. Serigstad B. Buhl-Mortensen P. Olsen M. Ostrowski M. Blazewicz-Paszkowycz M. et al . (2017b). First observations of the structure and megafaunal community of a large Lophelia reef on the ghanaian shelf (the Gulf of Guinea). Deep Sea Res. Part II: Topical Stud. Oceanogr.137, 148–156. doi: 10.1016/j.dsr2.2016.06.007
10
Buhl-Mortensen L. Vanreusel A. Gooday A. J. Levin L. A. Priede I. G. Buhl-Mortensen P. et al . (2010). Biological structures as a source of habitat heterogeneity and biodiversity on the deep ocean margins. Mar. Ecol.31 (1), 21–50. doi: 10.1111/j.1439-0485.2010.00359.x
11
Büscher J. V. Form A. U. Riebesell U. (2017). Interactive effects of ocean acidification and warming on growth, fitness and survival of the cold-water coral Lophelia pertusa under different food availabilities. Front. Mar. Sci.4. doi: 10.3389/fmars.2017.00101
12
Clarke K. R. Warwick R. M. (2001). Change in marine communities: An approach to statistical analysis and interpretation. 2nd ed (Plymouth, U.K: PRIMER-E).
13
Comas M. Pinheiro L. M. (2007). “Discovery of carbonate mounds in the Alboran Sea: The Melilla mound field,” in Abstract for the First MAPG International Convention, Conference & Exhibition Marrakech Convention Center, October 28 - 31 2007.
14
Corbera G. Lo Iacono C. Gràcia E. Grinyó J. Pierdomenico M. Huvenne V. A. I. et al . (2019). Ecological characterisation of a Mediterranean cold-water coral reef: Cabliers coral mound province (Alboran Sea, western Mediterranean). Prog. Oceanogr.175, 245–262. doi: 10.1016/j.pocean.2019.04.010
15
Corbera G. Lo Iacono C. Standish C. D. Anagnostou E. Titschack J. Katsamenis O. et al . (2021). Glacio-eustatic variations and sapropel events as main controls on the middle Pleistocene-Holocene evolution of the calibers coral mound province (W Mediterranean). Quaternary Sci. Rev.253, 106783. doi: 10.1016/j.quascirev.2020.106783
16
Cordier T. Barrenechea Angeles I. Henry N. Lejzerowicz F. Berney C. Morard R. et al . (2022). Patterns of eukaryotic diversity from the surface to the deep-ocean sediment. Sci. Adv.8 (5), 1–13. doi: 10.1126/sciadv.abj9309
17
Cossignani T. Ardovini R. (2011). Malacologia mediterranea, atlante delle conchiglie del mediterraneo (Ancona: L’informatore Piceno).
18
Cramer K. L. Donovan M. K. Jackson J. B. C. Greenstein B. J. Korpanty C. A. Cook G. M. et al . (2021). The transformation of Caribbean coral communities since humans. Ecol. Evol.11, 10098–10118. doi: 10.1002/ece3.7808
19
Crocetta F. Spanu M. (2008). Molluscs associated with a sardinian deep water population of Corallium rubrum (Linné, 1758). Mediterr. Mar. Sci.9, 63–85. doi: 10.12681/mms.133
20
Davies A. J. Duineveld G. C. Lavaleye M. S. Bergman M. J. van Haren H. Roberts J. M. (2009). Downwelling and deep-water bottom currents as food supply mechanisms to the cold-water coral Lophelia pertusa (Scleractinia) at the mingulay reef complex. Limnol. Oceanogr.54, 620–629. doi: 10.4319/lo.2009.54.2.0620
21
Davies A. J. Guinotte J. M. (2011). Global habitat suitability for framework-forming cold-water corals. PloS One6, e18483. doi: 10.1371/journal.pone.0018483
22
Davies A. J. Wisshak M. Orr J. C. Roberts J. M. (2008). Predicting suitable habitat for the cold-water coral Lophelia pertusa (Scleractinia). Deep Sea Res. Part I: Oceanogr. Res. Pap.55, 1048–1062. doi: 10.1016/j.dsr.2008.04.010
23
De Clippele L. H. Huvenne V. A. I. Orejas C. Lundälv T. Fox A. Hennige S. J. et al . (2018). The effect of local hydrodynamics on the spatial extent and morphology of cold-water coral habitats at Tisler reef, Norway. Coral Reefs37, 253–266. doi: 10.1007/s00338-017-1653-y
24
De Clippele L. H. Huvenne V. A. I. Molodtsova T. N. Murray Roberts J. M. (2019). The diversity and ecological role of non-scleractinian corals (Antipatharia and alcyonacea) on scleractinian cold-water coral mounds. Front. Mar. Sci.6. doi: 10.3389/fmars.2019.00184
25
Dorschel B. Hebbeln D. Foubert A. White M. Wheeler A. J. (2007). Hydrodynamics and cold-water coral facies distribution related to recent sedimentary processes at Galway mound west of Ireland. Mar. Geology244, 184–195. doi: 10.1016/j.margeo.2007.06.010
26
Duineveld G. C. Jeffreys R. M. Lavaleye M. S. Davies A. J. Bergman M. J. Watmough T. et al . (2012). Spatial and tidal variation in food supply to shallow cold-water coral reefs of the mingulay reef complex (Outer Hebrides, Scotland). Mar. Ecol. Prog. Ser.444, 97–115. doi: 10.3354/meps09430
27
Duineveld G. C. A. Lavaleye M. S. S. Berghuis E. M. (2004). Particle flux and food supply to a seamount cold-water coral community (Galicia bank, NW Spain). Mar. Ecol. Prog. Ser.277, 13–23. doi: 10.3354/meps277013
28
Eisele M. Frank N. Wienberg C. Hebbeln D. López Correa M. Douville E. et al . (2011). Productivity controlled cold-water coral growth periods during the last glacial off Mauritania. Mar. Geology280, 143–149. doi: 10.1016/j.margeo.2010.12.007
29
Fentimen R. Feenstra E. Rüggeberg A. Hall E. Rime V. Vennemann T. et al . (2022). A 300,000-year record of cold-water coral mound build-up at the East Melilla coral province (SE Alboran Sea, western Mediterranean). Climate Past18, 1915–1945. doi: 10.5194/cp-18-1915-2022
30
Fentimen R. Feenstra E. Rüggeberg A. Vennemann T. Hajdas I. Adatte T. et al . (2020). Cold-water coral mound archive provides unique insights into intermediate water mass dynamics in the Alboran Sea during the last deglaciation. Front. Mar. Sci.7. doi: 10.3389/fmars.2020.00354
31
Fink H. G. Wienberg C. De Pol-Holz R. Wintersteller P. Hebbeln D. (2013). Cold-water coral growth in the alboran Sea related to high productivity during the late Pleistocene and Holocene. Mar. Geology339, 71–82. doi: 10.1016/j.margeo.2013.04.009
32
Flögel S. Dullo W. C. Pfannkuche O. Kiriakoulakis K. Rüggeberg A. (2014). Geochemical and physical constraints for the occurrence of living cold-water corals. Deep Sea Res. Part II: Topical Stud. Oceanogr.99, 19–26. doi: 10.1016/j.dsr2.2013.06.006
33
Frank N. Paterne M. Ayliffe L. van Weering T. Henriet J.-P. Blamart D. (2004). Eastern North Atlantic deep-sea corals: Tracing upper intermediate water Δ14C during the Holocene. Earth Planet. Sci. Lett.219, 3–4, 297-309. doi: 10.1016/S0012-821X(03)00721-0
34
Frank N. Ricard E. Lutringer-Paquet A. van der Land C. Colin C. Blamart D. et al . (2009). The Holocene occurrence of cold water corals in the NE Atlantic: Implications for coral carbonate mound evolution. Mar. Geology266, 129–142. doi: 10.1016/j.margeo.2009.08.007
35
Freiwald A. Beuck L. Rüggeberg A. Taviani M. Hebbeln D. (2009). The white coral community in the central Mediterranean Sea revealed by ROV surveys. Oceanography22, 58–74. doi: 10.5670/oceanog.2009.06
36
Freiwald A. Fossa J. H. Grehan A. Koslow T. Roberts J. M. (2004). Cold-water coral reefs (Cambridge, U.K: UNEP-WCMC).
37
Fretter V. Graham A. (1976). The prosobranch molluscs of Britain and Denmark. Part 1 - Pleurotomariacea, Fissurellacea and Patellacea. J. Molluscan Stud. (Suppl. 1), 1–36.
38
Fretter V. Graham A. (1977). The prosobranch molluscs of Britain and Denmark. Part 2 - Trochacea. J. Molluscan Stud.Suppl. 3, 39–100.
39
Fretter V. Graham A. (1978a). The prosobranch molluscs of Britain and Denmark. Part 3 - Neritacea, Viviparacea, Valvatacea, terrestrial and freshwater littorinacea and rissoaceaJ. Molluscan Stud.Suppl. 5, 101–152.
40
Fretter V. Graham A. (1978b). The prosobranch molluscs of Britain and Denmark. Part 4 - marine Rissoacea. J. Molluscan Stud.Suppl. 6, 153–241.
41
Fretter V. Graham A. (1980). The prosobranch molluscs of Britain and Denmark. Part 5 - marine littorinacea. J. Molluscan Stud.Suppl. 7, 243–284.
42
Fretter V. Graham A. (1981). The prosobranch molluscs of Britain and Denmark. Part 6 - Cerithiacea, Strombacea, Hipponicacea, calyptraeacea, lamellariacea, cypraeacea, naticacea, tonnacea, heteropoda. J. Molluscan Stud.Suppl. 9, 285–363.
43
Fretter V. Graham A. (1982). The prosobranch molluscs of Britain and Denmark. Part 7 - "Heterogastropoda" (Cerithiopsacea, triphoracea, epitoniacea, eulimacea). J. Molluscan Stud.Suppl 11, 363–434.
44
Fretter V. Graham A. (1984). The prosobranch molluscs of Britain and Denmark. Part 8 - Neogastropoda. J. Molluscan Stud.Suppl. 15, 435–556.
45
Gilinsky N. L. Bennington J. B. (1994). Estimating numbers of whole individuals from collections of body parts: a taphonomic limitation of the paleontological record. Paleobiology20 (2), 245–258. doi: 10.1017/S0094837300012719
46
Global Biodiversity Information Facility (GBIF) (2022a) GBIF occurrence download (Mollusca, Morocco) (Accessed March 1, 2022).
47
Global Biodiversity Information Facility (GBIF) (2022b) GBIF occurrence download: Heteranomia squamula, Mediterranean Sea, north Atlantic ocean. 10.15468/dl.tdvttc(Accessed March 11, 2022). doi: 10.15468/dl.tdvttc
48
Global Biodiversity Information Facility (GBIF) (2022c) GBIF occurrence download: Hiatella arctica, Mediterranean Sea, north Atlantic ocean. (Accessed March 11, 2022). doi: 10.15468/dl.eku29a
49
Gofas S. Moreno D. Salas C. (2011). Moluscos marinos de andalucía (Málaga: Universidad de Málaga, Junta de Andalucía).
50
Heaton T. J. Köhler P. Butzin M. Bard E. Reimer R. W. Austin W. E. N. et al . (2020). Marine20–the marine radiocarbon age calibration curve (0–55,000 cal BP). Radiocarbon62 (4), 779–820. doi: 10.1017/RDC.2020.68
51
Hebbeln D. (2019). “Highly variable submarine landscapes in the Alborán Sea created by cold-water corals,” in Mediterranean Cold-water corals: Past, present and future, springer series: Coral reefs of the world. Eds. OrejasC.JiménezC. (Cham, Switzerland: Springer), 61–65.
52
Hebbeln D. Wienberg C. Beuck L. Freiwald A. Wintersteller P. cruise participants (2009). Report and preliminary results of RV POSEIDON cruise POS 385 “Cold-water corals of the Alboran Sea (western Mediterranean sea)”, Faro–Toulon, may 29–June 16, 2009. Berichte Fachbereich Geowissenschaften Universität Bremen273, 79.
53
Hennige S. J. Larsson A. I. Orejas C. Gori A. De Clippele L. H. Lee Y. C. et al . (2021). Using the goldilocks principle to model coral ecosystem engineering. Proc. R. Soc. B: Biol. Sci.288, 20211260. doi: 10.1098/rspb.2021.1260
54
Hennige S. J. Wolfram U. Wickes L. Murray F. Roberts J. M. Kamenos N. A. et al . (2020). Crumbling reefs and cold-water coral habitat loss in a future ocean: Evidence of “Coralporosis“ as an Indicator Habitat Integrity. Front. Mar. Sci.7. doi: 10.3389/fmars.2020.00668
55
Henry L. A. Davies A. J. Roberts J. M. (2010). Beta diversity of cold-water coral reef communities off western Scotland. Coral Reefs29, 427–436. doi: 10.1007/s00338-009-0577-6
56
Henry L. A. Frank N. Hebbeln D. Wienberg C. Robinson L. van de Flierdt T. et al . (2014b). Global ocean conveyor lowers extinction risk in the deep sea. Deep Sea Res. Part I: Oceanogr. Res. Pap.88, 8–16. doi: 10.1016/j.dsr.2014.03.004
57
Henry L.-A. Navas J. M. Hennige S. J. Wicks L. C. Vad J. Roberts J. M. (2013). Cold-water coral reef habitats benefit recreationally valuable sharks. Biol. Conserv.161, 67–70. doi: 10.1016/j.biocon.2013.03.002
58
Henry L. A. Roberts J. M. (2007). Biodiversity and ecological composition of macrobenthos on cold-water coral mounds and adjacent off-mound habitat in the bathyal Porcupine Seabight, NE Atlantic. Deep Sea Res. Part I: Oceanogr. Res. Pap.54 (4), 654–672. doi: 10.1016/j.dsr.2007.01.005
59
Henry L. A. Roberts J. M. (2017). “Global biodiversity in cold-water coral reef ecosystems,” in Marine animal forests. Eds. RossiS.BramantiL.GoriA.OrejasC. (Cham, Switzerland: Springer), 235–256. doi: 10.1007/978-3-319-21012-4_6
60
Henry L. A. Vad J. Findlay H. Murillo J. Milligan R. Roberts J. M. (2014a). Environmental variability and biodiversity of megabenthos on the Hebrides terrace seamount (Northeast Atlantic). Sci. Rep.4, 5589. doi: 10.1038/srep05589
61
Hoffman L. Freiwald A. (2017). A unique and diverse amalgamated mollusc assemblage from the coral patch seamount, eastern Atlantic. Miscellanea Malacol.7 (4), 61–79.
62
Hsieh T. C. Ma K. H. Chao A. (2016). iNEXT: An r package for rarefaction and extrapolation of species diversity (Hill numbers). Methods Ecol. Evol.7 (12), 1451–1456. doi: 10.1111/2041-210X.12613
63
Huber M. (2010). Compendium of bivalves. a full-color guide to 3,300 of the world’s marine bivalves. a status on bivalvia after 250 years of research. part I (Hackenheim D: ConchBooks).
64
Huber M. (2015). Compendium of bivalves. a full-color guide to 3,300 of the world’s marine bivalves. a status on bivalvia after 250 years of research part II (Hackenheim D: ConchBooks).
65
Huvenne V. A. I. Bett B. J. Masson D. G. Le Bas T. P. Wheeler A. J. (2016). Effectiveness of a deep-sea cold-water coral marine protected area, following eight years of fisheries closure. Biol. Conserv.200, 60–69. doi: 10.1016/j.biocon.2016.05.030
66
Huvenne V. A. I. Beyer A. de Haas H. Dekindt K. Henriet J. P. Kozachenko M. et al . (2005). “The seabed appearance of different coral bank provinces in the Porcupine Seabight, NE Atlantic: Results from sidescan sonar and ROV seabed mapping,” in Cold-water corals and ecosystems. Eds. FreiwaldA.RobertsJ. M. (Heidelberg, Germany: Springer-Verlag), 535–569. doi: 10.1007/3-540-27673-4_27
67
Juva K. Flögel S. Karstensen J. Linke P. Dullo W.-C. (2020). Tidal dynamics control on cold-water coral growth: A high-resolution multivariable study on eastern Atlantic cold-water coral sites. Front. Mar. Sci.7. doi: 10.3389/fmars.2020.00132
68
Kano A. Ferdelman T. G. Williams T. Henriet J.-P. Ishikawa T. Kawagoe N. et al . (2007). Age constrains on the origin and growth history of a deep-water coral mound in the northeast Atlantic drilled during integrated ocean drilling program expedition 307. Geology35 (11), 1051–1054. doi: 10.1130/G23917A.1
69
Kazanidis G. Henry L. A. Roberts J. M. (2021a). Hidden structural heterogeneity enhances marine hotspots’ biodiversity. Coral Reefs40, 1615–1630. doi: 10.1007/s00338-021-02114-w
70
Kazanidis G. Henry L. A. Vad J. Johnson C. De Clippele L. H. Roberts J. M. (2021b). Sensitivity of a cold-water coral reef to interannual variability in regional oceanography. Diversity Distrib.27, 1719–1731. doi: 10.1111/ddi.13363
71
Kenyon N. H. Akhmetzhanov A. M. Wheeler A. J. van Weering T. C. E. de Haas H. Ivanov M. K. (2003). Giant carbonate mud mounds in the southern Rockall Trough. Mar. Geology195, 5–30. doi: 10.1016/S0025-3227(02)00680-1
72
Kidwell S. M. (1998). Time-averaging in the marine fossil record: overview of strategies and uncertainties. GEOBIOS30 (7), 977–995. doi: 10.1016/S0016-6995(97)80219-7
73
Kidwell S. M. (2013). Time-averaging and fidelity of modern death assemblages: Building a taphonomic foundation for conservation palaeobiology. Palaeontology56 (3), 487–522. doi: 10.1111/pala.12042
74
Levin L. A. Cowie G. Woulds C. Lamont P. Whitcraft C. (2006). “Oxygen minimum zone influence on benthos: Boundary effects, threshold and bioturbation,” in Geophysical research abstracts 8, 01793. abstract retrieved from European geophysical union meetings database. European Geosciences Union, Munich, Germany
75
Lo Iacono C. Gràcia E. Ranero C. R. Emelianov M. Huvenne V. A. I. Bartolomém R. et al . (2014). The West Melilla cold water coral mounds, Eastern Alboran Sea: Morphological characterization and environmental context. Deep Sea Res. Part II99, 316–326. doi: 10.1016/j.dsr2.2013.07.006
76
Lo Iacono C. Savini A. Basso D. (2018). “Cold-water carbonate bioconstructions,” in Submarine geomorphology. Eds. MicallefA.KrastelS.SaviniA. (Cham, Switzerland: Springer Geology), 425–455. doi: 10.1007/978-3-319-57852-1_22
77
Matos L. Wienberg C. Titschack J. Schmiedl G. Frank N. Abrantes F. et al . (2017). Coral mound development at the Campeche cold-water coral province, southern Gulf of Mexico: Implications of Antarctic intermediate water increased influence during interglacials. Mar. Geology392, 53–65. doi: 10.1016/j.margeo.2017.08.012
78
Mienis F. De Stigter H. C. De Haas H. van der Land C. Van Weering T. C. E. (2012). Hydrodynamic conditions in a cold-water coral mound area on the Renard Ridge, southern Gulf of Cadiz. J. Mar. Syst.96-97, 61–71. doi: 10.1016/j.jmarsys.2012.02.002
79
Mienis F. de Stigter H. C. White M. Duineveld G. de Haas H. van Weering T. C. E. (2007). Hydrodynamic controls on cold-water coral growth and carbonate-mound development at the SW and SE Rockall Trough margin, NE Atlantic Ocean. Deep Sea Res. Part I: Oceanogr. Res. Pap.54, 1655–1674. doi: 10.1016/j.dsr.2007.05.013
80
Mienis F. van Weering T. de Haas H. de Stigter H. Huvenne V. Wheeler A. (2006). Carbonate mound development at the SW Rockall Trough margin based on high resolution TOBI and seismic recording. Mar. Geology233, 1–19. doi: 10.1016/j.margeo.2006.08.003
81
Mihaljević M. Korpanty C. Renema W. Welsh K. Pandolfi J. (2017). Identifying patterns and drivers of coral diversity in the central indo-pacific marine biodiversity hotspot. Paleobiology43 (3), 343–364. doi: 10.1017/pab.2017.1
82
Mohtadi M. Prange M. Oppo D. W. De Pol-Holz R. Merkel U. Zhang X. et al . (2014). North Atlantic forcing of tropical Indian Ocean climate. Nature509, 76–80. doi: 10.1038/nature13196
83
Mortensen P. B. Fosså J. H. (2006). “Species diversity and spatial distribution of invertebrates on deep-water Lophelia reefs in Norway,” in Proceedings of the 10th international coral reefs symposium, Okinawa (Japan, June–July 2004. 1849–1868.
84
Mueller C. E. Larsson A. I. Veuger B. Middelburg J. J. Van Oevelen D. (2014). Opportunistic feeding on various organic food sources by the cold-water coral Lophelia pertusa. Biogeosciences11 (1), 123–133. doi: 10.5194/bg-11-123-2014
85
Naumann M. S. Orejas C. Ferrier-Pagès C. (2014). Species-specific physiological response by the cold-water corals Lophelia pertusa and Madrepora oculata to variations within their natural temperature range. Deep Sea Res. Part II: Topical Stud. Oceanogr.99, 36–41. doi: 10.1016/j.dsr2.2013.05.025
86
Negri M. Corselli C. (2016). Bathyal Mollusca from the cold-water coral biotope of Santa Maria di Leuca (Apulian margin, southern Italy). Zootaxa4186 (1), 4186. doi: 10.11646/zootaxa.4186.1.1
87
Oksanen J. Blanchet F. G. Friendly M. Kindt R. Legendre P. McGlinn D. et al . (2018) Community ecology package version 2.5-3. Available at: https://cran.r-project.orghttps://github.com/vegandevs/vegan.
88
Orejas C. Gori A. Rad-Menéndez C. Last K. S. Davies A. J. Beveridge C. M. et al (2016). The effect of flow speed and food size on the capture efficiency and feeding behavior of the cold-water coral Lophelia pertusa. J. Exp. Mar. Biol. Ecol.481, 34–40. doi: 10.1016/j.jembe.2016.04.002
89
Portilho-Ramos R. Titschack J. Wienberg C. Siccha M. Yokohama Y. Hebbeln D. (2022). Major environmental drivers determining life and death of cold-water corals through time. PloS Biol.20 (5), e3001628. doi: 10.1371/journal.pbio.3001628
90
Price D. M. Robert K. Callaway A. Lo Iacono C. Hall R. A. Huvenne V. A. I. (2019). Using 3D photogrammetry from ROV video to quantify cold-water coral reef structural complexity and investigate its influence on biodiversity and community assemblage. Coral Reefs38, 1007–1021. doi: 10.1007/s00338-019-01827-3
91
Purser A. (2015). A time series study of Lophelia pertusa and reef megafauna responses to drill cuttings exposure on the Norwegian margin. PloS One10 (7), e0134076. doi: 10.1371/journal.pone.0134076
92
Purser A. Larsson A. I. Thomsen L. van Oevelen D. (2010). The influence of flow velocity and food concentration on Lophelia pertusa (Scleractinia) zooplankton capture rates. J. Exp. Mar. Biol. Ecol.395, 55–62. doi: 10.1016/j.jembe.2010.08.013
93
Raddatz J. Titschack J. Frank N. Freiwald A. Conforti A. Osborne A. et al . (2020). Solenosmilia variabilis-bearing cold-water coral mounds off Brazil. Coral Reefs39, 69–83. doi: 10.1007/s00338-019-01882-w
94
R Core Team (2021). “R: A language and environment for statistical computing. R Foundation for Statistical Computing(Vienna, Austria). Available at: http://www.R-project.org/.
95
Reimer P. J. McCormac F. G. (2002). Marine radiocarbon reservoir corrections for the Mediterranean and Aegean seas. Radiocarbon44 (1), 159–166. doi: 10.1017/S0033822200064766
96
Roberts J. M. Wheeler A. J. Freiwald A. (2006). Reefs of the deep: The biology and geology of cold-water coral ecosystems. Science312, 543–547. doi: 10.1126/science.1119861
97
Roberts J. Wheeler A. Freiwald A. Cairns S. (2009). Cold-water corals: The biology and geology of deep-Sea coral habitats (New York: Cambridge University Press). doi: 10.1017/CBO9780511581588
98
Rossi S. Bramanti L. Gori A. Orejas C. (2017). Marine animal forests: The ecology of benthic biodiversity hotspots (Berlin, Germany: Springer).
99
Rosso A. Vertino A. Di Geronimo I. Sanfilippo R. Sciuto F. Di Geronimo R. et al . (2010). Hard- and soft-bottom thanatofacies from the Santa Maria Di Leuca deep-water coral province, Mediterranean. Deep Sea Res. Part II: Topical Stud. Oceanogr.57 (5-6), 360–379. doi: 10.1016/j.dsr2.2009.08.024
100
Rueda J. L. Urra J. Aguilar R. Angeletti L. Bo M. García-Ruiz C. et al . (2019). “Cold-water coral associated fauna in the Mediterranean Sea and adjacent areas,” in Mediterranean Cold-water corals: Past, present and future, springer series: Coral reefs of the world. Eds. OrejasC.JiménezC. (Cham, Switzerland: Springer), 295–333. doi: 10.1007/978-3-319-91608-8_29
101
Shimadzu H. (2018). On species richness and rarefaction: Size- and coverage-based techniques quantify different characteristics of richness change in biodiversity. J. Math. Biol.77, 1363–1381. doi: 10.1007/s00285-018-1255-5
102
Siani G. Paterne M. Arnold M. Bard E. Métivier B. Tisnerat N. et al . (2000). Radiocarbon reservoir ages in the Mediterranean Sea and Black Sea. Radiocarbon42 (2), 271–280. doi: 10.1017/S0033822200059075
103
Siani G. Paterne M. Michel E. Sulpizio R. Sbrana A. Arnold M. et al . (2001). Mediterranean Sea Surface radiocarbon reservoir age changes since the last glacial maximum. Science294 (5548), 1917–1920. doi: 10.1126/science.1063649
104
Soland K. R. Kerhoulas L. P. Kerhoulas N. J. Teraoka J. R. (2021). Second-growth redwood forest responses to restoration treatments. For. Ecol. Manage.496, 119370. doi: 10.1016/j.foreco.2021.119370
105
Stalder C. Vertino A. Rosso A. Rüggeberg A. Pirkenseer C. Spangenberg J. E. et al . (2015). Microfossils, a key to unravel cold-water carbonate mound evolution through time: Evidence from the eastern Alboran Sea. PloS One10, e0140223. doi: 10.1371/journal.pone.0140223
106
Steinmann L. Baques M. Wenau S. Schwenk T. Spiess V. Piola A. R. et al . (2020). Discovery of a giant cold-water coral mound province along the northern Argentine margin and its link to the regional contourite depositional system and oceanographic setting. Mar. Geology427, 106223. doi: 10.1016/j.margeo.2020.106223
107
Stuiver M. Reimer P. J. Reimer R. W. (2021) CALIB 8.2 [WWW program]. Available at: http://calib.org (Accessed 2021-10-29).
108
Thiem Ø. Ravagnan E. Fosså J. H. Berntsen J. (2006). Food supply mechanisms for cold-water corals along a continental shelf edge. J. Mar. Syst.60, 207–219. doi: 10.1016/j.jmarsys.2005.12.004
109
Titschack J. Baum D. De Pol-Holz R. López Correa M. Forster N. Flögel S. et al . (2015). Aggradation and carbonate accumulation of Holocene Norwegian cold-water coral reefs. Sedimentology62 (7), 1873–1898. doi: 10.1111/sed.12206
110
Titschack J. Fink H. G. Baum D. Wienberg C. Hebbeln D. Freiwald A. (2016). Mediterranean Cold-water corals - an important regional carbonate factory? Depositional Rec.2, 74–96. doi: 10.1002/dep2.14
111
Vad J. Orejas C. Moreno-Navas J. Findlay H. S. Roberts J. M. (2017). Assessing the living and dead proportions of cold-water coral colonies: Implications for deep-water marine protected area monitoring in a changing Ocean. PeerJ5, e3705. doi: 10.7717/peerj.3705
112
Wang H. Lo Iacono C. Wienberg C. Titschack J. Hebbeln D. (2019). Cold-water coral mounds in the southern Alboran Sea (western Mediterranean Sea): Internal waves as an important driver for mound formation since the last deglaciation. Mar. Geology412, 1–18. doi: 10.1016/j.margeo.2019.02.007
113
Wang H. Titschack J. Wienberg C. Korpanty C. Hebbeln D. (2021). The importance of ecological accommodation space and sediment supply for cold-water coral mound formation, a case study from the Western Mediterranean Sea. Front. Mar. Sci.8. doi: 10.3389/fmars.2021.760909
114
Wefing A.-M. Arps J. Blaser P. Wienberg C. Hebbeln D. Frank N. (2017). High precision U-series dating of scleractinian cold-water corals using an automated chromatographic U and Th extraction. Chem. Geology475, 140–148. doi: 10.1016/j.chemgeo.2017.10.036
115
Wheeler A. J. Beyer A. Freiwald A. de Haas H. Huvenne V. A. I. Kozachenko M. et al . (2007). Morphology and environment of cold-water coral carbonate mounds on the NW European margin. Int. J. Earth Sci.96 (1), 37–56. doi: 10.1007/s00531-006-0130-6
116
White M. Dorschel B. (2010). The importance of the permanent thermocline to the cold water coral carbonate mound distribution in the NE Atlantic. Earth Planet. Sci. Lett.296 (3-4), 395–402. doi: 10.1016/j.epsl.2010.05.025
117
White M. Mohn C. de Stigter H. Mottran G. (2005). “Deep-water coral development as a function of hydrodynamics and surface productivity around the submarine banks of the Rockall Trough, NE Atlantic,” in Cold-water corals and ecosystems. Eds. FreiwaldA.RobertsJ. M. (Berlin, Germany: Springer-Verlag), 503-514). doi: 10.1007/3-540-27673-4_25
118
Wienberg C. Frank N. Mertens K. Stuut J.-B. Marchant M. Fietzke J. et al . (2010). Glacial cold-water corals growth in the Gulf of Cádiz: Implications of increased palaeo-productivity. Earth Planet. Sci. Lett.298 (3-4), 405–416. doi: 10.1016/j.epsl.2010.08.017
119
Wienberg C. Krengel T. Frank N. Wang H. Van Rooij D. Hebbeln D. (2022). Cold-water coral mounds in the western Mediterranean Sea: New insights into their initiation and development since the mid-Pleistocene in response to changes of African hydroclimate. Quaternary Sci. Rev.293, 107723. doi: 10.1016/j.quascirev.2022.107723
120
Wienberg C. Titschack J. (2017). “Framework-forming scleractinian cold-water corals through space and time: A late quaternary north Atlantic perspective,” in Marine animal forests: The ecology of benthic biodiversity hotspots. Eds. RossiS.BramantiL.GoriA.OrejasC. (Cham, Switzerland: Springer), 699–732. doi: 10.1007/978-3-319-21012-4_16
121
Wienberg C. Titschack J. Freiwald A. Frank N. Lundälv T. Taviani M. et al . (2018). The giant Mauritanian cold-water coral mound province: Oxygen control on coral mound formation. Quaternary Sci. Rev.185, 135–152. doi: 10.1016/j.quascirev.2018.02.012
122
Zettler M. L. Bochert R. Pollehne F. (2009). Macrozoobenthos diversity in an oxygen minimum zone off norther Namibia. Mar. Biol.156, 1949–1961. doi: 10.1007/s00227-009-1227-9
Summary
Keywords
cold-water coral, Mollusca, biodiversity, Alboran Sea, Mediterranean Sea, Quaternary
Citation
Korpanty CA, Hoffman L, Portilho-Ramos RdC, Titschack J, Wienberg C and Hebbeln D (2023) Decline in cold-water coral growth promotes molluscan diversity: A paleontological perspective from a cold-water coral mound in the western Mediterranean Sea. Front. Mar. Sci. 9:895946. doi: 10.3389/fmars.2022.895946
Received
14 March 2022
Accepted
17 November 2022
Published
28 February 2023
Volume
9 - 2022
Edited by
Lorenzo Angeletti, Department of Earth System Sciences and Technologies for the Environment (CNR), Italy
Reviewed by
Anna Maria Addamo, Joint Research Centre (JRC), Italy; Paolo G. Albano, Stazione Zoologica Anton Dohrn Napoli, Italy
Updates
Copyright
© 2023 Korpanty, Hoffman, Portilho-Ramos, Titschack, Wienberg and Hebbeln.
This is an open-access article distributed under the terms of the Creative Commons Attribution License (CC BY). The use, distribution or reproduction in other forums is permitted, provided the original author(s) and the copyright owner(s) are credited and that the original publication in this journal is cited, in accordance with accepted academic practice. No use, distribution or reproduction is permitted which does not comply with these terms.
*Correspondence: Chelsea A. Korpanty, chelsea.korpanty@gmail.com
This article was submitted to Deep-Sea Environments and Ecology, a section of the journal Frontiers in Marine Science
Disclaimer
All claims expressed in this article are solely those of the authors and do not necessarily represent those of their affiliated organizations, or those of the publisher, the editors and the reviewers. Any product that may be evaluated in this article or claim that may be made by its manufacturer is not guaranteed or endorsed by the publisher.