Abstract
The large-scale cultivation of S. fusiforme was hypothesized to effectively improve water quality and environmental characteristics. Specifically, such cultivation could promote habitat restoration effects by increasing DO and pH levels in addition to decreasing nitrogen and phosphorus levels within cultivation area waters. Phytoplankton diversity could also reflect the quality and health of waters. This study explored the effects of large-scale cultivation of Sargassum fusiforme on the biodiversity and the ecosystem of a phytoplankton community in the coastal waters of Dongtou island, China. S. fusiforme cultivation increased DO and pH values within the area but decreased N contents of the cultivation area waters. A total of 75 phytoplankton species were identified based on morphological identification, while a parallel survey of phytoplankton communities using high-throughput cultivation-independent sequencing identified 601 phytoplankton OTUs. Large scale cultivation of S. fusiforme was associated with increased phytoplankton diversity as reflected by multiple alpha and beta diversity metrics. These data suggested that S. fusiforme cultivation could affect phytoplankton community structure when the S. fusiforme biomass reached maximum levels. Redundancy analysis (RDA) indicated that S. fusiforme played an important role in controlling the dynamics of phytoplankton communities in coastal ecosystems. Thus, the results suggested that S. fusiforme cultivation could enhance phytoplankton community biodiversity. Overall, this study demonstrated that large-scale cultivation of S. fusiforme in coastal regions was an effective approach for mitigating environmental problems in marine ecosystems.
1 Introduction
Phytoplankton are important primary producers in marine ecosystems (Behrenfeld et al., 2006; Jardillier et al., 2010), as they assimilate nutrients, fix inorganic carbon, and produce organic matter (Falkowski et al., 2000; Emerson, 2014). Biodiversity is essential for enhancing ecosystem productivity but is also critical for maintaining stability at the community and ecosystem levels in addition to maximizing the resource use and ecological efficiency that underpin ecosystem services (Chai et al., 2018). Species composition and phytoplankton community diversity are highly sensitive to changing environmental conditions and are affected by physical, chemical, biological, and climatic factor (Leblad et al.,2020; Liu et al., 2022). Thus, phytoplankton community diversity serves as an indicator of the influences from environmental factors and processes (Peng et al., 2021; Parsons et al., 2021). Consequently, these community characteristics can be used as ecological indicators to evaluate aquatic ecosystem health (Chai et al., 2018; Shan et al., 2019; Navas-Parejoa et al., 2020; Zhou et al., 2021).
Marine phytoplankton biodiversity research has primarily focused on microscopic morphological observations (Lee et al., 2010). However, morphological approaches have limitations for identifying species (Massana, 2011), (Manoylov, 2014) for example in picophytoplankton that exhibit very small cell sizes or organisms that have no clear defining morphological characteristics in addition to those species that have not yet been described or characterized (Egge et al, 2015; de Vargas et al., 2015; Malviya et al., 2016; Liu S et al., 2020). Furthermore, high levels of impurities such as sediments in samples can lead to the inability to observe species. Moreover, morphological observation methods generally take considerable amounts of time and require specialist training for morphological identification. The rapid development of molecular biology tools has led to breakthroughs in understanding microalgae diversity (Lefebvre et al., 2005). Handelsman et al. (1998) formally proposed the field of metagenomics in 1998, focusing on understanding the diversity of microorganisms via environmental genomics techniques. Subsequent studies have demonstrated that high-throughput metagenomic sequencing methods are much more effective than morphological approaches for exploring the spatio-temporal dynamics of marine phytoplankton communities (Egge et al, 2015; de Vargas et al., 2015; Chai et al., 2018; Qiao et al., 2020). The 18S rDNA genes represent small ribosomal subunit genes that exist in all eukaryotes and that have both informational and functional roles within cells (Liu et al., 2017). The genes comprise nine variable regions, among which the V4 and V9 regions are widely used in eukaryotic biodiversity studies (Neefs et al., 1990). For example, Stoeck et al. (2010) demonstrated that the V4 region better distinguishes species with close genetic relationships. Moreover, diversity results based on the V4 region are more closely aligned with those from full-length 18S rDNA sequences compared to the results using the V9 region (Pawlowski et al., 2011; Dunthorn et al., 2012), thereby rendering the V4 region of 18S rDNA genes an appropriate tool for phytoplankton identification (Liu et al., 2017).
Sargassum fusiforme is a species endemic to the temperate coastal areas of the northwestern Pacific region and is particularly abundant in coastal waters of China, Korea, and Japan (Li et al., 2019). S. fusiforme is an edible alga in China and is widely cultivated in southeastern coastal areas, the Yellow Sea, and the Bohai Sea (Hu et al., 2016; Zhang et al., 2021). Among these areas, the yield and quality are highest near the coast of Zhejiang province, and especially the coastal area of Dongtou Island (Zhang et al., 2002). The alga has become one of the most important species for seaweed mariculture in China in recent years due to its high economic value and increasing consumer demand (Chen et al., 2018). In addition to providing food for human consumption (Zhang et al., 2020), the algae have also been used as a traditional Chinese medicinal plant to treat various diseases (Zhang et al., 2006; Liu J et al., 2020).
Local farmers culturing S. fusiforme have observed that during S. fusiforme culture, and especially in April when S. fusiforme biomass is highest, red tides rarely occur in cultivation areas, while red tides frequently occur in the cultivation areas after the S. fusiforme harvest (local fisherman’s expertis). Previous studies have shown that S. fusiforme can also inhibit Karenia mikimotoi growth (Ma et al., 2017). Interestingly, identification of microscopically observable microalgae has indicated that the abundance of one of the red tide microalgae, Skeletonema costatum, was significantly lower in the S. fusiforme cultivation areas compared to areas without S. fusiforme (unpublished data). These observations prompted the present study to evaluate whether a positive impact on phytoplankton community diversity occurs due to S. fusiforme cultivation, and also whether the latter influences the cell abundances of red tide microalgae. Moreover, these studies were used to evaluate whether additional red tide microalgae could be inhibited by S. fusiforme. To investigate these hypotheses, we analyzed the phytoplankton biodiversity associated with S. fusiforme cultivation via high-throughput sequencing of 18S rRNA genes using newly designed PCR primers for eukaryotes. In addition, water quality parameters in S. fusiforme cultivation and non-cultivation areas were analyzed in tandem. These results are of significance for comprehensively understanding the ecological value of large-scale S. fusiforme culture.
2 Materials and methods
2.1 Sampling site descriptions
The study area is located at the Banpingshan cultivation zone in southeastern Dongtou Island (27°41′19″–28°01′10″ E, 120°59′45″–121°15′58″ N), one of the largest S. fusiforme mariculture bases in the Dongtou district (Figure 1). The cultivation area was only 57.2 ha in 1989 and is currently maintained at approximately 1,000 ha per year, with an annual seaweed dry-weight production of about 7,000–9,000 tons.
Figure 1
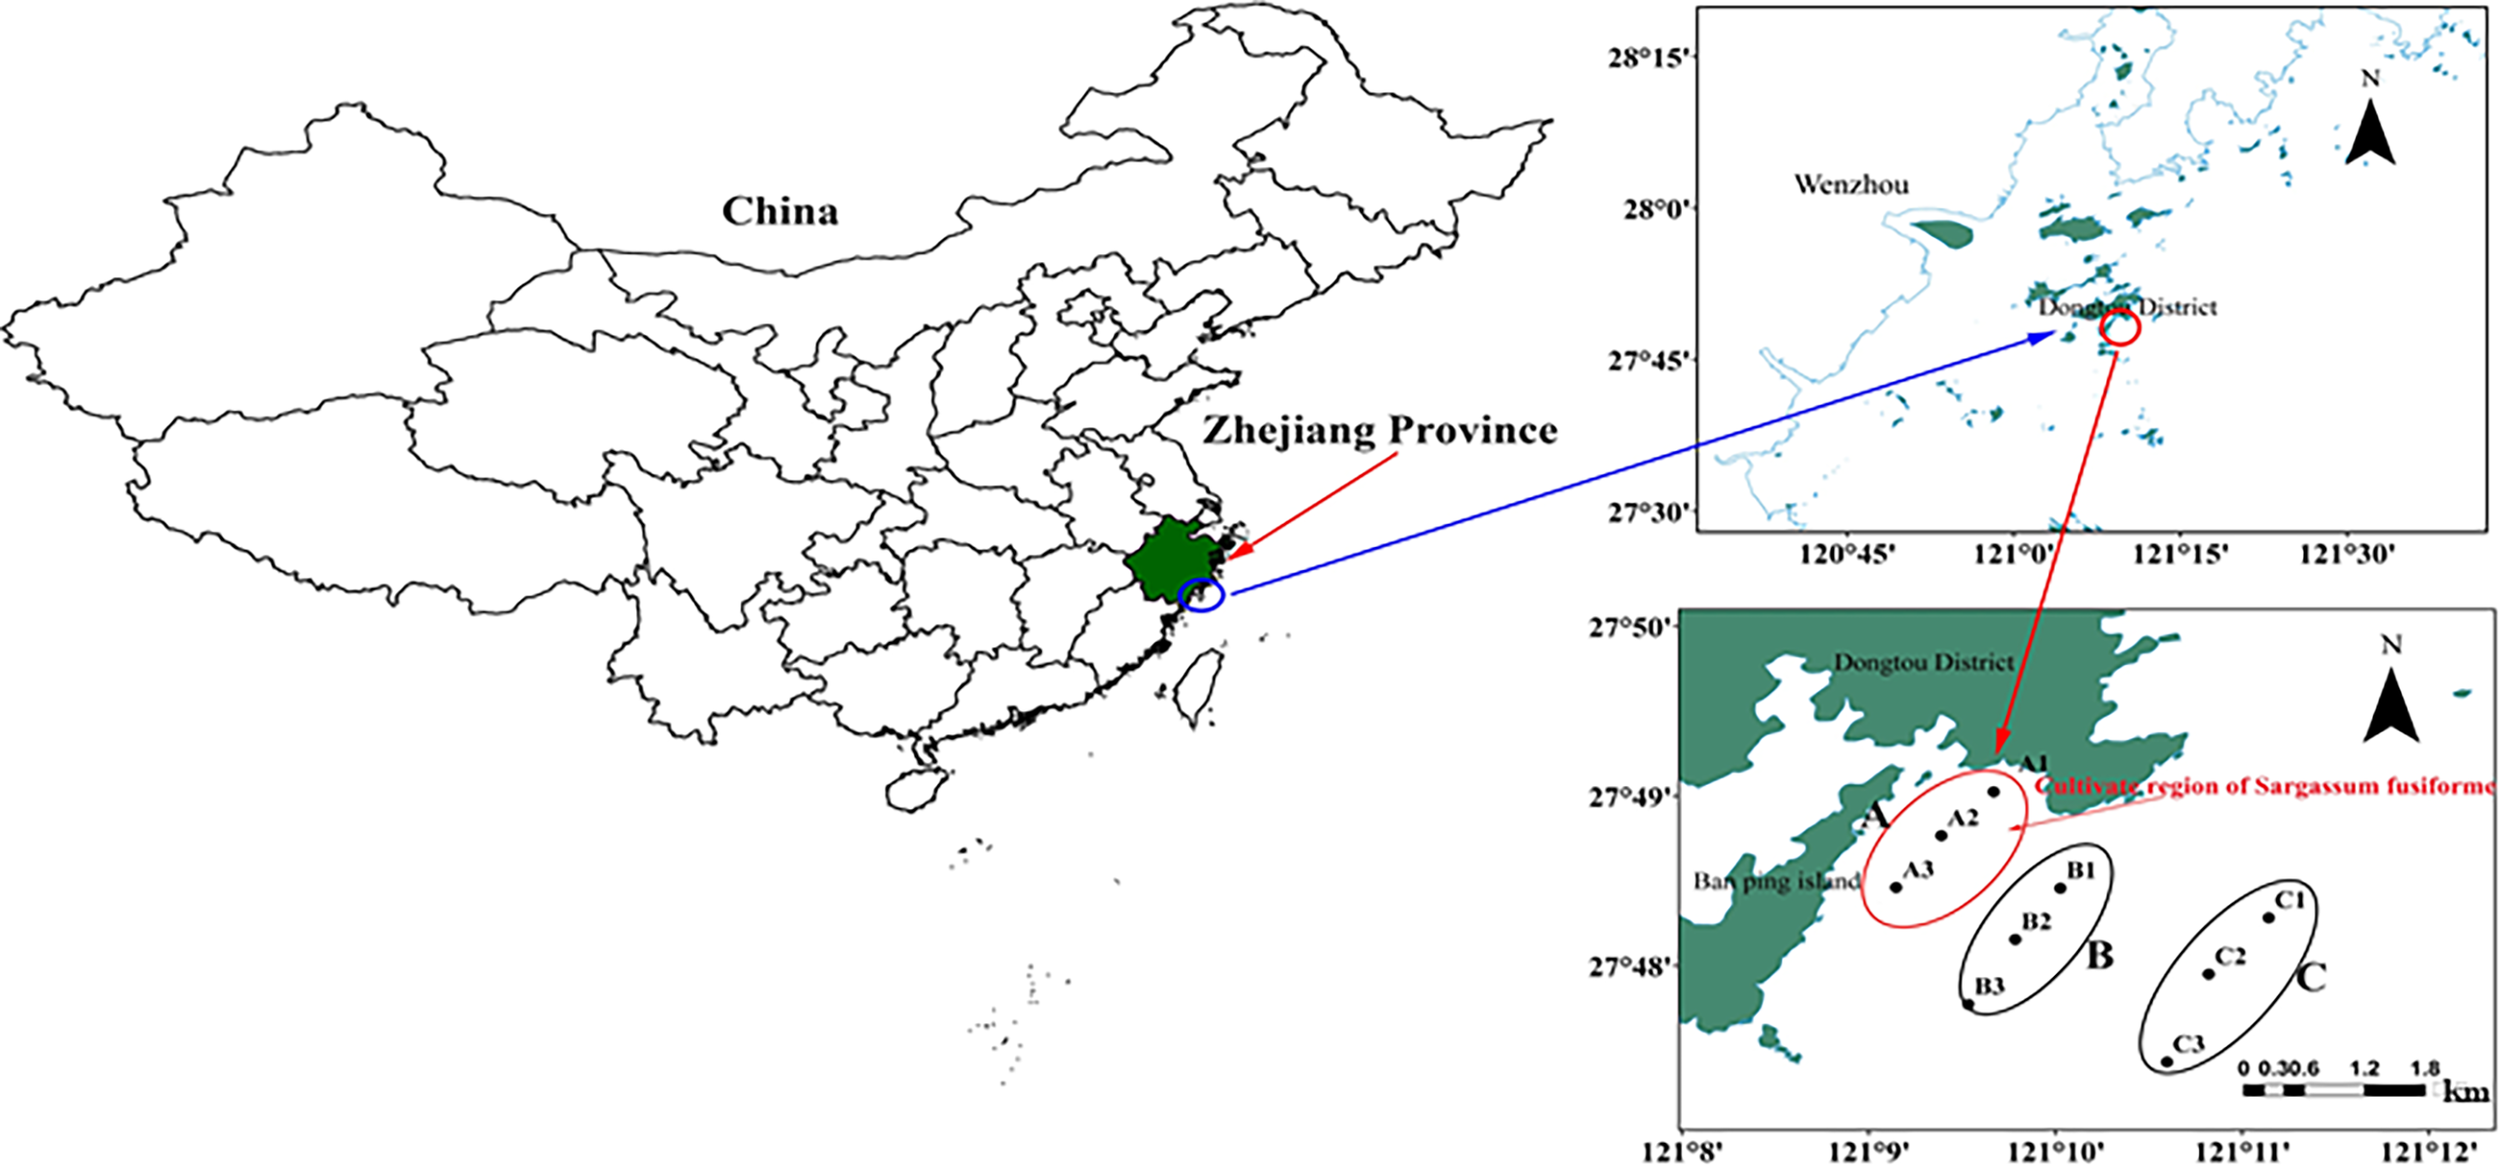
Location of sampling sites in Dongtou Island, China. (A)Sargassion fusiforme cultivation area with three sites (A1-A3); (B) adjacent area (without S. fusiforme cultivation) with three sites (B1-B3); (C) open sea area (without S. fusiforme cultivation) with three sites (C1-C3). The depth of each site was showed (A1, A2, A3, B1, B2, B3, C1, C2 and C3:9.6, 9.0.9.8, 9.2, 9.1, 9.4, 9.4, 9.8 and 10.0 m respectively.
In total, 54 samples were collected in April and June 2019. Nine sampling sites were selected in areas with and without S. fusiforme cultivation. The sampling sites and samples were collected as follows: (1) A: S. fusiforme cultivation areas, comprising three sites (A1-A3), (2) B: 200–500 m away from the “A” cultivation areas, with three sites (B1-B3), and C: three sites in the open sea about 2 km away from the cultivation area (C1-C3). The average depths at sites A, B, and C were 9.0 m, 8.7 m, and 9.1 m, respectively. A total of 54 samples comprising three replicates for each site were collected from surface waters (0.5 m below the surface), with samples labeled as Ban Pingshan, BS, and CS. Samples were also identified by the time of sampling, with Apr-A, Apr-B, and Apr-C for April samples, and Jun-A, Jun-B and Jun-C for June samples.
2.2 Sample collection and water quality
Water samples (4 L) from the surface and bottom of the sea were collected with organic glass hydrophores. A subsample (1 L) of water from each sample was then used for microbial community investigation by filtering with a sterile microfiltration membrane (47 mm, 0.22 µm filter). After filtering, microfiltration membranes were placed in 5 mL sterile tubes and immediately placed on dry ice.
The remaining water from each sample was stored at −80°C and transported to the laboratory. Dissolved oxygen (DO), salinity (Sal), temperature (T), and pH were measured for each sample using 550A, EC300A, and PH100A YSI instruments, respectively (YSI Inc., Yellow Springs, OH, USA). Ammonia-nitrogen (NH4+-N), nitrite-nitrogen (NO2−-N), nitrate-nitrogen (NO3−-N), active phosphate (PO43–P), silicate (SiO32-), total nitrogen (TN), and total phosphorus (TP) were all measured using previously described methods (Zhang et al., 2021).
2.3 Phytoplankton morphological analysis
Unfiltered water samples (1 L) were fixed with 5 mL of Lugol’s solution, and each sample was subsequently concentrated to 10 mL. Phytoplankton species were identified in these samples, and cell numbers were counted using a phytoplankton enumeration chamber with an inverted microscope (Olympus CKX41, Olympus Corporation, Tokyo, Japan).
2.4 High-throughput sequencing of phytoplankton and bioinformatics analyses
2.4.1 DNA extraction, PCR amplification, and sequencing
Total genomic DNA was extracted from samples using the FastDNA spin kit for soils (MP Biomedicals, OH, USA), following the manufacturer’s instructions. DNA quality and concentration were measured by gel electrophoresis and a Nanodrop spectrophotometer (NanoDrop Technologies, Wilmington, DE, USA), respectively. PCR was performed using the 18S rDNA gene primer pair 18sV4F (5′-CCAGCASCYGCGGTAATTCC-3′) and 18sV4R (5′-ACTTTCGTTCTTGATYRA-3′ (Stoeck etal., 2010). PCR products were extracted from a 2% agarose gel and further purified using the AxyPrepDNA Gel Extraction Kit (Axygen Biosciences, USA) according to the manufacturer’s instructions, and then quantified using the QuantiFluor™-ST system (Promega, USA). Purified amplicons were pooled in equimolar concentrations and subjected to paired-end (PE300) read sequencing on an Illumina MiSeq platform (Illumina, San Diego, USA) at Majorbio Bio-Pharm Technology Co. Ltd. using standard protocols (Shanghai, China). Sequence data were deposited in GenBank under the accession number PRJNA761497.
2.4.2 Bioinformatic analysis
The pretreatment of raw data was performed by QIIME software (Caporaso et al., 2010). The raw tags were merged by FLASH using an overlap length > 10 bp and a maximum mismatch rate < 0.2. The quality filtration of raw tags was executed by Trimmomatic software, and raw tags with a quality level < 75% were discarded. The UCHIME software was applied to identify and discard the chimeric sequences. The valid tags were clustered into operational taxonomic units (OTUs) at a 97% identify threshold. The OTUs were annotated and classified by QIIME software based on the Silva database. Taxonomic assignments were determined for representative sequences of each OTU using the Basic Local Alignment Search Tool (BLAST) in the NCBI database (http://www.ncbi.nlm.nih.gov). Following the exclusion of sequences annotated as bacterial and those that were unclassified, phytoplankton sequences were selected for community compositional analyses based on taxonomic information.
2.4.3 Ecological network analysis of the microbial community
To illuminate phytoplankton interactions and differences between groups, phylogenetic molecular ecological networks (pMENs) were constructed via a random matrix theory-based interface approach in the molecular ecological network analysis pipeline (MENA, http://ieg2.ou.edu/MENA/)
2.5 Phytoplankton community analysis
The dominance of abundant species identified by morphological analysis (> 10% of communities) was defined as the species cell abundance/total cell abundance ratio. The dominance of abundant genera revealed by high-throughput sequencing (>10% of sequence reads) was defined as the percentage of sequences for the taxa among the total sequences. Phytoplankton were further classified as picophytoplankton (≤ 2 μm), small nanophytoplankton (> 2 μm and ≤ 10 μm), large nanophytoplankton (> 10 μm and < 20 μm), and microphytoplankton (> 20 μm and < 200 μm) based on cell sizes (Qiao et al., 2020).
Three α-diversity metrics were calculated for communities, the Shannon–Wiener, Simpson, and Ace indices, using the QIIME software program. Differences in α-diversity metric values were analyzed by one-way ANOVA, and statistical analyses were performed with the SPSS software program (v. 22.0). Prior to statistical analyses, data were checked for normality of distributions and homogeneity of variance by the Kolmogorov-Smirnov and Levene’s tests, respectively. Statistical significance was identified at the p < 0.05 level. β-diversity was also calculated as a comparative indicator of community structures among samples. Histograms of phyla and classes were constructed using the Origin 9.0 software program. In addition, linear model-based redundancy analysis (RDA) was used based on correlations among phytoplankton community composition and water quality parameters with the Canoco 5.0 software package.
3 Results
3.1 Water quality parameters
S. fusiforme cultivation increased DO and pH values but decreased N contents of the cultivation area waters. The DO, NO3-N, NO2-N, and TN values of the cultivation area in April 2019 were significantly higher than in the adjacent and control areas (p < 0.05). In June 2019, NO3-N was significantly higher in the cultivation area than in the adjacent and control areas. NO2-N and NH4-N were also significantly higher in the cultivation area than in the control area (p < 0.05) (Table 1).
Table 1
| Parameter | April | June | ||||
|---|---|---|---|---|---|---|
| AS | BS | CS | AS | BS | CS | |
| Depth (m) | 10.0±0.24 | 9.9±0.27 | 9.9±0.15 | 10.0±0.18 | 9.8±0.21 | 10.0±0.13 |
| Temperature (°C) | 14.6±0.2 | 14.7±0.2 | 14.5±0.2 | 22.0±0.4 | 22.1±0.1 | 22.3±0.1 |
| Salinity | 26.5±0.2 | 26.5±0.1 | 26.5±0.1 | 28.2±0.2 | 28.4±0.1 | 28.3±0.0 |
| pH | 8.32±0.05 | 8.21±0.02 | 8.13±0.03* | 8.23±0.0 | 8.25±0.0 | 8.27±0.0 |
| DO (mg/L) | 10.4±0.2 | 10.1±0.1* | 10.1±0.1* | 9.3±0.1 | 9.3±0.1 | 9.3±0.1 |
| NO3-N (mg/L) | 0.474±0.025 | 0.467±0.011 | 0.507±0.032* | 0.317±0.109 | 0.287±0.008* | 0.290±0.015* |
| NO2-N (mg/L) | 0.008±0.008 | 0.009±0.008 | 0.026±0.017** | 0.013±0.002 | 0.010±0.004 | 0.009±0.003* |
| NH4-N (mg/L) | 0.149±0.019 | 0.133±0.018 | 0.121±0.024 | 0.102±0.027 | 0.095±0.003 | 0.093±0.003* |
| TN (mg/L) | 3.12±0.35 | 3.07±0.26 | 3.33±0.36* | 4.84±1.40 | 4.81±0.57 | 4.75±1.41 |
| PO4-P (mg/L) | 0.039±0.008 | 0.036±0.002 | 0.037±0.003 | 0.048±0.003 | 0.042±0.010 | 0.046±0.003 |
| TP (mg/L) | 0.05±0.01 | 0.05±0.01 | 0.05±0.01 | 0.041±0.01 | 0.042±0.01 | 0.040±0.01 |
| SiO3-Si (mg/L) | 0.452±0.027 | 0.445±0.445 | 0.447±0.036 | 0.720±0.026 | 0.717±0.004 | 0.720±0.031 |
Temporal and spatial variation in environmental parameters of waters measured in 2019.
Values are means ± standard deviations. *: p < 0.05 indicating that BS or CS was significantly different from AS, based on one-way ANOVA t test.
**p < 0.01.
3.2 Phytoplankton community composition
Five phyla 75 species of phytoplankton were observed based on morphological observations: Bacillariophyta, Dinophyta, Chrysophyta, Cyanophyta, and Chlorophyta, with Bacillariophyta and Dinophyta being the most dominant phyla. The abundances of each phylum among different survey areas/times were as follows: Bacillariophyta (Apr-A=93.87%; Apr-B=94.15%; Apr-C=96.59%; Jun_A=94.94%; Jun_B=88.71%; Jun_C=88.58%), Dinophyta (Apr-A=1.82%; Apr-B=2.85%; Apr-C=1.01%; Jun_A=4.16%; Jun_B=9.72%; Jun_C=9.72%), Chrysophyta (Apr-A=1.82%; Apr-B=1.00%; Apr-C=0.71%; Jun_A=0.00%; Jun_B=0.52%; Jun_C=0.33%), Cyanophyta (Apr-A=1.21%; Apr-B=1.00%; Apr-C=0.74%; Jun_A=0.44%; Jun_B=0.52%; Jun_C=0.33%), and Chlorophyta (Apr-A=1.28%; Apr-B=1.00%; Apr-C=1.01%; Jun_A=0.46%; Jun_B=0.52%; Jun_C=0.33%) (Figure 2A).
Figure 2
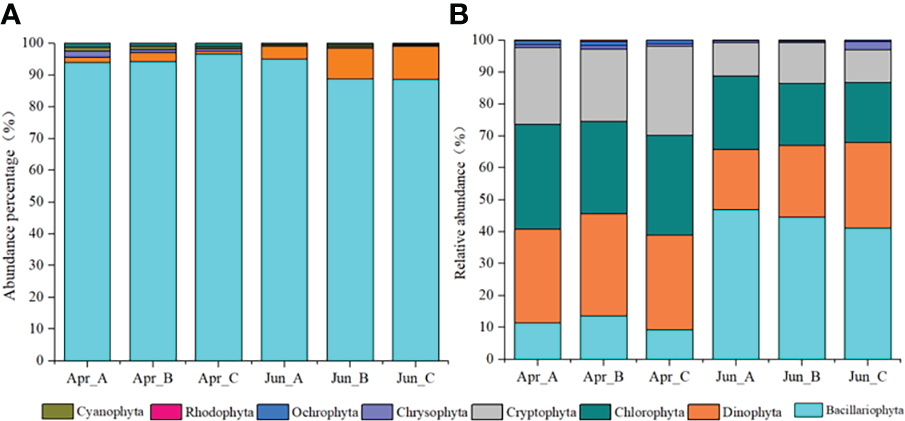
Temporal variation in the relative abundances of phytoplankton phyla based on morphological observations (A) and high-throughput sequencing (B) approaches.
After removing macroalgal, zooplankton, protozoan, fungal, and unclassified OTUs from the sequence dataset via comparisons against the NCBI database and literature searches, a total of 601 phytoplankton OTUs were identified comprising the seven phyla Dinophyta, Bacillariophyta, Chlorophyta, Cryptophyta, Chrysophyta, Ochrophyta, and Rhodophyta. Among these, Bacillariophyta, Dinophyta, Chlorophyta, and Cryptophyta were the dominant phyla. The relative abundances of each phylum among the survey areas based on molecular analysis were as follows: Bacillariophyta (Apr-A=11.3%; Apr-B=13.6%; Apr-C=9.2%; Jun_A=47.0%; Jun_B=44.5%; Jun_C=41.1%), Dinophyta (Apr-A=29.5%; Apr-B=32.0%; Apr-C=29.7%; Jun_A=18.8%; Jun_B=22.5%; Jun_C=26.9%), Chlorophyta (Apr-A=32.8%; Apr-B=28.9%; Apr-C=31.2%; Jun_A=23.0%; Jun_B=19.3%; Jun_C=18.8%), Cryptophyta (Apr-A=24.0%; Apr-B=22.7%; Apr-C=27.9%; Jun_A=10.3%; Jun_B=12.9%; Jun_C=10.3%), Chrysophyta (Apr-A=1.0%; Apr-B=0.9%; Apr-C=0.8%; Jun_A=0.7%; Jun_B=0.3%; Jun_C=0.5%), Ochrophyta (Apr-A=1.2%; Apr-B=1.4%; Apr-C=1.1%; Jun_A=0.2%; Jun_B=0.4%; Jun_C=0.4%), and Rhodophyta (Apr-A=0.2%; Apr-B=0.4%; Apr-C=0.1%; Jun_A=0.0%; Jun_B=0.0%; Jun_C=0.0%) (Figure 2B).
Significant differences were observed for phytoplankton composition, specifically the abundances of Bacillariophyta, Ochlorophyta, Chlorophyta, Cryptophyta, and Rhodophyta between April and June communities (p < 0.05) (Figure 3). No significant differences were observed between Dinophyta and Chrysophyta abundances across the two time periods (p > 0.05). Bacillariophyta abundances in April were significantly higher than in June, while the abundances of Ochlorophyta, Chlorophyta, Cryptophyta, and Rhodophyta were significantly lower in April than in June.
Figure 3
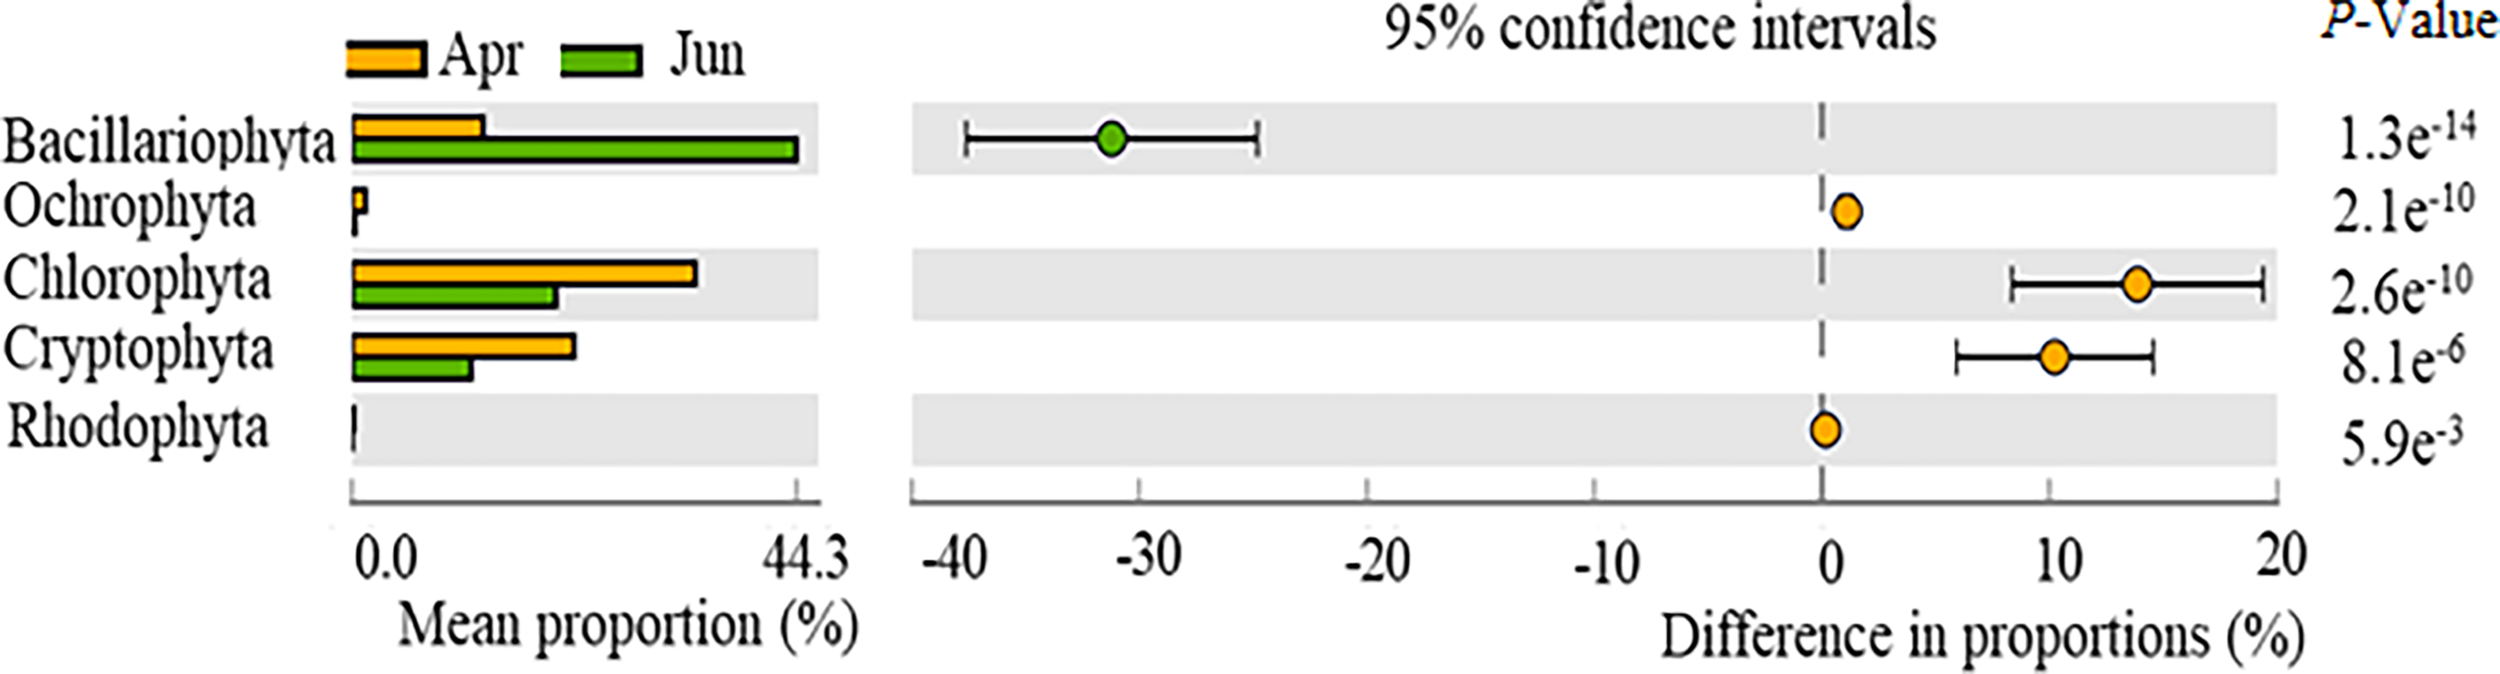
Temporal variation in the relative abundances of phytoplankton phyla, as observed with high-throughput sequencing of community compositions.
A total of 23 genera/species of picophytoplankton and 17 genera/species of small nanophytoplankton were detected via high-throughput sequencing that were not observed with morphological analyses (Table 2), accounting for 22.21% and 13.18% of the abundance percentage. The dominant Chlorophyta species that were observed included Bathycoccus prasinos, Micromonas pusilla, Pyramimonas australis, and Nannochloris sp., all of which exhibited cell sizes less than 2 μm; all are considered to be photosynthetic picoeukaryotes (PPEs) and are widely distributed in marine environments (Mayer and Taylo, 1979; Luis et al., 1992; Rashid et al., 2018). Thus, the overall diversity and community structure of phytoplankton were not comprehensively evaluated by traditional morphological observations alone.
Table 2
| Phylum | Genus | Closet known species | NCBI accession(similarity) | Relative abundance(%) | Cell size(μm) | Reference | |
|---|---|---|---|---|---|---|---|
| Picophytoplankton(Minimum size≤2μm) | |||||||
| Bacillariophyta | Skeletonema | S. menzellii | AB948147.1(99.74%) | 0.72 | 2-12 | (Pfannkuchen et al, 2018) | |
| Skeletonema | S. marinoi | KY364698.1(100%) | 1.31 | 2-12 | (Pfannkuchen et al, 2018) | ||
| Skeletonema | S. costatum | KY290715 (94.50%) | 4.78 | 2-12 | (Pfannkuchen et al, 2018) | ||
| Skeletonema | S. potamos | MW541631(91.88%) | 0.00 | 2-12 | (Pfannkuchen et al, 2018) | ||
| Skeletonema | S. subsalsum | AY684967.1 (91.36%) | 0.00 | 2-12 | (Pfannkuchen et al, 2018) | ||
| Arcocellulus | A. cornucervi | KU561153.1(100%) | 0.21 | 1.0-17.0 | (Vaulot et al., 2008) | ||
| Triparma | T. strigata | KR998402.1(100%) | 0.00 | 2.0-3.0 | (Ichinomiya et al., 2019) | ||
| Brockmanniella | B.brockmannii | KY979974 (100%) | 0.02 | 2×10 | (Samanta et al., 2017) | ||
| Chaetoceros | C.socialis | KY852277.1(100%) | 0.00 | 2×10 | (Mahadik et al., 2017; Antoni et al., 2020) | ||
| Chlorophyta | Micromonas | M. pusilla | KY980039.1(100%) | 4.83 | 0.2-0.3 | (Song et al., 2020) | |
| Bathycoccus | B. prasinos | MT571465.1(100%) | 5.35 | 1-3 | (Simon et al., 2017) | ||
| Ostreococcus | Ostreococcus sp. | MT117941(100%) | 2.02 | 1-3 | (Chai et al., 2018) | ||
| Micromonas | M.commoda | KU612123.1(100%) | 0.00 | 1.0-2.0 | (Simon et al., 2017) | ||
| Pycnococcus | P.provasolii | MK541772.1(100%) | 0.00 | ≤2μm | (Moro et al., 2002) | ||
| Pyramimonas | P.tetrarhynchus | FN562441.1(99.74%) | 0.00 | ≤2μm | (Zhang et al., 2015) | ||
| Ostreococcus | Ostreococcus sp. | JN862919.1(99.73%) | 0.00 | 0.8 | (Liu et al., 2017) | ||
| Nannochloris | Nannochloris sp. | AB058312.1(100%) | 2.84 | 2-4 | (Qiao et al., 2020) | ||
| prasinophyte | prasinophyte sp. | AB058375.1(100%) | 0.00 | 2-5 | (Jouenne et al., 2011) | ||
| Nannochloropsis | N.oculata | KY054986.1(99.21%) | 0.02 | 2-4 | (Kagan and Matulka 2015) | ||
| Picochlorum | P.maculatum | KM055115.1(99.21%) | 0.00 | 1-2 | (Augustine et al., 2017) | ||
| Stichococcus | S.bacillaris | MT053478.1(100%) | 0.01 | 2-3 | (Sivakumar et al., 2014) | ||
| Tetrastrum | T.staurogeniiforme | LC425390.1(99.74%) | 0.00 | 2-5 | (Bock et al., 2013) | ||
| Ochrophyta | Aureococcus | A.anophagefferen | KY980028.1(100%) | 0.00 | 1.5-2 | (Sieburth et al., 1985) | |
| small nanophytoplankton (≤10μm) | |||||||
| Bacillariophyta | Micrometopion | M.nutans | HQ121441.1(92.03%) | 0.00 | 5-7 | (Howe et al., 2011) | |
| Cyclotella | C.choctawhatcheeana | JQ217341.1(100%) | 1.06 | 10 | (Christiane, 2003) | ||
| Chaetoceros | C.muellerii | JF790991.1(98.67%) | 0.03 | 3.5-9.2 | (Song et al., 2020) | ||
| Chaetoceros | C.calcitrans | AY625894.1(100%) | 0.10 | 2.8-3.0 | (Song et al., 2020) | ||
| Minidiscus | M. comicus | MW722948.1(100%) | 0.05 | 2.0-7.5 | (Leblanc et al., 2018) | ||
| Chaetoceros | C.tenuissimus | KC309487.1(99.74%) | 0.04 | 5.0 | (Tomaru et al., 2018) | ||
| Cryptophyta | Teleaulax | T.amphioxeia | KY980249 (100%) | 8.31 | 5.0-6.8 | (Song et al., 2020) | |
| Goniomonas | G.avonlea | JQ434475.1(90.31%) | 0.02 | 9.7 | (Song et al., 2020) | ||
| Plagioselmis | prolonga | MK956143.1(100%) | 0.11 | (5-7)×(3-3.7) | (Xing et al., 2008) | ||
| Chlorophyta | Dolichomastix | Dolichomastix sp. | FN562449.1(96.32%) | 0.02 | 3.0-5.0 | (Vaulot et al., 2008) | |
| Prasinoderma | Prasinoderma sp. | AB058379.1(94.01%) | 0.00 | 2.2-5.5 | (Vaulot et al., 2008) | ||
| Ochrophyta | Florenciella | Florenciella sp. | AB518483.1(99.74%) | 0.01 | 3.0-6.0 | (Vaulot et al., 2008) | |
| Pseudochattonella | P.verruculosa | AB217629.1(99.74%) | 0.03 | 5×10 | (Lincoln et al., 2011) | ||
| Ciliophrys | C.infusionum | AB081641.1(89.41%) | 0.00 | 5 | (Hiroshi et al., 2002) | ||
| Chlorophyta | Tetraselmis | Tetraselmis sp. | MH055454 (98.95%) | 0.73 | (8-16)×(7-9)×(3-5) | (Nozaki, 2003) | |
| Pyramimona | P.australis | KY980350.1(100%) | 2.71 | 8 | (Moro et al., 2002) | ||
| Mamiella | M.gilva | FN562450.1(99.47) | 0.12 | (5-8)×(4-7) | (Alonso-González et al., 2014) | ||
List of described picophytoplankton and small nanophytoplankton species revealed by high-throughput sequencing.
A total of 75 phytoplankton species were identified based on morphological characters, while a parallel survey of phytoplankton communities using high-throughput cultivation-independent sequencing identified 601 phytoplankton OTUs. Thus, the number of OTUs in this study was 3 to 7.6 times higher than the number of morphospecies identified from the same communities. Therefore, the high-throughput sequencing results were selected to analyze the dominant species and diversity of phytoplankton.
3.3 Dominant phytoplankton species or genera based on high-throughput sequencing
Dominant phytoplankton genera/species (dominance ≥ 0.01) were calculated based on OTU compositions. The dominant phytoplankton species were primarily distributed among the phyla Chlorophyta (6 OTUs), Cryptophyla (7 OTUs), Dinophyta (3 OTUs), and Bacillariophyta (10 OTUs). Among April communities, Heterocapsa sp. (Dinophyta) were dominant, with values in the cultivation, adjacent, and control areas of 0.165, 0.159, and 0.171, respectively. The second most dominant species was Plagioselmis prolonga (Cryptophylum) that exhibited dominance values of 0.109, 0.102, and 0.114, respectively, in the above areas. The third most abundant species was B. prasinos (Chlorophyta), with dominance values of 0.086, 0.087, and 0.092, respectively. Among June communities, the most abundant species was Heterocapsa sp. (Dinophyta), with dominance values in the culture, adjacent, and control areas of 0.089, 0.080, and 0.076, respectively. The second most abundant species in June was S. costatum (Bacillariophyta), with dominance values of 0.092, 0.081, and 0.070 respectively. The third most abundant species was Chaetoceros tenuissimus (Bacillariophyta) that exhibited dominance values of 0.086, 0.074, and 0.080 respectively (Table 3).
Table 3
| Phylum | Taxa | OTU ID | April | June | NCBIAccession (similarity) | ||||||
|---|---|---|---|---|---|---|---|---|---|---|---|
| AS | BS | CS | All | AS | BS | CS | All | ||||
| Chlorophyta | s: Bathycoccus prasinos | OTU1583 | 0.086 | 0.087 | 0.092 | 0.088 | 0.019 | 0.014 | 0.015 | 0.016 | MT571465.1 (100%) |
| g:Ostreococcus sp. | OTU99 | 0.043 | 0.046 | 0.033 | 0.041 | / | / | / | MT117941 (100%) | ||
| s:Micromonas pusilla | OTU2003 | 0.036 | 0.035 | 0.044 | 0.038 | 0.076 | 0.049 | 0.054 | 0.060 | KT860879.1 (100%) | |
| g:Micromonas sp. | OTU557 | 0.034 | 0.033 | 0.032 | 0.033 | / | / | / | MT117944.1 (100%) | ||
| s:Pyramimonas australis | OTU1951 | 0.030 | 0.027 | 0.027 | 0.028 | 0.034 | 0.025 | 0.021 | 0.027 | KY980350.1 (100%) | |
| g:Picochlorum sp. | OTU3226 | 0.041 | 0.022 | 0.021 | 0.028 | 0.027 | 0.030 | 0.025 | 0.027 | KT860896.1 (100%) | |
| Cryptophyta | g:Plagioselmis prolonga | OTU350 | 0.109 | 0.102 | 0.114 | 0.108 | 0.020 | 0.020 | 0.020 | 0.020 | MK956143.1 (100%) |
| g:Teleaulax gracilis | OTU1747 | 0.030 | 0.036 | 0.033 | 0.033 | 0.016 | 0.024 | 0.022 | 0.021 | JQ966995 (98.93%) | |
| s:Storeatula major | OTU232 | 0.018 | 0.015 | 0.017 | 0.016 | 0.020 | 0.020 | / | 0.020 | KY980340.1 (100%) | |
| s:Teleaulax minuta | OTU3028 | / | / | / | 0.014 | 0.015 | 0.016 | 0.015 | JQ966996.1 (99.73%) | ||
| s:Geminigera cryophila | OTU489 | 0.015 | 0.017 | 0.015 | 0.016 | 0.023 | 0.024 | 0.022 | 0.023 | MK956818.1 (98.93) | |
| Dinophyta | g:Heterocapsa sp. | OTU1048 | 0.165 | 0.159 | 0.171 | 0.165 | 0.089 | 0.080 | 0.076 | 0.082 | MH071708.1 (99.74) |
| s:Heterocapsa rotundata | OTU2153 | 0.040 | 0.046 | 0.049 | 0.045 | 0.027 | 0.039 | 0.045 | 0.037 | KY980288 (100%) | |
| g:Warnowia sp. | OTU667 | 0.057 | 0.072 | 0.063 | 0.064 | 0.018 | 0.022 | 0.031 | 0.024 | KY980035.1 (100%) | |
| Bacillariophyta | s:Skeletonema marinoi | OTU1132 | 0.016 | 0.023 | 0.014 | 0.018 | / | / | / | / | KY364698.1 (100%) |
| s:Skeletonema costatum | OTU1820 | / | / | / | / | 0.092 | 0.081 | 0.070 | KY290715 (94.50%) | ||
| s:Thalassiosira rotula | OTU2063 | 0.010 | 0.010 | 0.010 | 0.010 | / | / | / | / | KT860983.1 (99.22%) | |
| s:Thalassiosira tenera | OTU601 | 0.048 | 0.054 | 0.027 | 0.043 | 0.041 | 0.048 | 0.041 | 0.043 | MW722948.1 (100%) | |
| g:Minidiscus comicus | OTU1983 | 0.010 | / | 0.068 | 0.039 | 0.076 | 0.072 | 0.023 | 0.057 | MN528623.1 (100%) | |
| s:Cerataulina pelagica | OTU2032 | / | / | / | / | 0.020 | / | 0.030 | 0.025 | KC309487.1 (99.74%) | |
| g:Chaetoceros sp. | OTU2669 | / | / | / | / | 0.086 | 0.074 | 0.080 | 0.080 | MG972315.1 (100%) | |
| s:Cyclotella choctawhatcheeana | OTU2226 | / | / | / | / | 0.020 | 0.023 | 0.018 | 0.020 | JQ217341.1 (99.74%) | |
| s:unclassified-dinoflagellate | OTU2935 | / | / | / | / | 0.030 | 0.022 | / | 0.026 | KY290715.1 (95.01%) | |
Dominant genera and species based on high throughput sequencing, in addition to their dominance values and sequence similarity to database accessions.
“/” indicates that the taxon was not a dominant species for a given sampling season. “g:” indicates a genus classification, while “s:” indicates a species-level classification.
Several dominant microalgae in the April communities, including B. prasinos, Geminigera cryophila, Heterocapsa sp., S. marinoi, and Thalassiosira tenera, exhibited lower dominance values in the adjacent and control areas. In June, B. prasinos, G. cryophila, Heterocapsa sp., S. costatum, and T. tenera exhibited higher dominance values in the cultivation area waters than in the adjacent or control areas. We consequently speculated that S. fusiforme exhibited an inhibitory effect on the above dominant species and that S. fusiforme selectively prevents the growth of some microalgae (Table 3).
3.4 Phytoplankton community structure based on high-throughput sequencing
3.4.1 Phytoplankton community alpha diversity
Large scale cultivation of S. fusiforme was associated with increased phytoplankton diversity. Specifically, the Shannon-Wiener index of April communities in the culture area (3.29 ± 0.15) was significantly higher than in the control area (2.69 ± 0.24) (p < 0.05). In contrast, no significant differences were observed among diversity values in June in the culture, adjacent, or control areas. The Simpson index values of the cultivation area communities in April (0.069 ± 0.016) were significantly lower than in the control area (0.088 ± 0.005) (p < 0.05). In contrast, June culture area community Simpson index values (0.0980 ± 0.026) were significantly higher than in the adjacent (0. 067 ± 0.004) (p < 0.05) and control (0.063 ± 0.006) (p < 0.01) areas (Figure 4). The Ace richness index did not significantly differ among areas in April, while the June culture area Ace index (201.4 ± 18.4) was significantly lower than that of the adjacent area (243.5 ± 31.8) (p < 0.05).
Figure 4
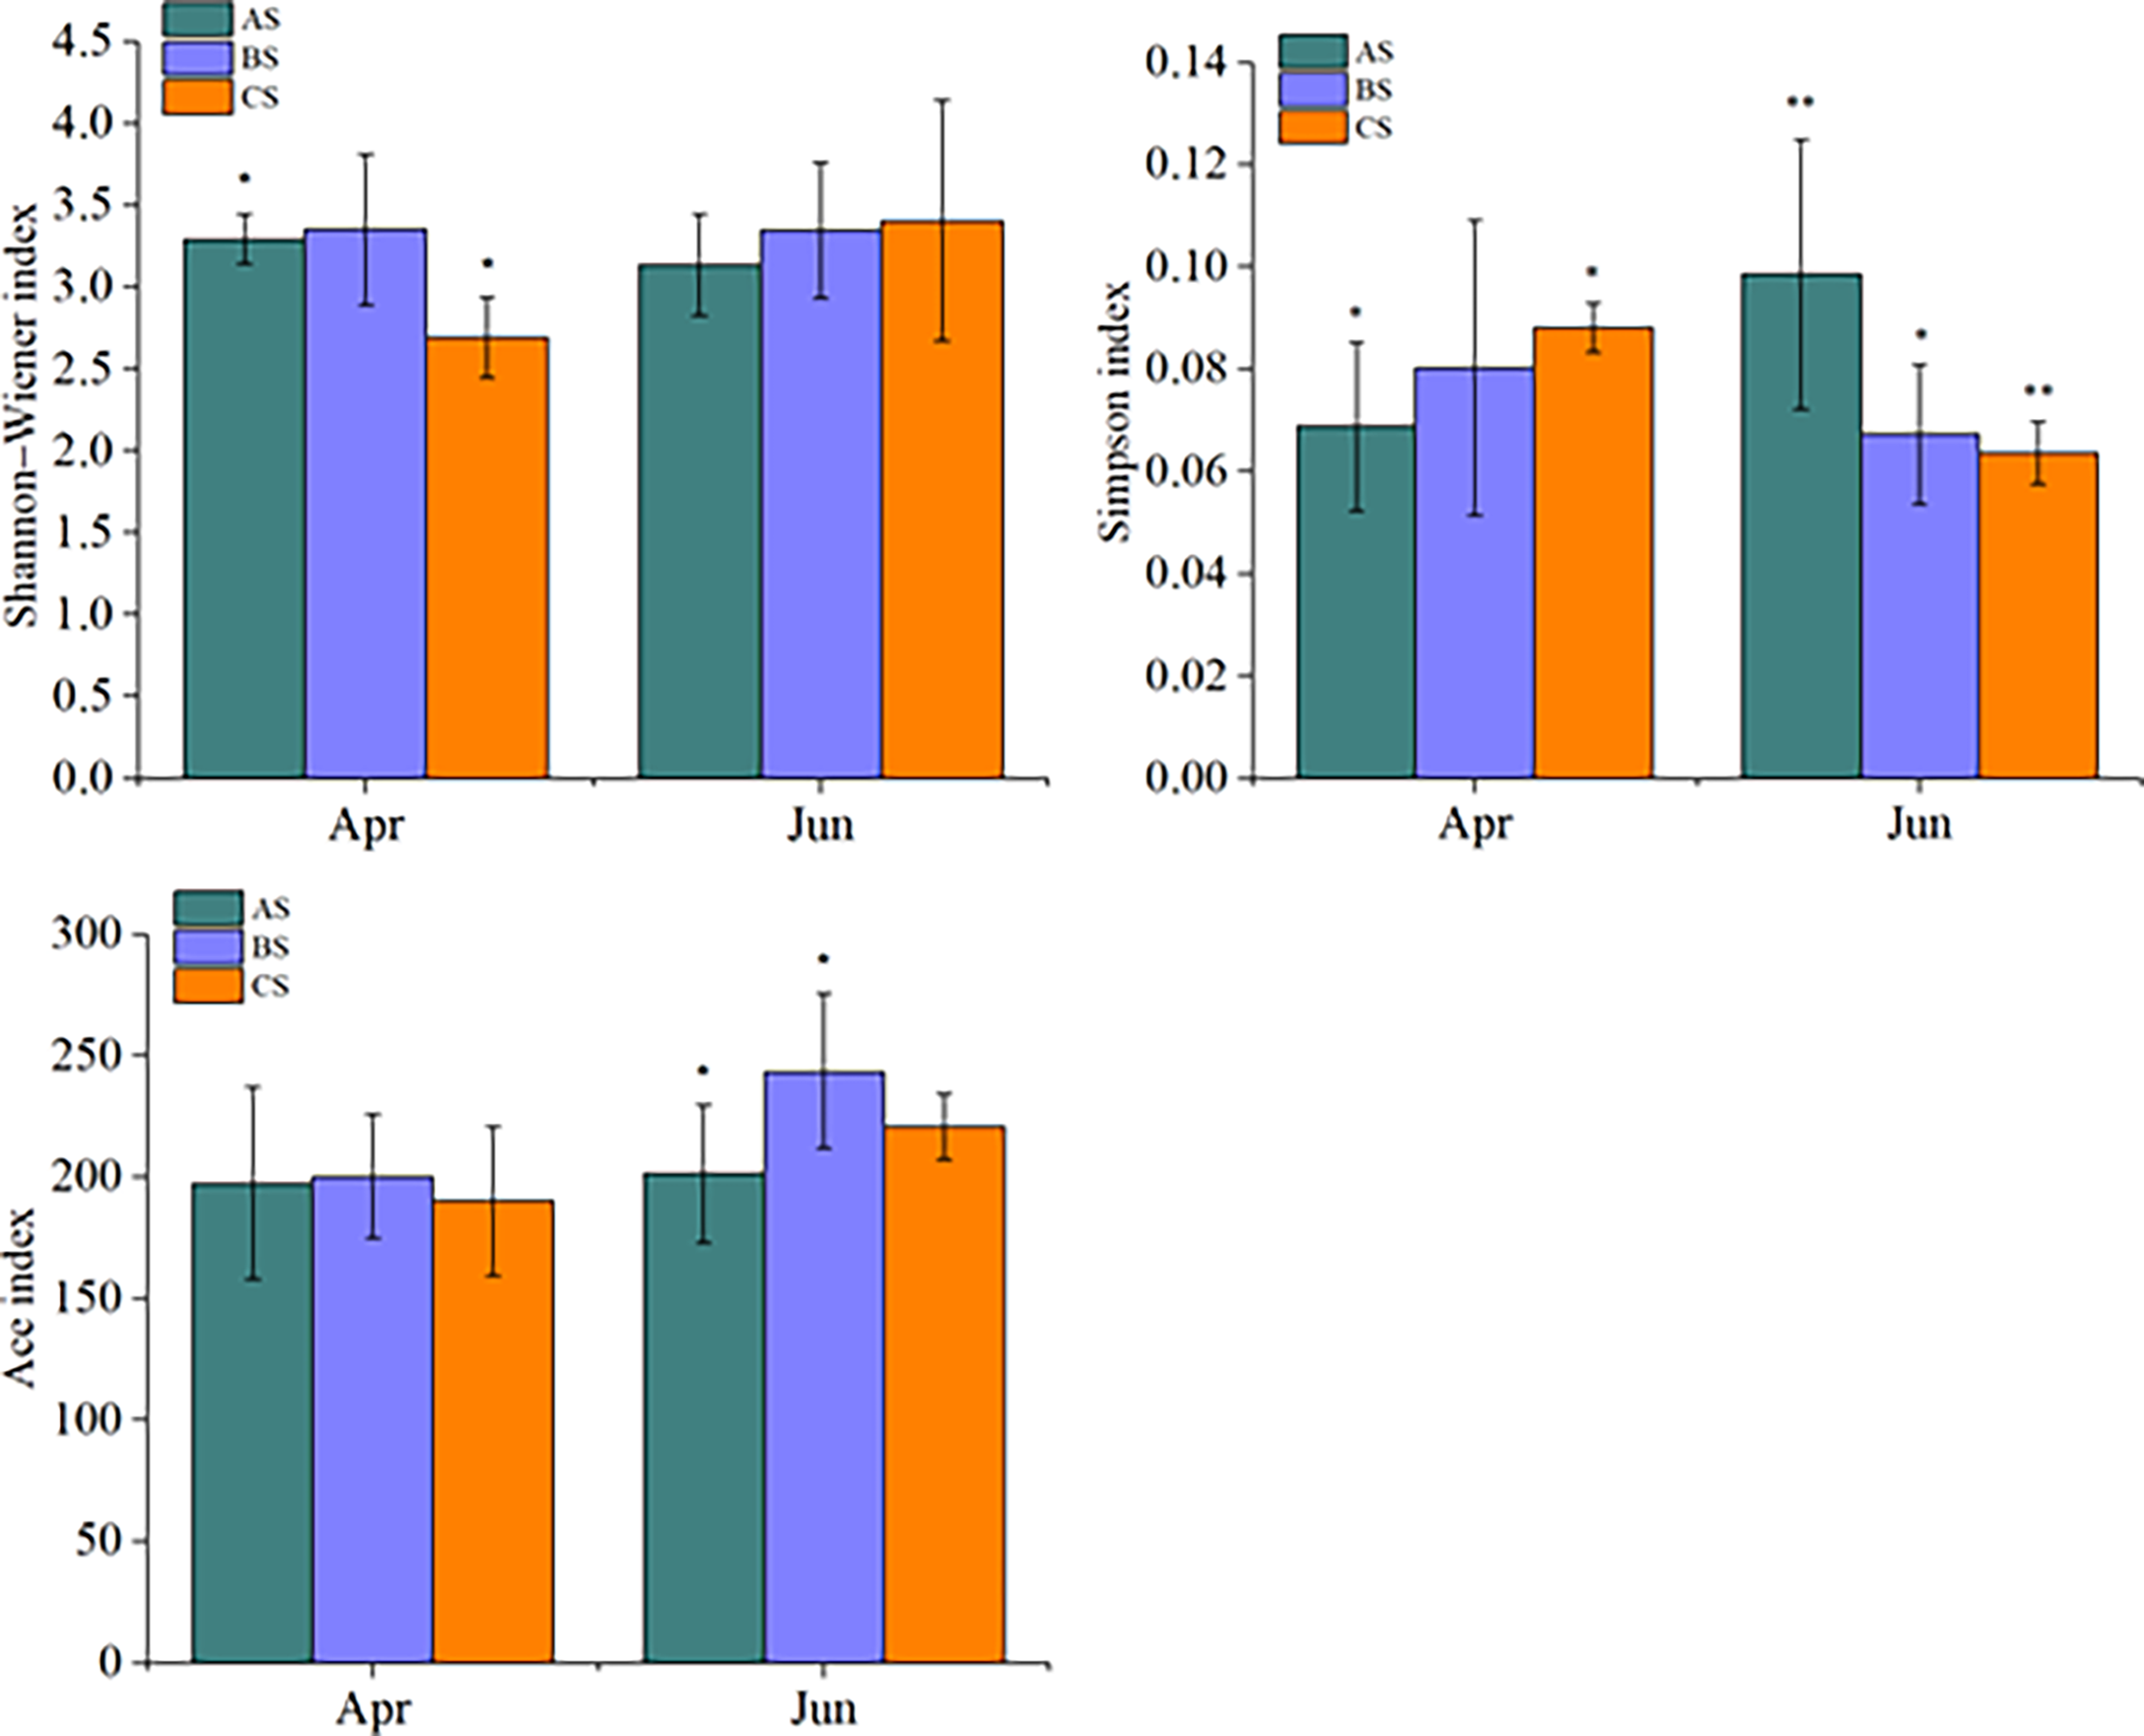
Shannon-Wiener, Simpson, and Ace alpha diversity index values for AS, BS, and CS communities. Note AS: surface samples from culture area BS: surface samples from Adjacent area CS: surface samples from control area,"*" and "**" indicates that BS or CS have significant differences compared with AS (*p <0.05, **p<0.01, one-way ANOVA).
3.4.2 Phytoplankton community beta diversity
Principal component analysis (PCA) was used to evaluate differences in phytoplankton community structure among all surface samples (Figure 5). Significant differences in phytoplankton community structure were observed among sampling areas in April (p = 0.010), although significant differences were not observed in June (p = 0.088) (Figure 5).
Figure 5
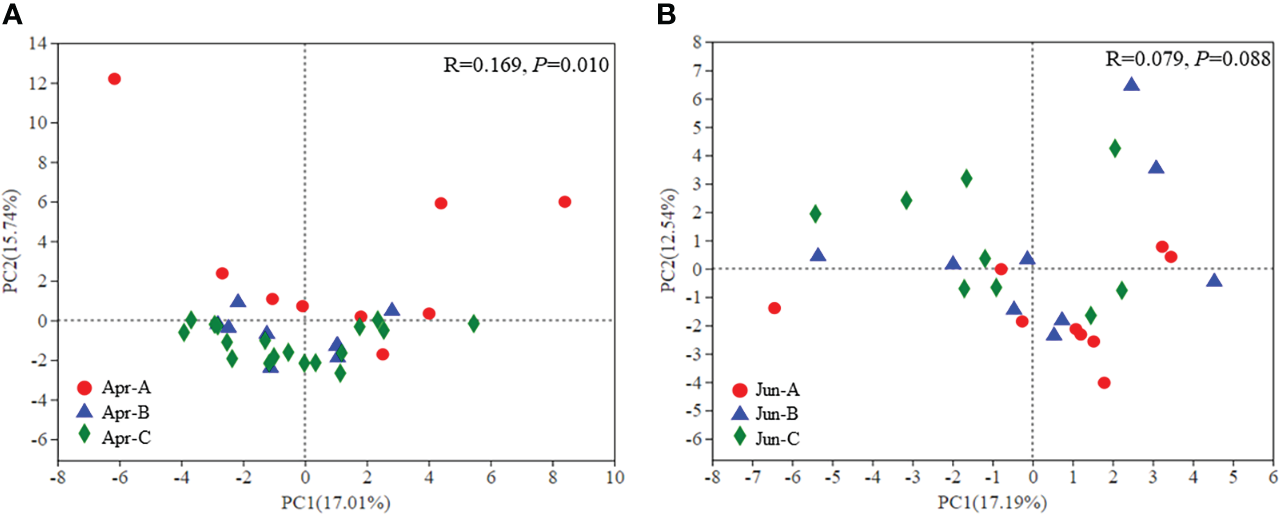
β-diversity of phytoplankton community composition in April (A) and June (B) based on PCA ordinations.
3.4.3 Correlation between dominant phytoplankton species and environmental factors
RDA analysis indicated that most dominant species abundances were positively correlated with metrics of N, P, and Si (except NO2-N) in April. NO2-N, DO, and PO43–P were the primary environmental factors associated with phytoplankton community structure in April. In addition, the abundances of dominant species were negatively correlated with nutrient values (except TN) in June, while TN and TP were the primary environmental factors associated with phytoplankton community structure (Figure 6).
Figure 6
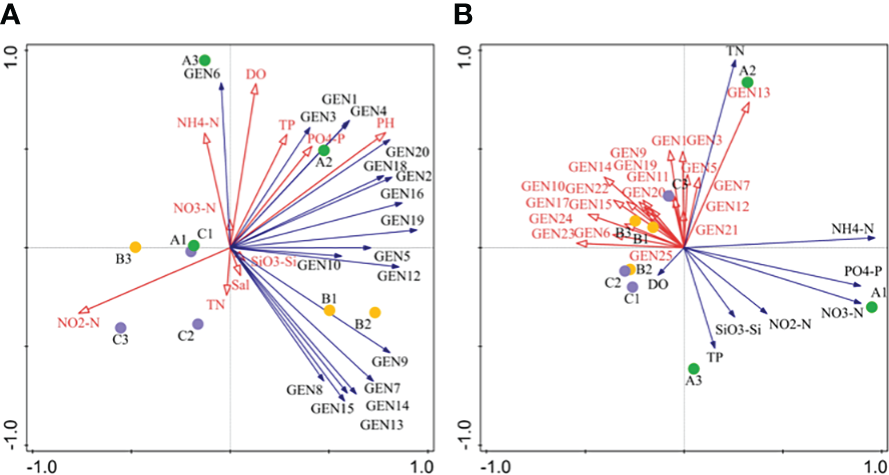
Redundancy anaysis (RDA) of phytoplankton community composition based on high-throughput sequencing for April (A) and June (B) communities. Abbreviations are as follows: GEN1: Bathycoccus prasinos, GEN2: Ostreococcus sp., GEN3: Micromonas pusilla, GEN4: Micromonas sp., GEN5: Pyramimonas australis, GEN6: Nannochloris sp., GEN7: Plagioselmis prolonga, GEN8: Teleaulaxamphioxeia, GEN9: Cryptomonadales sp., GEN10: Storeatula major, GEN11 Teleaulax minuta, GEN12: Geminigera cryophila, GEN13: Heterocapsa sp., GEN14: unclassified dinoflagellate, GEN15: Gymnodinium sp., GEN16: Skeletonema marinoi, GEN17: Skeletonema costatum, GEN18: Thalasssiosira rotula, GEN19: Thalassiosira tenera GEN20: Minidiscus comicus, GEN21: Cerataulina pelagica, GEN22: Chaetocerus tenuissimus, GEN23: Chaetoceros sp., GEN24: Cyclotella choctawcheeana, and GEN25: unclassified dinoflagellate.
The correlations between environmental factors (NH4+-N, NO2-N, NO3-N, PO43–P, SiO32–Si, TN, TP, DO PH, and Sal) and dominant phytoplankton species abundances in April were analyzed with phylogenetic molecular ecological networks (pMENs) (Figure 7). NH4+-N concentrations were significantly correlated with Teleaulax amphioxeia abundances (p < 0.05), while NO2-N concentrations were significantly correlated with Ostreococcus sp., P. australis, and Minidiscus comicus (p < 0.05) in addition to B. prasinos, M. pusilla, and Micromonas sp. (p < 0.01). In addition, NO3-N concentrations were significantly correlated with Storeatula major, M. comicus, and Thalassiosira rotula abundances (p < 0.05), while TP was significantly correlated with M. comicus abundances (p < 0.05). DO was significantly correlated with Nannochloris sp. abundances (p < 0.05), while pH was significantly correlated with Ostreococcus sp., Cryptomonas sp., Heterocapsa sp., unclassified Dinophyta, S. marinoi, T. tenera, and M. comicus abundances (p < 0.05).
Figure 7
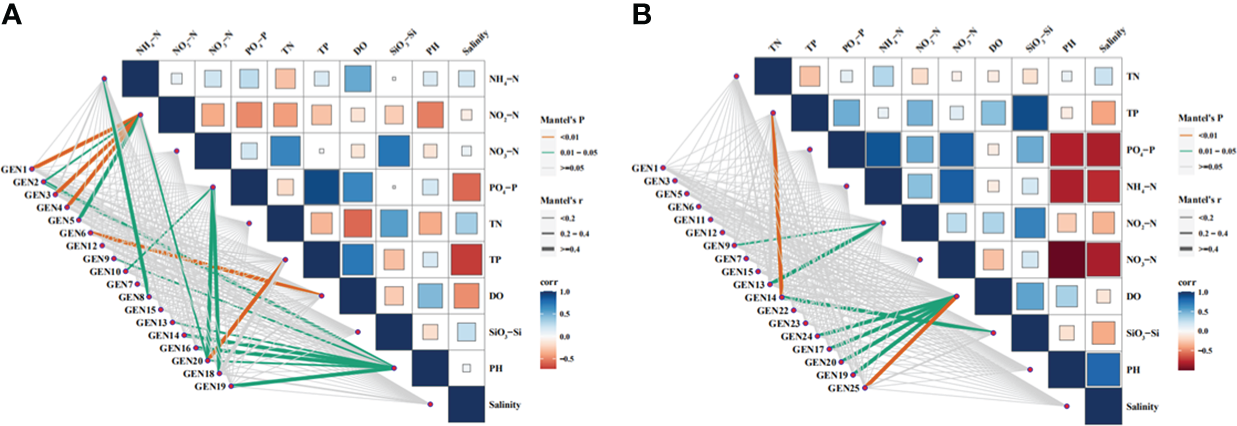
Relationships between environmental factors and the abundances of dominant phytoplankton species based on phylogenetic molecular ecological network analysis. Abbreviations are as follows: GEN1: Bathycoccus prasinos, GEN2: Ostreococcus sp., GEN3 Micromonas pusilla, GEN4: Micromonas sp., GEN5: Pyramimonas australis, GEN6: Nannochloris sp., GEN7: Plagioselmis prolonga, GEN8: Teleaulax amphioxeia, GEN9: Cryptomonadales sp., GEN10: Storeatula major, GEN11: Teleaulax minuta, GEN12: Geminigera cryophila, GEN13: Heterocapsa sp., GEN14: unclassified dinoflagellate, GEN15: Gymnodinium sp.,GEN16: Skeletonema marinoi, GEN17: Skeletonema costatum, GEN18: Thalassiosira rotula, GEN19: Thalassiosira tenera GEN20: Minidiscus comicus, GEN21: Cerataulina pelagica, GEN22: Chaetoceros tenuissimus, GEN23: Chaetocerus sp., GEN24: Cyclotella choctawhatcheeana, and GEN 25: unclassified dinoflagellate.
The same analyses were conducted for environmental factors and dominant phytoplankton species in June communities (Figure 7). Again, TP levels were significantly correlated with unclassified Dinophyta abundances (p < 0.01). NO3-N concentrations were significantly correlated with Cryptomonas sp. and Heterocapsa sp. abundances (p < 0.05), while DO concentrations were significantly correlated with unclassified Dinophyta abundances (p < 0.01) in addition to those of Cyclotella choctahatcheeana, S. costatum, Minidiscus comicus, and T. tenera (p < 0.05). Lastly, SiO32–Si concentrations were significantly correlated with unclassified Dinophyta abundances (p < 0.05).
4 Discussion
4.1 Large-scale S. fusiforme cultivation could effectively increase marine carbon sequestration and helped mitigate coastal environmental problems
Large-scale S. fusiforme cultivation was associated with increased DO and pH in addition to decrease N within the cultivation area waters. Thus, S. fusiforme took up carbon (C), N, and P during photosynthesis and reduced N and P concentrations in seawater in addition to atmospheric carbon dioxide. These activities led to increase marine carbon sink capacity and DO levels that then increased water pH and helped preventing ocean acidification while also preventing eutrophication via efficient absorption of N and P along with other nutrients. Therefore, large-scale S. fusiforme cultivation could effectively improve water quality and environmental characteristics, leading to beneficial habitat restoration effects. S. fusiforme might inhibit phytoplankton growth by reducing nutrient availability. The inhibited growth of phytoplankton living in shaded areas might be due to light shading effects by expanded seaweed thalli (Chai et al., 2018).
The dominant microalgae in the non-cultivation area waters in April were B. prasinos, Geminigera cryophila, Heterocapsa sp, S. marinoi, and Thalassiosira tenera, but B. prasinos, G. cryophila, H. sp., S. costatum, and T. tenera in June. We speculate that S. fusiforme inhibited the growth of the above species, leading to their dominance in non-cultivation waters. Consistent with this interpretation, seawater extracts of hijiki dry powder contains substances that inhibit S. costatum, wherein the inhibitory effect increases with extract concentrations, suggesting that inhibitory substances in the extracts were presumably secondary metabolites with allelopathic effects (Zhang et al., 2021).
In this study there was no significant difference in the relative abundance of the dominant species Heterocapsa sp., P. prolonga, and B. prasinos among the sampling areas in April. Therefore, the dominant phyla of phytoplankton in the coastal ocean would not change due to the cultivation of S. fusiforme. The observed differences in community structure between April and June indicated a seasonal influence on communities that was consistent with other studies showing such trends due to seasonal variation of environmental factors such as temperature and nutrients (Chen et al., 2016; Lamont et al., 2018).
Significant differences between areas with and without S. fusiforme cultivation were observed when comparing several estimates of phytoplankton α and β biodiversity based on high-throughput sequencing approaches. Thus, these results pointed to a critical ecological significance of S. fusiforme cultivation, since biodiversity is one of the most important indicators of coastal ecosystem health and forms the basis of ecosystem productivity (Cardinale et al., 2012; Fraser et al., 2015; Isbell et al., 2015). Specifically, the results of this study indicated that large-scale cultivation of S. fusiforme maintained or enhanced phytoplankton community biodiversity via nutrient and light competition between seaweeds and phytoplankton. Therefore, these results demonstrated that large-scale cultivation of S. fusiforme could provide raw materials with high edible, medicinal, and industrial value and thus represented a promising strategy for controlling harmful algal blooms and eutrophication.
4.2 High-throughput sequencing provided more accurate microplankton identification
A total of 75 phytoplankton species were identified based on morphology, while a parallel survey of phytoplankton communities using high-throughput cultivation-independent sequencing identified 601 phytoplankton OTUs. Thus, the number of OTUs in this study was 3 to 7.6 times higher than the number of morphospecies identified from the same communities. This difference was likely attributable the high morphological similarity of species based on current taxonomy. For example, Skeletonema was one of the most abundant genera of phytoplankton observed in this study, comprising the five species S. marinoi, S. costatum, S. potamos, S. menzellii, and S. subsalsum based on high-throughput sequencing. In contrast, only S. costatum was identified based on traditional morphological observations due to high similarity in morphological appearance. In addition, the smallest known eukaryotes (~ l mm diameter cell sizes) (Chai et al., 2018) were observed for the first time in the study area. The actual number of phytoplankton species should be lower than those indicated by DNA sequencing approaches (Qiao et al., 2020). However, these higher OTU numbers likely reflected the genetic diversity among many morphospecies, and possibly the presence of some cryptic species or species complexes (Chai et al., 2018).
Phytoplankton communities detected with high-throughput sequencing are strikingly more diverse than those determined by microscopic detection, as many species exhibit relatively small sizes or are morphologically simple or similar to others (Liu et al., 2022). Furthermore, dormant cells, dead cells, or even cell fragments can be identified and lead to spurious diversity or abundance estimates (Santoferrara et al., 2020; Eliáš, 2021; Burki et al., 2021; Liu et al., 2022). Previous investigations of phytoplankton composition and diversity have primarily relied on traditional optical microscopy (Soares et al., 2011) that relies on cell morphological identification, rendering it difficult to recognize and distinguish similar taxa (Qiao et al., 2020). In this study, 21 species of nanophytoplankton accounted for 22.21% of the total sequences, while 17 species of picophytoplankton accounted for 13.18% of the total sequences from high-throughput sequencing, and these taxa were not observed using morphological analysis. Dominant Chlorophyta species such as B. prasinos, M. pusilla, P. australis, and Picochlorum sp. that are less than 2 μm in diameter are PPEs that are widely distributed in marine environments (Mayer and Taylo, 1979; Luis et al., 1992; Rashid et al., 2018). However, it was impossible to observe the above species by morphological observation; consequently, the use of high-throughput sequencing was necessary to comprehensively assess the diversity and community structure of phytoplankton. This will generally lead to higher biodiversity estimates.
4.3 The effects of S. fusiforme on phytoplankton community structure
RDA analysis indicated that DO, PO43–P, and NH4+-N were the main environmental factors affecting phytoplankton community structure in April among the factors measured, while DO levels in the culture area were significantly higher than in adjacent and control areas. The latter was primarily due to the photosynthetic oxygen release of S. fusiforme, and thus the effect of DO on phytoplankton community structure could be attributed to the effects of S. fusiforme on the phytoplankton community structure. A positive correlation was observed between phytoplankton community structure and nutrient concentrations, suggesting that seawater nutrients were consumed by S. fusiforme, thereby limiting phytoplankton growth to a certain extent. Consequently, S. fusiforme appeared to play a key role in regulating phytoplankton growth.
5 Conclusions
In summary, the results of the present study indicated that large-scale cultivation of S. fusiforme could reduce N and P concentrations in seawater, thereby helping to prevent eutrophication. Moreover, cultivation could increase water DO levels that could also help reduce the adverse effects of hypoxia while increasing water pH to prevent ocean acidification. In addition, large-scale cultivation of S. fusiforme played an important role in stabilizing phytoplankton community structure by improving phytoplankton diversity via the inhibition of harmful algal growth, potentially through allelopathy, nutrient competition and shading. Consequently, this study demonstrated that large-scale cultivation of S. fusiforme in coastal regions was an effective approach for increasing marine carbon sink capacities and helping to solve environmental problems in marine ecosystems.
Funding
This work was supported by the National Key R&D Program of China (grant numbers: 2018YFD0900702) and the Natural Science Foundation of Zhejiang Province (LZ17D060001 and LGF19D060002)
Publisher’s note
All claims expressed in this article are solely those of the authors and do not necessarily represent those of their affiliated organizations, or those of the publisher, the editors and the reviewers. Any product that may be evaluated in this article, or claim that may be made by its manufacturer, is not guaranteed or endorsed by the publisher.
Statements
Data availability statement
The datasets presented in this study can be found in online repositories. The names of the repository/repositories and accession number(s) can be found below: https://www.ncbi.nlm.nih.gov/, PRJNA761497
Author contributions
YZ: Conceptualization, Methodology, Software, Writing-original draft, Funding acquisition. DX: Supervision, Project administration, Validation, Writing - review and editing. TL: Investigation, Methodology, Validation. LQ: Investigation, Methodology, Validation. NX: Resources, Validation, Supervision, Writing - review and editing, Funding acquisition. All authors contributed to the article and approved the submitted version.
Conflict of interest
The authors declare that they have no known competing financial interests or personal relationships that could have appeared to influence the work reported in this paper.
References
1
Alonso-González A. Orive E. David H. Garcia-Etxebarria K. Luis Garrido J. Laza-Martinez A. et al . (2014). Scaly green flagellates from Spanish Atlantic coastal waters: molecular, ultrastructural and pigment analyses. Bot. Mar.57 (5), 379–402. doi: 10.1515/bot-2013-0108
2
Antoni J. S. Almandoz G. O. Ferrario M. E. Hernando M. P. Varel D. E. Rozem P. D et al (2020). Response of a natural Antarctic phytoplankton assemblage to changes in temperature and salinity. J. Exp. Mar. Biol. Ecol532, 151444. doi: 10.1016/j.jembe.2020.151444
3
Augustine A. Kumaran J. Puthumana J. Sabu S. Singh B. I. S. (2017). Multifactorial interactions and optimization in biomass harvesting of marine picoalga Picochlorum maculatum MACC3 with different flocculants. Aquaculture474, 18–25. doi: 10.1016/j.aquaculture.2017.03.020
4
Behrenfeld M. J. O’Malley R. T. Siegel D. A. McClain C. R. (2006). Climate-driven trends in contemporary ocean productivity. Nature444 (7120), 752–755. doi: 10.1038/nature05317
5
Bock C. Luo W. Kusber W. H. Hegewald E. Pažoutová M. Krienitz L. (2013). Classification of crucigenoid algae: phylogenetic position of the reinstated genus Lemmermannia, tetrastrum spp. Crucigenia tetrapedia, and C. lauterbornii (Trebouxiophyceae, chlorophyta) (1). J. Phycol.49 (2), 329–339. doi: 10.1111/jpy.12039.
6
Burki F. Sandin M. M. Jamy M. (2021). Diversity and ecology of protists revealed by metabarcoding. Curr. Biol.31 (19), R1267–R1280. doi: 10.1016/j.cub.2021.07.066
7
Caporaso J. G. Kuczynski J. Stombaugh J. (2010). QIIME allows analysis of high-throughput community sequencing data. Nat. Methods7, 335–336. doi: 10.1038/nmeth.f.303
8
Cardinale B. J. Duffy J. E. Gonzalez A. Hooper D. U. Perrings C. Venail P. et al . (2012). Biodiversity loss and its impact on humanity. Nature486, 59–67. doi: 10.1038/nature11148
9
Chai Z. Y. He Z. L. Yun Y. Yang Y. F. Tang Y. Z. (2018). Cultivation of seaweed Gracilaria lemaneiformis enhanced biodiversity in an eukaryotic plankton community as revealed via metagenomic analyses. Mol. Ecol.27, 1081–1093. doi: 10.1111/mec.14496
10
Chen Y. Gao Y. Chen C. Liang J. Sun L. (2016). Seasonal variations of phytoplankton assemblages and its relation to environmental variables in a scallop culture sea area of bohai bay, China, mar. pollut. Bull.113 (1-2), 362–370. doi: 10.1016/j.marpolbul.2016.10.025
11
Chen B. Zou D. Ma Z. Yu P. Wu M. (2018). Effects of light intensity on the photosynthetic responses of Sargassum fusiforme seedlings to future CO2 rising. Aquac. Res.50, 116–125. doi: 10.1111/are.13873
12
Christiane S. (2003). Cylotella cboctawbatcheeanaeine häufige diatomee aus sedimenthorizonten and einer wasserprobe des Greifswalder boddens(südliche ostsee). Senckenbe. Marit.32, 35–50. doi: 10.1007/BF03043084
13
de Vargas C. Audic S. Henry N. Decelle J. Mahe F. Logares R. et al . (2015). Eukaryotic plankton diversity in the sunlit ocean. Science348, 1261605. doi: 10.1126/science.1261605
14
Dunthorn M. Klier J. Bunge J. Stoeck T. (2012). Comparing the hyper-variable V4 and V9 regions of the small subunit rDNA for assessment of ciliate environmental diversity. J. Eukaryot. Microbio.59 (2), 185–187. doi: 10.1111/j.1550-7408.2011.00602.x
15
Egge E. S. Johannessen T. V. Andersen T. Eikrem W. Bittner L. Larsen A. et al . (2015). Seasonal diversity and dynamics of haptophytes in the skagerrak, Norway, explored by high-throughput sequencing. Mol. Ecol.24, 3026–3042. doi: 10.1111/mec.13160
16
Eliáš M. (2021). Protist diversity: novel groups enrich the algal tree of life. Curr. Biol.31 (11), R733–R735. doi: 10.1016/j.cub.2021.04.025
17
Emerson S. (2014). Annual net community production and the biological carbon flux in the ocean. Global Biogeochem. Cy.28 (1), 14–28. doi: 10.1002/2013GB004680
18
Falkowski P. Scholes R. J. Boyle E. E. A. Canadell J. Canfield D. Elser J. et al . (2000). The global carbon cycle: a test of our knowledge of earth as a system. Science290 (5490), 291–296. doi: 10.1126/science.290.5490.291
19
Fraser L. H. Pither J. Jentsch A. Sternberg M. Zobel M. Askarizadeh D. et al . (2015). Worldwide evidence of a unimodal relationship between productivity and plant species richness. Science349, 302–305. doi: 10.1126/science.aab3916
20
Handelsman J. Rondon M. R. Brady S. F. Clardy J. Goodman R. M. (1998). Molecular biological access to the chemistry of unknown soil microbes: a new frontier for natural products. Chem. Bio.5 (10), R245–R249. doi: 10.1016/S1074-5521(98)90108-9
21
Hiroshi S. Mayumi M. Takeshi N. Isao I. (2002). Vestigial chloroplasts in heterotrophic stramenopiles pteridomonas danicaand Ciliophrys infusionum (Dictyochophyceae). Protist153, 157–167. doi: 10.1078/1434-4610-00094
22
Howe A. T. Bass D. J. Scoble J. M et al . (2011). Novel Cultured Protists Identify Deep-branching Environmental DNA Clades of Cercozoa: New Genera Tremula, Micrometopion, Minimassisteria, Nudifila, Peregrinia. Protist162, 332–72. doi: 10.1016/j.protis.2010.10.002
23
Ichinomiya M. Yamada K. Nakagawa Y. Nishino Y. Kasai H. Kuwata A. (2019). Parmales abundance and species composition in the waters surrounding Hokkaido, north Japan. Polar Sci.9, 130–136. doi: 10.1016/j.polar.2018.08.001
24
Isbell F. Craven D. Connolly J. Loreau M. Schmid B. Beierkuhnlein C. et al . (2015). Biodiversity increases the resistance of ecosystem productivity to climate extremes. Nature526, 574–577. doi: 10.1038/nature15374
25
Jardillier L. Zubkov M. V. Pearman J. Scanlan D. J. (2010). Significant CO2 fixation by small prymnesiophytes in the subtropical and tropical northeast Atlantic ocean. ISME J.4 (9), 1180–1192. doi: 10.1038/ismej.2010.36
26
Jouenne F. Eikrema W. Le Gall F. Marie D. Johnsen G. Vaulot D. (2011). Prasinoderma singularis sp. nov. (Prasinophyceae, chlorophyta), a solitary coccoid prasinophyte from the south-East pacific ocean. Protist162, 70–84. doi: 10.1016/j.protis.2010.04.005
27
Kagan M. L. Matulka R. A. (2015). Safety assessment of the microalgae Nannochloropsis oculata. Toxicol.Rep.2, 617–623. doi: 10.1016/j.toxrep.2015.03.008
28
Lamont T. Brewin R. J. W. Barlow R. G. (2018). Seasonal variation in remotely-sensed phytoplankton size structure around southern Africa. Remote Sens. Environ.204, 617–631. doi: 10.1016/j.rse.2017.09.038
29
Leblad B. R. Amnhir R. Reqia S. Sitel F. Daoudi M. (2020). Seasonal variations of phytoplankton assemblages in relation to environmental factors in Mediterranean coastal waters of Morocco, a focus on HABs species. Harmful Algae96, 101819. doi: 10.1016/j.hal.2020.101819
30
Leblanc K. Quéguiner B. Diaz F. Michel-Rodriguez M. (2018). Nanoplanktonic diatoms are globally overlooked but play a role in spring blooms and carbon export. Nat. Commun.9, 953. doi: 10.1038/s41467-018-03376-9
31
Lee S. R. Oak J. H. Chung I. K. Lee J. A. (2010). Effective molecular examination of eukaryotic plankton species diversity in environmental seawater using environmental PCR, PCR-RFLP, and sequencing. J. Appl. Phycol.22, 699–707. doi: 10.1007/s10811-010-9509-7
32
Lefebvre S. Lawson T. Fryer M. Zakhleniuk O. V. Lloyd J. C. Raines C. A. (2005). Increased sedoheptulose-1,7-bisphosphatase activity in transgenic tobacco plants stimulates photosynthesis and growth from an early stage in development. Plant Physiol.138 (1), 451–460.
33
Li J. Li J. Liu Y. Liu Y. Wang Q. Gao X. et al . (2019). Effects of temperature and salinity on the growth and biochemical composition of the brown alga Sargassum fusiforme (Fucales, phaeophyceae). J. Appl. Phycol.31, 3061–3068. doi: 10.1007/s10811-019-01795-9
34
Lincoln AM Kirsty FS Lesley LR et al (2011). Mortalities of sea-cage salmon (Oncorhynchus tshawytscha) due to a bloom of Pseudochattonella verruculosa (Dictyochophyceae) in Queen Charlotte Sound, New Zealand. Harmful Algae11, 45–53. doi: 10.1016/j.hal.2011.07.003
35
Liu S. Gibson K. Cui Z. Chen Y. Sun X. Chen N. (2020a). Metabarcoding analysis of harmful algal species in jiaozhou bay. Harmful Algae92. doi: 10.1016/j.hal.2020.101772
36
Liu J. Ling S. Chen Q. Shen Y. Zhang J. (2020). Different extraction methods bring about distinct physicochemical properties and antioxidant activities of sargassum fusiforme fucoidans. Int.J. Bio.Macromol.155, 1385–1392. doi: 10.1016/j.ijbiomac.2019.11.113
37
Liu W. Song L. Wu J. (2017). Optimization of high-throughput sequencing primers for nanophytoplankton and picophytoplankton in environmental samples. Acta Ecol. Sin.37 (12), 4208–4216. doi: 10.5846/stxb201605180963
38
Luis M. L. Julián B. Rafael E. (1992). A comparative study of acid and alkaline phosphatase activities in several strains of nannochloris (Chlorophyceae) and nannochloropsis (Eustigmatophyceae), br. Phycol. J.27, 119–130. doi: 10.1080/00071619200650131
39
Mackenzie L. A. Smith K. F. Rhodes L. L (2011). Mortalities of sea-cage salmon (oncorhynchus tshawytscha) due to a bloom of pseudochattonella verruculosa (dictyochophyceae) in queen charlotte sound, new zealand. Harmful Algae11, 41–53. doi: 10.1016/j.hal.2011.07.003
40
Malviya S. Scalco E. Audic S. Vincent F. Veluchamy A. (2016). Insights into global diatom distribution and diversity in the world’s ocean. PNAS113(11), E1516–E1525. doi: 10.1073/pnas.1509523113
41
Manoylov K. M. (2014). Taxonomic identification of algae (morphological and molecular): species concepts, methodologies, and their implications for ecological bioassessment. J. Phycol.50 (3), 409–424. doi: 10.1111/jpy.12183
42
Massana R. (2011). Eukaryotic picoplankton in surface oceans. Annu. Rev. Microbiol.65, 91–110. doi: 10.1146/annurev-micro-090110-102903
43
Ma Z. Wu M. Lin L. Ronald W. T. Yu H. Zhang X. (2017). Allelopathic interactions between the macroalga Hizikia fusiformis (Harvey) and the harmful blooms-forming dinoflagellate Karenia mikimotoi. Harmful Algae65, 19–26. doi: 10.1016/j.hal.2017.04.003
44
Mayer J. A. Taylo F. J. R. (1979). A virus which lyses the marine nanoftagellate Micromonas pusilla. Nature281, 299–301. doi: 10.1038/281299a0
45
Moro I. La Rocca N. Dalla Valle L. Moschin E. Negrisolo E. Andreoli C. (2002). Pyramimonas australis sp. nov. (Prasinophyceae, chlorophyta) from Antarctica: fine structure and molecular phylogeny. Eur. J. Phycol.37, 103–114. doi: 10.1017/S0967026201003493
46
Navas-Parejoa J. C. C. Corzoa A. Papaspyroua S. (2020). Seasonal cycles of phytoplankton biomass and primary production in a tropical temporarily open-closed estuarine lagoon-the effect of an extreme climatic event. Sci. Total Environ.723, 138014. doi: 10.1016/j.scitotenv.2020.138014
47
Neefs J. M. Van de Peer Y. Hendriks L. De Wachter R. (1990). Compilation of small ribosomal subunit RNA sequences. Nucleic Acids Res.18 (Suppl), 2237–2317. doi: 10.1093/nar/18.suppl.2237
48
Nozaki H. (2003). “Flagellated green alagae,” in Freshwater algae of north America: Ecology and classification. Academic Press Eds. WehrJ. D.SheathR. G. (Elsterdam), 225–252.
49
Parsons M. L. Brandt A. L. Turner R. E. Morrison W. L. Ralabais N. N. (2021). Characterization of common phytoplankton on the Louisiana shelf. Mari. pollut. Bull.168, 112458. doi: 10.1016/j.marpolbul.2021.112458
50
Pawlowski J. Christen R. Lecroq B. Bachar D. Shahbazkia H. R. Amaral-Zettler L. et al . (2011). Eukaryotic richness in the abyss: insights from pyrotag sequencing. PloS One6 (4), e18169. doi: 10.1371/journal.pone.0018169
51
Peng X. Zhang L. Li Y. Lin Q. He C. (2021). The changing characteristics of phytoplankton community and biomass in subtropical shallow lakes: Coupling effects of land use patterns and lake morphology. Water Res.200, 117235. doi: 10.1016/j.watres.2021.117235
52
Pfannkuchen D. M. Godrijan J. Tankovic M. S. Baricevic A. Kuzat N. Djakovac T. et al . (2018). The ecology of one cosmopolitan, one newly introduced and one occasionally advected species from the genus skeletonema in a highly structured ecosystem, the northern Adriatic. Microb. Ecol.75, 674–687. doi: 10.1007/s00248-017-1069-9
53
Qiao L. Chang Z. Li J. Chen Z. (2020). Phytoplankton community succession in relation to water quality changes in the indoor industrial aquaculture system for litopenaeus vannamei. Aquaculture527, 735441. doi: 10.1016/j.aquaculture.2020.735441
54
Rashid J. Kobiyama A. Reza M. S. Yamada Y. Ikeda Y. (2018). Seasonal changes in the communities of photosynthetic picoeukaryotes in ofunato bay as revealed by shotgun metagenomic sequencing. Gene665, 127–132. doi: 10.1016/j.gene.2018.04.071
55
Samanta B. Kinney M. E. Heffell Q. Ehrman J. M. Kaczmarska I. (2017). Gametogenesis and auxospore development in the bipolar centric diatom brockmanniella brockmannii (Family cymatosiraceae). Protist168, 527–545. doi: 10.1016/j.protis.2017.07.004
56
Santoferrara L. Burki F. Filker S. Logares R. Dunthorn M. McManus G. B. (2020). Perspectives from ten years of protist studies by high-throughput metabarcoding. J. Eukaryot. Microbiol.67 (5), 612–622. doi: 10.1111/jeu.12813
57
Shan K. Song L. R. Chen W. Li L. Liu L. M. Wu Y. L. (2019). Analysis of environmental drivers influencing interspecific variations and associations among bloom-forming cyanobacteria in large, shallow eutrophic lakes. Harmful Algae84, 84–94. doi: 10.1016/j.hal.2019.02.002
58
Sieburth J. M. Johnson P. W. Hargraves P. E. (1985). Ultrastructure and ecology of aureococcus anophage-fferens gen. et sp. nov. (Chrysophyceae) the dominant picoplankter during a bloom in Narragansett bay, Rhode island, summer. J. Phycol.24, 416–425. doi: 10.1111/j.1529-8817.1988.tb04485.x
59
Simon N. Foulona E. Grulois D. Christophe S. Yves D. (2017). Revision of the genus micromonas Manton et parke (Chlorophyta, mamiellophyceae), of the type species m. pusilla (Butcher) Manton & parke andof the species M. commoda van baren, bachy and worden and description of two new species based on the geneticand phenotypic characterization of cultured isolates. Protist168, 612–635. doi: 10.1016/j.protis.2017.09.002
60
Sivakumar G. Jeong K. Lay J. O. (2014). Bioprocessing of Stichococcus bacillaris strain siva2011. Biotechnol. Biofuels7, 62. doi: 10.1186/1754-6834-7-62
61
Soares M. C. Lobao L. M. Vidal L. O. Noyma N. P. Barros N. O. Cardoso S. J . (2011). Light microscopy in aquatic ecology: methods for plankton communities studies. Methods Mol. Biol.689, 215–227. doi: 10.1007/978-1-60761-950-5_13
62
Song L. Wu J. Song G. J. (2020). High-throughput sequencing and comparative analysis of eukaryotic phytoplankton community in liaodong bay, China. Reg. Stud. Mar. Sci.40, 10150. doi: 10.1016/j.rsma.2020.101508
63
Stoeck T. Bass D. Nebel M. Christen R. Jones M. D. Breiner H. W. (2010). Multiple marker parallel tag environmental DNA sequencing reveals a highly complex eukaryotic community in marine anoxic water. Mol. Ecol.19, 21–31. doi: 10.1111/j.1365-294X.2009.04480.x
64
Tomaru Y. Toyoda K. Kimura K. (2018). Occurrence of the planktonic bloom-forming marine diatom Chaetoceros tenuissimus meunier and its infectious viruses in western Japan. Hydrobiologia805, 221–223. doi: 10.1007/s10750-017-3306-0
65
Vaulot D. Eikrem W. Viprey M. Moreau H. (2008). The diversity of small eukaryotic phytoplankton (3μm) in marine ecosystems. Fems. Microbiol. Rev.32, 795–820. doi: 10.1111/j.1574-6976.2008.00121.x
66
Xing X. Lin X. Chen C. Gao Y. Liang J. (2008). Observations of several cryptomonad flagellates from China Sea by scanning electron microscopy. J. Syst. Evo.46 (2), 205–212. doi: 10.3724/SP.J.1002.2008.07073
67
Zhang F. He J. Lin L. Jin L. (2015). Dominance of picophytoplankton in the newly open surface water of the central Arctic ocean. Polar Biol.38 (7), 1081–1089. doi: 10.1007/s00300-015-1662-7
68
Zhang Z. Liu J. Liu J. (2002). Study review of Hizikia fusiformis. mar. fishe. Res.23, 67–74.
69
Zhang Y. Xu N. Li H. Li Z. (2021). Evaluation of the correlation of Sargassum fusiforme cultivation and biodiversity and network structure of marine bacteria in the coastal waters of dongtou island of China. Aquaculture2021, 737057. doi: 10.1016/j.aquaculture.2021.737057
70
Zhang R. Zhang X. Tang Y. Mao J. (2020). Composition, isolation, purification and biological activities of sargassum fusiforme polysaccharides: A review. carbohydr. Polym228, 115381. doi: 10.1016/j.carbpol.2019.115381
71
Zhang X. Zhou H. Zhang H. (2006). The effect of Sargassum fusiforme polysaccharide extracts on vibriosis resistance and immune activity of the shrimp, fenneropenaeus chinensis. Fish Shellfish Immunol.20, 750–757. doi: 10.1016/j.fsi.2005.09.008
72
Zhou Y. Yang X. Wang Y. Li F. Wang J. Tan L. (2021). Exogenous nutrient inputs restructure phytoplankton community and ecological stoichiometry of Eastern Indian ocean. Ecolo. Indic.127, 107801. doi: 10.1016/j.ecolind.2021.107801
Summary
Keywords
Sargassum fusiforme , harmful algal blooms, phytoplankton biodiversity, high-throughput sequencing, bioremediation
Citation
Zhang Y, Xu D, Li T, Qiao L and Xu N (2022) Effects of large-scale Sargassum fusiforme culture on phytoplankton community structure and water quality. Front. Mar. Sci. 9:907726. doi: 10.3389/fmars.2022.907726
Received
30 March 2022
Accepted
13 July 2022
Published
04 August 2022
Volume
9 - 2022
Edited by
Jinghui Fang, Yellow Sea Fisheries Research Institute (CAFS), China
Reviewed by
Zengling Ma, Wenzhou University, China; Xiaoting Fu, Ocean University of China, China; Biswarup Sen, Tianjin University, China
Updates
Copyright
© 2022 Zhang, Xu, Li, Qiao and Xu.
This is an open-access article distributed under the terms of the Creative Commons Attribution License (CC BY). The use, distribution or reproduction in other forums is permitted, provided the original author(s) and the copyright owner(s) are credited and that the original publication in this journal is cited, in accordance with accepted academic practice. No use, distribution or reproduction is permitted which does not comply with these terms.
*Correspondence: Dongdong Xu, xudong0580@163.com; Nianjun Xu, xunianjun@nbu.edu.cn
This article was submitted to Marine Fisheries, Aquaculture and Living Resources, a section of the journal Frontiers in Marine Science
Disclaimer
All claims expressed in this article are solely those of the authors and do not necessarily represent those of their affiliated organizations, or those of the publisher, the editors and the reviewers. Any product that may be evaluated in this article or claim that may be made by its manufacturer is not guaranteed or endorsed by the publisher.