Abstract
Although China possesses a large number of islands, knowledge of their overall ecological condition is limited on a national scale. Accordingly, this study developed a comprehensive and quantitative island ecosystem assessment framework that incorporates environmental quality, biological structure, and landscape patterns. The framework was applied to 42 typical, representative islands within China’s coastal regions, including different climatic zones, area sizes, populations, and substratum lithologies. Results showed that the value range of the comprehensive index of island ecosystem condition (CIisland) was significant (from 52.33 to 89.53, 71.72 average), and 85.4% of islands scored either “high” or “good,” indicative of their exceptional condition. However, conditions varied among different island components, indicating different challenges. Environmental quality index (Ienv) values ranged from 60.70 to 94.80 (79.72 average), where primary threats were seawater nutrient pollution, petroleum, and marine organism metal contamination. Biological structure index (Ibio) values ranged from 43.50 to 89.40 (66.10 average), where primary threats were vegetation destruction and a reduction in marine biodiversity within intertidal and subtidal zones. Landscape pattern index (Iland) values varied significantly (from 6 to 100, 72.36 average), where a key characteristic of highly developed islands was low natural landscape (vegetation) coverage. Conditions also varied among island climate zones, lithologies, area sizes, and levels of human habitation. Additionally, island ecosystem conditions were influenced by both natural and anthropogenic factors as well as area size, population, and GDP. Although distance to the mainland significantly correlated to (Ibio), and (CIisland), these parameters did not significantly correlate to (Ienv), which might be explained by that environmental quality was generally conditional on large-scale environments. This assessment is intended to provide a holistic perspective on island conditions in China while identifying key challenges and associated driving factors, which will greatly aid in establishing island-specific sustainable management practices.
Introduction
An island is a land body completely surrounded by sea water, which is a complicated ecological-social-economical systems having important ecological and socioeconomic roles. Due to geographic isolation and unique environments, many endemic and specialized species inhabit islands (Weigelt et al., 2013), playing a critical role in global biodiversity maintenance (Veettil et al., 2020). At the same time, island ecosystems also provide valuable goods and services, such as food and water provisioning, erosion and pollination regulation, and recreation and ecotourism (Su et al., 2016; Balzan et al., 2018). However, owing to their isolation and small size, most island ecosystems are ecologically fragile (Brodie et al., 2013), being particularly susceptible to global climate change (Leclerc et al., 2020), land-use intensification (Xie et al., 2021), exotic species invasion (Reaser et al., 2007), etc. Under increasing threat from natural and anthropogenic impacts, there is growing concern regarding island conservation and sustainable development around the world.
Comparatively, China holds many islands. For example, more than 11,000 islands are dispersed around its surrounding seas, among which 7372 have a land area greater than 500 m2. This equates to an approximate land area of 72,800 km2 and a coastline of 14217.8 km (Ministry of Natural Resources of the People’s Republic of China, 2018). Many of these islands have undergone considerable changes and degradation, mainly due to intensive anthropogenic activities (Zhao et al., 2004; Cao et al., 2017), such as vegetation destruction, endemic species loss, and seawater deterioration. Over time, island management has moved from being hands-off to active management, such as island restoration, island tourism management, and carefully planned and comprehensive management will become more necessary with increasing climate change and anthropogenic pressures (Xie et al., 2021), particularly in a large spatial scale. For better decision making for island management, it is important to determine their ecosystem condition status and baseline.
Since China’s First National Island Resources Comprehensive Survey (1988–1996), various aspects of island data have been reported on, including island soil, bird, vegetation, marine organisms, environmental quality, etc. (Yang, 2000; Xu et al., 2017; Tan et al., 2020). In recent years, an increasing number of studies have tended to assess or evaluate island ecosystems quantitatively. For example, Zhan et al. (2019) used emergy analysis modeling to evaluate ecosystem services in Chongming Island. Sun et al. (2020) established an Eco-environmental Quality Index (EQI) model to evaluate the ecological status of Hainan Island. Zhang et al. (2021) applied principal component analysis (PCA) to conduct an island sustainability evaluation in the Zhoushan Archipelago, using 15 island ecosystem indices covering climatic, geographical, landscape, social, and biological dimensions. Chi et al. (2021) applied 12 factors that included vegetation, soil, and landscape factors to evaluate island ecosystems in the Miaodao Archipelago. However, challenges remain: i) most current studies were conducted at a relatively small scale (i.e., island or archipelago scale), and knowledge related to Chinese island ecosystems and associated methodologies are limited on a national scale; ii) only limited knowledge is available on comprehensive island conditions that cover terrestrial, intertidal, and subtidal sub-ecosystems. Accordingly, this study aims to quantitatively explore the condition of Chinese island ecosystems, providing an important baseline to predict prospective effects of anthropogenic disturbances and climate change, which will be of great significance in informing the direction of effective management and sustainable development.
Materials and Methods
Selected Islands
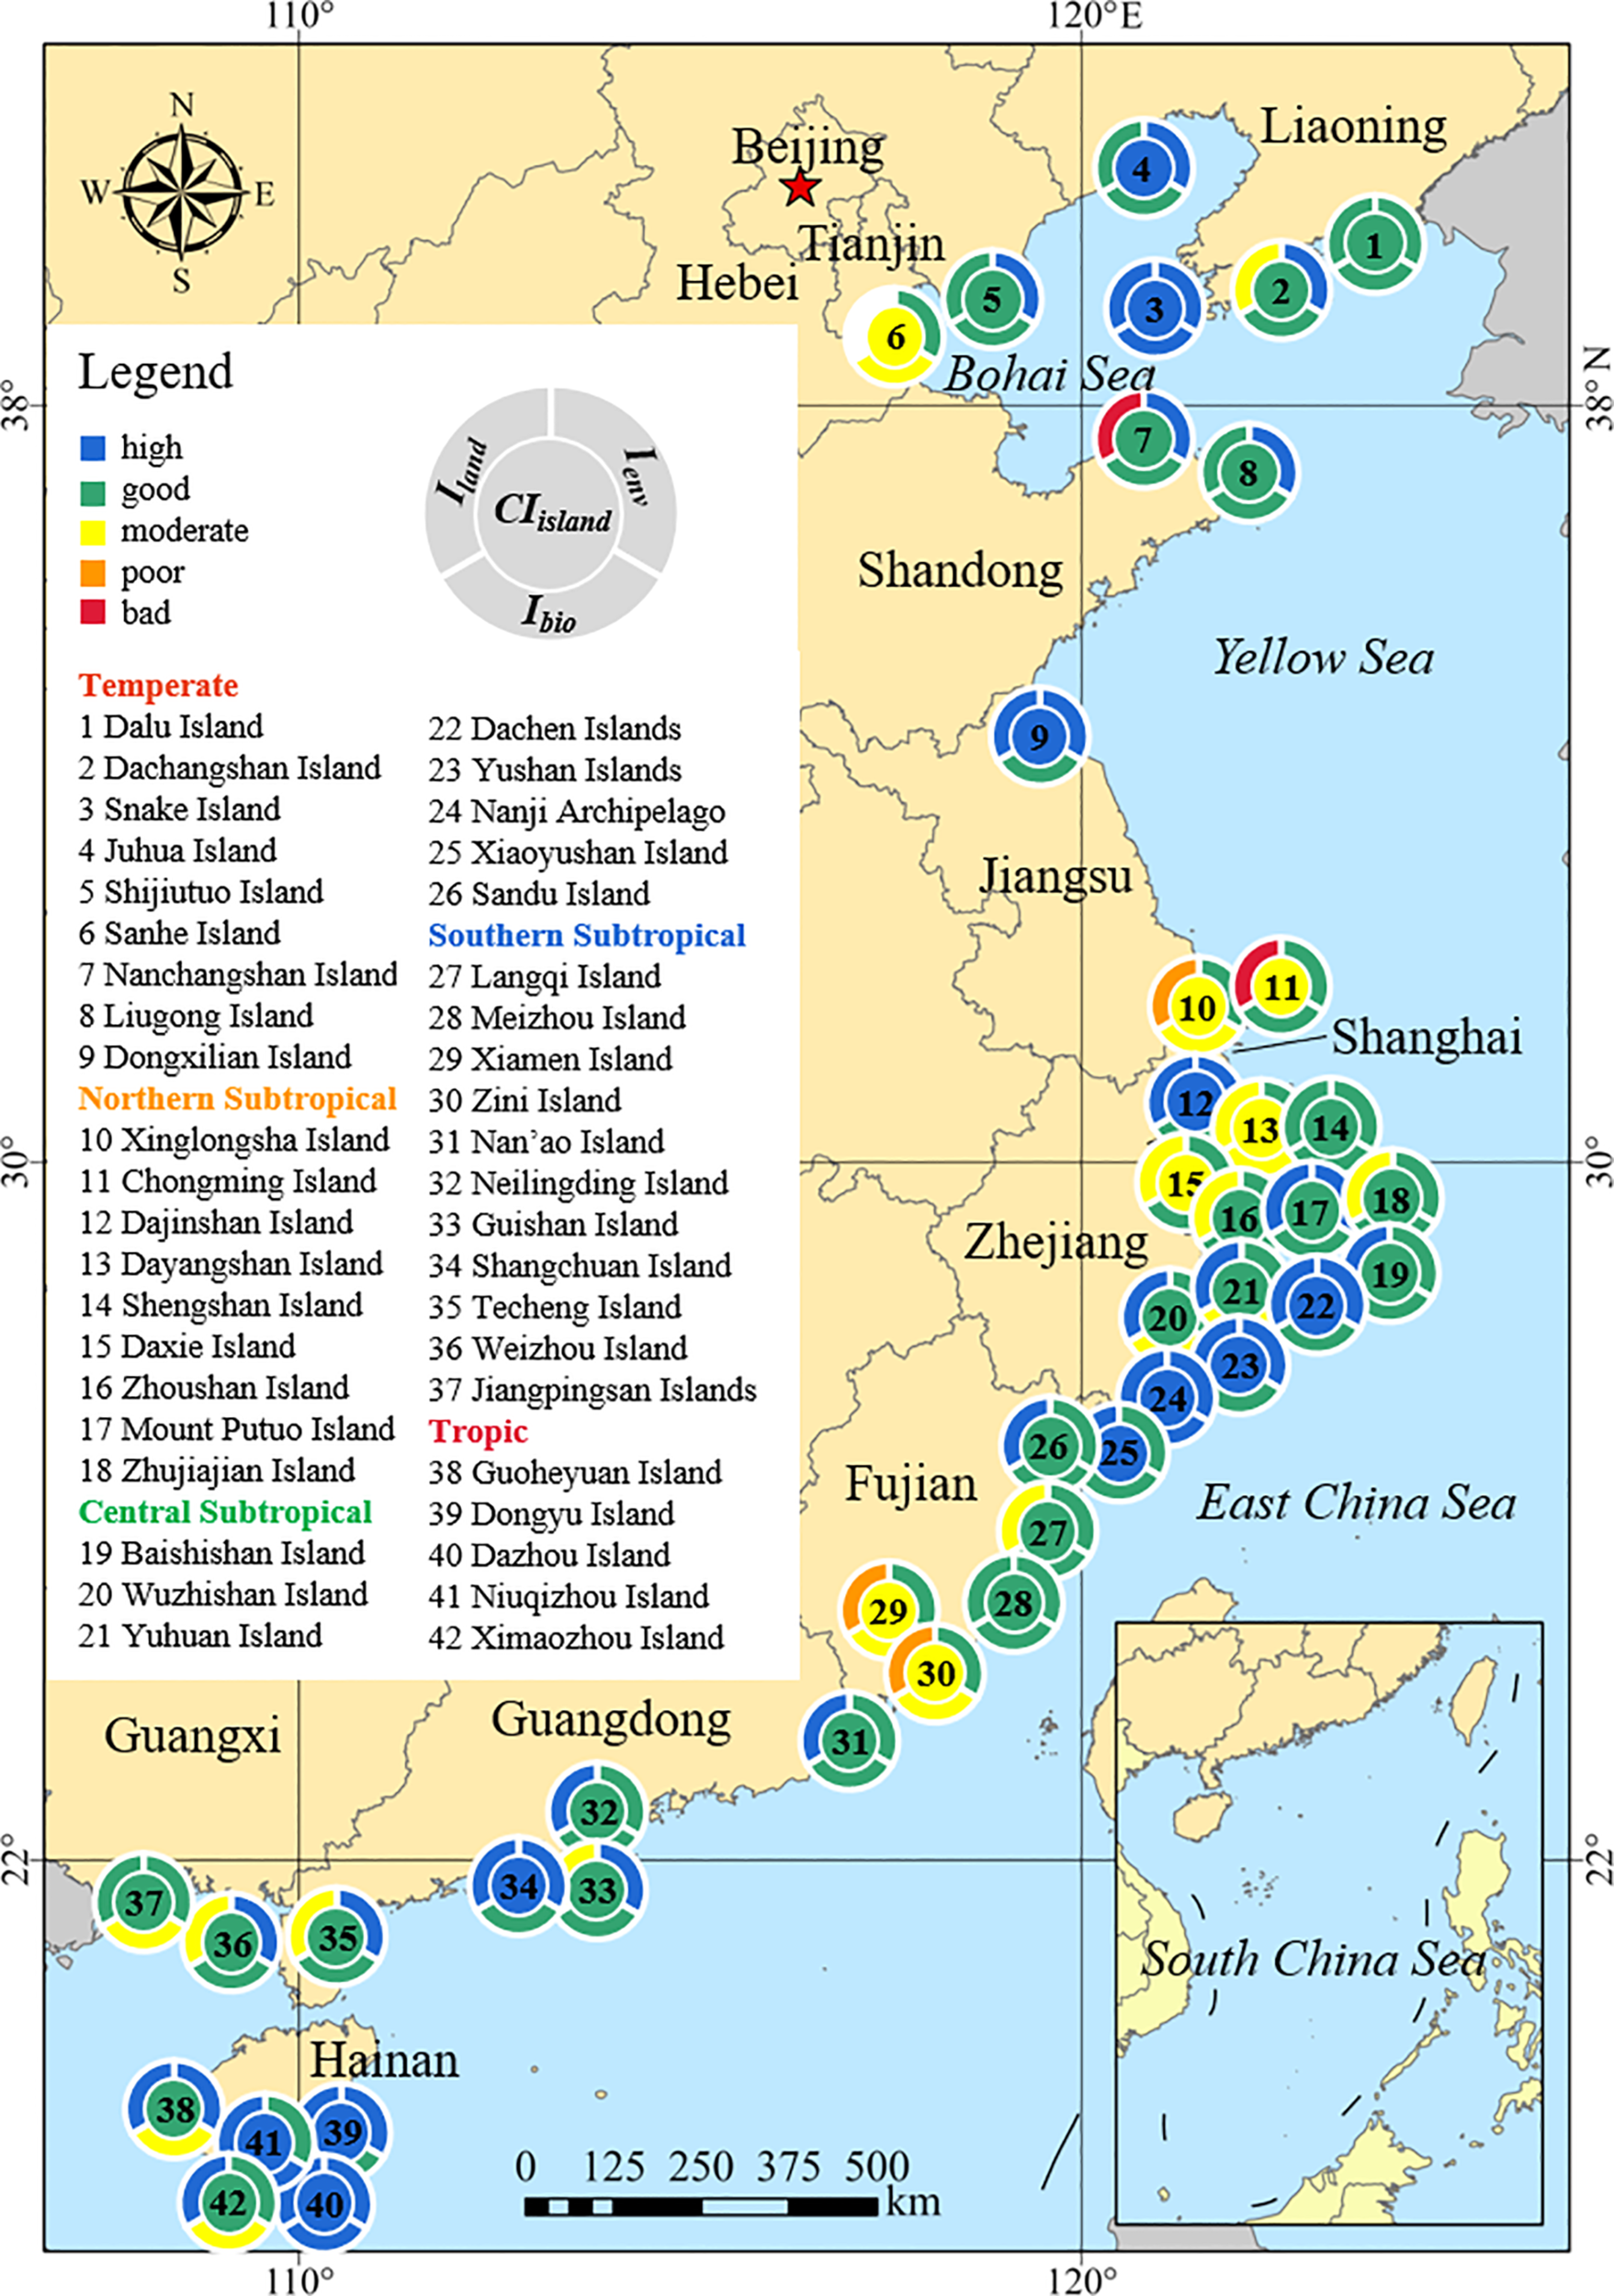
A total of 42 islands were selected for this study, exemplifying China’s main island characteristics. These are representative island systems from different climatic zones and with varying area sizes, populations, and substratum lithologies (Table 1 and Figure 1). Because China’s subtropical zone consists of the largest number of islands overall (i.e., approximately 73% of all of China’s islands are distributed off the coast of Zhejiang, Fujian, and Guangdong provinces) (Ministry of Natural Resources of the People’s Republic of China, 2018), most islands selected for this study are from the subtropical zone (28 in total). Considering the relative equilibrium of the islands selected among China’s different climate zones, subtropical islands were further grouped into three subsets by their location and climate condition, namely, northern subtropical, central subtropical, and southern subtropical subsets. Finally, nine temperate, nine northern subtropical, eight central subtropical, 11 southern subtropical, and five tropical island ecosystems were selected for this investigation. Island area ranged from 0.1 km2 to 1225 km2 (63.31 km2 average), of which 86.36% were less than 100 km2. Regarding population, most islands were inhabited (i.e., 35 inhabited and seven uninhabited). Based on island substratum lithologies, which express specific island-forming processes, 34 islands were designated continental and seven alluvial. In general, the distribution of all 42 islands selected for this study reflect the uneven distribution of the islands that surround China. In other words, most islands are distributed throughout the southern region of the country while, at the same time, most islands are situated nearshore (compared to offshore).
Table 1
| NO. | Island name | Area (km2) | Climatic zone | Population | Island lithology |
|---|---|---|---|---|---|
| 1 | Dalu Island | 3.7 | Temperate | Inhabited | Continental |
| 2 | Dachangshan Island | 25.7 | Temperate | Inhabited | Continental |
| 3 | Snake Island | 0.7 | Temperate | Uninhabited | Continental |
| 4 | Juhua Island | 11.7 | Temperate | Inhabited | Continental |
| 5 | Shijiutuo Island | 3.4 | Temperate | Inhabited | Alluvial |
| 6 | Sanhe Island | 0.1 | Temperate | Uninhabited | Alluvial |
| 7 | Nanchangshan Island | 10.4 | Temperate | Inhabited | Continental |
| 8 | Liugong Island | 1.8 | Temperate | Inhabited | Continental |
| 9 | Dongxilian Island | 5.4 | Temperate | Inhabited | Continental |
| 10 | Xinglongsha Island | 36.6 | Northern Subtropical | Inhabited | Alluvial |
| 11 | Chongming Island | 1225 | Northern Subtropical | Inhabited | Alluvial |
| 12 | Dajinshan Island | 0.2 | Northern Subtropical | Uninhabited | Continental |
| 13 | Dayangshan Island | 6.6 | Northern Subtropical | Inhabited | Continental |
| 14 | Shengshan Island | 4.5 | Northern Subtropical | Inhabited | Continental |
| 15 | Daxie Island | 28.4 | Northern Subtropical | Inhabited | Continental |
| 16 | Zhoushan Island | 502.6 | Northern Subtropical | Inhabited | Continental |
| 17 | Mount Putuo Island | 16 | Northern Subtropical | Inhabited | Continental |
| 18 | Zhujiajian Island | 75.8 | Northern Subtropical | Inhabited | Continental |
| 19 | Baishishan Island | 1.1 | Central Subtropical | Inhabited | Continental |
| 20 | Wuzhishan Island | 4.8 | Central Subtropical | Uninhabited | Continental |
| 21 | Yuhuan Island | 174.3 | Central Subtropical | Inhabited | Continental |
| 22 | Dachen Islands | 17.5 | Central Subtropical | Inhabited | Continental |
| 23 | Yushan Islands | 12 | Central Subtropical | Inhabited | Continental |
| 24 | Nanji Archipelago | 12 | Central Subtropical | Inhabited | Continental |
| 25 | Xiaoyushan Island | 3.3 | Central Subtropical | Inhabited | Continental |
| 26 | Sandu Island | 24.7 | Central Subtropical | Inhabited | Continental |
| 27 | Langqi Island | 72 | Southern Subtropical | Inhabited | Continental |
| 28 | Meizhou Island | 14.2 | Southern Subtropical | Inhabited | Continental |
| 29 | Xiamen Island | 129.5 | Southern Subtropical | Inhabited | Continental |
| 30 | Zini Island | 47 | Southern Subtropical | Inhabited | Alluvial |
| 31 | Nan’ao Island | 105.2 | Southern Subtropical | Inhabited | Continental |
| 32 | Neilingding Island | 5.5 | Southern Subtropical | Uninhabited | Continental |
| 33 | Guishan Island | 3.6 | Southern Subtropical | Inhabited | Continental |
| 34 | Shangchuan Island | 137.2 | Southern Subtropical | Inhabited | Continental |
| 35 | Techeng Island | 3.2 | Southern Subtropical | Inhabited | Continental |
| 36 | Weizhou Island | 25 | Southern Subtropical | Inhabited | Continental |
| 37 | Jiangpingsan Islands | 20.8 | Southern Subtropical | Inhabited | Alluvial |
| 38 | Guoheyuan Island | 1.1 | Tropic | Uninhabited | Alluvial |
| 39 | Dongyu Island | 1.7 | Tropic | Inhabited | Alluvial |
| 40 | Dazhou Island | 4.4 | Tropic | Inhabited | Continental |
| 41 | Niuqizhou Island | 1.1 | Tropic | Uninhabited | Continental |
| 42 | Ximaozhou Island | 2.1 | Tropic | Inhabited | Continental |
Characteristics of the selected islands in this study.
Figure 1
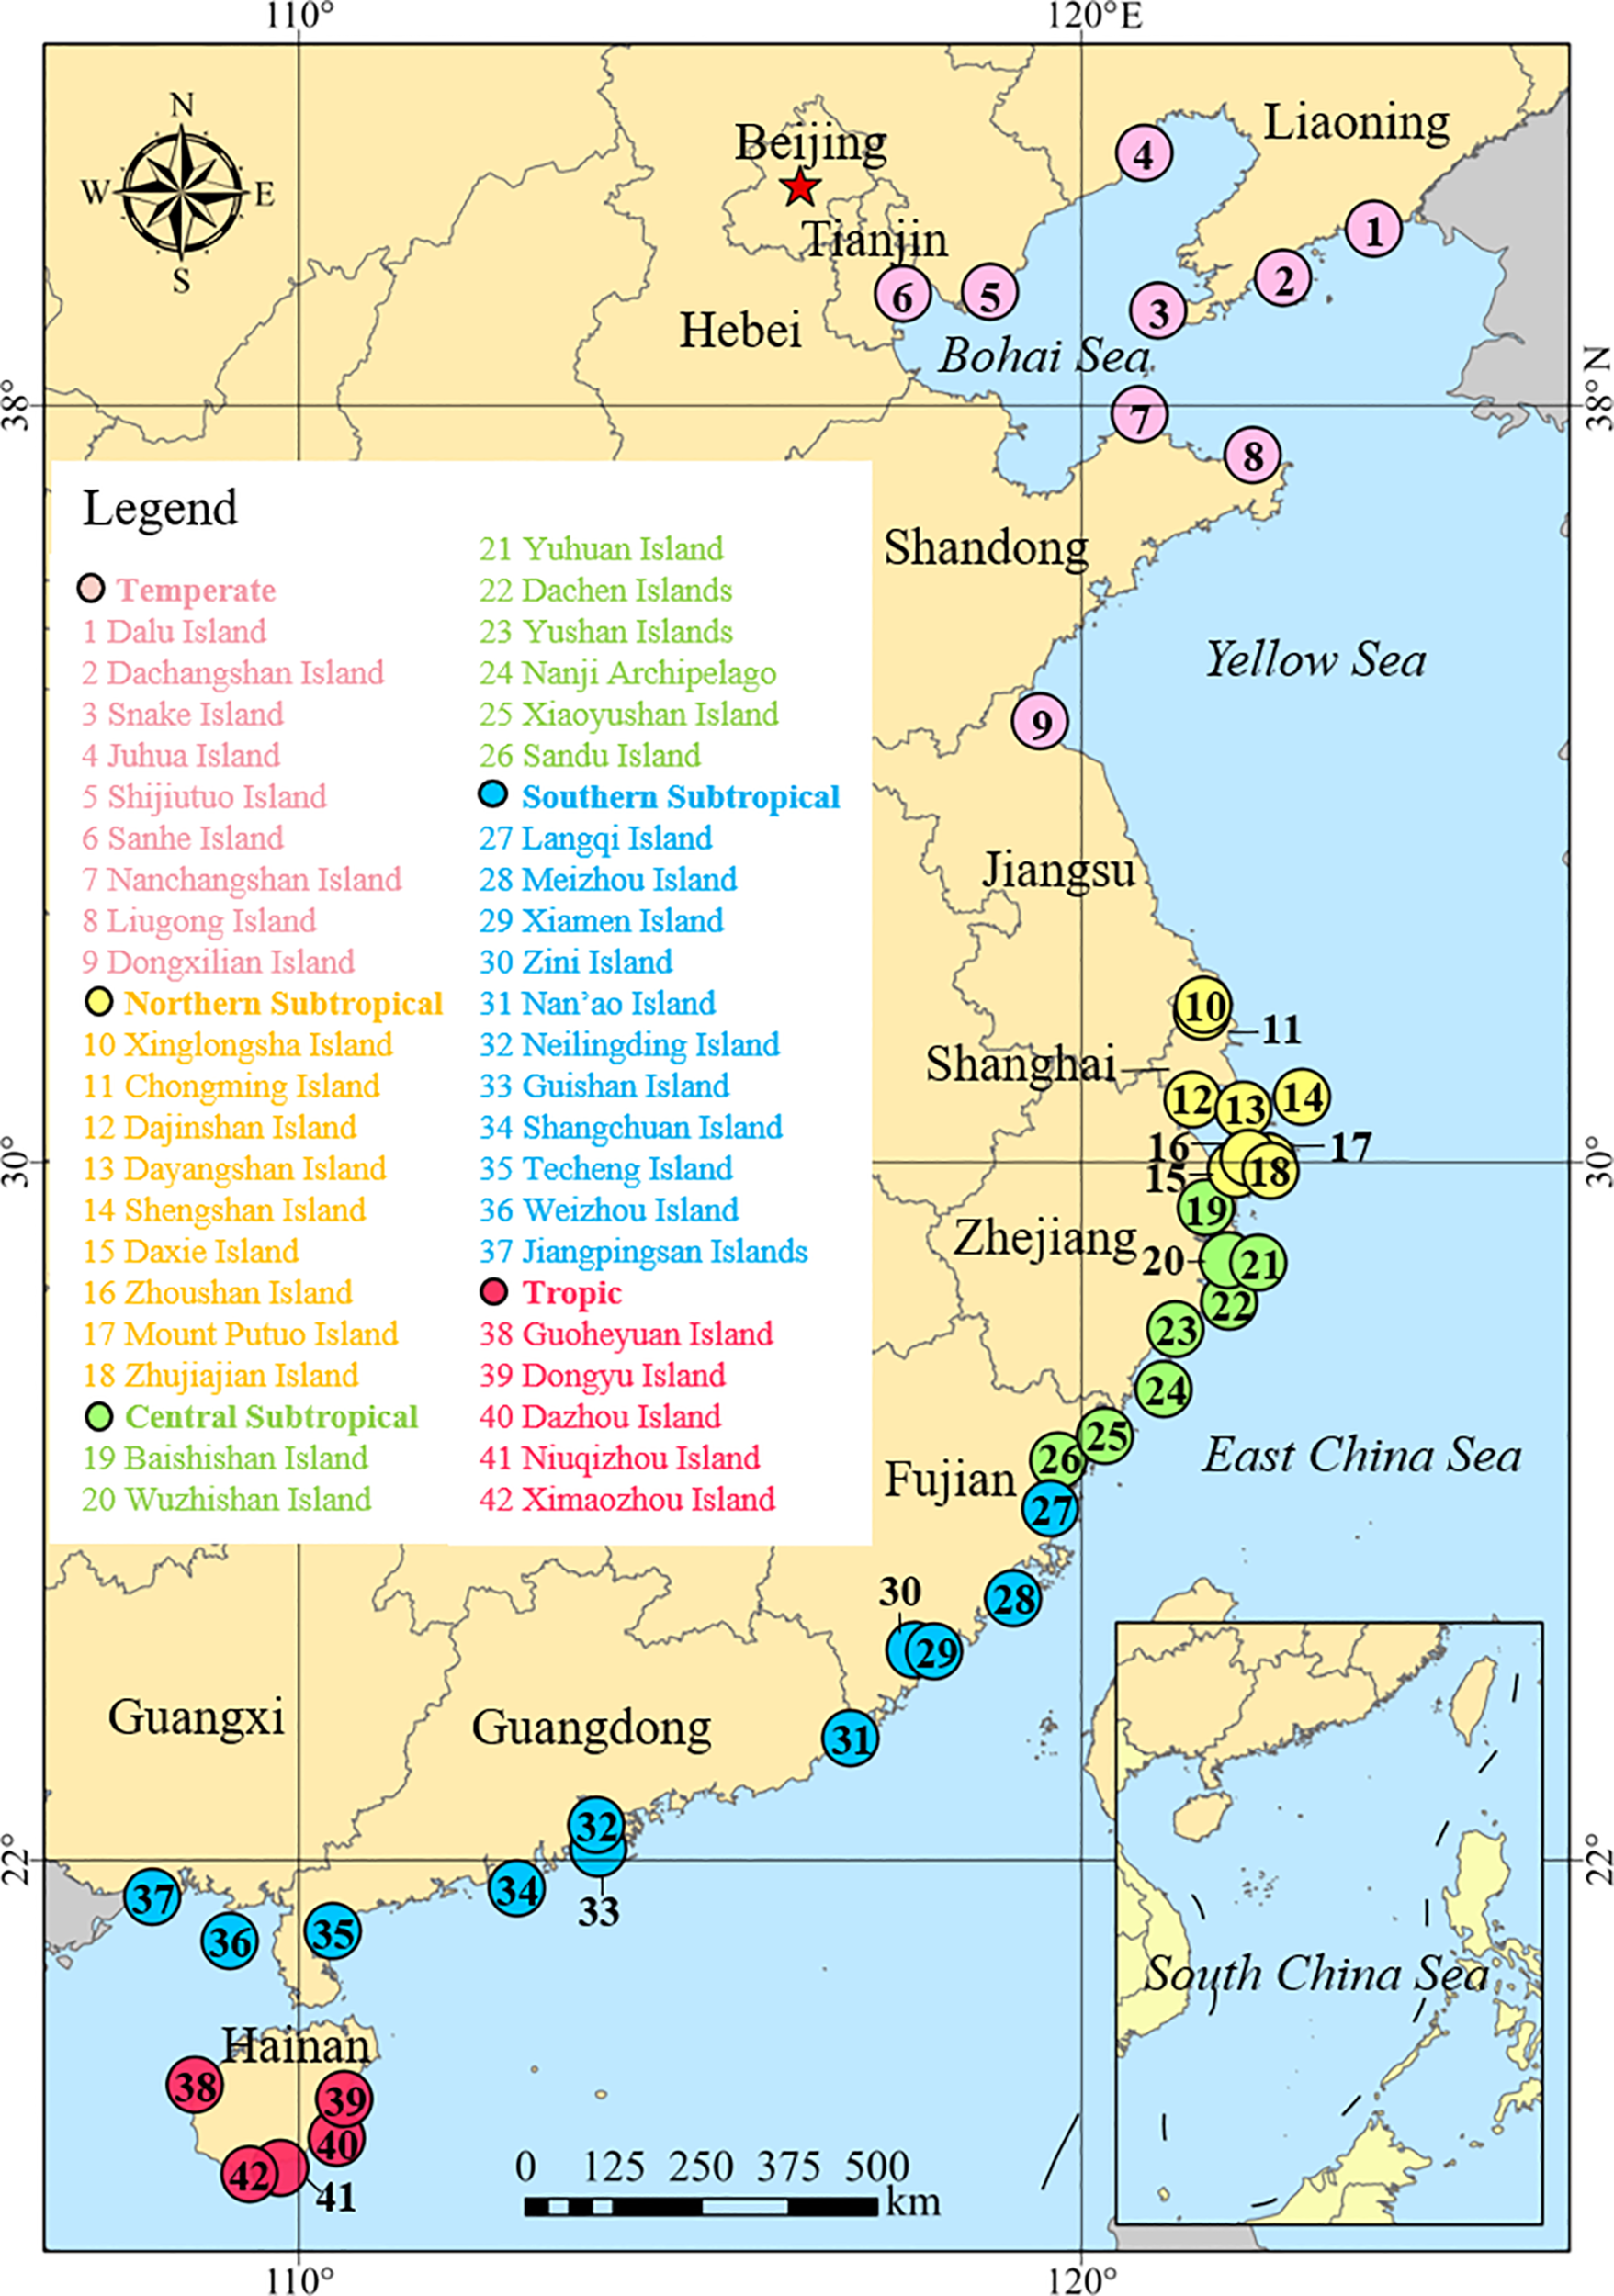
Distribution of the selected islands in this study.
Data Sources
Data on marine environmental and biological parameters in this study were based on a comprehensive and nationwide marine project (i.e., China’s offshore marine investigation and assessment), covering seawater, phytoplankton, and macrobenthos, which were compiled from a series of published provincial and national investigations reports (Offshore Marine Investigation and Assessment Project Office of Jiangsu, 2012; Hebei Oceanic Administration, 2013; Xu et al., 2013; Hou and Ma, 2014; Chen, 2016; Huang et al., 2017; Ma et al., 2017). Marine environmental and biological parameters were obtained during four campaigns conducted in July (summer) 2006, October (autumn) 2006, January (winter) 2007, and April (spring) 2007. Investigation methods used were consistent across all selected islands, following the technical regulations for island investigations (Offshore Marine Investigation and Assessment Project Office of SOA, 2005a), the technical regulations for marine biological and ecological investigations (Offshore Marine Investigation and Assessment Project Office of SOA, 2006a), the technical regulations for marine chemical investigations (Offshore Marine Investigation and Assessment Project Office of SOA, 2006b). Some of the data used in our study are presented in the Supplementary Tables 1, 2.
For island vegetation and landscape parameters, data were interpreted from remote sensing images fused with multi-spectral and panchromatic bands with a resolution of 2.5m using data from 2005, following the technical regulations for aerial remote sensing investigation of islands and coastal zones (Offshore Marine Investigation and Assessment Project Office of SOA, 2005b).
In this way, all data described were obtained during the same period with uniform investigation technical regulations, enhancing the data’s comparability and reliability.
Integrated Assessment Method
Indicators
An island is a unique ecosystem comprised of complex components in multiple dimensions, which spatially covers various sub-ecosystems, including terrestrial, intertidal, and subtidal sub-ecosystems, biotic and abiotic factors, and the hierarchical ecological organization of individuals, populations, communities, and landscapes. For this study, to simplify complexity, island ecosystem condition was defined and characterized under three specific factors: environmental, biological, and landscape. A set of criteria was then proposed to screen for appropriate indicators that could be used to determine island ecosystem conditions, including representativeness, sensitivity, measurability, data availability, and comprehensiveness (Table 2). Based on these criteria, proposed indicators were selected by a panel of experts using the Delphi method, and a three-hierarchal indicator system was established, covering indicators related to environmental quality, biological structure, and landscape pattern (Table 3).
Table 2
| Criteria | Description |
|---|---|
| Representative | Indicator should be typical for describing a certain aspect of ecosystem condition, and representative for some other related and repeated indicators with the same or similar meaning. |
| Sensitive | Indicator should be able to provide early warnings and accurately reflects a certain aspect of ecosystem condition. |
| Measurable | Indicator should be measured by scientific tools or methods and transparent for an easy communication, in order to be applied at different islands. |
| Data available | The data required for indicators should be easy to attain and interpret by current monitoring efforts. |
| Comprehensive | Indicator system should be comprehensive to cover the main characteristics of ecosystem, and also reflect the spatial integrity of island ecosystem covering insular land, intertidal and subtidal sub-ecosystems. |
Criteria for selecting indicators of island ecosystem condition.
Table 3
| Goal | Sub-goal | Indicators | Unit | Required (●)/optional (○) |
|---|---|---|---|---|
| Environmental quality (A) | Seawater quality (A1) | DO, COD, DIN, PO4-P, Petroleum | mg/L | ● |
| Intertidal sediment quality (A2) | Organic carbon, Sulfide, Petroleum, Cu, Zn, Pb, Cr, Hg, As, Cd | 10-6 | ● | |
| Intertidal organism quality (shellfish) (A3) | 666, DDT, Cu, Zn, Pb, Cr, Hg, As, Cd, Petroleum | mg/kg | ○ | |
| Biological structure (B) | Island terrestrial biological structure (B1) | Vegetation coverage | % | ● |
| Abundance variation of key terrestrial animals | % | ○ | ||
| Intertidal biological structure (B2) | Intertidal macrobenthos diversity | – | ● | |
| Subtidal biological structure (B3) | Chlorophyll-a | mg/m3 | ● | |
| Phytoplankton diversity | – | ● | ||
| Zooplankton diversity | – | ● | ||
| Subtidal diversity | – | ● | ||
| Nekton diversity | – | ○ | ||
| Indicator species (B4) | Abundance variation of important or endangered species | % | ● | |
| Invasive species (B5) | Area coverage invaded by alien species | – | ○ | |
| Landscape pattern (C) | Naturalness of landscape (C1) | Coverage of natural landscapes | % | ● |
Island ecosystem assessment indicators.
For environmental quality, three subgoals were considered in view of data availability, including the quality of seawater, intertidal sediment, and intertidal organisms, which were measured using typically used chemical parameters. For biological structure, in light of the spatial integrity of biological structure, terrestrial, intertidal, and subtidal biological structures were included. Moreover, two specific species level indicators were also considered, including invasive species and indicator species of important or endangered species. Biological structures were primarily measured respective to the composition, abundance, and diversity of taxonomic entities, where the Shannon index (H') was adopted to calculate diversity (Shen et al., 2010). For landscape pattern, naturalness of landscape was selected, which was measured using natural landscape coverage.
Given the considerable characteristic differences across all selected islands (along with the limited available data of some of them), indicators were defined as either “required” or “optional,” where the former was used for all islands while the latter could be applied to a limited number of islands conditional on data availability. This was done to enhance the operability of the indicator system (Table 3). For this study, “required” indicators must reflect typical characteristics among all selected islands, have easily obtainable and available raw data, and are strongly representative. Conversely, “optional” indicators are those that represent unique characteristics of certain island ecosystems or where the raw data were difficult to attain.
Reference Values
Ecosystem condition was generally defined as being an observed state to a referenced condition or ecological target (Smit et al., 2021); thus, setting the reference value for all indicators was an essential part of the ecosystem condition assessment. Owing to the natural and anthropogenic heterogeneity across the selected islands, ensuring comparability was the key challenge of this study.
To resolve this challenge, we used consistent standards across the selected islands by adopting current and related standards. Specifically, reference values of island seawater quality, intertidal sediment quality, and intertidal organism quality derived from the national sea water quality standard of China (GB3097-1997), the marine sediment quality standard of China (GB18668-2002), and the marine biological quality standard of China (GB18421-2001), respectively. For biological structure indicators, reference values referred to the guidance for the assessment of coastal marine ecosystem health (HY/T 087-2005). For certain indicators that lacked a current standard, we used data that derived from the First National Island Resources Comprehensive Survey (1988–1996), which provided historical conditions devoid of or with only limited anthropogenic disturbances. For landscape patterns, an absolute boundary was set at 0–100% natural landscape coverage, and therefore, the highest theoretical value (100%) was defined as the reference condition, indicating the best condition without anthropogenic disturbances.
To highlight differences among indicator value intervals, indicator reference values were hierarchized into four categories: class I, class II, class III, and class IV. The final reference values were determined as described in Supplementary Table 3.
Indicator Normalization
Indicator normalization was used to reduce measurements to dimensionless data under a standard scale, where, specifically, raw indicator data were rescaled into an identical score scale of 0–100 based on the aforementioned reference values. Being consistent with the four reference value categories, the normalization score range was set correspondingly in Supplementary Table 3.
The min-max normalization technique with linear interpolation was used for indicator normalization. Two different formulas were employed for positive (a) and negative (b) indicators, respectively. A positive indicator indicated a positive relationship between raw indicator data and normalization score, a lower indicator data value, and a lower normalization score, reducing the ecological condition. Conversely, a negative indicator yielded a lower raw indicator data value and a higher normalization score, increasing the ecological condition.
where Yi is the normalization score of indicator I; Xi is the observed value of raw data for indicator i; Bmax and Bmin are the upper and lower limits of reference values of the condition level interval for indicator i determined by its measurement; Fmax and Fmin are the upper and lower limits of normalization score values of the condition level interval for indicator i.
Weight Assignment
Weights reflect the importance of each indicator relative to the upper level composite indicator. The weights on goal and sub-goal levels were determined using the Delphi method through an investigation of greater than 100 questionnaires, covering scientific researchers, students, governmental administrators, protected area managers, etc. An equal weighting scheme was used for indicator levels. In the case of missing data for certain sub-goals or indicators, the weights of other sub-goals or indicators at the same level were adjusted proportionally based on the original weights. The total sum of weights at the same indicator level was 1. The final weights were calculated as shown in Figure 2.
Figure 2
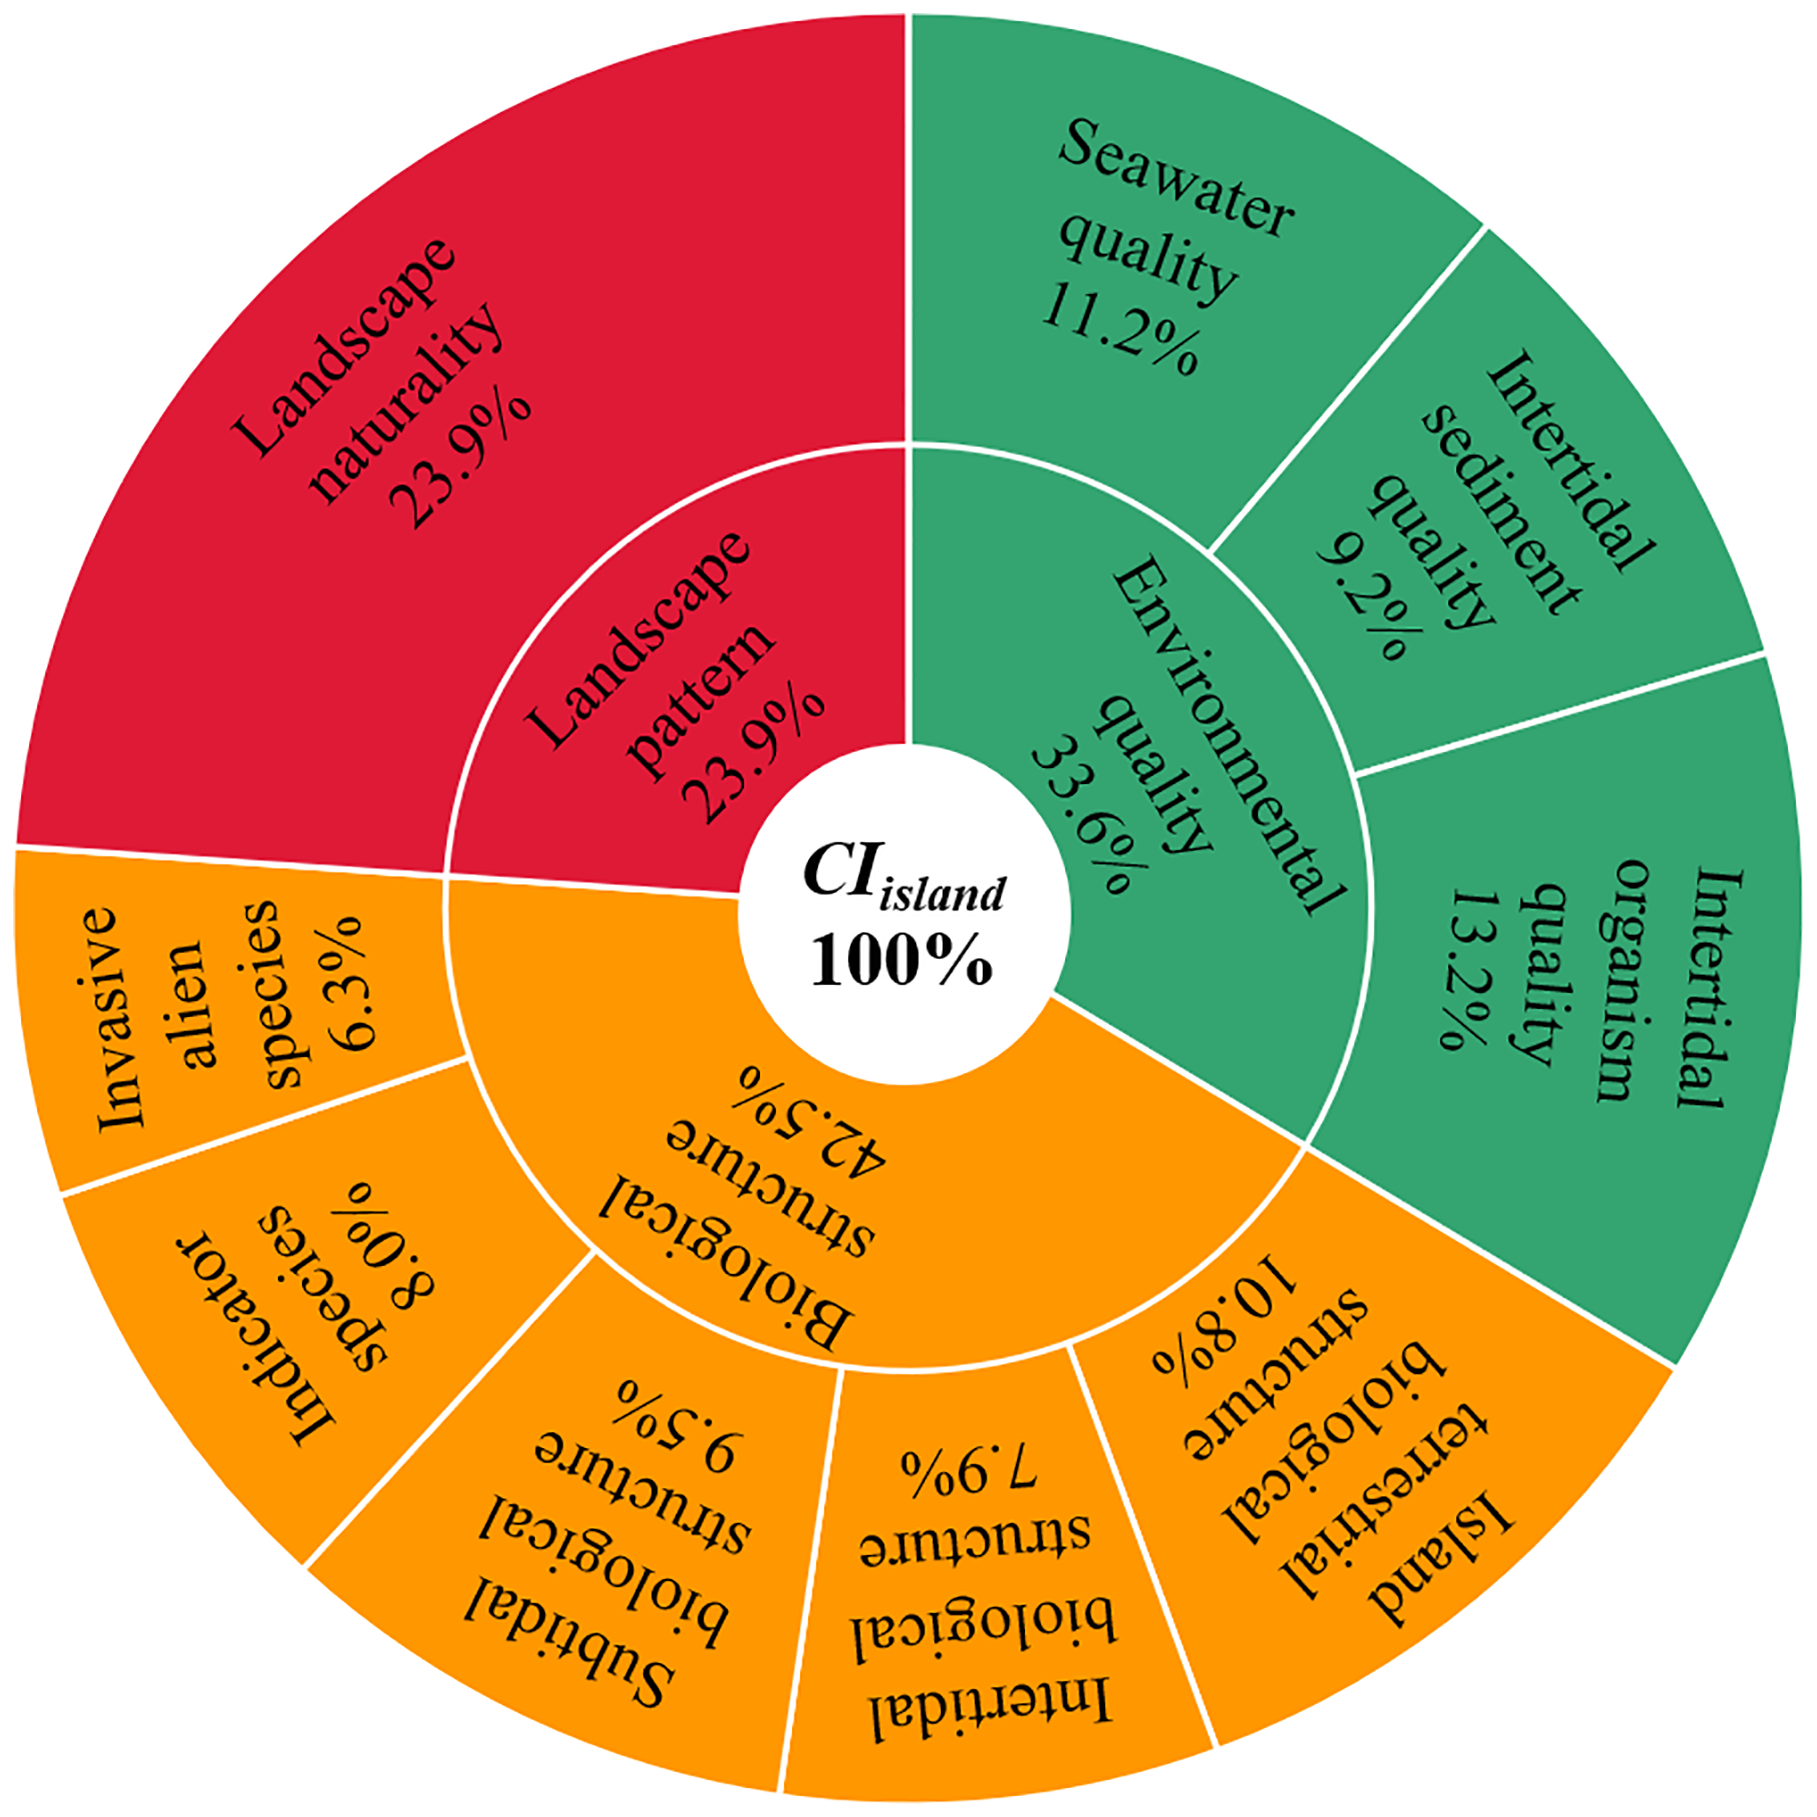
Indicator weights of integrated assessment of island ecosystems.
Integrated Assessment Model
The aim of this integrated assessment was to aggregate several indicators into a single composite index. The weighted sum model was used to calculate the comprehensive index of island ecosystems, covering the environmental quality index, the biological structure index, and the landscape pattern index. The formulas used are as follows:
where (CIisland) is the comprehensive index of island ecosystem condition; Ienv is the environmental quality index; Ibio is the biological structure index; Iland is the landscape pattern index, Wenv, Wbio, and Wland are the weights for environmental quality, biological structure, and landscape patterns. Ienvi is the score of sub-goal i for environmental quality; Wenvi is the weight of sub-goal i for environmental quality. Ibioi is the score of sub-goal i for biological structure; Wbioi is the weight of sub-goal i for biological structure. Analogously, sub-goal scores were obtained by weighted summation as formal (d) and (e) from corresponding next level indicators.
The value for the composite index, including, (CIisland) Ienv, Ibio and Ilandranged from 0 to 100. The higher the value, the better the condition, where 0 represents the fully degraded condition and 100 represents the best condition without disturbance and degradation. To further define the condition, the equidistant method was applied to section the value of the composite index into five levels that represent different conditions: very poor (0~20), poor (20~40), moderate (40~60), good (60~80), and high (80~100).
Results
Environmental Quality Index
The value of environmental quality index (Ienv) ranged from 60.70 to 94.80, with an average of 79.72, indicating good environmental quality, where the condition of 19 islands scored “high” and 23 islands scored “good”. Pertaining to the different factors, the value to intertidal sediment quality was highest (87.95 average) under the “high” condition, followed by seawater quality (78.73 average) under the “good” condition, while organism quality was the lowest (66.25 average) under the “good” condition.
For seawater quality, the overall condition of the selected islands was good, where most environmental parameters met the class II national sea water quality standard of China (GB3097-1997), except for DIN and PO4-P, which were also the primary pollution parameters within China’s nearshore waterbodies. In approximately 47.6% of the selected islands, DIN exceeded the class II national sea water quality standard of China (0.3mg/L), where Zini Island, Chongming Island, and Dajinshan Island had particularly high DIN content (>1.0mg/L). In approximately 38.1% of the selected islands, PO4-P exceeded the class II national sea water quality standard of China (0.03mg/L), where Baishishan Island and Dachangshan Island had particularly high PO4-P content (>0.05mg/L).
For intertidal sediment quality, sulfide, organic carbon, and heavy metal content was low in most of the selected islands, where approximately 82% of the selected islands met the class I marine sediment quality standard of China (GB18668-2002). The quality of intertidal shellfish was comparatively lower, where all parameters in greater than 50% of islands exceeded the class I organism marine biological quality standard threshold of China (GB18421-2001).
Furthermore, certain parameters [i.e., petroleum, lead (Pb), zinc (Zn)] had high pollution content, whether for seawater, intertidal sediment, or organisms. Spatially, the environmental quality value was highest in tropical islands, followed by temperate and subtropical islands (Table 4). However, significant variation was observed among the different sub-regions in the subtropical zone, where the value of the central subtropical zone was highest overall, particularly regarding its high intertidal sediment quality score. The northern subtropical zone had the lowest overall score, which was mainly due to its comparatively lower intertidal organism quality value.
Table 4
| Indicators | Temperate | Subtropical | Tropical | ||||
|---|---|---|---|---|---|---|---|
| All | Northern Subtropical | Central Subtropical | Southern Subtropical | ||||
| Seawater quality (A1) | range | 73.04-88.67 | 66.27-92.71 | 68.52-76.19 | 66.27-82.13 | 73.13-92.71 | 53.00-92.23 |
| average | 82.40 | 76.60 | 70.65 | 76.91 | 82.24 | 80.39 | |
| Intertidal sediment quality (A2) | range | 87.73-98.28 | 65.96-97.68 | 65.96-95.47 | 78.14-93.99 | 67.08-97.68 | 77.78-99.1 |
| average | 92.17 | 86.34 | 84.92 | 93.99 | 88.47 | 85.48 | |
| Intertidal organism quality (A3) | range | 43.93-66.71 | 37.17-85.78 | 37.17-82.34 | 59.66-85.78 | 37.06-84.06 | 69.24-69.24 |
| average | 55.30 | 66.06 | 58.00 | 75.91 | 64.28 | 69.24 | |
| environmental quality index Ienv | range | 67.95-91.68 | 60.70-91.78 | 60.70-80.57 | 72.57-84.75 | 66.91-91.78 | 62.42-92.08 |
| average | 83.80 | 76.88 | 72.18 | 84.75 | 79.45 | 81.93 | |
Environmental quality assessment scores.
Biological Structure Index
The biological structure index Ibio values varied significantly from 43.50 to 89.40, with an average of 66.10 under the “good” condition, where the condition of 4, 28, and 10 islands scored “high,” “good,” and “moderate,” respectively. Values also varied significantly among the different factors, where values of invasive species were highest overall, with an average value of 96.76 under the “high” condition, followed by indicator species with an average value of 74.88 and island terrestrial biological structure with an average value of 64.32 under the “good” condition. Lower values were observed in subtidal biological structure values (58.08 average) and intertidal biological structure (53.83 average) under the “moderate” condition.
Results showed that the biological condition of marine aquatic island sub-ecosystems (i.e., intertidal and subtidal) was lower than that of island terrestrial sub-ecosystems. Island vegetation coverage varied significantly (from 0 to 100%, 62.64% average), where Snake Island, Dajinshan Island, and Neilingding Island had a vegetation coverage of 100%, all being protected areas, while Wuzhishan Island and Zini Island had a vegetation coverage of 0%. Biological invasion was uncommon across all selected islands. Mikania micrantha was the most prominent invasive species found on a limited number of islands, particularly Neilingding Island. For subtidal biological structure, biological conditions differed among biological communities, where higher values were observed in zooplankton diversity (69.20 average) and nekton diversity (62.73 average) under the “good” condition, followed by phytoplankton diversity (58.64 average), chlorophyll-a (55.75 average), and macrobenthos diversity (50.21 average) under the “moderate” condition.
Spatially, the biological condition of temperate islands was the highest overall, followed by subtropical and tropical islands (Table 5). The low value of tropical islands was the result of a significant reduction in the abundance of important and/or endangered species, particularly in Dong Island and Ximaozhou Island.
Table 5
| Indicators | Temperate | Subtropical | Tropical | ||||
|---|---|---|---|---|---|---|---|
| All | Northern Subtropical | Central Subtropical | Southern Subtropical | ||||
| Island terrestrial biological structure | range | 46.40-100 | 0-100 | 0-100 | 62.68-99.34 | 0-100 | 44.70-93.9 |
| average | 73.16 | 61.04 | 50.80 | 81.58 | 50.75 | 77.66 | |
| Intertidal biological structure | range | 28.20-100 | 23.54-91.39 | 25.00-66.00 | 26.16-91.39 | 23.54-79.15 | / |
| average | 65.87 | 50.23 | 45.00 | 58.20 | 47.48 | / | |
| Subtidal biological structure | range | 42.90-69.10 | 34.00-79.00 | 34.00-66.00 | 48.26-72.41 | 41.85-79.00 | 57.94-76.00 |
| average | 52.70 | 58.68 | 53.50 | 61.85 | 60.69 | 64.13 | |
| Indicator species | range | 75.00-100 | 25.00-100 | 100 | 30.00-90.00 | 25.00-90.00 | 7.92-100 |
| average | 85.63 | 77.08 | 100 | 63.75 | 67.50 | 31.32 | |
| Invasive species | range | 100 | 20.00-100 | 100 | 100 | 20.00-100 | / |
| average | 100 | 96.00 | 100 | 100 | 88.00 | / | |
| Biological structure index Ibio | range | 43.50-89.40 | 46.00-85.22 | 46.00-74.00 | 53.99-85.22 | 49.51-76.25 | 46.64-85.84 |
| average | 71.50 | 64.85 | 60.70 | 72.64 | 61.20 | 64.49 | |
Biological structure assessment scores.
Landscape Pattern Index
The value of landscape pattern index Iland varied significantly from 6 to 100 (72.36 average) where the value of approximately 47.62% of the selected islands were under the “good” condition, indicating that most islands retained relatively high natural landscape coverage. The condition of two islands scored “very poor” while three islands scored “poor,” which were mostly in inhabited islands that surrounded megacities, such as Xinglongsha Island and Chongming Island in Shanghai, indicating that the advantageous geographic location of islands near to large cities often resulted in a reduction in their natural landscapes.
The landscape pattern condition varied spatially, where tropical islands had the highest Iland values (91.36 average), followed by subtropical islands (69.69 average) and temperate islands (66.75 average) (Table 6). Significant variation was observed among the different subtropical sub-regions, where the highest values were in the central subtropical region (86.02 average), followed by the southern subtropical region (64.65 average) and the northern subtropical region (58.40 average).
Table 6
| Indicators | Temperate | Subtropical | Tropic | ||||
|---|---|---|---|---|---|---|---|
| All | Northern Subtropical | Central Subtropical | Southern Subtropical | ||||
| Naturalness of landscape (C1) | range | 19.70-100 | 6.00-100 | 6.00-100 | 57.70-100 | 27.72-100 | 82.40-100 |
| average | 66.75 | 69.69 | 58.40 | 86.02 | 64.65 | 91.36 | |
Landscape pattern assessment scores.
Composite Index of Island Ecosystem Conditions
The value of the comprehensive index of the island ecosystem condition (CIisland) for all selected islands varied significantly from 52.33 to 89.53 (71.72 average) under the “good” condition (Table 7). Specifically, 12 islands were under the “high” condition, 23 islands were under the “good” condition, and seven islands were under the “moderate” condition.
Table 7
| Indicators | Temperate | Subtropical | Tropical | ||||
|---|---|---|---|---|---|---|---|
| All | Northern Subtropical | Central Subtropical | Southern Subtropical | ||||
| Environmental quality index Ienv | range | 67.95-91.68 | 60.70-91.78 | 60.70-80.57 | 72.57-84.75 | 66.91-91.78 | 62.42-92.08 |
| average | 83.80 | 76.88 | 72.18 | 84.75 | 79.45 | 81.93 | |
| Biological structure index Ibio | range | 43.50-89.40 | 46.00-85.22 | 46.00-74.00 | 53.99-85.22 | 49.51-76.25 | 46.64-85.84 |
| average | 71.50 | 64.85 | 60.70 | 72.64 | 61.20 | 64.49 | |
| Landscape pattern index Iland | range | 19.70-100 | 6.00-100 | 6.00-100 | 57.70-100 | 27.72-100 | 82.40-100 |
| average | 66.75 | 69.69 | 58.40 | 86.02 | 64.65 | 91.36 | |
| Composite index of island ecosystem condition CIisland | range | 54.29-88.97 | 52.33-87.52 | 52.33-82.29 | 69.11-87.52 | 52.51-80.85 | 64.38-89.53 |
| average | 74.17 | 70.14 | 64.29 | 77.98 | 68.16 | 77.14 | |
Integrated assessment scores of island conditions.
For both indicators and climatic zones, conditions varied slightly (Table 8 and Figures 3, 4). Environmental quality index (Ienv) values were highest (79.72 average), where all selected islands were under the “good” or “high” condition. Moreover, a comparatively large number of islands were under the “high” condition in the temperate and tropical zones. Although the landscape pattern index Iland ranked second (72.36 average), its range was significant. Even though all tropical and central subtropical islands were under the “high” condition, a certain proportion of islands in other climatic zones were degraded with respect to landscape pattern. Biological structure index (Ibio) values were lowest (66.10 average), where a high proportion of islands were under the “high” or “good” condition. Tropical island conditions were best overall, followed by temperate and the subtropical islands. Additionally, this also showed that except for “poor” or “very poor” conditions observed in the landscape pattern index (Iland) for a limited number of islands, the other sub-goals were comparatively better.
Table 8
| Area Size | Island Population | Population Density of Island | Island GDP | GDP Density of Island | Distance to Mainland | |
|---|---|---|---|---|---|---|
| Ienv | -0.16 | -0.26 | -0.29 | -0.39 | -0.39 | -0.29 |
| Ibio | -0.03 | -0.11 | -0.31* | -0.54* | -0.54* | -0.35* |
| Iland | -0.47** | -0.50** | -0.47** | -0.28 | -0.28 | -0.41** |
| CIIsland | -0.31* | -0.40** | -0.48** | -0.52* | -0.52* | -0.47** |
Pearson correlation coefficients between island condition indices and geographical-social-economic parameters.
*denotes a correlation significance of P<0.05; **denotes a correlation significance of P<0.01.
Figure 3
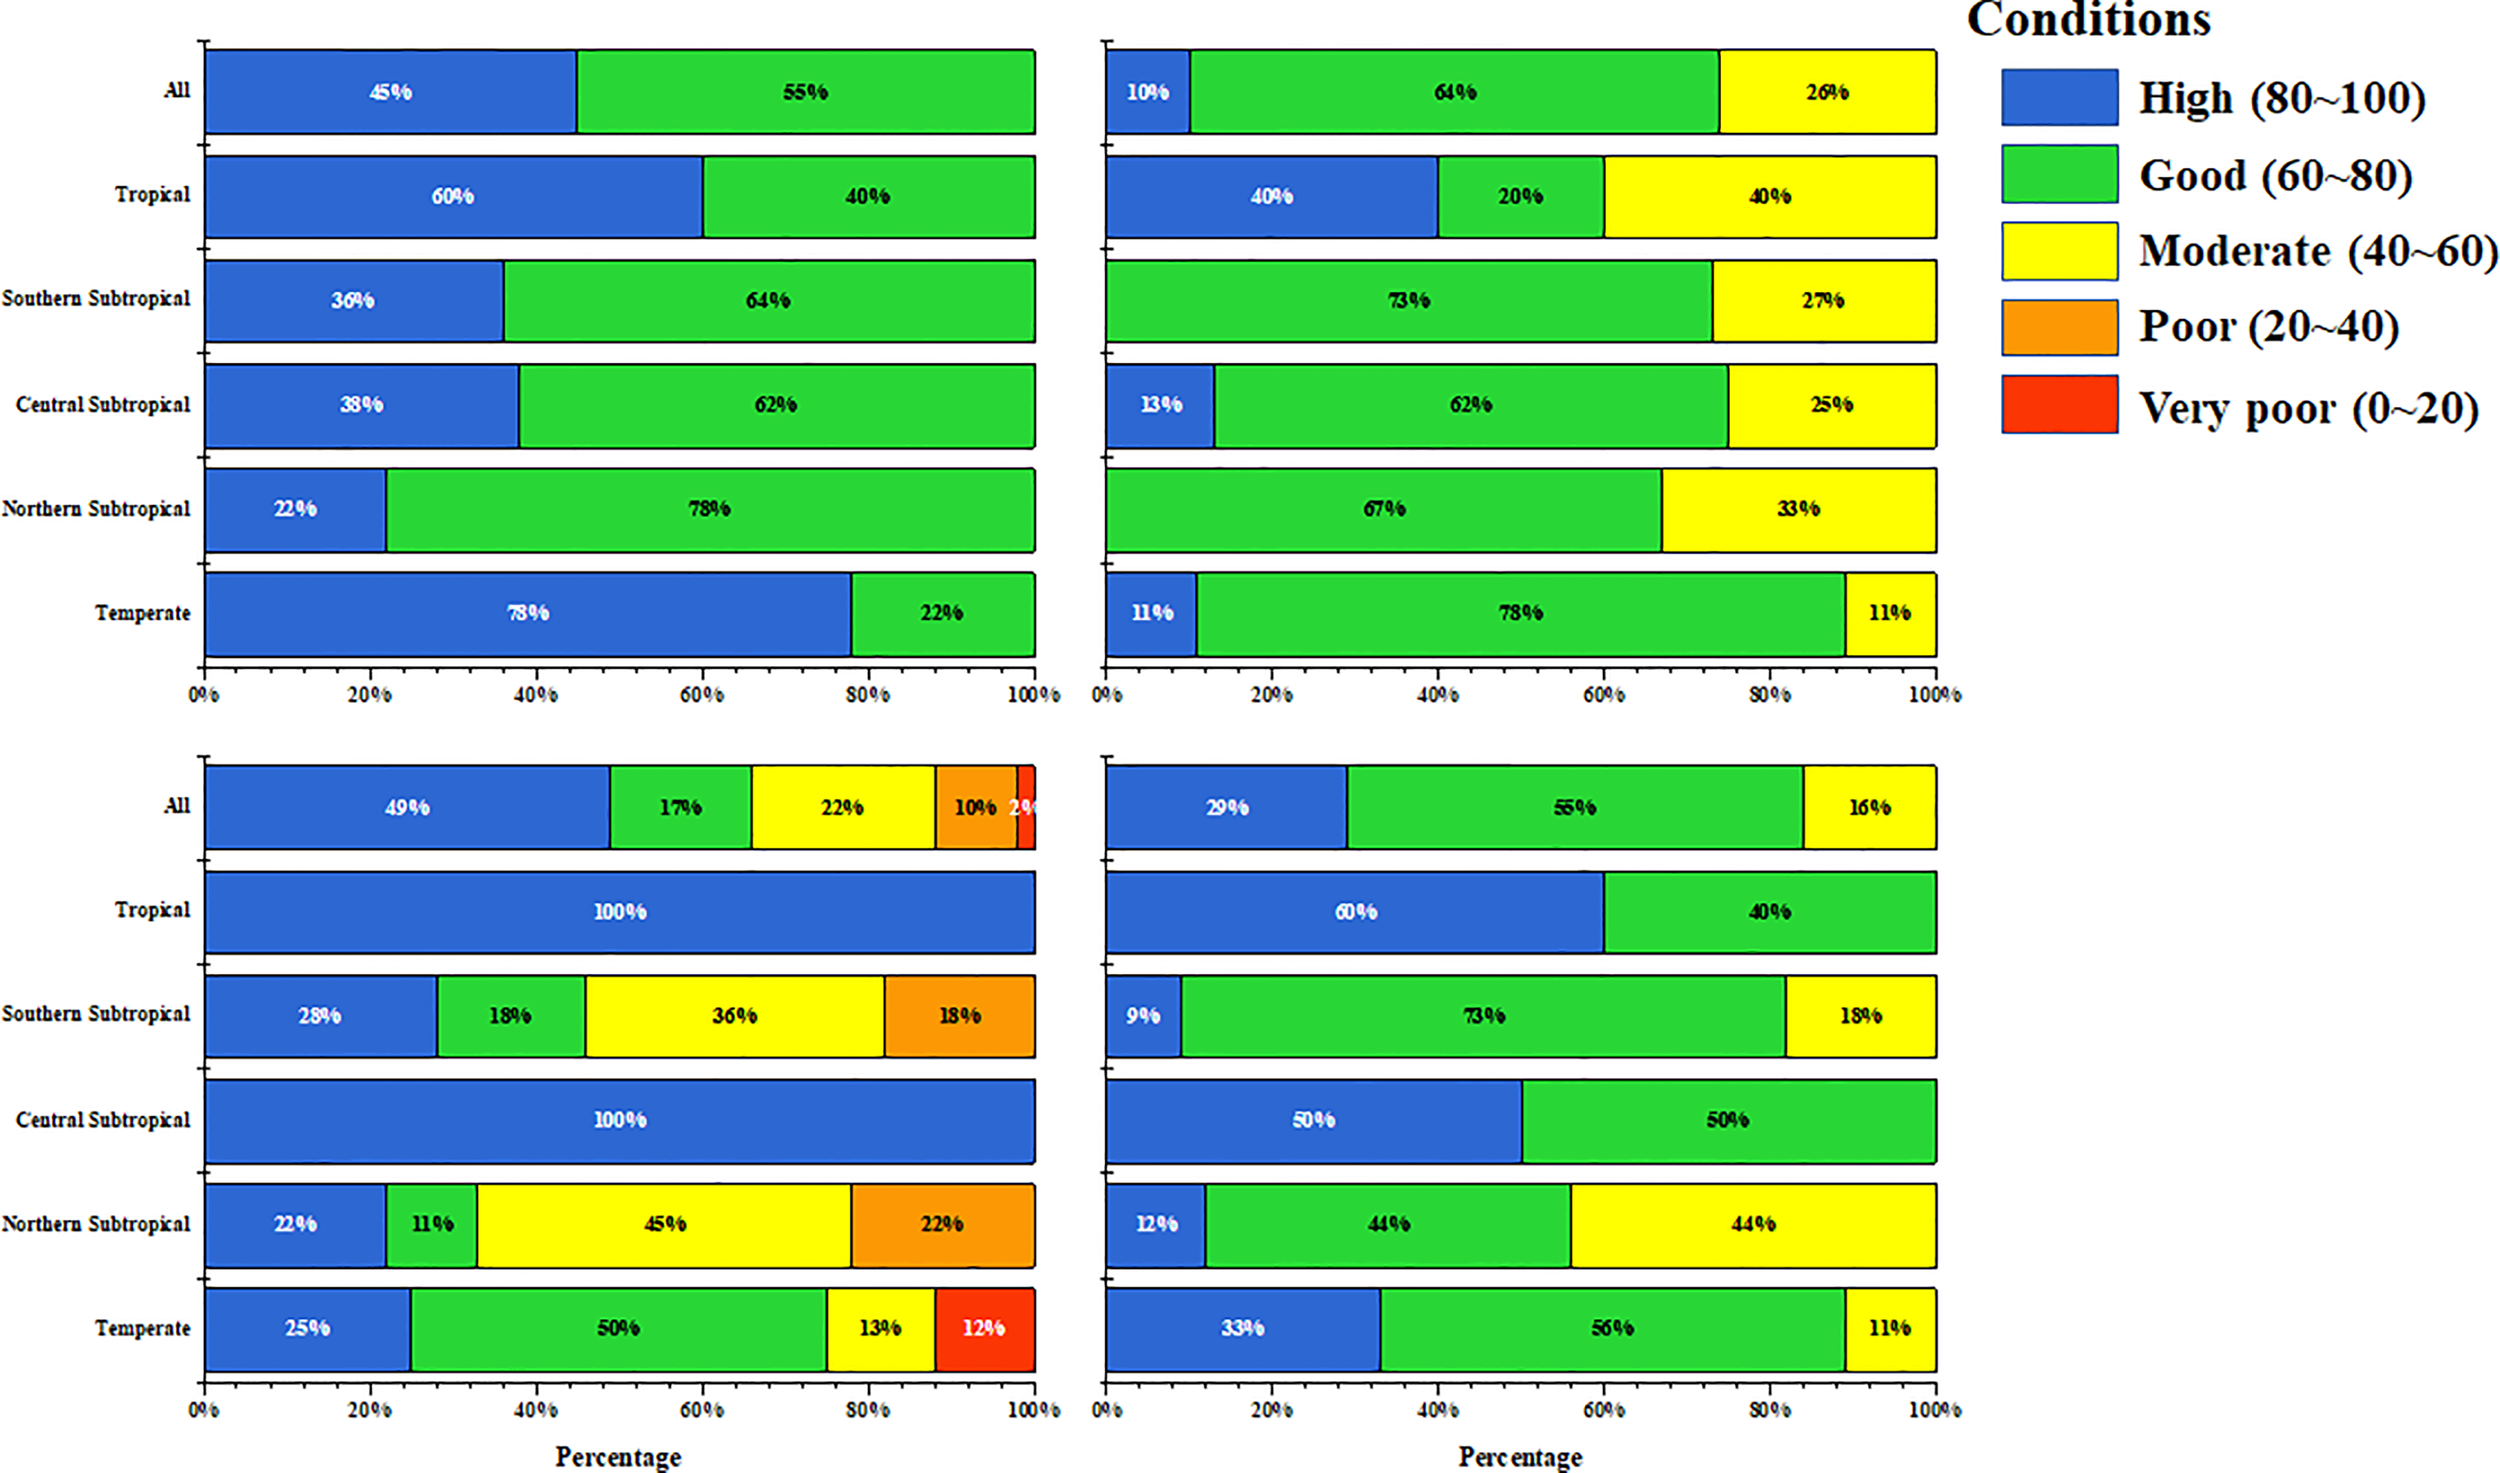
Integrated assessment results of island ecosystem (a:Ienv, b:Ibio, c:Iland, d:CIland).
Figure 4
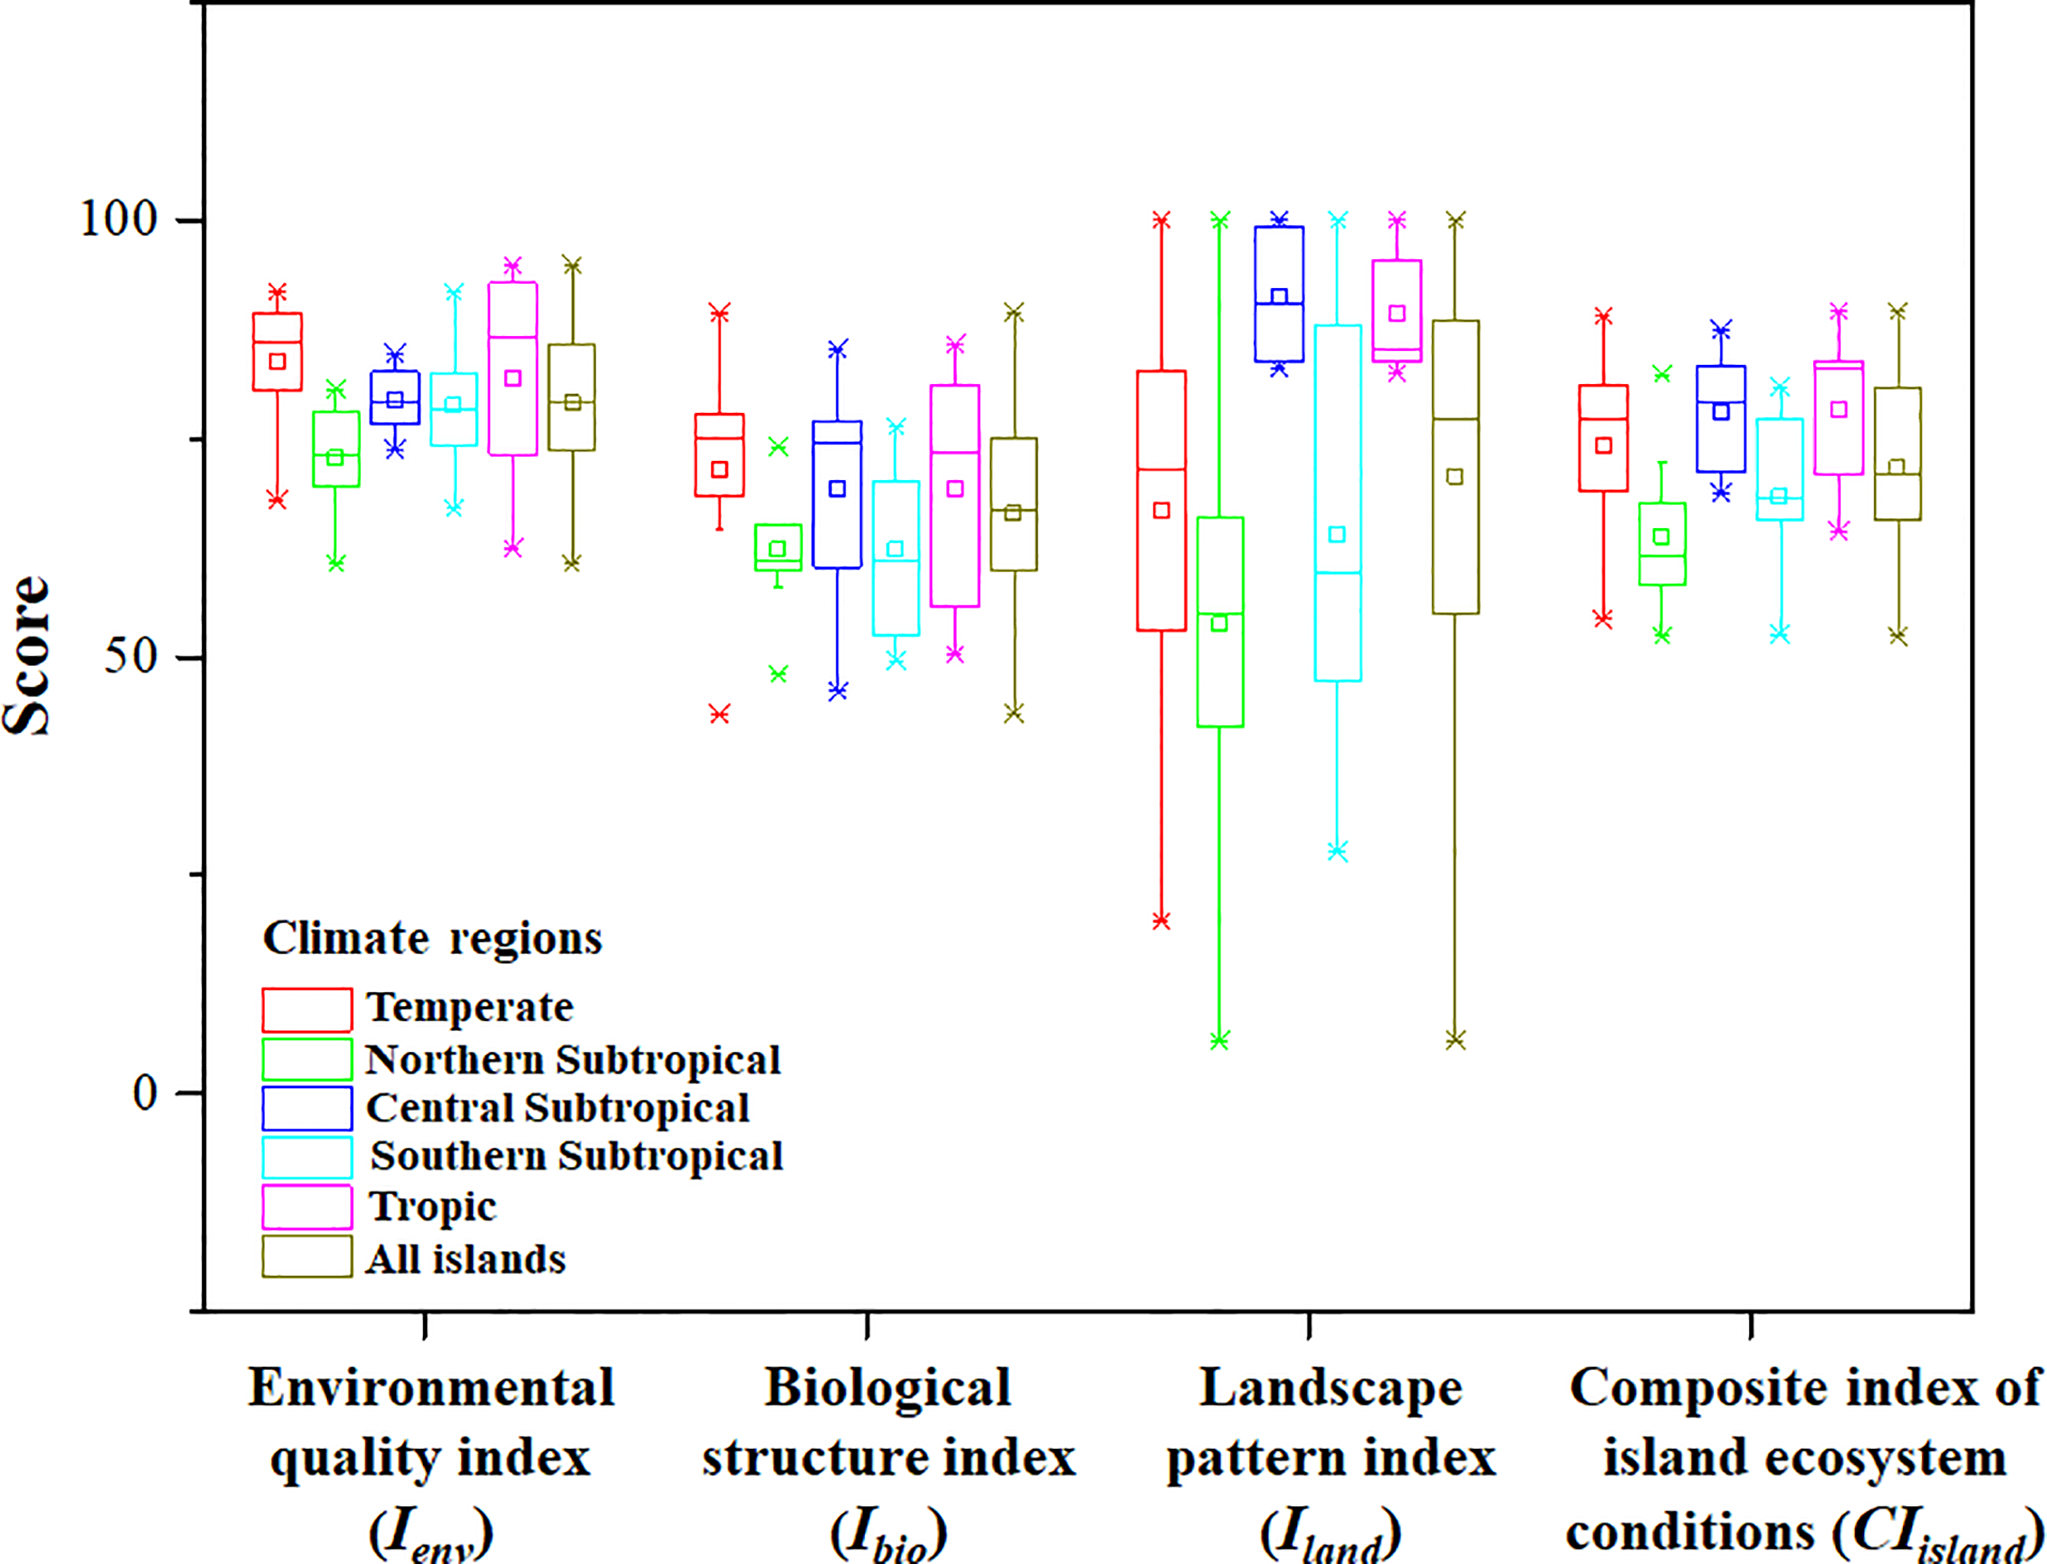
Integrated assessment results of island ecosystem.
Discussion
Overall Condition and Primary Challenges of Chinese Island Ecosystems
Our results showed that approximately 85.4% of the islands investigated were under the “high” and/or “good” condition, indicating that the overall condition of all selected islands was good. Spatially, the condition of subtropical islands was the lowest overall (Figure 5). Therefore, some challenges remain with respect to certain island ecosystem components for some islands.
Figure 5
The overall condition of island ecosystem in China mainland.
For environmental quality, the main threats were nutrient pollution in seawater and petroleum and marine organism (shellfish) metal contamination. Regarding the different climate regions, the seawater quality condition of subtropical islands was the lowest overall, particularly those in the northern region, being one of China’s most densely developed areas (i.e., Yangtze River Delta economic region). Moreover, the seawater quality of coastal island systems was generally lower than that of offshore island systems. Marine organism contamination was severe, particularly regarding petroleum-based and Zn and Pb pollution. This indicates that more effort should be paid to reducing and controlling nutrient, petroleum, and heavy metal pollution to improve conditions of island environmental quality.
For biological structure, the degradation range of most islands varied in biological community structure, covering terrestrial, intertidal, and subtidal sub-ecosystems. It is important to note that biological structure conditions were largely dependent on both natural baselines and levels of anthropogenic disturbance. Under a natural context, biological community baselines differed significantly with respect to island climate conditions, area, substratum lithology, etc. For example, a general trend was observed in subtidal macrobenthos species richness in a northward to southward direction (Supplementary Table 2), and similar trends were observed for intertidal macrobenthos as well as subtidal phytoplankton, zooplankton, and nekton species richness. However, no spatial trend was observed in the abundance and density of these communities. Analogously, island vegetation coverage was selected as the single indicator of terrestrial biological structure respective to data availability. This study found that: i) island vegetation coverage was higher in tropical and temperate islands and comparatively higher in subtropical islands; ii) higher vegetation coverage was observed in islands covered in bedrock, while comparatively lower in islands comprised of sediment and corals; iii) uninhabited islands had higher overall vegetation coverage than inhabited islands, which was particularly the case for islands with lower vegetation cover which were developed for agriculture and industry usage. The primary threat to island vegetation coverage was from intensive urban and industrial development, which was common in most inhabited islands, resulting in island vegetation destruction. It is therefore recommended that in situ conservation efforts should be strengthened to protect endemic and endangered island species from eradication resulting from invasive species and anthropogenic development.
Landscape patterns were directly indicative of the degree of destruction of natural landscapes, and low vegetation coverage of natural landscapes was typically observed in highly developed islands, such as Nanchangshan Island, Chongming Island, Xiamen Island, and Zini Island. Thus, more effort should be prioritized to ecological restoration to restore the natural habitats and landscapes of these island ecosystems.
Differences Among Different Island Types
Conditions varied across different island ecosystems. Regarding climate, the overall condition of subtropical islands was lower than temperate and tropical islands, indicating that rapid and intensive coastal economic development in subtropical zones affected island ecosystem conditions. Regarding island substratum lithologies, continental island conditions were significantly better than alluvial islands, whether being environmental quality, biological structure, or landscape patterns. Conditions of small-sized islands (with an island area <5 km2) were better than larger islands (with an island area >5 km2), which was particularly the case regarding environmental quality and landscape pattern. Conditions of uninhabited islands were better than inhabited islands, being associated with island area, given that large islands are typically inhabited.
Key Factors Contributing to Ecosystem Conditions
Islands are often geographically remote, connected directly and/or indirectly to the mainland, relatively small, and vary in geological, ecological, economic, human, cultural, and topographical settings. It needs emphasized that islands are complicated ecological-social-economical systems, and island condition is influenced by both natural and anthropogenic factors. Our study indicated that area, population, GDP, and distance to the mainland were significantly correlated to Ibio, Iland, and CIisland (Table 8). Results also indicated that anthropogenic development impacts were manifest. Ibio was negatively correlated to population density, GDP, and GDP density. This indicated that along with anthropogenic impacts, the impact of natural factors was associated with distance to the mainland, reflective of a negative correlation. This is because certain offshore islands are covered by rocks instead of vegetation, such as Wuzhishan Island. Iland negatively correlated to area size, population, population density, and distance to the mainland, indicating that larger island areas, populations, and closer proximity to the mainland are associated with intensive development, resulting in the destruction of natural landscapes. However, results also showed that parameters were not significantly related to; Ienv thus, it was assumed that large-scale islands were mostly influenced by environmental quality. For example, the “very poor” environment quality of both Chongming Island and Dajinshan Island was largely dependent on the Yangtze Estuary, the region in which China’s most severe water-based nutrient pollution occurs.
Limitations and Challenges
This study aimed to develop an applicable framework to comprehensively assess island ecosystems at a national scale, which was largely dependent on data availability. Since the 908 Project has mostly focused on marine aquatic ecosystems, only limited data are available on terrestrial island area. On this account, due to the limited number of terrestrial indicators used in this study, results can be considered slightly biased, particularly concerning environmental quality. This study also highlighted the importance of island soil and freshwater quality. Accordingly, results from this study showed that terrestrial island monitoring should be strengthened respective to national scale monitoring and investigations, particularly regarding island soil and freshwater environments as well as island-specific animal and endemic species. With the rapid development of remote sensing and big data processing technology, there is great potential for the large-scale assessment of island ecosystems in a comprehensive way, particularly along with the impact of climate change and land-use modification, the status of land-sea ecological connectivity and integrity.
Conclusions
Although China has many island systems, knowledge related to their overall ecological condition is limited on a national scale. Accordingly, this study developed a national scale quantitative assessment framework for island ecosystem conditions, including environmental quality, biological structure, and landscape patterns. Results from the 42 typical, representative island ecosystems indicated that the overall condition of Chinese islands was good, where the condition of approximately 85.4% of all selected islands scored either “high” or “good”. The primary challenges mainly included nutrient pollution in seawater environments, petroleum and metal contamination in marine organisms, and vegetation destruction and a reduction in marine biodiversity in intertidal and subtidal zones. Island ecosystem conditions are influenced by both natural and anthropogenic factors, while area size, population, GDP, and distance to the mainland significantly correlated to Ibio, Iland, and CIisland. This proposed framework provides a practical tool to use for island ecosystem condition assessments, which can be widely applied at different scales. However, certain factors require further investigation, such as island soil and freshwater environments as well as animal and endemic species. Additionally, the monitoring of these parameters should be strengthened in future investigations at a national scale. Our study can enrich and extend the methodologies used in island assessments, while offering an effective and versatile tool for which to better instruct island sustainable management practices.
Funding
This research was supported by the National Natural Science Foundation of China (42076163); Offshore Marine Investigation and Assessment Project; Asian Cooperation Fund Project-Marine Protected Areas Network in China-ASEAN Countries.
Publisher’s Note
All claims expressed in this article are solely those of the authors and do not necessarily represent those of their affiliated organizations, or those of the publisher, the editors and the reviewers. Any product that may be evaluated in this article, or claim that may be made by its manufacturer, is not guaranteed or endorsed by the publisher.
Statements
Data availability statement
The original contributions presented in the study are included in the article/Supplementary Material. Further inquiries can be directed to the corresponding authors.
Author contributions
BC contributed to the study’s conception. ZM and WY contributed to the article writing. WZ, FG, and DZ performed the data analyze and figures drawing. WH, JL, and HH (9th Author) performed the indicator selection. YS and HH (11th Author) performed the data collection. All authors contributed to the article and approved the submitted version.
Acknowledgments
Authors acknowledge all those who contributed to the article. Special thanks to Xinmei Yang, Pifu Cong, and Bin Liang from National Marine Environmental Monitoring Center; Jianqiang Yang, Wei Tang, and Bei Zhao from North China Sea Bureau, Ministry of Natural Resources; Xiaodong Zhu, Yangfan Li, Xiang Sun, and Xiao Yang from Nanjing University; Shengyun Yang, Xiaoming Zhu, Mingru Chen, Jiamei Xiao, and Lu Yang from Xiamen University; Xiaoping Huang, Zhijian Jiang, and Liangmin Huang from Institute of South China Sea, Chinese Academy of Sciences.
Conflict of interest
The authors declare that the research was conducted in the absence of any commercial or financial relationships that could be construed as a potential conflict of interest.
Supplementary material
The Supplementary Material for this article can be found online at: https://www.frontiersin.org/articles/10.3389/fmars.2022.920069/full#supplementary-material
References
1
Balzan M. V. Potschin-Young M. Haines-Young R. (2018). Island Ecosystem Services: Insights From a Literature Review on Case-Study Island Ecosystem Services and Future Prospects. Int. J. Biodivers. Sci. Ecosyst. Serv. Manage.14, 71–90. doi: 10.1080/21513732.2018.1439103
2
Brodie G. Pikacha P. Tuiwawa M. (2013). Biodiversity and Conservation in the Pacific Islands: Why Are We Not Succeeding? Conserv. Biol.: Voice. Trop. Chapter 21, 181–187. doi: 10.1002/9781118679838.ch21
3
Cao W. Li R. Chi X. Chen N. Chen J. Zhang H. et al . (2017). Island Urbanization and its Ecological Consequences: A Case Study in the Zhoushan Island, East China. Ecol. Indic.76, 1–14. doi: 10.1016/j.ecolind.2017.01.001
4
Chen J. (2016). Fujian Nearshore Comprehensive Investigation and Assessment Report (Beijing: Ocean Press).
5
Chi Y. Liu D. Xing W. Wang J. (2021). Island Ecosystem Health in the Context of Human Activities With Different Types and Intensities. J. Clean. Prod.281, 125334. doi: 10.1016/j.jclepro.2020.125334
6
Hebei Oceanic Administration (2013). Hebei Offshore Marine Investigation and Assessment Report (Beijing: Ocean Press).
7
Hou Y. Ma D. (2014). Shandong Offshore Marine Investigation and Assessment Report (Beijing: Ocean Press).
8
Huang L. Sheng P. Liu C. Tan Y. (2017). Guangdong Offshore Marine Investigation and Assessment Report (Beijing: Ocean Press).
9
Leclerc C. Courchamp F. Bellard C. (2020). Future Climate Change Vulnerability of Endemic Island Mammals. Nat. Commun.11, 1–9. doi: 10.1038/s41467-020-18740-x
10
Ma Z. Chen B. Yu W. (2017). Assessment of Island Ecosystem in China (Beijing: China Ocean Press).
11
Ministry of Natural Resources, PRC (2018) Island Survey Statistical Bulletin of 2017. Available at: http://www.mnr.gov.cn/gk/tzgg/201807/P020180907587895302182.pdf.
12
Offshore Marine Investigation and Assessment Project Office of Jiangsu (2012). Jiangsu Offshore Marine Investigation and Assessment Report (Beijing: Science Press).
13
Offshore Marine Investigation and Assessment Project Office of SOA (2005a). Technical Regulations for Aerial Remote Sensing Investigation of Islands and Coastal Zones (Beijing: Ocean Press).
14
Offshore Marine Investigation and Assessment Project Office of SOA (2005b). Technical Regulations for Island Investigation (Beijing: Ocean Press).
15
Offshore Marine Investigation and Assessment Project Office of SOA (2006a). Technical Regulations for Marine Biological and Ecological Investigation (Beijing: Ocean Press).
16
Offshore Marine Investigation and Assessment Project Office of SOA (2006b). Technical Regulations for Marine Chemical Investigation (Beijing: Ocean Press).
17
Reaser J. K. Meyerson L. A. Cronk Q. De Poorter M. A. J. Eldrege L. G. Green E. et al . (2007). Ecological and Socioeconomic Impacts of Invasive Alien Species in Island Ecosystems. Environ. Conserv.34, 98–111. doi: 10.1017/S0376892907003815
18
Shen G. Huang L. Guo F. Shi B . (2010). Marine Ecology (Beijing: Science Press).
19
Smit K. P. Bernard A. T. F. Lombard A. T. Sink K. J. (2021). Assessing Marine Ecosystem Condition: A Review to Support Indicator Choice and Framework Development. Ecol. Indic.2021, 121. doi: 10.1016/j.ecolind.2020.107148
20
Sun R. Wu Z. Chen B. Yang C. Qi D. Lan G. et al . (2020). Effects of Land-Use Change on Eco-Environmental Quality in Hainan Island, China. Ecol. Indic.109, 105777. doi: 10.1016/j.ecolind.2019.105777
21
Su M. Wall G. Jin M. (2016). Island Livelihoods: Tourism and Fishing at Long Islands, Shandong Province, China. Ocean. Coast. Manage.122, 20–29. doi: 10.1016/j.ocecoaman.2015.11.014
22
Tan F. Yang H. Xu X. Fang Z. Xu H. Shi Q. et al . (2020). Microplastic Pollution Around Remote Uninhabited Coral Reefs of Nansha Islands, South China Sea. Sci. Tot. Environ.725, 138383. doi: 10.1016/j.scitotenv.2020.138383
23
Veettil B. K. Van D. D. Quang N. X. (2020). Biodiversity and Nature Conservation in Island Ecosystems: Spatiotemporal Changes in Socotra Archipelago (Yemen). J. Coast. Conserv.24 (5), 54. doi: 10.1007/s11852-020-00774-4
24
Weigelt P. Jetz W. Kreft H. (2013). Bioclimatic and Physical Characterization of the World's Islands. PNAS. 110 (38), 15307–15312. doi: 10.1073/pnas.1306309110
25
Xie Z. Li X. Chi Y. Jiang D. Zhang Y. Ma Y. et al . (2021). Ecosystem Service Value Decreases More Rapidly Under the Dual Pressures of Land Use Change and Ecological Vulnerability: A Case Study in Zhujiajian Island. Ocean. Coast Manage.201, 105493. doi: 10.1016/j.ocecoaman.2020.105493
26
Xu Y. Lin S. He J. Xin Y. Zhang L. Jiang H. et al . (2017). Tropical Birds are Declining in the Hainan Island of China. Biol. Conserv.210, 9–18. doi: 10.1016/j.biocon.2016.05.029
27
Xu R. Ye S. Jiang X. Wang J. Cheng X. Liu Z. (2013). Shanghai Nearshore Comprehensive Investigation and Assessment Report (Beijing: Science Press).
28
Yang W. (2000). Chinese Islands (Beijing: Ocean Press).
29
Zhang H. Xiao Y. Deng Y. (2021). Island Ecosystem Evaluation and Sustainable Development Strategies: A Case Study of the Zhoushan Archipelago. Glob. Ecol. Conserv.28, e01603. doi: 10.1016/j.gecco.2021.e01603
30
Zhan J. Zhang F. Chu X. Liu W. Zhang Y. (2019). Ecosystem Services Assessment Based on Emergy Accounting in Chongming Island, Eastern China. Ecol. Indic.105, 464–473. doi: 10.1016/j.ecolind.2018.04.015
31
Zhao B. Kreutur U. Li B. Ma Z. Chen J. Nakagoshi N. (2004). An Ecosystem Service Value Assessment of Land-Use Change on Chongming Island,China. Land. Use. Policy.21, 139–248. doi: 10.1016/j.landusepol.2003.10.003
Summary
Keywords
integrated assessment, ecosystem indicators, island ecosystem, island sustainable management, ecosystem condition
Citation
Ma Z, Yu W, Zhang W, Ge F, Chen B, Hu W, Zhang D, Liao J, Huang H, Sun Y and Huang H (2022) Conditions of Mainland China’s Island Ecosystems and Associated Influencing Factors: Integrated Assessment of 42 Typical Island Ecosystems. Front. Mar. Sci. 9:920069. doi: 10.3389/fmars.2022.920069
Received
14 April 2022
Accepted
13 May 2022
Published
13 June 2022
Volume
9 - 2022
Edited by
Meilin Wu, Chinese Academy of Sciences, China
Reviewed by
Chao Chen, Zhejiang Ocean University, China; Zhaohui Zhang, First Institute of Oceanography, China; Zeng Jiangning, Ministry of Natural Resources, China
Updates
Copyright
© 2022 Ma, Yu, Zhang, Ge, Chen, Hu, Zhang, Liao, Huang, Sun and Huang.
This is an open-access article distributed under the terms of the Creative Commons Attribution License (CC BY). The use, distribution or reproduction in other forums is permitted, provided the original author(s) and the copyright owner(s) are credited and that the original publication in this journal is cited, in accordance with accepted academic practice. No use, distribution or reproduction is permitted which does not comply with these terms.
*Correspondence: Weiwei Yu, yuweiwei@tio.org.cn; Bin Chen, chenbin@tio.org.cn
This article was submitted to Marine Pollution, a section of the journal Frontiers in Marine Science
Disclaimer
All claims expressed in this article are solely those of the authors and do not necessarily represent those of their affiliated organizations, or those of the publisher, the editors and the reviewers. Any product that may be evaluated in this article or claim that may be made by its manufacturer is not guaranteed or endorsed by the publisher.