Abstract
Over 200 species of reef fish around the world form spawning aggregations to reproduce at specific times and locations. The locations of many reef fish spawning aggregations in the Caribbean have been known and fished for decades. Red Hind (Epinephelus guttatus), a species of grouper important in Caribbean fisheries, migrate to form spawning aggregations which have historically experienced intense fishing pressure. The Red Hind Bank Marine Conservation District (MCD) was established in the United States Virgin Islands to protect a known Red Hind spawning aggregation site. The MCD was closed seasonally to fishing in 1990 and then permanently in 1999. Our goal was to evaluate the success of this marine conservation effort by assessing how the Red Hind population at the spawning aggregation responded to changing levels of protection. We documented Red Hind population demographics at the spawning aggregation site in the MCD during peak spawning events from 2018 to 2020. After 30 years of protection, the mean size of Red Hind at the spawning aggregation increased by >35% and the population sex ratio of females to males was less skewed compared to population characteristics at the spawning aggregation prior to protection. To evaluate stock status relative to management benchmarks, we used length-based stock assessment models that included in situ size distribution data spanning 1988 to 2020 to estimate population spawning potential ratio (SPR) over time. We found that the SPR of the Red Hind population at the spawning aggregation prior to protection was 0.32 (95% CI: 0.25, 0.39) and under seasonal protection, The SPR increased slightly to 0.35 (95% CI: 0.28, 0.42). Under permanent protection, The SPR increased to its highest value yet at 0.49 (95% CI: 0.42, 0.56), which is above the benchmark value considered sustainable for many fish species. Our work demonstrates demographic recovery of the protected Red Hind spawning population and highlights the value of using size distribution data to evaluate the response of data-limited reef fish populations to seasonal and permanent protection at spawning aggregation sites.
Introduction
Seasonal migrations for reproduction are important life history events across phyla which function to connect individuals distributed across broad geographic areas (Dingle and Drake, 2007). Globally, over 200 species of marine fishes, representing 44 families, reproduce by forming resident or transient spawning aggregations at specific times and locations (Sadovy De Mitcheson et al., 2008; Nemeth, 2009; Russell et al., 2014), with some species migrating tens to hundreds of kilometers to spawn (Colin, 1992; Bolden, 2000). This strategy works well from an evolutionary perspective but presents a bottleneck when that life history strategy is disrupted by exploitation (Sadovy De Mitcheson et al., 2008), habitat loss (Reed et al., 2007), or climate change (Asch and Erisman, 2018). The timing of spawning events is often driven by changing photoperiod and lunar cycle, making the formation of spawning aggregations a predictable event (Nemeth, 2009). Fish spawning aggregations are susceptible to intense fishing pressure due to their predictability and the hyperstability of catch rates (Sadovy De Mitcheson and Domeier, 2005; Sadovy De Mitcheson et al., 2008; Erisman et al., 2011).
The locations of many reef fish spawning aggregations in the Caribbean have been known and fished for decades (Beets and Friedlander, 1992; Sadovy De Mitcheson et al., 2008). Intense fishing pressure has led to the extirpation of some reef fish spawning aggregations, most notably of Nassau grouper (Epinephelus striatus), which led to its listing as Threatened under the United States Endangered Species Act (Erisman et al., 2013). In the United States Virgin Islands (USVI), when Nassau grouper spawning populations collapsed, Red Hind (Epinephelus guttatus), which shared some spawning aggregation sites with Nassau grouper, were intensively targeted instead (Beets and Friedlander, 1992). Red Hind, like many other serranids (groupers and sea basses) undergo seasonal migrations to form spawning aggregations to reproduce (Colin et al., 1987; Sadovy De Mitcheson et al., 1992; Zeller, 1998; Heyman et al., 2005; Nemeth, 2005; Lopez-Rivera and Sabat, 2009; Rowell et al., 2015). Red Hind are protogynous hermaphrodites (changing sex from female to male as they age), so they may be more vulnerable to size-selective fishing pressure that disproportionately removes the larger males (Heppell et al., 2006; Brooks et al., 2008). By the late 1980s, the Red Hind population near St. Thomas, USVI showed signs of decline with a decrease in mean fish size and an extremely skewed sex ratio (Beets and Friedlander, 1992). This decline has led to increasingly restrictive harvest guidelines.
Red Hind is an important species in commercial, recreational, and subsistence fisheries in the Caribbean, particularly in Puerto Rico and the USVI, where Red Hind have historically comprised the majority of finfish landings (Cummings et al., 1997). Over the last 30 years, fishery managers have implemented regulations to improve the declining Red Hind populations and to protect spawning aggregation sites. In 1990, the Red Hind Bank Marine Conservation District (MCD) was established to protect a fish spawning aggregation site south of St. Thomas, USVI by seasonally closing the area to fishing during the months of peak spawning activity (December through February). In 1999, the MCD was permanently closed to fishing. Several studies (Beets and Friedlander, 1992; Sadovy De Mitcheson et al., 1992; Beets and Friedlander, 1999; Nemeth, 2005; Nemeth et al., 2007) have surveyed the Red Hind population at the spawning aggregation in the MCD in the intervening years, but to date, no holistic analysis of the change in population status, compiled using all extant data, has been conducted.
In the most recent Red Hind stock assessment (SEDAR, 2014), the types of management benchmarks that could be set were constrained as there were limited data to perform a traditional stock assessment reliant on an estimate of the stock-recruitment relationship. Data-limited fisheries assessments often lack age, growth, and maturation data or abundance indices from which stock-recruitment relationships are derived, but size distribution data are easily collected and can be the only source of information for some stocks (Quinn and Deriso, 1999; Rudd et al., 2019). The population spawning potential ratio (SPR) can be used as a proxy for maximum sustainable yield when traditional population metrics are unavailable (Rudd and Thorson, 2018). The SPR describes the proportion of the reproductive population remaining in a fished population relative to its unfished state (Goodyear, 1993; Walters and Martell, 2004). The SPR can be used to evaluate population status and to set target benchmarks for fisheries management (Myers et al., 1994; Slipke et al., 2002; Ault et al., 2008; Brooks et al., 2010; Hordyk et al., 2015a; Prince et al., 2015; Stock et al., 2021), with harvest strategies that are expected to result in 40% unfished spawning stock biomass (SPR ≥ 0.4) considered risk adverse for many species (Clark, 1993; Clark, 2002; Mace, 1994; Rudd and Thorson, 2018). Length-based assessment methods provide a way to evaluate stock status of data-limited fisheries because SPR can be calculated using knowledge of basic life history ratios and size distribution data (Pauly and Morgan, 1987; Basson et al., 1988; Gulland and Rosenberg, 1992; Beverton and Holt, 2012; Hordyk et al., 2015a; Hordyk et al., 2015b). Other less data-intensive metrics used to evaluate population status or recovery at fish spawning aggregations are the change in population mean size, size distribution, and sex ratio (Coleman et al., 1996; Beets and Friedlander, 1999; Nemeth, 2005; Heppell et al., 2012; Nemeth et al., 2020; Waterhouse et al., 2020).
Our study (1) uses contemporary in situ size distribution and sex ratio data to document population demographics at the Red Hind spawning aggregation in the MCD during peak spawning events from 2018 to 2020, and (2) includes these data with historical size distribution data collected over the previous 30 years in length-based stock assessment models to track changes in the SPR of the Red Hind population under seasonal and then permanent spawning aggregation site protection. The results of our work highlight the value of using length-based methods to assess the response of Red Hind in the USVI to increasing levels of protection and the potential of this method to be applied for other data-limited reef fish populations.
Methods
Study Site
There are two known Red Hind spawning aggregation sites in the USVI, one located near St. Thomas, and one located near St. Croix. These two spawning aggregation sites are located 80 km apart and are separated by the Virgin Islands Trough (4,000 m deep) and likely serve two separate populations (Nemeth et al., 2007); this study focuses on the Red Hind population at the spawning aggregation in the Red Hind Bank Marine Conservation District (MCD; Figure 1). The MCD is located approximately 16 km south of St. Thomas and approximately 25 km southeast of Culebra, Puerto Rico. Red Hind that spawn at this location are known to have home reefs as far west as Culebra (Nemeth et al., 2007).
Figure 1
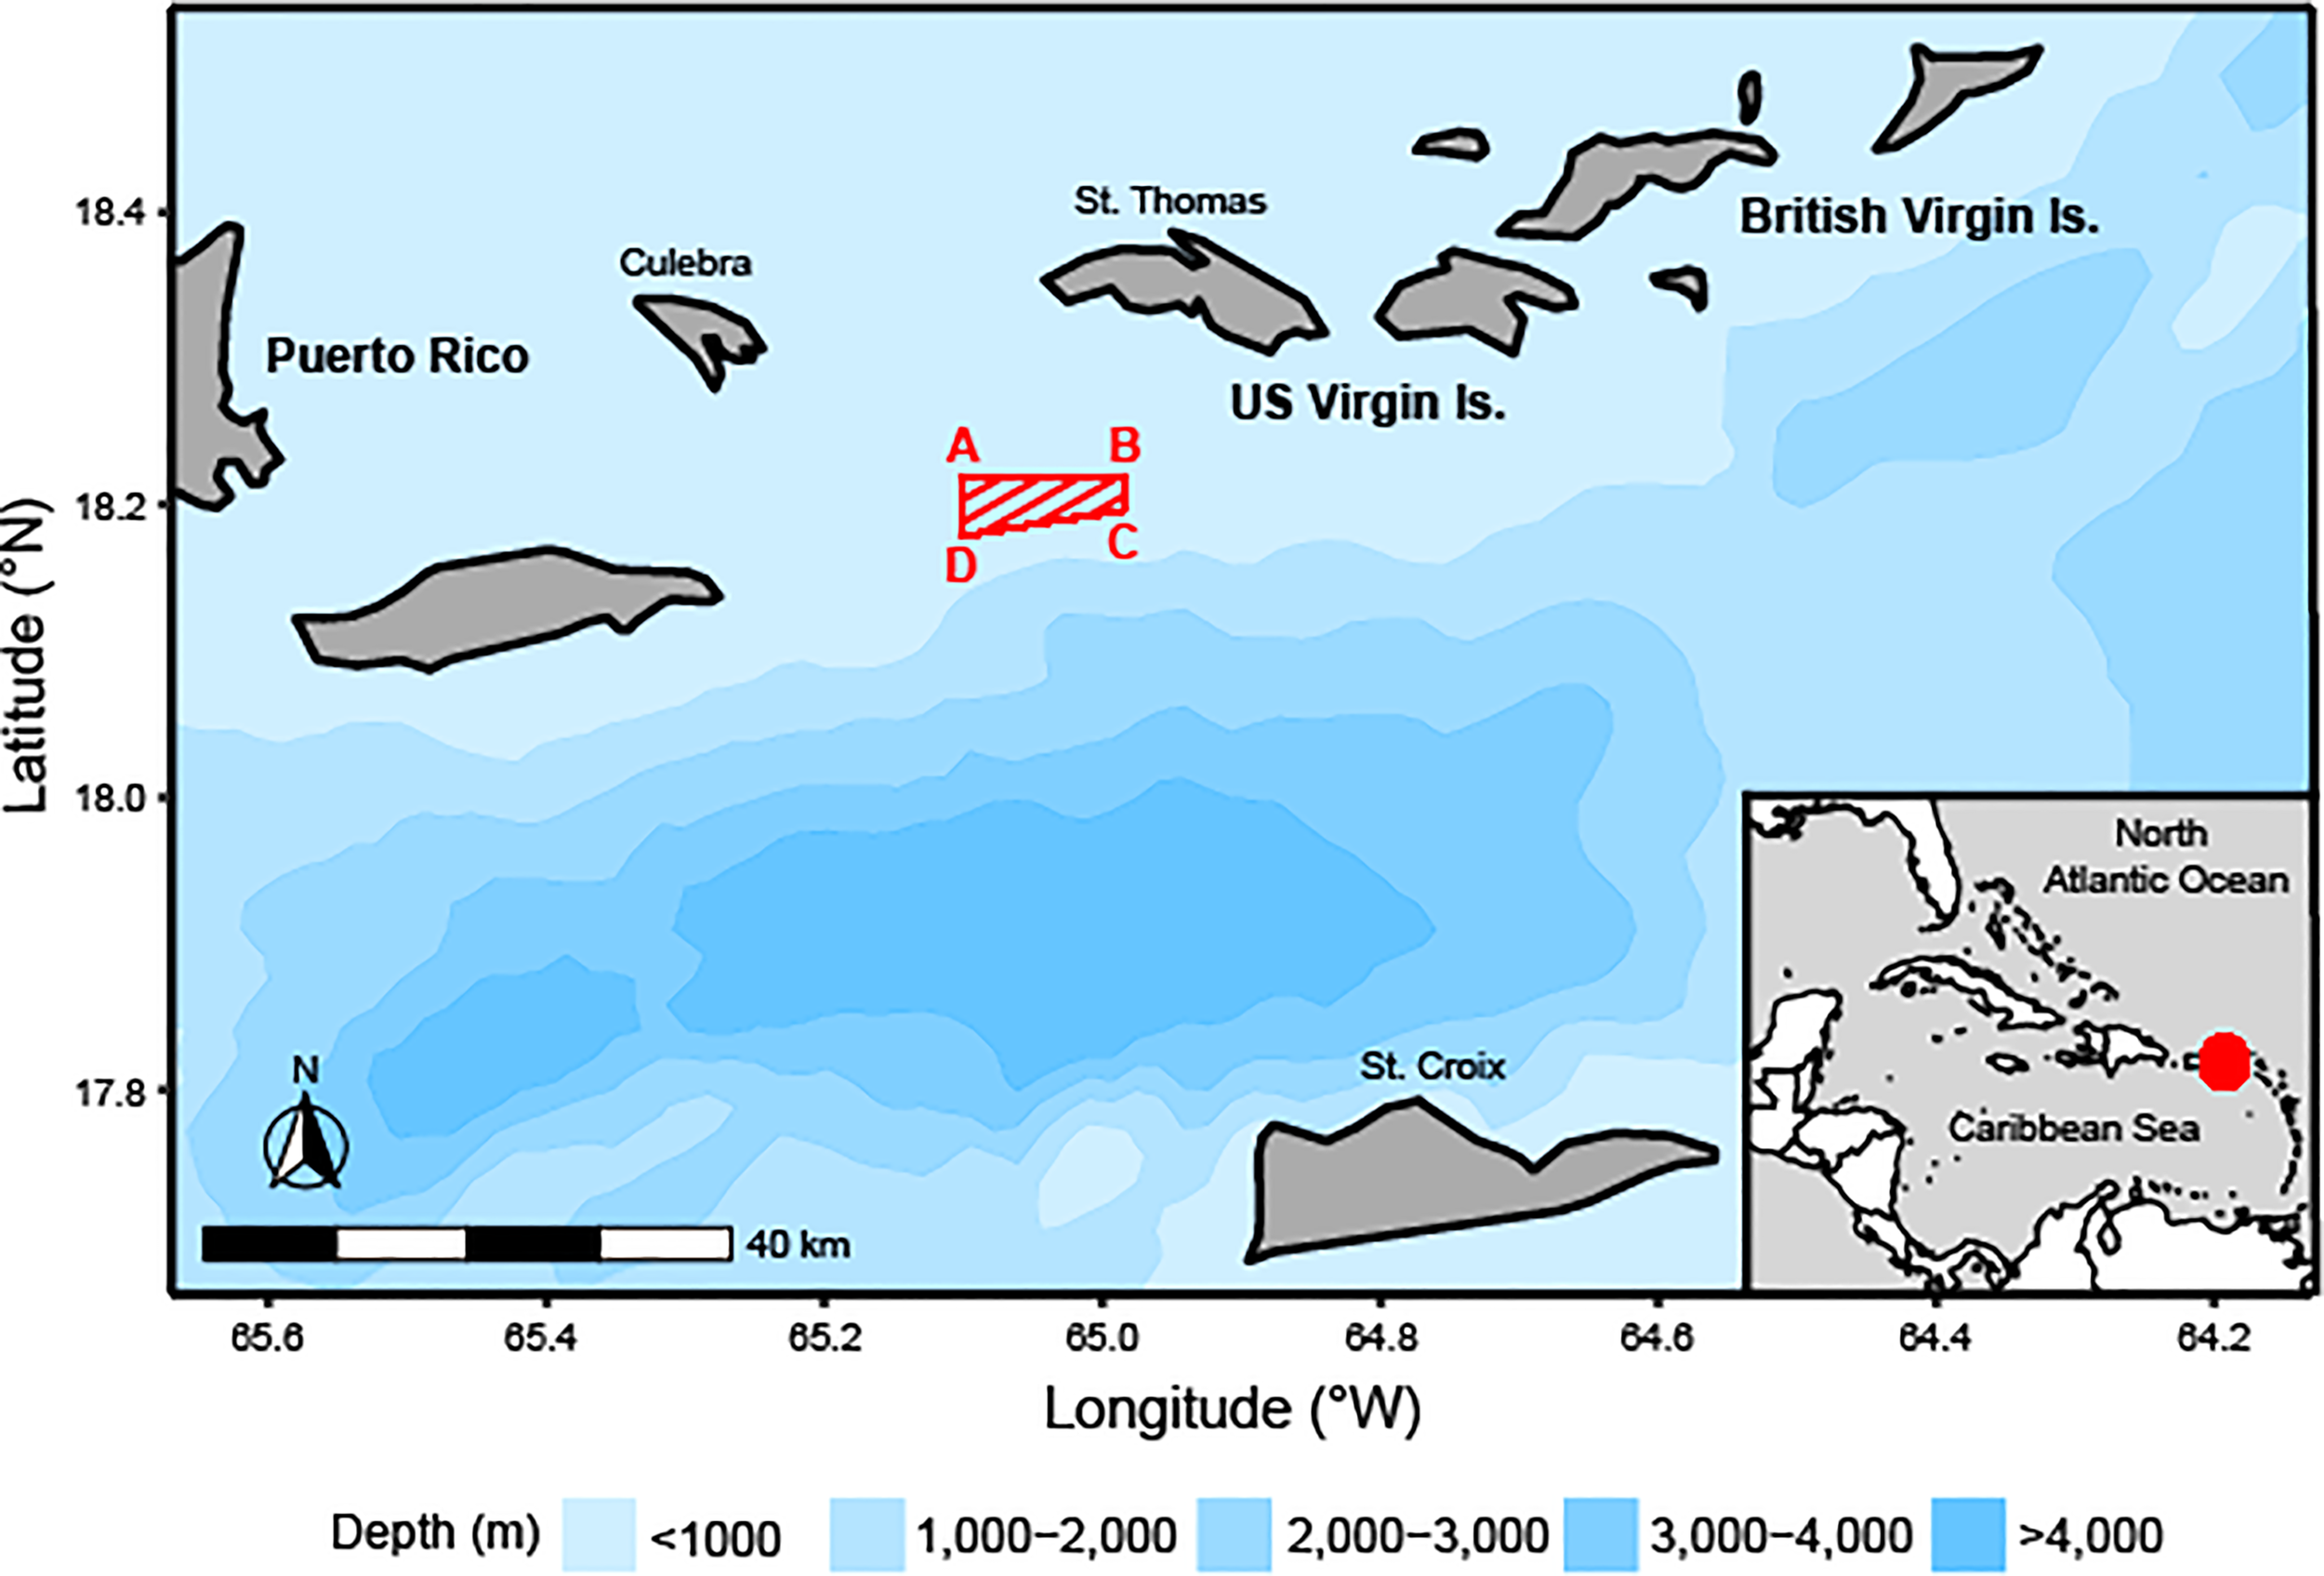
Map of the northeastern Caribbean, including Puerto Rico, US Virgin Islands (USVI), British Virgin Islands, and the Red Hind Bank Marine Conservation District (area as red-striped trapezoid, A = 18°13.2’ N, 65°06.0’ W; B = 18°13.2’ N, 64°59.0’ W; C = 18°11.8’ N, 64°59.0’ W; D = 18°10.7’ N, 65°06.0’ W; SEDAR, 2014) and ocean bathymetry, with an inset of the Wider Caribbean Region showing the study site location as a red point.
Population Demography
We sampled Red Hind at the spawning aggregation in the MCD to target peak spawning events in December 2018, January 2019, December 2019, and January 2020. With assistance from the USVI Division of Fish and Wildlife and local fishers, we captured Red Hind using baited hook and line, which is a sampling technique used in several studies to describe the size distribution and sex ratio within a spawning aggregation (Beets and Friedlander, 1992; Shapiro et al., 1993b; Beets and Friedlander, 1999; Nemeth, 2005; Luckhurst et al., 2006; Nemeth et al., 2006). All species caught were documented; non-target species were immediately recompressed at depth (ranging from 38.5 m to 48.5 m) using a commercially available descending device (SeaQualizer™), while Red Hind were retained briefly for data and sample collection and then released in a similar manner. Our work was completed with approval from the National Oceanic and Atmospheric Administration National Marine Fisheries Service Sustainable Fisheries Division and followed an approved protocol from the Institutional Animal Care and Use Committee at Oregon State University.
Size Distribution
We measured the total length (TL) of each Red Hind to the nearest millimeter and recorded the date, time, location, and depth at capture. To minimize the effects of barotrauma, this process was conducted as quickly as possible. Typically, fish were on deck less than two minutes.
Analyses of size distribution data were conducted using R version 4.0.3 (R Core Team, 2020). Alpha levels for all statistical tests were 0.05. Size distribution data for each sampling event were evaluated as to whether data met assumptions of parametric testing. Size distribution data were tested for normality with a Shapiro-Wilk test and were square transformed if p ≤ 0.05. To investigate how fish size varied between spawning events, we ran a one-way analysis of variance (ANOVA) test with fish size as the response variable and sampling event (December 2018, January 2019, December 2019, and January 2020) as the predictor variable and conducted a Tukey’s HSD post-hoc test for multiple comparisons. We calculated mean fish size (TL) of individuals for each spawning event. Data were pooled, and we calculated mean fish size (TL) of individuals over the 2018–2020 study period. Size distribution data of females and males over the 2018–2020 study period were evaluated as to whether data met assumptions of parametric testing. Data were tested for normality with a Shapiro-Wilk test and were square transformed if p ≤ 0.05. The size distribution of females was normal (Shapiro-Wilk test, p > 0.05), whereas the size distribution of males was left-skewed (Shapiro-Wilk test, p < 0.001); both distributions were transformed for statistical comparison. To investigate whether females were smaller than males (as expected for protogynous hermaphrodites), we ran a two-sample, one-sided t-test with fish size as the response variable and fish sex as the predictor variable.
Sex Ratio
For each Red Hind captured, we attempted to collect a blood sample to determine fish sex. If the seas were too rough or the fish had been on deck for too long, we refrained from taking a blood sample. We collected blood samples from the caudal vein using a heparinized syringe and samples were stored on ice until centrifuged to separate out the plasma. Plasma samples were then frozen until analysis. We determined sex based on relative hormone concentrations of estradiol and 11-ketotestosterone using commercially available enzyme-linked immunosorbent assays (ELISAs; Cayman Chemical Company, 2022). We randomly selected a subsample from all plasma samples available for analysis. Plasma samples were first tested for interference to evaluate the need for purification. Interference levels were determined to be sufficiently high (>20%) to warrant purification, so samples were extracted prior to measuring hormone levels. Estradiol and 11-ketotestosterone levels in blood plasma were measured following protocols from the manufacturer (Cayman Chemical Company, 2022). The ratio of estradiol to 11-ketotestosterone was used to determine fish sex (Heppell and Sullivan, 2000). The derived sex ratios (F:M) represent the ratio of female fish relative to one male.
Population Demographics Over Time
To evaluate how Red Hind population demographics have changed over time at the spawning aggregation, we compared population sex ratio, mean fish size (TL), mean size (TL) of females, and mean size (TL) of males from this study period (2018–2020) and historical studies conducted at the spawning aggregation site under increasing levels of protection (Table 1). Historical size distribution data were extracted from published manuscripts using a free online tool, WebPlotDigitizer (Rohatgi, 2021). For studies that included multiple years of size distribution data, all years were pooled to represent a study period. Size distribution data from each study period were evaluated as to whether data met assumptions of parametric testing. Size distribution data were tested for normality with a Shapiro-Wilk test and were square transformed if p ≤ 0.05. To investigate how fish size varied between study periods, we ran a one-way analysis of variance (ANOVA) test with fish size as the response variable and study period as the predictor variable and conducted a Tukey’s HSD post-hoc test for multiple comparisons.
Table 1
| Time period | Source | n (total sampled, females, males) | Capture method |
|---|---|---|---|
| Pre–1988 | No protections of fish spawning aggregation site | ||
| 1988–1989 | Beets and Friedlander (1992) | 495, 177, 8 | Baited traps, hook and line |
| 1990 | Seasonal protection of fish spawning aggregation site | ||
| 1997 | Beets and Friedlander (1999) | 395, 300*, 91 | Baited traps, hook and line |
| 1999 | Permanent protection of fish spawning aggregation site | ||
| 2001–2003 | Nemeth (2005); Nemeth et al. (2006); Nemeth et al. (2007) | 2499, 545, 193 | Diver surveys, baited traps, hook and line |
| 2006–2009 | R. S. Nemeth, unpublished data | 1398, 491, 850 | Diver surveys, baited traps |
| 2018–2020 | This study | 1203, 104, 115 | Hook and line |
Timeline of spawning aggregation site protections and size distribution data used to estimate population demographics and length-based spawning potential ratio over time.
Sample size (n) is reported for the total number of fish sampled, and the number of positively identified females and males in each study. *Authors included 36 individuals of unidentified sex that were not distinguished from females in their report.
Spawning Potential Ratio (SPR)
We used the length-based spawning potential ratio (LBSPR) method developed by Hordyk and colleagues (Hordyk et al., 2015a; Hordyk et al., 2015b) to estimate the SPR of the Red Hind population at the spawning aggregation site over time. The LBSPR method provides a way to evaluate stock status of data-limited fisheries because SPR can be calculated using knowledge of basic life history ratios and size distribution data (Hordyk et al., 2015a; Hordyk et al., 2015b). We fit LBSPR models to Red Hind size distribution data collected between 1988 and 2020 at the spawning aggregation in the MCD using the ‘LBSPR’ R package (Hordyk, 2019) and R version 4.0.3 (R Core Team, 2020). We included female-only size distribution data from historical datasets as well as our contemporary data to estimate the SPR before and after changes in spawning aggregation site protection (Table 1).
The LBSPR method assumes a population at equilibrium, that fish growth conforms to the von Bertalanffy equation, that there is a normal distribution of size-at-age, natural mortality rates are constant across age classes, growth rates are constant across cohorts, and that selectivity is asymptotic. While there is some potential for dome-shaped selectivity in fishery-dependent sampling of Red Hind landings in the USVI due to market demands for plate-sized individuals (SEDAR, 2014), the size distribution data we used to estimate SPR resulted from fishery-independent sampling at the spawning aggregation in the MCD with methods satisfying the assumption of asymptotic selectivity.
We used female-only size distribution data in our LBSPR models to avoid bias in size distribution associated with varying population sex ratio. The sex ratio (F:M) at the spawning aggregation varies widely based on the day of sampling relative to peak spawning (Shapiro et al., 1993a; Sadovy De Mitcheson et al., 1994; Beets and Friedlander, 1999; Nemeth, 2005; Whiteman et al., 2005; Nemeth et al., 2007). Since Red Hind transition from female to male with age, the larger individuals in the population are generally male. If the sex ratio is heavily skewed towards males in a given time period, but both females and males are included in LBSPR models, then during periods of extremely skewed sex ratio, SPR estimates may be biased because of the size distribution of a population with a relatively disproportionate number of larger individuals.
The life history parameter inputs to the LBSPR models included mean asymptotic size (L∞), variability of size-at-age (CVL), the ratio of natural mortality divided by von Bertalanffy growth coefficient (M/k), and the size at maturity schedule (Table 2). We included female-only size distribution data and a female-only maturity schedule (size at which 50%, L50, and 95%, L95, of females are mature) in the LBSPR models. The growth curve estimated for Red Hind is assumed to describe female growth (Sadovy De Mitcheson et al., 1992). Fishing mortality may differ for males and females (Sadovy De Mitcheson et al., 1994; Nemeth, 2005), but natural mortality was assumed to be the same. Life history parameters should be estimated from studies conducted in close spatial proximity to the population of interest (Prince et al., 2015), so we chose parameters calculated specifically for Red Hind at the spawning aggregation in the MCD.
Table 2
| Parameter | Value | Source | |
|---|---|---|---|
| L∞ | Mean asymptotic size (cm) | 60.10 | Sadovy De Mitcheson et al. (1992) |
| CVL | Variability of size-at-age | 0.10 | Assumed (Hordyk et al., 2015b) |
| M | Natural mortality (1/year) | 0.16 | Sadovy De Mitcheson and Figuerola (1992) |
| k | Growth coefficient (1/year) | 0.0705 | Sadovy De Mitcheson et al. (1992) |
| M/k | 2.27 | ||
| L50 | Size at 50% maturity (cm) | 21.50 | Sadovy De Mitcheson et al. (1994) |
| L95 | Size at 95% maturity (cm) | 27.50 | Sadovy De Mitcheson et al. (1994) |
| Bin width (cm) | 1 | ||
| Maximum size (cm) | 67 | ||
| Minimum size (cm) | 1 | ||
Biological parameters used to fit the length-based spawning potential ratio models.
The LBSPR method is particularity sensitive to the underestimation of L∞ because as the larger-sized individuals in a sample begin to approach L∞, estimates of SPR increase rapidly (Hordyk et al., 2015b). To better understand the influence of our selected parameters on model output, we conducted a sensitivity analysis of model-derived SPR to the values of L∞, M, and k in each study period: 1988–1989, 1997, 2001–2003, 2006–2009, and 2018–2020. We varied each parameter (L∞, M, and then k) by ± 10% while holding the other parameters constant.
Results
Population Demography
Size Distribution
We caught, measured, and released a total of 1,203 Red Hind at the spawning aggregation site in the MCD over the 2018–2020 study period. Mean size of fish over the entire study period was 40.6 ± 0.42 cm TL (min = 22.6 cm TL, max = 48.2 cm TL; Figure 2A). The number of fish sampled and mean fish size (TL) varied by sampling event (one-way ANOVA, df = 3, 1199, F = 12.80, p < 0.001; Table 3). There was no evidence that mean fish size (TL) differed between the two months sampled in the 2018–2019 spawning season (Tukey’s HSD, p > 0.05), but there was strong evidence that mean fish size (TL) differed between the two months sampled in the 2019–2020 spawning season and that mean fish size (TL) differed between both months in the 2019–2020 spawning season compared to both months in the 2018–2019 spawning season (Tukey’s HSD, p < 0.05). The size distribution was progressively dominated by males towards the upper end of the distribution (Figure 2B), as expected for protogynous hermaphrodites. Females (39.6 ± 0.76 cm TL, n = 104) were smaller than males (42.6 ± 0.52 cm TL, n = 115; two-sample t-test, t = -8.84, df = 217, one-sided p < 0.001).
Figure 2
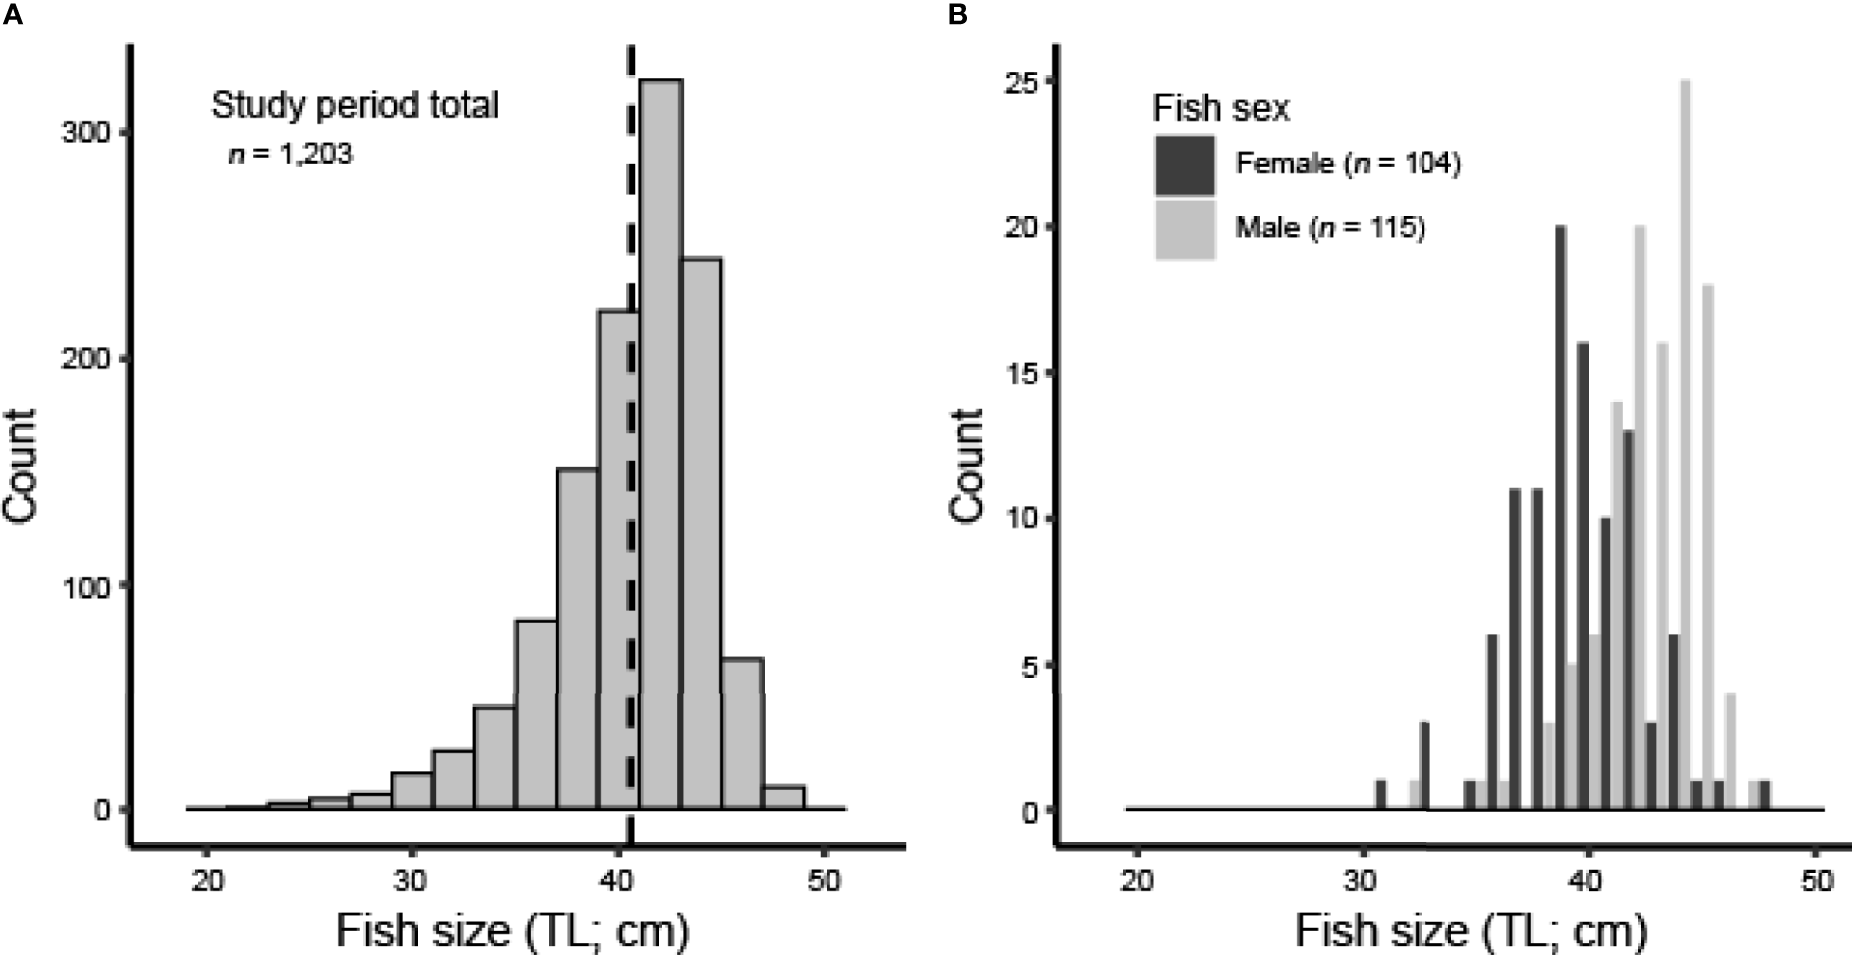
(A) Size distribution (TL; cm) of all Red Hind sampled at the spawning aggregation site from 2018 to 2020; dashed line represents mean TL (cm). (B) Size distribution (TL; cm) of all positively identified females (dark bars) and males (light bars), as determined by hormone analysis.
Table 3
| Sampling event | n | Mean fish size (TL; cm) ± SE |
|---|---|---|
| December 2018 | 348 | 40.9 ± 0.86 |
| January 2019 | 476 | 40.9 ± 0.55 |
| December 2019 | 64 | 38.1 ± 3.26 |
| January 2020 | 315 | 40.1 ± 0.73 |
| 2018–2020 study period | 1,203 | 40.6 ± 0.42 |
Sample size (n) and mean fish size (TL; cm) ± SE of Red Hind caught at the spawning aggregation site over the 2018–2020 study period.
Sex Ratio
Of the 1,203 Red Hind sampled at the spawning aggregation over the 2018–2020 study period, we determined the sex of 219 (18.2%). The ratio of females to males varied between sampling events. Sex ratio was skewed towards males in days leading up to the full moon, whereas the sex ratio was skewed towards females in days following the full moon (Table 4). The overall sex ratio for the study period was 0.90:1 (F:M), but comparison of the sex-specific size distributions with the size distribution of all individuals sampled at the spawning aggregation indicated that the sex ratio of the total sample was likely more skewed to females than reported here because the overall mean size (TL) was closer to that of the mean size (TL) of females than of males.
Table 4
| Date | Days to full moon | F | M | Ratio (F:M) |
|---|---|---|---|---|
| 12/19/2018 | -3 | 0 | 7 | |
| 12/20/2018 | -2 | 4 | 8 | 0.50:1 |
| 12/22/2018 | 0 | 4 | 14 | 0.29:1 |
| December 2018 total: | 8 | 29 | 0.28:1 | |
| 01/18/2019 | -3 | 7 | 17 | 0.41:1 |
| 01/19/2019 | -2 | 7 | 11 | 0.64:1 |
| 01/21/2019 | 0 | 17 | 14 | 1.21:1 |
| 01/22/2019 | +1 | 12 | 11 | 1.09:1 |
| January 2019 total: | 43 | 53 | 0.81:1 | |
| 12/15/2019 | +3 | 0 | 1 | |
| December 2019 total: | 0 | 1 | ||
| 01/16/2020 | +6 | 27 | 13 | 2.08:1 |
| 01/17/2020 | +7 | 26 | 19 | 1.37:1 |
| January 2020 total: | 53 | 32 | 1.66:1 | |
| 2018–2020 study period | 104 | 115 | 0.90:1 |
The number of and sex ratio of females to males in daily catches relative to days from the full moon, summarized by month and over the 2018–2020 study period.
Population Demographics Over Time
The mean size (TL) of fish at the spawning aggregation increased over time and with increased spawning aggregation site protections. The mean fish size (TL) 30 years after protection at the spawning aggregation site was 11.1 cm TL (37.6%) larger than the mean fish size reported from Red Hind landings data in 1988, prior to protection (Beets and Friedlander, 1992; Table 5). The cumulative size frequency distribution of female fish shifted to larger sizes over time (Figures 3A, B). There was strong evidence that the mean size (TL) of females differed between study periods (one-way ANOVA, df = 4, 1552, F = 68.34, p < 0.001), except for between 1997 and 2006 to 2009 (Tukey’s HSD, p > 0.05). The mean size (TL) of females from 2006 to 2009 may have decreased due to a number of females transitioning to males, thereby also causing a decrease in the mean size (TL) of males, with the overall mean size (TL) of fish at the spawning aggregation from 2006 to 2009 continuing to increase (Table 5). The decrease in mean size (TL) of females from 2006 to 2009 may have been due in part to the recruitment of smaller females to the population of spawners.
Table 5
| Study period | Source | Sex ratio (F:M) | Mean fish size (TL; cm) ± SE | Mean size of females (TL; cm) ± SE | Mean size of males (TL; cm) ± SE |
|---|---|---|---|---|---|
| 1988–1989 | Beets and Friedlander (1992) | 14.6:1 | 29.5* | 34.0* 33.2** ± 0.38** | 39.7* |
| 1997 | Beets and Friedlander (1999) | 2.9:1 | 36.6* | 35.3** ± 0.19** | 41.2* ± 0.48* |
| 2001–2003 | Nemeth (2005); Nemeth et al. (2006); Nemeth et al. (2007) | 2.8:1 | 38.0 ± 0.08 | 36.9 ± 0.14 | 42.0 ± 0.24 |
| 2006–2009 | R. S. Nemeth, unpublished data | 0.6:1 | 38.8 ± 0.11 | 35.5 ± 0.14 | 40.9 ± 0.09 |
| 2018–2020 | This study | 0.9:1 | 40.6 ± 0.42 | 39.6 ± 0.76 | 42.6 ± 0.52 |
Population sex ratio and mean fish size (TL; cm) ± SE of Red Hind at the spawning aggregation site for each study period and mean fish size (TL; cm) ± SE of positively identified females and males.
*As reported in source study. **calculated from published fish size distributions, otherwise calculated from raw data.
Figure 3
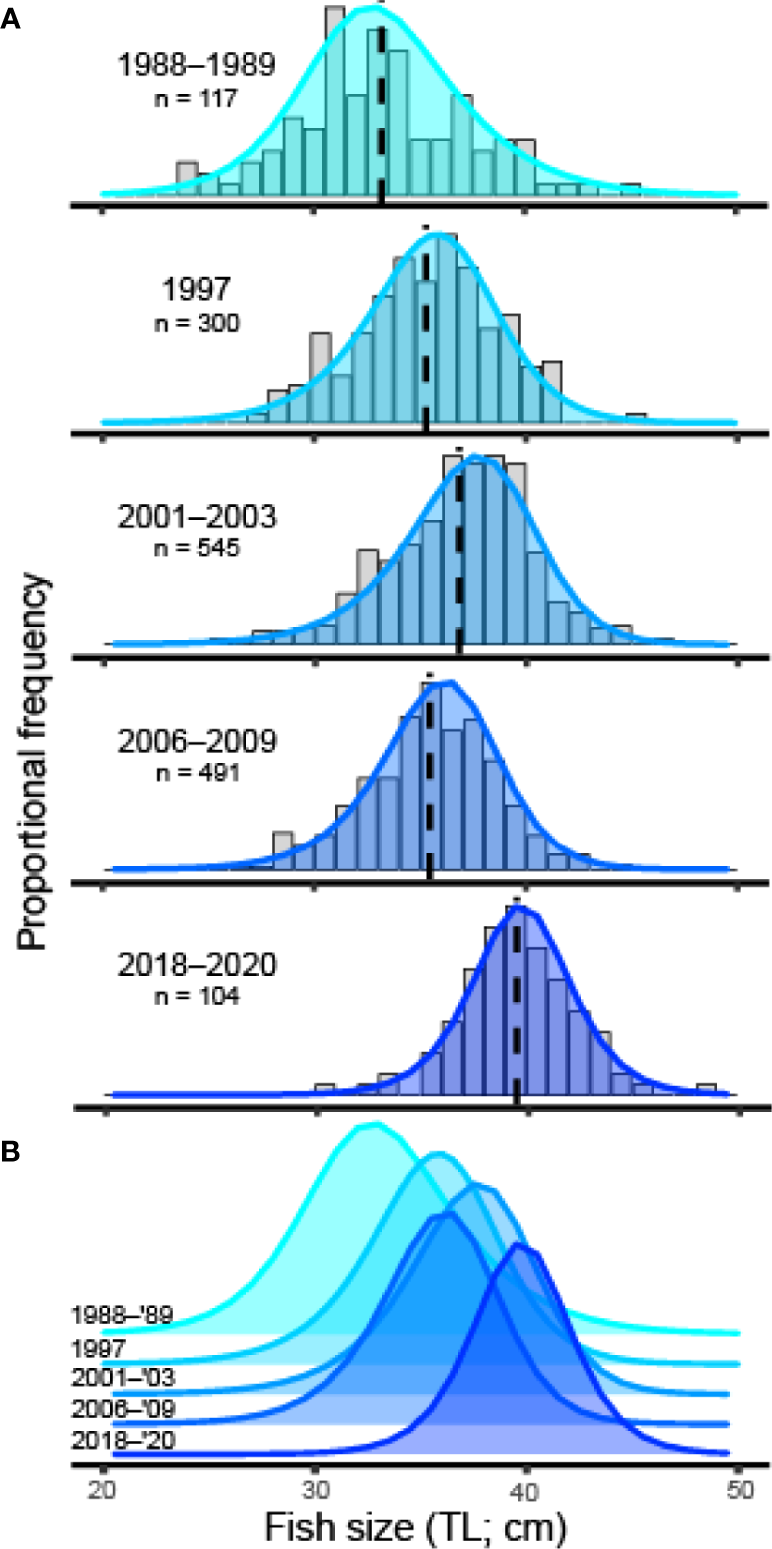
(A) Proportional frequency distribution of female fish size (TL; cm) overlayed with frequency distribution predictions used to calculate spawning potential ratio in length-based spawning potential ratio models for each study period: 1988–1989, 1997, 2001–2003, 2006–2009, and 2018–2020. Sample size (n) and mean size (TL; cm) of females (black, dashed line) are included for each study. (B) Overlapping frequency distribution predictions (same color-codes as in A) to highlight shift over time.
Spawning Potential Ratio (SPR)
Our length-based stock assessment models included size distributions of female fish in the following study periods: 1988–1989, 1997, 2001–2003, 2006–2009, and 2018–2020. In the late 1980s, before seasonal or permanent protection at the spawning aggregation, the SPR of the Red Hind population at the spawning aggregation in the MCD was 0.32 (95% CI: 0.25, 0.39; Figure 4). Pre-protection SPR was lower than the traditional target benchmark of SPR ≥ 0.40. In 1997, following seven years of seasonal protection, the SPR increased slightly to 0.35 (95% CI: 0.28, 0.42). Permanent protection of the spawning aggregation site was put into place in 1999. In the early 2000s, the SPR increased to 0.41 (95% CI: 0.35, 0.46), above the traditional target, but then from 2006 to 2009, decreased to 0.36 (95% CI: 0.31, 0.41), likely due to larger females transitioning to males and the recruitment of smaller females. After 20 years of continued permanent protection of the spawning aggregation site, the SPR increased to its highest level yet at 0.49 (95% CI: 0.42, 0.56).
Figure 4
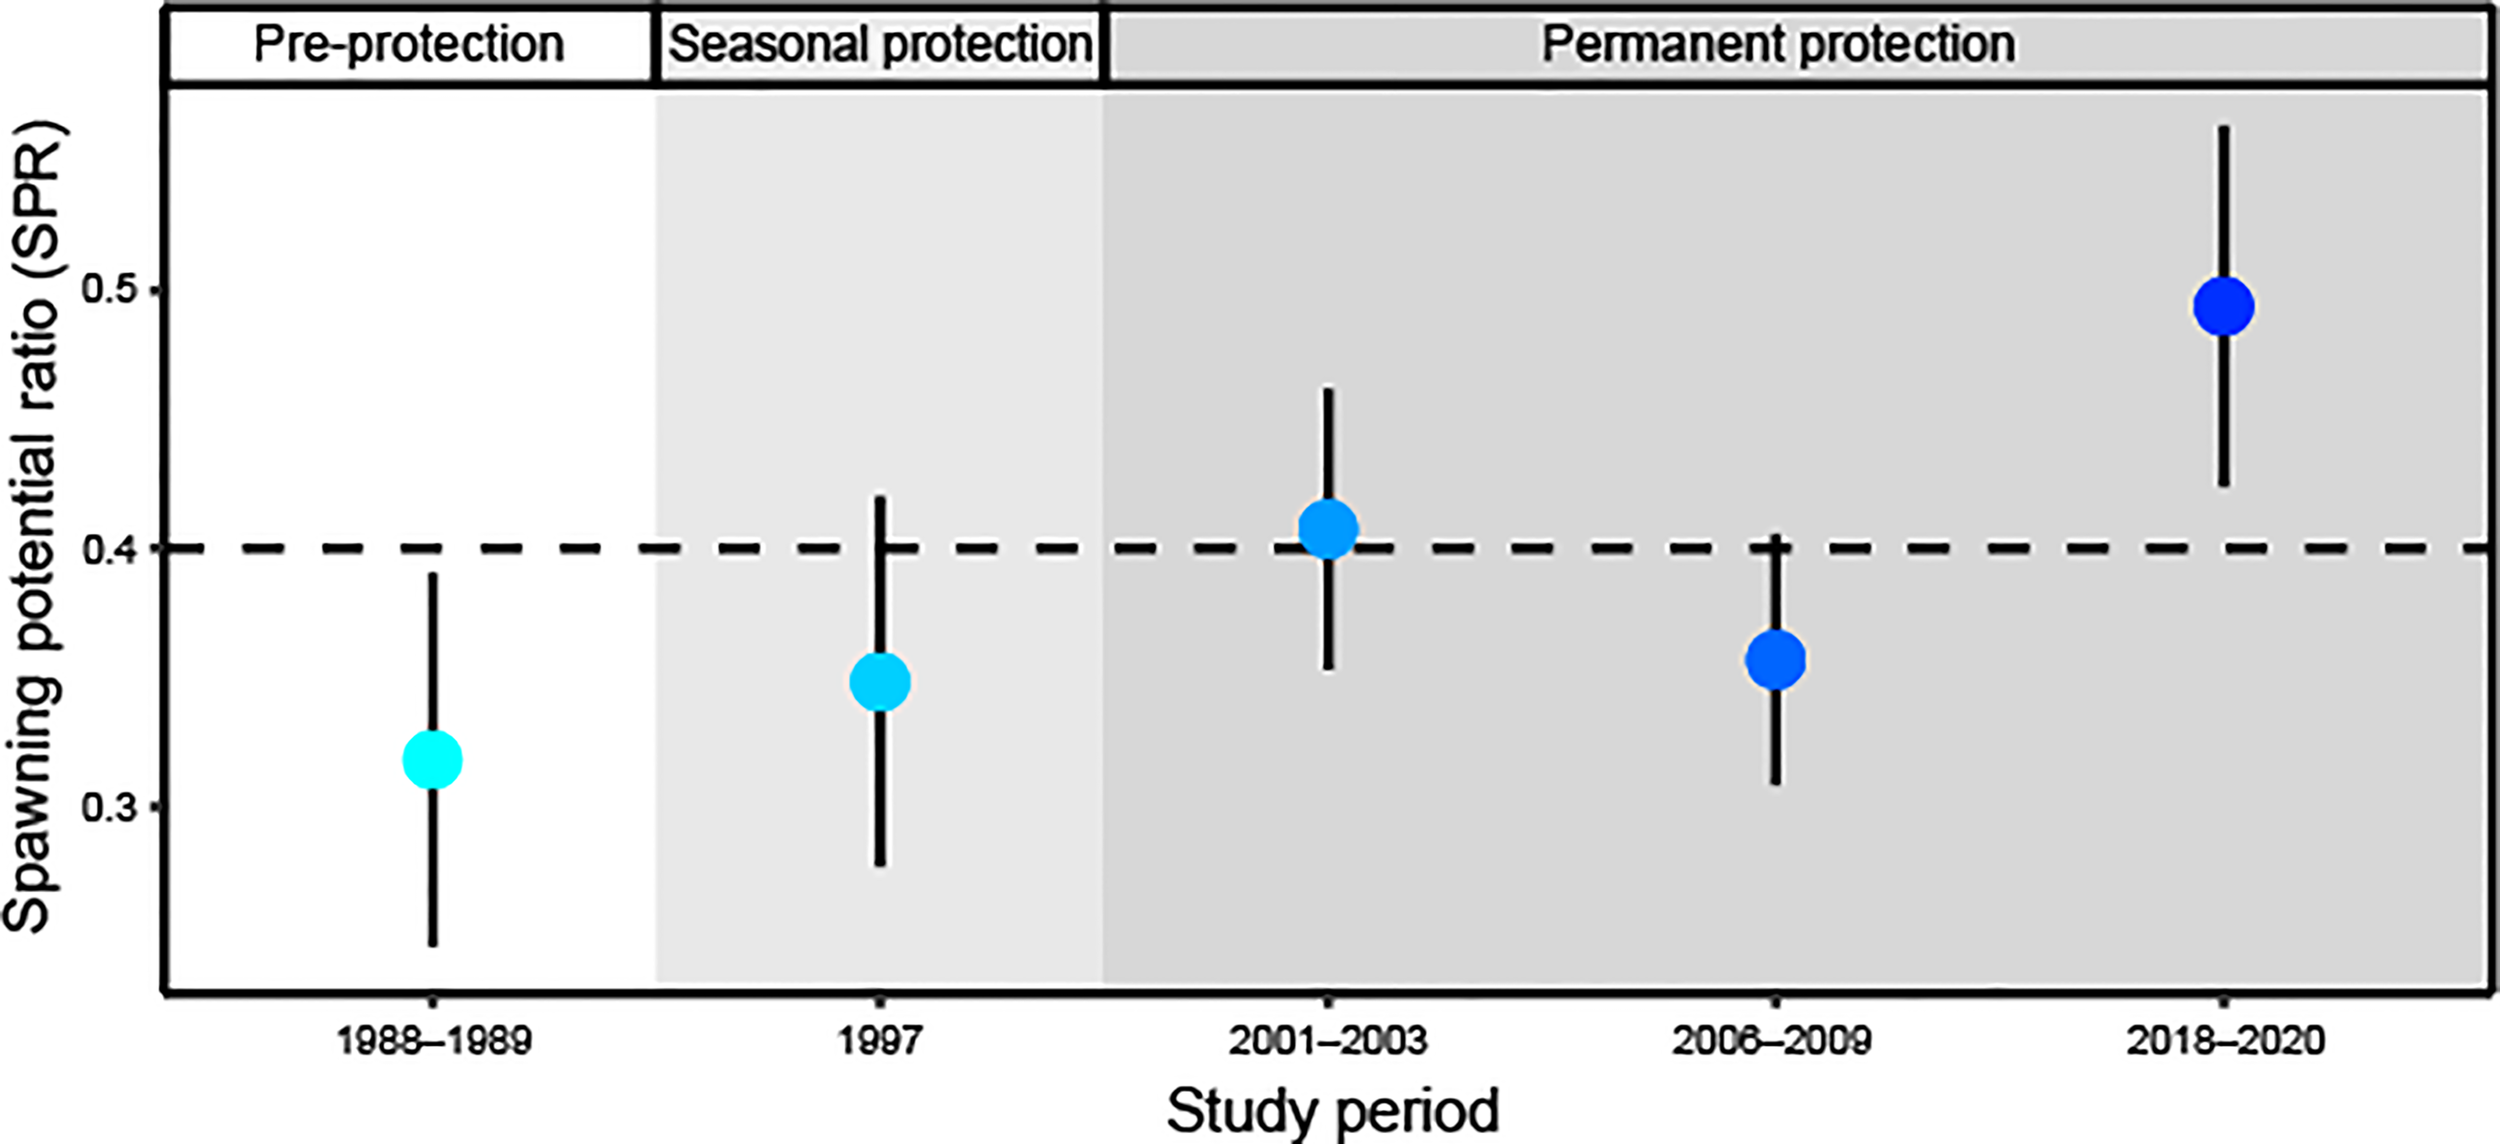
Estimated spawning potential ratio (SPR; ± 95% CI) of Red Hind population over time at the spawning aggregation site under no protection (white background), seasonal protection (light grey background), and permanent protection (dark grey background). The horizontal dashed line at SPR = 0.40 represents the lower limit of what is considered sustainable for most fish species.
Sensitivity analysis revealed that estimates of SPR were sensitive to mean asymptotic size (L∞) and less so to our assumption of natural mortality rate (M) and the growth coefficient (k; Supplementary Table 1).
Discussion
This study evaluates the impact of reducing and then eliminating fishing pressure from a spawning aggregation site as a marine conservation effort to aid in the recovery of a reef fish population. Fishing pressure is the predominant factor that affects the size and abundance of groupers in the Caribbean (Sluka et al., 1997; Chiappone et al., 2000), and aggregation fishing is one of the greatest sources of catch for aggregating species (Sadovy De Mitcheson et al., 2008). The MCD south of St. Thomas, USVI was established to protect a known spawning aggregation site from fishing pressure, first seasonally in 1990 and then permanently in 1999. We document the demographic recovery of the Red Hind population at the spawning aggregation in the MCD over 30 years of increasing protections using length-based assessment methods and historical and contemporary in situ size distribution data. After 10 years of seasonal protection and 20 years of permanent protection at the spawning aggregation site, the overall mean size (TL) of Red Hind increased by >35%, the population sex ratio is less skewed, and the SPR is above a management benchmark considered conservative for many fisheries (Clark, 1993; Clark, 2002; Mace, 1994; Rudd and Thorson, 2018). Population recovery of Red Hind in the USVI has tracked management decisions to increase protections at the spawning aggregation site.
With the reduction in fishing pressure at the spawning aggregation site, a gradual return to a population structure that includes a higher proportion of older and larger fish is expected; however, this recovery can take decades, depending on life history and reproductive strategy (White et al., 2013; Kaplan et al., 2019). Red Hind are long-lived (max. 22 years) and reach their maximum size slowly (Sadovy De Mitcheson et al., 1994). The timing of recovery of the proportion of older and larger individuals in the population (in this case, males) after protection is difficult to predict, particularly for protogynous hermaphrodites (Easter et al., 2020). We note that the size distribution of females sampled in the 2018–2020 study period is normally distributed, but the size distribution of males is left-skewed and is missing the upper tail of larger individuals. The absence of larger males may indicate that the size structure of the population is still filling in after years of protection. Another reason why larger males are less represented in the size distribution may be due to size-selective fishing mortality outside of the MCD, with commercial fishing activity disproportionately targeting larger males occupying offshore reefs (Nemeth, 2005). It is important then, that this population has been surveyed multiple times over the decades to track changes in population structure to assess recovery.
The recovery of the population size structure may lead to an increase in reproductive potential. The mean size of female fish at the spawning aggregation increased from 34.0 cm TL pre-protection (Beets and Friedlander, 1992) to 39.6 cm TL in the 2018–2020 study period, with the overall size distribution of females gradually shifting to larger fish. A survey of the Red Hind population at the spawning aggregation site found that female Red Hind larger than 37.0 cm have higher potential fecundities than those smaller than 37.0 cm and there is a rapid increase in potential fecundity with total length (Whiteman et al., 2005). The mean size of females in the 2018–2020 study period, after 30 years of protection, is above the 37.0 cm threshold, indicating that a greater proportion of the population may be contributing significantly more to larval production. Our study did not estimate reproductive output, nor did we investigate whether recruitment rates have changed over time, but both may be worth future experimental or theoretical studies to understand if the increase in mean size of females over time has impacted stock recruitment.
Heavy exploitation of spawning aggregations can alter sex ratios of hermaphroditic species (Beets and Friedlander, 1992; Carter and Perrine, 1994; Coleman et al., 1996; Koenig et al., 1996; Domeier and Colin, 1997). Before the MCD was established, the sex ratio of the population at the spawning aggregation site was heavily skewed towards females (15 females per male; Beets and Friedlander, 1992). A population with a highly skewed sex ratio may experience a decrease in reproductive success. Red Hind mate in small clusters of multiple females per male (Colin et al., 1987; Shapiro et al., 1993a), and gonad size of males and females is similar (Sadovy De Mitcheson et al., 1994), indicating that sperm limitation is unlikely unless the sex ratio is so skewed towards females to the point that there is lower fertilized egg output (Alonzo and Mangel, 2004; Heppell et al., 2006). The sex ratio after 30 years of protection at the spawning aggregation site is within the range considered biologically balanced for this population (Whiteman et al., 2005). The sex ratio is skewed towards males in days leading up to the full moon and is skewed towards females in days following the full moon. This pattern of occupancy of the spawning aggregation site is consistent with that observed at this site previously and at other Red Hind spawning aggregation sites in the Caribbean, with the sex ratio skewed more towards males prior to spawning and then towards females during peak spawning (Sadovy De Mitcheson et al., 1994; Beets and Friedlander, 1999; Whiteman et al., 2005; Nemeth et al., 2007).
A challenge for sustainable fisheries management is developing cost-effective ways to determine stock status of data-limited fisheries. Length-based assessment methods have been employed around the world because they offer a way to assess the stock status of fisheries without requiring expensive data inputs (Prince et al., 2015; Stock et al., 2021). The LBSPR method that we use in this study has also been applied to other data-limited populations of grouper (Serranidae) in the Caribbean to assess population status at fish spawning aggregations before and after protection. In the Cayman Islands, Nassau grouper spawning aggregation site protection led to the recovery of the population size structure and SPR after 16 years of protection, but the rate and extent of recovery may have been driven by successful periodic recruitment (Stock et al., 2021). Although SPR ≥ 0.40 is considered sustainable for many fish species, adjusting the target upwards may be necessary to achieve maximum sustainable yield for vulnerable fish life histories (Clark, 2002; Brooks et al., 2010; Zhou et al., 2020).
After 10 years of seasonal protection and 20 years of permanent protection from fishing pressure in the MCD, the SPR of the Red Hind population at the spawning aggregation has increased from 0.32 (95% CI: 0.25, 0.39) to 0.49 (95% CI: 0.42, 0.56), above the benchmark considered sustainable for many fisheries (Clark, 1993; Clark, 2002; Mace, 1994; Rudd and Thorson, 2018). Red Hind that are resident within the MCD gained additional protection when protection became year-round. This particular Red Hind population has experienced demographic recovery after spawning aggregation site protection at a different rate than other Red Hind populations in the Caribbean, possibly due to historic fishing pressure or other population dynamics (Sadovy De Mitcheson and Figuerola, 1992; Nemeth et al., 2006). The increase in the SPR of the population of Red Hind represents a conservation success, but it is possible that the target SPR of the population needs to be higher still to maintain a sustainable fishery.
Spawning aggregations are necessary for the successful reproduction of many reef fishes, but fishing at spawning aggregations has led to the decline of many important fishery species around the world (Sadovy De Mitcheson et al., 2008). Fish spawning aggregation site protection is used as a management tool to aid in population recovery (Grüss et al., 2014). To evaluate the effectiveness of spawning aggregation site protection, it is necessary to assess stock status over time as it may take decades for the population structure to fully recover (White et al., 2013; Kaplan et al., 2019). Our study uses historical and contemporary data to monitor recovery of a Red Hind population over 30+ years, from 1988 to 2020. The population of Red Hind at the spawning aggregation site south of St. Thomas, USVI has recovered according to multiple population metrics: an increase in overall mean fish size (TL), a less skewed sex ratio, and an increase in the population SPR. The USVI Red Hind fishery has tracked recovery of the population at the spawning aggregation site, with an increase in mean size of landed Red Hind and a perceived increase in catch rates (Beets and Friedlander, 1999; Nemeth, 2005). Most fishers are supportive of the spawning aggregation site closure because of the perceived enhancement of the local fishery (Beets and Friedlander, 1999; Nemeth, 2005). Management decisions, participation of fishers in acknowledging closures, and long-term monitoring have contributed to the conservation success that is the recovery of the Red Hind population at the spawning aggregation site south of St. Thomas, USVI.
Funding
Funding for this research (2018–2020) was provided by the National Oceanic and Atmospheric Administration National Marine Fisheries Service Saltonstall-Kennedy Program (Award No. NA17NMF4270206). The 2006–2009 dataset was funded by Puerto Rico Sea Grant College Program (R-31-1-06) to R. S. Nemeth, Publication of this paper was supported, in part, by the Thomas G. Scott and Henry Mastin Graduate Student Publication Funds from the Department of Fisheries, Wildlife, and Conservation Sciences at Oregon State University.
Publisher’s Note
All claims expressed in this article are solely those of the authors and do not necessarily represent those of their affiliated organizations, or those of the publisher, the editors and the reviewers. Any product that may be evaluated in this article, or claim that may be made by its manufacturer, is not guaranteed or endorsed by the publisher.
Statements
Data availability statement
The datasets presented in this study can be found in online repositories. The names of the repository/repositories and accession number(s) can be found below: https://github.com/rclairer/population_recovery_with_marine_conservation.
Ethics statement
The animal study was reviewed and approved by Institutional Animal Care and Use Committee at Oregon State University.
Author contributions
SH and RN: funding. CR, RN, and SH: study design. CR, RN, and SH: data collection or sources. CR: coding. CR: analysis. CR, RN, and SH: interpretation. CR wrote the first draft of the manuscript. CR, RN, and SH contributed to manuscript revisions. CR, RN, and SH read and approved the submitted version.
Acknowledgments
We thank Larry Aubain, Richard Caleb, and the US Virgin Islands (USVI) Division of Fish and Wildlife (DFW) for providing the expertise that enabled us to complete our field work (2018–2020). We thank Brittany Schwartzkopf, Mee-ya Monneedy, and Maxwell Tice-Lewis for additional field support (2018–2020). We thank Alex Avila, members of American Fisheries Society Puerto Rico, and USVI DFW for project outreach support. Field support for collection of 2006–2009 data was provided by Elizabeth Kadison, Jeremiah Blondeau, Tyler B. Smith, Jacqui Calnan, Steve Herzlieb, and Kenny Turbe. We thank the Oregon State University Center for Genome Research and Biocomputing Laboratory for access to equipment necessary for hormone analysis. We thank Allison Guill, Coltyn Kidd, Chantelle MacAdams, and Kaitlyn Reicheck for additional lab work support. We thank Brian Stock for his counsel on running length-based stock assessment models and for providing helpful references and code.
Conflict of interest
The authors declare that the research was conducted in the absence of any commercial or financial relationships that could be construed as a potential conflict of interest.
Supplementary material
The Supplementary Material for this article can be found online at: https://www.frontiersin.org/articles/10.3389/fmars.2022.931409/full#supplementary-material
References
1
Alonzo S. H. Mangel M. (2004). The Effects of Size-Selective Fisheries on the Stock Dynamics of and Sperm Limitation in Sex-Changing Fish. Fishery Bull.102 (1). 1–13, Available at: http://hdl.handle.net/1834/30881
2
Asch R. G. Erisman B. E. (2018). Spawning Aggregations Act as a Bottleneck Influencing Climate Change Impacts on a Critically Endangered Reef Fish. Diversity Distributions24 (12), 1712–1728. doi: 10.1111/ddi.12809
3
Ault J. S. Smith S. G. Luo J. Monaco M. E. Appeldoorn R. S. (2008). Length-Based Assessment of Sustainability Benchmarks for Coral Reef Fishes in Puerto Rico. Environ. Conserv.35, 221–231. doi: 10.1017/S0376892908005043
4
Basson M. Rosenberg A. A. Beddington J. R. (1988). The Accuracy and Reliability of Two New Methods for Estimating Growth Parameters From Length-Frequency Data. ICES J. Mar. Sci.44 (3), 277–285. doi: 10.1093/icesjms/44.3.277
5
Beets J. P. Friedlander A. M. (1992). Stock Analysis and Management Strategies for Red Hind, Epinephelus Guttatus, in the US Virgin Islands.Proceedings of the Gulf and Caribbean Fisheries Institute. 42, 66–79. Available at: http://hdl.handle.net/1834/30233.
6
Beets J. P. Friedlander A. M. (1999). Evaluation of a Conservation Strategy: A Spawning Aggregation Closure for Red Hind, Epinephelus Guttatus, in the U.S. Virgin Islands. Environ. Biol. Fishes55, 91–98. doi: 10.1023/a:1007404421518
7
Beverton R. J. H. Holt S. J. (2012). On the Dynamics of Exploited Fish Populations.Fish & Fisheries Series11(1). VI–538 (Springer Dordrecht). https://doi.org/10.1007/978-94-011-2106-4
8
Bolden S. K. (2000). Long-Distance Movement of a Nassau Grouper (Epinephelus Striatus) to a Spawning Aggregation in the Central Bahamas. Fishery Bull.98 (3), 642–645. Available at: https://spo.nmfs.noaa.gov/sites/default/files/12_0.pdf
9
Brooks E. N. Powers J. E. Cortés E. (2010). Analytical Reference Points for Age-Structured Models: Application to Data-Poor Fisheries. ICES J. Mar. Sci.67 (1), 165–175. doi: 10.1093/icesjms/fsp225
10
Brooks E. N. Shertzer K. W. Gedamke T. Vaughan D. S. (2008). Stock Assessment of Protogynous Fish: Evaluating Measures of Spawning Biomass Used to Estimate Biological Reference Points. Fishery Bull.106 (1), 12–23. Available at: http://hdl.handle.net/1834/19910
11
Carter J. Perrine D. (1994). A Spawning Aggregation of Dog Snapper, Lutjanus Jocu (Pisces: Lutjanidae) in Belize, Central America. Bull. Mar. Sci.55 (1), 228–234. Available at: https://orst.library.ingentaconnect.com/content/umrsmas/bullmar/1994/00000055/00000001/art00012?crawler=true
12
Cayman Chemical Company (2022). Available at: https://www.caymanchem.com/
13
Chiappone M. Sluka R. Sealey K. S. (2000). Groupers (Pisces: Serranidae) in Fished and Protected Areas of the Florida Keys, Bahamas and Northern Caribbean. Mar. Ecol. Prog. Ser.198, 261–272 doi: 10.3354/meps198261
14
Clark W. G. (1993). The Effect of Recruitment Variability on the Choice of a Target Level of Spawning Biomass Per Recruit. In Proceedings of the International Symposium on Management Strategies for Exploited Fish Populations, 233–246. Ed. By KruseG.MarascoR. J.PautzkeC.QuinnT. J.II. University of Alaska, Alaska Sea Grant College Program Report 93-02, Fairbanks.
15
Clark W. G. (2002). F 35% Revisited Ten Years Later. North Am. J. Fisheries Manage.22 (1), 251–257. doi: 10.1577/1548-8675(2002)022<0251:frtyl>2.0.co;2
16
Coleman F. C. Koenig C. C. Collins L. A. (1996). Reproductive Styles of Shallow-Water Groupers (Pisces: Serranidae) in the Eastern Gulf of Mexico and the Consequences of Fishing Spawning Aggregations. Environ. Biol. Fishes47 (2), 129–141. doi: 10.1007/BF00005035
17
Colin P. L. (1992). Reproduction of the Nassau Grouper, Epinephelus Striatus (Pisces: Serranidae) and Its Relationship to Environmental Conditions. Environ. Biol. Fishes34 (4), 357–377. doi: 10.1007/BF00004740
18
Colin P. L. Shapiro D. Y. Weiler D. (1987). Aspects of the Reproduction of Two Groupers, Epinephelus Guttatus and E. Striatus in the West Indies. Bull. Mar. Sci.40, 220–230. Available at: https://orst.library.ingentaconnect.com/content/umrsmas/bullmar/1987/00000040/00000002/art00005?crawler=true&mimetype=application/pdf
19
Cummings N. J. Parrack M. L. Zweifel J. W. (1997). The Status of Red Hind and Coney in the U.S. Virgin Islands Between 1974 and 1992. Proc. 49th Gulf Caribb Fish Inst49, 354–397. Available at: http://hdl.handle.net/1834/28967
20
Dingle H. Drake V. A. (2007). “What Is Migration?”BioScience57 (2), 113–121. doi: 10.1641/B570206
21
Domeier M. L. Colin P. L. (1997). Tropical Reef Fish Spawning Aggregations: Defined and Reviewed. Bull. Mar. Sci.60(3), 698–726. Available at: https://orst.library.ingentaconnect.com/content/umrsmas/bullmar/1997/00000060/00000003/art00006?crawler=true
22
Easter E. E. Adreani M. S. Hamilton S. L. Steele M. A. Pang S. White J. W. (2020). Influence of Protogynous Sex Change on Recovery of Fish Populations Within Marine Protected Areas. Ecol. Appl.30 (3), Article e02070, 1–15 doi: 10.1002/eap.2070
23
Erisman B. E. Allen L. G. Claisse J. T. Pondella D. J. Miller E. F. Murray J. H. (2011). The Illusion of Plenty: Hyperstability Masks Collapses in Two Recreational Fisheries That Target Fish Spawning Aggregations. Can. J. Fisheries Aquat. Sci.68 (10), 1705–1716. doi: 10.1139/f2011-090
24
Erisman B. E. Mckinney-Lambert C. Sadovy De Mitcheson Y. (2013). Sad Farewell to C. Lavett-Smith’s Iconic Nassau Spawning Aggregation Site. Proc. 66th Gulf Caribbean Fisheries Institute.66, 421–422. Available at: https://www.researchgate.net/profile/Brad-Erisman/publication/281464649_Sad_Farewell_to_C_Lavett-Smith's_Iconic_Nassau_Spawning_Aggregation_Site/links/55e9ea4b08aeb6516265e037/Sad-Farewell-to-C-Lavett-Smiths-Iconic-Nassau-Spawning-Aggregation-Site.pdf
25
Goodyear C. P. (1993). Spawning Stock Biomass Per Recruit in Fisheries Management: Foundation and Current Use. in Risk Evaluation and Biological Reference Points for Fisheries Management, vol. 120 . Eds. SmithS. J.HuntJ. J.RivardD. ( Canadian Special Publication of Fisheries and Aquatic Sciences), 67–82.
26
Grüss A. Robinson J. Heppell S. S. Heppell S. A. Semmens B. X. (2014). Conservation and Fisheries Effects of Spawning Aggregation Marine Protected Areas: What We Know, Where We Should Go, and What We Need to Get There. ICES J. Mar. Sci.71 (7), 1515–1534. doi: 10.1093/icesjms/fsu038
27
Gulland J. A. Rosenberg A. A. (1992). A Review of Length-Based Approaches to Assessing Fish Stocks In FAO Fisheries Technical Paper, 323. Rome, FAO.
28
Heppell S. S. Heppell S. A. Coleman F. C. Koenig C. C. (2006). Models to Compare Management Options for a Protogynous Fish. Ecol. Appl.16 (1), 238–249. doi: 10.1890/04-1113
29
Heppell S. A. Semmens B. X. Archer S. K. Pattengill-Semmens C. V. Bush P. G. McCoy C. M. et al . (2012). Documenting Recovery of a Spawning Aggregation Through Size Frequency Analysis From Underwater Laser Calipers Measurements. Biol. Conserv.155, 119–127. doi: 10.1016/j.biocon.2012.06.002
30
Heppell S. A. Sullivan C. V. (2000). Identification of Gender and Reproductive Maturity in the Absence of Gonads: Muscle Tissue Levels of Sex Steroids and Vitellogenin in Gag (Mycteroperca Microlepis). Can. J. Fisheries Aquat. Sci.57, 148–159. doi: 10.1139/f99-188
31
Heyman W. D. Kjerfve B. Graham R. T. Rhodes K. L. Garbutt L. (2005). Spawning Aggregations of Lutjanus Cyanopterus (Cuvier) on the Belize Barrier Reef Over a 6 Year Period. J. Fish Biol.67, 83–101. doi: 10.1111/j.0022-1112.2005.00714.x
32
Hordyk A. (2019) LBSPR: Length-Based Spawning Potential Ratio. 204–216. Available at: https://cran.r-project.org/package=LBSPR.
33
Hordyk A. Ono K. Sainsbury K. Loneragan N. Prince J. (2015a). Some Explorations of the Life History Ratios to Describe Length Composition, Spawning-Per-Recruit, and the Spawning Potential Ratio. ICES J. Mar. Sci.72 (1), 204–216. doi: 10.1093/icesjms/fst235
34
Hordyk A. Ono K. Valencia S. Loneragan N. Prince J. (2015b). A Novel Length-Based Empirical Estimation Method of Spawning Potential Ratio (SPR), and Tests of Its Performance, for Small-Scale, Data-Poor Fisheries. ICES J. Mar. Sci.72 (1), 217–231. doi: 10.1093/icesjms/fsu004
35
Kaplan K. A. Yamane L. Botsford L. W. Baskett M. L. Hastings A. Worden S. et al . (2019). Setting Expected Timelines of Fished Population Recovery for the Adaptive Management of a Marine Protected Area Network. Ecol. Appl.29 (6), Article e01949, 1202–1220. doi: 10.1002/eap.1949
36
Koenig C. C. Coleman F. C. Collins L. A. F. Arreguín-Sánchez J. L. Munro M. C. Balgos D. Pauly (1996). Reproduction in Gag (Mycteroperca Microlepis) (Pisces: Serranidae) in the Eastern Gulf of Mexico and the Consequences of Fishing Spawning Aggregations. In (eds.) Biology, Fisheries and Culture of Tropical Groupers and Snappers. ICLARM Conf. Proc.48, 449 p. Available at: https://www.researchgate.net/publication/291026675_Reproduction_in_gag_Mycteroperca_microlepis_Pisces_Serranidae_in_the_eastern_Gulf_of_Mexico_and_the_consequences_of_fishing_spawning_aggregations
37
Lopez-Rivera D. M. M. Sabat A. M. (2009). Effects of a Marine Fishery Reserve and Habitat Characteristics in the Abundance and Demography of the Red Hind Grouper, Epinephelus Guttatus. Caribbean J. Sci.45, 348–362. doi: 10.18475/cjos.v45i2.a19
38
Luckhurst B. E. Hateley J. Trott T. M. (2006). Estimation of the Size of Spawning Aggregations of Red Hind (Epinephelus Guttatus) Using a Tag-Recapture Methodology at Bermuda. Gulf Caribbean Fisheries Institute Proc., 57, 535–542. Available at: http://hdl.handle.net/1834/29804
39
Mace P. M. (1994). Relationships Between Common Biological Reference Points Used as Thresholds and Targets of Fisheries Management Strategies. Can. J. Fisheries Aquat. Sci.51 (1), 110–122. doi: 10.1139/f94-013
40
Myers R. A. Rosenberg A. A. Mace P. M. Barrowman N. Restrepo V. R. (1994). In Search of Thresholds for Recruitment Overfishing. ICES J. Mar. Sci.51 (2), 191–205. doi: 10.1006/jmsc.1994.1020
41
Nemeth R. S. (2005). Population Characteristics of a Recovering US Virgin Islands Red Hind Spawning Aggregation Following Protection. Mar. Ecol. Prog. Ser.286, 81–97. doi: 10.3354/meps286081
42
Nemeth R. S. Blondeau J. Herzlieb S. Kadison E. (2007). Spatial and Temporal Patterns of Movement and Migration at Spawning Aggregations of Red Hind, Epinephelus Guttatus, in the U.S. Virgin Islands. Environ. Biol. Fishes78, 365–381. doi: 10.1007/s10641-006-9161-x
43
Nemeth R. S. Herzlieb S. Blondeau J. (2006). Comparison of Two Seasonal Closures for Protecting Red Hind Spawning Aggregations in the US Virgin Islands. In International Coral Reef Symposium. 10 (4), 1306–1313. Available at: https://www.researchgate.net/publication/236323826_Comparison_of_two_seasonal_closures_for_protecting_red_hind_spawning_aggregations_in_the_US_Virgin_Islands
44
Nemeth R. S. (2009). “Dynamics of Reef Fish and Decapod Crustacean Spawning Aggregations: Underlying Mechanisms, Habitat Linkages, and Trophic Interactions.” In Ecological Connectivity Among Tropical Coastal Ecosystems. doi: 10.1007/978-90-481-2406-0_4
45
Nemeth R. S. Kadison E. Brown-Peterson N. J. Blondeau J. (2020). Reproductive Biology and Behavior Associated With a Spawning Aggregation of the Yellowfin Grouper Mycteroperca Venenosa in the US Virgin Islands. Bull. Mar. Sci.96 (1), 31–56(26). doi: 10.5343/bms.2019.0028
46
Pauly D. Morgan G. R. (eds.) (1987). Length-Based Methods in Fisheries Research. In ICLARM Conf. Proc.13, 468 p. Available at: https://hdl.handle.net/20.500.12348/3377
47
Prince J. Victor S. Kloulchad V. Hordyk A. (2015). Length Based SPR Assessment of Eleven Indo-Pacific Coral Reef Fish Populations in Palau. Fisheries Res.171, 42–58. doi: 10.1016/j.fishres.2015.06.008
48
Quinn T. J. Deriso R. B. (1999). Quantitative Fish Dynamics (Oxford University Press). Oxford University Press; 1st edition; 560 pages
49
R Core Team (2020). R: A Language and Environment for Statistical Computing (Vienna, Austria: R Foundation for Statistical Computing). Available at: https://www.r-project.org/.
50
Reed J. K. Koenig C. C. Shepard A. N. (2007). Impacts of Bottom Trawling on a Deep-Water Oculina Coral Ecosystem Off Florida.Bull. Mar. Sci.81(3), 481–496. Available at: https://orst.library.ingentaconnect.com/content/umrsmas/bullmar/2007/00000081/00000003/art00014?crawler=true&mimetype=application/pdf
51
Rohatgi A. (2021). WebPlotDigitizer (Pacifica, California, USA). Available at: https://automeris.io/WebPlotDigitizer.
52
Rowell T. J. Nemeth R. S. Schärer M. T. Appeldoorn R. S. (2015). Fish Sound Production and Acoustic Telemetry Reveal Behaviors and Spatial Patterns Associated With Spawning Aggregations of Two Caribbean Groupers. Mar. Ecol. Prog. Ser.518, 239–254. doi: 10.3354/meps11060
53
Rudd M. B. Thorson J. T. (2018). Accounting for Variable Recruitment and Fishing Mortality in Length-Based Stock Assessments for Data-Limited Fisheries. Can. J. Fisheries Aquat. Sci.75 (7), 1019–1035. doi: 10.1139/cjfas-2017-0143
54
Rudd M. B. Thorson J. T. Sagarese S. R. (2019). Ensemble Models for Data-Poor Assessment: Accounting for Uncertainty in Life-History Information. ICES J. Mar. Sci.76 (4), 870–883. doi: 10.1093/icesjms/fsz012
55
Russell M. W. Sadovy De Mitcheson Y. Erisman B. E. Hamilton R. J. Luckhurst B. E. Nemeth R. S. (2014). Status Report–World’s Fish Aggregations 2014. Science and Conservation of Fish Aggregations,California, USA.International Coral Reef Initiative. Available at: https://www.researchgate.net/publication/269688206_Status_Report_World's_Fish_Aggregations_2014_Report_by_Science_and_Conservation_of_Fish_Aggregations_SCRFA_in_collaboration_with_the_ICRI_Ad_Hoc_Committee_for_Reef_Associated_Fisheries
56
Sadovy De Mitcheson Y. Cornish A. Domeier M. Colin P. L. Russell M. Lindeman K. C. (2008). A Global Baseline for Spawning Aggregations of Reef Fishes. Conserv. Biol.22 (5), 1233–1244. doi: 10.1111/j.1523-1739.2008.01020.x
57
Sadovy De Mitcheson Y. Domeier M. (2005). Are Aggregation-Fisheries Sustainable? Reef Fish Fisheries as a Case Study. Coral Reefs24 (2), 254–262. doi: 10.1007/s00338-005-0474-6
58
Sadovy De Mitcheson Y. Figuerola M. (1992). The Status of Red Hind Fishery in Puerto Rico and St. Thomas, as Determined by Yield-Per-Recruit Analysis. In Proceedings of the Gulf and Caribbean Fishery Institute42, 23–38. Available at: http://hdl.handle.net/1834/30229
59
Sadovy De Mitcheson Y. Figuerola M. Román A. (1992). Age and Growth of Red Hind Epinephelus Guttatus in Puerto Rico and St Thomas. Fishery Bull.90, 516–528. Available at: https://spo.nmfs.noaa.gov/sites/default/files/pdf-content/1992/903/sadovy.pdf
60
Sadovy De Mitcheson Y. Rosario A. Román A. (1994). Reproduction in an Aggregating Grouper, the Red Hind, Epinephelus Guttatus. Environ. Biol. Fishes41, 269–286. doi: 10.1007/BF02197849
61
SEDAR (2014) Stock Assessment Report for U.S. Caribbean Red Hind. Available at: https://sedarweb.org/sedar-35.
62
Shapiro D. Y. Sadovy De Mitcheson Y. McGehee M. A. (1993a). Periodicity of Sex Change and Reproduction in the Red Hind, Epinephelus Guttatus, a Protogynous Grouper. Bull. Mar. Sci.53 (3), 1151–1162. doi: 10.2307/1447138
63
Shapiro D. Y. Sadovy De Mitcheson Y. McGehee M. A. (1993b). Size, Composition, and Spatial Structure of the Annual Spawning Aggregation of the Red Hind, Epinephelus Guttatus (Pisces: Serranidae). Copeia1993 (2), 399–406. doi: 10.2307/1447138
64
Slipke J. W. Martin A. D. Pitlo J. Maceina M. J. (2002). Use of the Spawning Potential Ratio for the Upper Mississippi River Channel Catfish Fishery. North Am. J. Fisheries Manage.22 (4), 1295–1300. doi: 10.1577/1548-8675(2002)022<1295:uotspr>2.0.co;2
65
Sluka R. Chiappone M. Sullivan K. M. Wright R. (1997). The Benefits of a Marine Fishery Reserve for Nassau Grouper Epinephelus Striatus in the Central Bahamas. In Proceeding of the International Coral Reef Symposium8(2), 1961–1964. Available at: https://www.researchgate.net/publication/237335940_The_benefits_of_a_marine_reserve_for_Nassau_grouper_Epinephelus_striatus_in_the_central_Bahamas
66
Stock B. C. Heppell S. A. Waterhouse L. Dove I. C. Pattengill-Semmens C. V. McCoy C. M. et al . (2021). Pulse Recruitment and Recovery of Cayman Islands Nassau Grouper (Epinephelus Striatus) Spawning Aggregations Revealed by in Situ Length-Frequency Data. ICES J. Mar. Sci.78 (1), 277–292.doi: 10.1093/icesjms/fsaa221
67
Walters C. J. Martell S. J. D. (2004). Fisheries Ecology and Management (Princeton, USA: Princeton University Press).
68
Waterhouse L. Heppell S. A. Pattengill-Semmens C. V. McCoy C. Bush P. Johnson B. C. et al . (2020). Recovery of Critically Endangered Nassau Grouper (Epinephelus Striatus) in the Cayman Islands Following Targeted Conservation Actions. Proc. Natl. Acad. Sci. U.S.A.117 (3), 1587–1595. doi: 10.1073/pnas.1917132117
69
White J. W. Botsford L. W. Hastings A. Baskett M. L. Kaplan D. M. Barnett L. A. K. (2013). Transient Responses of Fished Populations to Marine Reserve Establishment. Conserv. Lett.6 (3), 180–191. doi: 10.1111/j.1755-263X.2012.00295.x
70
Whiteman E. A. Jennings C. A. Nemeth R. S. (2005) “Sex Structure and Potential Female Fecundity in a Epinephelus Guttatus Spawning Aggregation: Applying Ultrasonic Imaging.”J. Fish Biol.66 (4). 983–995. doi: 10.1111/j.0022-1112.2005.00653.x
71
Zeller D. C. (1998). Spawning Aggregations: Patterns of Movement of the Coral Trout Plectropomus Leopardus (Serranidae) as Determined by Ultrasonic Telemetry. Mar. Ecol. Prog. Ser.162, 253–263. doi: 10.3354/meps162253
72
Zhou S. Punt A. E. Lei Y. Deng R. A. Hoyle S. D. (2020). Identifying Spawner Biomass Per-Recruit Reference Points From Life-History Parameters. Fish Fisheries21 (4), 760–773. doi: 10.1111/faf.12459
Summary
Keywords
fisheries management, length-based assessment, spawning potential ratio, size distribution, sex ratio, Serranidae, Caribbean
Citation
Rosemond RC, Nemeth RS and Heppell SA (2022) Demographic Recovery of a Reef Fish Population Over 30 Years of Spawning Aggregation Site Protection. Front. Mar. Sci. 9:931409. doi: 10.3389/fmars.2022.931409
Received
29 April 2022
Accepted
09 June 2022
Published
22 July 2022
Volume
9 - 2022
Edited by
David M. P. Jacoby, University of Lancaster, United Kingdom
Reviewed by
Oumar Sadio, Institut de recherche pour le développement (Senegal), Senegal; Brendan J. Runde, The Nature Conservancy, United States
Updates
Copyright
© 2022 Rosemond, Nemeth and Heppell.
This is an open-access article distributed under the terms of the Creative Commons Attribution License (CC BY). The use, distribution or reproduction in other forums is permitted, provided the original author(s) and the copyright owner(s) are credited and that the original publication in this journal is cited, in accordance with accepted academic practice. No use, distribution or reproduction is permitted which does not comply with these terms.
*Correspondence: R. Claire Rosemond, claire.rosemond@oregonstate.edu
This article was submitted to Marine Conservation and Sustainability, a section of the journal Frontiers in Marine Science
Disclaimer
All claims expressed in this article are solely those of the authors and do not necessarily represent those of their affiliated organizations, or those of the publisher, the editors and the reviewers. Any product that may be evaluated in this article or claim that may be made by its manufacturer is not guaranteed or endorsed by the publisher.