Abstract
Marine crustaceans are known as a group with high morphological diversity and great economic value. Most species have planktonic larval stages that are difficult to identify to species level using traditional approaches because of insufficient morphological diagnostic characters or taxonomic descriptions. We used DNA barcoding and molecular species identification to investigate the species diversity and distribution of crustacean larvae in the Zhongsha Islands waters, South China Sea. In total, 108 sequences were obtained from crustacean larvae collected in the Zhongsha Islands waters in 2019 using vertical hauls between the depths of 5 and 200 m. The molecular classification approach confirmed that 108 sequences represented crustaceans typical to the South China Sea, with 70 species identified, representing 43 genera, 23 families, and 4 orders. However, the cytochrome c oxidase subunit I gene sequences of only 27 species identified from the larval samples matched with available sequences taken from adults in GenBank. The comparison of K2P distances yielded a notable gap of 3.5–10.7% between intraspecific and interspecific distances across the sequence dataset. More than 80% of the crustacean larvae species belonged to the order Decapoda, and they displayed marked differences in their distributionsin the Zhongshan Islands waters. The orders Calanoida and Amphipoda were represented by the fewest species, which were recorded only at the edge of the Zhongsha Atoll.
Introduction
The majority of extant species of crustaceans live in oceans and estuarine regions and adjacent coastal waters. Crustaceans are one of the largest and most morphologically diverse and economically important marine invertebrate groups, and play important roles in marine food webs. Most marine crustacean species have a complex life history including planktonic (larval) and benthic (juvenile to adult) phases (Radulovici et al., 2010). Traditional taxonomic identification of marine crustaceans is largely based on visible morphological characteristics, such as shape of the carapace and features of the thoracic somites, antennae, and mandibles (Anger, 2001). However, these characters are insufficient to identify every species, especially at larval stages. The larvae show a wide array of adaptations to the ocean environment, including characteristics of their morphology, developmental stage, behavior, and ecology (Forward, 1990; Bertram and Strathmann, 1998). In addition, different larval stages within species can exhibit different morphological features, and most crustacean larvae bear little resemblance to their adult forms (Alford and Jackson, 1993). Thus, the same crustacean species at different larval stages may be erroneously identified as a different species when depending on morphological characteristics; conversely, different species at the same larval stage can have similar morphological features (Ko et al., 2013). Furthermore, identifications and classifications based on morphological characteristics can be difficult and time-consuming; though species identifications generally require considerable taxonomic knowledge, even the same specimen can be identified inconsistently among taxonomists (Bilgin et al., 2014). Therefore, diagnoses of crustacean larvae are problematic and challenging given the generally small amount of morphological characteristics available, especially in the context of a species’ rapid development from larval to juvenile stages.
DNA-based methods provide a quick, reliable, and cost-effective identification system that applies specific DNA sequences as “DNA barcodes” to identify species. Hebert et al. (2003) was the first to propose the use of a short and standardize fragment of the mitochondrial cytochrome c oxidase subunit I (COI) gene for identifications throughout the entire animal kingdom based on the sequence diversity among different taxa (Ratnasingham and Hebert, 2007; Ratnasingham and Hebert, 2013). The COI gene has several characteristics that make it highly efficient and reliable for species identification in most animals. For instance, it has an almost exclusively haploid mode of inheritance from the mother, high substitution rates, large copy numbers in mitochondria, and an absence of recombination and introns (Ballard and Whitlock, 2004; Bernt et al., 2013). In the decades since a DNA barcoding system for specimen identifications was established, numerous studies have proven that this technique is effective for identifying species (Hajibabaei et al., 2006; Ward et al., 2009; Radulovici et al., 2010). DNA barcoding has now been successfully applied in insects (Janzen et al., 2005; Smith et al., 2005), crustaceans (Costa et al., 2007; Bilgin et al., 2014; Bucklin et al., 2022), fish (Ward et al., 2005; Hubert et al., 2008; Ghouri et al., 2020; Guimarães-Costa et al., 2020; Xu et al., 2021), birds (Hebert et al., 2004), and mammals (Lorenz et al., 2005; Clare et al., 2007). These achievements have benefited from the establishment of the Barcode of Life Data Systems (BOLDSystems), which is a global public standard dataset platform with general technical rules and identification systems for animal taxonomy. Data deposited in BOLD include not only DNA barcode sequences but also the geographical coordinates of collection sites, primer sequences, taxonomic information, photographs of vouchers, and even electropherogram files (Ratnasingham and Hebert, 2007). The database implies standardization, which allows comparisons of specimens identified by morphological and molecular characters among the datasets of different researchers, sometimes revealing potential cryptic species or cosmopolitan species consisting of species complexes (Ratnasingham and Hebert, 2013). Given that marine crustacean larvae pose considerable problems in terms of identification, owing to limited morphological characteristics in the complex life cycle of marine crustaceans, DNA barcoding has been applied by matching the COI sequences of unknown larval morphotypes with the sequences of previously described adults deposited in the database. Through DNA barcoding, Tang et al. (2010) found 14 larval morphotypes of stomatopods from Hong Kong waters belonged to seven species; Kusbiyanto et al. (2020) identified the larvae of eight species of crustaceans from the eastern part of Segara Anakan Lagoon, Indonesia; and Barber and Boyce (2006) explored the biodiversity of stomatopods in the Coral Triangle (western Pacific) and the Red Sea.
The South China Sea is the largest semi-enclosed sea located in the western Pacific region, hosting rich coral reef ecosystem, and diverse fish and crustacean taxa. It extends across the subtropical and tropical zones, with an area of ~3,400,000 km2 and average depth of 1,200 m (Morton and Blackmore, 2001; Liu, 2013). The Zhongsha Islands are located approximately at the center of the South China Sea; they consist of Huangyan Island (or Scarborough Shoal), Zhongsha Atoll (or Macclesfield Bank), and four other main reefs. Zhongsha Atoll is situated approximately 510–670 km from the Philippine Islands, Indo-China Peninsula, and China mainland. It is a ring-shaped reef complex, arranged along the outer edge of a submerged atoll structure; its maximum length exceeds 150 km (southwest–northeast) and the width is ~75 km, and it covers an area of ~23,500 km2. The discontinuous marginal reefs of Zhongsha Atoll surround a lagoon with depths of 50–70 m (Huang et al., 2020). Zhongsha Atoll is one of the most important coral reef ecosystems in the South China Sea owing to high biodiversity and abundant fishery resources (Tittensor et al., 2010; Li et al., 2020; Zhao and Jia, 2020; Lu et al., 2021; Huang et al., 2022).
Here, we obtained specimens of crustacean larvae from waters around the Zhongsha Islands to investigate the species diversity and distribution of marine crustaceans at the islands by using DNA barcodes to identify unknown larval morphotypes. This study will provide useful additional information for understanding the diversity crustaceans in the Zhongsha Islands waters and will improve the accuracy of marine crustacean larvae identification. Moreover, our reference DNA barcoding information on larval crustaceans should benefit estimations of the recruitment and productivity potential of the Zhongsha Islands waters as a nursery ground. Overall, such data are vital as a scientific basis for biodiversity and ecosystem conservation of the South China Sea.
Materials and Methods
Sample Collection
Sampling around the Zhongsha Islands (including at Zhongsha Atoll and Huangyan Island) was carried out by the scientific expedition vessel Yueyuzhanke10 during an investigation by the South China Sea Institute of Oceanology, conducted 9–29 August in 2019. Twenty-two sampling sites were visited within a total investigation area covering 8,000 km2 (Figure 1). Crustacean larvae were collected using a bongo net, with a 330-μm mesh size and 80-cm mouth diameter, equipped with a flow meter in the net opening. The net was hauled vertically from 300-m deep (or 10 m above the bottom at sampling sites in depths of <300 m) to the surface at a speed of 2 m s–1. After the net was retrieved, the samples were fixed in 70% ethanol solution. Upon returning to the laboratory, all fixed samples were transferred to a new bottle and preserved in 95% ethanol solution at −20°C for subsequent analysis. Before DNA extraction, the samples were placed in distilled water for 10 min at room temperature. Next, an entire sample was emptied into a counting tray and scanned for crustacean larvae under a stereo-dissecting microscope at 20–50× magnification (Olympus SZX71; Japan), until exhaustion of the sample. Each crustacean larva was identified to the lowest taxonomic level based on general morphological characteristics, following the guilds described by Anger (2001).
Figure 1
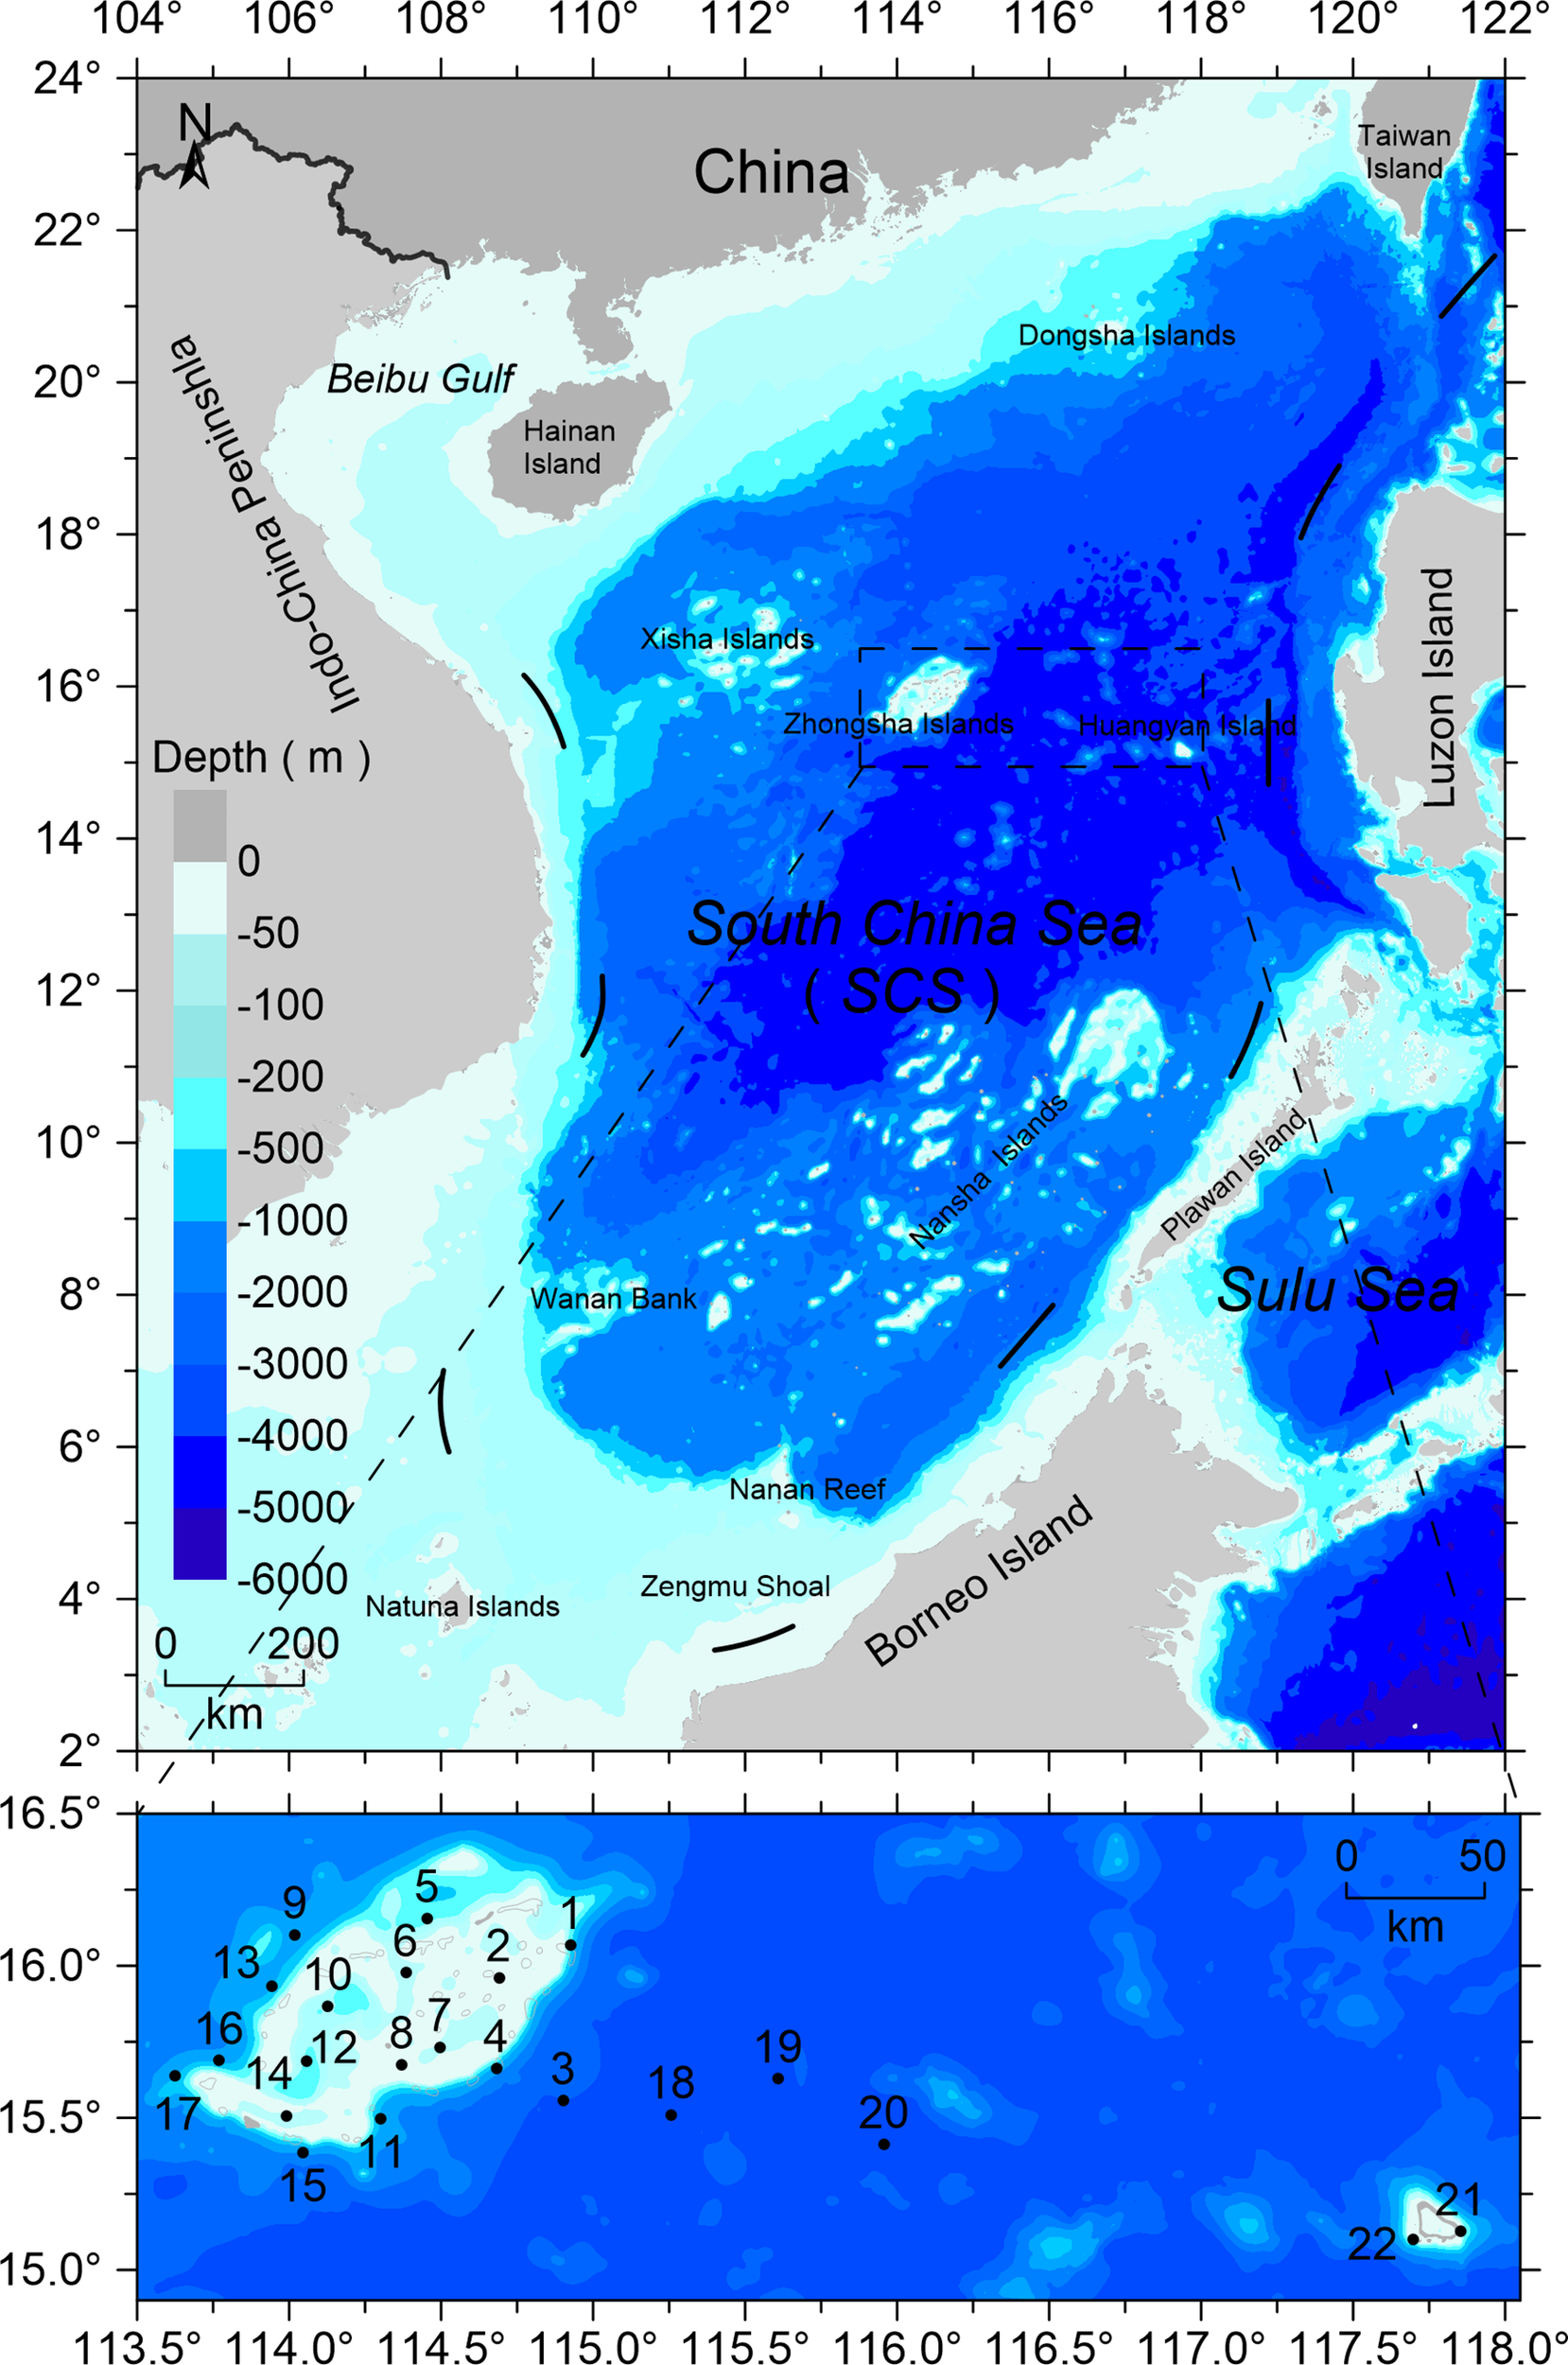
Map showing the 22 sampling sites around the Zhongsha Islands, South China Sea.
DNA Extraction
Total genomic DNA was extracted from crustacean larvae individuals using the Wizard Genomic DNA Purification Kit (Promega, USA). Here, we modified the standard DNA extraction protocol as follows (Xu et al., 2011): each specimen was picked out of the 95% ethanol solution, rinsed with distilled water, transferred to a reaction tube. Next, we added 200 μL of preheating cell-lysis solution (65°C) and 3 μL of proteinase K (20 mg mL–1) then incubated the mixture for 2 h at 65°C after vortexed, and then for 24 h at 55°C with addition of 2 μL of fresh Proteinase K. After that, we added 200 μL of precipitation solution, vortexed at a middle speed for 20 s, and then centrifuged at RCF 19,000×g for 15 min at 4°C. Then, we removed the supernatant and transferred it to a new 500-μL microcentrifuge tube with 200 μL of isopropanol, centrifuged at RCF 19,000×g for 1 min at 4°C, decanted the supernatant. Finally, the pellet was washed with 70% ethanol and dissolved in 50 μL of DNA hydration solution then stored at −20°C. All the collected specimens and the extracted DNA were stored at the Guangdong Provincial Key Laboratory of Fishery Ecology and Environment. The concentration of each DNA extraction was measured using a NanoDrop ND-1000 spectrophotometer (NanoDrop Technologies, USA). Only the DNA samples with an A260/A280 ratio of 1.8–2.1 were used as template for subsequent PCR amplification.
PCR Amplification and Sequencing
The barcoding fragment of the mitochondrial cytochrome c oxidase subunit I gene was amplified from genomic DNA using PCR with the universal primers LCO1490 and HCO2198 (Folmer et al., 1994). Each 30-µL PCR reaction consisted of 3 µL of PCR buffer, 18.75 µL of dd H2O, 2.4 µL of 25 M MgCl2, 3 µL of Coral Load Concentrate, 0.3 µL of 25 M solution of each primer, 0.6 µL of 10 M dNTPs, 0.15 µL of TopTaq DNA Polymerase (QIAGEN, Germany) and 1.5 µL of DNA template. The PCR conditions for amplification were: 35 cycles of 30 s at 96°C, 30 s at 51°C and 60 s at 72°C, followed by 7 min at 72°C on a 2720 Thermal Cycler (Applied Biosystems, USA). For some individuals for which we were unsuccessful with the Folmer primers, we also used a specific set of primers for decapods (Costa et al., 2007), following the protocols specified by the authors. The PCR products were sequenced bi-directionally on an ABI PRISM 3130XLDNA Analyzer.
DNA Identification
The authenticity of all COI sequences wasfirst verified in GenBank by BLAST search, which compares sequences for the highest match (98–100%). Sequences corresponding to maximum species identity were downloaded for the subsequent analysis. All sequences were then assembled and examined with BioEdit (Hall, 1999), aligned using the ClustalW progressive algorithm under default options, as no indels were found. To evaluate taxonomic units from DNA identification, we applied two different methods: Automatic Barcode Gap Discovery analysis (ABGD; Puillandre et al., 2012) and the Generalized Mixed Yule Coalescent model (GMYC; Pons et al., 2006; Fujisawa and Barraclough, 2013), to infer putative species boundaries based on the COI sequence dataset. The ABGD approach tests for the existence of the barcode gap in the distribution of the pairwise genetic distances and identifies groups of individuals united by genetic distances shorter than the gap. This was performed on the COI alignment through an online tool (https://bioinfo.mnhn.fr/abi/public/abgd) with default settings: prior limit to intraspecific diversity (P), ranging between 0.001 and 0.1; gap widths (X) = 1, using the available models JC86 (Jukes–Cantor) and K80 (Kimura). The other method, the GMYC approach, uses the maximum-likelihood method to optimize the shift in the branching patterns of the phylogenetic tree from interspecific branches (Yule model) to intraspecific branches (neutral coalescent), and it thereby identifies clusters of sequences corresponding to independently evolving entities. This approach requires a dichotomous and rooted ultrametric tree without duplicated sequences. Therefore, we reconstructed the ultrametric tree without duplicated sequences using BEAST1.8.0 (Drummond and Rambaut, 2007). Parameters for BEAST were set in BEAUti 1.8.0 (Drummond et al., 2012), assuming a coalescent model with constant population size, uncorrelated relaxed clock model, general time-reversible substitution model, and gamma shape site model, with a chain length of 100,000,000 iterations for Markov chain Monte Carlo simulations, and sampled every 10,000 generations. We obtained a maximum clade credibility consensus tree in TreeAnnotator v1.8.2, with the first 1,000,000 generations discarded as burn-in. The GMYC model was performed in R 3.0.1 (R Development Core Team, 2017), with “splits” package (Ezard et al., 2009).
Genetic Divergence and Phylogenetic Relationships
COI sequence divergences were calculated with the K2P (Kimura two-parameter) nucleotide substitution model in MEGA version 6.0 (Tamura et al., 2013). We used uniform rates, and standard error estimates were obtained by a NJ (neighbor-joining) bootstrap procedure with 10,000 replicates. K2P genetic distances were calculated, categorized as: intraspecific distances, interspecies distances within the congener, intergeneric distances within intrafamily, distances between different families within the same order, and distances between different orders within same class. We performed the phylogenetic analysis with all COI sequences to visually reflect the relationships of marine crustacean species and the distribution patterns of crustacean larvae at the Zhongsha Islands. Before phylogenetic analysis, we first used MrModeltest v.2.3 (Nylander, 2004) to select the best-fit models of nucleotide substitution under the AIC (Akaike information criterion). Bayesian inference analysis was performed using MrBayes v.3.1.2 (Huelsenbeck et al., 2001). MCMC simulationswere run in four parallel chains for 2,000,000 generations, sampling every 1,000 generations. Majority rule consensus trees were reconstructed after discarding the burn-in of 500 and displayed using TreeView v.1.6.6 (Page, 1996).
Results
DNA Identification and Phylogenetic Analysis
In total, we analyzed 135 sequences in our COI dataset, namely the 108 partial sequences of COI obtained from crustacean larvae collected from the Zhongsha Islands waters, and the 27 crustacean COI sequences available from public databases (maximum species identity corresponding sequences), to ensure that the nomenclature in our study would be solid for each species (Supplementary Table S1). The length of partial sequences of the COI fragments after alignment was 539 bp (a small portion of both ends could not be used). The average base composition of the COI gene was 26.3% A, 17.7% G, 19.7% C, and 36.3% T, and the ratio of transition to transversion (Ti/Tv) was 1.11. This value is similar to that of other crustaceans (Richter et al., 2007).
DNA-based classification with ABGD method could detect a barcode gap from the COI sequence dataset and suggested that the 135 sequences represented 68 taxonomic units (confidence interval: 65–72). Two species of snapping shrimp (Alpheus dolerus and Alpheus sp.) and two species of Lucifer prawns (Lucifer typus and Lucifer sp.) were suggested as the same taxonomic units by the ABGD method (Figure 2). Nevertheless, the GMYC method supported the scenario that all analyzed sequences presented 70 taxonomic units (confidence interval: 67–74); hence, the likelihood of the null model with one taxonomic unit was significantly worse (likelihood = 588.89, likelihood ratio test = 196.56, p = 3.22 × 10⁻⁸) than the likelihood of the solution with more than one taxonomic unit (likelihood = 687.17; Figure 2). Therefore, the DNA-based classification confirmed that all 108 sequences represented typical crustaceansfound in the South China Sea, and belonged to 70 species, of 43 genera, 23 families, and 4 orders (Table 1). Comparing each of the COI sequences amplified from our samples with the sequences deposited in GenBank, 55 sequences (51%) from 27 species were recovered as species of crustaceans (sequence similarity >98%). A total of 53 sequences from 43 species showed low or no similarity matches at the species level with sequences deposited in the database, indicating that these species have not been barcoded ever. Consequently, the sequences identified to species level were uploaded to GenBank (accession numbers OM679168–OM679215). The best-fitting model fora Bayesian inference tree selected by MrModeltest 2.3 was GTR+I+G, with gamma distribution shape parameter of 0.163 and relative AIC weight of 1.000. The COI phylogenetic tree revealed fourmain well-supported clades: Amphipoda, Calanoida, Euphausiacea, and Decapoda. The clade Decapoda could be further divided into Pleocyemata and Dendrobranchiata (Figure 2). Pleocyemata was the most abundant taxon, encompassing 56.5% of the total specimens, assignable to 45 species. Dendrobranchiata and Euphausiacea followed, with 15 species (24.1% of the total specimens) and 4 species (14.8% of the total specimens), respectively. Amphipoda and Calanoida together comprised 4.6% of the total specimens and 5 species.
Figure 2
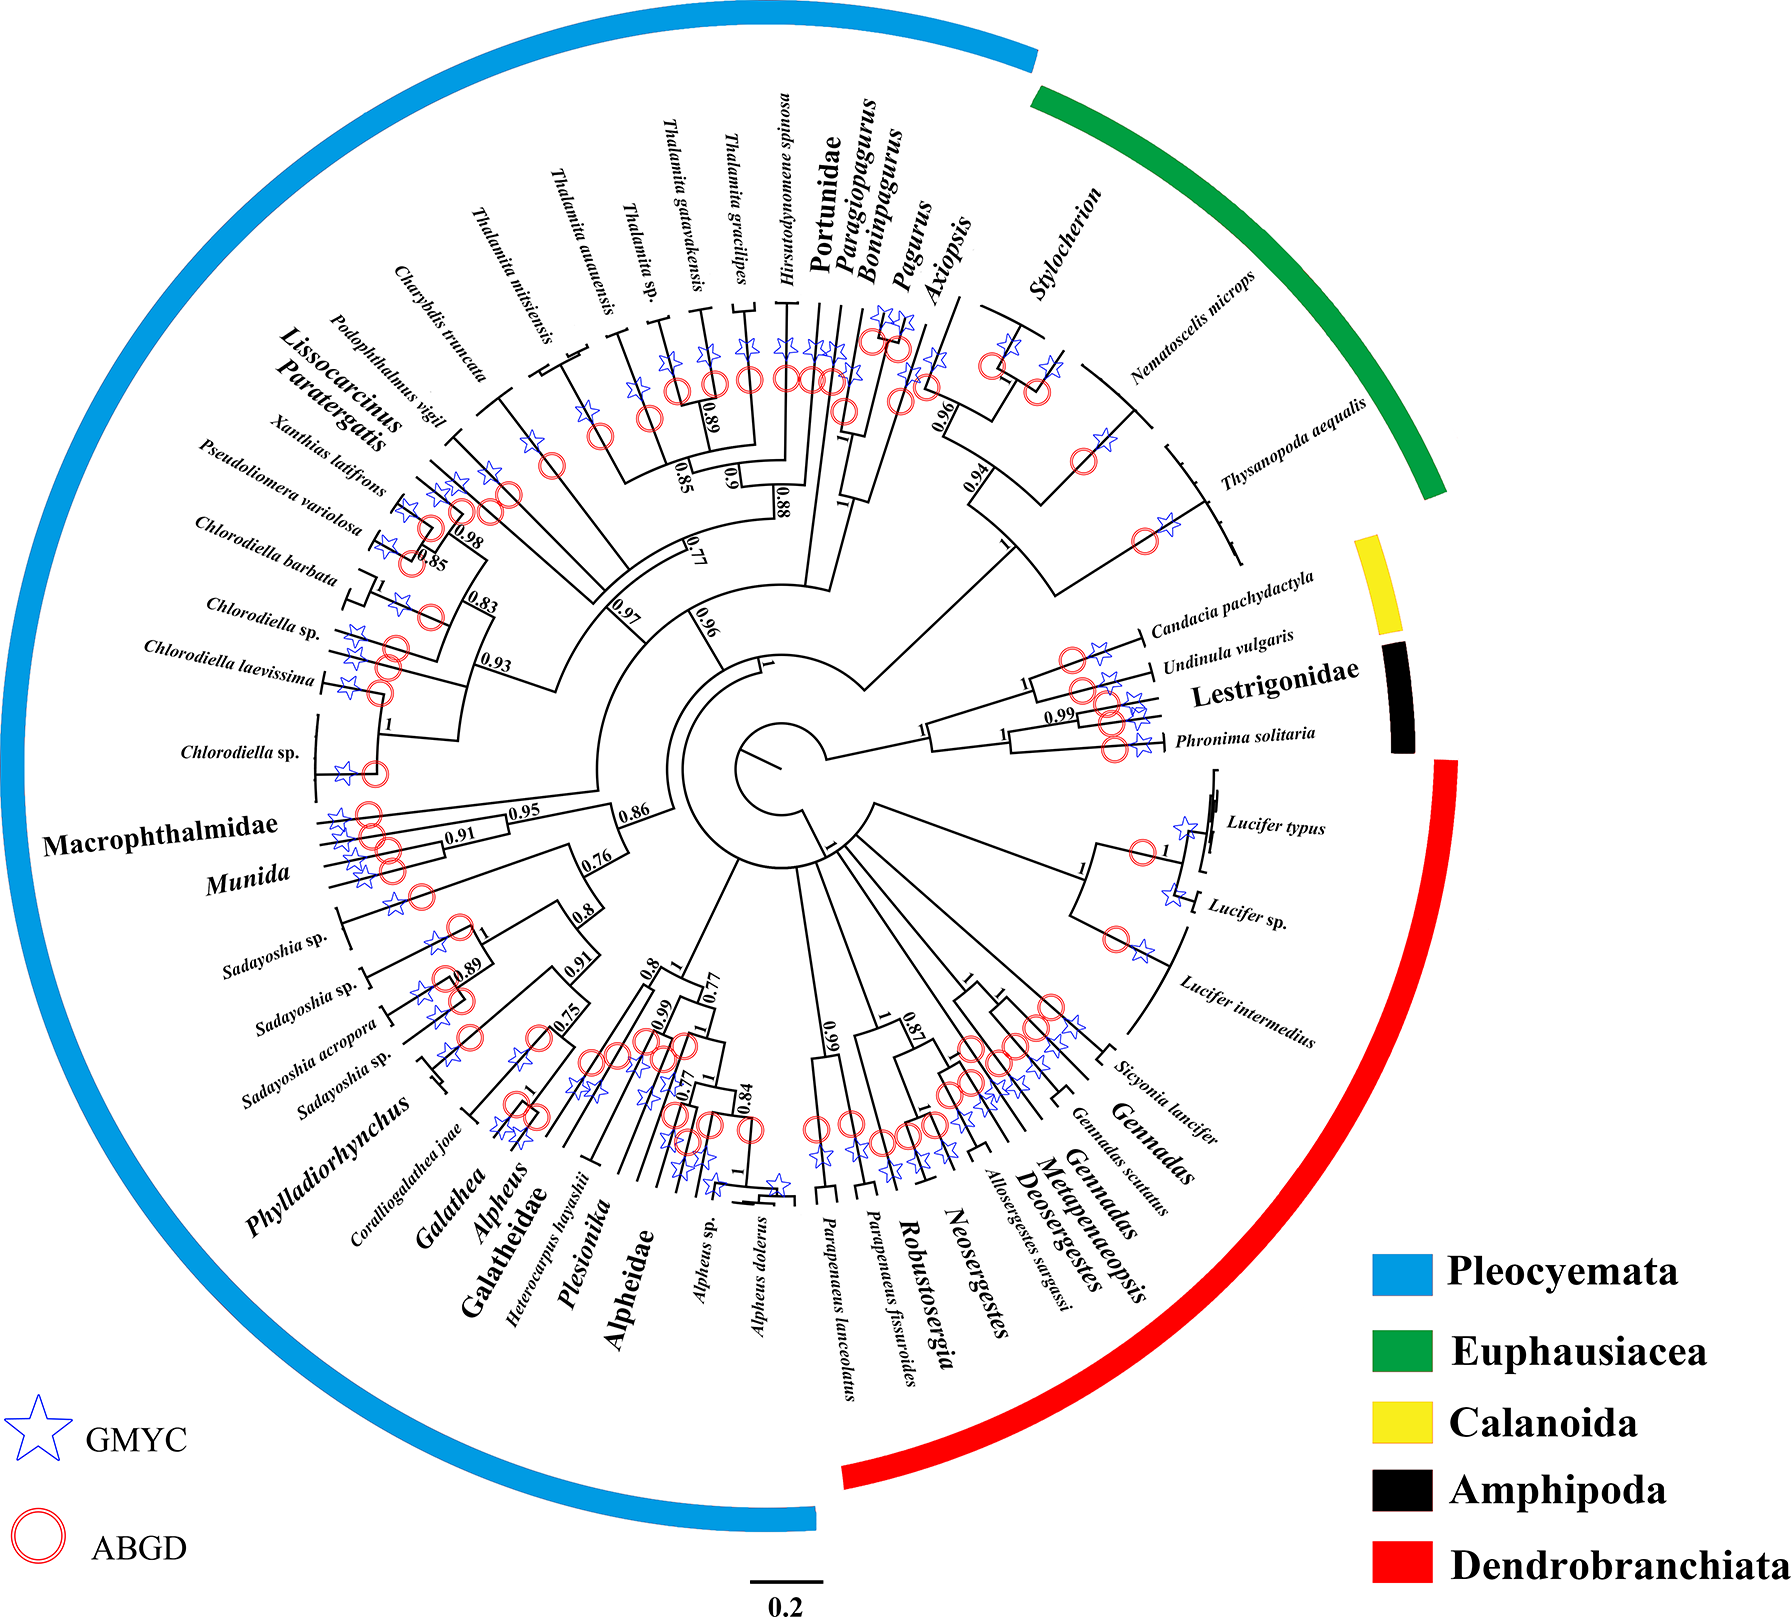
Phylogenetic tree obtained through Bayesian inference of the COI dataset for marine crustacean larvae present at the Zhongsha Islands, using MrBayes, with the scale bars proportional to substitution rates. Bayesian posterior probabilities are shown on the branches (values below 0.7 are not shown). DNA identifications through the molecular approaches (Generalized Mixed Yule Coalescent model [GMYC] and Automatic Barcode Gap Discovery analysis [ABGD]) are shown on the branches. The major clades are depicted by different colors to reflect groups of species in the same order.
Table 1
| Sequence ID | Order | Family | Genus | Species (identification based on barcode) | Similarity (%) |
|---|---|---|---|---|---|
| 6.S18TYC4 | Decapoda | Alpheidae | Alpheus | Alpheus dolerus | 99 |
| D4.S10TYC5 | Decapoda | Alpheidae | Alpheus | Alpheus dolerus | 100 |
| 26.S19TYC5 | Decapoda | Alpheidae | Alpheus | Alpheus dolerus | 100 |
| 11.S12TYC13 | Calanoida | Candaciidae | Candacia | Candaciapachydactyla | 100 |
| 1.S11TYC1 | Decapoda | Portunidae | Charybdis | Charybdis truncata | 100 |
| 36.S6TYC4 | Decapoda | Portunidae | Charybdis | Charybdis truncata | 100 |
| 33.S2TYC7 | Decapoda | Xanthidae | Chlorodiella | Chlorodiellabarbata | 94 |
| 16.S4TYC9 | Decapoda | Xanthidae | Chlorodiella | Chlorodiellabarbata | 100 |
| 43.S13TYC6 | Decapoda | Xanthidae | Chlorodiella | Chlorodiellalaevissima | 99 |
| 37.S6TYC5 | Decapoda | Xanthidae | Chlorodiella | 90 | |
| 41.S6TYC7 | Decapoda | Xanthidae | Chlorodiella | 90 | |
| 42.S5TYC2 | Decapoda | Xanthidae | Chlorodiella | 90 | |
| 28.S2TYC2 | Decapoda | Xanthidae | Chlorodiella | 90 | |
| 6.S16TYC8 | Decapoda | Xanthidae | Chlorodiella | 90 | |
| F10.S13TYC3 | Decapoda | Galatheidae | Coralliogalathea | Coralliogalatheajoae | 99 |
| 31.S3TYC10 | Decapoda | Pandalidae | Heterocarpus | Heterocarpushayashii | 99 |
| 31.S6TYC1 | Decapoda | Dynomenidae | Hirsutodynomene | Hirsutodynomene spinosa | 99 |
| 35.S13TYC6 | Decapoda | Luciferidae | Lucifer | Lucifer intermedius | 99 |
| 6.S12TYC6 | Decapoda | Luciferidae | Lucifer | Lucifer intermedius | 99 |
| E11.S8TYC7 | Decapoda | Luciferidae | Lucifer | Lucifer intermedius | 99 |
| 33.S17TYC6 | Decapoda | Luciferidae | Lucifer | Lucifer intermedius | 99 |
| 38.S17TYC12 | Decapoda | Luciferidae | Lucifer | Lucifer intermedius | 99 |
| C10.S10TYC1 | Decapoda | Luciferidae | Lucifer | Lucifer intermedius | 99 |
| A3.S9TYC3 | Decapoda | Luciferidae | Lucifer | Lucifer typus | 99 |
| 3.S21TYC3 | Decapoda | Luciferidae | Lucifer | Lucifer typus | 99 |
| 7.S6TYC9 | Decapoda | Luciferidae | Lucifer | Lucifer typus | 99 |
| 7.S12TYC7 | Decapoda | Luciferidae | Lucifer | Lucifer typus | 99 |
| C4.S9TYC18 | Decapoda | Luciferidae | Lucifer | Lucifer typus | 99 |
| 27.S3TYC6 | Euphausiacea | Euphausiidae | Nematoscelis | Nematoscelismicrops | 99 |
| 30.S14TYC6 | Euphausiacea | Euphausiidae | Nematoscelis | Nematoscelismicrops | 99 |
| 15.S7TYC8 | Euphausiacea | Euphausiidae | Nematoscelis | Nematoscelismicrops | 99 |
| 13.S15TYC9 | Euphausiacea | Euphausiidae | Nematoscelis | Nematoscelismicrops | 99 |
| 28.S17TYC1 | Decapoda | Penaeidae | Parapenaeus | Parapenaeusfissuroides | 99 |
| 36.S14TYC12 | Decapoda | Penaeidae | Parapenaeus | Parapenaeuslanceolatus | 99 |
| 22.S1TYC4 | Amphipoda | Phronimidae | Phronima | Phronima solitaria | 99 |
| 11.S15TYC3 | Decapoda | Portunidae | Podophthalmus | Podophthalmus vigil | 99 |
| 29.S22TYC1 | Decapoda | Xanthidae | Pseudoliomera | Pseudoliomeravariolosa | 99 |
| 11.S4TYC4 | Decapoda | Munididae | Sadayoshia | Sadayoshiaacropora | 99 |
| 30.S17TYC3 | Decapoda | Sicyoniidae | Sicyonia | Sicyonialancifer | 99 |
| B1.S9TYC2 | Decapoda | Portunidae | Thalamita | Thalamitaauauensis | 99 |
| 25.S3TYC4 | Decapoda | Portunidae | Thalamita | Thalamitagatavakensis | 99 |
| 24.S3TYC3 | Decapoda | Portunidae | Thalamita | Thalamitagracilipes | 97 |
| 47.S16TYC1 | Decapoda | Portunidae | Thalamita | Thalamitamitsiensis | 98 |
| 5.S16TYC7 | Decapoda | Portunidae | Thalamita | Thalamitamitsiensis | 100 |
| 13.S4TYC6 | Decapoda | Portunidae | Thalamita | Thalamitamitsiensis | 99 |
| 17.S3TYC1 | Euphausiacea | Euphausiidae | Thysanopoda | Thysanopodaaequalis | 99 |
| 27.S14TYC8 | Euphausiacea | Euphausiidae | Thysanopoda | Thysanopodaaequalis | 99 |
| 15.S15TYC11 | Euphausiacea | Euphausiidae | Thysanopoda | Thysanopodaaequalis | 99 |
| 3.S15TYC2 | Euphausiacea | Euphausiidae | Thysanopoda | Thysanopodaaequalis | 99 |
| 15.S20TYC3 | Euphausiacea | Euphausiidae | Thysanopoda | Thysanopodaaequalis | 99 |
| 23.S3TYC4 | Euphausiacea | Euphausiidae | Thysanopoda | Thysanopodaaequalis | 99 |
| B6.S9TYC5 | Calanoida | Candaciidae | Undinula | Undinula vulgaris | 99 |
| B11.S9TYC9 | Decapoda | Xanthidae | Xanthias | Xanthiaslatifrons | 99 |
| 37.S5TYC1 | Amphipoda | Hyperiidae | Hyperietta | 88 | |
| 21.S17TYC5 | Amphipoda | Lestrigonidae | Phronimopsis | 90 | |
| 1.S12TYC1 | Decapoda | Galatheidae | Galathea | 93 | |
| 17.S22TYC2 | Decapoda | Galatheidae | Galathea | 95 | |
| 9.S4TYC2 | Decapoda | Munididae | Sadayoshia | 93 | |
| 19.S17TYC3 | Decapoda | Munididae | Sadayoshia | 93 | |
| 6.S4TYC10 | Decapoda | Munididae | Sadayoshia | 93 | |
| 26.S22TYC11 | Decapoda | Munididae | Munida | 90 | |
| 21.S22TYC6 | Decapoda | Munididae | Munida | 92 | |
| 31.S22TYC3 | Decapoda | Munididae | Munida | 90 | |
| 7.S18TYC3 | Decapoda | Munididae | Sadayoshia | 91 | |
| 44.S13TYC7 | Decapoda | Munididae | Sadayoshia | 90 | |
| 12.S16TYC14 | Decapoda | Munididae | Sadayoshia | 90 | |
| 23.S14TYC2 | Decapoda | Galatheidae | Phylladiorhynchus | 90 | |
| A4.S9TYC1 | Decapoda | Galatheidae | Phylladiorhynchus | 90 | |
| 35.S4TYC3 | Decapoda | Galatheidae | Phylladiorhynchus | 90 | |
| 2.S4TYC6 | Euphausiacea | Euphausiidae | Stylocherion | 90 | |
| 8.S6TYC10 | Euphausiacea | Euphausiidae | Stylocherion | 96 | |
| 25.S19TYC4 | Euphausiacea | Euphausiidae | Stylocherion | 96 | |
| 2.S21TYC2 | Euphausiacea | Euphausiidae | Stylocherion | 96 | |
| 25.S22TYC10 | Euphausiacea | Euphausiidae | Stylocherion | 96 | |
| 22.S19TYC1 | Euphausiacea | Euphausiidae | Stylocherion | 93 | |
| 20.S20TYC8 | Decapoda | Luciferidae | Lucifer | Lucifer typus | 97 |
| 4.S4TYC8 | Decapoda | Luciferidae | Lucifer | Lucifer typus | 97 |
| E5.S8TYC2 | Decapoda | Penaeidae | Metapenaeopsis | 89 | |
| A9.S9TYC8 | Decapoda | Benthesicymidae | Gennadas | Gennadasscutatus | 98 |
| 19.S14TYC3 | Decapoda | Benthesicymidae | Gennadas | 86 | |
| 39.S6TYC6 | Decapoda | Benthesicymidae | Gennadas | 85 | |
| 14.S20TYC2 | Decapoda | Sergestidae | Allosergestes | Allosergestessargassi | 97.6 |
| 8.S21TYC3 | Decapoda | Sergestidae | Deosergestes | 90 | |
| 9.S12TYC11 | Decapoda | Sergestidae | Robustosergia | 94 | |
| 19.S20TYC7 | Decapoda | Sergestidae | Neosergestes | 90 | |
| 40.S13TYC9 | Decapoda | Sergestidae | Neosergestes | 90 | |
| 15.S4TYC8 | Decapoda | Sergestidae | Neosergestes | 87 | |
| 34.S4TYC2 | Decapoda | Alpheidae | Alpheus | 95 | |
| 14.S12TYC3 | Decapoda | Palaemonidae | Macrobrachium | 83 | |
| 24.S22TYC9 | Decapoda | Alpheidae | Alpheus | 83 | |
| 40.S6TYC7 | Decapoda | Alpheidae | Alpheus | 85 | |
| 28.S3TYC7 | Decapoda | Alpheidae | Alpheus | Alpheus dolerus | 98 |
| 14.S16TYC2 | Decapoda | Alpheidae | Alpheus | 90 | |
| 9.S15TYC6 | Decapoda | Pandalidae | Plesionika | 92 | |
| 32.S14TYC9 | Decapoda | Galatheidae | Lauriea | 84 | |
| 2.S16TYC4 | Decapoda | Pilumnidae | Pilumnus | 86.8 | |
| 8.S18TYC4 | Decapoda | Macrophthalmidae | Macrophthalmus | 85 | |
| 9.S16TYC11 | Decapoda | Xanthidae | Liomera | 87 | |
| 42.S13TYC5 | Decapoda | Xanthidae | Paratergatis | 93 | |
| 32.S19TYC2 | Decapoda | Portunidae | Lissocarcinus | 90 | |
| 20.S3TYC2 | Decapoda | Portunidae | Thalamita | 88 | |
| 12.S18TYC8 | Decapoda | Portunidae | Thalamita | 99 | |
| 13.S18TYC9 | Decapoda | Portunidae | Thalamita | Thalamitagatavakensis | 99.3 |
| 48.S16TYC2 | Decapoda | Paguridae | Pagurus | 89 | |
| 16.S15TYC12 | Decapoda | Parapaguridae | Paragiopagurus | 91 | |
| 3.S16TYC5 | Decapoda | Paguridae | Boninpagurus | 87 | |
| 35.S5TYC12 | Decapoda | Axiidae | Axiopsis | 93 | |
| C1.S9TYC16 | Decapoda | Axiidae | Axiopsis | 93.5 |
Summary of identification based on species barcode using BLAST search from GenBank.
Genetic Divergence and Distribution Pattern
The uncorrected K2P pairwise distances within species averaged 0.81% and ranged from 0 to 4.04%. The congeneric divergences averaged 11.99%, and varied from the lowest of 5.18% in Parapenaeus to the highest of 17.82% in Alpheus. The confamilial divergences averaged 16.01%, varied from 11.14% (Sergestidae) to 19.56% (Candaciidae), and the divergences within orders averaged 23.12%, varied from 19.11% (Calanoida) to 26.79% (Decapoda; Tables 2, S2). The frequency distribution of pairwise K2P distances is shown in Figure 3. It displayed a notable gap of 3.5–10.7% between intraspecific and interspecific distances within theentire sequence dataset.
Table 2
| Comparisons within | Minimum | Mean distance | Maximum | S.E. |
|---|---|---|---|---|
| Species | 0 | 0.81 | 4.04 | ± 0.28 |
| Genera | 5.18 | 11.99 | 17.82 | ± 1.27 |
| Families | 11.14 | 16.01 | 19.56 | ± 1.47 |
| Orders | 19.11 | 23.12 | 26.79 | ± 1.83 |
| Classes | 24.74 | 33.14 | 36.29 | ± 2.32 |
Summary of pairwise mitochondrial cytochrome c oxidase I (COI) barcode nucleotide divergences within various taxonomic levels, using K2P distances (%).
Figure 3
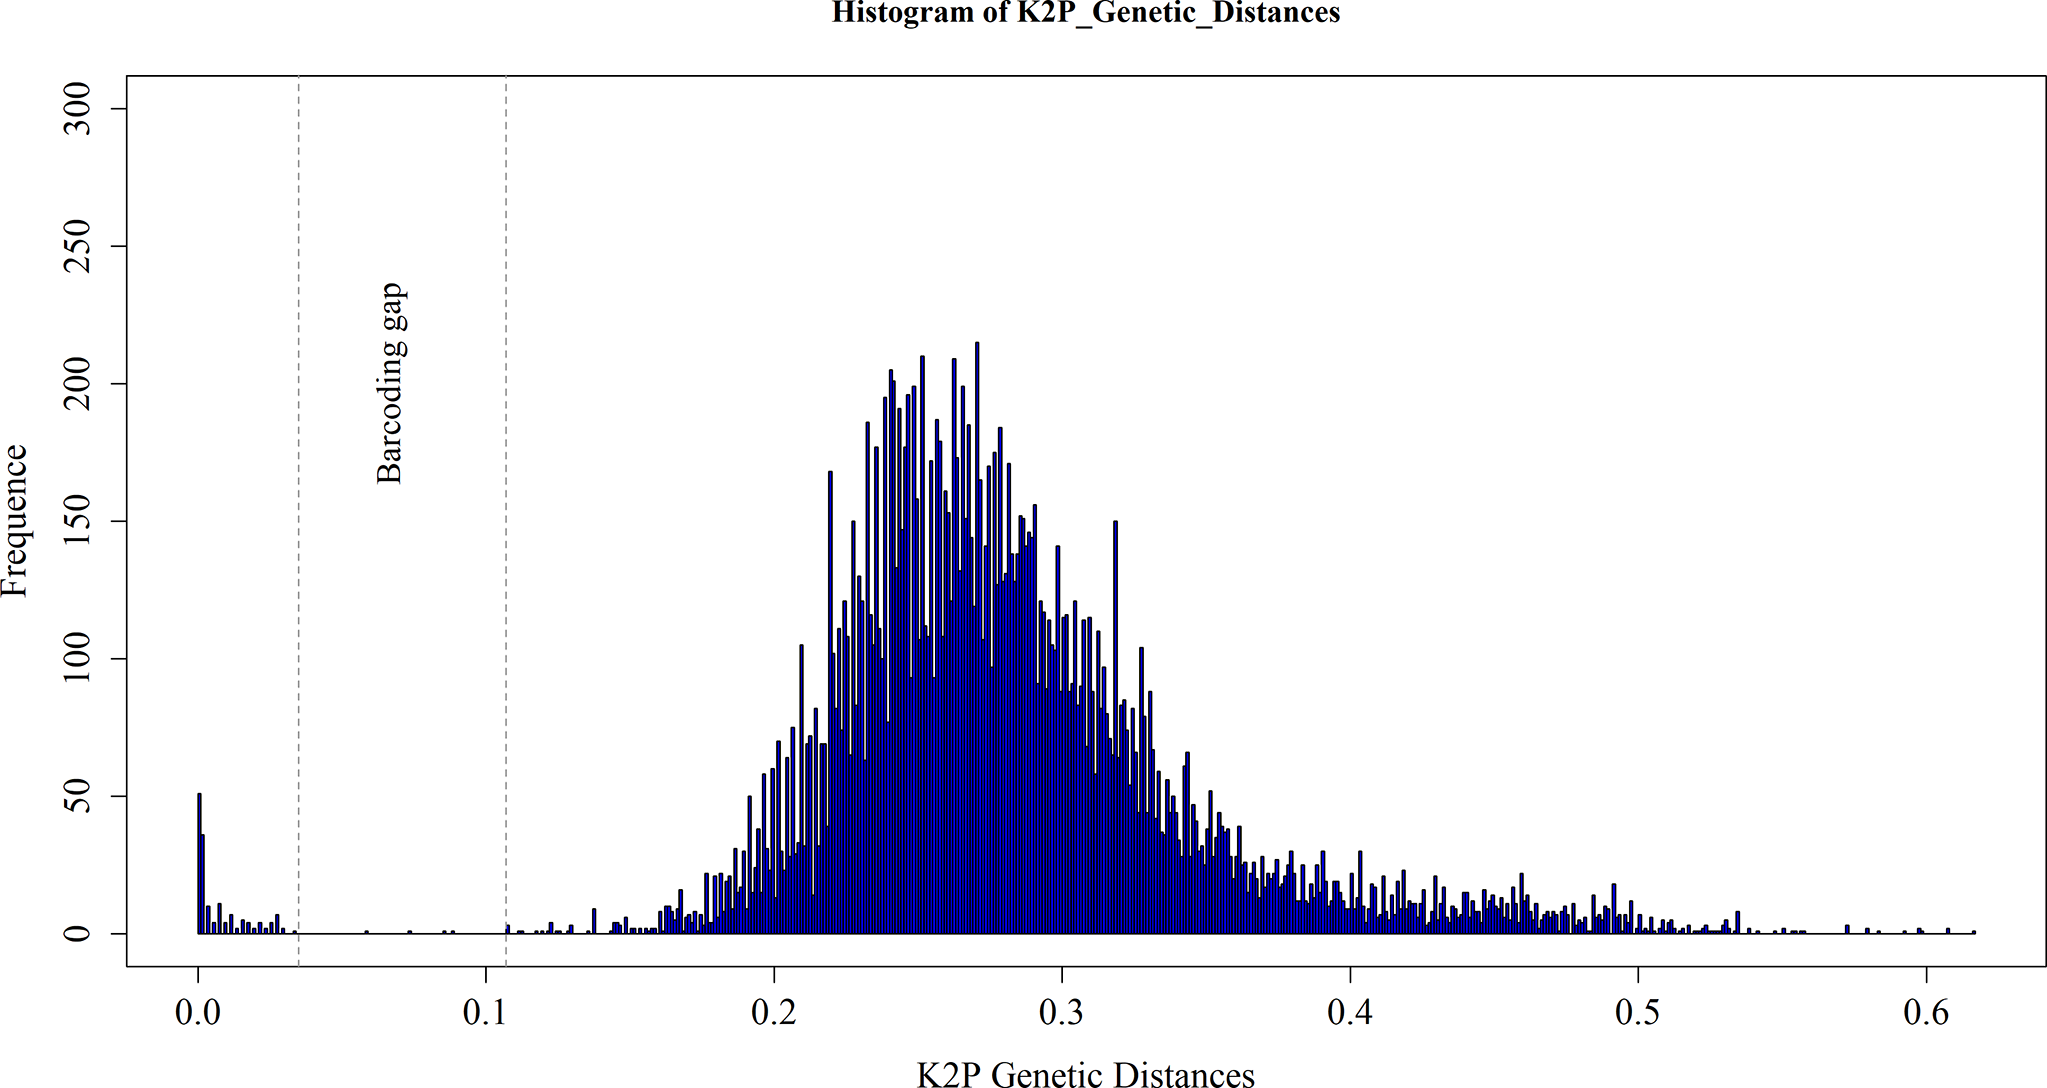
Frequency distributions of intraspecific and interspecific pairwise genetic K2P distances based on all marine crustacean larvae sampled at the Zhongshan Islands. The area between dashed lines shows the “barcoding gap” between the intra- and interspecific distances.
The spatial distribution of the crustacean larvae in the Zhongsha Islands waters is shown in Figure 4. High crustacean species numbers were found in western (sites 9 and 16) and southeastern (site 4) areas, while low species numbers were found in northeastern (site 1) and southern (sites 11 and 7) areas of the Zhongsha Islands. Larvae of Decapoda were recorded from all sampling sites except site 1; larvae of Amphipoda were only found at the edge of the Zhongsha Islands; larvae of Calanoida appeared only in the western area at the islands; and larvae of Euphausiacea were mainly distributed at the outer edge of Zhongsha Atoll and in the area between the atoll and Huangyan Island.
Figure 4
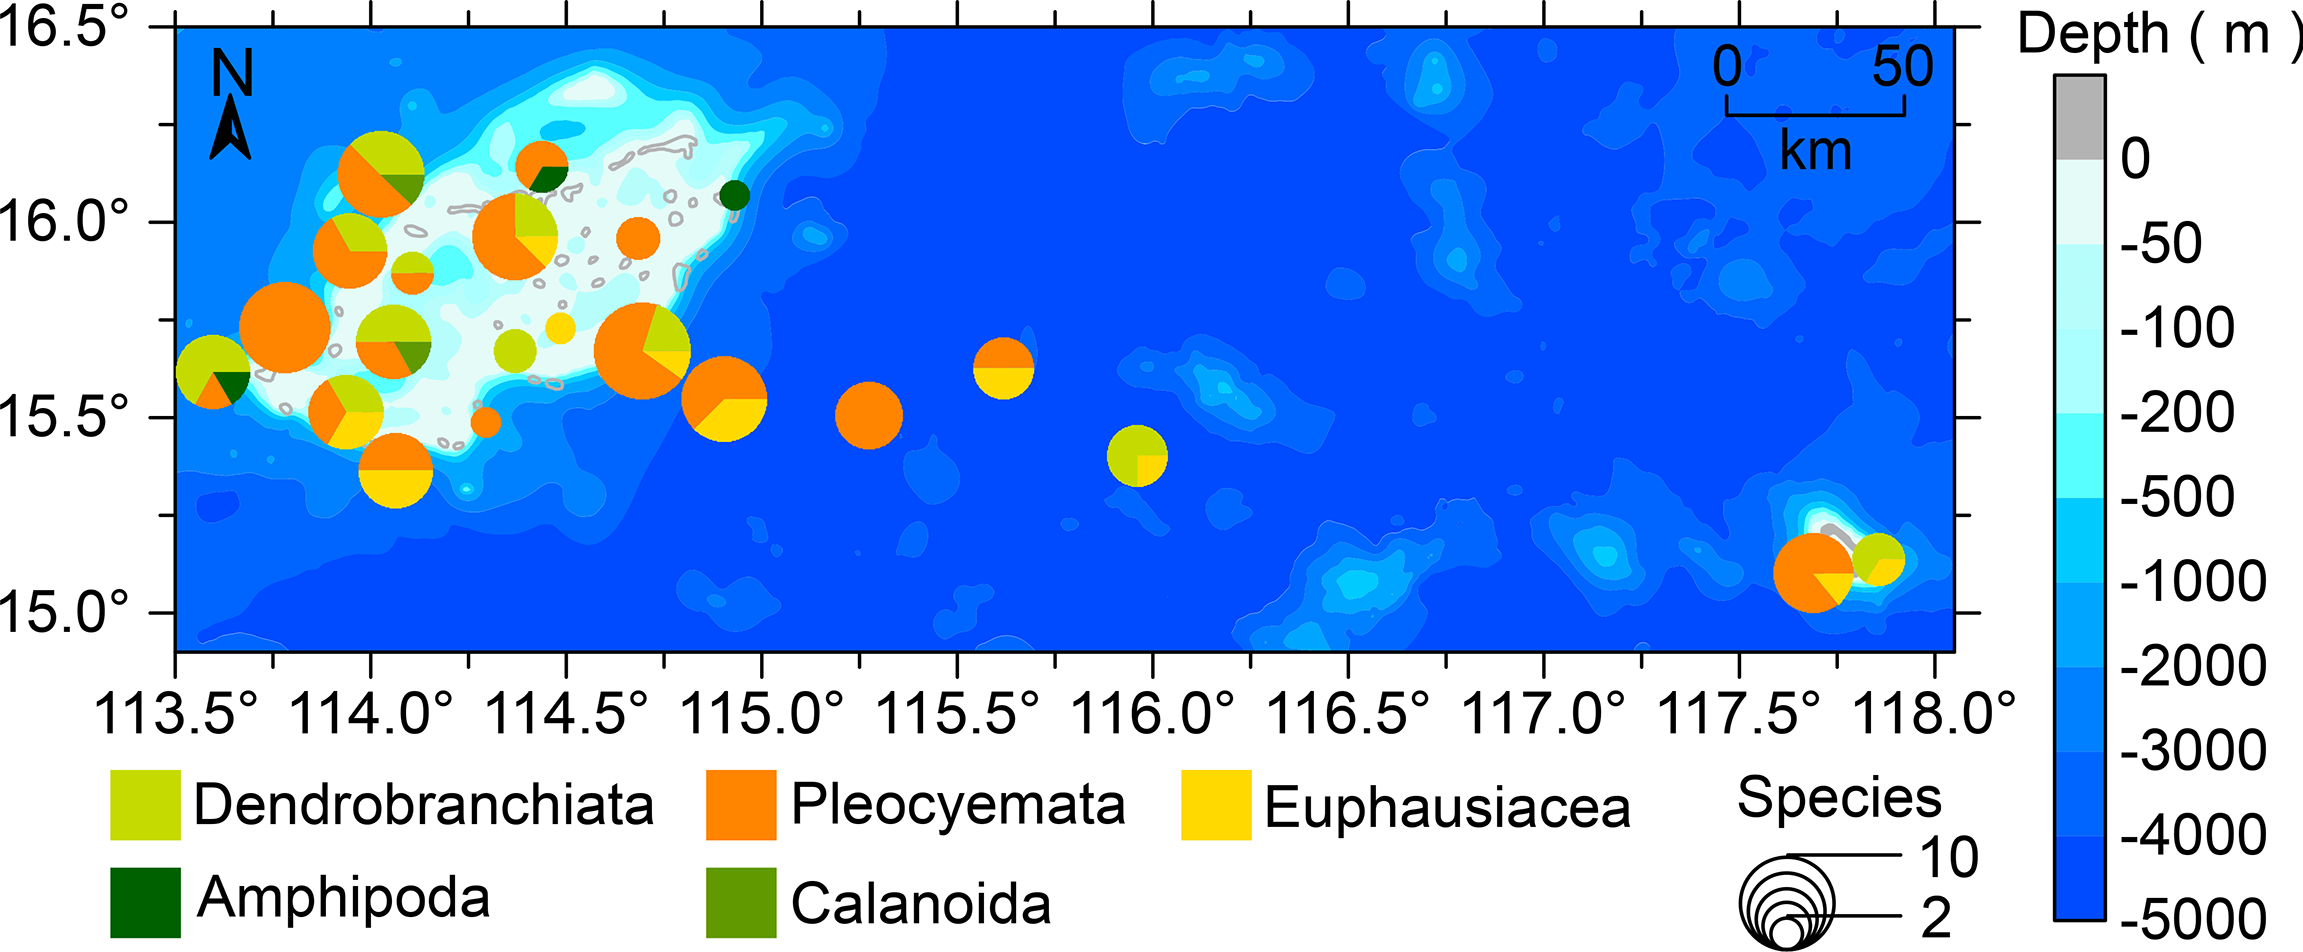
The species composition and spatial distributions of marine crustacean larvae collected at the Zhongsha Islands, South China Sea.
Discussion
The South China Sea is regarded as one of thecenters of world marine biodiversity, which holds particular attraction for biodiversity researchers globally (Barber et al., 2000). The South China Sea biota is rich in warm-water species, comprising subtropical and tropical fauna of the Indo-Pacific biotic region, paralleled with the Philippines–Indonesia–New Guinea Coral Triangle as one of the typical tropical faunal centers. Crustaceans are the second-most-diverse group of marine metazoans in the South China Sea. Previous surveys and studies have together recorded a total of at least 2,150 species of crustaceans in the South China Sea (Liu, 2013). In our study, two DNA identification approaches, ABGD and GMYC, suggested that the 108 sequences obtained from marine crustacean larvae matched 68 and 70 species, respectively. Two species of snapping shrimp (Alpheus dolerus and Alpheus sp.) and two species of Lucifer prawns (L. typus and Lucifer sp.) were suggested as the same taxonomic units by ABGD. The results of the two molecular approaches were largely consistent. Our previous studies of fishes in the South China Sea similarly indicated that sibling or cryptic species are common among marine organisms (Trevor and Marti, 2003; Radulovici et al., 2009; Xu et al., 2019; Xu et al., 2021).
The efficacy of DNA barcoding is based on the assumption that the same species will have similar DNA barcodes representing their intraspecific variation, while interspecific divergence will far exceed intraspecific divergence. A clear “barcode gap” could be observed between the intraspecific and interspecific divergences (Figure 3). Intraspecific divergences are usually less than 1%, and rarely more than 2%, when the COI genes are used as DNA barcoding for animal species (Hebert et al., 2003). In our study, the intraspecific K2P distances for marine crustacean larvae ranged from 0 to 4.04% (average 0.81%). The highest intraspecific divergence (4.04%) was still below the common species identity cutoff value of 5% that has been used for both insects and crustaceans (Čandek and Kuntner, 2015; Karanovic, 2015). Intraspecific divergence values obtained in our study are common for crustaceans that have been precisely identified, though the values can be highly variable from one to another crustaceanspecies. For example, Jeffery et al. (2011)reported that intraspecific divergences in the Branchiopoda ranged from 0 to 3.4%, and Matzen da Silva et al. (2011) reported intraspecific divergences in Decapoda ranging between 0and 4.6%. However, the intraspecific divergence can be even higher in some crustacean groups. Aguilar et al. (2017) found the highest intraspecific divergence in Branchinectalindahli (order Anostraca) was 7.4%; Radulovici et al. (2009) reported that the highest intraspecific divergence in Ampeliscaeschrichtii (Amphipoda) reached 13.6%. Weiss et al. (2014) reported the highest range of intraspecific divergences in crustaceans, with the intraspecific divergences of Gammarus fossarum (Amphipoda) ranging from 0 to 23.3% (average 14.4%); the genetic divergence values among individuals within Gammarus were even higher than interspecific divergences among some crustaceans. However, because the genetic divergence values appeared extreme, Weiss et al. (2014) suggested that G. fossarum is a species complex of several highly divergent species. The congeneric divergences in our data ranged from 5.18 to 17.82% and averaged 11.99%. Such a wide range of genetic divergences within congeneric species indicates that some taxa are more divergent from each other. For instance, the average congeneric divergence within genus Parapenaeus was 5.18%, considerably lower than 17.82% divergence within the genus Alpheus. These different values between genera perhaps reflect the average evolutionary time of congeneric species, as some species within genera will differentiate before others.
Previous studies proved that DNA barcoding is a reliable, rapid, and effective tool for precise species identification of morphologically similar crustacean larvae, such as through matching the COI sequences of unknown larvae with the available sequences of previously described adults in databases (Barber and Boyce, 2006; Webb et al., 2006; Tang et al., 2010; Kusbiyanto et al., 2020). In our study, the DNA identification method using the GMYC model suggested that the 108 sequences obtained from crustacean larvae represented 70 species. However, only 55 specimens (51%) of the larvae of 27 crustacean species matched with the COI sequences taken from adults of previously described species in the database. Altogether, 53 sequences from larvae of 43 species showed no or low similarity matches on the species level with sequences in the database, indicating that these species had never before been barcoded. Thus, our results imply that a minimum of three-fifths of additional marine crustacean species in the Zhongsha Islands waters are not yet described in their adult forms. Similar studies have reported on other sea areas. For example, Webb et al. (2006) reported that the majority of Antarctic marine crustacean larvae (60%) could be identified only to family level by matching the COI sequences with the database, and some were only identifiable to phylum or subphylum because of a lack of comparator sequences in databases. Barber and Boyce (2006) likewise found that only about 20% of the larval stomatopods collected in the Red Sea could be identified, while most of the adult forms represented yet undiscovered or undescribed species. Therefore, identifying novel DNA sequences is problematic in that a species definition cannot be assigned to the sequence without morphological identification. Together, these studies, including our reported cases, imply that the success rate of DNA identification largely depends on broad coverage of DNA barcodes for known species. Once the public databases are sufficiently complete, these query sequences, aided by the query-optimized search library, might be readily matched with reference sequences and assigned to reasonable species.
Our study not only confirms the utility of DNA barcoding for the identification of marine crustacean larvae but also provides insights into the diversity and distribution of crustaceans in the Zhongsha Islands waters. Crustaceans are one of the most speciose groups of coral reef fauna, comprising approximately 20% of all invertebrate species (Kramer et al., 2014). Our finding of numerous species in such restricted habitat types, water depths, and relatively small area, with at least three-fifths of the species seemingly not yet described, suggests that crustacean diversity at the Zhongsha Islands has been seriously underestimated until now.We found that more than 80% of the crustacean larvae belonged to the order Decapoda, which are mostly larger-bodied species. The orders Calanoida and Amphipoda were represented by the fewest species. Decapods, as reef-associated crustaceans, are dominant benthic invertebrate group on the continental shelf and slope and are especially important contributors to coral reef ecosystems. For example, they can defend living corals from predators and remove parasites from fishes (Pratchett, 2001; Becker and Grutter, 2004). Several surveys of coral reef communities were carried out by international scientists in the South China Sea in the 1960s and 1990s. These surveys recorded as many as 694 species of decapods in the South China Sea and found that several species of coral-dwelling decapods are commonly found in the northern part of the South China Sea, such as Synalpheusdemani, Trapezia spp., Coralliocaris spp., Tetralia spp., and Thalamita spp. (Liu, 2013). However, except for coral reef crab Thalamita spp., we did not find larvae of the above species at the Zhongsha Islands. This difference in survey findings implies that there is potential larval dispersal between the Zhongsha Islands and adjacent areas. In addition, understanding the nature of marine crustacean larval dispersal is key to understanding the evolution and dynamics of marine crustacean populations and for implementing effective stock management and conservation plans (Largier, 2003). Our results revealed notable differences in the distributions of larvae of different crustacean species present in the Zhongsha Islands waters. The species numbers were higher in the northwestern and southeastern areas of the Zhongsha Atoll, and lower in sites at the northeastern edge. Amphipoda larvae were only found at the edge of the Zhongsha Atoll, and Calanoida larvae appeared in the western part of the atoll. The distribution of crustacean larvae in the Zhongsha Islands waters is doubtlessly related to oceanographic features. The surface currents at the Zhongsha Islands are strongly influenced by the East Asian Monsoon cycle; the surface current is northeastward during the summer monsoon, and southwestward during the winter monsoon (Yang et al., 2002). The upwelling water causes by the monsoon would promote larval dispersal and provides sufficient food sources, for example supporting the highly diverse crustacean larvae in the western part of the Zhongsha Atoll. Furthermore, the variety of microhabitats on coral reefs creates shelter for crustacean larvae, helping to maintain higher survival. Since coral reefs worldwide currently face a variety of environmental and anthropogenic pressures, comprehensive understanding of crustacean larvae community structure, and the ecological processeson coral reef would establish a basis for the restoration and protection of coral reef ecosystems.
Conclusion
Our study demonstrates DNA barcoding as a reliable, rapid, and effective tool for precise species identification of morphologically similar marine crustacean larvae, such as those collected from the Zhongsha Islands waters. However, sequences obtained from larvae of only 27 species were matched with the COI sequences taken from previously described adults in the BOLD database. Consequently, less than half of the crustacean larvae collected in the present study at the Zhongsha Islands could be identified to species. This outcome was not a failure of the DNA barcoding methodology, yet it reflects that the crustacean diversity at the islands has been seriously underestimated until now.
Our study shows that the success rate of DNA identification largely depends on broad coverage of DNA barcodes for known species. However, without adequate taxonomic descriptions for all known species, barcode sequences can lose much of their value. More than 80% of the marine crustacean larvae collected in the Zhongsha Islands waters belonged to the order Decapoda, which are relatively large-bodied species. The orders Calanoida and Amphipoda were represented by the fewest species and these larvae appeared only at the edge of Zhongsha Atoll.
Funding
This study was funded by Science and Technology Basic Resources Investigation Program of China (2018FY100105, 2017FY201405) and Fund of Guangdong Provincial Key Laboratory of Fishery Ecology and Environment (FEEL-2019-9).
Publisher’s Note
All claims expressed in this article are solely those of the authors and do not necessarily represent those of their affiliated organizations, or those of the publisher, the editors and the reviewers. Any product that may be evaluated in this article, or claim that may be made by its manufacturer, is not guaranteed or endorsed by the publisher.
Statements
Data availability statement
The datasets presented in this study can be found in online repositories. The names of the repository/repositories and accession number(s) can be found in the article/Supplementary Material.
Author contributions
LX: conceptualization, methodology, formal analysis, data curation, writing—original draft, writing—review and editing. LW, JN, DH, YL, and SL: methodology and formal analysis. XW and FD: funding acquisition, project administration, and resources. All authors contributed to the article and approved the submitted version.
Acknowledgments
We thank all colleagues and students for their help with sampling. Cynthia Kulongowski with Liwen Bianji (Edanz; https://www.liwenbianji.cn) assisted with editing the language of a draft of this manuscript.
Conflict of interest
The authors declare that the research was conducted in the absence of any commercial or financial relationships that could be construed as a potential conflict of interest.
Supplementary material
The Supplementary Material for this article can be found online at: https://www.frontiersin.org/articles/10.3389/fmars.2022.932678/full#supplementary-material
References
1
Aguilar A. Maeda-Martínez A. M. Murugan G. Obregón-Barboza H. Christopher Rogers D. McClintock K. et al . (2017). High Intraspecific Genetic Divergence in the Versatile Fairy Shrimp Branchinecta Lindahli With a Comment on Cryptic Species in the Genus Branchinecta (Crustacea: Anostraca). Hydrobiologia801 (1), 59–69. doi: 10.1007/s10750-017-3283-3
2
Alford R. A. Jackson G. D. (1993). Do Cephalopods and Larvae of Other Taxa Grow Asymptotically? Am. Nat.141 (5), 717–728. doi: 10.1086/285501
3
Anger K. (2001). The Biology of Decapod Crustacean Larvae (Rotterdam: A. A. Balkema Publishes).
4
Ballard J. W. O. Whitlock M. C. (2004). The Incomplete Natural History of Mitochondria. Mol. Ecol.13 (4), 729–744. doi: 10.1046/j.1365-294X.2003.02063.x
5
Barber P. Boyce S. L. (2006). Estimating Diversity of Indo-Pacific Coral Reef Stomatopods Through DNA Barcoding of Stomatopod Larvae. Proc. R. Soc B.273 (1597), 2053–2061. doi: 10.1098/rspb.2006.3540
6
Barber P. H. Palumbi S. R. Erdmann M. V. Moosa M. K. (2000). A Marine Wallace’s Line? Nature406 (6797), 692–693. doi: 10.1038/35021135
7
Becker J. H. Grutter A. S. (2004). Cleaner Shrimp do Clean. Coral Reefs23 (4), 515–520. doi: 10.1007/s00338-004-0429-3
8
Bernt M. Braband A. Schierwater B. Stadler P. F. (2013). Genetic Aspects of Mitochondrial Genome Evolution. Mol. Phylogen. Evol.69 (2), 328–338. doi: 10.1016/j.ympev.2012.10.020
9
Bertram D. F. Strathmann R. R. (1998). Effects of Maternal and Larval Nutrition on Growth and Form of Planktotrophic Larvae. Ecology79 (1), 315–327. doi: 10.2307/176885
10
Bilgin R. Utkan M. A. Kalkan E. Karhan S. U. BekbÖLet M. (2014). DNA Barcoding of Twelve Shrimp Species (Crustacea: Decapoda) From Turkish Seas Reveals Cryptic Diversity. Mediterr. Mar. Sci.16 (1), 36–45. doi: 10.12681/mms.548
11
Bucklin A. Batta-Lona P. G. Questel J. M. Wiebe P. H. Richardson D. E. Copley N. J. et al . (2022). COI Metabarcoding of Zooplankton Species Diversity for Time-Series Monitoring of the NW Atlantic Continental Shelf. Front. Mar. Sci.9. doi: 10.3389/fmars.2022.867893
12
Čandek K. Kuntner M. (2015). DNA Barcoding Gap: Reliable Species Identification Over Morphological and Geographical Scales. Mol. Ecol. Resour.15 (2), 268–277. doi: 10.1111/1755-0998.12304
13
Clare E. L. Lim B. K. Engstrom M. D. Eger J. L. Hebert P. D. N. (2007). DNA Barcoding of Neotropical Bats: Species Identification and Discovery Within Guyana. Mol. Ecol. Notes7 (2), 184–190. doi: 10.1111/j.1471-8286.2006.01657.x
14
Costa F. O. deWaard J. R. Boutillier J. Ratnasingham S. Dooh R. T. Hajibabaei M. et al . (2007). Biological Identifications Through DNA Barcodes: The Case of the Crustacea. Can. J. Fish. Aquat. Sci.64 (2), 272–295. doi: 10.1139/f07-008
15
Drummond A. J. Rambaut A. (2007). BEAST: Bayesian Evolutionary Analysis by Sampling Trees. BMC Evol. Biol.7 (1), 214. doi: 10.1186/1471-2148-7-214
16
Drummond A. J. Suchard M. A. Xie D. Rambaut A. (2012). Bayesian Phylogenetics With BEAUti and the BEAST 1.7. Mol. Biol. Evol.29 (8), 1969–1973. doi: 10.1093/molbev/mss075
17
Ezard T. H. G. Fujisawa T. Barraclough T. G. (2009). Splits: Species’ LImits by Threshold Statistics.
18
Folmer O. Black M. Hoeh W. Lutz R. Vrijenhoek R. (1994). DNA Primers for Amplification of Mitochondrial Cytochrome C Oxidase Subunit I From Diverse Metazoan Invertebrates. Mol. Mar. Biol. Biotechnol.3 (5), 294–299.
19
Forward R. B. (1990). Behavioral Responses of Crustacean Larvae to Rates of Temperature Change. Biol. Bull.178 (3), 195–204. doi: 10.2307/1541819
20
Fujisawa T. Barraclough T. G. (2013). Delimiting Species Using Single-Locus Data and the Generalized Mixed Yule Coalescent Approach: A Revised Method and Evaluation on Simulated Data Sets. Syst. Biol.62 (5), 707–724. doi: 10.1093/sysbio/syt033
21
Ghouri M. Z. Ismail M. Javed M. A. Khan S. H. Munawar N. Umar A. B. et al . (2020). Identification of Edible Fish Species of Pakistan Through DNA Barcoding. Front. Mar. Sci.7. doi: 10.3389/fmars.2020.554183
22
Guimarães-Costa A. Machado F. S. Reis-Filho J. A. Andrade M. Araújo R. G. Corrêa E. M. R. et al . (2020). DNA Barcoding for the Assessment of the Taxonomy and Conservation Status of the Fish Bycatch of the Northern Brazilian Shrimp Trawl Fishery. Front. Mar. Sci.7. doi: 10.3389/fmars.2020.566021
23
Hajibabaei M. Janzen Daniel H. Burns John M. Hallwachs W. Hebert Paul D. N. (2006). DNA Barcodes Distinguish Species of Tropical Lepidoptera. Proc. Natl. Acad. Sci. U.S.A.103 (4), 968–971. doi: 10.1073/pnas.0510466103
24
Hall T. A. (1999). BioEdit: A User-Friendly Biological Sequence Algnment Editor and Analysis Program for Windows 95/98/NT. Nucl. Acids Symp. Ser.41, 95–98.
25
Hebert P. D. Cywinska A. Ball S. L. deWaard J. R. (2003). Biological Identifications Through DNA Barcodes. Proc. R. Soc B.270 (1512), 313–321. doi: 10.1098/rspb.2002.2218
26
Hebert P. D. Stoeckle M. Y. Zemlak T. S. Francis C. M. (2004). Identification of Birds Through DNA Barcodes. PLos Biol.2 (10), e312. doi: 10.1371/journal.pbio.0020312
27
Huang X. Betzler C. Wu S. Bernhardt A. Eagles G. Han X. et al . (2020). First Documentation of Seismic Stratigraphy and Depositional Signatures of Zhongsha Atoll (Macclesfield Bank), South China Sea. Mar. Pet. Geol.117, 104349. doi: 10.1016/j.marpetgeo.2020.104349
28
Huang D. Chen J. Xu L. Wang X. Ning J. Li Y. et al . (2022). Larval Fish Assemblages and Distribution Patterns in the Zhongsha Atoll (Macclesfield Bank, South China Sea). Front. Mar. Sci.8. doi: 10.3389/fmars.2021.787765
29
Hubert N. Hanner R. Holm E. Mandrak N. E. Taylor E. Burridge M. et al . (2008). Identifying Canadian Freshwater Fishes Through DNA Barcodes. PLos One3 (6), e2490. doi: 10.1371/journal.pone.0002490
30
Huelsenbeck J. P. Ronquist F. Nielsen R. Bollback J. P. (2001). Bayesian Inference of Phylogeny and Its Impact on Evolutionary Biology. Sci. (New York N.Y.)294 (5550), 2310–2314. doi: 10.1126/science.1065889
31
Janzen D. H. Hajibabaei M. Burns J. M. Hallwachs W. Remigio E. Hebert P. D. (2005). Wedding Biodiversity Inventory of a Large and Complex Lepidoptera Fauna With DNA Barcoding. Philos. Trans. R. Soc Lond. B Biol. Sci.360 (1462), 1835–1845. doi: 10.1098/rstb.2005.1715
32
Jeffery N. W. Elias-Gutierrez M. Adamowicz S. J. (2011). Species Diversity and Phylogeographical Affinities of the Branchiopoda (Crustacea) of Churchill, Manitoba, Canada. PLos One6 (5), e18364. doi: 10.1371/journal.pone.0018364
33
Karanovic I. (2015). Barcoding of Ancient Lake Ostracods (Crustacea) Reveals Cryptic Speciation With Extremely Low Distances. PLos One10 (3), e0121133. doi: 10.1371/journal.pone.0121133
34
Ko H. L. Wang Y. T. Chiu T. S. Lee M. A. Leu M. Y. Chang K. Z. et al . (2013). Evaluating the Accuracy of Morphological Identification of Larval Fishes by Applying DNA Barcoding. PLos One8 (1), e53451. doi: 10.1371/journal.pone.0053451
35
Kramer M. J. Bellwood D. R. Bellwood O. (2014). Benthic Crustacea on Coral Reefs: A Quantitative Survey. Mar. Ecol. Prog. Ser.511, 105–116. doi: 10.3354/meps10953
36
Kusbiyanto K. Bhagawati D. Nuryanto A. (2020). DNA Barcoding of Crustacean Larvae in the Eastern Areas of Segara Anakan Cilacap, Central Java Indonesia. Biodiversitas21 (10), 4878–4887. doi: 10.13057/biodiv/d211054
37
Largier J. L. (2003). Considerations in Estimating Larval Dispersal Distances From Oceanographic Data. Ecol. Appl.13 (sp1), 71–89. doi: 10.1890/1051-0761(2003)013[0071:CIELDD]2.0.CO;2
38
Liu J. Y. (2013). Status of Marine Biodiversity of the China Seas. PLos One8 (1), e50719. doi: 10.1371/journal.pone.0050719
39
Li Y. Zhang J. Chen Z. Gong Y. Cai Y. Yang Y. et al ., (2020). Study on Taxonomic Diversity of Fish in Zhubi Reef of Nansha Islands. South China Fish. Sci.16, 36–41. doi: 10.12131/20190159
40
Lorenz J. G. Jackson W. E. Beck J. C. Hanner R. (2005). The Problems and Promise of DNA Barcodes for Species Diagnosis of Primate Biomaterials. Phil. Trans. R. Soc B.360 (1462), 1869–1877. doi: 10.1098/rstb.2005.1718
41
Lu Z. Li M. Zhang J. Zhang S. Li H. Jiang P. et al . (2021). Preliminary Study on Species Composition of Fish Eggs of Meiji Reef Lagoon in South China Sea Based on DNA Barcoding. South China Fish. Sci.17, 12–21. doi: 10.12131/20210091
42
Matzen da Silva J. Creer S. dos Santos A. Costa A. C. Cunha M. R. Costa F. O. et al . (2011). Systematic and Evolutionary Insights Derived From mtDNA COI Barcode Diversity in the Decapoda (Crustacea: Malacostraca). PLos One6 (5), e19449. doi: 10.1371/journal.pone.0019449
43
Morton B. Blackmore G. (2001). South China Sea. Mar. Pollut. Bull.42 (12), 1236–1263. doi: 10.1016/s0025-326x(01)00240-5
44
Nylander J. A. A. (2004). MrModeltest V2. Program Distributed by the Author (Sweden: Evolutionary Biology Centre,Uppsala University).
45
Page R. D. M. (1996). Tree View: An Application to Display Phylogenetic Trees on Personal Computers. Bioinformatics12 (4), 357–358. doi: 10.1093/bioinformatics/12.4.357
46
Pons J. Barraclough T. G. Gomez-Zurita J. Cardoso A. Duran D. P. Hazell S. et al . (2006). Sequence-Based Species Delimitation for the DNA Taxonomy of Undescribed Insects. Syst. Biol.55 (4), 595–609. doi: 10.1080/10635150600852011
47
Pratchett M. (2001). Influence of Coral Symbionts on Feeding Preferences of Crown-of-Thorns Starfish Acanthaster Planci in the Western Pacific. Mar. Ecol. Prog. Ser.214, 111–119. doi: 10.3354/meps214111
48
Puillandre N. Lambert A. Brouillet S. Achaz G. (2012). ABGD, Automatic Barcode Gap Discovery for Primary Species Delimitation. Mol. Ecol.21 (8), 1864–1877. doi: 10.1111/j.1365-294X.2011.05239.x
49
Radulovici A. E. Archambault P. Dufresne F. (2010). DNA Barcodes for Marine Biodiversity: Moving Fast Forward? Diversity2 (4), 450–472. doi: 10.3390/d2040450
50
Radulovici A. E. Sainte-Marie B. Dufresne F. (2009). DNA Barcoding of Marine Crustaceans From the Estuary and Gulf of St Lawrence: A Regional-Scale Approach. Mol. Ecol. Resour.9 (s1), 181–187. doi: 10.1111/j.1755-0998.2009.02643.x
51
Ratnasingham S. Hebert P. D. N. (2007). BOLD: The Barcode of Life Data System. Mol. Ecol. Notes7 (3), 355–364. doi: 10.1111/j.1471-8286.2007.01678.x
52
Ratnasingham S. Hebert P. D. N. (2013). A DNA-Based Registry for All Animal Species: The Barcode Index Number (BIN) System. PLos One8 (7), e66213. doi: 10.1371/journal.pone.0066213
53
R Development Core Team (2017). R: A Language and Environment for Statistical Computing (Vienna, Austria: R Foundation for Statistical Computing).
54
Richter S. Olesen J. Wheeler W. C. (2007). Phylogeny of Branchiopoda (Crustacea) Based on a Combined Analysis of Morphological Data and Six Molecular Loci. Cladistics23 (4), 301–336. doi: 10.1111/j.1096-0031.2007.00148.x
55
Smith M. A. Fisher B. L. Hebert P. D. N. (2005). DNA Barcoding for Effective Biodiversity Assessment of a Hyperdiverse Arthropod Group: The Ants of Madagascar. Phil. Trans. R. Soc B.360 (1462), 1825–1834. doi: 10.1098/rstb.2005.1714
56
Tamura K. Stecher G. Peterson D. Filipski A. Kumar S. (2013). MEGA6: Molecular Evolutionary Genetics Analysis Version 6.0. Mol. Biol. Evol.30 (12), 2725–2729. doi: 10.1093/molbev/mst197
57
Tang R. W. K. Yau C. Ng W.-C. (2010). Identification of Stomatopod Larvae (Crustacea: Stomatopoda) From Hong Kong Waters Using DNA Barcodes. Mol. Ecol. Resour.10 (3), 439–448. doi: 10.1111/j.1755-0998.2009.02794.x
58
Tittensor D. P. Mora C. Jetz W. Lotze H. K. Ricard D. Berghe E. V. et al . (2010). Global Patterns and Predictors of Marine Biodiversity Across Taxa. Nature466 (7310), 1098–1101. doi: 10.1038/nature09329
59
Trevor J. W. Marti J. A. (2003). Structure of Cryptic Reef Fish Assemblages: Relationships With Habitat Characteristics and Predator Density. Mar. Ecol. Prog. Ser.257, 209–221. doi: 10.3354/meps257209
60
Ward R. D. Hanner R. Hebert P. D. (2009). The Campaign to DNA Barcode All Fishes, FISH-BOL. J. Fish. Biol.74 (2), 329–356. doi: 10.1111/j.1095-8649.2008.02080.x
61
Ward R. D. Zemlak T. S. Innes B. H. Last P. R. Hebert P. D. (2005). DNA Barcoding Australia’s Fish Species. Phil. Trans. R. Soc B.360 (1462), 1847–1857. doi: 10.1098/rstb.2005.1716
62
Webb K. E. Barnes D. K. A. Clark M. S. Bowden D. A. (2006). DNA Barcoding: A Molecular Tool to Identify Antarctic Marine Larvae. Deep. Sea. Res. (II Top. Stud. Oceanogr.)53 (8), 1053–1060. doi: 10.1016/j.dsr2.2006.02.013
63
Weiss M. Macher J. N. Seefeldt M. A. Leese F. (2014). Molecular Evidence for Further Overlooked Species Within the Gammarus Fossarum Complex (Crustacea: Amphipoda). Hydrobiologia721 (1), 165–184. doi: 10.1007/s10750-013-1658-7
64
Xu L. Han B.-P. Van Damme K. Vierstraete A. Vanfleteren J. R. Dumont H. J. (2011). Biogeography and Evolution of the Holarctic Zooplankton Genus Leptodora (Crustacea: Branchiopoda: Haplopoda). J. Biogeogr.38 (2), 359–370. doi: 10.1111/j.1365-2699.2010.02409.x
65
Xu L. Van Damme K. Li H. Ji Y. Wang X. Du F. (2019). A Molecular Approach to the Identification of Marine Fish of the Dongsha Islands (South China Sea). Fish. Res.213, 105–112. doi: 10.1016/j.fishres.2019.01.011
66
Xu L. Wang X. Van Damme K. Huang D. Li Y. Wang L. et al . (2021). Assessment of Fish Diversity in the South China Sea Using DNA Taxonomy. Fish. Res.233, 105771. doi: 10.1016/j.fishres.2020.105771
67
Yang H. Liu Q. Liu Z. Wang D. Liu X. (2002). A General Circulation Model Study of the Dynamics of the Upper Ocean Circulation of the South China Sea. J. Geophys. Res.107 (C7), 22–21-22-14. doi: 10.1029/2001JC001084
68
Zhao X. Jia P. (2020). Towards Sustainable Small-Scale Fisheries in China: A Case Study of Hainan. Mar. Policy121, 103935. doi: 10.1016/j.marpol.2020.103935
Summary
Keywords
DNA identification, COI gene, crustacean larvae, coral reef, Zhongsha Islands
Citation
Xu L, Wang X, Huang D, Wang L, Ning J, Li Y, Liu S and Du F (2022) The Application of DNA Barcoding in Crustacean Larvae Identification from the Zhongsha Islands, South China Sea. Front. Mar. Sci. 9:932678. doi: 10.3389/fmars.2022.932678
Received
30 April 2022
Accepted
10 June 2022
Published
18 July 2022
Volume
9 - 2022
Edited by
Jun Xu, Institute of Hydrobiology (CAS), China
Reviewed by
Weichun Li, Jiangxi Agricultural University, China; Qiuqi Lin, Jinan University, China
Updates
Copyright
© 2022 Xu, Wang, Huang, Wang, Ning, Li, Liu and Du.
This is an open-access
*Correspondence: Feiyan Du, feyanegg@163.com
This article was submitted to Marine Ecosystem Ecology, a section of the journal Frontiers in Marine Science
Disclaimer
All claims expressed in this article are solely those of the authors and do not necessarily represent those of their affiliated organizations, or those of the publisher, the editors and the reviewers. Any product that may be evaluated in this article or claim that may be made by its manufacturer is not guaranteed or endorsed by the publisher.