Abstract
The East Sea (also known as the Japan Sea; hereafter, EJS) is a semi-enclosed marginal sea surrounded by the Korean Peninsula, Russia, and the Japanese Islands. The EJS is connected to the Pacific through shallow straits. Thus, the EJS has its own thermohaline circulation and the characteristic biogeochemistry. The deep overturning circulation plays a critical role in carbon cycling including absorption of atmospheric CO2 and its sequestration into the interior of the sea. The turnover time of the deep EJS (>1000 m) is ~ hundred years and probably varies depending on physical climate forcing. Thus, the effect of climate change on oceanic processes may be more easily detected in the EJS. In this paper, we summarize the current understanding of carbon cycling in the EJS. We focus especially on the Ulleung Basin in the southwestern EJS, from which more extensive data are available. Notable features of carbon cycling in the EJS include the following: primary productivity and the export/production ratio are higher than in the adjacent Pacific; the EJS is a net sink of atmospheric CO2 and anthropogenic CO2 content is ~1% of the dissolved inorganic carbon inventory; dissolved inorganic carbon in the sea interior is mostly supplied by organic matter decomposition rather than CaCO3 dissolution and thus, the deep waters are vulnerable to acidification; N:P molar ratio of the deep waters is ~13, lower than the Redfield ratio; concentration of dissolved organic carbon is significantly higher than in the oceans; and sediment resuspension and lateral transport is an important component of sinking particulate organic carbon (POC) flux. Another important feature is the temporal trends observed for the last few decades. For example, pH, calcium carbonate saturation status, and dissolved oxygen concentration in the sea interior have decreased, whereas dissolved inorganic carbon and likely, the inventory of anthropogenic CO2 have increased. These temporal trends have an implication on better understanding of the processes occurring more slowly in the oceans. Brief suggestions for future research that will improve our understanding of carbon cycling and its variability are provided at the end of the paper.
Introduction
The East Sea (also known as the Japan Sea; hereafter: EJS; all abbreviations are listed in Table 1) is a semi-enclosed marginal sea that is connected to the Pacific Ocean via three shallow straits (less than 150-m deep; Figure 1). The flux of the Tsushima Warm Current (TWC), which flows into the EJS through the Korea Strait, varies widely between 0.7 and 4.6 Sv (1 Sv = 106 m3s−1) depending on the measurement method and period used (Yi, 1966; Byun and Seung, 1984; Chang et al., 2004). The 4-yr mean for the period 1999–2002, estimated from submarine cable data and calibrated using direct observations, was 2.4 Sv (Chang et al., 2004; Park, 2007). About two-thirds of the influx exits to the Pacific through the Tsugaru Strait and the remaining one-third exits through the Soya Strait (Katoh, 1994; Na et al., 2009; Han et al., 2020). A branch of the TWC flows north along the coast of the Korean Peninsula and forms the subpolar front around 38°–40°N upon detaching from the coast (Chang et al., 2002). The difference in annual sea surface temperature (SST) between the north and south of the subpolar front is 10–15°C (Gordon et al., 2002; Park and Lee, 2014). This distinct meridional difference in SST has physical (e.g., sea–air gas exchange of CO2) and biological (e.g., plankton community structure) consequences.
Table 1
| Abbreviation | Full name |
|---|---|
| Geographical Terms | |
| EJS | East Sea/Japan Sea |
| JB | Japan Basin |
| UB | Ulleung Basin |
| YB | Yamato Basin |
| Currents and Water Masses | |
| ESIW | East Sea Intermediate Water |
| TWC | Tsushima Warm Current |
| Biogeochemical Terms | |
| AOU | Apparent Oxygen Utilization |
| BP | Bacterial Production |
| DIC | Dissolved Inorganic Carbon |
| DIN | Dissolved Inorganic Nitrogen |
| DIP | Dissolved Inorganic Phosphorous |
| DO | Dissolved Oxygen |
| DOC | Dissolved Organic Carbon |
| FDOM | Fluorescent Dissolved Organic Matter |
| NCP | Net Community Production |
| OUR | Oxygen Utilization Rate |
| pCO2 | Partial Pressure of CO2 |
| POC | Particulate Organic Carbon |
| PP | Primary Production |
| SDOM | Sediment-derived Dissolved Organic Matter |
| SOC | Sedimentary Organic Carbon |
| SST | Sea Surface Temperature |
| Sv | Sverdrup (=106 m3s-1) |
| TA | Total Alkalinity |
| THAA | Total Hydrolysable Amino Acids |
Full names of the abbreviations used in the paper.
Figure 1
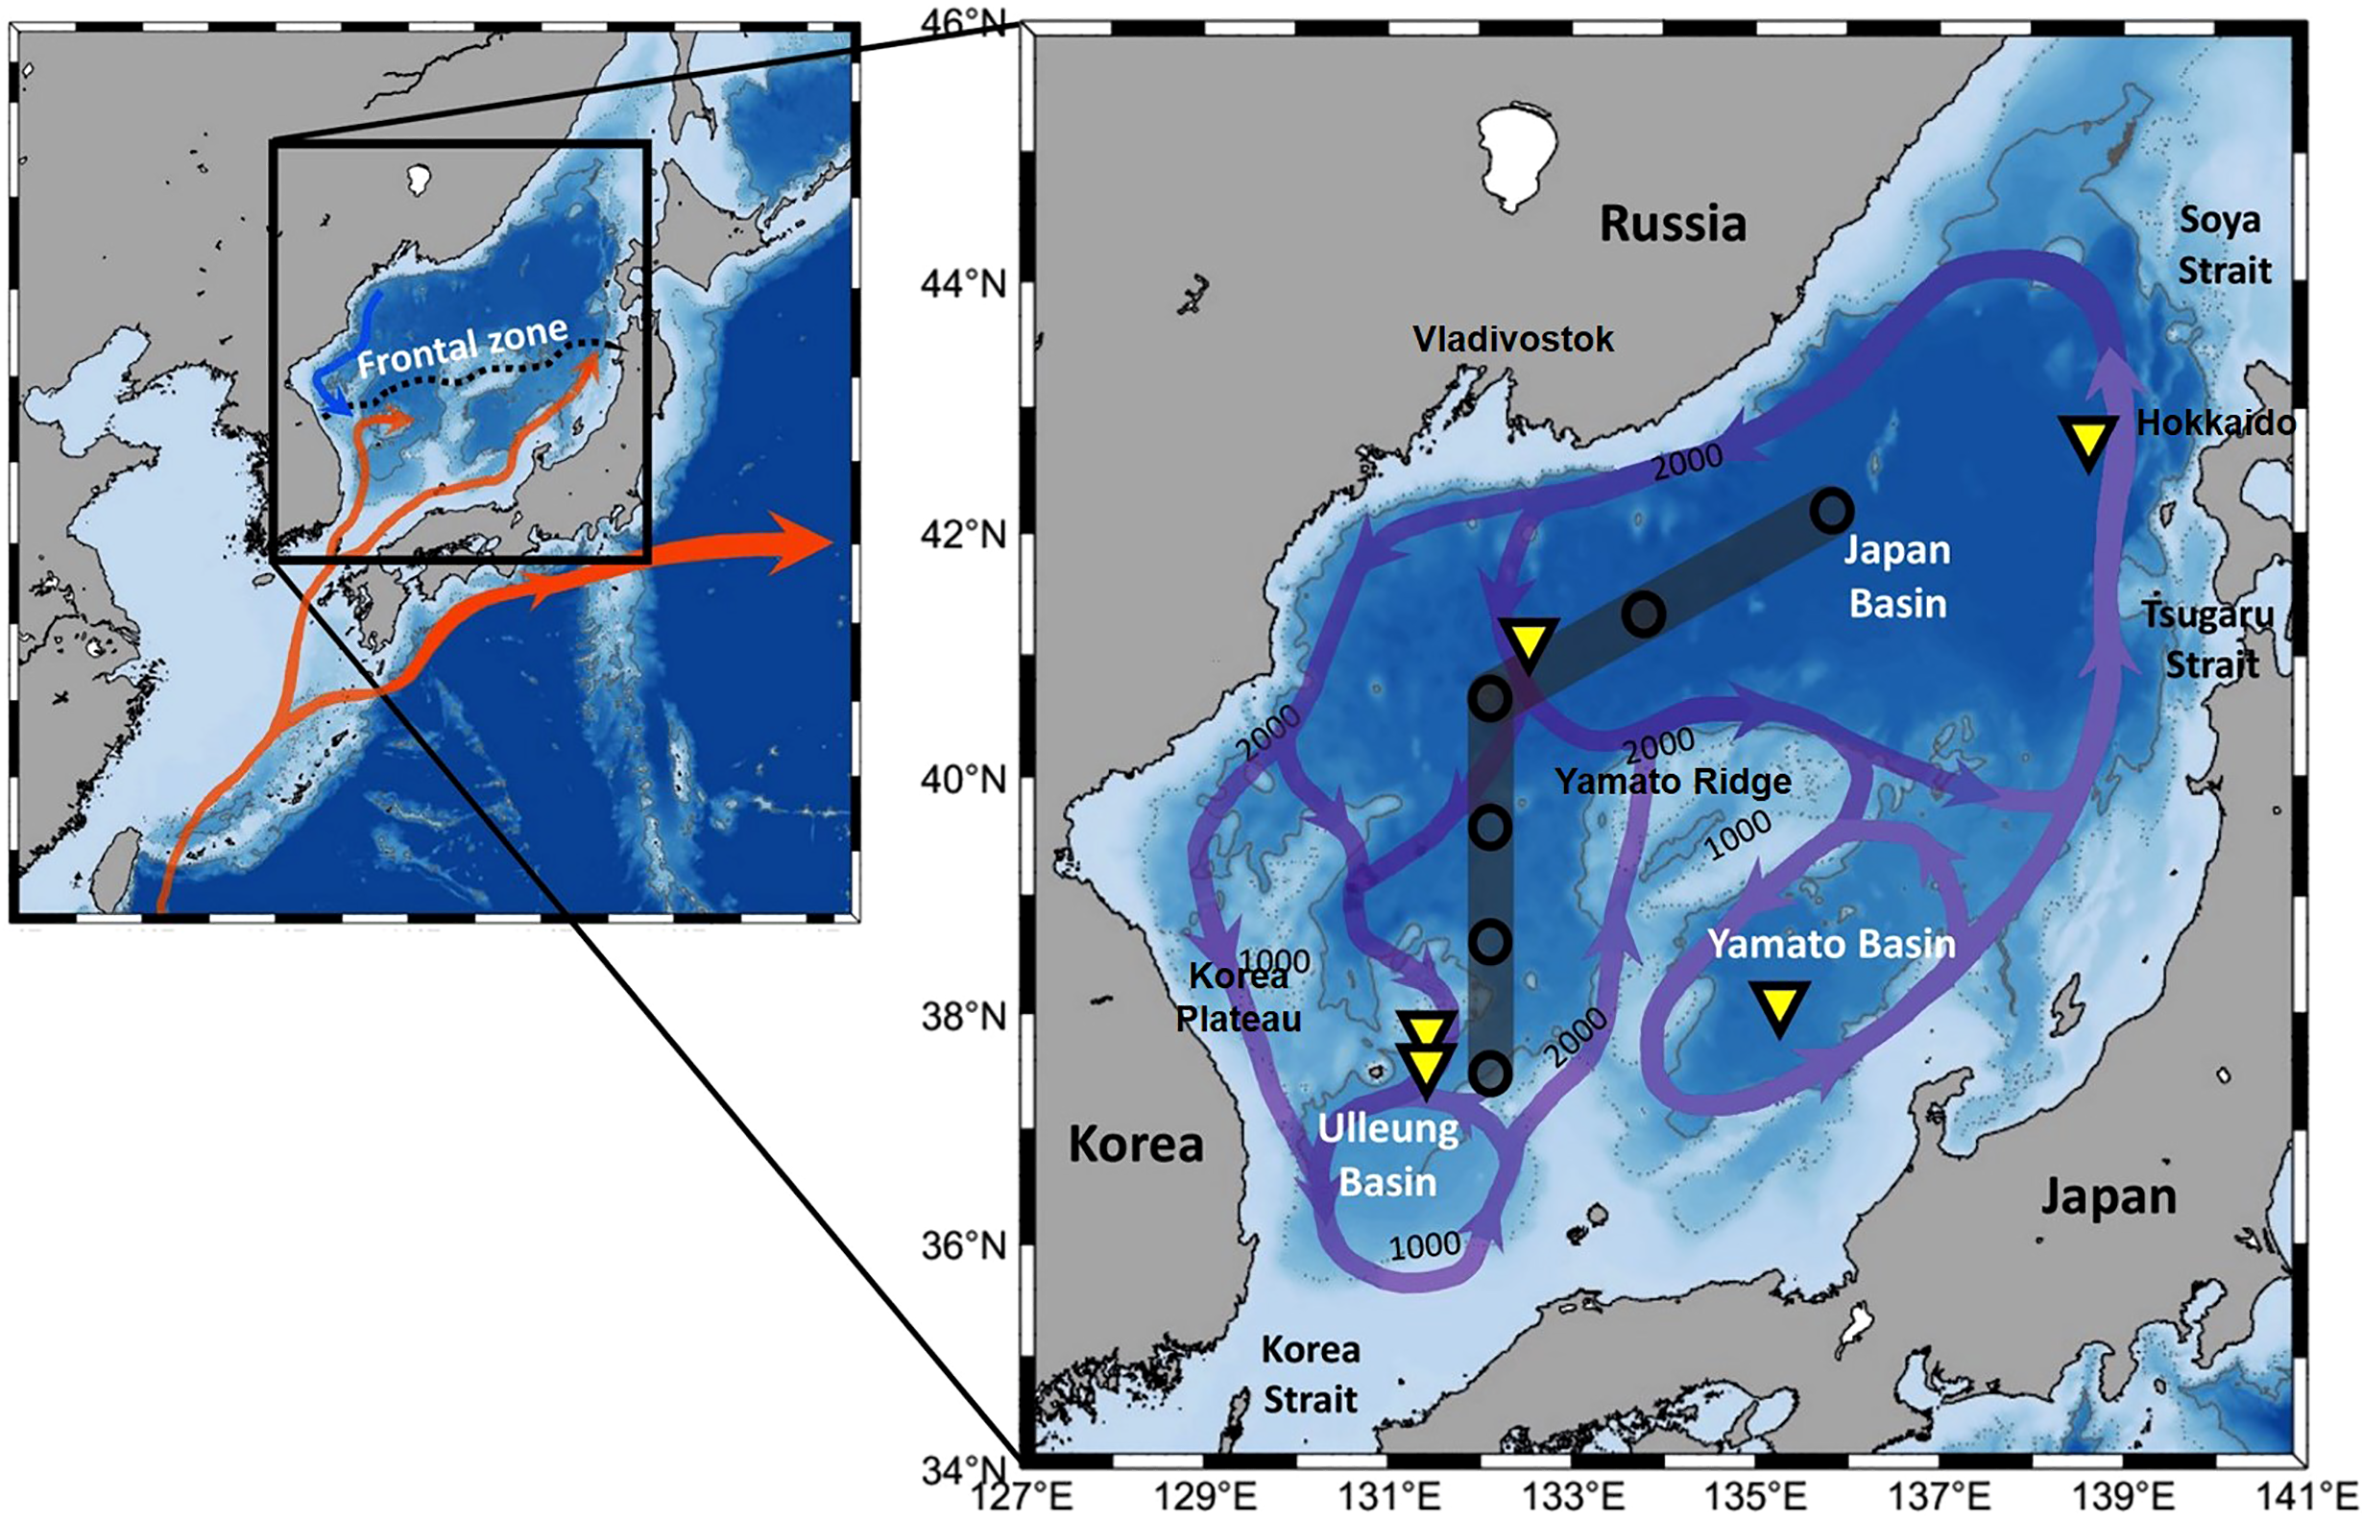
Map showing schematic surface currents and frontal zone (Kwak et al., 2013a) and expanded section with schematic view of abyssal circulation (arrows) in the EJS (Senjyu et al., 2005; Aramaki et al., 2013). Stations for vertical profiles of properties in Figure 2 (circles) and sediment trap mooring sites (triangles) are indicated.
Several water masses are present in the upper layer, down to a depth of ~500 m, and they show associated horizontal variations in biogeochemical properties (Kim et al., 2004; Kim et al., 2008). For example, in the southwestern part of the EJS, the East Sea Intermediate Water (ESIW) occurs below the TWC at around 200–400 m (Yoon and Kawamura, 2002; Kim et al., 2021). A salinity minimum (<34.06 psu), low temperatures (1–5°C) with a high DO (dissolved oxygen) content and a subsurface chlorofluorocarbon maximum have been observed within the ESIW (Kim and Kim, 1999; Min and Warner, 2005). Water flow from the shelf of Vladivostok to the Yamato Basin (YB) takes 12–15 months in the subsurface layer (Senjyu and Sudo, 1996).
Relatively fast horizontal circulations mix the deep waters of the EJS. A simple calculation based on the average current speed (~1.0 cm s−1; Senjyu et al., 2005) and the approximate path length along the slopes of the three deep basins (~4000 km) implies that it would take 10–20 yr for one circulation along the isopycnal surfaces. Similarly, it would take 3–4 yr from the offshore area near Vladivostok to the central Ulleung Basin (UB).
Vertical deep-water convection occurs on top of the rapid horizontal circulation. A turnover time of ~100 yr has been suggested for waters deeper than 1000 m (~9.1 × 10⁵ km3) by several independent studies based on various chemical tracers, such as 3H, 14C, and 226Ra, and assuming steady state conditions (Watanabe et al., 1991; Chen et al., 1995; Kumamoto et al., 1998). This short turnover time implies that ~0.3 Sv of deep-water formation occurs if it is evenly distributed temporally. Kang et al. (2003) estimated that the annual vertical flux of cold surface water to deep waters below 200 m is ~0.47 Sv. Deep-water formation is probably confined to the cold season because it is created by cooling and brine rejection during the formation of sea ice (Talley et al., 2003; Talley et al., 2006). Hahm and Kim (2008) reported that a maximum of ~1% of the bottom layer (<2600 m) was replaced by surface water during the severely cold winter of 2000–2001, and this corresponds to ~0.2 Sv of deep-water formation during the three winter months.
Below the intermediate water, lies the Central Water, which is defined as a water mass between 200 m and the deep salinity minimum layer with its temperature being ~1°C (Kim et al., 1996; Kang et al., 2004). The Bottom Water is the homogeneous layer in the bottom and the Deep Water resides in between the Central Water and the Bottom Water (Kim et al., 1996; Kang et al., 2004). Hereafter in this manuscript, the deep waters generally refers to the Deep Water and the Bottom Water. The EJS has been experiencing changes in its deep convection associated with physical forcing (Kim and Kim, 1996). The deep-water formation is believed to have fed the Bottom Water in the early 1990s (Kang et al., 2003; Yoon et al., 2018). However, the deep-water circulation in the EJS weakened in the mid-1990s (Gamo, 2011). The changes in the vertical distribution of DO indicate an increased DO supply to the Central Water from 1954 to 1996. However, an increased DO supply to the Deep Water and Bottom Water from 1996 to 2015 was observed, and this implies re-initiation of Bottom Water formation (Yoon et al., 2018).
The vertical and horizontal distributions of biogeochemical properties should be interpreted within this context of hydrographic characteristics. Although changes in biogeochemical parameters during the short transit from the Japan Basin (JB) to the UB are very small or insignificant, episodic deep-water formation in the JB can leave imprints via the addition of water with low nutrient levels and temperature, and high DO and chlorofluorocarbons (Kim et al., 2002; Senjyu et al., 2002; Tsunogai et al., 2003; Min and Warner, 2005). In turn, close examination of the long-term variation of the biogeochemical properties may provide information regarding the variations in the water circulation.
Because the deep waters are isolated from the adjacent Pacific, the parameters related to carbon cycle in the deep waters of the EJS may have their own characteristic features in stoichiometry and rates of organic matter decomposition, oxygen utilization, and nutrient regeneration (Chen et al., 2004). Also, characteristics in the biology such as plankton community structure and their variation in surface waters are reflected in the biogeochemical parameters in the deep waters. The influence of riverine input to the EJS, especially the southwestern part, is relatively small despite its proximity to land. Thus, the biogeochemistry in the EJS is mainly controlled by oceanic processes.
Because the deep waters circulate at a much shorter time scale than in the oceans, any biogeochemical changes caused by physical forcing may occur faster and may be detected more easily in the EJS than in the oceans (e.g., Kim et al., 2001). For example, temporal changes in the carbonate system, especially in pH, dissolved inorganic carbon (DIC) concentration, apparent oxygen utilization (AOU), and calcium carbonate saturation horizons have been reported (e.g., Chen et al., 2017; Na et al., 2022). These temporal changes have an implication on better understanding of the future changes in the oceans.
Characteristics of the carbonate system and CO2 parameters in the EJS
Flux of CO2 through sea–air exchange and the uptake of anthropogenic CO2
A study based on the continuous measurement of CO2 partial pressure (pCO2) along the cruise tracks between 1995 and 1997 and subsequent modeling showed that the EJS released CO2 to the atmosphere from June to September, but otherwise absorbed CO2 (Oh et al., 1999). This study estimated a net sea–air flux of −2.2 mol m−2yr−1 (negative values indicate flux into the sea) if evenly distributed across the EJS (Table 2). The pCO2 in surface waters has been studied more frequently in the UB than in other major basins of the EJS. Choi et al. (2012) estimated a sea–air CO2 flux of −2.5 ± 1.3 mol m−2yr−1 in the UB, based on four-times of underway pCO2 observation between 2006 and 2008 (Table 2). By using three machine learning models with information including SST, chlorophyll-a (Chl-a), and mixed-layer depth, Hahm et al. (2019a) presented a high-resolution time series of surface pCO2 values in the UB and found a net CO2 flux of −0.76 ± 1.15 mol m−2yr−1 in 2008. Kim et al. (2014) measured pCO2 in the UB 14 times between 1995 and 2009 and showed that the region was mostly under-saturated with a monthly mean ΔpCO2 (i.e., the difference in pCO2 between the atmosphere and the surface seawater) ranging between −100 and +20 μatm. Those authors also proposed a smaller net sea–air CO2 flux of −0.8 mol m−2yr−1. Another recent study used satellite data from the geostationary ocean color imager (GOCI) and machine learning to suggest that the UB is under-saturated throughout the year and had a mean net sea–air CO2 flux of −1.53 mol m−2yr−1 from 2014 to 2015 (Jang et al., 2017).
Table 2
| Parameters | UB | JB/YB | EJS | |
|---|---|---|---|---|
| pCO2 (mol m−2yr−1)1) | –0.8 to –2.5 | –0.3 to –1.2 | –2.2 | |
| DIC (μmol kg−1)2) | 0–500 m | 1966–2219 | 2024–2210 | 1966–2252 |
| >500 m | 2236–2260 | 2242–2253 | 2217–2260 | |
Inorganic carbon parameters in the EJS.
1) These values were from Oh et al., 1999; Sakamoto et al., 2008; Choi et al., 2012; Kim et al., 2014; Jang et al., 2017; Hahm et al., 2019a.
2) These values are from Kim et al., 2019 and Na et al., 2022.
Kosugi et al. (2016) measured pCO2 in surface water in the fall from 2010 to 2014 in the eastern part of the EJS. Generally, pCO2 was lower in the north than south. They found that cooling was the major factor for low pCO2 in the fall, but the influence of the Changjiang Diluted Water was also important in the southern region. The average CO2 flux ranged from −0.31 to −1.2 mol m−2yr−1 on the Otaru coast of Hokkaido, Japan, from 1998 to 2003 (Table 2; Sakamoto et al., 2008). In their summary of the literature and unpublished data from global estuaries and continental shelf regions (with a water depth of less than 500 m), Chen et al. (2013) calculated an average CO2 flux in the EJS of −3.9 mol m−2yr−1 (n = 2), which is 3× greater than the global average CO2 flux based on data from 45 shelf sites (−1.09 mol m−2yr−1). Overall, the sea–air CO2 flux estimates from the EJS fall within a large range between −0.31 and −3.9 mol m−2yr−1.
Deep-water ventilation facilitates the uptake and transport of anthropogenic CO2 (additional CO2 released by human activities) into the deep sea interior (Kim et al., 2001; Lee et al., 2011). Chen et al. (1995) first estimated the inventory of excess CO2 in the EJS at 0.31 ± 0.05 GtC in 1992. Using the extended multiple linear regression method, Park et al. (2006) observed the highest concentrations of anthropogenic CO2 (50–60 μmol kg−1) in the upper waters of the southern EJS where the vertical stratification is strong. The vertical gradient in anthropogenic CO2 in the northern EJS was relatively small and was associated with the active vertical mixing. There, the anthropogenic CO2 levels of 15–20 μmol kg−1 reached depths of ~3500 m. The highest column-integrated anthropogenic CO2 values were observed in the JB (~80 molC m−2), with low values near the Korea Strait and other shallow regions in the UB and YB (Park et al., 2006). Those authors used a chlorofluorocarbon tracer to calculate a total anthropogenic CO2 inventory in the EJS of 0.40 ± 0.06 GtC in 1999. The sea–air anthropogenic CO2 uptake flux decreased from −0.6 ± 0.4 molC m−2yr−1 over the period 1992–1999 to −0.3 ± 0.2 molC m−2yr−1 for 1999–2007, potentially reflecting the previous slowing of deep-water ventilation in the EJS (Park et al., 2008). Considering the recent observation of new Bottom Water formation (Yoon et al., 2018), further observations will be necessary if we are to better understand the role of the deep-water ventilation in terms of the uptake of anthropogenic CO2.
Dissolved inorganic carbon (DIC) and total alkalinity (TA)
Based on the vertical distribution of DIC, the EJS contains about 44 GtC of inorganic carbon. Several previous studies have investigated the DIC and CO2 parameters in the EJS. Chen et al. (1995) presented the concentrations and spatial variations of CO2 parameters in the EJS measured in 1992. They showed that both the nTA (salinity-normalized total alkalinity) and DIC concentrations in the EJS were lower than those in the Pacific (Chen et al., 1995). Later, CO2 parameters were determined with greater spatial coverage in 1999 (Talley et al., 2004). Most recently, DIC and TA data from the JB and UB in 2019 were reported (Na et al., 2022).
DIC shows spatial variations in the upper layer (500 m), but it is rather uniform in the deeper layer below 500 m throughout the EJS (Figure 2; Talley et al., 2004; Na et al., 2022). Vertically, the DIC concentration increases quickly with increasing water depth from around 1966 to 2235 μmol kg−1 in the upper layer, but it is then uniform (~2300 μmol kg−1) below 1000 m in the EJS (Figure 2 and Table 2; Chen et al., 1995; Talley et al., 2004; Na et al., 2022). One notable observation from the EJS is the relatively small vertical change in TA when compared with the oceans: TA decreases with increasing depth down to ~500 m, then gradually increases with depth to the bottom (from 2240 to 2290 μmol kg−1; Chen et al., 1995; Talley et al., 2004; Na et al., 2022). Therefore, the TA values near the seafloor were similar to, or only slightly higher than, the values in the surface water. Most organic matter remineralization occurs in the upper 500-m layer. The DIC/TA ratio in the EJS is higher than that in the ocean (e.g., DIC/TA ratio in the South Atlantic= ~0.955± 0.002) (Chen et al., 1995; Na et al., 2022). This high DIC/TA ratio (0.985 ± 0.002; Na et al., 2022) is caused by the large DIC supply, which is related to the high primary production (PP) and export production of organic matter, together with the limited supply of TA related to the low rates of CaCO3 export (Masuzawa, 1989; Hong and Chen, 2002; Kim et al., 2017) caused by the small contribution from calcifying plankton (Kang et al., 2004). The high DIC/TA ratio implies that the deep waters of the EJS are especially vulnerable to acidification (i.e., because of the limited buffering capacity of pH; Chen et al., 2017).
Figure 2
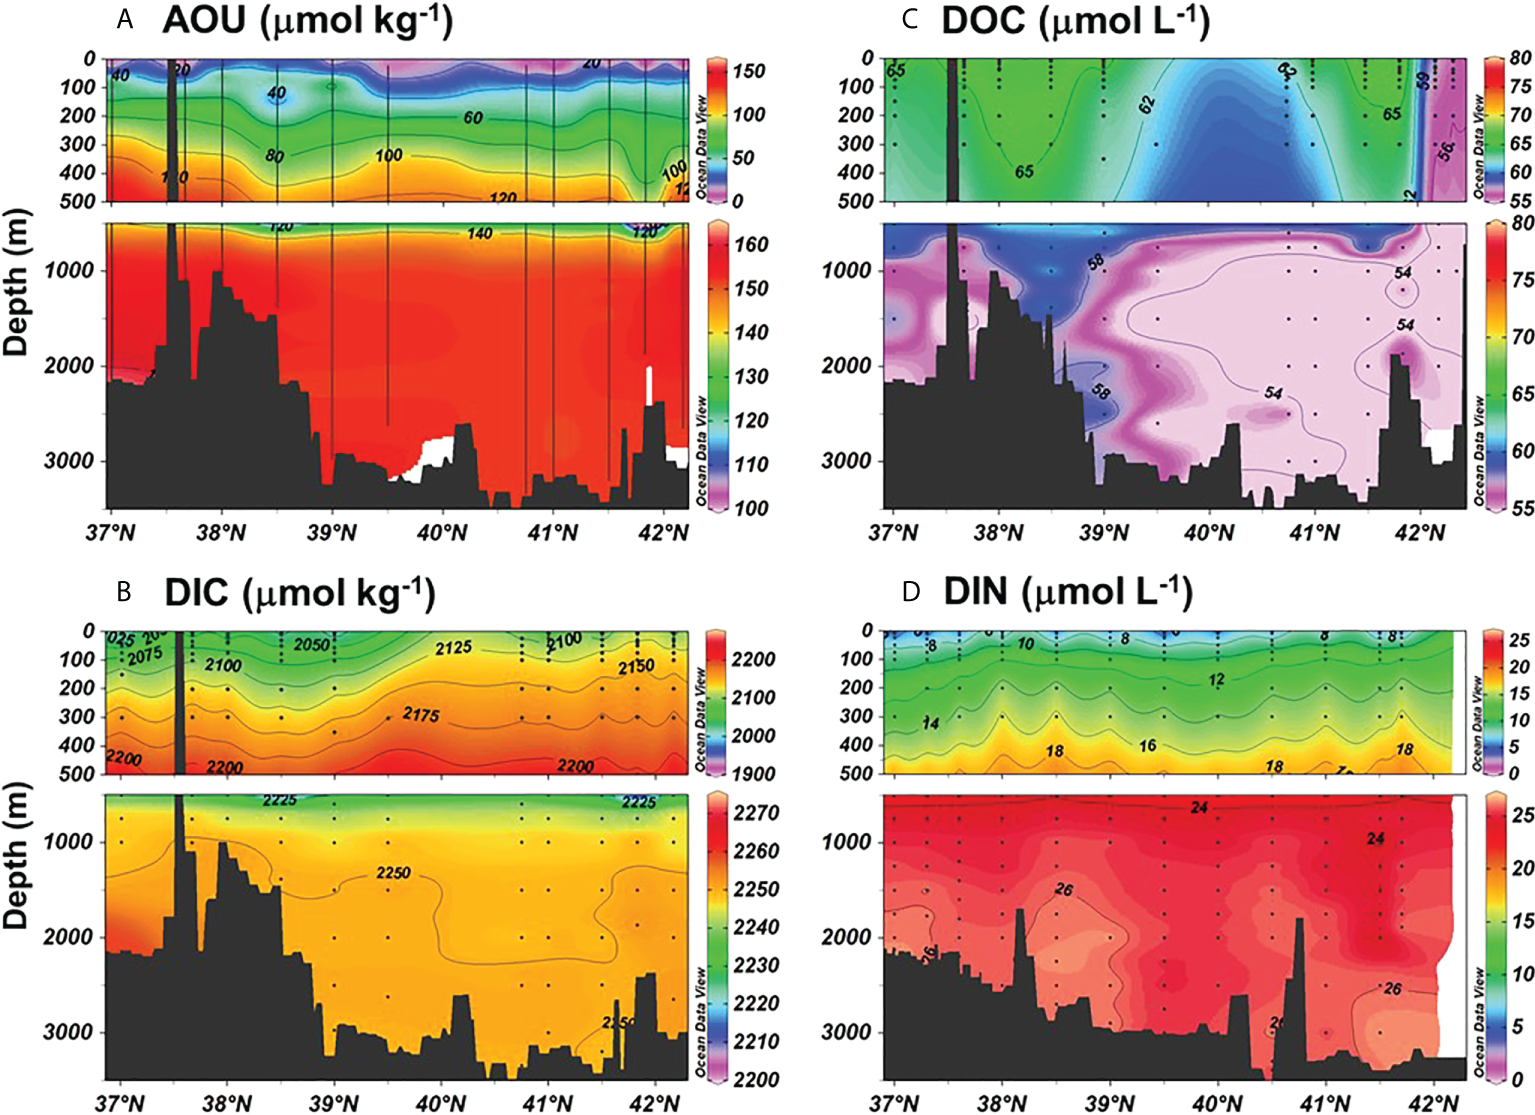
Distributions of (A) AOU, (B) DIC, (C) DOC, and (D) DIN in the EJS along the approximately meridional transect shown in Figure 1. Raw data are available from Kim (2013); Kim and Kim (2013); Kim (2015); Han et al. (2021), and Na et al. (2022).
pH and carbonate compensation depth (CCD)
A rapid decrease in pH (0.03 ± 0.02 pH units decade−1) since 1995 has been recorded in surface waters of the UB (Kim et al., 2014). For deep waters, Chen et al. (2017) estimated pH from long-term DO data and showed a rapid decrease in pH in the interior of the EJS. Accumulation of CO2 from organic matter decomposition, which was facilitated by the slowdown of deep-water ventilation, was suggested as the main cause of the acidification of the deep waters of the EJS (Chen et al., 2017; Na et al., 2022). Recently, based on a multi-box 1-D model, Li et al. (2022) suggested that, in addition to the reduced deep-water ventilation, increased intermediate ventilation and the particulate organic carbon (POC) remineralization rate control the acidification of the deep waters of the EJS.
Accompanying the pH decrease, the carbonate saturation horizons have been shoaling (Park et al., 2006; Na et al., 2022). Chen et al. (1995) reported that the saturation horizons were 1300 m and 300 m for calcite and aragonite, respectively, in 1992. Kim et al. (2010) used a multi-parameter linear regression model and found the shoaling of the aragonite saturation horizon by 50–250 m with a greater magnitude in the northern part of the EJS. The calcite saturation horizons shoaled by 400–500 m (to ~500 m), while the aragonite saturation horizon changed little (~200 m) in the UB and JB from 1999 to 2019 (Na et al., 2022). The shoaling in the EJS has been occurring at a faster rate than that in the ocean (for example, >20 m yr-1 for calcite from 1999 to 2019, vs. 1 to 2 m yr-1 on average in the Pacific; Feely et al., 2012; Na et al., 2022). Further shoaling will affect calcifying organisms and may reduce CaCO3 production via a positive feedback in the future. Li et al. (2022) demonstrated that the CaCO3 in sediment would have no significant neutralizing effect on the rapid acidification in the deep EJS. This emphasizes the importance of local biology (e.g., diatom domination of the plankton community) in determining the carbonate chemistry of a marginal sea (Luo and Boudreau, 2016; Li et al., 2022).
Dissolved organic carbon (DOC)
The total inventory of DOC in the EJS is ~1.2 GtC, which amounts to ~0.19% of the oceanic DOC pool of 660 GtC (Hansell, 2013; Hansell and Carlson, 2015). Only a few studies have examined the characteristics and cycling of DOC in the EJS (Kim et al., 2015; Kim et al., 2020). In particular, in light of the relatively short timescale of deep-water circulation in the EJS, characteristics of DOC are expected to differ from that in the Pacific (Kim et al., 2017).
The average DOC concentration in the UB and JB was 68 ± 6 μM in the surface layer (down to 200 m) and 58 ± 4 μM below this layer (Figure 2; Kim and Kim, 2010; Kim and Kim, 2013; Kim et al., 2015; Kim et al., 2017). Although the DOC concentration in the surface layer is similar to that in the global oceans, that in the deep waters is notably higher than that in the adjacent Pacific Ocean (34–43 μM; Hansell and Carlson, 1998). Faster deep-water ventilation in the EJS than in the global ocean may be the cause of relatively high DOC concentration (Chen, 2011; Kim et al., 2015). The DOC concentration in the deep layer of the EJS observed in July 2009 did not show any significant spatial difference (Figure 2 and Table 3; Kim and Kim, 2010).
Table 3
| Parameters | UB | JB/YB | EJS | NW Pacific7) |
|---|---|---|---|---|
| Primary production (molC m−2yr−1)1) | ||||
| In-situ | 23 | 7.4 | ||
| Satellite | 18 to 23 | 13 to 16 | 19 to 22 | |
| New production, NCP, export POC (molC m−2yr−1)2) | ||||
| Satellite | 5.5 | 7.2 | 5.5 to 7.2 | 2.5 to 12 |
| 3He, 3H, OUR | 5.3 | 5.3 to 9.2 | 5.3 to 9.2 | |
| 234Th | 4.9 (13) | |||
| NCP, ΔO2/Ar | (24 to 55) | (4.5 to 250) | ||
| Drifting trap | (5.8 to 12; 60 m) (2.1 to 6.2; 200 m) |
|||
| Sinking POC: sediment traps (molC m−2yr−1)3) | ||||
| Shallow (~1000 m) | 0.8 (1.7) | 0.4 (1.0): E-JB 0.9 (2.6): W-JB |
||
| Deep (2000-3000 m) | 0.8 (2.1) | 0.2 (0.5): E-JB 0.6 (1.4): W-JB |
(0.5; 4810 m) | |
| DOC (μM)4) | ||||
| surface (<200 m) deep (>200 m) |
68 55 |
69 59 |
68 58 |
42–65 35–53 |
| Bacterial production (μmolC m−3d−1)5) | ||||
| 130–200 (surface water) | 4.5 (surface–500 m) | |||
| 1.7–3.3 (750–2000 m) | ||||
| Sediment (molC cm−2yr−1)6) | ||||
| SOC accumulation | 0.3 (basin), 4.8 (slope) | 0.2 (JB) | 0.2 to 4.8 | |
Organic carbon parameters in the EJS and in the NW Pacific. Note that the flux values in parentheses are in mmolC m−2d−1.
1) These values were from Yamada et al., 2005. Kwak et al., 2013a; Joo et al., 2014; Joo et al., 2016.
2) These values were from Hahm and Kim, 2001; Hahm and Kim, 2008; Kim et al., 2011; Joo et al., 2018; Hahm and Lee, 2018.
3) These values were from Kim et al., 2017 and Otosaka et al., 2004. For JB, the two values were obtained from different mooring locations (eastern and western JB).
4) These values were from Senjyu et al., 2005; Kim and Kim, 2010; Kim and Kim, 2013; Kim et al., 2015; Kim et al., 2017.
5) These values were from Hyun et al., 2009; Hyun et al., 2022.
6) These values were from Hong et al., 1997; Hong et al., 1999; Otosaka et al., 2006.
7) Data from KNOT (44°N, 155°E) time-series observations at station for PP (Imai et al., 2002) and NCP (Tsurushima et al., 2002; Palevsky et al., 2016). New production from Northwestern Pacific Ocean by satellite observation (Falkowski et al., 1998; Laws et al., 2000; Goes et al., 2000). NCP data are from the Station ALOHA (Ferrón et al., 2015), northeast subtropic and Alaskan Gyre (Lockwood et al., 2012; Palevsky et al., 2013). Sinking particles in the upper 200 m were collected by using drifting sediment traps (Honda et al., 2015) and 4810 m by using conical sediment trap (Nichiyu-Giken-Kogyo SMD26S-6000; Honda, 2020) at Station K2. DOC concentration from 8 stations in the Northwest Pacific (Ding et al., 2019) and bacterial production from surface to 500 m, 2 stations in the Northwest Pacific (Yamada et al., 2012).
The high total hydrolysable amino acids (THAA) concentration in the deep waters of the EJS (156 ± 37 nM; Kim et al., 2017) is an interesting research topic. Their value is higher than those recorded at the Bermuda Atlantic Time-series Study (BATS; 87–103 nM) and Hawaii Ocean Time-series (HOT; 45–70 nM; Kaiser and Benner, 2008; Kaiser and Benner, 2009) sites. The THAA concentration and high yield (% of DOC) indicate the semi-labile nature of DOC in the deep layer of the EJS (Kim et al., 2015).
A few studies have examined the fluorescence characteristics of DOC using excitation–emission spectroscopy with parallel factor analysis (PARAFAC; Bro, 1997). Humic fluorescent dissolved organic matter (FDOM) is produced by microbial activity that uses oxygen. Tanaka et al. (2014) found that the EJS has similar humic FDOM characteristics to the deep water of the North Pacific, which is unexpected considering the great difference in the deep-water age between the two water bodies. Those authors proposed accumulation of bio-recalcitrant humic FDOM during repeated renewal of the deep waters of the EJS. Another study reported production of excess humic FDOM by an anaerobic process in the sediments and release to the water column (Kim and Kim, 2016). Thus, both the bioavailable and bio-recalcitrant fractions of DOC appear to be accumulating in the deep EJS.
Recently, Hyun et al. (2022) further demonstrated the supply of a substantial amount of sediment-derived DOM (SDOM) in the UB. The SDOM contains bio-reactive components and stimulates the heterotrophic microbial metabolism in the water near the seafloor. The enhanced bacterial production (BP) in the water samples taken from near the seafloor, amended with SDOM-containing pore water partly explains the rapid consumption of oxygen in the water near the seafloor (Kang et al., 2010) and the accumulation of excess FDOM in the deep water of the UB (Kim and Kim, 2016).
Studies of DOC in the EJS are relatively new and our understanding is mostly limited to its concentration and the characteristics of FDOM and THAA. Better spatial coverage of DOC concentration measurements in other areas, including the YB, together with the measurements of other biogeochemical parameters such as radiocarbon content, and studies of the interactions between microbes and DOC, are needed to further advance our understanding of DOC cycling in the EJS.
Particulate components of the biological pump in the EJS
Plankton community
The phytoplankton community affects both the magnitude of PP and the export efficiency of POC (Edwards et al., 2015; Basu and Mackey, 2018). The phytoplankton community of the EJS is characterized by the abundance and diversity of diatoms, dinoflagellates, and cyanobacteria (Choi et al., 2016). Diatoms are abundant in most of the regions, whereas the cyanobacteria abundance is comparatively high in the open waters (Kim et al., 2021). Cyanobacteria occurs mainly in the surface mixed layer, whereas diatoms are dominant in the stratified zone at depths below 20 m (Kwak et al., 2017). A dearth of coccolithophores is also noteworthy (Shim et al., 1985; Kim et al., 2014; Yoon, 2016). The small contribution from calcifying plankton to the total plankton community (Kang et al., 2004; Kwak et al., 2013b) results in the low CaCO3 content in the sinking particles (Kim et al., 2017; Kim et al., 2020) and sediments. Hong and Chen (2002) reported that the pteropod flux to a depth of 2800 m in the JB in 1994–1995 was ~6 mgC m-2yr-1, dominated by a single species, Limacina helicina.
Ashjian et al. (2005) recorded the taxa, size, and vertical distribution of the zooplankton in the upper 80 m of the EJS during the summer of 1999 using the Video Plankton Recorder (VPR), which was mounted on a vertically profiling towed vehicle. The most abundant zooplankton taxa were copepods (Oithona spp., Calanus spp.), and copepod nauplii, and protozoa (Iguchi, 2004; Ashjian et al., 2005; Jo et al., 2017). Copepods were most dominant to the south of the subpolar front, whereas protozoans and copepod nauplii were relatively abundant to the north of the subpolar front (Ashjian et al., 2005).
Primary production
The EJS, especially the UB, has high PP (Yoo and Park, 2009; Kwak et al., 2013a, b). Shipboard measurements of in situ PP, especially year-round results, are scarce (Kwak et al., 2013a, b). The monthly PP in the UB ranged between 92 mmolC m−2d−1 in May and 32 mmolC m−2d−1 in November 2010, with an annual average of 23 mmolC m−2d−1 (273 gC m−2yr−1; Table 3; Kwak et al., 2013a).
PP data with a wider temporal and spatial coverage were obtained from the SeaWiFS (Sea-viewing Wide Field-of-view Sensor) and MODIS (Moderate-Resolution Imaging Spectroradiometer)-Aqua satellite sensors, and the Vertically Generalized Productivity Model (VGPM; Behrenfeld and Falkowski, 1997) with size-fractionated PP model (Kameda and Ishizaka, 2005; Yamada et al., 2005; Yoo and Park, 2009). Yamada et al. (2005) reported PP over the period 1998–2002 to be 18, 13, 16, and 14 molC m−2yr−1 in the UB, JB, YB, and off the Russian coast, respectively. Joo et al. (2014) estimated the annual mean PP in the UB from 2002 to 2012 to be 23 ± 1.2 molC m−2yr−1, which is similar to the in situ measurements made by Kwak et al. (2013b). Later, Joo et al. (2016) reported average annual PP over the period 2003–2012 ranging between 19 and 22 molC m−2yr−1, with values being between 10% and 20% higher in the southern part of the EJS than in the north. The processes that might be responsible for the high PP levels in the UB include wind-driven coastal upwelling along the southeast coast of the Korean Peninsula (Hyun et al., 2009; Yoo and Park, 2009), shoaling of the nitracline onto the euphotic zone during summer that stimulates new production (Kwak et al., 2013a), and the upward flux of nutrients via the formation of intra-thermocline eddies that are associated with the occurrence of the Ulleung Warm Eddy in the center of the UB (Kim et al., 2012).
Seasonally, PP is highest in spring, lowest in winter, and similar during summer and fall (Kwak et al., 2013b). The spring bloom accounts for 42% of the annual PP (Yamada et al., 2005). The fall bloom is short-lived and not as prominent as the spring bloom, especially in the northern EJS. PP starts about a month earlier in the southern EJS than in the north (Joo et al., 2016). The wind speed in spring affects the interannual variability of PP (Yamada et al., 2005). Jo et al. (2007) showed that the wet deposition of Asian dust can also cause the spring bloom to begin about a month earlier than in normal years. Another study showed that the strong transport by the TWC can generate nutrient poor conditions in the upper layer that suppress the spring bloom in the UB (Yoo and Kim, 2004).
New production, export production, and net community production
Kwak et al. (2013b) reported monthly shipboard measurements of new production and regenerated production in the UB based on 15N incubation. The new production ranged between 371 gN m−2d−1 in June and 41 gN m−2d−1 in November 2010, with an average of 63 gN m−2yr−1 (i.e., 4.5 molN m−2yr−1). The average resultant f-ratio, defined as new production:primary production (Eppley and Peterson, 1979), was 0.59 (range = 0.39–0.81), and such high values are usually observed in the productive upwelling-influenced regions (Dugdale and Wilkerson, 1992). A high contribution from diatoms was suggested as a potential cause of the high f-ratio in the UB (Kwak et al., 2013b). Joo et al. (2018) estimated annual new production in the EJS based on the MODIS-derived sea surface nitrate concentration and it was 7.1 molC m−2yr−1 in the northern EJS and 5.5 molC m−2yr−1 in the south (Table 3). Hahm and Kim (2001) estimated export production based on the upward flux of 3He and nitrate into the euphotic zone (Jenkins, 1988) and reported 5.3 molC m−2yr−1 in the southern EJS including the UB and YB.
Hahm and Kim (2008) estimated oxygen utilization rate (OUR) in the western JB based on the 3H-3He age and AOU. Under an assumption of 90% oxygen saturation in the surface water, the integration of the OUR between 0 and 200 m in the water column yielded 12 molO2 m−2yr−1, which is equivalent to 9.2 molC m−2yr−1 of organic matter remineralization under the Redfield stoichiometry (Hahm and Kim, 2008). Because oxygen is consumed by oxidation of organic matter the OUR integrated for the layer below the euphotic zone can be interpreted as the minimum value for export production.
The mean POC export in the UB based on the 234Th/238U disequilibrium method (Savoye et al., 2006; Waples et al., 2006; Buesseler et al., 2020) was 13 ± 6.3 mmolC m−2d−1(i.e., 4.9 molC m−2yr−1), from the results of four cruises during spring 2006, summer 2007, and the fall and winter of 2008. (Kim et al., 2011). Seasonal variations were small, except for the fall (4.1 mmolC m−2d−1), when the flux was 4× lower than in the other seasons (Kim et al., 2011). The e-ratio (defined as export production:primary production) was higher during spring–summer than fall–winter. The mean e-ratio, 0.34 ± 0.13, is higher than the values (~0.26) obtained from the global formulation of the e-ratio using SST and PP (Laws et al., 2011). Spatially, the POC export in the shallow (<200 m water depth) region (26 mmolC m−2d−1) of the UB was about 3× higher than in the deep (>1500 m) region (8.4 mmolC m−2d−1) in August 2007 (Kim et al., 2009).
Net community production (NCP) is equivalent to the export production if integrated over a long period and under steady state conditions. High spatial resolution (<1 km) NCP data were obtained using the Δ(O2/Ar) method in the UB (Hahm and Lee, 2018). The average NCP in the upwelling region of the UB was 55 ± 29 mmolC m−2d−1, which is about twice that in the ambient waters (24 ± 14 mmolC m−2d−1; Table 3). The values from the UB are higher than those from the low-latitude Pacific region (7.9–26 mmolC m−2d−1; Lockwood et al., 2012) and similar to, or lower than, those from high latitude regions such as Alaska (250 mmolC m−2d−1; Palevsky et al., 2013).
Overall, the values measured as new production, export production, and the NCP were similar but within a large uncertainty. The arithmetic mean of all of the measured values was 8 ± 5 molC m−2yr−1. However, the discrepancy between the 15N incubation-based measurement (Kwak et al., 2013b) and other estimates (Hahm and Kim, 2001; Hahm and Kim, 2008; Kim et al., 2009; Hahm et al., 2019b) needs to be resolved.
Sinking POC flux in the deep-sea interior
Using a mass balance of 210Po and 210Pb, Hong et al. (Hong et al., 1997; Hong et al., 2008) estimated that the sinking POC flux in the UB at 1000 m was 4.5 and 0.6 mmolC m−2d−1 in spring and fall, respectively (1.9 mmolC m−2d−1 on average). Later, Kim et al. (2017) reported year-round results of the sinking particle flux. The POC flux at 1000 m reflected the temporal variations in PP in the surface waters, with a prominent spring peak and a smaller fall peak (Kwak et al., 2013a; Joo et al., 2014). The POC flux varied between 0.2 and 4.4 mmolC m−2d−1 (with an average of 1.7 mmolC m−2d−1) at 1000 m, and between 0.7 and 4.7 mmolC m−2d−1 (with an average of 2.1 mmolC m–2d–1) at 2300 m (20 m above the seafloor).
Otosaka et al. (Otosaka et al., 2004; Otosaka et al., 2008) reported a time series of sediment trap results from the JB and YB between 2000 and 2002. The annual sinking POC fluxes were 2.6 and 1.4 mmolC m−2d−1 at 927 and 2746 m, respectively, in the western (W)-JB (Table 3); 1.0 and 0.5 mmolC m−2d−1 at 1057 and 3043 m, respectively, in the eastern (E)-JB; and 2.0 and 1.5 mmolC m−2d−1 at 1175 and 2100 m, respectively, in the YB. Based on data from sediment traps at four locations, the sinking POC flux was the highest in the W-JB and lowest in E-JB. The annual average POC flux at ~1000 m (sampling-duration weighted) was 2.1, 2.6, 1.0, and 2.0 mmolC m−2d−1, in the UB, W-JB, E-JB, and YB, respectively, which corresponds to between 2% and 5% of the annual PP (Table 3). The spatial distribution of the POC flux is not consistent with that of PP based on satellite observations (Yamada et al., 2005). However, the spatial comparison of the sinking POC fluxes obtained at different times is difficult because of temporal variability and will require more data to be obtained simultaneously.
The biogenic particle flux at 1000 m in the UB was dominated by opal, accounting for ~62% of the sinking material (Kim et al., 2017). The opal dominance was also observed in the YB (Otosaka et al., 2004). The opal dominance is consistent with diatom dominance and low contribution from prymnesiophytes (a major producer of CaCO3) in the phytoplankton community in this region (Kwak et al., 2013a). The CaCO3 accounted for 14% of the sinking particles (Kim et al., 2017). The CaCO3 peak flux followed that of opal with a time lag of 50–70 days. The biogenic components at greater depths varied in a similar fashion to those at 1000 m (Otosaka et al., 2008; Kim et al., 2017).
A notable feature of sinking particles is the high lithogenic material content, especially close to the seafloor. The lithogenic material accounted for 34% of the sinking particles at 1000 m and for an even larger fraction (40%–60%) at 2300 m in the UB (Kim et al., 2017). This feature was also observed in the other basins of the EJS. The proportion of lithogenic material ranged from 14% to 51% and 9% to 65% at 1175 and 2100 m, respectively, in the W-JB; 16% to 38% and 30% to 60% at 1057 and 3043 m, respectively, in the E-JB; and 20% to 55% and 30% to 64% at 1175 and 2100 m, respectively, in the YB (Otosaka et al., 2004). The negative correlation generally observed in the EJS between the radiocarbon content of sinking POC and the lithogenic content of the sinking particles implies that the older POC in the sinking particles was derived mostly from sediment resuspension (Otosaka et al., 2008; Kim et al., 2017; Kim et al., 2020). The lateral supply of POC explains why POC fluxes at deeper depths, especially at depths close to the seafloor, were greater than those observed at ~1000 m. Thus, the supply of resuspended sedimentary POC to the water column is an important feature of organic carbon cycling in the EJS.
Otosaka et al. (2004) showed that large fractions of sinking particles in the JB and YB were lithogenic material of various sources, including fresh particles supplied by aeolian dust fallout, old particles transported by the TSW, and Island-Arc detritus. Stable carbon isotope ratio (δ13C) of sinking POC observed at a depth of ~1000 m was in the range −21.8 ‰ to −25.0 in the eastern JB (Nakanishi and Minagawa, 2003) and −22.0 ‰ to −24.7 ‰ in the UB (Kim et al., 2017). These values are similar to or lower than the values typically observed for marine POC (Degens, 1969), suggesting potential input of terrigenous POC.
Quasi-continuous time series data of the sinking particle flux and composition were obtained between 2011 and 2017 in the UB (Kim et al., 2020) and showed an increased particle flux during the 2015–16 El Niño. The POC transfer efficiency (POC flux/PP) was significantly higher during this period, thus implying that organic carbon sequestration is affected by interannual variations in physical forcing (Kim et al., 2020).
Microbially mediated organic carbon cycles in the water column and sediment
In the UB, during the spring bloom induced by coastal upwelling, BP accounted for 20% to 25% of PP along the stream and 58% of PP at the center of the Ulleung Warm Eddy (Hyun et al., 2009). These results indicate that BP is closely coupled to organic substrates produced by phytoplankton, and heterotrophic bacteria are a significant component in the channeling of photosynthetically fixed carbon in the UB. In spring, BP in the surface waters of the UB was 130–200 μmolC m−3d−1, which is comparable with that reported in highly productive upwelling systems, such as the Iberian upwelling system (33–3997 μmolC m−3d−1) and the Benguela upwelling system (8.3–416 μmolC m−3d−1; Hyun et al., 2009; Kim et al., 2017). The large supply of DOC derived from the high PP caused by the upwelling appears to stimulate bacterial metabolism.
High DOC concentrations and the bio-reactive properties of DOC (Kim et al., 2017) are probably linked to the high BP in the deeper waters (i.e., water depths of 750–2000 m) of the UB. The BP values in the deeper waters (1.7–3.3 μmolC m−3d−1) were among the highest observed in various meso- and bathy-pelagic water columns, including the North Atlantic Basin (0.4–1.1 μmolC m−3d−1; 1000–3870 m depth), the NW African upwelling site (0.2–1.7 μmolC m−3d−1; 2000 m depth), and the Mediterranean Sea (0.1–0.5 μmolC m−3d−1; 1000–2000 m depth; Hyun et al., 2022).
Geochemical analysis of the sediment along the continental shelf, slope, and rise of the UB revealed that the sedimentary organic carbon (SOC) content in the surface sediment of the central UB was exceptionally high (>2.5% dry wt.), which is comparable to that in the Chilean and Peruvian upwelling regions (Cha et al., 2007; Lee et al., 2008; Hyun et al., 2017). The high export flux and lateral transport of POC along the continental slope of the UB (Kim et al., 2017; Lee et al., 2019) are likely to supply substantial amounts of SOC to the downstream surface sediments. The high SOC content is ultimately responsible for the high benthic SOC remineralization rates. Benthic microbial metabolic activity measured using the diffusive oxygen utilization (DOU) rates in the UB (5.9–7.1 mmol m−2d−1; Hyun et al., 2017) and total oxygen uptake (TOU) rates measured from in situ incubation using a benthic lander (2.0–12 mmolO2 m−2d−1; Lee et al., 2019) were among the highest reported at the same depth range from other continental margins. The total anaerobic respiration estimated using the DIC production rates at the slope (14.0 mmol m−2d−1) and basin (7.2 mmol m−2d−1) sites were also comparable to those measured in the same depth range at a Chilean upwelling site (9.2–11.6 mmol m−2d−1; Thamdrup and Canfield, 1996). Benthic SOC mineralization showed temporal and spatial variations related to the water column productivity. Hyun et al. (2010) reported that SOC oxidation processed by sulfate reduction appeared higher during spring when PP was higher. Spatially, the sulfate reduction rates were always higher at the slope sites where upwelling occurs than at deep basin sites.
Together with the high SOC content, the UB surface sediment is uniquely characterized by the high levels of Mn oxides (>200 µmolCm−3) and Fe oxides (up to 100 µmolCm−3) in the center of the basin (Cha et al., 2007; Hyun et al., 2010). The reduction of Mn and Fe were consistently the dominant SOC oxidation pathways in the center of the UB, accounting for 45% and 20% of total SOC oxidation, respectively. By contrast, in the slope sediments, sulfate reduction was the dominant SOC oxidation pathway, accounting for 50% of total SOC mineralization (Hyun et al., 2017). Based on RNA-stable isotope probing (RNA-SIP), microorganisms affiliated with Colwelliaceae and Oceanospirillaceae were identified as putative acetate-oxidizing Mn-reducing bacteria in the center of the UB, whereas no sulfate reducing bacteria were labeled (Vandieken et al., 2012; Cho et al., 2020). Instead, in the slope sediments where sulfate reduction dominates the SOC oxidation pathways, Desulfobacteraceae, known as putative sulfate reducing bacteria, constituted a major SOC-oxidizing clade, comprising 22% of the total bacterial 16S rRNA sequences (Cho et al., 2020).
Sedimentary organic carbon (SOC) accumulation rate
Continental margins are an important SOC reservoir and store between 80% and 90% of global marine sediment while occupying only ~20% of the oceanic surface area (Keil, 2017). Studies based on the vertical distribution of the excess 210Pb in the UB yielded apparent sedimentation rates (ASR) of 0.02–0.2 cm yr−1, decreasing with increasing bottom depth from the shelf to the central basin (Hong et al., 1997; Cha et al., 2005; Cha et al., 2007; Lee et al., 2008; Lee et al., 2010). In addition to the 210Pb, Kim and Park (2003) used the activity of 7Be, 234Th, and 137Cs and reported ASR values of 0.06–0.08 cm yr−1 in the UB. Gal et al. (2019) estimated the ASR on the slope of the UB to be 0.15 cm yr−1 for the last 240 yr, based on 210Pb and 137Cs dating.
Hong et al. (1999) reported 210Pb derived mass accumulation rates of 22, 11, 18, and 71 mg cm−2yr−1 from the UB, central JB, Yamato Ridge, and Korea Plateau (Figure 3). Later, Otosaka et al. (2006) presented mass accumulation rates of 24, 58, 26, and 15 mg cm−2yr−1 from the UB, western JB, eastern JB, and southern YB (Figure 3).
Lee et al. (2010) reported input fluxes of SOC to sediment ranging from 0.66 to 0.92 molC m−2yr−1 (0.80 molC m−2yr−1 on average), and burial fluxes (below a sediment depth of 15 cm) of SOC ranging from 0.17 to 0.26 molC m−2yr−1 in the UB (Table 3). Therefore, 0.49 to 0.67 molC m−2yr−1 is remineralized after settling to the seafloor (Lee et al., 2010). The input flux, regenerated flux, and burial flux to the sediment in the UB corresponds to approximately 4%, 3%, and 1%, respectively, of the PP (Lee et al., 2010). Recently, Lee et al. (2019) measured the vertical distributions of SOC content and sedimentation rates, estimated using excess 210Pb, at nine stations from the slope to the basin in the UB. The burial fluxes of SOC were 4.00 ± 0.36 and 0.25 ± 0.01 molC m−2yr−1 on the slope near the Korea Strait and in the basin, respectively (mean = 1.75 ± 0.25 molC m−2yr−1). Those authors proposed that a significant fraction of the SOC in sediment (47% to 86%) is supplied by lateral transport down-slope from the shelf.
The SOC accumulation rate is higher on the slope than in the central basin (Figure 3; Hong et al., 1999; Cha et al., 2007), with rates of 0.3, 0.2, 0.2, and 4.8 molC cm−2yr−1 reported from the UB, central JB, Yamato Ridge, and Korea Plateau, respectively (Hong et al., 1999; Lee et al., 2008; Lee et al., 2010). However, so far, only sparse data exist. Studies with wider coverage and a higher spatial resolution (e.g., Bao et al., 2016), as well as use of source-specific proxies (e.g., Cao et al., 2022), will be required if we are to better understand the sources and accumulation of marine SOC. Furthermore, it will be necessary to obtain the permanent burial rate below the reaction (and/or bioturbated) layer using radiocarbon dating.
Figure 3
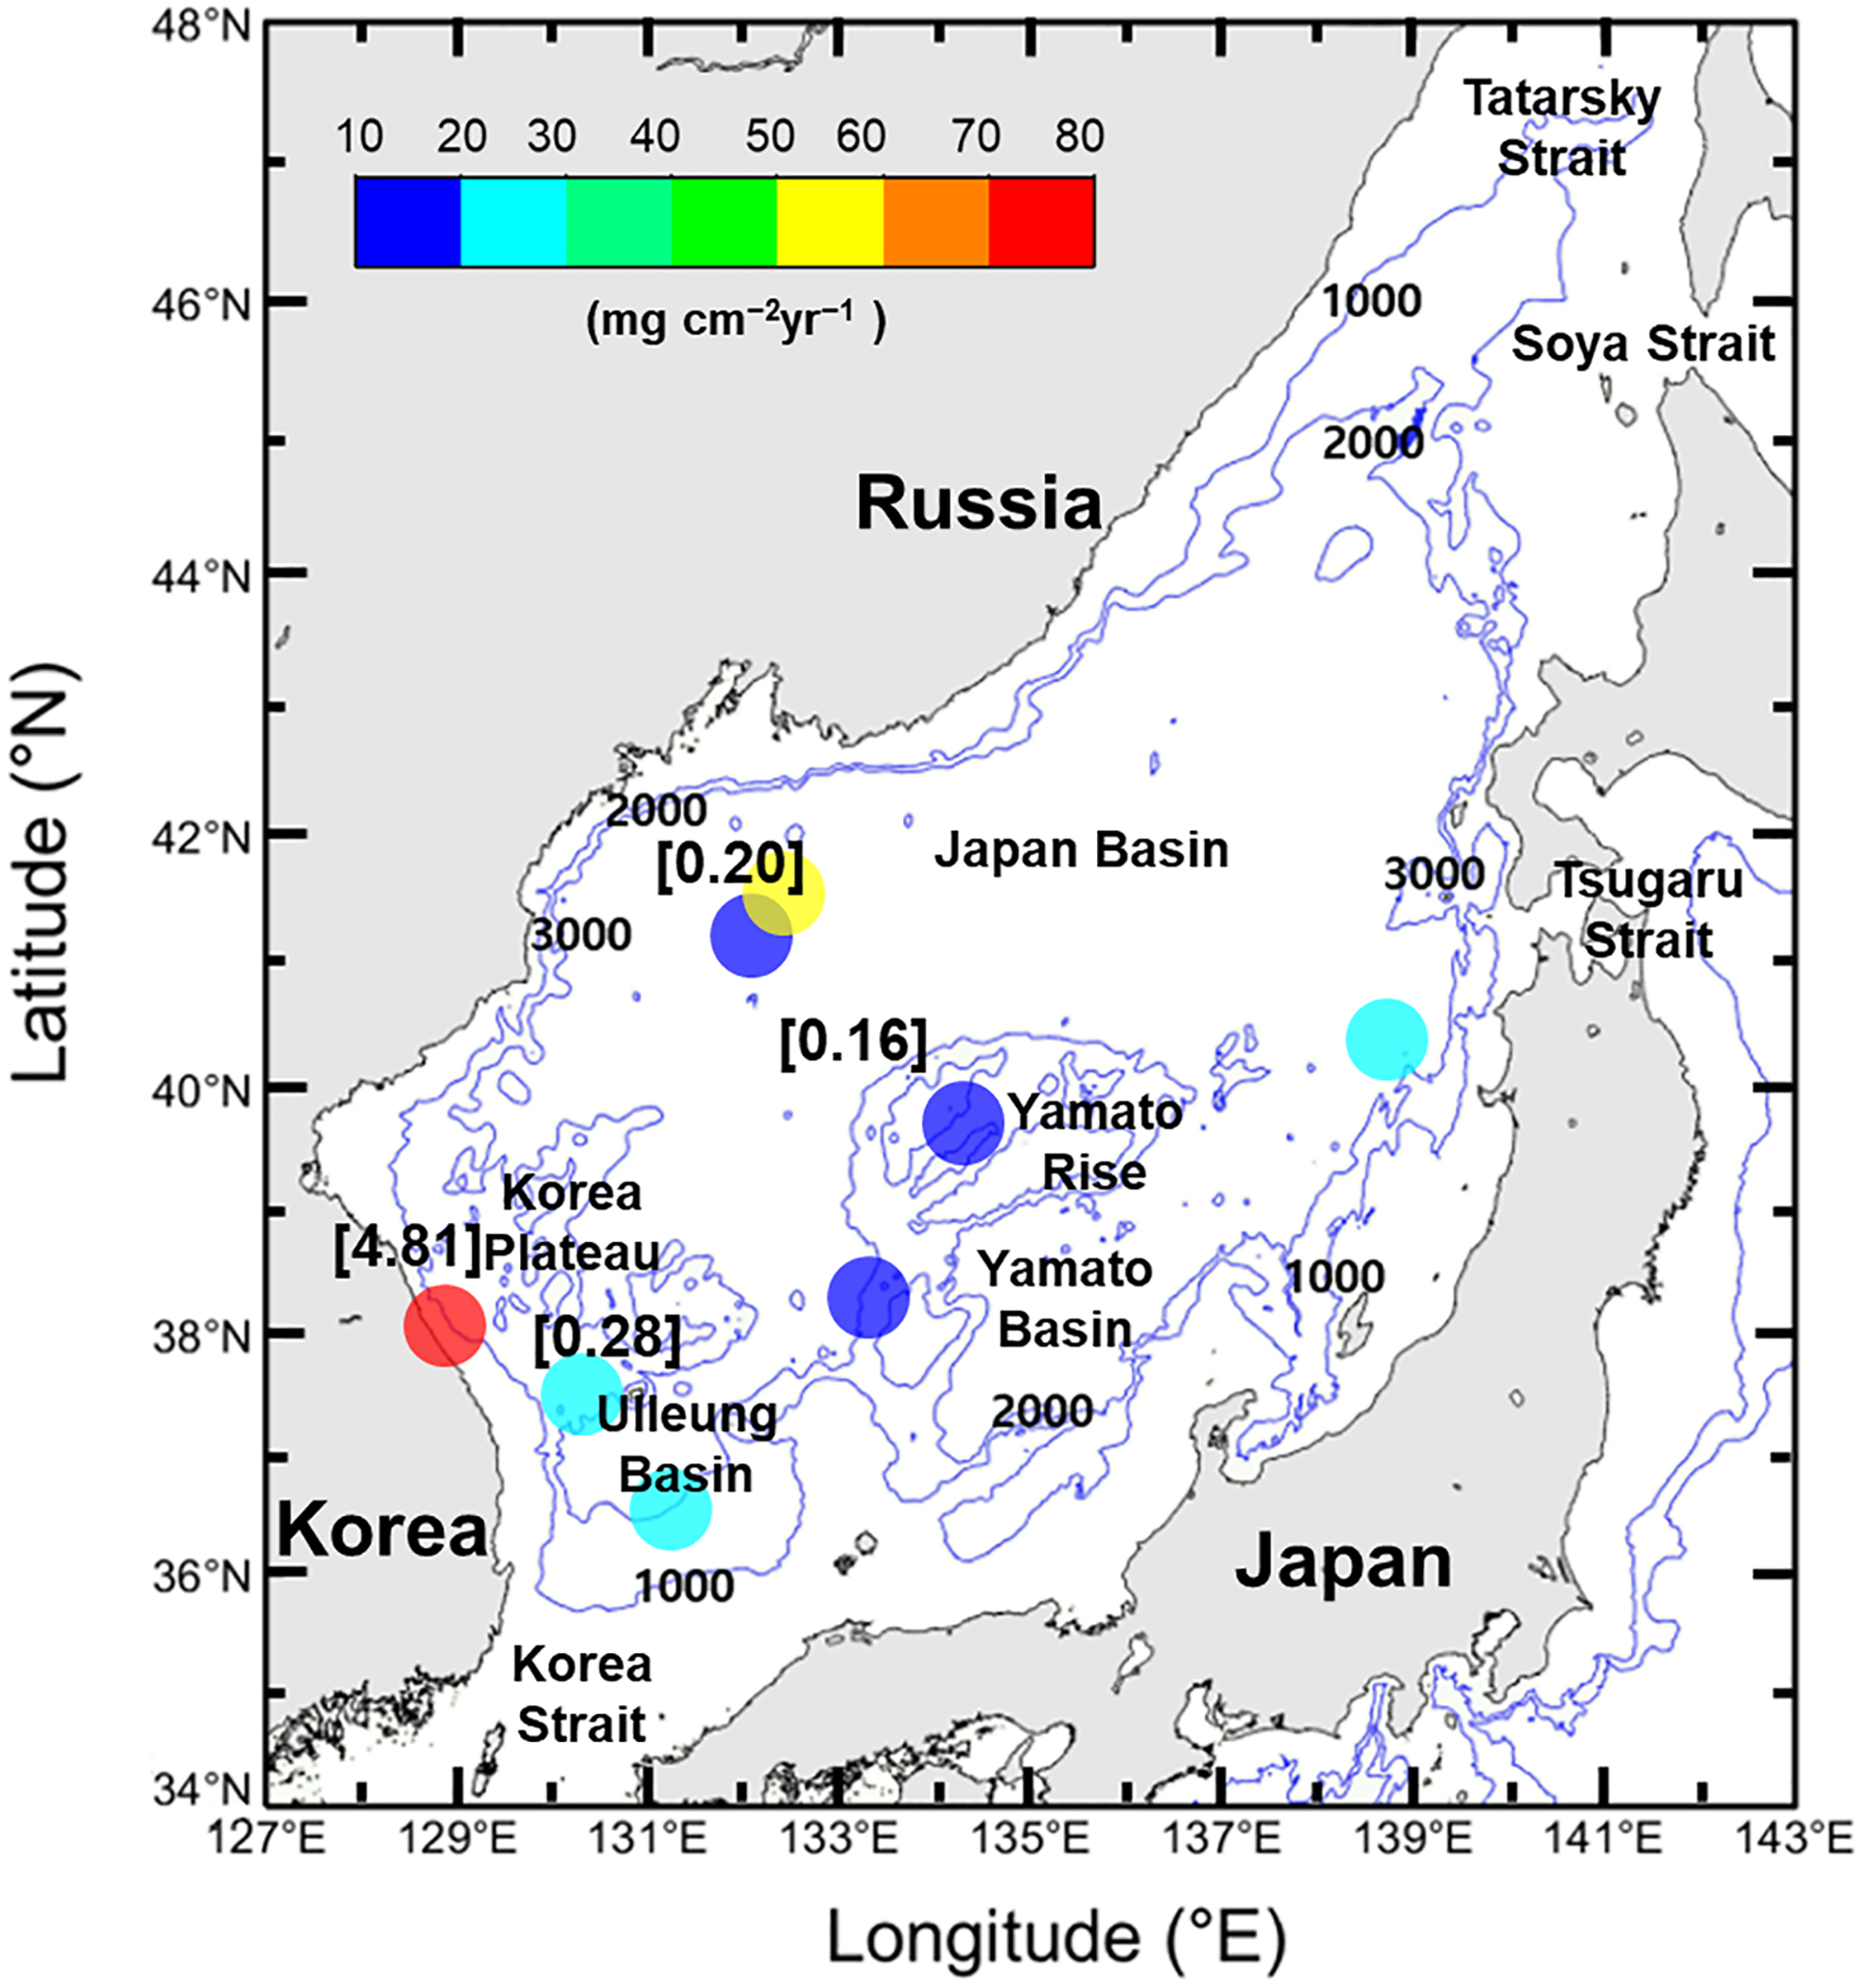
Mass accumulation rate (colored circles; mg cm−2yr−1) and SOC accumulation rate (values in brackets; molC cm−2yr−1) in the EJS.
Stoichiometry of C, O, N, P in particulate and dissolved forms
Chen et al. (1996b) reported ratios of biologically important elements (i.e., C, H, N, S, O, P) in suspended particulate organic matter in surface waters of the EJS and other marginal seas in the western North Pacific. C:N molar ratio of the particulate organic matter samples in the EJS was 10 ± 2 (n=17). C:N molar ratio of sinking particles intercepted at a depth of ~1000 m was in the range of 6.8−9.0 with an annual mean of 7.8 in the eastern JB (Nakanishi and Minagawa, 2003) and in the range of 8.3−10.2 with an annual mean of 9.0 in the UB (Kim et al., 2017). Thus, the C:N molar ratios observed for suspended particles in surface waters and for sinking particles are similar to, or slightly higher than the Redfield ratio of 6.6. To our knowledge, particulate P content data in sinking particles are missing for the EJS.
Dissolved inorganic nitrate (DIN) and phosphate (DIP) are depleted in the surface waters and their concentrations increase rapidly with increasing depth to ~500 m and then more slowly to ~1000 m, below which are constant (Chen et al., 1996a; Kim and Kim, 2013; Figure 2). The concentrations of DIN and DIP do not exhibit any significant basin-to-basin differences in the deep waters (Figure 2). The N:P ratios observed between 2001 and 2009 were always lower than 10 in the mixed layer (10–30 m) (Kim and Kim, 2013). An interesting point is the low N:P ratio (~13) in the deep waters (Chen et al., 1996a; Kim et al., 2010; Kim and Kim, 2013). Kim and Kim (2013) explained the low N:P ratios as being the result of the combined effects of the rapid supply of surface water with a low N:P ratio into the deep water and the remineralization of sinking particulate organic matter supplying nutrients according to the Redfield ratio (Figure 4).
Figure 4
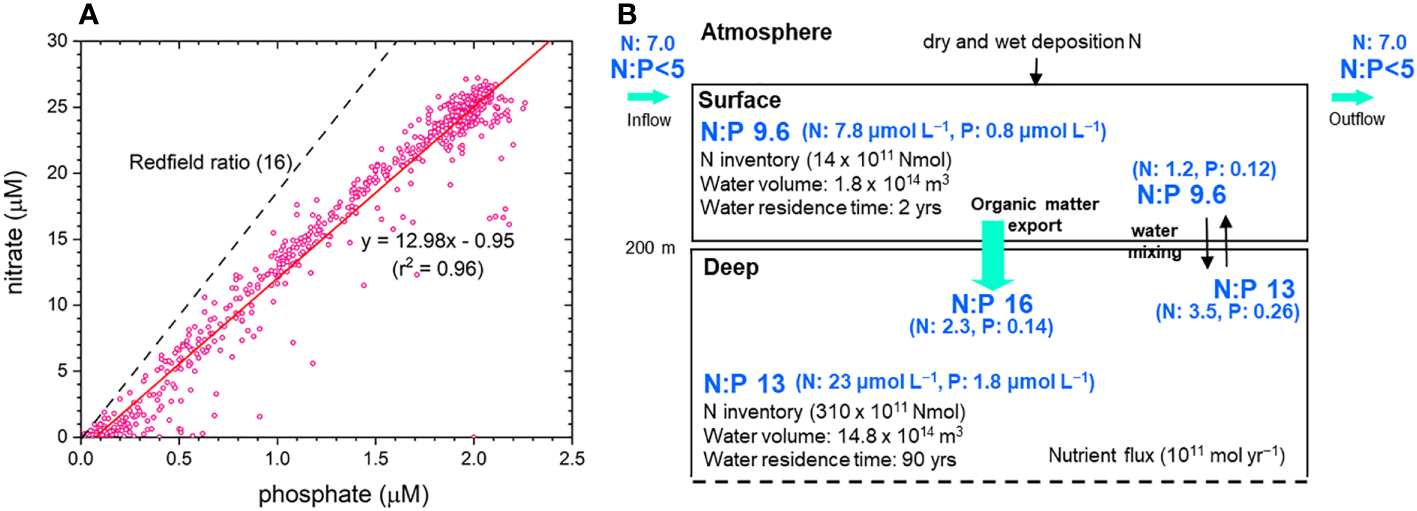
(A) Cross-plot of nitrate and phosphate for the entire water column. (B) Nutrient budgets for the surface and deep waters of the EJS (redrawn from Kim and Kim, 2013).
Chen et al. (1996a) used a mass-balance method to estimate the elemental ratios for the waters deeper than 2000 m. The resultant ratio of C:O:N:P was 98:125:13:1. Na et al. (2022) also observed that the ratio of the increase in AOU to that in DIC in the layer deeper than 500 m was ~1.3. Thus, the ratio of C:O is similar to the canonical ratio of 106:138 for CO2:O2 associated with the photosynthesis and respiration of organic matter (Redfield, 1958).
Chen et al. (1996a) also estimated regeneration rates for elements for the layer between 300 m and 600 m, and the layer deeper than 2000 m in the EJS, using the turnover times of 18.2 yr and 120 yr, respectively. For the deeper layer among the two, the organic carbon decomposition rate was 0.89 µmol kg–1yr–1 with the oxygen consumption rate being 1.13 µmol kg–1yr–1. Regeneration rates for nitrate and phosphate were 0.12 µmol kg–1yr–1 and 0.009 µmol kg–1yr–1, respectively. If integrated over 1000 m-thick layer below the 2000 m horizon, the organic carbon decomposition rate would amount to 0.89 molC m–2yr–1, which is in the same order of magnitude with the POC flux observed at ~2000 in the EJS (0.2-0.8 molC m–2yr–1, Table 3). However, sinking POC flux data are much more limited than DO and DIC data for comparison. Later, Chen et al. (1999) added consumption or production rates of C, O, and nutrients at depths of 600 m and 2000 m using a 1-D advection-diffusion model (Table 1 of their paper).
Temporal trends
Climate change affects hydrographic properties, water circulation, and, consequently, the biological and biogeochemical properties of the EJS (Chiba et al., 2008; Kim et al., 2021). Joo et al. (2016) showed that PP decreased by 13% between 2003 and 2012 in the EJS. The causes of this observed decrease in PP, and whether this is a long-term trend associated with climate change or part of the natural fluctuations of the EJS, requires further investigation using a longer time series of monitoring data. Recently, Park et al. (2022) examined satellite-observed time series of chlorophyll-a concentrations from the EJS over the period 2003–2020 and found that chlorophyll-a concentration increased in most of the EJS. Wind speed and direction, and SST, which are important physical parameters affecting the long-term trend in chlorophyll-a concentration, also showed characteristic trends and were related to Arctic Oscillation index variability (Park, 2022).
Biogeochemical parameters show temporal trends in relation with the deep circulation change. Increase in potential temperature and decrease in DO in the Deep and Bottom Waters in the EJS have been widely reported (e.g., Kim and Kim, 1996). Accumulation of nutrients, DIC, and TA and increase in AOU in deep waters are expected as a consequence of slowdown of deep water circulation. Na et al. (2022) compared results obtained in 1992, 1999, and 2019 and showed that DIC increased by 21 µmol kg–1, accompanying a commensurate increase in AOU by 29 µmol kg–1 from 1992 to 2019 in the layer below 1000 m in the UB. pH decrease was observed in both estimates from long-term DO data (Chen et al., 2017) and measurements (Na et al., 2022). Recently, Tishchenko et al. (2021) reported a decrease in pH and DO, and an increase in normalized DIC, pCO2, and nutrient concentrations in the subpolar region of the EJS from 1999 to 2014.
Anthropogenic CO2 content is also expected to increase with time. The inventory of the anthropogenic CO2 estimated for 1992 was 0.31 ± 0.05 GtC (Chen et al., 1995). The value increased slightly to 0.40 ± 0.06 GtC for 1999 (Park et al., 2006). Constraining the increasing trend in the anthropogenic CO2 inventory for the last two decades since 1999 is of importance.
Variability in deep water circulation holds a key for the temporal changes in biogeochemical parameters. A possibility of moving towards an anoxic condition in the Bottom Water was raised if DO supply is outpaced by consumption because of a reduction or cessation of new bottom water formation (Chen et al., 1999). Re-initiation of bottom water formation in the EJS (Yoon et al., 2018) will affect the future evolution of the concentrations of the biogeochemical parameters. Continued monitoring of these parameters together with the hydrographic changes in the EJS has an important implication in understanding the future changes in the ocean.
Summary and suggestions for future research
The EJS is a marginal sea with high primary productivity when compared to the adjacent northwestern Pacific. The e-ratio and f-ratio are also high. The EJS is a net sink of atmospheric CO2. The EJS contains ~0.4 GtC of anthropogenic CO2, which is ~1% of the DIC inventory. This value is likely increasing, and continued monitoring is necessary. Sinking particles are dominated by opal and thus, contribution of carbon to DIC in the deep waters from CaCO3 dissolution is much smaller than organic matter decomposition. The DIC/TA ratio is high implying vulnerable nature of the EJS to acidification. Molar ratios of C:N and CO2:O2 in dissolved forms are similar to those in the Pacific. However, N:P molar ratio, ~13, is significantly lower than the Redfield ratio. The concentration of DOC is higher than in the Pacific, which needs further research to reveal the cause(s) and the implication on microbial carbon pump.
A schematic representation of the biological pump in the EJS, focusing particularly on the UB, is shown in Figure 5. The PP, calculated from in situ and satellite-based studies, is 18–23 molC m−2yr−1 (Figure 5; Kwak et al., 2013a; Joo et al., 2014). New production and NCP estimated by various methods is 5–20 molC m−2yr−1 in the UB (Hahm and Kim, 2001; Hahm and Kim, 2008; Kim et al., 2009; Kwak et al., 2013b; Hahm et al., 2019b). The sinking POC flux is ~0.8 molC m−2yr−1 at ~1000 m in the central basin, and 2.0–2.7 molC m−2yr−1 at ~700 m on the slope (Kwak et al., 2017; Kim et al., 2017; Kim et al., 2020). SOC is buried at a rate of 0.2–4.2 molC m−2yr−1 (Cha et al., 2007; Lee et al., 2008; Lee et al., 2010). A significant fraction of the SOC is supplied by lateral transport down-slope from the shelf.
Figure 5
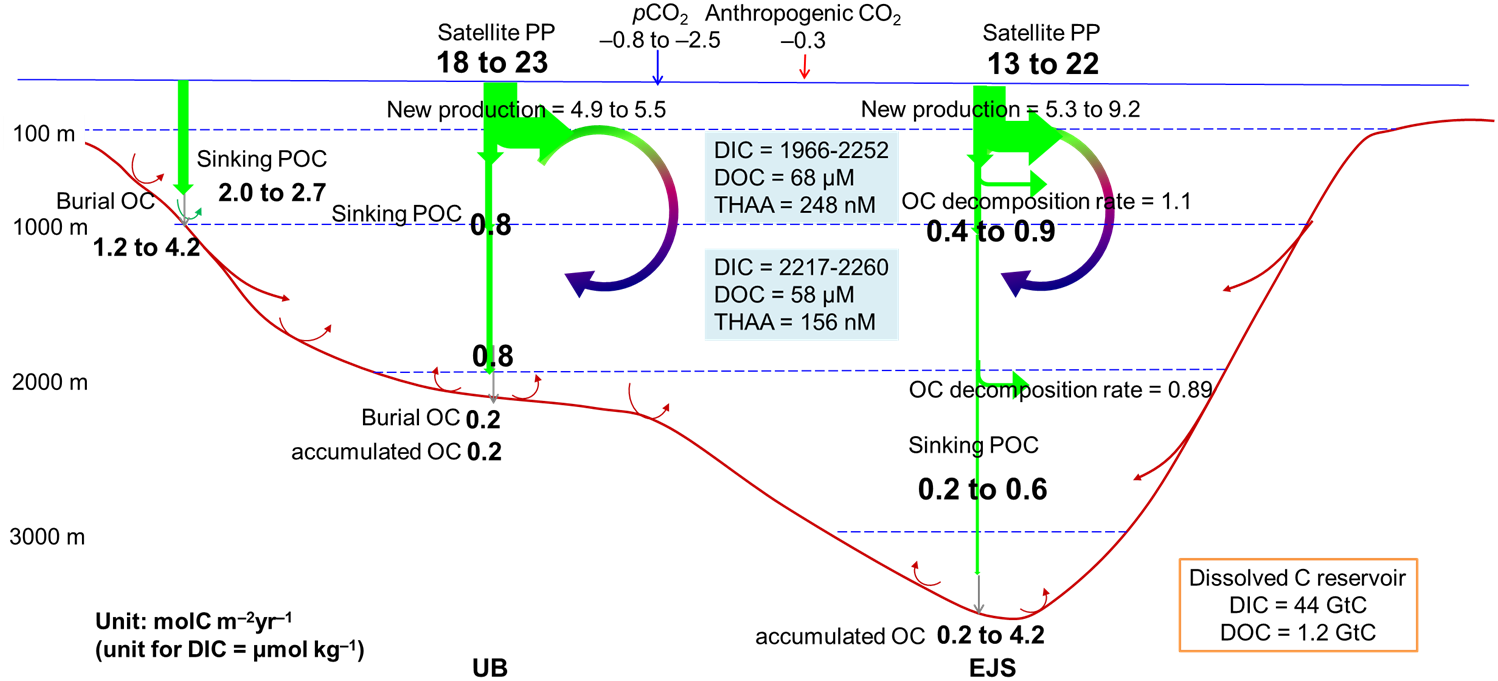
Schematic diagram summarizing carbon fluxes and reservoirs in the UB (left-hand side arrows and values) and overall in the EJS (right-hand side). Fluxes are given in molC m−2yr−1 and concentrations are given in μmol kg−1 unless otherwise indicated.
These processes are most probably affected by climatic variability. Having a short turnover time, the effect of climatic variability is reflected in temporal trends in biogeochemical parameters for the last several decades. pH, calcium carbon saturation status, and DO concentration in the deep waters have decreased, whereas DIC and AOU have increased. Long-term time series, collected either remotely or by field observations, are essential if we are to detect any changes associated with the ongoing climate changes (Lee and Park, 2019; Lee et al., 2022).
We recommend the adoption of various new approaches to complement observations and in situ measurements, and extend spatial coverage. Modelling studies and machine learning need to be coordinated with field observations and satellite remote sensing (Lee and Yoo, 2016; Restreppo et al., 2020; Li et al., 2022). For example, Jeong et al. (2022) used monthly mean ocean reanalysis system 4 data to investigate the long-term surface warming trend in the EJS. Han et al. (2021) estimated the turnover times of the ES MOC by using a global HYCOM reanalysis with data assimilation for a 20-yr period (1993–2012) in addition to the previous estimates based on chemical tracers. A 3-D physical–biogeochemical coupled model experiment applied to the Yellow Sea could also be used in the EJS (Tak et al., 2022).
Adopting new technologies will help improve observational resolution and spatial coverage. POC flux and remineralization in the layer between the bottom of the surface mixed layer (or euphotic zone) and a depth of ~1000 m (commonly referred to as the twilight zone; Buesseler, 1991; Buesseler et al., 2007) has been relatively poorly studied. Underwater gliders and the Biogeochemical Argo (BGC-Argo) floats that use physical and bio-geochemical sensors (Park, 2013; Park, 2019) could be used to better understand the processes in the twilight zone. At the same time, episodic in situ deployments of free drifting, neutrally buoyant traps in the twilight zone may provide critical data on the export flux in the upper ocean. State-of-the-art analytical techniques, such as long-chain diols used as a nutrient proxy (Gal et al., 2021), various biomarkers (Cao et al., 2022), amino acid compositions and their compound-specific 13C and 15N isotopes (Choi et al., 2022), and compound- and/or density-specific 14C analysis of sinking particles, would complement the bulk-analysis results.
Our current knowledge gap includes DOC cycling. Further studies are needed to provide more data related to the spatial distribution of DOC concentrations (e.g., YB) and better characterization of FDOM and THAA. DOC 14C data will shed light on the sources and ages of DOC in the EJS. Quantifying the microbial carbon pump is also necessary.
As a miniature ocean, studies of the biogeochemical changes in the EJS, which occur at faster rates than in the ocean, can help us to better understand oceanic processes. Therefore, it is important to monitor these changes by using well-designed, multi-disciplinary, long-term observations. Although rapid horizontal deep-water circulation homogenizes many biogeochemical parameters, the spatial distribution of some rapidly changing parameters may be potentially heterogeneous and thus requires basin-wide measurements. In this sense, international collaboration among the countries bordering the EJS is crucial, as exemplified by the Circulation Research of the East Asian Marginal Seas (CREAMS) program (Kim and Kim, 1996; Talley et al., 2004).
Funding
This research forms part of the ‘Deep Water Circulation and Material Cycling in the East Sea (20160400)’ project funded by the Ministry of Oceans and Fisheries, South Korea.
Acknowledgments
We thank Kyung-Ryul Kim and Kyung-Il Chang for their leadership in the earlier research in the EJS, the graduate students at Seoul National University for providing early data and discussion of a draft of the paper, and Yejin Ryu for drawing Figure 1.
Publisher’s note
All claims expressed in this article are solely those of the authors and do not necessarily represent those of their affiliated organizations, or those of the publisher, the editors and the reviewers. Any product that may be evaluated in this article, or claim that may be made by its manufacturer, is not guaranteed or endorsed by the publisher.
Statements
Author contributions
JH (hereafter, corresponds to Jeomshik Hwang) and GK designed the study. MK and JH led the writing of the paper. All co-authors contributed to the writing of the paper through discussion and helpful reviews of the manuscript. All authors contributed to the article and approved the submitted version.
Conflict of interest
The authors declare that the research was conducted in the absence of any commercial or financial relationships that could be construed as a potential conflict of interest.
References
1
Aramaki T. Tanaka S. S. Kushibashi S. Kim Y. I. Kim C. J. Hong G. H. et al . (2013). Spatial distribution of radiocarbon in the southwestern Japan/East Sea immediately after bottom water renewal. Radiocarbon55, 1675–1682. doi: 10.1017/S0033822200048591
2
Ashjian C. J. Davis C. S. Gallager S. M. Alatalo P. (2005). Characterization of the zooplankton community, size composition, and distribution in relation to hydrography in the Japan/East Sea. Deep-Sea Res. II.52, 1363–1392. doi: 10.1016/j.dsr2.2005.05.001
3
Bao R. McIntyre C. Zhao M. Zhu C. Kao S. Eglinton T. I. (2016). Widespread dispersal and aging of organic carbon in shallow marginal seas. Geology44, 791–794. doi: 10.1130/G37948.1
4
Basu S. Mackey K. R. M. (2018). Phytoplankton as key mediators of the biological carbon pump: their responses to a changing climate. Sustain10, 1. doi: 10.3390/su10030869
5
Behrenfeld M. J. Falkowski P. G. (1997). Photosynthetic rates derived from satellite-based chlorophyll concentration. Limnol. Oceanogr.42 (1), 1–20. doi: 10.4319/lo.1997.42.1.0001
6
Bro R. (1997). PARAFAC. tutorial and applications. Chemometr Intell. Lab.38, 149–171. doi: 10.1016/S0169-7439(97)00032-4
7
Buesseler K. O. (1991). Do upper-ocean sediment traps provide an accurate record of particle flux? Nature353 (6343), 420–423. doi: 10.1038/353420a0
8
Buesseler K. O. Antia A. N. Chen M. Fowler S. W. Gardner W. D. Gustafsson O. et al . (2007). An assessment of the use of sediment traps for estimating upper ocean particle fluxes. J. Mar. Res.65, 345–416. doi: 10.1357/002224007781567621
9
Buesseler K. O. Benitez-Nelson C. R. Roca-Marti M. Wyatt A. M. Resplandy L. Clevenger S. J. et al . (2020). High resolution spatial and temporal measurements of particulate organic carbon flux using thorium-234 in the NE pacific ocean during the EXPORTS program. Elementa: Sci. Anthropocene8 (1), 030. doi: 10.1525/elementa.2020.030
10
Byun S. K. Seung Y. H. (1984). “Description of current structure and coastal upwelling in the southwest Japan Sea–summer 1981 and spring 1982,” in Ocean hydrodynamics of the Japan and East China seas. Ed. IchiyeT. (Netherlands: Elsevier), 83–93.
11
Cao Y. Bi R. Wang X. Chen X. Hu J. Wang Y. et al . (2022). The sources and burial of marine organic carbon in the Eastern China marginal seas. Front. Mar. Sci.9. doi: 10.3389/fmars.2022.824181
12
Cha H. J. Choi M. S. Lee C. B. Shin D.-H . (2007). Geochemistry of surface sediments in the southwestern East/Japan Sea. J. Asian Earth Sci.29, 685–697. doi: 10.1016/j.jseaes.2006.04.009
13
Cha H. J. Lee C. B. Kim B. S. Choi M. S. Ruttenberg K. (2005). Early diagenetic redistribution and burial of phosphorus in the sediments of the southwestern East Sea (Japan Sea). Mar. Geol.216, 127–143. doi: 10.1016/j.margeo.2005.02.001
14
Chang K. I. Hogg N. G. Suk M. S. Byun S. K. Kim Y. G. Kim K. (2002). Mean flow and variability in the southwestern East Sea. Deep Sea Res. I.49, 2261–2279. doi: 10.1016/S0967-0637(02)00120-6
15
Chang K.-I. Teague W. J. Lyu S. J. Perkins H. T. Lee D.-K. Watts D. R. et al . (2004). Circulation and currents in the southwestern East/Japan Sea: Overview and review. Prog. Oceanogr.61, 105–156. doi: 10.1016/j.pocean.2004.06.005
16
Chen C.-T. A. (2011). Microbial carbon pump: additional considerations. Nat. Rev. Microbiol.9 (7), 555–555. doi: 10.1038/nrmicro2386-c4
17
Chen C.-T. A. Andreev A. Kim K. R. Yamamoto M. (2004). Roles of continental shelves and marginal seas in the biogeochemical cycles of the north pacific ocean. J. Oceanogr.60 (1), 17–44. doi: 10.1023/B:JOCE.0000038316.56018.d4
18
Chen C.-T. A. Bychkov A. S. Wang S. L. Pavlova G. Y. (1999). An anoxic Sea of Japan by the year 2200? Mar. Chem.67 (3-4), 249–265. doi: 10.1016/S0304-4203(99)00074-2
19
Chen C.-T. A. Gong G. C. Wang S. L. Bychkov A. S. (1996a). Redfield ratios and regeneration rates of particulate matter in the Sea of Japan as a model of closed system. Geophys. Res. Lett.23 (14), 1785–1788. doi: 10.1029/96GL01676
20
Chen C.-T. Huang T. H. Chen Y. C. Bai Y. He X. Kang Y. (2013). Air-sea exchanges of CO2 in the world’s coastal seas. Biogeosciences10 (10), 6509–6544. doi: 10.5194/bg-10-6509-2013
21
Chen C.-T. A. Lin C.-M. Huang B.-T. Change L.-F. (1996b). Stoichiometry of carbon, hydrogen, nitrogen, sulfur and oxygen in the particulate matter of the western north pacific marginal seas. Mar. Chem.54, 179–190. doi: 10.1016/0304-4203(96)00021-7
22
Chen C.-T. A. Lui H.-K. Hsieh C.-H. Yanagi T. Kosugi N. Ishii M. et al . (2017). Deep oceans may acidify faster than anticipated due to global warming. Nat. Clim. Change7, 890–894. doi: 10.1038/s41558-017-0003-y
23
Chen C.-T. A. Wang S. L. Bychkov A. S. (1995). Carbonate chemistry of the Sea of Japan. J. Geophys. Res. Oceans100, 13737–13745. doi: 10.1029/95JC00939
24
Chiba S. Aita M. N. Tadokoro K. Saino T. Sugisaki H. Nakata K. (2008). From climate regime shifts to lower-trophic level phenology: synthesis of recent progress in retrospective studies of the western north pacific. Prog. Oceanogr.77, 112–126. doi: 10.1016/j.pocean.2008.03.004
25
Choi H. Hwang J. Kim G. Shin K. H. (2022). Seasonal trophic dynamics of sinking particles in the ulleung basin of the East Sea (Japan sea): An approach employing nitrogen isotopes of amino acids. Front. Mar. Sci9. doi: 10.3389/fmars.2022.824479
26
Choi S. H. Kim D. Shim J. H. Kim K. H. Min and K.R. Kim H. S. (2012). Seasonal variations of surface fCO2 and sea-air CO2 fluxes in the ulleung basin of the East/Japan Sea. Terr. Atmos. Ocean. Sci.23 (3), 343–353. doi: 10.3319/TAO.2012.01.19.01(Oc)
27
Choi J. K. Noh J. H. Orlova T. Park M. O. Lee S. H. Park Y. J. et al . (2016). “Phytoplankton and primary production,” in Oceanography of the East Sea (Japan Sea) (Cham: Springer), 217–245. doi: 10.1007/978-3-319-22720-7_10
28
Cho H. Kim B. Mok J. S. Choi A. Thamdrup B. Hyun J. H. (2020). Acetate-utilizing microbial communities revealed by stable-isotope probing in sediment underlying the upwelling system of the ulleung basin, East Sea. Mar. Ecol. Prog. Ser.634, 45–61. doi: 10.3354/meps13182
29
Degens E. T. (1969). “Biogeochemistry of stable carbon isotopes,” in Organic geochemistry. Eds. EglintonG.MurphyM. T. J. (New York: Elsevier), 304–329.
30
Ding L. Ge T. Wang X. (2019). Dissolved organic carbon dynamics in the East China Sea and the northwest pacific ocean. Ocean. Sci.15, 1177–1190. doi: 10.5194/os-15-1177-2019
31
Dugdale R. C. Wilkerson F. P. (1992). “Nutrient limitation of new production,” in Primary productivity and biogeochemical cycles in the sea. Eds. FalkowskiP. G.WoodheadA. D. (New York: Plenum), 107–122.
32
Edwards K. F. Thomas M. K. Klausmeier C. A. Litchman E. (2015). Light and growth in marine phytoplankton: allometric, taxonomic, and environmental variation. Limnol. Oceanogr.60 (2), 540–552. doi: 10.1002/lno.10033
33
Eppley R. W. Peterson B. J. (1979). Particulate organic matter flux and planktonic new production in the deep ocean. Nature282, 677–680. doi: 10.1038/282677a0
34
Falkowski P. G. Barber R. T. Smetacek C. (1998). Biogeochemical controls and feedbacks on ocean primary production. Science281, 677–687. doi: 10.1126/science.281.5374.200
35
Feely R. A. Sabine C. L. Byrne R. H. Millero F. J. Dickson A. G. Wanninkhof R. et al . (2012). Decadal changes in the aragonite and calcite saturation state of the pacific ocean. Global Biogeochem. Cy.26, GB3001. doi: 10.1029/2011GB004157
36
Ferrón S. Wilson S. T. Martínez-García S. Quay P. D. Karl D. M. (2015). Metabolic balance in the mixed layer of the oligotrophic north pacific ocean from diel changes in O2/Ar saturation ratios. Geophys. Res. Lett.42, 3421–3430. doi: 10.1002/2015GL063555
37
Gal J.-K. Kim J.-H. Kim S. Hwang J. Shin K.-H. (2021). Assessment of the nutrient diol index (NDI) as a sea surface nutrient proxy using sinking particles in the East Sea. Mar. Chem.231, 103937. doi: 10.1016/j.marchem.2021.103937
38
Gal J. K. Kim J.-H. Kim S. Lee S. H. Yoo K. C. Shin K. H. (2019). Application of the newly developed nutrient diol index (NDI) as a sea surface nutrient proxy in the East Sea for the last 240 years. Quat. Int.503, 146–152. doi: 10.1016/j.quaint.2018.11.003
39
Gamo T. (2011). Dissolved oxygen in the bottom water of the Sea of Japan as a sensitive alarm for global climate change. Trend Anal. Chem.30 (8), 1308–1319. doi: 10.1016/j.trac.2011.06.005
40
Goes J. I. Saino T. Oaku H. Ishizaka J. Wong C. S. Nojiri Y. (2000). Basin scale estimates of sea surface nitrate and new production from remotely sensed sea surface temperature and chlorophyll. Geophys. Res. Lett.27 (9), 1263–1266. doi: 10.1029/1999GL002353
41
Gordon A. L. Giulivi C. F. Lee C. M. Furey H. H. Bower A. Talley L. (2002). Japan/East Sea intrathermocline eddies. J. Phys. Oceanogr.32, 1960–1974. doi: 10.1175/1520-0485(2002)032<1960:JESIE>2.0.CO;2
42
Hahm D. Kim K.-R. (2001). An estimation of the new production in the southern East Sea using helium isotopes. J. Korean Soc Oceanogr.36 (1), 19–26.
43
Hahm D. Kim K.-R. (2008). Observation of bottom water renewal and export production in the Japan basin, East Sea using tritium and helium isotopes. Ocean. Sci. J.43, 39–48. doi: 10.1007/BF03022430
44
Hahm D. Lee I. (2018). Estimation of net community production based on O2/Ar measurements. J. Korean Soc Oceanogr.23, 49–62. doi: 10.7850/jkso.2017.23.1.049
45
Hahm D. Park S. Choi S. H. Kang D. J. Rho T. Lee T. (2019a). Estimation of surface fCO2 in the southwest East Sea using machine learning techniques. J. Korean Soc Oceanogr.24 (3), 375–388.
46
Hahm D. Rhee T. S. Kim H.-C. Jang C. J. Kim Y. S. Park J.-H. (2019b). An observation of primary production enhanced by coastal upwelling in the southwest East/Japan Sea. J. Mar. Sys.195, 30–37. doi: 10.1016/j.jmarsys.2019.03.005
47
Han M. Chang Y. S. Kang H.-W. Kang D.-J. Kim Y. S. (2021). Turnover time of the East Sea (Sea of Japan) meridional overturning circulation. Front. Mar. Sci.8. doi: 10.3389/fmars.2021.768899
48
Han M. Cho Y.-K. Kang H.-W. Nam S. (2020). Decadal changes in meridional overturning circulation in the East Sea (Sea of Japan). J. Phys. Oceanogr.50 (6), 1773–1791. doi: 10.1175/JPO-D-19-0248.1
49
Han H. Cho H. M. Kwon H. K. Kim G. (2021). Fluorescent dissolved organic matter (FDOM) in the East Sea (Japan sea): distributions, sources, and sinks. Ocean. Sci. J.56 (2), 132–140. doi: 10.1007/s12601-021-00014-2
50
Hansell D. A. (2013). Recalcitrant dissolved organic carbon fractions. Ann. Rev. Mar. Sci.5, 3.1–3.25. doi: 10.1146/annurev-marine-120710-100757
51
Hansell D. A. Carlson C. A. (1998). Deep ocean gradients in dissolved organic carbon concentrations. Nature395 (6699), 263–266. doi: 10.1038/26200
52
Hansell D. A. Carlson C. A. (2015). Biogeochemistry of marine dissolved organic matter. 2nd Edn (Amsterdam: Academic Press).
53
Honda M. C. (2020). Effective vertical transport of particulate organic carbon in the Western north pacific subarctic region. Front. Earth Sci.8. doi: 10.3389/feart.2020.00366
54
Honda M. C. Kawakami H. Matsumoto K. Wakita M. Fujiki T. Mino Y. et al . (2015). Comparison of sinking particles in the upper 200 m between subarctic station K2 and subtropical station S1 based on drifting sediment trap experiments. J. Oceanogr.72, 373–386. doi: 10.1007/s10872-015-0280-x
55
Hong G. H. Chen C. T. A. (2002). Aragonitic pteropod flux to the interior of the East Sea (Sea of Japan). Terr. Atmos. Ocean. Sci.13 (2), 205–210. doi: 10.3319/TAO.2002.13.2.205(O)
56
Hong G. H. Kim Y.-I. Baskaran M. Kim S.-H. Chung C.-S. (2008). Distribution of 210 po and export of organic carbon from the euphotic zone in the southwestern East Sea (Sea of Japan). J. Oceanogr.64, 277–292. doi: 10.1007/s10872-008-0022-4
57
Hong G. H. Kim S. Chung C. Kang D.-J. Shin D.-H. Lee H. et al . (1997). 210Pb-derived sediment accumulation rates in the southwestern East Sea (Sea of Japan). Geo-Mar. Lett.17, 126–132. doi: 10.1007/s003670050017
58
Hong G. H. Lee S. H. Kim S. H. Chung C. S. Baskaran M. (1999). Sedimentary fluxes of 90Sr, 137Cs, 239,240 Pu and 210Pb in the East Sea (Sea of Japan). Sci. Total Environ.237, 225–240. doi: 10.1016/S0048-9697(99)00138-2
59
Hyun J. H. Kim B. Han H. Baek Y. J. Lee H. Cho H. et al . (2022). Sediment-derived dissolved organic matter stimulates heterotrophic prokaryotes metabolic activity in overlying deep sea in the ulleung basin, East Sea. Front. Mar. Sci9. doi: 10.3389/fmars.2022.826592
60
Hyun J. H. Kim S. H. Mok J. S. Cho H. Lee T. Vandieken V. et al . (2017). Manganese and iron reduction dominate organic carbon oxidation in surface sediments of the deep ulleung basin, East Sea. Biogeosciences14 (4), 941–958. doi: 10.5194/bg-14-941-2017
61
Hyun J. H. Kim D. Shin C. W. Noh J. H. Yang E. J. Mok J. S. et al . (2009). Enhanced phytoplankton and bacterioplankton production coupled to coastal upwelling and an anticyclonic eddy in the ulleung basin, East Sea. Aquat. Microb. Ecol.54 (1), 45–54. doi: 10.3354/ame01280
62
Hyun J. H. Mok J. S. You O. R. Kim D. Choi D. L. (2010). Variations and controls of sulfate reduction in the continental slope and rise of the ulleung basin off the southeast Korean upwelling system in the East Sea. Geomicrobiol. J.27 (2), 212–222. doi: 10.1080/01490450903456731
63
Iguchi N. (2004). Spatial/temporal variations in zooplankton biomass and ecological characteristics of major species in the southern part of the Japan Sea: a review prog. Oceanogr61 (2–4), 213–225. doi: 10.1016/j.pocean.2004.06.007
64
Imai K. Nojiri Y. Tsurushima N. Saino T. (2002). Time series of seasonal variation of primary productivity at station KNOT (44°N, 155°E) in the sub-arctic western north pacific. Deep Sea Res. Part II.49, 5395–5408. doi: 10.1016/S0967-0645(02)00198-4
65
Jang E. Im J. Park G. H. Park Y. G. (2017). Estimation of fugacity of carbon dioxide in the East Sea using in situ measurements and geostationary ocean color imager satellite data. Remote Sens.9, 821. doi: 10.3390/rs9080821
66
Jenkins W. J. (1988). The use of anthropogenic tritium and helium-3 to study subtropical gyre ventilation and circulation. Philos. Trans. R. Soc London Ser. A.325, 43–61. doi: 10.1098/rsta.1988.0041
67
Jeong Y. Nam S. Kwon J. I. Uppara U. Jo Y. H. (2022). Surface warming slowdown with continued subsurface warming in the East Sea (Japan Sea) over recent decades, (2000-2014). Front. Mar. Sci9. doi: 10.3389/fmars.2022.825368
68
Jo N. Kang J. J. Park W. G. Lee B. R. Yun M. S. Lee J. H. et al . (2017). Seasonal variation in the biochemical compositions of phytoplankton and zooplankton communities in the southwestern East/Japan Sea. Deep-Sea Res. Part II.143, 82–90. doi: 10.1016/j.dsr2.2016.12.001
69
Jo C. O. Lee J. Y. Park K. A. Kim Y. H. Kim K. R. (2007). Asian Dust initiated early spring bloom in the northern East/Japan Sea. Geophys. Res. Lett.34 (5), L05602. doi: 10.1029/2006gl027395
70
Joo H. Lee D. Son S. H. Lee S. H. (2018). Annual new production of phytoplankton estimated from MODIS-derived nitrate concentration in the East/Japan Sea. Remote Sens.10 (5), 806. doi: 10.3390/rs10050806
71
Joo H. Park J. W. Son S. Noh J. H. Jeong J. Y. Kwak J. H. et al . (2014). Long-term annual primary production in the ulleung basin as a biological hot spot in the East/Japan Sea. J. Geophys. Res. Oceans119 (5), 3002–3011. doi: 10.1002/2014jc009862
72
Joo H. Son S. Park J. W. Kang J. J. Jeong J. Y. Il Lee C. et al . (2016). Long-term pattern of primary productivity in the East/Japan Sea based on ocean color data derived from MODIS-aqua. Remote Sens.8 (1), 25. doi: 10.3390/rs8010025
73
Kaiser K. Benner R. (2008). Major bacterial contribution to the ocean reservoir of detrital organic carbon and nitrogen, limnol. Oceanogr53, 99–112. doi: 10.4319/lo.2008.53.1.0099
74
Kaiser K. Benner R. (2009). Biochemical composition and size distribution of organic matter at the pacific and Atlantic time-series stations. Mar. Chem.113, 63–77. doi: 10.1016/j.marchem.2008.12.004
75
Kameda T. Ishizaka J. (2005). Size-fractionated primary production estimated by a two-phytoplankton community model applicable to ocean color remote sensing. J. Oceanogr.61 (4), 663–672. doi: 10.1007/s10872-005-0074-7
76
Kang J. H. Kim W. S. Chang K. I. Noh J. H. (2004). Distribution of plankton related to the mesoscale physical structure within the surface mixed layer in the southwestern East Sea, Korea. J. Plankton Res.26, 1515–1528. doi: 10.1093/plankt/fbh140
77
Kang D. J. Kim B. Y. Kim K. R. (2010). Dissolved oxygen at the bottom boundary layer of the ulleung basin, East Sea. Ocean. Polar Res.32 (4), 439–448. doi: 10.4217/OPR.2010.32.4.439
78
Kang D. J. Kim J. Y. Lee T. Kim K. R. (2004). Will the East/Japan Sea become an anoxic sea in the next century? Mar. Chem.91 (1-4), 77–84. doi: 10.1016/j.marchem.2004.03.020
79
Kang D. J. Park S. Kim Y.-G. Kim K. Kim K.-R. (2003). A moving-boundary box model (MBBM) for oceans in change: An application to the East/Japan Sea. Geophys. Res. Lett.30, 32-1–32-4. doi: 10.1029/2002GL016486
80
Katoh O. (1994). Structure of the tsushima current in the southwestern Japan Sea. J. Oceanogr.50, 317–338. doi: 10.1007/BF02239520
81
Keil R. (2017). Anthropogenic forcing of carbonate and organic carbon preservation in marine sediments. Annu. Rev. Mar. Sci.9, 151–172. doi: 10.1146/annurev-marine-010816-060724
82
Kim T. H. (2013). Biogeochemistry of dissolved organic matter (DOM), 210Pb, and 210Po in the East Sea (South Korea: Seoul National University).
83
Kim T. H. (2015). Distributions of dissolved inorganic nutrients in the southwestern East Sea in summer. J. Korean Soc Environ. Analysis.18 (3), 164–172.
84
Kim K. Chang K.-I. Kang D.-J. Kim Y. H. Lee J.-H. (2008). Review of recent findings on the water masses and circulation in the East Sea (Sea of Japan). J. Oceanogr.64, 721–735. doi: 10.1007/s10872-008-0061-x
85
Kim D. Choi M. S. Oh H. Y. Song Y. H. Noh J. H. Kim K. H . (2011). Seasonal export fluxes of particulate organic carbon from 234Th/238U disequilibrium measurements in the ulleung basin (Tsushima basin) of the East Sea (Sea of Japan). J. Oceanogr.67, 577–588. doi: 10.1007/s10872-011-0058-8
86
Kim D. Choi M. S. Oh H. Y. Kim K. H. Noh J. H. (2009). Estimate of particulate organic carbon export flux using 234Th/238U disequilibrium in the south western East Sea during summer. J. Korean Soc Oceanogr.14, 1–9.
87
Kim M. Hwang J. Rho T. Lee T. Kang D. J. Chang K. I. et al . (2017). Biogeochemical properties of sinking particles in the southwestern part of the East Sea (Japan Sea). J. Mar. Sys.167, 33–42. doi: 10.1016/j.jmarsys.2016.11.001
88
Kim S. Y. Jeong S. Lee T. (2019). Calcium carbonate saturation state in the ulleung basin, East Sea. J. Korean Soc Oceanogr.24 (3), 389–399. doi: 10.7850/JKSO.2019.24.3.389
89
Kim D. Ji R. Park H. J. Feng Z. Jang J. Lee C. I. et al . (2021). Impact of shifting subpolar front on phytoplankton dynamics in the Western margin of East/Japan Sea. Front. Mar. Sci. 8.126 (6), e2020JC017158. doi: 10.3389/fmars.2021.790703
90
Kim J.-Y. Kang D.-J. Lee T. Kim K.-R. (2014). Long-term trend of CO2 and ocean acidification in the surface water of the ulleung basin, the East/Japan Sea inferred from the underway observational data. Biogeosciences11, 2443–2454. doi: 10.5194/bg-11-2443-2014
91
Kim K.-R. Kim K. (1996). What is happening in the East Sea (Japan sea)?: recent chemical observations during CREAMS 93–96. J. Korean Soc Oceanogr.31, 164–172. doi: 10.7850/jkso.2014.19.4.287
92
Kim Y. G. Kim K. (1999). Intermediate waters in the East/Japan. Sea. J. Oceanogr.55, 123–132. doi: 10.1023/A:1007877610531
93
Kim T. H. Kim G. B. (2010). Distribution of dissolved organic carbon (DOC) in the southwestern East Sea in summer. Ocean. Polar Res.32 (3), 291–297. doi: 10.4217/OPR.2010.32.3.291
94
Kim T. H. Kim G. (2013). Factors controlling the c: N: P stoichiometry of dissolved organic matter in the n-limited, cyanobacteria-dominated East/Japan Sea. J. Mar. Sys.115, 1–9. doi: 10.1016/j.jmarsys.2013.01.002
95
Kim J. Kim G. (2016). Significant anaerobic production of fluorescent dissolved organic matter in the deep East Sea (Sea of Japan). Geophys. Res. Lett.43 (14), 7609–7616. doi: 10.1002/2016GL069335
96
Kim M. Kim Y. I. Hwang J. Choi K. Y. Kim C. J. Ryu Y. et al . (2020). Influence of sediment resuspension on the biological pump of the southwestern East Sea (Japan Sea). Front. Earth Sci.8 (144). doi: 10.3389/feart.2020.00144
97
Kim K. Kim K. R. Kim Y. G. Cho Y. K. Chung J. Y. Choi B. H. et al . (1996). New findings from CREAMS observations: Water masses and eddies in the East Sea. J. Korean Soc Oceanogr.31 (4), 155–163.
98
Kim K. Kim K. R. Kim Y. G. Cho Y. K. Kang D. J. Takematsu M. et al . (2004). Water masses and decadal variability in the East Sea (Sea of Japan). Prog. Oceanogr.61, 157–174. doi: 10.1016/j.pocean.2004.06.003
99
Kim K.-R. Kim G. Kim K. Lobanov V. Ponomarev V. Salyuk A. (2002). A sudden bottom-water formation during the severe winter 2000- 2001: The case of the East/Japan Sea. Geophys. Res. Lett.29 (8), 75–1–75–4. doi: 10.1029/2001GL014498
100
Kim B. Kim S.-H. Kwak J. H. Kang C.-K. Lee S. H. Hyun J.-H. (2017). Heterotrophic bacterial production, respiration, and growth efficiency associated with upwelling intensity in the ulleung basin, East Sea. Deep Sea Res. Part II.143, 24–35. doi: 10.1016/j.dsr2.2017.07.002
101
Kim T. H. Kim G. Lee S. A. Dittmar T. (2015). Extraordinary slow degradation of dissolved organic carbon (DOC) in a cold marginal sea. Sci. Rep.5, 13808. doi: 10.1038/srep13808
102
Kim K. Kim K. R. Min D. H. Volkov Y. Yoon J. H. Takematsu M . (2001). Warming and structural changes in the East (Japan) Sea: a clue to future changes in global oceans? Geophys. Res. Lett.28, 3293–3296. doi: 10.1029/2001GL013078
103
Kim J. Kim T. H. Park S. R. Lee H. J. Kim J. K. (2020). Factors controlling the distributions of dissolved organic matter in the East China Sea during summer. Sci. Rep.10 (1), 11854. doi: 10.1038/s41598-020-68863-w
104
Kim T. H. Kim G. Shen Y. Benner R. (2017). Strong linkages between surface and deep-water dissolved organic matter in the East/Japan Sea. Biogeosciences14 (9), 2561–2570. doi: 10.5194/bg-14-2561-2017
105
Kim T. W. Lee K. Feely R. A. Sabine C. L. Chen C. T. A. Jeong H. J. et al . (2010). Prediction of Sea of Japan (East Sea) acidification over the past 40 years using a multiparameter regression model. Glob. Biogeochem. Cycles24, GB3005. doi: 10.1029/2009GB003637
106
Kim T. H. Lee Y. W. Kim G. (2010). Hydrographically mediated patterns of photosynthetic pigments in the East/Japan Sea: Low n: P ratios and cyanobacterial dominance. J. Mar. Sys.82 (1-2), 72–79. doi: 10.1016/j.jmarsys.2010.03.005
107
Kim K. H. Park N. J. (2003). Estimation of sedimentation and particle mixing rates in ulleung basin of the East Sea (Sea of Japan) using 7Be, 234Th, 210Pb and 137Cs. Ocean. Sci. J.38 (4), 1–165.
108
Kim S. Y. Park Y. G. Kim Y. H. Seo S. Jin H. Pak G. et al . (2021). Origin, variability, and pathways of East Sea intermediate water in a high-resolution ocean reanalysis. J. Geophys. Res.: Oceans126 (6). doi: 10.1029/2020JC017158
109
Kim D. Yang E. J. Kim K. H. Shin C.-W. Park J. Yoo S. et al . (2012). Impact of an anticyclonic eddy on the summer nutrient and chlorophyll a distributions in the ulleung basin, East Sea (Japan Sea). ICES J. Mar. Sci.69, 23–29. doi: 10.1093/icesjms/fsr178
110
Kim A. R. Yoon S. H. Chung M. H. Yoon S. C. Moon C. H. (2014). The influences of coastal upwelling on phytoplankton community in the southern part of East Sea, Korea. Sea19 (4), 287–301.
111
Kosugi N. Sasano D. Ishii M. Enyo K. Saito S. (2016). Autumn CO2 chemistry in the Japan Sea and the impact of discharges from the changjiang river. J. Geophys. Res.: Oceans121 (8), 6536–6549. doi: 10.1002/2016JC011838
112
Kumamoto Y. I. Yoneda M. Shibata Y. Kume H. Tanaka A. Uehiro T. et al . (1998). Direct observation of the rapid turnover of the Japan Sea bottom water by means of AMS radiocarbon measurement. Geophys. Res. Lett.25, 651–654. doi: 10.1029/98GL00359
113
Kwak J. H. Han E. Hwang J. Kim Y. I. Lee C. I. Kang C.-K. (2017). Flux and stable c and n isotope composition of sinking particles in the ulleung basin of the East/Japan Sea. Deep-Sea Res. II.143, 62–72. doi: 10.1016/j.dsr2.2017.03.014
114
Kwak J. H. Hwang J. Choy E. J. Park H. J. Kang D.-J. Lee T. et al . (2013a). High primary productivity and f-ratio in summer in the ulleung basin of the East/Japan Sea. Deep Sea Res. I.79, 74–85. doi: 10.1016/j.dsr.2013.05.011
115
Kwak J. H. Lee S. H. Park H. J. Choy E. J. Jeong H. D. Kim K. R. et al . (2013b). Monthly measured primary and new productivities in the ulleung basin as a biological “hot spot” in the East/Japan Sea. Biogeosciences10, 4405–4417. doi: 10.5194/bg-10-4405-2013
116
Laws E. A. D’Sa E. Naik P. (2011). Simple equations to estimate ratios of new or export production to total production from satellite-derived estimates of sea surface temperature and primary production. Limnol. Oceanogr. Methods9 (12), 593–601. doi: 10.4319/lom.2011.9.593
117
Laws E. A. Falkowski P. G. Smith W. O. Ducklow H. McCarthy J. J. (2000). Temperature effects on export production in the open ocean. Glob. Biogeochem. Cycles14 (4), 1231–1246. doi: 10.1029/1999GB001229
118
Lee J. S. Han J. H. An S. Kim S. Lim D. Kim D. et al (2019). Sedimentary organic carbon budget across the slope to the basin in the southwestern ulleung (Tsushima) basin of the East (Japan) Sea. J. Geophys. Res. Biogeosci.124 (9). doi: 10.1029/2019jg005138
119
Lee T. Hyun J. H. Mok J. S. Kim D. (2008). Organic carbon accumulation and sulfate reduction rates in slope and basin sediments of the ulleung basin, East/Japan Sea. Geo-Mar. Lett.28 (3), 153–159. doi: 10.1007/s00367-007-0097-8
120
Lee T. H. Kim D. S. Kim B. K. Choi D. L. (2010). Organic carbon cycling in ulleung basin sediments, East Sea. Ocean. Polar Res.32 (2), 145–156. doi: 10.4217/OPR.2010.32.2.145
121
Lee K. Nam S. Cho Y. K. Jeong K. Y. Byun D. S. (2022). Determination of long-term, (1993-2019) sea level rise trends around the Korean peninsula using ocean tide-corrected, multi-mission satellite altimetry data. Front. Mar. Sci. 9. doi: 10.3389/fmars.2022.810549
122
Lee E. Y. Park K. A. (2019). Change in the recent warming trend of Sea surface temperature in the East Sea (Sea of Japan) over decade (1982-2018). Remote Sens.11 (22), 2613. doi: 10.3390/rs11222613
123
Lee K. Sabine C. L. Tanhua T. Kim T. W. Feely R. A. Kim H.-C . (2011). Roles of marginal seas in absorbing and storing fossil fuel CO2. Energy Environ. Sci.4, 1133–1146. doi: 10.1039/c0ee00663g
124
Lee S. Yoo S. (2016). Interannual variability of the phytoplankton community by the changes in vertical mixing and atmospheric deposition in the ulleung basin, East Sea: A modelling study. Ecol. Model.322 (24), 31–47. doi: 10.1016/j.ecolmodel.2015.11.012
125
Li L. Chen B. Luo Y. Xia J. Qi D. (2022). Factors controlling acidification in intermediate and deep/bottom layers of the Japan/East Sea. J. Geophys. Res. Oceans127, e2021JC017712. doi: 10.1029/2021JC017712
126
Lockwood D. Quay P. D. Kavanaugh M. T. Juranek L. W. Feely R. A. (2012). High-resolution estimates of net community production and air-sea CO2 flux in the northeast pacific. Global Biogeochem. Cycles26, GB4010. doi: 10.1029/2012GB004380
127
Luo Y. Boudreau B. P. (2016). Future acidification of marginal seas: a comparative study of the Japan/East Sea and the south China Sea. Geophys. Res. Lett.43, 6393–6401. doi: 10.1002/2016GL068760
128
Masuzawa T. (1989). Compositional change of settling particles with water depth in the Japan Sea. Mar. Chem.27, 61–78. doi: 10.1016/0304-4203(89)90028-5
129
Min D. H. Warner M. J. (2005). Basin-wide circulation and ventilation study in the East Sea (Sea of Japan) using chlorofluoro-carbon tracers. Deep Sea Res. II.52, 1580–1616. doi: 10.1016/j.dsr2.2003.11.003
130
Na T. Hwang J. Kim S. Jeong S. Rho T. K. Lee T. (2022). Acidification-vulnerable carbonate system of the East Sea (Japan Sea). Front. Mar. Sci. 9. doi: 10.3389/fmars.2022.825206
131
Na H. Isoda Y. Kim K. Kim Y. H. Lyu S. J. (2009). Recent observations in the straits of the East/Japan Sea: A review of hydrography, currents and volume transports. J. Mar. Syst.78 (2), 200–205. doi: 10.1016/j.jmarsys.2009.02.018
132
Nakanishi T. Minagawa M. (2003). Stable carbon and nitrogen isotopic compositions of sinking particles in the northeast Japan Sea. Geochem. J.37, 261–275. doi: 10.2343/geochemj.37.261
133
Oh D. C. Park M. K. Choi S. H. Kang D. J. Park S. Y. Hwang J. S. et al . (1999). The air-Sea exchange of CO2 in the East Sea (Japan Sea). J. Oceanogr.55 (2), 157–169. doi: 10.1023/A:1007833811440
134
Otosaka S. Amano H. Ito T. Kawamura H. Kobayashi T. Suzuki T. et al . (2006). Anthropogenic radionuclides in sediment in the Japan Sea: distribution and transport processes of particulate radionuclides. J. Environ. Radioact.91 (3), 128–145. doi: 10.1016/j.jenvrad.2006.09.001
135
Otosaka S. Tanaka T. Togawa O. Amano H. Karasev E. V. Minakawa M. et al . (2008). Deep sea circulation of particulate organic carbon in the Japan Sea. J. Oceanogr.64, 911–923. doi: 10.1007/s10872-008-0075-4
136
Otosaka S. Togawa O. Baba M. Karasev E. Volkov Y. N. Omata N. et al . (2004). Lithogenic flux in the Japan Sea measured with sediment traps. Mar. Chem.91, 143–163. doi: 10.1016/j.marchem.2004.06.006
137
Palevsky H. I. Quay P. D. Lockwood D. E. Nicholson D. P. (2016). The annual cycle of gross primary production, net community production, and export efficiency across the north pacific ocean. Global Biogeochem. Cycles30, 361–380. doi: 10.1002/2015GB005318
138
Palevsky H. I. Ribalet F. Swalwell J. E. (2013). The influence of net community production and phytoplankton community structure on CO2 uptake in the gulf of Alaska. Global Biogeochem. Cycles27, 664–676. doi: 10.1002/gbc.20058
139
Park Y. G. (2007). The effects of tsushima warm current on the interdecadal variability of the East/Japan Sea thermohaline circulation. Geophys. Res. Lett.34, L06609. doi: 10.1029/2006GL029210
140
Park J. J. (2013). Underwater glider: Its applicability in the East/Japan Sea. Ocean. Polar Res.35 (2), 107–121. doi: 10.4217/OPR.2013.35.2.107
141
Park J. J. (2019). First observational finding of submesoscale intrathermocline eddy in the East Sea using underwater glider. J. Korean Soc Oceanogr.24 (2), 332–350. doi: 10.7850/JKSO.2019.24.2.332
142
Park J. J. (2022). Long-term variability of East Sea intermediate water thickness: Regime shift of intermediate layer in the mid-1990s. Front. Mar. Sci.9, 1118. doi: 10.3389/fmars.2022.923093
143
Park K. A. Lee E. Y. (2014). Semiannual cycle of sea surface temperature in the East/Japan Sea and cooling process. Int. J. Remote Sens.35, 4287–4314. doi: 10.1080/01431161.2014.916437
144
Park G.-H. Lee K. Tishchenko P. (2008). Sudden, considerable reduction in recent uptake of anthropogenic CO2 by the East/Japan Sea. Geophys. Res. Lett.35 (23), L23611. doi: 10.1029/2008gl036118
145
Park G. H. Lee K. Tishchenko P. Min D. H. Warner M. J. Talley L. D. et al . (2006). Large Accumulation of anthropogenic CO2 in the East (Japan) Sea and its significant impact on carbonate chemistry. Global Biogeochem. Cycles20, 4013. doi: 10.1029/2005GB002676
146
Park K. A. Park J. E. Kang C. K. (2022). Satellite-observed chlorophyll-a concentration variability in the East Sea (Japan sea): Seasonal cycle, long-term trend, and response to climate index. Front. Mar. Sci. doi: 10.3389/fmars.2022.807570
147
Redfield A. C. (1958). The biological control of chemical factors in the environment. Am. Scientist46, 205–221. http://www.jstor.org/stable/27827150
148
Restreppo G. A. Wood W. T. Phrampus B. J. (2020). Oceanic sediment accumulation rates predicted via machine learning algorithm: towards sediment characterization on a global scale. Geo-Mar. Lett.40, 755–763. doi: 10.1007/s00367-020-00669-1
149
Sakamoto A. Watanabe Y. W. Osawa M. Kido K. Noriki S. (2008). Time series of carbonate system variables off otaru coast in Hokkaido, Japan. Estuar. Coast. Shelf. Sci.79, 377–386. doi: 10.1016/j.ecss.2008.04.013
150
Savoye N. Benitez-Nelson C. Burd A. B. Cochran J. K. Charette M. Buesseler K. O. et al . (2006). 234Th sorption and export models in the water column: A review. Mar. Chem.100, 234–249. doi: 10.1016/j.marchem.2005.10.014
151
Senjyu T. Aramaki T. Otosaka S. Togawa O. Danchenkov M. Karasev E. et al . (2002). Renewal of the bottom water after the winter 2000-2001 may spin-up the thermohaline circulation in the Japan Sea. Geophys. Res. Lett.29, 71149. doi: 10.1029/2001GL014093
152
Senjyu T. Shin H. R. Yoon J.-H. Nagano Z. An H.-S. Byun S.-K. et al . (2005). Deep flow field in the Japan/East Sea as deduced from direct current measurements. Deep-Sea Res.52, 1726–1741. doi: 10.1016/j.dsr2.2003.10.013
153
Senjyu T. Sudo H. (1996). Interannual variation of the upper portion of the Japan Sea proper water and its probable cause. J. Oceanogr.52, 27–42. doi: 10.1007/BF02236531
154
Shim J. H. Lee W. H. Park S. Y. (1985). Studies on the plankton in the southwestern waters of the East Sea (Sea of Japan) (II) phytoplankton-standing crop, nanofraction, and primary production. J. Korean Soc Oceanogr.20 (3), 37–54.
155
Tak Y.-J. Cho Y.-K. Hwang J. Kim Y.-Y. (2022). Assessments of nitrate budgets in the yellow Sea based on a 3D physical-biogeochemical coupled model. Front. Mar. Sci.8. doi: 10.3389/fmars.2021.785377
156
Talley L. D. Lobanov V. Ponomarev V. Salyuk A. Tishchenko P. Zhabin I. et al . (2003). Deep convection and brine rejection in the Japan Sea. Geophys. Res. Lett.30 (4),1159. doi: 10.1029/2002GL016451
157
Talley L. D. Min D.-H. Lobanov V. B. Luchin V. A. Ponomarev V. I. Salyuk A. N. et al . (2006). Japan/East Sea water masses and their relation to the sea’s circulation. Oceanogr19 (3), 32–49. doi: 10.5670/oceanog.2006.42
158
Talley L. D. Tishchenko P. Luchin V. Nedashkovskiy A. Sagalaev S. Kang D. J. et al . (2004). Atlas of Japan (East) Sea hydrographic properties in summe. Prog. Oceanogr.61 (2-4), 277–348. doi: 10.1016/j.pocean.2004.06.011
159
Tanaka K. Kuma K. Hamasaki K. Yamashita Y. (2014). Accumulation of humic-like fluorescent dissolved organic matter in the Japan Sea. Sci. Rep.4, 5292. doi: 10.1038/srep05292
160
Thamdrup B. Canfield D. E. (1996). Pathways of carbon oxidation in continental margin sediments off central Chile. Limnol. Oceanogr.41, 1629–1650. doi: 10.4319/lo.1996.41.8.1629
161
Tishchenko P. Lobanov V. Kaplunenko D. Sagalaev S. Tishchenko P. (2021). Acidification and deoxygenation of the northwestern Japan/East Sea. J. Mar. Sci. Eng.9, 953. doi: 10.3390/jmse9090953
162
Tsunogai S. Kawada K. Watanabe S. Aramaki. T. (2003). CFC Indicating renewal of the Japan Sea deep water in winter 2000-2001. J. Oceanogr.59, 685–693. doi: 10.1023/B:JOCE.0000009597.33460.d7
163
Tsurushima N. Nojiri Y. Imai K. Watanabe S. (2002). Seasonal variations of carbon dioxide system and nutrients in the surface mixed layer at station KNOT (44°N, 155°E) in the subarctic western north pacific. Deep Sea Res. Part II.49, 5377–5394. doi: 10.1016/S0967-0645(02)00197-2
164
Vandieken V. Pester M. Finke N. Hyun J. H. Friedrich M. W. Loy A. et al . (2012). Three manganese oxide-rich marine sediments harbor similar communities of acetateoxidizing manganese-reducing bacteria. ISME J.6, 2078–2090. doi: 10.1038/ismej.2012.41
165
Waples J. T. Benitez-Nelson C. Savoye N. Rutgers van der Loeff M. Baskaran M. Gustafsson Ö. (2006). An introduction to the application and future use of 234Th in aquatic systems. Mar. Chem.100 (3-4), 166–189. doi: 10.1016/j.marchem.2005.10.011
166
Watanabe Y. Watanabe S. Tsunogai S. (1991). Tritium in the Japan Sea and the renewal time of the Japan Sea deep water. Mar. Chem.34, 97–108. doi: 10.1016/0304-4203(91)90016-P
167
Yamada N. Fukuda H. Ogawa H. Saito H. Suzumura M. (2012). Heterotrophic bacterial production and extracellular enzymatic activity in sinking particulate matter in the western north pacific ocean. Front. Microbiol.3. doi: 10.3389/fmicb.2012.00379
168
Yamada K. Ishizaka J. Nagata H. (2005). Spatial and temporal variability of satellite primary production in the Japan Sea from 1998 to 2002. J. Oceanogr.61 (5), 857–869. doi: 10.1007/s10872-006-0005-2
169
Yi S. U. (1966). Seasonal and secular variations of the water volume transport across the Korea strait. J. Korean Soc Oceanogr.1, 7–13.
170
Yoo S. Kim H. C. (2004). Suppression and enhancement of the spring bloom in the southwestern East Sea/Japan Sea. Deep Sea Res. Part II.51 (10-11), 1093–1111. doi: 10.1016/j.dsr2.2003.10.008
171
Yoon Y. H. (2016). Bio-environmental characteristics of the uljin marine ranching area (UMRA), East Sea of korea. 1. spatio-temporal distributions of phytoplankton community. J. Korean Soc Mar. Environ. Energy19 (1), 37–46. doi: 10.7846/JKOSMEE.2016.19.1.37
172
Yoon S.-T. Chang K.-I. Nam S. Rho T. Kang D.-J. Lee T. et al . (2018). Re-initiation of bottom water formation in the East Sea (Japan Sea) in a warming world. Sci. Rep.8, 1576. doi: 10.1038/s41598-018-19952-4
173
Yoon J. H. Kawamura H. (2002). The formation and circulation of the intermediate water in the Japan Sea. J. Oceanogr.58, 197–211. doi: 10.1023/A:1015893104998
174
Yoo S. Park J. (2009). Why is the southwest the most productive region of the East Sea/Sea of Japan. J. Mar. Syst.78 (2), 301–315. doi: 10.1016/j.jmarsys.2009.02.014
Summary
Keywords
carbon cycling, biological carbon pump, biogeochemistry, climate change, East Sea (Japan Sea)
Citation
Kim M, Hwang J, Kim G, Na T, Kim T-H and Hyun J-H (2022) Carbon cycling in the East Sea (Japan Sea): A review. Front. Mar. Sci. 9:938935. doi: 10.3389/fmars.2022.938935
Received
08 May 2022
Accepted
08 August 2022
Published
24 August 2022
Volume
9 - 2022
Edited by
Nicholas David Ward, Pacific Northwest National Laboratory (DOE), United States
Reviewed by
Chen-Tung Arthur Chen, National Sun Yat-sen University, Taiwan; Zhuo-Yi Zhu, Shanghai Jiao Tong University, China; Haiyan Jin, Ministry of Natural Resources, China
Updates
Copyright
© 2022 Kim, Hwang, Kim, Na, Kim and Hyun.
This is an open-access article distributed under the terms of the Creative Commons Attribution License (CC BY). The use, distribution or reproduction in other forums is permitted, provided the original author(s) and the copyright owner(s) are credited and that the original publication in this journal is cited, in accordance with accepted academic practice. No use, distribution or reproduction is permitted which does not comply with these terms.
*Correspondence: Jeomshik Hwang, jeomshik@snu.ac.kr
This article was submitted to Marine Biogeochemistry, a section of the journal Frontiers in Marine Science
Disclaimer
All claims expressed in this article are solely those of the authors and do not necessarily represent those of their affiliated organizations, or those of the publisher, the editors and the reviewers. Any product that may be evaluated in this article or claim that may be made by its manufacturer is not guaranteed or endorsed by the publisher.