Introduction
Ocean acidification (OA) is a long-term drop in the pH of the ocean caused mostly by atmospheric carbon dioxide (CO2). It is a consequence of climate change that poses a direct threat to life on earth by affecting the marine ecosystem (Panchang and Ambokar, 2021). The ocean has absorbed around 30% of the carbon dioxide emitted by human activities since the beginning of the industrial revolution (Sabine et al., 2004). The elevated partial pressure of carbondioxide (pCO2) causes seawater pH and CaCO3 staturation to decrease (Feely et al, 2004). The pCO2 value is now at 375 atm (Rhein et al., 2013) which is expected to reach 420 to 940 atm by 2100, and pH may decline by 0.13 to 0.42 units scenario (Rhein et al., 2013). The pH of sea water has declined from 8.17 units in pre-industrial periods (Key et al., 2004) to 8.06 units now (Rhein et al., 2013), indicating a decrease of 34.91%. Due to eutrophication and amplification of natural CO2 some coastal locations may see shifts H+ that are at least 2–3 times the world average (Melzner et al., 2012). Many marine organisms’ physiological activities are predicted to be influenced by such changes in ocean chemistry, potentially having far-reaching effects on marine biodiversity and ecological processes (Murugan et al., 2005; Vijayakumaran et al., 2005; Fabry et al., 2008; Pörtner, 2008; Kumar et al., 2009; Gattuso et al., 2011).
Ocean acidification thought to harm marine fish performance, owing to changes in oxygen availability and delivery capabilities (Pörtner, 2008). Individual survival may be harmed by acidic pH because less energy is allocated to digestion, growth, and reproduction (Munday et al., 2009; Munday et al., 2014). The OA has the ability to change the outcomes of ecologically important processes and the structure of ecological communities (Pörtner, 2008). Given that abiotic variables such as oxygen availability, temperature, and salinity are known to have the greatest influence on aquatic species’ early life stages (Bonk, 2005), the possible impact of acidified seawater on their development should be taken into account. Only a few studies on the impact of OA on early life stages of aquatic animals have been conducted, with the majority focusing on invertebrates (Kurihara et al., 2004; Havenhand et al., 2008; Dupont and Thorndyke, 2009; Ellis et al., 2009Dupont et al., 2010) indicating that the impact of OA on the early life history of vertebrates is scanty.
Because blood is the channel of intercellular transfer and comes into direct contact with multiple organs and tissues of the body, it plays an important part in all physiological systems and hence, an animal’s physiological status at any given time is reflected in its blood. Any type of environmental stress induces oxidative stress in a normal organism, which is reflected in blood proteins and causes haematological changes, and may be used as a method for biological monitoring (Martinez and Souza, 2002). Although organisms are resistant to the harmful effects of oxidative stress caused due to reactive oxygen species, prolonged exposure can cause oxidative damage, including the loss of compensatory mechanisms due to changes in enzyme function (Galloway and Handy, 2003; Dogan and Can, 2011; Narra, 2017). Adverse changes in the haematological and biochemical markers indicate toxicity, and their use in environmental monitoring and aquatic biota health has a wide variety of applications (Thilagam et al., 2009; Narra, 2017).
A few research on the consequences of hypercapnia on various life stages of marine teleosts have been published in recent years (Checkley et al., 2009; Munday et al., 2009; Munday et al., 2014). Increased pCO2 levels were employed by Kikkawa et al. (2003) to explore the acute lethal effect of pCO2 on the early life stages of marine fishes. The whole world’s seas, especially coastal estuaries and streams, are being affected by OA. Many economies rely on fish and shellfish, and people all over the world use seafood as their major source of protein. Considering the need of the hour and importance of fisheries sector, an experiment was designed to study seawater acidification impacts on the growth rate of Indian seabass at various stages of their lives (Fry and Fingerlings). In both fry and fingerlings, we investigated how acidified medium alter haematological, biochemical markers in blood and consequently affect the growth. Thus, this study will help in designing the long-term effects of ocean acidification on the growth of Indian seabass, which might have implications on coastal and marine ecosystem organisms.
Methods
For this study, fishes were collected from the Rajiv Gandhi Centre for Aquaculture (RGCA) in Thirumullaivasal, Tamil Nadu, India. Before being utilized in the experiment, fish fry with an average length of 3.58 ± 1.2 cm and a weight of 2.78 ± 0.9 g and fingerling with an average length of 7.42 ± 1.59 cm and a weight of 6.1 ± 1.24 g were acclimatized for a week in a fiberglass tank. During acclimatization, the water temperature, salinity, and pH were all maintained at 28 ± 1°C, 20 PSU, and 8.1, respectively, and the tank received a continuous O2 supply. The fish were fed finely chopped fresh prawn meat and commercial feed regularly during the conditioning phase. Prior to the start of the exposure, the average individual weight of 180 fries and 180 fingerlings was recorded and randomly distributed into 9 rectangular glass aquaria (3 tanks for each exposure group) with a culture volume of 50 L and a stocking density of 20 fish per tank. However, the total number of fish used per time point per experimental group was 18 (six fish per tank and triplicate maintained for each tank). Similarly, the experimental setup for fingerling was also followed.
The effects of OA were investigated by lowering the pH of seawater and subjecting various size groups of fish to three distinct pH conditions: control pH of 8.1 and two lower pH levels expected under different climate change scenarios (pH 7.7 and pH 7.4). In a brief, lower pH was achieved by bubbling CO2-enriched air at the proper CO2 content. Using a dual variable area flow controller, the CO2 concentration in the bubbled air was regulated and the pH in the experimental tank was monitored regularly. The fish were fed fresh prawn flesh throughout the experiment. To reduce fluctuation, the temperature and salinity were maintained and measured daily with a probe (Hydrolab Quanta Multi-Probe Meter) and the pH of seawater was recorded thrice a day using a well calibrated pH meter (Wensar pH Meter, LMPH-with ± 0.01 pH).
At 20, 40, and 60 d, healthy fish of two different stages (fry and fingerling) were sampled. At each time, 18 fish were dissected per group (6 individuals per tank). Fish were anesthetized for 30 seconds in ice-cold aquarium water, then removed and measured for body length and weight. The fish was kept calm by gently wrapping it in a paper towel soaked in ice-cold aquarium water. The tail was cut 1–2 mm rostral to the caudal fin. To prevent clotting, blood was drawn from the cut end with a micropipette fitted with heparinized tips and immediately diluted with Tris EDTA buffer. Blood samples from three fish in the same tank were pooled as one replicate for fish fry and fingerlings (i.e., total sample number = 6 per group at time point). An aliquot of pooled samples were frozen in liquid nitrogen and kept at -80°C until further processing for biochemical component analysis. The above-mentioned animal handling procedures were approved by the Animal Ethics Committee of the University of Madras.
Using a Neubauer haemocytometer, the red blood cell (RBC) and white blood cell (WBC) counts were measured after dilution with Grower’s and Dacie’s solutions, respectively (Voigt, 2000). The haemoglobin (Hb) content was measured using the photometrical cyanohaemoglobin technique. Standard formulae given below were used to compute haematocrit (HCT), mean cellular volume (MCV), mean cell haemoglobin (MCH), and mean cellular haemoglobin concentration (MCHC) (Kang et al., 2005).
The oxygen carrying capacity was estimated by multiplying the haemoglobin concentration by 1.25 oxygen combining the power of Hb/g (Johansen, 1970; Sampath et al., 1998). Total protein content in blood serum was determined using the Bradford (1976) method, which used bovine serum albumin as a reference. The assay Kit measured albumin, globulin, and the albumin: globulin (A/G) ratio (divided albumin content by globulin content) (Biuret method using dye reagent, Qualigens Fine Chemicals, Mumbai, India).
The average survival, length and weight gain of the fishes during the experiment was estimated by the following formulae:
Survival (%) = Number of fish survived after 60 d/initial number of fish stocked × 100.
Weight gain (%) = Average (Final weight (g) - initial weight (g)/ initial weight (g) × 100.
Length gain (%) = Average (Final length- initial length / initial length) × 100.
The statistical analysis was carried out using SPSS software (version 20). The data was subjected to normality and homogeneity before a two way analysis of variance (ANOVA) to test differences between the groups.Tukey’s multiple comparison post hoc tests were used to determine the statistical difference between different treatment groups and the p-value of less than 0.05 was considered significant.
Data Description
Physicochemical parameters of the seawater such as temperature (°C), salinity (PSU), pH, total alkalinity (µmol kg-1), dissolved inogranic carbon (µmol kg-1), turbidity (NTU), specific conductivity (mS), and pressure (pCO2; µatm) are given in Supplementary Table 1A. Physicochemical parameters during the exposure period did not differ significantly (p > 0.05) between the exposure groups. Table 1 shows the changes in haematological parameters such as red blood cell (106/µL), white blood cell (103/µL) and Hb (g/dl) level, HCT, MCV, MCH, MCHC, O2 carrying capacity of sea bass fry and fingerling exposed to different pH groups. Between the control and experimental groups, the mean values for most of blood parameters showed significant differences (p < 0.05). In both fry and fingerling, WBCs, RBCs, Hb, HCT and O2 carrying carpacity showed a pH-dependent decline, but MCV and MCHC increased considerably in both fry and fingerlings. However, MCV in fish fry reduced significantly after 60 d of exposure at pH 7.4. MCH values decreased considerably in all the exposure period when the fish fry were exposed to pH 7.4. On the contrary, fish fingerlings exposed to OA do not show any significant differences in MCH values with the respective control groups except after 60 d exposure at pH 7.4, it is clear that extended exposure to OA caused considerable alterations in fingerlings, signalling that fry may be more susceptible than fingerlings to OA.
Table 1
| Parameters | 20 d | 40 d | 60 d | ||||||
|---|---|---|---|---|---|---|---|---|---|
| Fish fry | Control(pH 8.1) | pH 7.7 | pH 7.4 | Control(pH 8.1) | pH 7.7 | pH 7.4 | Control(pH 8.1) | pH 7.7 | pH 7.4 |
| RBC | 2.21±0.047a | 1.93±0.061b | 1.78±0.047b | 2.08±0.060a | 1.70±0.051b | 1.53±0.061b | 2.13±0.049a | 1.91±0.047b | 1.36±0.055c |
| HB level (g/dL) |
9.28±0.132a | 9.30±0.081a | 8.73±0.076b | 9.31.±0.060a | 8.58±0.094b | 7.96±0.156b | 9.08±0.101a | 8.40±0.093b | 7.38±0.126c |
| HCT (%) | 31.55±0.482a | 29.76±0.555a | 26.85±0.788b | 31.18.±0.616a | 28.15±0.557b | 25.30±0.530c | 32.10±0.499a | 27.45±0.576b | 21.68±0.404c |
| MCV(fL) | 140.91±2.40a | 149.59±7.41a | 153.66±3.30b | 154.66.±3.91a | 162.36±6.930b | 165.28±5.37b | 154.43±4.69a | 154.96±8.12ab | 145.58±4.70b |
| MCH (Pg) | 33.98±0.286a | 32.02±0.685a | 30.72±0.722b | 33.46.±0.596a | 32.80±0.672a | 30.89±0.537b | 35.34±0.508a | 32.70±0.825b | 29.45±0.484c |
| MCHC(%) | 29.43±0.245a | 31.29±0.652a | 32.63±0.784b | 29.92.±0.537a | 30.54±0.633a | 32.53±0.738b | 28.31±0.400a | 30.67±0.778b | 34.00±0.544c |
| O2 carrying Capacity |
11.60±0.165a | 11.62±0.102a | 10.91±0.095a | 11.64.±0.075a | 10.72±0.118b | 9.95±0.195c | 11.35±0.126a | 10.50±0.116b | 9.20±0.160c |
| WBC | 8.18±0.132a | 8.08±0.094a | 7.43±0.076b | 8.01±0.060a | 7.28±0.094b | 6.66±0.156c | 7.78±0.101a | 7.10±0.093b | 6.06±0.128c |
| Fingerlings | |||||||||
| RBC | 3.11±0.047a | 2.61±0.007b | 2.36±0.047c | 3.13.±0.060a | 2.50±0.051b | 2.13±0.061c | 3.03±0.049a | 2.41±0.047b | 1.76±0.055c |
| HB level (g/dL) |
10.18±0.132a | 10.36±0.049ab | 9.98±0.101b | 9.98.±0.094a | 9.38±0.094b | 8.90±0.093c | 9.66±0.186a | 8.56±0.156b | 7.76±0.128c |
| HCT (%) | 32.43±0.442a | 32.21±0.602a | 32.96±0.517a | 31.95.±0.665a | 29.03±0.567b | 27.95±0.576b | 30.88±0.820a | 26.03±0.546b | 22.08±0.404c |
| MCV (fL) | 101.68±1.430a | 117.52±4.83b | 132.23±5.34b | 106.10.±3.35a | 113.88±3.99a | 127.45±6.59b | 107.53±3.99a | 105.70±3.72a | 120.88±5.97b |
| MCH (Pg) | 31.85±0.249a | 31.07±0.571a | 33.02±0.466a | 32.02.±0.749a | 30.95±0.620a | 31.42±0.771a | 31.95±0.726a | 30.42±0.716a | 28.44±0.453b |
| MCHC (%) | 31.40±0.243a | 32.23±0.596a | 30.30±0.420a | 31.31.±0.731a | 32.37±0.659a | 31.91±0.788a | 31.36±0.685a | 32.96±0.785a | 35.19±0.546b |
| O2 carrying Capacity |
12.72±0.165a | 12.95±0.618a | 12.47±0.126a | 12.46.±0.118a | 11.72±0.113b | 11.12±0.116b | 12.08±0.225a | 10.70±0.195b | 9.70±0.160b |
| WBC | 8.58±0.132a | 8.48±0.094a | 7.83±0.076b | 8.36.±0.055a | 7.63±0.080b | 7.10±0.134c | 8.38±0.101a | 7.53±0.098b | 6.38±0.119c |
Data of haematological parameters of Asian sea bass Lates calcarifer fry and fingerlings exposed to different pH for 60 d.
Values are expressed as mean± SD of 6 observations. The same letters (a, b, c) indicate no significant difference between exposure groups at different exposure periods, whereas different letters indicate statistically significant differences (p < 0.05) between different exposure periods and groups. RBC and WBC expressed (x106 and106 cells/μL respectively) and O2 carrying Capacity expressed in (mlO2 g-1Hb).
Fish fry and fingerling exposed to acidified seawater showed decreased oxygen carrying capacity, which could result in poor oxygen transport to organs. The fall in Hb concentration could be reason for a reduction in oxygen transport to the tissues, resulting in a reduction in physical activity (Nussey et al., 1995). Similar findings have been reported earlier, wherein the oxygen carrying capacity of Heteropneustes fossilis blood decreased due to a decrease in RBC count and Hb concentration (James and Sampath, 1995).
In the present study the total RBC count in both fry and fingerlings exposed to different pH conditions (8.1, 7.7 and 7.4) reduced considerably and such reduction in RBC count may be due to blood cell disruption, i.e. haemolysis (Table 1), which was reflected in changes in red blood indices such as Hb, HCT, PCV, MCV, MCH, and MCHC (Table 1) and these variations in RBC could lead to abnormalities in the composition of blood and its functions. Moreover increased MCH and MCHC readings in sea bass blood correspond to fluctuations in erythrocyte count caused by red blood cell breakdown and reduced Hb content in each cell (Sakthivel and Sampath, 1990). The results of RBC indices are also considered and used to differentiate distinct kinds and the cause of anaemia (Whalan, 2015). MCV and MCH levels may rise in response to structural damage to RBC membranes when the acidity level rises and could results in hemolysis, impaired haemoglobin production, and red blood cell enlargement (Fletcher, 1975; Schafhauser-Smith and Benfey, 2003). The elevations in MCV and MCH, together with the lack of change in MCHC, showed that the anaemia was of the macrocytic type (Ates et al., 2008). The MCHC value is used to assess the degree and aetiology of anaemia, as well as to identify differences in erythrocyte size, shape, and Hb concentration (Grant, 2015). The MCHC level in both fry and fingerling seabass subjected to acidified conditions decreased significantly after 60 d of exposure at pH 7.4, while there were no significant changes in the fingerlings exposed to pH 7.7 compared to the control groups. Figures 1A–D shows the biochemical characteristics of seabass fry and fingerlings, including total protein (g/ml), albumin (g/ml), globulin (g/ml), and albumin/globulin (A/G) ratio. When seabass fry and fingerlings were exposed to acidified seawater, the total protein, albumin, and globulin concentration in their blood decreased drastically. Albumin content in fish fingerling significantly decreased in both exposure group after 40 d, however in fish fry the same decreased only when the fry were exposed to pH 7.4. On the contrary, globulin content in fish fry reduced significantly in both exposure groups and the same reduced in fish fingerling only when the fish were exposed to pH 7.4. Overall these data suggests that the fry were under stress than the fingerling. Intriguingly, the albumin and globulin ratios in fingerlings and fry did not show any significant decrease throughout the 40-day exposure period.
Figure 1
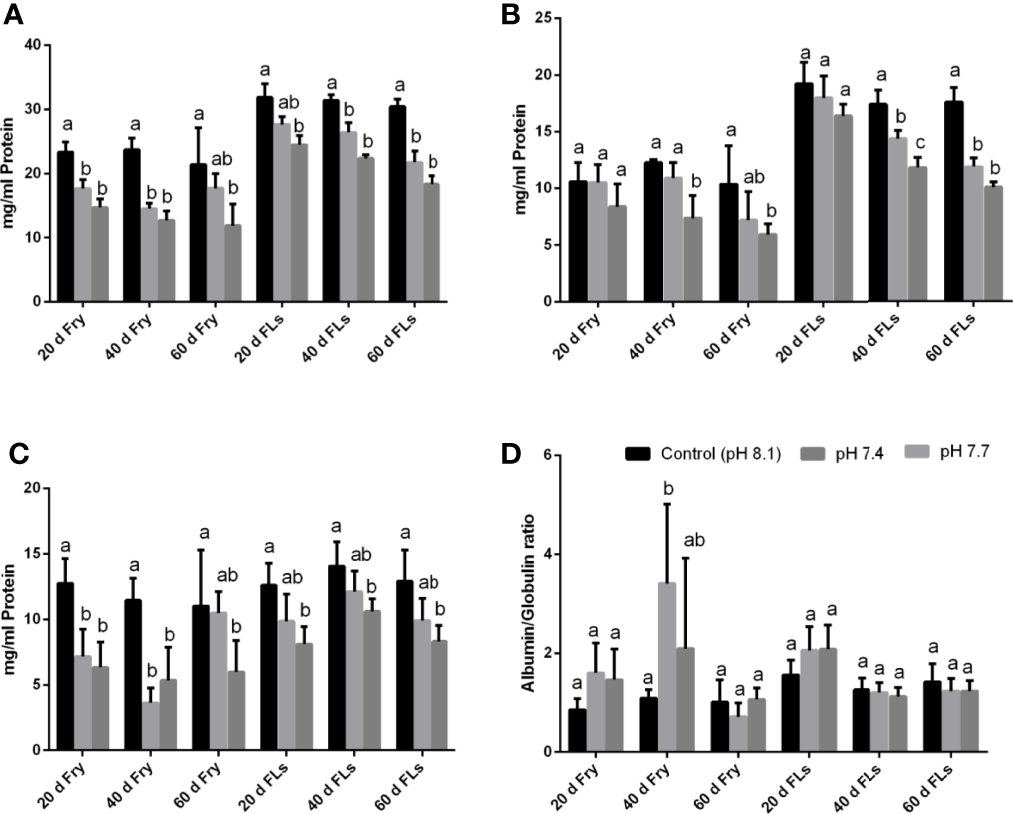
(A–D) is the data representing the biochemical components such as (A) total protein (mg/ml), (B) albumin (mg/ml), (C) globulin (mg/ml), (D) albumin and globulin (A/G) ratio of seabass fry and fingerling exposed for 60 d under different acidified conditions. Each bar represents mean ± standard deviation of six samples. Two-way analysis of variance followed by Tukey’s post hoc test was used. The same letters (a, b, c) indicate no significant difference between the exposure groups whereas different letters indicate statistically significant differences (p< 0.05) between different groups.
The total protein level was thought to indicate the health condition of fish, which may directly be related with growth (Gopal et al., 1997). We discovered a decrease in total protein, albumin, globulin, and a change in the albumin to globulin ratio throughout our experimental periods. Marine pollution and/or stress exposure has been shown to cause changes in blood protein levels, which indirectly effect the physiological process of fish (Kroeker et al., 2010; Harvey et al., 2013).
Supplementary Table 1B displays statistics on fish survival and variations in length weight measurement in proportion to the initial values of fish fry and fingerlings, respectively. The percentage increase in length compared to initial values in seabass fry grown in the control treatment (pH 8.1) was 83.51%, however, growth was slowed when the fry were reared in acidified seawater with pH 7.7 and 7.4. In pH 7.7 and 7.4, the increase in length was 62.29% and 41.62%, respectively. Similarly, seabass fingerlings exposed to two acidic seawater environments developed substantially slower than the control groups. The weight of fry after 60 d was 5.91 0.36 g, a rise of 112% over the original weight; however, at pH 7.7 and 7.4, this was reduced to 83.45% and 73.66%, respectively. Fingerlings followed a similar trend. These findings clearly show that acidified seawater has a deleterious impact on fish (fry and fingerlings) growth.
To conclude, this is the first study to our knowledge to look at the impact of OA on the haematological and biochemical parameters in two different size groups of L. calcarifer. In both groups, OA causes changes in haematological and biochemical components, according to the findings of this study. The current study also revealed that OA had an effect on physiological processes (growth rate), with the effect being stage-specific and pH dependent. We propose that fish haematological and serum biochemical research have become more important as a result of the increased emphasis on fish farming and rising level of pollution in coastal and marine ecosystems. Its effect on fish growth might aid in the development of a long-term management plan to mitigate ocean acidification.
Publisher’s Note
All claims expressed in this article are solely those of the authors and do not necessarily represent those of their affiliated organizations, or those of the publisher, the editors and the reviewers. Any product that may be evaluated in this article, or claim that may be made by its manufacturer, is not guaranteed or endorsed by the publisher.
Statements
Data availability statement
The datasets presented in this study can be found in online repositories. The names of the repository/repositories and accession number(s) can be found in the article/Supplementary Material.
Ethics statement
Since culture commercial fish were used, ethical review and approval not required.
Author contributions
GS, PS, PP, RS, and PM: sample collection, laboratory analysis, data processing, TH: data validation and manuscript preparation. SB: Review the manuscript, suggestion, and project administration. All authors contributed to the article and approved the submitted version.
Acknowledgments
The authors thank the Head, of the Research Department of Zoology and also the Principal Pachaiyappa’s College for Men, Chennai- 600 030 for extending their support through the experiment.
Conflict of interest
The authors declare that the research was conducted in the absence of any commercial or financial relationships that could be construed as a potential conflict of interest.
Supplementary material
The Supplementary Material for this article can be found online at: https://www.frontiersin.org/articles/10.3389/fmars.2022.940573/full#supplementary-material
References
1
Ates B. Orun I. Talas Z. S. Durmaz G. Yilmaz I. (2008). Effects of Sodium Selenite on Some Biochemical and Hematological Parameters of Rainbow Trout (Oncorhynchus Mykiss Walbaum 1792) Exposed to Pb2+ and Cu2+. Fish. Physiol. Biochem.34, 53–59. doi: 10.1007/s10695-007-9146-5
2
Bonk A. A. (2005). “Influence of the Conditions of Reproduction on the Survival of Herring Embryos in the Western Bering Sea,” in PICES 14th Annual Meeting, 181 pp.
3
Bradford M. M. (1976). A Rapid and Sensitive Method for the Quantitation of Microgram Quantities of Protein Utilizing the Principle of Protein-Dye Binding. Anal. Biochem.72, 248–254. doi: 10.1016/0003-2697(76)90527-3
4
Checkley D. Jürgen A. Oozeki Y. Roy C. (Eds.). (2009). Climate Change and Small Pelagic Fish. Cambridge: Cambridge University Press. doi: 10.1017/CBO9780511596681
5
Dogan D. Can C. (2011). Hematological, Biochemical, and Behavioral Responses of Oncorhynchus Mykiss to Dimethoate. Fish. Physiol. Biochem.37 (4), 951–958. doi: 10.1007/s10695-011-9492-1
6
Dupont S. Lundve B. Thorndyke M. (2010). Near Future Ocean Acidification Increases Growth Rate of the Lecithotrophic Larvae and Juveniles of the Sea Star Crossaster Papposus. J. Exp. Zool. (Mol. Dev. Evol.)314B, 382–389. doi: 10.1002/jez.b.21342
7
Dupont S. Thorndyke M. C. (2009). Impact of CO2-Driven Ocean Acidification on Invertebrates Early Life-History What We Know, What We Need to Know and What We can do. Biogeosciences6, 3109–3131. doi: 10.5194/bgd-6-3109-2009
8
Ellis R. P. Bersey J. Rundle S. D. Hall-Spencer J. M. Spicer J. (2009). I.: Subtle But Significant Effects of CO2 Acidified Seawater on Embryos of the Intertidal Snail, Littorina Obtusata. Aquat. Biol.5, 41–48. doi: 10.3354/ab00118
9
Fabry V. J. Seibel B. A. Feely R. A. Orr J. C. (2008). Impacts of Ocean Acidification on Marine Fauna and Ecosystem Processes. ICES. J. Mar. Sci.65, 414–432. doi: 10.1093/icesjms/fsn048
10
Feely R. A. Sabine C. L. Lee K. Berelson W. Kleypas J. Fabry V. J. et al (2004). Impact of Anthropogenic CO2 on the CaCO3 System in the Oceans. Science5682, 362–66. doi: 10.1126/science.1097329
11
Fletcher G. (1975). The Effects of Capture,” Stress,” and Storage of Whole Blood on the Red Blood Cells, Plasma Proteins, Glucose, and Electrolytes of the Winter Flounder (Pseudopleuronectes Americanus). Can. J. Zool.53, 197–206. doi: 10.1139/z75-024
12
Galloway T. Handy R. (2003). Immunotoxicity of Organophosphorous Pesticides. Ecotoxicology12, 345–363. doi: 10.1023/A:1022579416322
13
Gattuso J. P. Bijma J. Gehlen M. Riebesell U. Turley C. (2011). Ocean Acidification: Knowns, Unknowns and Perspectives. doi: 10.1093/oso/9780199591091.003.0020
14
Gopal V. Parvathy S. Balasubramanian P. R. (1997). Effect of Heavy Metals on the Blood Protein Biochemistry of the Fish Cyprinus Carpio and its Use as a Bio-Indicator of Pollution Stress Environ. Monit. Ass.48, 117–124. doi: 10.1023/A:1005767517819
15
Grant K. R. (2015). Fish Hematology and Associated Disorders. Vet. Clin. North Am. Exot. Anim. Prac.18, 83–103. doi: 10.1016/j.cll.2015.05.015
16
Harvey B. P. Gwynn-Jones D. Moore P. J. (2013). Meta-Analysis Reveals Complex Marine Biological Responses to the Interactive Effects of Ocean Acidification and Warming. Ecol. Evol.3, 1016–1030. doi: 10.1002/ece3.516
17
Havenhand J. N. Buttler F. R. Thorndyke M. C. Williamson J. E. (2008). Near-Future Levels of Ocean Acidification Reduce Fertilization Success in a Sea Urchin. Curr. Biol.18, R651–R652. doi: 10.1016/j.cub.2008.06.015
18
James R. Sampath K. (1995). Sublethal Effects of Mixtures of Copper and Ammonia on Selected Biochemical and Physiological Parameters in the Catfish, Heteropneustes Fossiilis (Bloch). Bull. Environ. Contaminat. Toxicol.55, 187–194.
19
Johansen K. (1970). “Air-Breathing Fishes,” in Fish Physiology, vol. Vol. IV . Eds. HoarW. S.RandallD. J. (New York and London: Academic Press), 361–411.
20
Kang J. C. Kim S. G. Jang S. W. (2005). Growth and Hematological Changes of Rockfish, Sebastes Schlegeli (Hilgendorf) Exposed to Dietary Cu and Cd. J. World Aquacul. Soc.36, 188–195. doi: 10.1111/j.1749-7345.2005.tb00384.x
21
Key R. M. Kozyr A. Sabine C. L. Lee K. Wanninkhof R. Bullister J. L. et al . (2004). A Global Ocean Carbon Climatology: Results From Global Data Analysis Project (GLODAP). Global Biogeochem. Cycles18 (4). doi: 10.1029/2004GB002247
22
Kikkawa T. Ishimatsu A. Kita J. (2003). Acute CO2 Tolerance During the Early Developmental Stages of Four Marine Teleosts, Environ. Toxicol18, 375–382.
23
Kroeker K. J. Kordas R. L. Crim R. N. Singh G. G. (2010). Meta-Analysis Reveals Negative Yetvariable Effects of Ocean Acidification on Marine Organisms. Ecol. Lett.13, 1419–1434. doi: 10.1111/j.1461-0248.2010.01518.x
24
Kumar T. S. Vijayakumaran M. Murugan T. S. Jha D. K. Sreeraj G. Muthukumar S. (2009). Captive Breeding and Larval Development of the Scyllarine Lobster Petrarctusrugosus. New Z. J. Mar. Freshw. Res.43:1, 101–112. doi: 10.1080/00288330909509985
25
Kurihara H. Shimode S. Shirayama Y. (2004). Effects of Raised CO2 Concentration on the Egg Production Rate and Early Development of Two Marine Copepods (Acartia Steueri and Acartia Erythraea). Mar. Poll. Bull.49, 721–727. doi: 10.1016/j.marpolbul.2004.05.005
26
Martinez C. B. R. Souza M. M. (2002). Acute Effects of Nitrite on Ion Regulation in Two Neotropical Fish Species, Comparative Biochemistry and Physiology Part a. Mol. Integr. Physiol.133, 1, 151–160. doi: 10.1016/S1095-6433(02)00144-7
27
Melzner F. Thomsen J. Koeve W. Oschlies A. Gutowska M. A. Bange H. W. et al . (2012). Future Ocean Acidification Will be Amplified by Hypoxia in Coastal Habitats. Mar. Biol.160, 1875–1888. doi: 10.1007/s00227-012-1954-1
28
Munday P. L. Cheal A. J. Dixson D. L. Rummer J. L. Fabricius K. E. (2014). Behavioural Impairment in Reef Fishes Caused by Ocean Acidification at CO2 Seeps. Nat. Clim. Change4, 487–492. doi: 10.1038/nclimate2195
29
Munday P. L. Dixson D. L. Donelson J. M. Jones G. P. Pratchett M. S. Devitsina G. V. et al . (2009). Ocean Acidification Impairs Olfactory Discrimination and Homing Ability of a Marine Fish. Proc. Natl. Acad. Sci. U S A106, 1848–1852. doi: 10.1073/pnas.0809996106
30
Murugan T. S. Remany M. C. Mary Leema T. Jha D. K. Santhanakumar J. Vijayakumaran M. et al . (2005). Growth, Repetitive Breeding, and Aquaculture Potential of the Spiny Lobster, Panulirus Ornatus. New Z. J. Mar. Freshw.39:2, 311–315. doi: 10.1080/00288330.2005.9517311
31
Narra M. R. (2017). Haematological and Immune Upshots in Clarias Batrachus Exposed to Dimethoate and Defying Response of Dietary Ascorbic Acid. Chemosphere168, 988–995. doi: 10.1016/j.chemosphere.2016.10.112
32
Nussey G. Van Vuren J. H. J. Du Preez H. H. (1995). Effects of Copper on Haematology and Osmoregulation of the Mozambique Tilapia, Oreochromis Mossambicus (Cichlidae). Comp. Biochem. Physiol.111, 369–380. doi: 10.1016/0742-8413(95)00063-1
33
Panchang R. Ambokar M. (2021). Ocean Acidification in the Northern Indian Ocean : A Review. J. Asian Earth Sci.219, 104904. doi: 10.1016/j.jseaes.2021.104904
34
Pörtner H. O. (2008). Ecosystem Effects of Ocean Acidification in Times of Ocean Warming: A Physiologist's View. Mar. Ecol. Prog. Ser.373, 203–217. doi: 10.3354/meps07768
35
Rhein M. Rintoul S. R. Aoki S. Campos E. Chambers D. Feely R. A. et al . (2013). “Observations: Ocean,” in Climate Change 2013: The Physical Science Basis. Eds. StockerT. F.QinD.PlattnerG.-K.TignorM.AllenS. K.BoschungJ.NauelsA.XiaY.BexV.MidgleyP. M. (Cambridge, United Kingdom and New York, NY, USA: Cambridge University Press).
36
Sabine C. L. Feely. R. A. Gruber N Key R. M. Lee K. Bullister J. L. et al (2004). The Oceanic Sink for Anthropogenic CO2. Science305 (5682), 367–71. doi: 10.1126/science.1097403
37
Sakthivel M. Sampath K. (1990). “Respiration, Blood Cells and Food Conversion Efficiency in Cyprinus Carpio Exposed to Sublethal Concentrations of Tannery Effluents,” in Environment and Experimental Toxicology. Eds. DeshmukhP. B.MathaiA. T.DalelaR. C.PillaiK. S. (Valvada: Jai Research Foundation), 139–I50.
38
Sampath K. James R. Akbar Ali K. M. (1998). Effects of Copper and Zinc on Blood Parameters and Prediction of Their Recovery in Oreochromis Mossambicus (Pisces: Cichlidae). Indian JFisheries45 (2), 129–139.
39
Schafhauser-Smith D. Benfey T. (2003). The Effects of Long-Term Estradiol-17β Treatment on the Growth and Physiology of Female Triploid Brook Trout (Salvelinus Fontinalis). Gen. Comp. Endocrinol.131, 9–20. doi: 10.1016/S0016-6480(02)00626-3
40
Thilagam H. Gopalakrishnan S. Bo J. Wang K. J. (2009). Effect of 17 β-Estradiol on the Immunocompetence of Japanese Sea Bass (Lateolabrax Japonicus). Environ. Toxicol. Chem.28, 1722–1731. doi: 10.1897/08-642.1
41
Vijayakumaran M. Murugan T. S. Remany M. C. Mary Leema T. Jha D. K. Santhanakumar J. et al . (2005). Captive Breeding of the Spiny Lobster, Panulirus Homarus. New Z. J. Mar. Freshw. Res.39:2, 325–334. doi: 10.1080/00288330.2005.9517313
42
Voigt L. (2000). Hematology Techniques and Concepts for Veterinary Technicians (Ames: Iowa State University Press), 139.
43
Whalan J. E. (2015). A Toxicologist’s Guide to Clinical Pathology in Animals: Hematology, Clinical Chemistry, Urinalysis (Cham (CH: Springer International).
Summary
Keywords
Asian seabass, ocean acidification, marine environment, haematology, seawater
Citation
Srinivasan G, Marcus PN, Sivakumar P, Paramasivam P, Sivakumar R, Harikrishnan T and Balasubramaniam S (2022) Ocean Acidification Impact on Haematological and Serum Biochemical Parameters in Lates calcarifer. Front. Mar. Sci. 9:940573. doi: 10.3389/fmars.2022.940573
Received
10 May 2022
Accepted
26 May 2022
Published
23 June 2022
Volume
9 - 2022
Edited by
Dilip Kumar Jha, National Institute of Ocean Technology, India
Reviewed by
Muthukumar Thangavelu, Jeonbuk National University, South Korea; Thiagarajan Raman, Ramakrishna Mission Vivekananda College, India; Vikas Pandey, National Institute of Ocean Technology, India
Updates
Copyright
© 2022 Srinivasan, Marcus, Sivakumar, Paramasivam, Sivakumar, Harikrishnan and Balasubramaniam.
This is an open-access article distributed under the terms of the Creative Commons Attribution License (CC BY). The use, distribution or reproduction in other forums is permitted, provided the original author(s) and the copyright owner(s) are credited and that the original publication in this journal is cited, in accordance with accepted academic practice. No use, distribution or reproduction is permitted which does not comply with these terms.
*Correspondence: Sujatha Balasubramaniam, sujathapachaiyappas@gmail.com; Thilagam Harikrishnan, thilagampachaiyappas@gmail.com
†These authors have contributed equally to this work
This article was submitted to Marine Pollution, a section of the journal Frontiers in Marine Science
Disclaimer
All claims expressed in this article are solely those of the authors and do not necessarily represent those of their affiliated organizations, or those of the publisher, the editors and the reviewers. Any product that may be evaluated in this article or claim that may be made by its manufacturer is not guaranteed or endorsed by the publisher.