Abstract
The movement of organisms facilitated by anthropogenic activities is a serious threat to marine diversity, especially for endemic species that may be outcompeted from non-indigenous species (NIS). In this study, we have analyzed communities inhabiting the north of the Gulf of Aqaba, Red Sea, employing environmental DNA (eDNA) metabarcoding. That gulf is especially rich in species and population endemism. We have detected NIS representing 36% of the total number of species found from eDNA. Primary producers were more abundant in the NIS than in the native fraction of species, suggesting that functional diversity could be altered if NIS thrive there. We discuss maritime traffic as a factor that may enhance the introduction of non-natives in this region and emphasize the importance of the control of these species that may threaten the rich endemic biota of the Red Sea.
Introduction
Maritime traffic is a well-known way of spreading non-indigenous species (NIS) around the world (Sardain et al., 2019; Iacarella et al., 2020). Many examples demonstrate that ships carry numerous species in different compartments, principally attached to the hull (Chan et al., 2022) and in ballast water (Ardura et al., 2020). As a consequence, commercial ports and marinas are considered hotspots of biological invasions (Ferrario et al., 2017), and the projected invasion risk due to the global increase of maritime traffic is surging in many countries (Sardain et al., 2019). Even in islands with only small fishing ports, the importance of maritime traffic is reflected in the significant association between the density of boats and the abundance of NIS (Ardura et al., 2015).
One of the possible consequences of NIS introduction into a new ecosystem is the outbreak of biological invasions. However, not all of the NIS become invasive in the recipient ecosystem. A golden rule for successful invaders is “the more tolerant are the more dangerous” (Sakai et al., 2001; Lee, 2002; Madariaga et al., 2014), with tolerance to salinity, high temperature, and oxygen depletion acting as natural filters. Temperature fluctuations, oxygen depletion, and increased salinity may create a bottleneck for successful invasion (Früh et al., 2012). To become invasive, NIS must find a niche and reproduce without control (Williamson and Griffiths, 1996). This process is favored, among other factors, by depressed native diversity and disturbed habitats (García-Berthou et al., 2005), such as heavily anthropic ports and polluted areas (Miralles et al., 2016; Fernandez et al., 2021).
The Red Sea is a biodiversity hotspot (Roberts, 2002), rich in endemic species and lineages (Hodge et al., 2014), with a complex evolutionary history marked by past low-salinity conditions that enabled some parts, like the Gulf of Aqaba, to act as glacial refugia (DiBattista et al., 2016). This gulf is characterized by a vertical offshore profile with limited reefs and a high proportion of endemisms, where planktonic organisms were able to survive during the Last Glacial Maximum unlike in other areas of the Red Sea (Fenton et al., 2000). In the last decades, the whole region is experiencing an accelerated development that encompasses important conservation efforts to safeguard the unique diversity of the Red Sea (Chalastani et al., 2020). However, the conservation is principally focused on Marine Protected Areas (Gajdzik et al., 2021); the prevention of biological invasions seems to be somewhat overlooked, since reports of NIS are scarce in the Red Sea (Por, 1978). More studies are needed about this important biodiversity threat in a region that shelters such a rich endemic biota.
The majority of studies about marine invasive species target macroscopic taxonomic groups, like vertebrates, metazoans, or macroalgae, that are easier to spot, sample, and identify. However, many microscopic taxa living in the plankton can be invasive as well, like Oithona davisae (Yildiz et al., 2016) and other planktonic calanoid copepods (Beaver et al., 2019) or other zooplanktonic species (Kelly et al., 2013). Many of those invaders are overlooked for the intrinsic difficulty of sampling and the need of specialized laborious expertise for their identification (Feckler et al., 2014; Blackman et al., 2022). Environmental DNA (eDNA) and metabarcoding can help in this, since obtaining individuals for further taxonomic analysis is not necessary (Uchii et al., 2016; Borrell et al., 2017). eDNA is DNA directly extracted from environmental samples (water, soil, and biofilms), containing DNA remains and cells shed by multicellular organisms in the environment, and indeed unicellular organisms. The organisms present in the environment are then identified through high-throughput sequencing a phylogenetically informative DNA region. Many studies have demonstrated that metabarcoding on DNA samples reflect the existing biodiversity in aquatic environments (e.g., Fernandez et al., 2021; Blackman et al., 2022). The technique is useful for the identification of exotic plankton species; for example, eDNA extracted from water samples in French Polynesia allowed researchers to identify planktonic NIS that suggest changes in the trophic chain from its lower links (Ardura et al., 2021).
This study aims at filling the gap of studies about Red Sea NIS, focusing on those species that can be found from eDNA in coastal water samples: principally planktonic species, planktonic stages of metazoans, and other species detectable from eDNA remains. Water samples were analyzed using eDNA metabarcoding, and NIS were identified and characterized in terms of their most likely origin based on their native distribution.
Materials and methods
Sampling locations and procedure
Three locations were targeted in the Gulf of Aqaba: Hahashmal, The Red Rock, and Neviot beaches. They are sandy beaches located within 5 km in a touristic area in the north of the Gulf (Figure 1).
Figure 1
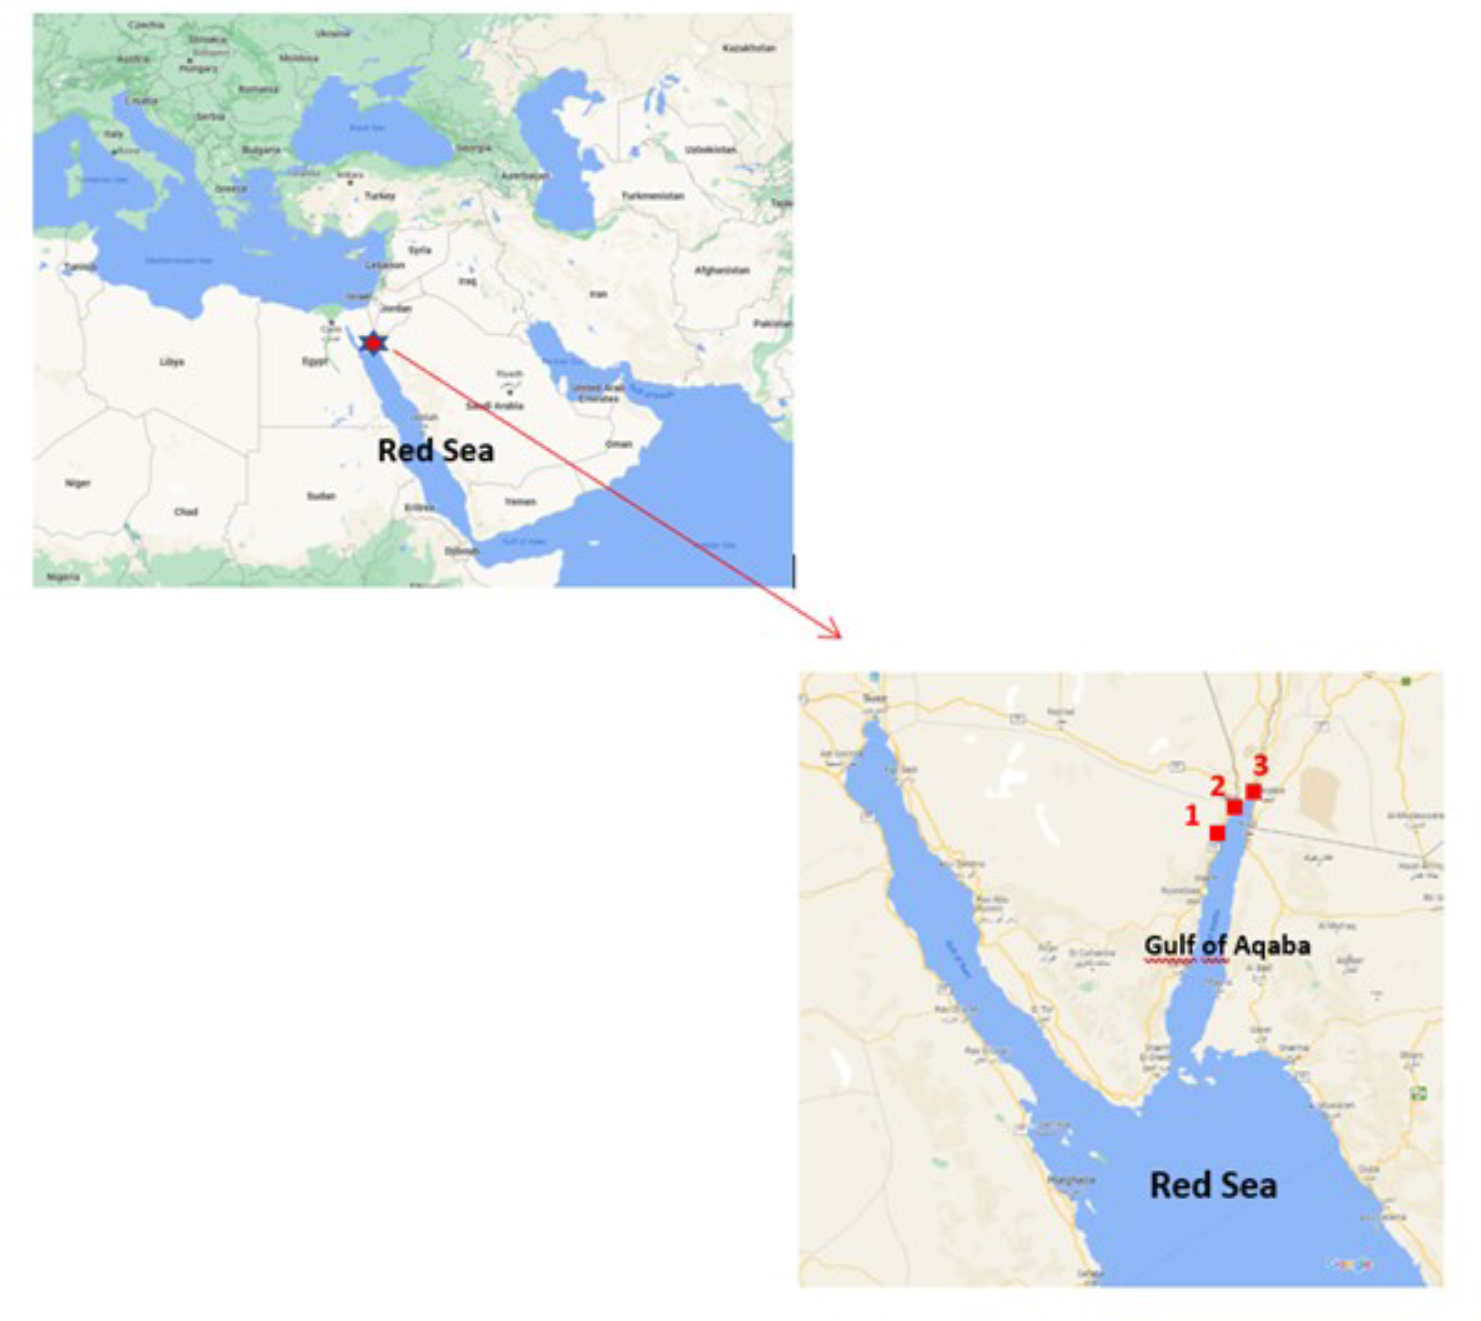
Map showing the beaches sampled in the Gulf of Aqaba, north Red Sea: 1: Hahashmal, 2: The Red Rock and 3: Neviot. Source: modified by the authors from Google Maps.
We considered the following environmental stressors: the maritime traffic, using the proximity to a port and/or a marina as a proxy; the visible presence of marine litter on the beach as a proxy of floating litter, which is a secondary NIS dispersal vector; the occurrence of pollution visualized from sewage discharges (= disturbed physic-chemical and bacterial environment); and beach frequentation observed (tourism pressure). These factors increase the frequency of NIS that are transported by ships (Ardura et al., 2015) and floating marine litter (Rech et al., 2018; Fernandez et al., 2022) and are often associated with degraded or anthropogenic areas (Pyšek and Richardson, 2010). Dummies 1 (stressor present in a beach) and 0 (stressor absent) were employed. Of the three locations, Hahashmal beach was subjected to more environmental stresses (litter, a pipeline discharge nearby, and the proximity of Eilat commercial port) than Neviot beach (a touristic beach near a marina), and The Red Rock beach was apparently the least stressed of the three sampling locations (Table 1).
Table 1
| Environmental stressors | |||||
|---|---|---|---|---|---|
| Beach | Coordinates | Marine litter | Port | Sewage discharge | Beach frequentation |
| Hahashmal | 29°32’29.8”N/34°56’54.3”E | 1 | 1 | 1 | 0 |
| The Red Rock | 29°32’51.3”N/34°57’12.6”E | 0 | 0 | 0 | 1 |
| Neviot | 29°32’54.2”N/34°57’44.5”E | 0 | 1 | 0 | 1 |
Characteristics of the sampling sites considered in this study.
Geographical coordinates and environmental stressors (1 present, 0 absent).
Water samples were collected in January 2019. Three samples of 1 L of water were taken from each site using 100-ml sterilized syringes. Syringes were washed before and after sampling with 10% bleach and rinsed thrice with sterile water. The water samples were filtered in situ through PES Supor® 200 Membrane Filters (Pall Corporation, Life Sciences) of 0.2 μm pore, and the filters were immediately placed in tubes filled with sterile ethanol. More details about sampling procedures can be found in Georges et al. (2021).
Molecular analysis
eDNA was extracted from the filters in a laminar air flow chamber to prevent contamination using the PowerWater® DNA Isolation Kit (MoBio Laboratories) following the manufacturer’s protocol. Negative controls were included at this step (DNA extraction from pure sterile ethanol samples) to ensure that contamination did not occur during the extraction process.
The purified DNA was quantified with Qubit® dsDNA HS (High Sensitivity) Assay Kits. Once eDNA was extracted, the filtration replicates (three per beach) were pooled per sampling point before sequencing to increase eDNA quantity. The primers mlCOIintF: 5′-GGWACWGGWTGAACWGTWTAYCCYCC-3′ and jgHCO2198: 5′-TANACYTCNGGRTGNCCRAARAAYCA-3′ (Leray et al., 2013) were employed to amplify a 313-bp fragment within the cytochrome oxidase subunit 1 gene (COI) that shows good results of plankton diversity recovery (e.g., Ardura et al., 2015; Suter et al., 2021). Polymerase chain reaction (PCR) was performed on 12 μl of each eDNA sample. Negative PCR controls were added as extra samples.
Thermocycling conditions were as follows: initial denaturing at 95°C for 5 min; 35 cycles of 95°C for 1 min, 48°C for 1 min, and 72°C for 1 min; 72°C for 5 min extension; and 4°C on hold. The 2100 Bioanalyzer instrument (Agilent Technologies) was employed to confirm fragment size and no occurrence of by-products. Amplicons were analyzed in the platform Ion Torrent PGM (ThermoFisher Scientific, USA) in the University of Oviedo. Different barcodes were added to the forward primer in order to identify the nine samples. The libraries were constructed with the Ion PGM Hi-Q view OT2 kit. High-throughput sequencing was done with the Ion PGM Hi-Q view Sequencing Kit on an Ion 314 Chip v.2 (ThermoFisher Scientific).
Bioinformatics of NGS data
QIIME software (Caporaso et al., 2010), although initially developed for prokaryote community analysis, is also employed on studies of eukaryote communities that use COI as a metabarcode (e.g., Von Ammon et al., 2018; Gueuning et al., 2019; Giebner et al., 2020; Georges et al., 2021). The open-source version QIIME 1.8.0 was employed in this study, as in Von Ammon et al. (2018) and Georges et al. (2021). Ion Torrent sequences were processed as follows: Low‐quality and polyclonal sequences were automatically filtered out, and the PGM adaptor was trimmed within the PGM software. QIIME was used to split the fastq files into constituent.fna and.qual files using convert_fastqualfastq. Py” python script, and to filter sequences by quality and size (minimum and maximum size of 250–400 and quality score of 25) using “split_libraries.py” python script. Qiime2 version was also employed as described in Garcia-Vazquez et al. (2021), to confirm the results.
OTU tables were constructed clustering reads with a 100% identity (exact sequence variants or ESV). Removal of singletons is often employed to eliminate false positives as proposed by Scott et al. (2018); however, in the context of early NIS detection for biosecurity surveillance, a false negative is more costly than a false positive (Von Ammon et al., 2018); thus, singletons were retained in the OTU table to allow maximum sensitivity for species detection. For the taxonomic assignation, Basic Local Alignment Search Tool (BLAST) alignment was performed against a locally built partial NCBI database of COI sequences, obtained and stored locally in September 2017. The following criteria were employed for the assignment of a sequence to a species: E value ≤ 10−50 and minimum percent identity = 97.0, which is generally enough for species identification from COI barcode (Hebert et al., 2003). For those sequences with multiple BLAST hits at a 100% identity to different species, or which best BLAST hit had no available species-level taxonomic identification, ESVs were taxonomically assigned at a genus level only.
Taxonomic and biogeographic information
Species taxonomy nomenclature followed the World Register of Marine Species WoRMS (WoRMS Editorial Board, 2022). For biogeographic analysis, only the taxonomic units identified down to a species level were considered. The status (whether native or alien) (NIS) in each region was determined from relevant literature and databases, such as WoRMS, Algaebase (Guiry and Guiry, 2022), and regional species lists like that of El-Sherif and Aboul Ezz (2000). Species’ invasive status was determined according to the Global Invasive Species Database (GISD) (Invasive Species Specialist Group, 2015), and the Invasive Species Compendium CABI (2022). Species causing harmful algal blooms (HAB) were checked in the IOC-UNESCO taxonomic reference list (Lundholm et al., 2009 onwards).
Statistical analysis
ESVs assigned to a species or genus using the bioinformatics pipeline described above were employed for downstream analysis. ESV diversity in each location was estimated from the number of species of each phylum as a variable. The Shannon–Weiner index was calculated from these data. The significance of differences in diversity between locations was checked from t-tests.
Distributions of quantitative data like the number of species of each taxon, or number of species of different origins, were compared between samples employing contingency Chi-square and post-hoc tests when needed. The effect size was tested from Cramer’s V tests.
Associations between diversity indicators like species richness, Shannon index, and proportion of alien species were tested using r-statistics. Parametric or non-parametric tests were employed depending on data normality. Normality was checked using Shapiro–Wilk tests.
The statistical analysis was conducted with the free software PAST v.4 (Hammer et al., 2001).
Results
High-throughput sequencing (HTS) results from eDNA metabarcoding of the Gulf of Aqaba samples are available in NCBI’s Sequence Read Archive repository with the following references: BioProject ID PRJNA631156 and BioSample SAMN14853927. Summing the three replicates of each site (only one from Hahashmal beach because the other two had too little DNA and PCR failed), the total number of BLAST hits at 97% identity ranged from 4,692 in Neviot to 17,299 in Hahashmal beach (Table 2). The results obtained with Qiime2 were practically identical and confirmed species assignations (data not shown). The number of sequences assigned to marine species was much lower, especially in Hahashmal beach where the majority of sequences were of Homo sapiens; these were discarded from further downstream analysis (Table 2). The abundance of H. sapiens sequences therein could be explained from the nearby occurrence of sewage discharges, which contain much human eDNA from urine and fecal matter (Harrison et al., 2019).
Table 2
| Beach | Raw reads | Quality-filtered sequences (%) | BLAST hits 97% (%) | Sequences assigned to marine species (%) |
|---|---|---|---|---|
| Hahashmal | 59,901 | 39.04 | 28.88 | 0.25 |
| The Red Rock | 55,377 | 61.87 | 28.55 | 19.48 |
| Neviot | 54,849 | 35.92 | 8.42 | 7.23 |
NGS results in the analyzed samples, as number of raw reads, proportion of quality-filtered sequences, proportion of sequences assigned to a taxonomic unit from BLAST using 97% identity threshold, and proportion of sequences assigned to marine species.
Despite small water volumes analyzed, the diversity captured was relatively high. Excluding the sequences assigned to terrestrial species, the number of marine ESVs, or putative species, ranged from 18 in Hahashmal to 42 in The Red Rock beach (Table 3, Supplementary Table 1).
Table 3
| Hahashmal | Red Rock | Neviot | |
|---|---|---|---|
| Diversity from eDNA | |||
| ESV count | 18 | 42 | 30 |
| Shannon-Weiner diversity | 0.62* | 1.27 | 1.12 |
| % phytoplankton species | 0.22 | 0.4 | 0.43 |
| Native distribution of the putative species | |||
| Mediterranean and Black Sea Marine System | 0.00 | 0.07 | 0.07 |
| Red and Indian | 0.33 | 0.33 | 0.23 |
| Shared Mediterranean and Red Sea | 0.06 | 0.12 | 0.10 |
| Pacific | 0.11 | 0.10 | 0.03 |
| Atlantic | 0.33 | 0.12 | 0.20 |
| Cosmopolitan/Cryptogenic | 0.17 | 0.26 | 0.37 |
Characteristics of the communities detected from eDNA in the sampling sites considered.
The number of ESV (Molecular Operational Taxonomic Units) represents putative species. The sample with significantly lower diversity is marked with an asterisk.
The three locations contained many arthropods, principally copepods (see Supplementary Table 1), and dinoflagellates (Myzozoa) were also relatively abundant in the three beaches, between 0.22 and 0.43 (Figure 2). Despite being located quite close to each other, the taxonomic profiles of the three beaches (Figure 2) were significantly different (χ2 = 25.81, with 14 d.f. and p = 0.02 < 0.05, Cramer’s V = 0.3, indicating medium effect size). Red algae (Rodophyta) were found only from The Red Rock beach, and Cnidarians were found in The Red Rock and Hahashmal beaches, but not in Neviot.
Figure 2
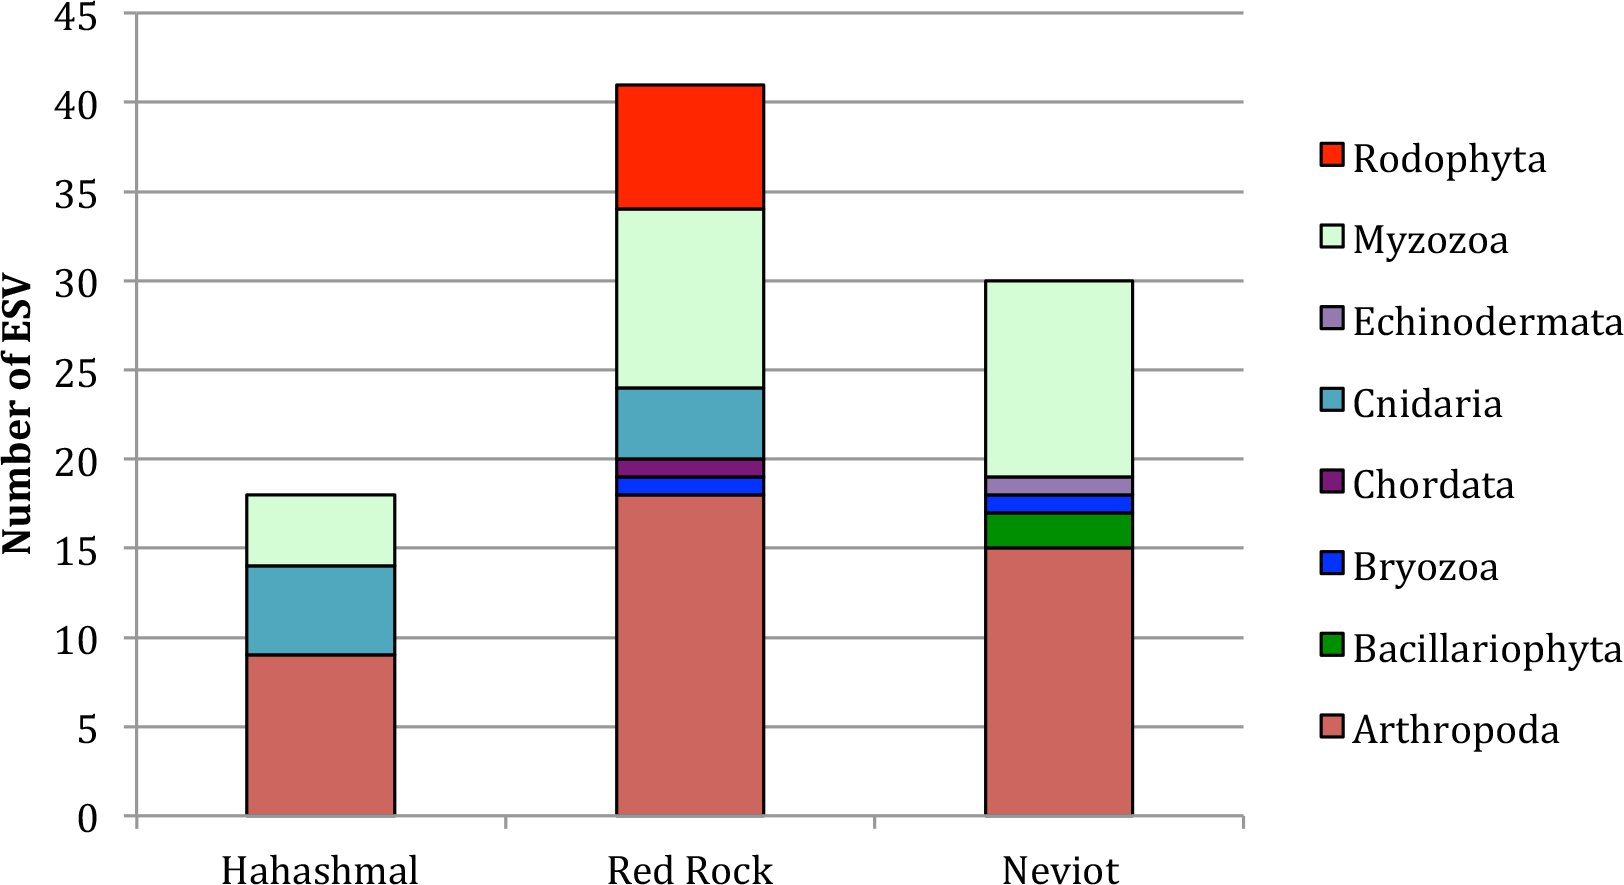
Taxonomic profile of the analyzed samples. Results are presented as the number of ESV (putative species) of different phyla in each location.
The taxonomic diversity (Shannon indices) oscillated between 0.69 in Hahashmal to 1.27 in The Red Rock beach. In pairwise comparisons, the least stressed, The Red Rock (one stressor: beach frequentation), was significantly more diverse than the most stressed Hahashmal beach, which is littered, polluted, and located near the commercial port of Eilat (t = 3.94, 38 d.f., p = 0.0003). Neviot, stressed from beach frequentation and a marina but not highly polluted, was also significantly more diverse than Hahashmal Beach (t = 2.23, 38 d.f., p = 0.03). The Red Rock beach diversity was higher than that of Neviot beach, but the difference was not significant (t = 0.77, 59 d.f., p = 0.45 > 0.05 n.s.).
We made an analysis of the native geographic distribution of the species detected (Table 3). The proportion of Red Sea native and cosmopolitan/cryptogenic species in the Gulf of Aqaba samples analyzed was 63.9% overall; thus, 36.1% were NIS. The proportion of NIS was 44% in Hahashmal, 30% in Neviot, and 28.6% in The Red Rock, just inverting the order of beach stress as expected. Correlational analysis was not done for the small number of locations analyzed.
Focusing on the NIS found in this study, half of them (50%) were native to the Atlantic Ocean (Table 4), followed by those of Pacific origin (27.3%) and finally five (22.7%) from the Mediterranean Sea. One of those, the invasive HAB-causing Karlodinium veneficum, is recognized as invasive in international databases (CABI, 2022). Biota distribution by geographical origin (summing native and cosmopolitan/cryptogenic) was not significantly different between the three beaches (χ2 = 6.03 with 6 d.f. and p = 0.41 > 0.05 n.s., Cramer’s V = 0.18, indicating moderate effect size).
Table 4
| Beach | |||||
|---|---|---|---|---|---|
| Origin | Species group | Species | Hahashmal | The Red Rock | Neviot |
| Mediterranean | Arthropoda | Euphausia brevis | 0 | 0 | 1 |
| Dinoflagellate | Karlodinium veneficum * | 0 | 1 | 0 | |
| Dinoflagellate | Kryptoperidinium foliaceum | 0 | 0 | 1 | |
| Elasmobranchii | Raja clavata | 0 | 1 | 0 | |
| Hydrozoan | Praya reticulata | 0 | 1 | 0 | |
| Atlantic | Copepod | Euchirella messinensis | 1 | 1 | 0 |
| Copepod | Calocalanus contractus | 1 | 1 | 1 | |
| Copepod | Oncaea scottodicarloi | 0 | 0 | 1 | |
| Copepod | Paracalanus quasimodo | 1 | 0 | 0 | |
| Dinoflagellate | Alexandrium ostenfeldii | 0 | 1 | 1 | |
| Dinoflagellate | Azadinium poporum | 1 | 0 | 1 | |
| Dinoflagellate | Lepidodinium chlorophorum | 0 | 1 | 1 | |
| Dinoflagellate | Scrippsiella lachrymosa | 1 | 0 | 0 | |
| Dinoflagellate | Thoracosphaera heimii | 0 | 0 | 1 | |
| Hydrozoan | Cyclocanna producta | 0 | 1 | 0 | |
| Sea anemone | Cervera atlantica | 1 | 0 | 0 | |
| Pacific | Bryozoan | Flustrellidra armata | 0 | 1 | 1 |
| Dinoflagellate | Togula jolla | 0 | 1 | 0 | |
| Hydrozoan | Bonneviella regia | 0 | 1 | 0 | |
| Red algae | Palisada crustiformans | 0 | 1 | 0 | |
| Sea anemone | Sarcophyton tumulosum | 1 | 0 | 0 | |
| Sea anemone | Sinularia slieringsi | 1 | 0 | 0 |
Non-indigenous species found from eDNA in this study.
Presence/absence as 1/0. Invasive species recognized in the Invasive Species Compendium (CABI, 2022) are marked with an asterisk. Species causing algal blooms are highlighted in bold.
The taxonomic profile of native species and NIS (Figure 3) was significantly different (χ2 = 11.14 with 4 d.f. and p = 0.02, large effect size with Cramer’s V = 0.4), and the differences occurred principally for Cnidarians (more NIS than natives in this gulf) and planktonic species, with NIS dinoflagellates being more abundant than the native ones and copepods being the other way around (Figure 3, Supplementary Table 1, Table 4).
Figure 3
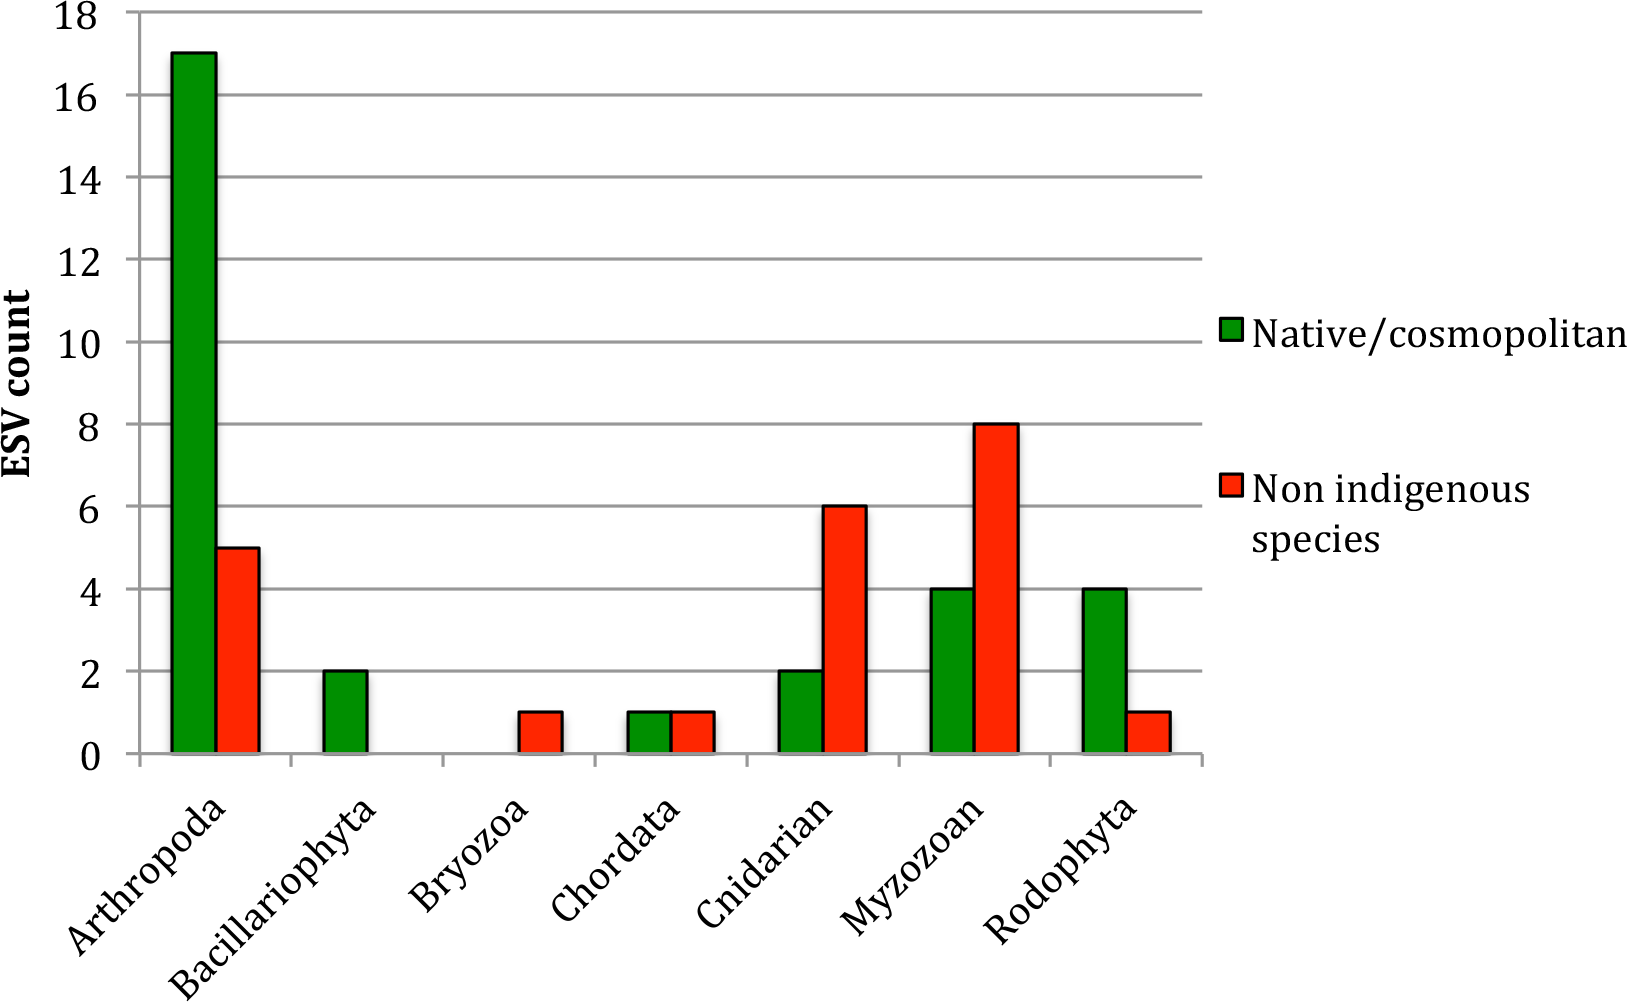
Taxonomic profile of the native and non-indigenous communities found from eDNA in the Gulf of Aqaba samples analyzed. Results are presented as ESV counts for native and non-indigenous species, per phylum.
Discussion
In this study, we have found an important proportion of non-native species in the north of the Gulf of Aqaba employing eDNA as a monitoring tool. The NIS found in this study may have the capacity to change the rich Red Sea native biota. For example, some NIS of this study are known producers of HAB (Table 4). They would be able to harm the environmental status of the Gulf of Aqaba, as it happened in the Baltic Sea where alien bloom-forming dinoflagellates have caused devastating effects (Telesh et al., 2016). On the other hand, we found DNA of the Mediterranean fish Raja clavata (Table 4). This species is not invasive, but it carries parasites that could endanger Red Sea native elasmobranchs (Petter and Radujković, 1989; Youssef et al., 2019).
For some authors, alien species should not have a negative connotation, and the conservation of a good environmental status to guarantee a normal ecosystem functioning should be prioritized over eradication of invasive species (Giangrande et al., 2020). However, the taxonomic composition of NIS found in the Gulf of Aqaba in our study was significantly different from that of the native species. The majority of NIS inferred from eDNA in Gulf of Aqaba samples were algae; if settling and expanding, they could modify the trophic web as suggested for French Polynesian ports (Ardura et al., 2021), perhaps increasing the primary production or favoring algal blooms (Telesh and Naumenko, 2021). Thus, a change in ecosystem functioning may be expected if those NIS thrive and replace the native species.
Considering the intense maritime traffic in the Red Sea, which is a main route of connection between the Indo-Pacific and the Atlantic oceans, likely many NIS found in this study have used ships as vectors. A higher proportion of NIS in the beaches closest to the port and the marina than in The Red Rock beach, which is less influenced by maritime traffic, would support this view; even at a very short scale, since the three beaches are located near each other. Since species can travel attached to ship hulls, in ballast water and in other vessel compartments (e.g., Sardain et al., 2019; Ardura et al., 2020), measures like a control of hull fouling and ensuring the compliance of the International Convention for the management of ballast water could help to improve biosecurity preventing NIS introductions in the Red Sea.
Although maritime traffic could explain the relative abundance of NIS in the three studied locations, other explanations are possible. NIS may have arrived in other areas within the Red Sea and move to the north of the Gulf of Aqaba by unaided ways, like secondary dispersal drifting with currents and maritime tides (Kraus et al., 2019; Wood et al., 2021). Rafting on floating marine litter (Rech et al., 2018; Fernandez et al., 2022) cannot be excluded either as a way of secondary dispersal, because the most littered Hahashmal beach was the most biopolluted (but it is the closest to the commercial port; thus, it is not possible to distinguish between the two factors). The north of the Gulf of Aqaba is heavily anthropogenic and these results cannot be directly applied to other regions of the Red Sea; instead, they could be taken as a call of attention because planktonic species occupying the Gulf of Aqaba can be transported to other areas by currents and tides. Expanding the geographical coverage of this type of studies to other Red Sea areas will help to understand the real extent of NIS risks and explain their ways of introduction and dispersal.
The particular habitat of the different beaches could also explain differences in diversity. Red algae, all native species except one, were found only from the least stressed beach (The Red Rock); this could be explained simply because that beach has more rocks than the others for red algae to attach to. Bryozoans (identified as Flustrellidra armata from eDNA) appeared in The Red Rock and Neviot beaches, but not in Hahashmal. The colonies of this species are distributed in rocky intertidal zones (Grischenko et al., 2010), but, opposite to the two other beaches, the substrate of Hahashmal beach is mainly sandy, with no rocks; thus, this bryozoan would not find its optimal habitat there.
As a final remark, the technique employed in this study is able to detect NIS that are not always found from conventional surveys, as highlighted in other studies that used the same approach (Furlan et al., 2019; Ardura et al., 2021; King et al., 2022). Despite current gaps in DNA reference databases (Weigand et al., 2019), eDNA metabarcoding could be used as a barometer of disturbance, helping to understand marine environments and complementing the existing survey methods (DiBattista et al., 2020).
Limitations of this study
This study has some limitations. Being based on small water volumes and only one metabarcode, the eDNA quantity and the number and diversity of ESVs recovered were relatively low; thus, we may either under- or overestimate the proportion of NIS. Another technical problem is the lack of replications. Moreover, given the small number of locations sampled, it is very difficult to establish sound correlations between the environmental stresses—here shallowly measured from dummies—and the diversity. Although Garcia-Vazquez et al. (2021) have reported the utility of eDNA from small water samples for the detection of some plankton taxa, for all these limitations, the results of the present study cannot reflect the true diversity and impact of NIS in the northern Red Sea and should be considered exploratory.
Conclusions and management recommendations
This study based on eDNA metabarcoding reports the presence of an important proportion of non-native species in the north of the Gulf of Aqaba. The taxonomic profile of NIS differs from that of the native species detected, suggesting changes in ecosystem functioning that could be predicted in case of proliferation of those NIS. Some of them are potentially harmful microalgae, which also implies functional changes.
For management, systematic monitoring for surveillance of non-native species would be recommended in the Gulf of Aqaba. Gajdzik et al. (2021) proposed the Red Sea nations to gather in a “Red Sea Challenge” to concert marine conservation efforts in the region. We would add the control of non-native species to their proposal, because biosecurity is important for biodiversity conservation. Improving the control of hull fouling and ballast water, and conducting periodical monitoring of biota from coastal and offshore waters, could help to keep biopollution out of Red Sea waters.
Statements
Data availability statement
The datasets presented in this study can be found in online repositories. The names of the repository/repositories and accession number(s) can be found in the article/Supplementary Material.
Author contributions
All the authors contributed significantly to this manuscript, have revised it and approved its submission to Frontiers in Marine Science. SF: data creation and analysis, contribution to writing. AA: sampling, data creation and analysis, contribution to writing. OG: sampling, data creation and analysis. MS-M: data analysis. JM: data creation and analysis. SP: conceptual design, sampling, data creation. EG-V: conceptual design, data analysis, writing. All authors contributed to the article and approved the submitted version.
Funding
This study was supported by the Spanish Ministry of Science and Innovation Grant PDC2021-120939-I00. SF holds a Margarita Salas Grant reference SV-PA-21-AYUD/2021/58385.
Conflict of interest
The authors declare that the research was conducted in the absence of any commercial or financial relationships that could be construed as a potential conflict of interest.
Publisher’s note
All claims expressed in this article are solely those of the authors and do not necessarily represent those of their affiliated organizations, or those of the publisher, the editors and the reviewers. Any product that may be evaluated in this article, or claim that may be made by its manufacturer, is not guaranteed or endorsed by the publisher.
Supplementary material
The Supplementary Material for this article can be found online at: https://www.frontiersin.org/articles/10.3389/fmars.2022.940889/full#supplementary-material
References
1
Ardura A. Borrell Y. J. Fernández S. González Arenales M. Martínez J. L. Garcia-Vazquez E. (2020). Nuisance algae in ballast water facing international conventions. insights from DNA metabarcoding in ships arriving in bay of Biscay. Water12, 2168. doi: 10.3390/w12082168
2
Ardura A. Fernandez S. Haguenauer A. Planes S. Garcia-Vazquez E. (2021). Ship-driven biopollution: How aliens transform the local ecosystem diversity in pacific islands. Mar. Poll. Bull.166, 112251. doi: 10.1016/j.marpolbul.2021.112251
3
Ardura A. Planes S. Garcia-Vazquez E. (2015). Aliens in paradise. boat density and exotic coastal mollusks in moorea island (French Polynesia). Mar. Environ. Res.112, 56–63. doi: 10.1016/j.marenvres.2015.08.007
4
Beaver J. R. Tausz C. E. Renicker T. R. Ordosch D. M. (2019). Distributions and range expansions of rare or invasive species of planktonic calanoid copepods (Copepoda: Calanoida) within lakes and reservoirs in the continental united states. J. Crustacean Biol.39 (4), 533–539. doi: 10.1093/jcbiol/ruz026
5
Blackman R. C. Brantschen J. Walser J. C. Wüthrich R. Altermatt F. (2022). Monitoring invasive alien macroinvertebrate species with environmental DNA. River Res. Appl38 (2). doi: 10.1002/rra.3947
6
Borrell Y. J. Miralles L. Do Huu H. Mohammed-Geba K. Garcia-Vazquez E. (2017). DNA In a bottle–rapid metabarcoding survey for early alerts of invasive species in ports. PLoS One12 (9), e0183347. doi: 10.1371/journal.pone.01833477
7
CABI (2022). Invasive species compendium (Wallingford, UK: CAB International).
8
Caporaso J. G. Kuczynski J. Stombaugh J. Bittinger K. Bushman F. D. Costello E. K. et al . (2010). QIIME allows analysis of high-throughput community sequencing data. Nat. Methods7, 335–336. doi: 10.1038/nmeth.f.303
9
Chalastani V. I. Manetos P. Al-Suwailem A. M. Hale J. A. Vijayan A. P. Pagano J. et al . (2020). Reconciling tourism development and conservation outcomes through marine spatial planning for a Saudi giga-project in the red Sea (The red Sea project, vision 2030). Front. Mar. Sci.7. doi: 10.3389/fmars.2020.00168
10
Chan F. T. Ogilvie D. Sylvester F. Bailey S. A. (2022). Ship biofouling as a vector for non-indigenous aquatic species to Canadian Arctic coastal ecosystems: A survey and modeling-based assessment. Front. Mar. Sci.9. doi: 10.3389/fmars.2022.808055
11
DiBattista J. D. Howard Choat J. Gaither M. R. Hobbs J.-P. A. Lozano-Cortés D. F. Myers R. F. et al . (2016). On the origin of endemic species in the red Sea. J. Biogeogr.43, 13–30. doi: 10.1111/jbi.12631
12
DiBattista J. D. Reimer J. D. Stat M. Masucci G. D. Biondi P. De Brauwer M. et al . (2020). Environmental DNA can act as a biodiversity barometer of anthropogenic pressures in coastal ecosystems. Sci. Rep.10, 8365. doi: 10.1038/s41598-020-64858-9
13
El-Sherif Z. M. Aboul Ezz S. M. (2000). Check list of plankton from the northern red Sea. Pakistan J. Mar. Sci.9, 61–78. doi: 10.21608/ejabf.2018.8167
14
Feckler A. Zubrod J. P. Thielsch A. Schwenk K. Schulz R. Bundschuh M. (2014). Cryptic species diversity: an overlooked factor in environmental management? J. Appl. Ecol.51 (4), 958–967. doi: 10.1111/1365-2664.12246
15
Fenton M. Geiselhart S. Rohling E. J. Hemleben (2000). Aplanktonic zones in the red Sea. Mar. Micropaleo.40, 277–294. doi: 10.1016/S0377-8398(00)00042-6
16
Fernandez F. Ibabe. A. Rayon-Viña F. Ardura A. Bartolomé M. Borrell Y. J. et al . (2022). Flotsam, an overlooked vector of alien dispersal from ports. Est. Coast. Shelf Sci.271, 107879. doi: 10.1016/j.ecss.2022.107879
17
Fernandez S. Miller D. L. Holman L. E. Gittenberger A. Ardura A. Rius M. et al . (2021). Environmental DNA sampling protocols for the surveillance of marine non-indigenous species in Irish coastal waters. Mar. Poll. Bull.172, 112893. doi: 10.1016/j.marpolbul.2021.112893
18
Ferrario J. Caronni S. Occhipinti-Ambrogi A. Marchini A. (2017). Role of commercial harbours and recreational marinas in the spread of non-indigenous fouling species. Biofouling33 (8), 651–660. doi: 10.1080/08927014.2017.1351958
19
Früh D. Stoll S. Haase P. (2012). Physico-chemical variables determining the invasion risk of freshwater habitats by alien mollusks and crustaceans. Ecol. Evol.2 (11), 2843–2853. doi: 10.1002/ece3.382
20
Furlan E. M. Gleeson D. Wisniewski C. Yick J. Duncan R. P. (2019). eDNA surveys to detect species at very low densities: A case study of European carp eradication in Tasmania, Australia. J. Appl. Ecol.56 (11), 2505–2517. doi: 10.1111/1365-2664.13485
21
Gajdzik L. Green A. L. Cochran J. E. M. Hardenstine R. S. Tanabe L. K. Berumen M. L. (2021). Using species connectivity to achieve coordinated large-scale marine conservation efforts in the red Sea. Mar. Poll. Bull.166, 112244. doi: 10.1016/j.marpolbul.2021.112244
22
García-Berthou E. Alcaraz C. Pou-Rovira Q. Zamora L. Coenders G. Feo C. (2005). Introduction pathways and establishment rates of invasive aquatic species in Europe. Can. J. Fish. Aquat. Sci.62 (2), 453–463. doi: 10.1139/f05-017
23
Garcia-Vazquez E. Georges O. Fernandez S. Ardura A. (2021). eDNA metabarcoding of small plankton samples to detect fish larvae and their preys from Atlantic and pacific waters. Sci. Rep.11, 7224. doi: 10.1038/s41598-021-86731-z
24
Georges O. Fernández S. Martinez J. L. Garcia-Vazquez E. (2021). DNA Metabarcoding illustrates biological pollution threats of red Sea - dead Sea water conveyance to dead Sea biodiversity. Mar. Poll. Bull.168, 112451. doi: 10.1016/j.marpolbul.2021.112451
25
Giangrande A. Pierri C. Del Pasqua M. Gravili C. Gambi M. C. Gravina M. F. (2020). The Mediterranean in check: Biological invasions in a changing sea. Mar. Ecol.41, e12583. doi: 10.1111/maec.12583
26
Giebner H. Langen K. Bourlat S. J. Kukowka S. Mayer C. Astrin J. J. et al . (2020). Comparing diversity levels in environmental samples: DNA sequence capture and metabarcoding approaches using 18S and COI genes. Mol. Ecol. Resour.20, 1333–1345. doi: 10.1111/1755-0998.13201
27
Grischenko A. V. Seo J. E. Min B. S. (2010). Flustrellidra armata (Bryozoa: Ctenostomatida)–a new species from the southern shoreline of Korea. Zootaxa2684, 25–35. doi: 10.11646/zootaxa.2684.1.3
28
Gueuning M. Ganser D. Blaser S. Albrecht M. Knop E. Praz C. et al . (2019). Evaluating next-generation sequencing (NGS) methods for routine monitoring of wild bees: Metabarcoding, mitogenomics or NGS barcoding. Mol. Ecol. Resour.19, 847–862. doi: 10.1111/1755-0998.13013
29
Guiry M. D. Guiry G. M. (2022). AlgaeBase (National University of Ireland, Galway: World-wide electronic publication). Available at: https://www.algaebase.org.
30
Hammer Ø. Harper D. A. Ryan P. D. (2001). PAST: paleontological statistics software package for education and data analysis. Palaeontol. Electronica4 (1), 9. Available at: http://palaeo-electronica.org/2001_1/past/issue1_01.htm.
31
Harrison J. B. Sunday J. M. Rogers S. (2019). Predicting the fate of eDNA in the environment and implications for studying biodiversity. Proc. R. Soc B286, 20191409. doi: 10.1098/rspb.2019.1409
32
Hebert P. D. Ratnasingham S. de Waard (2003). Barcoding animal life: cytochrome c oxidase subunit 1 divergences among closely related species. Proc. R. Soc Lon. B Biol. Sci.270 (Suppl. 1), S96–S99. doi: 10.1098/rsbl.2003.0025
33
Hodge J. R. van Herwerden L. Bellwood D. R. (2014). Temporal evolution of coral reef fishes: global patterns and disparity in isolated locations. J. Biogeogr.41, 2115–2127. doi: 10.1111/jbi.12356
34
Iacarella J. C. Lyons D. A. Burke L. Davidson I. C. Therriault T. W. Dunham A. et al . (2020). Climate change and vessel traffic create networks of invasion in marine protected areas. J. Appl. Ecol.57, 1793–1805. doi: 10.1111/1365-2664.13652
35
Invasive Species Specialist Group (2015). The global invasive species database. /. Version 2015.1.
36
Kelly N. E. Wantola K. Weisz E. Yan N. D. (2013). Recreational boats as a vector of secondary spread for aquatic invasive species and native crustacean zooplankton. Biol. Inv.15 (3), 509–519. doi: 10.1007/s10530-012-0303-0
37
King A. C. Krieg R. Weston A. Zenker A. K. (2022). Using eDNA to simultaneously detect the distribution of native and invasive crayfish within an entire country. J. Environ. Manage.302, 113929. doi: 10.1007/s10530-012-0303-0
38
Kraus R. Grilli F. Supić N. Janeković I. Brailo M. Cara M. et al . (2019). Oceanographic characteristics of the Adriatic Sea – support to secondary HAOP spread through natural dispersal. Mar. Poll. Bull.147, 59–85. doi: 10.1016/j.marpolbul.2018.10.062
39
Lee C. E . (2022). Evolutionary genetics of invasive species. Trends Ecol. Evol.17, 386–391.
40
Leray M. Yang J. Y. Meyer C. P. Mills S. C. Agudelo N. Ranwez V. et al . (2013). A new versatile primer set targeting a short fragment of the mitochondrial COI region for metabarcoding metazoan diversity: application for characterizing coral reef fish gut contents. Front. Zool.10, 34. doi: 10.1186/1742-9994-10-34
41
Lundholm N. Churro C. Fraga S. Hoppenrath M. Iwataki M. Larsen J. Mertens K. Moestru Ø. Zingone A. (2009) IOC-UNESCO taxonomic reference list of harmful micro algae. Available at: https://www.marinespecies.org/hab on 2022-04-09.
42
Madariaga D. J. Rivadeneira M. M. Tala F. Thiel M. (2014). Environmental tolerance of the two invasive species Ciona intestinalis and Codium fragile: their invasion potential along a temperate coast. Biol. Invasions16, 2507–2527.
43
Miralles L. Ardura A. Arias A. Borrell Y. J. Clusa L. Dopico E. et al . (2016). Barcodes of marine invertebrates from north Iberian ports: Native diversity and resistance to biological invasions. Mar. Poll. Bull.112 (1-2), 183–188. doi: 10.1016/j.marpolbul.2016.08.022ç
44
Petter A. J. Radujković B. M. (1989). Parasites of marine fishes from Montenegro: nematodes. Acta Adriatica30 (1-2), 195–236. doi: 10.13140/RG.2.1.2613.9600
45
Por F. D. (1978). Lessepsian migration: the influx of red Sea biota into the Mediterranean by way of the Suez canal Vol. 23. (New York: Springer-Verlag).
46
Pyšek P. Richardson D. M. (2010). Invasive species, environmental change and management, and health. Ann. Rev. Environ. Res.35 (1), 25–55. doi: 10.1146/annurev-environ-033009-095548
47
Rech S. Borrell Y. J. Garcia-Vazquez E. (2018). Anthropogenic marine litter composition in coastal areas may be a predictor of potentially invasive rafting fauna. PLoS One13 (1), e0191859. doi: 10.1371/journal.pone.0191859
48
Roberts C. M. (2002). Marine biodiversity hotspots and conservation priorities for tropical reefs. Science295, 1280–1284. doi: 10.1126/science.1067728
49
Sakai A. K. Allendorf F. W. Holt J. S. Lodge D. M. Molofsky J. With K. A et al (2001). The population biology of invasive species. Annu. Rev. Ecol. Evol.32, 305–332.
50
Sardain A. Sardain E. Leung B. (2019). Global forecasts of shipping traffic and biological invasions to 2050. Nat. Sustain.2, 274–282. doi: 10.1038/s41893-019-0245-y
51
Scott R. Zhan A. Brown E. A. Chain F. J. J. Cristescu M. E. Gras R. et al . (2018). Optimization and performance testing of a sequence processing pipeline applied to detection of nonindigenous species. Evol. Appl.11, 891–905. doi: 10.1111/eva.12604
52
Suter L. Polanowski A. M. Clarke L. J. Kitchener J. A. Deagle B. E. (2021). Capturing open ocean biodiversity: Comparing environmental DNA metabarcoding to the continuous plankton recorder. Mol. Ecol.30 (13), 3140–3157. doi: 10.1111/MEC.15587
53
Telesh I. V. Naumenko E. N. (2021). The impact of nuisance planktonic invaders on pelagic communities: a review of the Baltic Sea case studies. Protistology15 (4), 206–219. doi: 10.21685/1680-0826-2021-15-4-2
54
Telesh I. V. Schubert H. Skarlato S. O. (2016). Ecological niche partitioning of the invasive dinoflagellate Prorocentrum minimum and its native congeners in the Baltic Sea. Harm. Algae59, 100–111. doi: 10.1016/j.hal.2016.09.006
55
Uchii K. Doi H. Minamoto T. (2016). A novel environmental DNA approach to quantify the cryptic invasion of non-native genotypes. Mol. Ecol. Res.16 (2), 415–422. doi: 10.1111/1755-0998.12460
56
Von Ammon U. Wood S. A. Larocge O. Zaiko A. Tait L. Lavery S. et al . (2018). Combining morpho-taxonomy and metabarcoding enhances the detection of non-indigenous marine pests in biofouling communities. Sci. Rep.8, 16290. doi: 10.1038/s41598-018-34541-1
57
Weigand H. Beermann A. J. Čiampor F. Costa F. O. Csabai Z. Duarte S. et al . (2019). DNA Barcode reference libraries for the monitoring of aquatic biota in Europe: Gap-analysis and recommendations for future work. Sci. Total Environ.678, 499–524. doi: 10.1016/j.scitotenv.2019.04.247
58
Williamson M. Griffiths B. (1996). Biological invasions (Springer Science & Business Media).
59
Wood L. E. Silva T. A. M. Heal R. Kennerley A. Stebbing P. Fernand L. et al . (2021). Unaided dispersal risk of Magallana gigas into and around the UK: combining particle tracking modelling and environmental suitability scoring. Biol. Invasions23, 1719–1738. doi: 10.1007/s10530-021-02467-x
60
WoRMS Editorial Board (2022) World register of marine species. Available at: https://www.marinespecies.org (Accessed 2022-04-05). VLIZ.
61
Yildiz İ. Feyzioglu A. M. Besiktepe S. (2016). First observation and seasonal dynamics of the new invasive planktonic copepod oithona davisae Ferrari and orsi 1984 along the southern black Sea (Anatolian coast). J. Nat. History51 (3-4), 127–139. doi: 10.1080/00222933.2016.1229060
62
Youssef F. Tlig Zouari S. Benmansour B. (2019). New host–parasite records of siphonostomatoid copepods infesting elasmobranch fishes in Tunisian waters. J. Mar. Biol. Assoc. UK99 (4), 851–855. doi: 10.1017/S002531541800084X
Summary
Keywords
alien species, eDNA, Gulf of Aqaba, plankton, Red Sea, maritime ports
Citation
Fernandez S, Ardura A, Georges O, Martinez JL, Suarez-Menendez M, Planes S and Garcia-Vazquez E (2022) Non-native species in the north Gulf of Aqaba (Red Sea) revealed from environmental DNA. Front. Mar. Sci. 9:940889. doi: 10.3389/fmars.2022.940889
Received
10 May 2022
Accepted
23 November 2022
Published
14 December 2022
Volume
9 - 2022
Edited by
Khaled Mohammed-Geba, University of Maryland, United States
Reviewed by
Hicham Chairi, Abdelmalek Essaadi University, Morocco; Ryan McDonald, United States Food and Drug Administration, United States
Updates
Copyright
© 2022 Fernandez, Ardura, Georges, Martinez, Suarez-Menendez, Planes and Garcia-Vazquez.
This is an open-access article distributed under the terms of the Creative Commons Attribution License (CC BY). The use, distribution or reproduction in other forums is permitted, provided the original author(s) and the copyright owner(s) are credited and that the original publication in this journal is cited, in accordance with accepted academic practice. No use, distribution or reproduction is permitted which does not comply with these terms.
*Correspondence: Eva Garcia-Vazquez, egv@uniovi.es
†These authors share first authorship
This article was submitted to Marine Evolutionary Biology, Biogeography and Species Diversity, a section of the journal Frontiers in Marine Science
Disclaimer
All claims expressed in this article are solely those of the authors and do not necessarily represent those of their affiliated organizations, or those of the publisher, the editors and the reviewers. Any product that may be evaluated in this article or claim that may be made by its manufacturer is not guaranteed or endorsed by the publisher.