Abstract
Microplastics (MPs) are ubiquitous contaminants in the ocean. Zooplankton is thus widely exposed to MP ingestion. Here, we use a global coupled physical–biogeochemical model enriched with a 3D representation of MPs to assess the global zooplankton exposure to MPs. As expected, our results indicate that water MP concentration is the highest in the surface layers of subtropical gyres and coastal areas close to major MP sources, which is mostly due to floating MPs, while neutral MPs contaminate the mesopelagic zone. Additionally, we showed that floating MPs may be also transported to the mesopelagic waters during the seasonal deepening of the mixed layer depth. We then estimate zooplankton exposure to MPs based on water MP concentrations, plankton biomass, and zooplankton grazing rate. Two main drivers lead to high zooplankton exposure to MPs: 1) high water MP contamination and 2) intense grazing activity. Seasonally, re-stratification of surface waters may lead to MP vertical concentration coinciding with planktonic blooms, thus increasing contamination risk.
1 Introduction
Microplastic particles have been discovered in every ocean region, from the surface to the deepest trenches (Auta et al., 2017). This contamination is rather recent since plastic material has been widely produced and used since the 1950s (Crawford and Quinn, 2017). However, plastic contamination of the ocean may have begun as early as the 1960s (Carpenter and Smith, 1972; Thompson et al., 2004). Because of the rising rates of global plastic production, ocean contamination may follow an increasing trend (Hamid et al., 2018). The rise in oceanic contamination by these small (<5 mm and sometimes down to the micro- to nanometer scale; Ter Halle et al., 2017) anthropogenic debris may lead to widespread contamination of the oceanic food webs. Indeed, food-web contamination by MPs has been evidenced in fish and other high trophic levels (e.g., Neves et al., 2015). Recent studies have found MPs in wild-caught and commercial fish stomachs and guts (Jabeen et al., 2017; Baalkhuyur et al., 2018; Halstead et al., 2018), hinting toward large-scale MP contamination of the oceanic food web caused by direct MP ingestion (Roch et al., 2020), consumption of contaminated prey (Setälä et al., 2014; Nelms et al., 2018; Zhang et al., 2019), or MP entanglements (Setälä et al., 2018; Zhang et al., 2019). Food-web contamination may begin with MP ingestion by zooplankton, which is the primary consumer, and constitute the lowest heterotrophic trophic level of many ecosystems (e.g., Cole et al., 2013; Amélineau et al., 2016). Zooplankton contamination by MPs may also lead to several biological consequences such as decreased growth, reproduction, or larval survival rate (Cole et al., 2019). Because of their key position at the interface between primary producers and higher trophic levels (Richardson, 2008), the deleterious effects of MPs on zooplankton may impact entire marine ecosystems. Nevertheless, studies of in situ MP contamination remain insufficient to understand the extent of the zooplankton contamination and to identify high-risk areas on a global scale (Phuong et al., 2016).
To date, estimates of the global yearly MP inputs into the ocean vary from several thousand to a few million tons (Lebreton et al., 2017; Schmidt et al., 2017; van Wijnen et al., 2019; Weiss et al., 2021). The fate of floating MPs upon entering the surface ocean has been studied using Lagrangian models (Maximenko et al., 2012; Sebille et al., 2015), and results showed that they mostly accumulate in the subtropical gyres and along the coasts (Chenillat et al., 2021). However, severe gaps between the estimated global MP inputs to the ocean and the surface budgets have been diagnosed, hinting toward a global sink for MPs (Woodall et al., 2014; Sebille et al., 2015), which may be influenced by several mechanisms such as the physical characteristics of MPs (e.g., density), their interaction with natural particles (e.g., biofouling or heteroaggregation), or ingestion by marine biota. There is an increasing number of measurements of MP concentrations at the ocean surface (e.g., Law et al., 2014; Suaria and Aliani, 2014; Ter Halle et al., 2017; Tirelli et al., 2020), demonstrating that MPs are ubiquitous in the ocean albeit spatial gradients. In spite of a recent effort to synthesize available measurements of surface MPs (Isobe et al., 2021), no standard protocol is widely applied, which strongly reduces the pertinence of comparing observations between different studies (Galgani et al., 2021). Finally, measuring MPs below the surface is challenging, and there are very few MP vertical profiles (e.g., Choy et al., 2019; Egger et al., 2020; Pabortsava and Lampitt, 2020), thus limiting the current understanding of 3D MP distribution in the ocean.
In this context, global 3D models of ocean circulation and biogeochemistry are useful tools for representing the global distribution of pollutants and plankton as well as for identifying areas of co-occurrence (Auger et al., 2015; Alekseenko et al., 2018; Richon and Tagliabue, 2019). Identifying the regions with a higher risk of zooplankton contamination by MPs requires a sensible representation of the global 3D distribution of MPs in the different layers of the ocean.
In this study, we included tracers that represent the global MP distribution in the Eulerian coupled physics–biogeochemistry model NEMO/PISCES (Aumont et al., 2015) using updated estimates of global MP inputs to the ocean (Lebreton et al., 2017). We represent MPs as biogeochemical tracers in PISCES (thus contrasting with the previous Eulerian approach by Mountford and Morales Maqueda, 2019, using the physical model NEMO/LIM3). This original approach allows estimating the exposure of zooplankton to MP ingestion based on the identification of three factors: 1) MP concentrations, 2) zooplankton prey concentration, and 3) local grazing rates. Finally, we explore the seasonal variability in zooplankton exposure to MP ingestion. Our article, which provides one of the first 3D simulations of MP distribution and seasonality on a global scale, highlights the subsequent potential exposure of zooplankton to MP ingestion.
2 Methods
2.1 The NEMO/PISCES-PLASTIC model
We used the NEMO/PISCES 3D coupled physical–biogeochemical modeling platform. The physical component of the model (NEMO, Madec, 2008) has a horizontal resolution of 2° (≈200 km) with 31 vertical levels (10 levels in the first 100 m) and 6-h time steps. We used a climatological year for climate forcing (i.e., wind, currents, temperature, salinity, and freshwater fluxes) similarly to Richon and Tagliabue (2019); Richon et al. (2020), and Tagliabue et al. (2018).
The physical model is coupled to a biogeochemical model, PISCES (Aumont et al., 2015), that represents the uptake and cycling of five major nutrients (NO3, NH4, PO4, Si, and Fe) by phytoplankton of two functional types (nanophytoplankton and diatoms) and zooplankton separated into two size classes (micro- and mesozooplankton). The model also represents two compartments of organic particles (small and big particles) produced during plankton degradation. Zooplankton has two feeding modes: active predation and passive flux feeding (only for mesozooplankton). Zooplankton grazing and all model equations are fully described in Aumont et al. (2015). Gorgues et al. (2019) and Aumont et al. (2015); Aumont et al. (2018) provided evaluations of the zooplankton distribution in PISCES.
Three compartments of MPs were added to PISCES as passive tracers (i.e., not interacting with other biogeochemical tracers) to develop a configuration named “PISCES-PLASTIC”. Floating MPs represent polymers (such as polypropylene and high- and low-density polyethylene) that have a negative (upward) sinking speed (set to −64 m·day−1). Sinking MPs represent polyvinyl chloride, polyurethane, polyethylene terephthalate, and polystyrene, which have a positive (downward) sinking speed fixed at 90 m·day−1. Neutral MPs have a sinking speed set to 0 and are considered neutrally buoyant particles displaced by the ocean dynamics only. The vertical velocities of the MP particle set in the model have been chosen in agreement with the average vertical velocities of the different polymers used in Mountford and Morales Maqueda (2019). The proportions of floating, neutral, and sinking MPs are fixed and set, following Mountford and Maqueda (2021), to respectively 49.1%, 19%, and 31.9%, of the global MP inputs, which follows the relative proportions of the global industrial demands for each MP type (Plastics Europe, 2017).
2.2 Sources and sinks of microplastics
Widely used global monthly estimates of riverine MP inputs from Lebreton et al. (2017) (in tons·year−1) were utilized as the only source of MPs in our model. According to these estimations, the maximum MP fluxes come from the Southeast Asian and Indian rivers. All inputs have a climatological seasonal variability that follows that of freshwater fluxes. Globally, the highest MP inputs occur between June and September (over 200 kt·month−1, see Lebreton et al., 2017, for details), which corresponds to the highest freshwater fluxes due to the monsoon. These fluxes lead to a global release of 1.4 Mt of MPs to the surface ocean each year and are repeated every year during our simulation. Bearing in mind our study’s scope and given the uncertainties related to MP sinks, no beaching or sediment burial has been considered in this study. Finally, MPs are considered passive tracers in PISCES-PLASTIC and have no interaction with plankton, particles, or nutrients. In PISCES-PLASTIC, MP units are in mgMP·m−3. These mass units were chosen to keep consistency with plankton units (in mgC·m−3).
2.3 Calculating zooplankton exposure to microplastics
Exposure of zooplankton to MP ingestion is calculated with the following Equation (1):
with as the normalized grazing rate between 0 and 1. [MP] is the mass concentration of microplastic; Σ[Pi]×pi is the sum of zooplankton prey biomass (Pi,which may be nanophytoplankton, diatoms, microzooplankton, or particles) multiplied by zooplankton preference for each prey (pi, see Aumont et al., 2015, for values). Thus, the ratio is defined as the “seawater MP contamination” and is dimensionless. Exposure is a dimensionless term characterizing the risk for zooplankton to ingest MPs instead of prey.
2.4 Simulations
The model (without MP) has been spun-up for 1,000 years with climatological forcings in order to equilibrate the biogeochemical tracers in all depth layers. Then, we simulated MP contamination of the ocean by adding the global riverine MP fluxes from Lebreton et al. (2017). We ran the model for 50 years with constant MP inputs. Each year, we compared MP concentrations in the model with available in situ measurements in the pelagic zone from Pabortsava and Lampitt (2020). Given the integrative nature of the MP contamination, we selected the year that maximized the correlation between model and data, which corresponds to the 25th year of simulation. In our results, we present the monthly and yearly averages of the biogeochemical tracers.
2.5 Data selection for model comparison
In parallel to the model development, we worked on gathering in situ data for comparing model outputs in an effort to provide global estimates of 3D MP contamination as realistically as possible.
In order to make the comparison between model results and in situ measurements possible, it was necessary to report some information both in models and in situ data:
-
• Spatial coordinates (longitude and latitude) and depth.
-
• Sampling of fibers and quality control to avoid fiber contamination.
-
• Mesh size and/or bottle capacity and MP size fractions.
-
• Additional information on sea/wind conditions during sampling may be useful (see Reisser et al., 2015, for the influence of wind and sea conditions on vertical MP distribution).
In addition, our model represents mass concentrations of MPs. Therefore, we compared our model to measurements of mass MP concentration, without conversion between the number of particles and mass. Comparison between [MP] measurements in coastal areas with our model results is difficult because of the low spatial resolution of the model. Therefore, we focused our data research on the open ocean. We illustrate the model-data comparison with a study from Pabortsava and Lampitt (2020), which presents an Atlantic transect of 11 stations and 34 data points. We present in Figure 1 the comparison of modeled and measured [MP] as an illustration of its purpose and a call for concerted efforts between modelers and experimentalists to build a global database of ocean MP contamination.
Figure 1
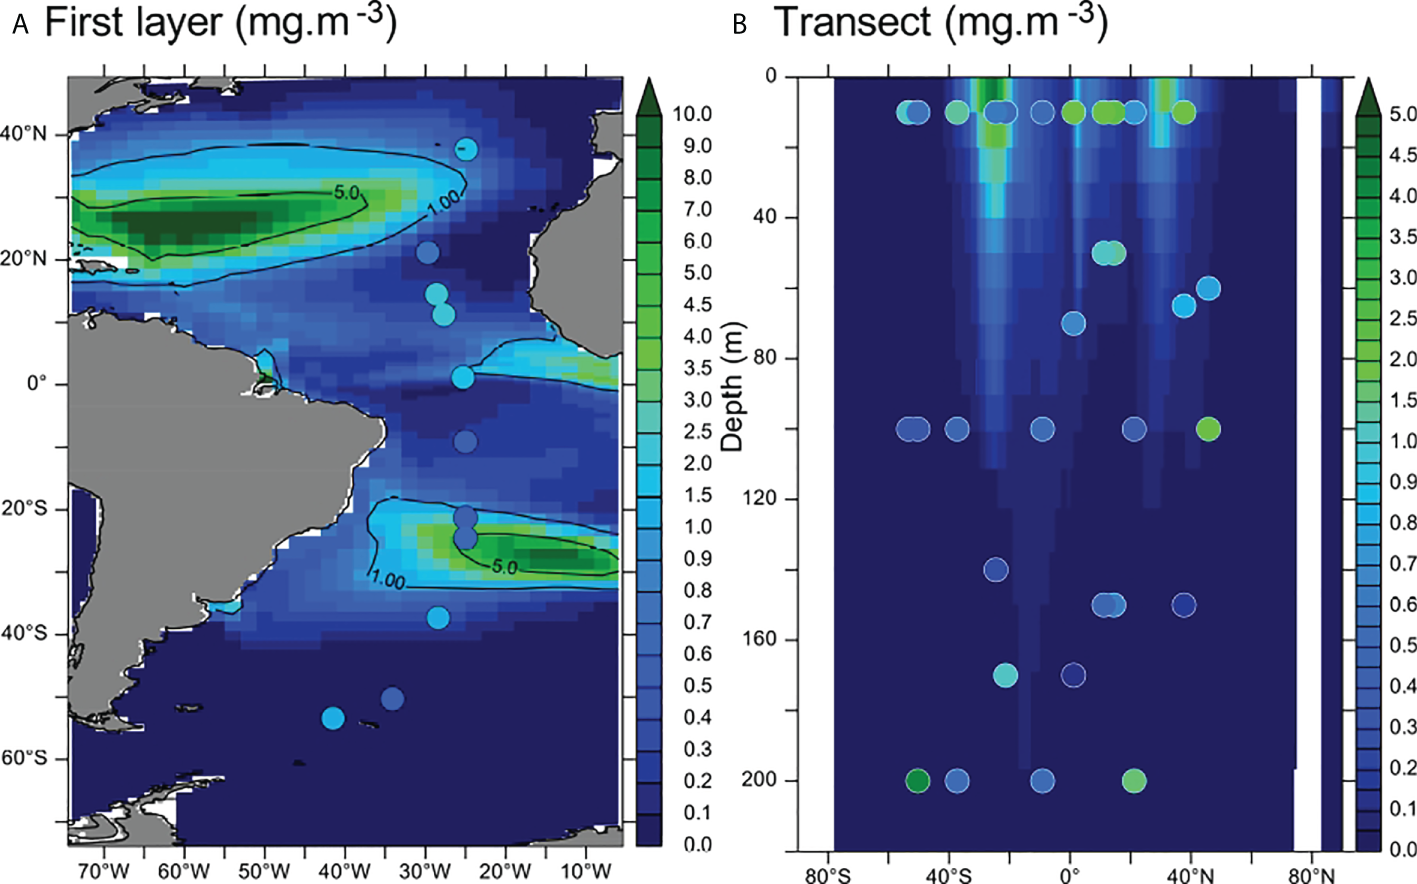
(A) Comparison of modeled total [MP] (background colors) with in situ measurements from Pabortsava and Lampitt (2020) (dots) in the first layer (0–10 m, mgMP·m−3). (B) Modeled MP concentrations (background, mg·m−3) and measured concentrations (dots) along the vertical transect. The modeled concentrations reported on panel (B) (background) are averaged between 30°W and 20°W. Contour lines indicate 1 and 5 mgMP·m−3 levels.
3. Results
3.1 Global three-dimensional distribution of microplastic
Microplastic concentrations measured across the Atlantic Ocean (60°N–50°S) in the first 200 m are between 0.12 and 4.13 mg·m−3 (Figure 1 and Pabortsava and Lampitt, 2020). Measured and modeled MP concentrations in the first layer of the model (first 10 m) are in the same order of magnitude (Figure 1A). Vertically, there is a steep MP gradient below the surface with a 10-fold decrease in MPs from the top of the water column to about 100-m depth (Figure 1B). This gradient is steeper in the model than in the measurements. Indeed, modeled concentrations below 100 m are systematically lower than 0.5 mg·m−3, where few data points show concentrations of approximately 1 mg·m−3. However, there are very few measurements below the first 100 m (only nine measurement points). Thus, the vertical distribution drawn from these measurements may not be representative of the global vertical distribution of MPs. The modeled vertical [MP] gradient is smoother in the convergence zones (approximately 30°N and 30°S, Figure 1B) where the downward vertical currents may transport MPs below the surface. The MP concentrations around the intertropical convergence zone (ITCZ) are satisfyingly reproduced by the model (Figure 1B), thus confirming that convergence zones constitute hot spots for MP accumulation.
Figure 2
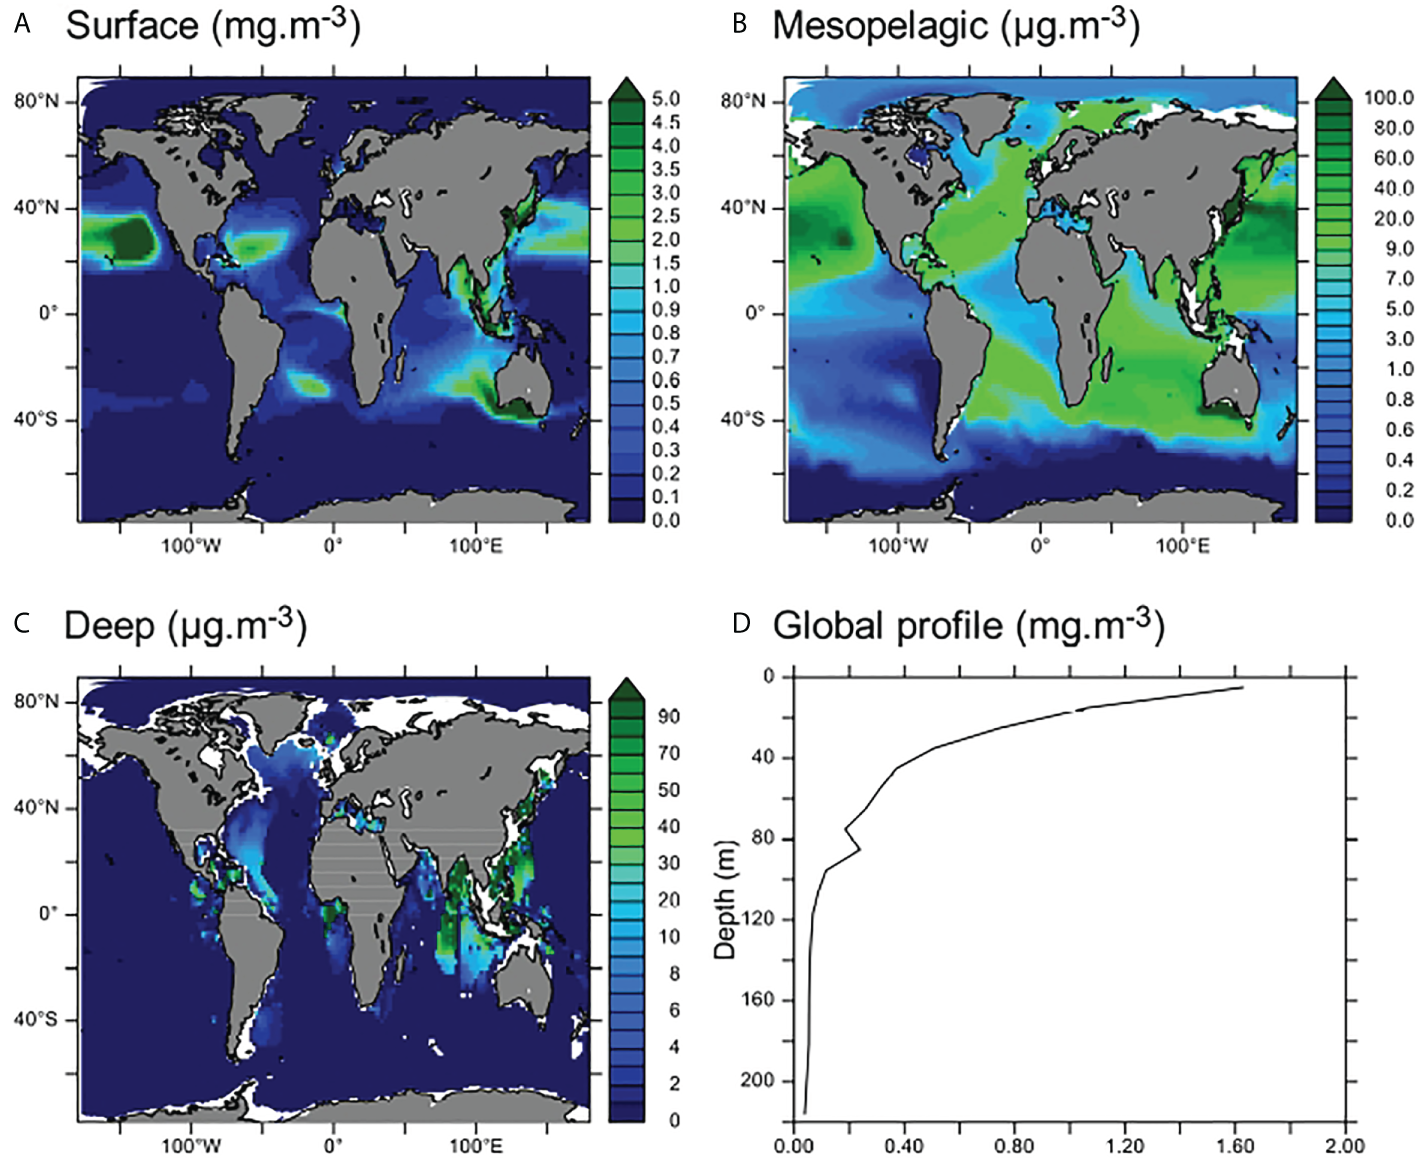
Global distribution of MPs. (A–C) Average MP concentrations in surface (0–100 m, A), mesopelagic (100–1,000 m, B), and deep (>1,000 m, C) ocean layers (note the different scales shown in panels B, C). (D) Global average vertical profile of [MP] (mg·m−3).
Moreover, MP distribution in the first layer of the model (0–10 m) compares well with previous modeling studies (concentrations found in our results are in the same order of magnitude as Maximenko et al., 2019, see Figure S1). Accumulation zones of MPs on the surface are the subtropics (approximately 30°N and 30°S) and the equatorial regions such as the Gulf of Guinea (Figure 2A). These accumulation zones were also found by Mountford and Morales Maqueda (2019) with the same physical model (NEMO) and by Maximenko et al. (2019) using Lagrangian frameworks. Spatial gradients in [MP] are more intense in Lagrangian models (Figure 5 in Maximenko et al., 2019), which may be due to the higher spatial resolution of these models, allowing to reproduce submesoscale processes. However, the order of magnitude of our modeled concentrations presented in Figure S1 is coherent with the global dataset presented in Maximenko et al. (2019), thus lending credibility to our modeling approach.
Maximum MP concentrations are found on the surface of subtropical gyres and along the coasts of Southeast Asia and in the Bay of Bengal, where modeled MP concentrations may reach over 10 mg·m−3 (Figure 2A). Between 100 and 1,000 m, the average MP concentration is an order of magnitude lower (between 0.5 and 100 μg·m−3) across the entire ocean, with the exception of the South Pacific upwelling region and the Southern Ocean, where almost no MPs are found (Figures 2B and S2b). In the deeper parts of the ocean, MP accumulation zones are spatially restrained close to the western Pacific and Indian coasts (over 70 kt of MPs accumulated in these zones in the model, and concentrations over 100 μg·m−3 are observed and may even exceed 1 mg·m−3, Figures 2C and S2). There is also some accumulation of MPs in the eastern North Atlantic, along the coast and below the gyre. Almost no MPs are found in the deep ocean outside of the accumulation zones as identified in Figure 2C.
In the model, 35 Mt of MPs was delivered to the global ocean after 25 years of constant riverine contamination. Of these, about 55% (20 Mt) are found in the surface layer (0–100 m), 14% in the mesopelagic layer (100–1,000 m), and 31% in the deep ocean (Figures 3 and S2). The proportion of MPs in the deep ocean reflects the input proportion of sinking MPs (31.9%). In the surface layer, mostly floating MPs accumulate (Figure S3). The MPs in the mesopelagic are mostly neutral MPs, transported by currents from coastal regions and the gyres (Figure S3). Neutral MPs only constitute 19.1% of the global MP input in our simulations but are found in almost every ocean region because they are easily dispersed by ocean currents (see also Huck et al., 2022), contrary to sinking MPs that rapidly evade the surface close to the sources and to floating MPs that are transported by surface currents and trapped in subtropical gyres and convergence zones. However, the proportions of MPs found in the surface and mesopelagic do not reflect input proportions of floating and neutral MPs, indicating that some redistribution processes occur between these layers. Globally, the Pacific and Indian oceans receive the most important fluxes of MPs from land (Lebreton et al., 2017) and accumulate most of the global MP budget (47% and 33% of the modeled global budget respectively, Figure 3). Despite documented contamination (Kanhai et al., 2018; Bergmann et al., 2022), the polar regions that are far from the major MP sources have the lowest MP concentrations (only 1% and 6% of the global MP budget are respectively found in the Arctic and Southern Oceans, Figures 2 and 3). Moreover, most of the MPs in the polar regions are found in the surface layer, and our results indicate that over 80% of these MPs are floating MPs (Figure S3). The lower budgets of MPs in the deeper parts of the polar regions compared to other deep regions may be explained by the distance from the sources that bring less sinking MPs to these remote regions. Therefore, most of the MPs in these regions are brought by lateral surface currents that transport floating and neutral MPs (because sinking MPs rapidly reach the bottom waters and undergo very slow lateral transport). Finally, most of the MPs found in the deep part of the Southern Ocean and the Arctic are neutral MPs (Figure S3) probably brought by the strong vertical currents that lead to deep water formation in these regions.
Figure 3
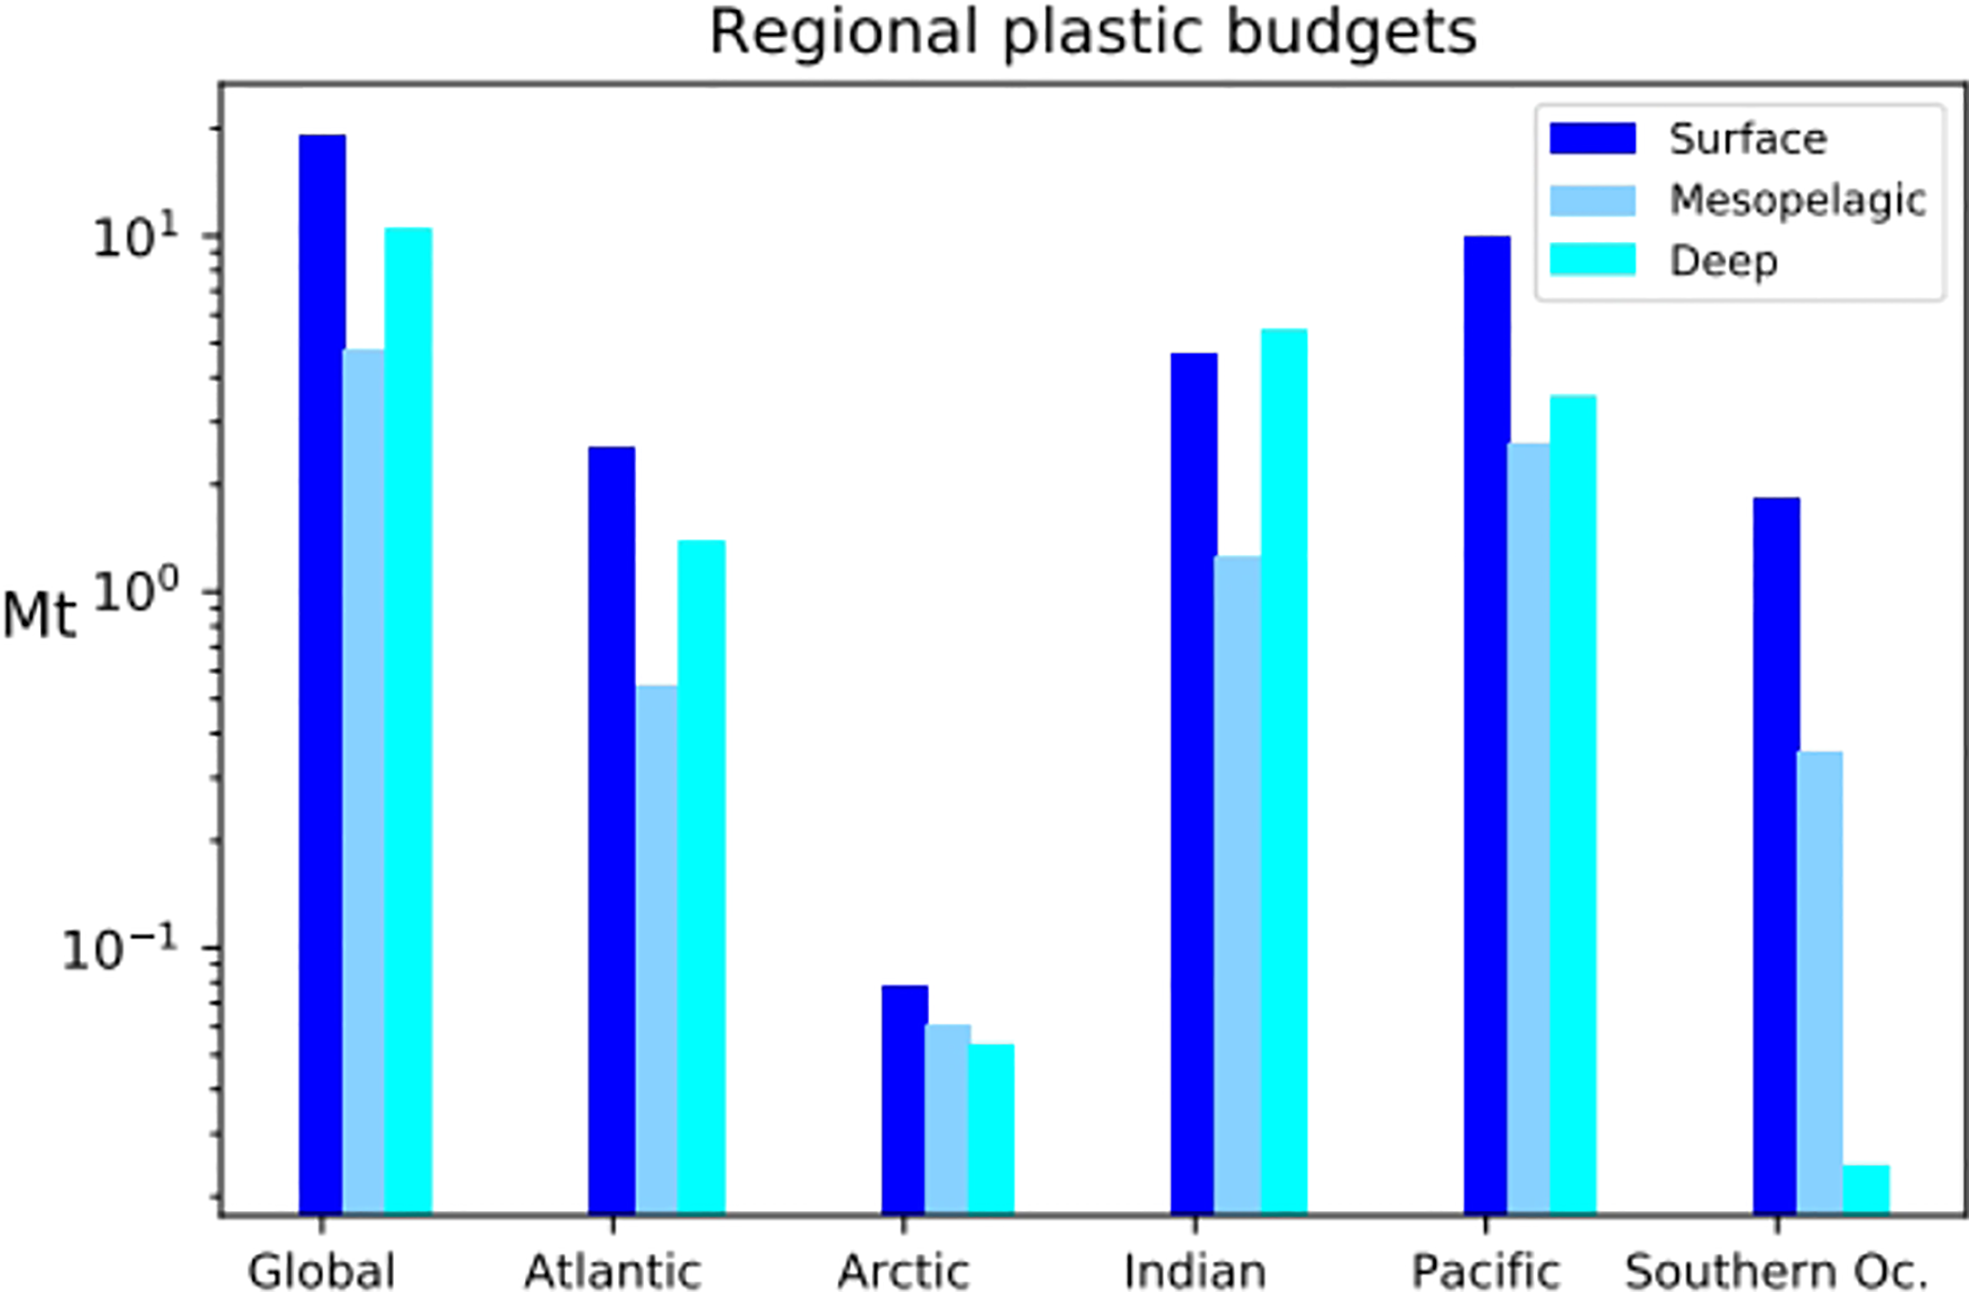
Plot of the MP budget (in Mt) in each ocean on the surface (0–100 m), mesopelagic (100–1,000 m), and deep (>1,000 m) layers.
Overall, our modeled distribution of MPs in the first 100 m of the ocean is consistent with the current understanding of global MP distribution (see Lebreton et al., 2012; Maximenko et al., 2012; Cózar et al., 2014; Sebille et al., 2015; Isobe et al., 2021). The deeper parts of the ocean, especially the regions close to the major sources, are described as accumulation zones of MPs (e.g., Peng et al., 2018), which is reproduced in our results. Finally, our simulation indicates that the mesopelagic area can be seen as a transition zone with lower MP concentrations. However, there are much fewer measurements in this layer, thus leading to high uncertainties in the MP concentrations.
3.2 Seasonal variability of microplastic budgets
On the ocean surface, the greatest seasonal variability in [MP] occurs in the low latitudes and along the coasts close to the major MP sources (Figure 4A). For instance, [MP] seasonal standard deviation exceeds 25% of the annually averaged surface [MP] in the equatorial Atlantic, the coastal areas of Asia, India, and Australia, and over 50% around Indonesia and in the frontal zone of the Southern Ocean approximately 50°S (see cyan contours on Figure 2A). The seasonal variability in coastal areas may reflect that of the sources, such as the North Indian Ocean and around the Gulf of Guinea. Around the subtropical gyres of the North Pacific and North Atlantic, we observe that the maximum horizontal gradients of [MP] spatially coincide with the contours of the convergence zones (Figure 4 and Beghoura et al., 2019; van Sebille et al., 2020). Figure 4A shows that seasonal variability in these frontal regions may significantly impact the surface [MP]. In the Equatorial Atlantic around the Gulf of Guinea, the high variability in [MP] may result from the combination of seasonal variability in MP inputs and that of tropical instability waves that lead to surface current variability (Menkes et al., 2002; Berger et al., 2014). Finally, in deep water formation zones such as the polar fronts (i.e., in the Labrador Sea and approximately 60°N and S), the strong vertical currents may transport MPs downward, explaining the high seasonal variability in surface [MP].
Figure 4
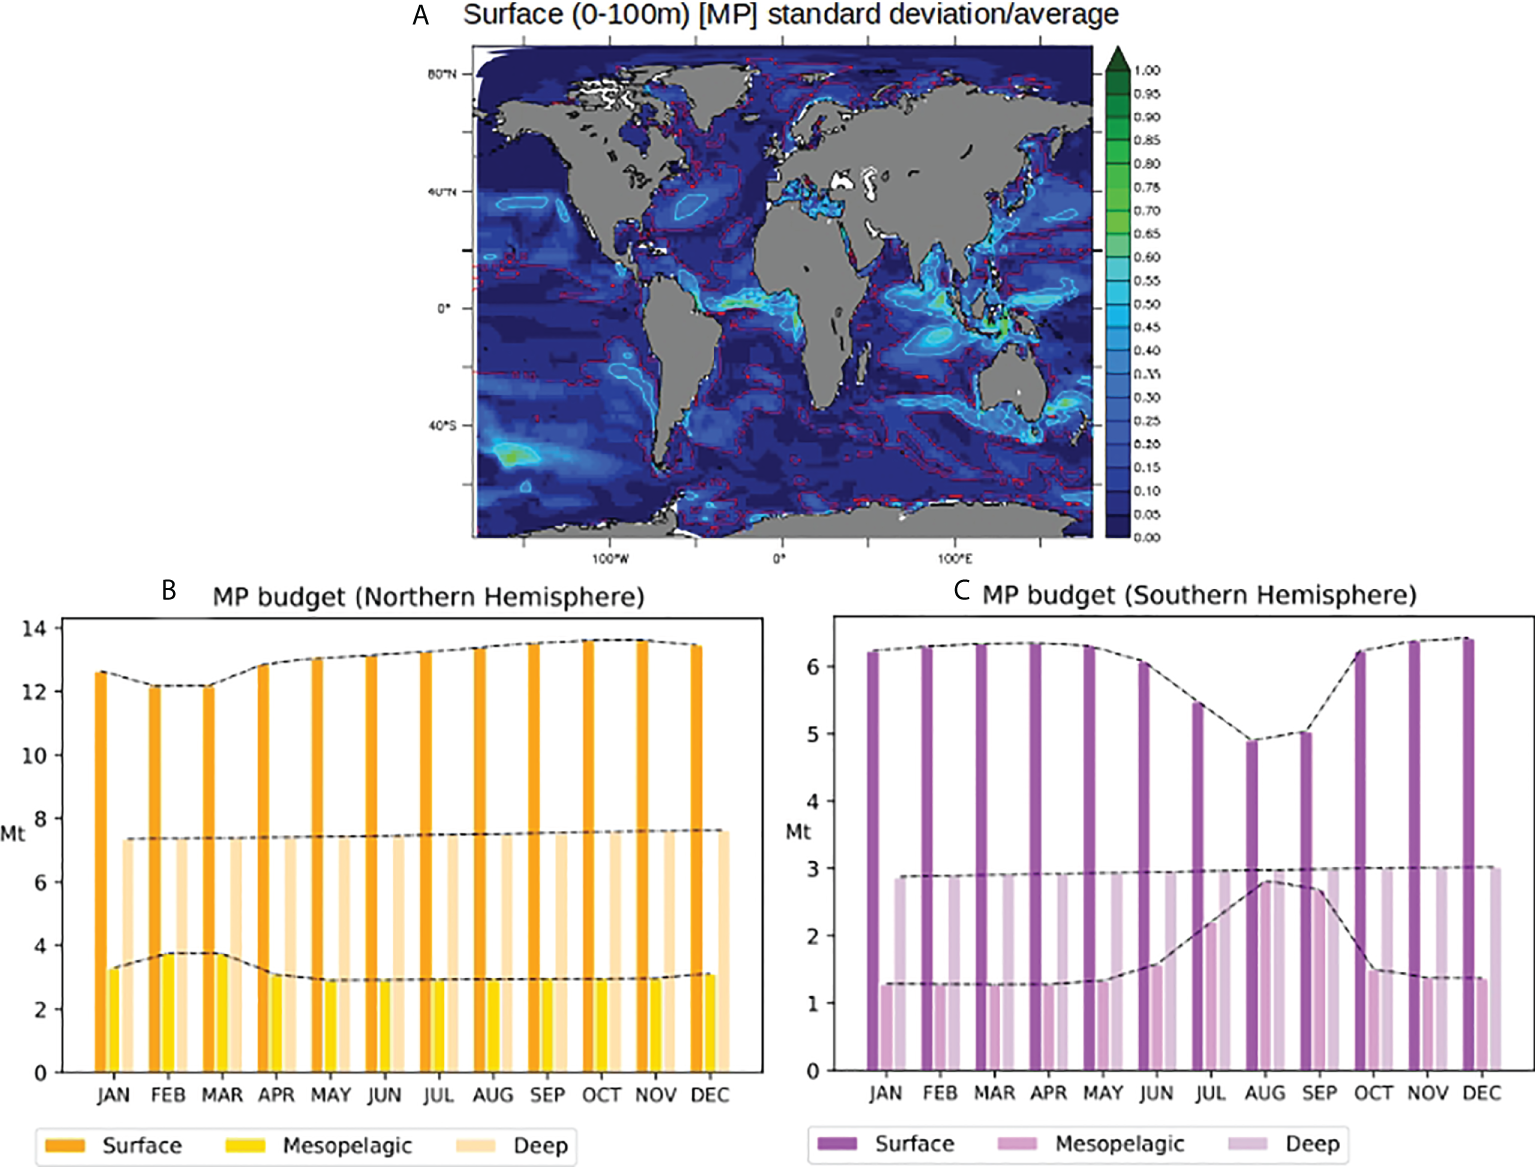
(A) Surface (0–100 m) monthly standard deviation of [MP] weighted by average yearly [MP]; red contours represent areas where std is over 10% of annual average [MP], and cyan contours where std is over 25% of annual average [MP]. (B, C) Global MP monthly budget in the surface (0–100 m), mesopelagic (100–1,000 m), and deep (>1,000 m) ocean layers (in Mt) in the Northern Hemisphere (B) and Southern Hemisphere (C). Dashed lines on panels (B, C) highlight the global monthly#MP budget in each layer.
The total surface MP budget varies between 12 and 13 Mt for the Northern hemisphere and between 4.5 and 6.5 Mt for the Southern hemisphere (Figures 4B, C). The mesopelagic budget varies between 4 and 5 Mt globally (2 to 4 Mt and 1 to 3 Mt in the Northern and Southern hemispheres, respectively). In the deep layer, the MP budget is almost constant at approximately 10 Mt (respectively, 7 and 3 Mt in the Northern and Southern hemispheres) for the year presented. About 2/3 of the global MP budget in all layers is located in the northern hemisphere.
To illustrate the seasonal exchange between the surface and mesopelagic layers, we focused on the Southern Ocean as an example of highly dynamical regions, mostly found at high latitudes, with strong seasonal vertical variations of ocean dynamics (e.g., Sallée et al., 2021). There is a strong seasonal variability in the MP budgets of the surface and the mesopelagic layers (Figure 5A). However, almost no seasonal variability is detected in the MP budget of the deep waters of the Southern Ocean. The opposite trends in monthly surface and mesopelagic MP budgets reported in Figure 5B illustrate the seasonal vertical exchange of MPs between the surface and the mesopelagic layers in the Southern Ocean. The maximum surface MP budgets occur during the season of the lowest vertical mixing (i.e., austral summer, between October and December, see the highest budget in Figure 5A and high positive trend in Figure 5B). This indicates a seasonal vertical concentration of MPs, mostly due to floating MPs brought back to the surface after downwelling to the mesopelagic during intense winter vertical mixing. The trend in deep MP budgets in the Southern Ocean is close to 0, thus confirming the absence of seasonal variability of the global deep MP budget in this region.
Figure 5
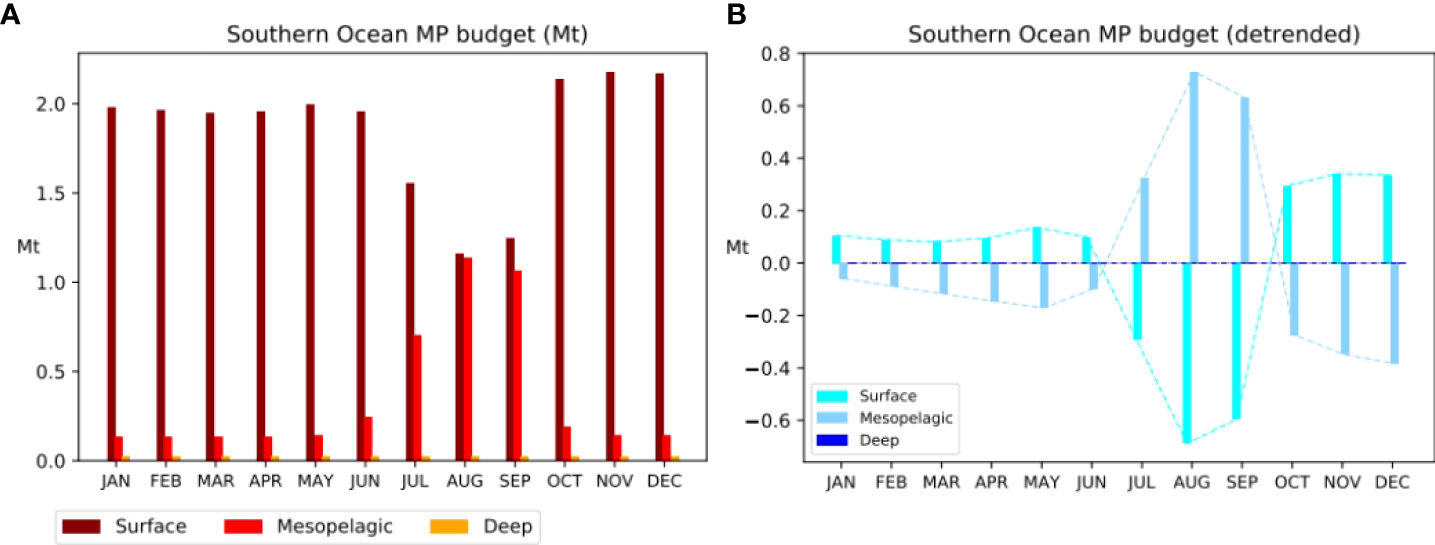
(A) Monthly MP budgets (Mt) in each layer of the Southern Ocean. (B) Detrended monthly MP budgets (Mt) in each layer of the Southern Ocean.
Results from Figures 4 and 5 indicate a low seasonal variability in deep ocean MP budgets, which confirms that the supply of MPs to the deep ocean through vertical mixing is weak and that most deep MPs come from the continued supply of sinking MPs from the coasts.
3.3 Quantifying the food chain contamination risk through microplastic ingestion by zooplankton
3.3.1 Identifying the regions of largest microplastic exposure
The exposure of zooplankton to MP ingestion is defined in this study as the probability for zooplankton to ingest MP particles during grazing. We calculate zooplankton exposure as the product of seawater MP contamination (([MP]/(Σ[Pi]×pi)) ratio, see Figure 6 and Equation 1) and normalized zooplankton grazing rate similarly to Roch et al. (2020). Because we do not explicitly represent prey contamination by MPs (no interaction between MPs and phytoplankton or particles is considered in the model), our results do not allow us to differentiate between exposure through direct MP ingestion and ingestion of contaminated prey (e.g., MPs adsorbed to particles or phytoplankton). However, the explicit description in PISCES of two feeding modes of zooplankton (see Aumont et al., 2015, for equations) allows to consider two modes of zooplankton exposure. The first one is active predation on microzooplankton, phytoplankton, and small organic particles. The second one is detritivory (i.e., passive filter feeding on small and large organic particles). Model results show that zooplankton exposure to MPs occurs almost exclusively from active grazing (see Figure S4).
Figure 6
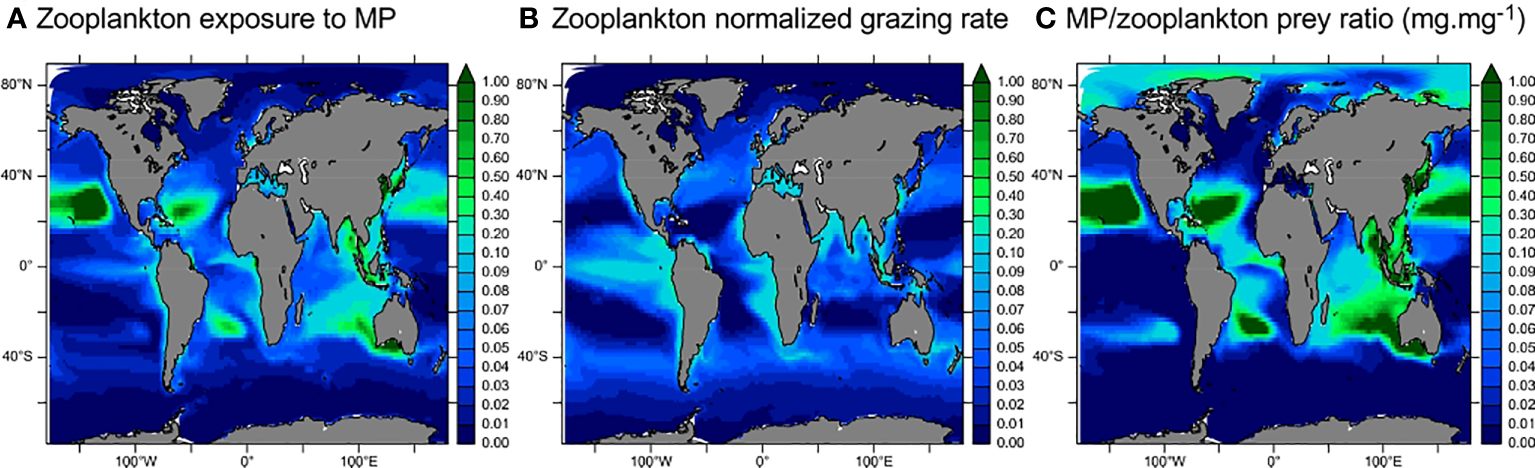
Maps of zooplankton exposure to MP ingestion and its driving factors (averaged in the first 100 m). (A) Zooplankton exposure to MP ingestion (unitless, see Methods). (B) Modelled normalized zooplankton grazing. (C) Modeled MP/prey ratio (as per Equation 1).
Zooplankton exposure to MP ingestion is maximal in the subtropical gyres and along the coasts (Figure 6A). The high exposure in the subtropical gyres is due to the high MP/prey ratio (also found by Moore et al., 2001, in the North Pacific gyre). In the upwelling, coastal, and generally all productive regions of the ocean, the intense grazing pressure leads to non-negligible zooplankton exposure to MP ingestion (i.e., over 0.1). Even in low [MP] waters such as the Eastern Tropical Pacific upwelling region, high grazing activity by zooplankton increases the exposure to MPs. Results from Figure 6 suggest two mechanisms for zooplankton exposure to MPs: 1) in the subtropical oligotrophic gyres, zooplankton grazing activity is very low, but water contamination by MPs (MP/prey ratio) is very high (>1 mgMP/mgPrey, Figure 6C). Therefore, zooplankton is strongly exposed to MP ingestion, even when grazing is low. 2) In productive regions such as the Southern Ocean or the eastern tropical Pacific, however, the limited water contamination (low MP/prey ratio) leads to a low probability of MP encounter, but the intensity of grazing multiplies ingestion probability by zooplankton, thus leading to non-negligible MP exposure (Figure 6A,B). Finally, in the coastal zone of Southeast Asia and the Bay of Bengal, there is high water contamination ([MP] up to several mg·m−3, Figure 2) leading to a high MP/prey ratio and high zooplankton grazing (Figure 6B), making these areas the most at-risk for zooplankton contamination by MPs.
3.3.2 Seasonal variability in food-web exposure to microplastics
Zooplankton exposure to MP ingestion varies spatially with MP concentrations and grazing activity (Figure 6), but both factors also undergo seasonal variations. Therefore, a phasing between the seasonal cycles of surface [MP] and grazing activity may periodically increase zooplankton exposure to MP ingestion.
There is significant seasonal variability in surface [MP] in about 35% of the ocean surface (Figure 4). The timing of seasonal maximum in MP concentration is reported in Figure 7 and shows seasonal patterns only weakly related to latitudes or circulation features. The noisy distribution of surface MP concentrations at seasonal maximum may be due to the influence of floating MPs. If all MPs were neutral, the seasonality of surface [MP] would reflect that of surface ocean dynamics. However, almost half of the total MP inputs are floating MPs with an upward vertical velocity. As a consequence, these particles tend to persist on the surface when the vertical downward currents remain comparatively weak. On the contrary, if those downward vertical currents or mixing are strong enough (e.g., during winter), floating MPs may be transported to the mesopelagic domain as shown in Figures 4 and S3. The timing of the seasonal surface maximum [MP] is therefore influenced by both mixing and floating MP rising velocity since these factors will determine the time that floating MPs will take to rise back to the surface after re-stratification.
Figure 7
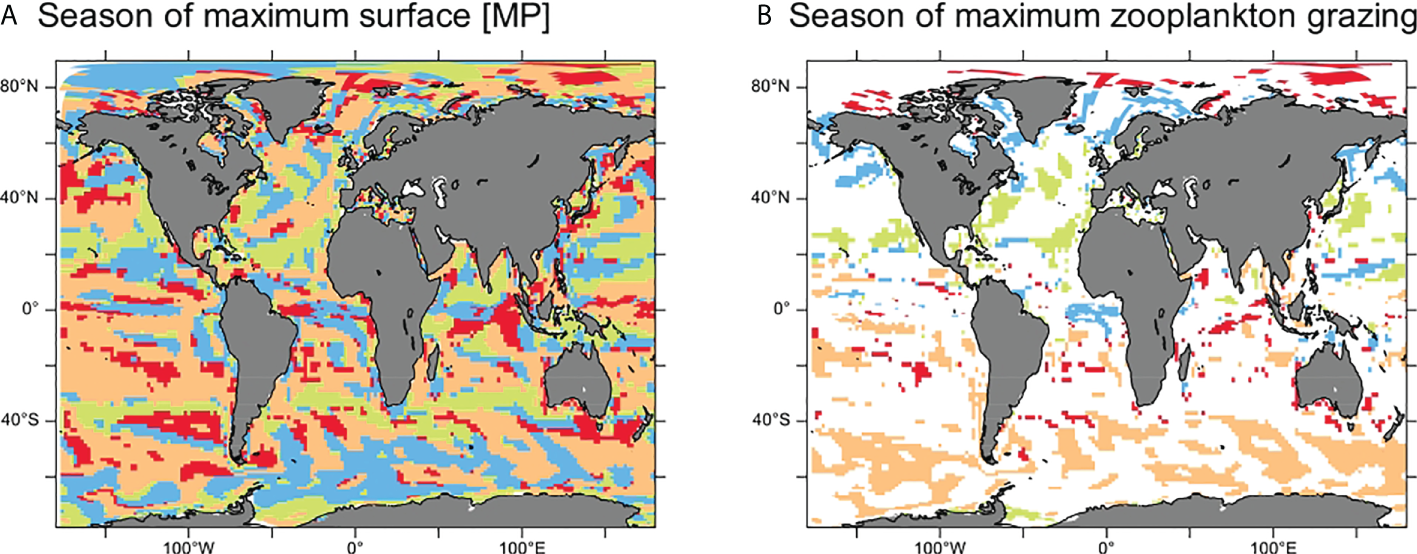
Maps identifying the timing of seasonal maximum in surface (0–100 m) MP concentration (A) and zooplankton grazing (B). On panel B, only the regions where the seasonal maximum in MP concentration and zooplankton grazing co-occur are filled. Regions colored in orange indicate maximum concentrations occurring in DJF (boreal winter), green indicates MAM (boreal spring), blue indicates JJA (boreal summer), and red indicates SON (boreal Autumn).
However, there are clear latitudinal patterns in the seasonality of zooplankton grazing (Figure 7B), which is driven by the seasonal variability in stratification, nutrient, and primary productivity. In the high latitudes, grazing activity is maximal during summer (DJF in the Southern Ocean and JJA/SON in the Arctic), and in the mid-latitudes, maximum grazing occurs during spring (SON in the southern hemisphere and MAM in the northern hemisphere).
Globally, there is a seasonal co-occurrence between maximal grazing and maximum surface [MP] in over 25% of the surface ocean area (Table 1), indicating that this maximum in surface [MP] occurs during the highest grazing period in large parts of the ocean, thus increasing contamination risk. In the Southern Ocean, this value rises to 40%, indicating that if [MP] increases in the future, MP contamination may become a significant threat to the fragile ecosystems of this region. In the subtropical gyres (that have a high MP/prey ratio), we observe that the seasonal maximum in MP surface concentration and grazing occurs at different seasons (Figure 7). However, zooplankton grazing in these regions has low seasonal variability. Finally, along the eastern Pacific coast, there are large areas of matching seasonal maxima in MPs and grazing, thus confirming the high contamination potential in this area (Figure 6).
Table 1
| Zone | Area [106 km2] | Seasonally contaminated area for zooplankton grazing [106 km2] (% of zone area) |
|---|---|---|
| Global | 360 | 95 (26) |
| Atlantic | 65 | 16 (25) |
| Arctic | 19 | 4.4 (23) |
| Indian | 58 | 11 (19) |
| Pacific | 140 | 32 (23) |
| Southern Ocean | 76 | 30 (39) |
Quantification of seasonally contaminated areas for zooplankton grazing.
This table indicates the ocean surface area (globally and in each ocean) where the seasonal maximum MP concentration and zooplankton grazing activity coincide. Numbers between brackets indicate the percentage of each zone that is seasonally contaminated by microplastics (MPs).
4 Discussion
4.1 Toward a global quantification of 3D microplastic ocean contamination
In this study, we used a 3D coupled physical–biogeochemical model, known for its realistic representation of nutrients, particles, and plankton distributions as well as their phenologies (Aumont et al., 2015). We implemented a microplastics scheme (PISCES-PLASTIC) based on documented estimates of riverine inputs of MPs (Lebreton et al., 2017), including features of floating, neutral, and sinking MPs along the vertical. This work allowed us to represent the 3D distribution of MPs in the global ocean and to identify the most potentially contaminated regions. The comparison of our model results with in situ measurements, and previous modeling work showed that our modeled MP concentration in the first 10 m is in the order of magnitude of the data (Figure 1). However, there is a strong decrease in concentrations below the surface in the model, which does not match the small set of available vertically resolved observations. However, the scarcity of vertically resolved observations calls for caution when comparing models and measurements.
In spite of this, our model results are consistent with previous observations of MP accumulation at the surface of subtropical gyres (Maximenko et al., 2012; Egger et al., 2020) and of a strong gradient of [MP] from coastal areas to the open ocean, with maximum [MP] close to the major sources (i.e., along the Southeast Asian and Indian coasts, see also Chenillat et al., 2021). We also note that the South Pacific gyre accumulates less MPs (Maximenko et al., 2012; Chenillat et al., 2021, and Figure 2). This may be linked to its position relatively far from the major MP sources as considered by the present source estimates. These results confirm that surface MP distribution is strongly influenced by surface currents and distance from the sources. Our 3D model brings a complementary perspective on the global distribution of MPs in the ocean compared to previous models that were restricted to the surface. Our results indicate that below the surface, [MP] rapidly decreases. The global [MP] profile resembles that of nutrients with [MP] rapidly decreasing in the first 100 m [60]. This “plasticline” has already been observed (Egger et al., 2020; Pabortsava and Lampitt, 2020, and Figure 2D). Below the mixed layer and throughout the mesopelagic zone, [MP] remains close to 0 (Figure 2B). Finally, there is a strong accumulation of sinking MPs near the ocean bottom, particularly in the vicinity of the sources (Figure 2C).
Nevertheless, the relatively high concentrations measured in the subsurface compared to our simulation results (Figure 1) may indicate that our model configuration is missing some processes that influence MP vertical distribution. In this first version of the PISCES-PLASTIC configuration, we set three contrasted vertical velocities for floating, neutral, and sinking MP, whereas the vertical velocities of MPs in the natural ocean probably range over a spectrum that is not yet resolved. In particular, the vertical velocity of MPs in the ocean may depend on the size and shape of MPs (Chubarenko et al., 2016; Zhang and Choi, 2021). As a consequence, the absence of MP size distribution in our model likely limits its representativeness. Nevertheless, the size and shape distribution of MP in the ocean (and particularly in the ocean interior) are still out of grasp. Very few studies have attempted to provide the size distribution of MPs in the water column (e.g., Pabortsava and Lampitt, 2020; Gardon et al., 2021). However, these distributions are based on the number of particles in each bin and not on the mass. This lack hampers our capability to model dependence of the vertical MP velocities toward their size. Moreover, several physical and biogeochemical processes may modify the MP sinking rate in the ocean. These processes include particle fragmentation, aggregation, biofouling, ingestion by marine fauna, and physical or chemical degradation, and most of them are not fully understood (Chubarenko et al., 2016; Hale et al., 2020; Andersen et al., 2021). As a result, most of the variability of MP vertical velocity is currently unknown. Accurately representing MP vertical velocities and their variability as they age and interact with various marine components is a key step for future model improvement needed to comprehend the distribution of MPs in the ocean. For instance, biofouling (e.g., the progressive colonization of MPs by prokaryotic and eukaryotic microorganisms, including planktonic organisms) may maintain MPs in suspension around the base of the euphotic layer (Kreczak et al., 2021). Recent advances in the modeling of biofouled MPs (Lobelle et al., 2021) could be used as a basis for further developing coupled MP–biogeochemistry models.
Calculations based on our model outputs indicate that the average residence time of MPs in the surface layer (0–100 m) is about 3 years. However, the residence time is highly variable depending on the region, at less than a year in highly ventilated regions such as the Arctic but over decades in the more contaminated and more stratified Pacific and Indian Oceans. These long residence times probably constitute upper estimates of MP residence time (see Reisser et al., 2015) because they only result from the influence of ocean physics on the vertical dynamics of MPs. Because we considered no variability in vertical dynamics, floating MPs are trapped on the surface with no degradation, ingestion, or biofouling mechanism to remove them from the surface. MP surface residence time should be revisited in models representing removal processes such as ingestion, biofouling, or even beaching.
Many factors may influence MP inputs from land to the ocean, and many uncertainties exist in both measurements and modeling of global MP inputs to the ocean. As a consequence, uncertainties in global MP inputs as well as in the global MP budget span several orders of magnitude (see Jambeck et al., 2015; Lebreton et al., 2017; Schmidt et al., 2017; Weiss et al., 2021) and may impact the estimates of MP distribution, residence time, and, consequently, zooplankton exposure. Moreover, a significant fraction of plastic waste found in the ocean may originate from sea-based sources (GESAMP, 2016) and aerosols have also recently been identified as a potential MP source to the ocean (Dris et al., 2018a; Liss, 2020; Brahney et al., 2021; Galgani et al., 2021). In this study, we used one of the most cited estimates for global riverine MP sources (Lebreton et al., 2017), which is based on estimates of population density, waste production, and hydrological models. However, there are many uncertainties linked with waste production estimates, and different models produce different global fluxes (e.g., Weiss et al., 2021). As a consequence, there is a strong need for more accurate estimates of MP fluxes to the ocean in order to build a more complete understanding of the global MP oceanic budget.
Several studies using Lagrangian modeling methods and in situ observations showed that beaching may be a significant sink for floating MPs (Karthik et al., 2018; Chenillat et al., 2021; Onink et al., 2021). Also, particle interactions, currents (Pohl et al., 2020), and biological activity in sediments (Coppock et al., 2019) may lead to MP burial in sediments, which could act as an MP sink at the bottom of the ocean. Moreover, coastal beaches and sediments may act as MP reservoirs and become source areas for MP resuspension. The magnitude of resuspension from beaches will depend on coastal erosion and wave action, whereas MP resuspension from sediments depends on sediment type, depth of burial, and biological activity. Extreme events such as storms may also lead to resuspension from sediments or beaches. In the future decades, increased frequency of extreme events may lead to significant resuspension fluxes (IPCC, 2012). All these processes (beaching, sediment burial, and resuspension) may significantly impact global ocean MP budgets, but the lack of data and understanding of processes affecting these sinks hinders their representation in current models.
Finally, because the worldwide use of plastic material is recent (a few decades) and continues to rise at an unprecedented rate, the MP budget in the ocean is definitely not in stationary equilibrium. Therefore, MP budgets derived from simulations depend on model integration time. In this study, we simulated constant MP inputs from land for 25 years in order to maximize the comparison of our modeled MP concentrations with available data, first aiming at representing the current state of ocean MP contamination and potential trophic chain MP exposure. Similar exercises with a near-real-time simulation of the ocean dynamics and microplastic time-varying sources would be necessary to deepen the understanding of global ocean MP contamination.
4.2 First modeled estimates of zooplankton exposure to microplastic ingestion
For the first time, results of simulated [MP], plankton biomass, and grazing rates of zooplankton are presented within the same context using a single global 3D ocean model. Results from the new configuration PISCES-PLASTIC feature one of the first estimates of global zooplankton exposure to MP ingestion and identify subtropical gyres and coastal areas as the most at risk of MP contamination (Figure 6). Previous measurements of surface MPs and plankton identified the Californian coast and the North Pacific subtropical gyre as regions of potential food-web contamination because of the high MP/zooplankton ratio in these waters (see Moore et al., 2001; Moore et al., 2002, and also Figure S5). Model resolution in the present study is too coarse for direct comparison, but data on MP contamination in the Mediterranean Sea also showed that the ratio of MPs (between 2 and 5 mm) to zooplankton around the Bay of Calvi is on average 2.63 (Collignon et al., 2014). Even though the ratio of small MPs (<2 mm) to zooplankton remained low in this study, these results indicate that water contamination of MPs may be occurring over large oceanic regions. A recent study estimated the MP contamination of fish over the global ocean (Savoca et al., 2021). The authors found that the most contaminated areas are the Asian and Indian coasts, the Equatorial Atlantic, the Southeast American coast, and South African coast. These highly contaminated regions are also identified in our analyses, with the exception of South America and South Africa, which display relatively low zooplankton exposure in our model results, which may be linked with the low seawater MP contamination of this area due to the strong currents rapidly dispersing MPs far from the coast. Results from Savoca et al. (2021) confirm that the upwelling regions and the South Pacific have low MP contamination, as mentioned above.
Our results regarding zooplankton exposure to MP ingestion are limited to the upper layers of the ocean (0–100 m) where most of the biological activity occurs in our model. If this observation is generally true for primary productivity and small plankton, higher trophic levels may be feeding at greater depth (Klevjer et al., 2016). Moreover, a large fraction of zooplankton carries out diel vertical migration (DVM; see Longhurst and Glen Harrison, 1988), whereby zooplankton feed at the surface at night, when their visual predators are absent and remain in diapause in the mesopelagic zone during the day. The PISCES configuration used in this study represents a daily averaged grazing rate of zooplankton, which does not take into account DVM presently (see Gorgues et al., 2019, for a simulation of DVM in PISCES). However, this approximation still leads to realistic grazing rates at the monthly and yearly time resolutions of the model outputs. If the absence of explicit DVM in our model does not significantly impact zooplankton exposure to MPs, it may impact the vertical MP distribution. Indeed, if zooplankton were to feed on MP particles at the surface, its vertical migration may bring MPs to the mesopelagic zone. We are not aware of any study demonstrating the impacts of zooplankton DVM on the vertical distribution of MPs, but given the importance of DVM for carbon and nutrient fluxes (Longhurst and Glen Harrison, 1988; Hansen and Visser, 2016), this process may be significant for MP export.
Zooplankton biomass over the global ocean is influenced by seasonal variations of climate conditions responsible for the variability in light and nutrients that underlie zooplankton phenology. However, MP seasonal variability in our current model depends on the seasonality of the sources, ocean vertical currents, and MP vertical velocity (see Figure 4, Table 1, and Figures S3 and 7). Our results indicate that the seasonal maxima in zooplankton grazing activity and MP surface concentration may co-occur over a significant proportion of the global ocean surface, which may increase zooplankton potential contamination during the bloom period. If the drivers of zooplankton phenology are well characterized, many factors may influence the seasonality of MP concentration in the ocean. For instance, Quesadas-Rojas et al. (2021) showed that seasonally human activities (seasonality in anthropogenic pressure in touristic areas) and precipitation regimes (high precipitation favors flushing of MPs from land to sea) may influence seaward MP fluxes.
Furthermore, climate change may increase ocean stratification (Kwiatkowski et al., 2020) and lead to changes in precipitation regimes and freshwater discharge from coasts and rivers (Nohara et al., 2006). As a consequence, global ocean MP sources, sinks, concentrations, and seasonality may be significantly altered, independently of future trends in MP production, fluxes, or depollution.
4.3 Directions for future studies
The development of models representing MP distribution in the ocean and its potential impacts is an important step toward understanding the multiple and complex impacts of MPs. Such effort should be pursued by research teams from diverse disciplines (in the same context as the one dedicated to climate change). In spite of the recent interest of a wide scientific community for MP research, many questions regarding MP impacts on the ocean remain. These questions span a large range of scientific disciplines such as freshwater and hydrodynamical sciences quantifying MP fluxes from land (e.g., Lebreton et al., 2017; Schmidt et al., 2017; Lebreton and Andrady, 2019; Weiss et al., 2021), atmospheric sciences studying airborne MPs (e.g., Dris et al., 2018b; Evangeliou et al., 2020; Brahney et al., 2021), and physical and biogeochemical sciences quantifying the dynamics and impacts of MPs on ocean nutrient and planktonic cycles (e.g., Kvale et al., 2020). These questions should mobilize a large community of scientists combining methodologies such as experiments, in situ measurements, observations, and modeling in order to build a global understanding of the distribution and impacts of MPs on the ocean.
Finally, the reliability of the conclusions drawn from models depends strongly on the comparison of model results with measurements. To date, only a limited amount of data is accessible and usable for model evaluation, which greatly limits the capacity of modeling studies. The next efforts from the microplastic research community should focus on building and diffusing harmonized methodologies for the collection, interpretation, and diffusion of MP data in the ocean. This effort should be concerned with the modeling community in order to facilitate the development and interpretation of model results. With the growing number of studies measuring MP concentration in various ocean areas (coastal, sediment, beaches, and water column), there is some emerging effort in the international community to harmonize data collection, analysis, and distribution (Maximenko et al., 2019; Galgani et al., 2021). Those efforts should be pursued.
5 Summary and conclusions
This study presents the global 3D distribution of MPs brought from rivers and dispersed into the water column of the global ocean. This model allowed us to identify the major MP-contaminated areas: the surface of the subtropical gyres and Southeast Asian and Indian coasts, as well as the deep ocean regions close to coastal sources of MPs. In these regions, [MP] may reach over 10 mg·m−3, which is higher than the average biomass of zooplankton found in these regions. Zooplankton contamination by MPs is also favored by high grazing rates, such as that of the coastal and upwelling regions. We identified two modes of zooplankton exposure to MPs: 1) high water [MP] (e.g., subtropical gyres), where exposure is high because any grazing may lead to MP contamination of zooplankton; 2) high grazing (i.e., equatorial regions), where exposure is increased by the intense grazing activity, even if water MP contamination is moderate. According to these mechanisms, regions with both high water contamination and high grazing (e.g., the South East Asian and Indian coasts) undergo maximal zooplankton contamination risk. Finally, the phasing of grazing and surface [MP] seasonal maxima may periodically increase zooplankton contamination risk through the seasonal vertical concentration of MPs. This occurs in about a quarter of the ocean surface.
Funding
This work was supported by ISblue project, Interdisciplinary graduate school for the blue planet (ANR-17-EURE-0015), and co-funded by a grant from the French government under the program “Investissements d’Avenir”, and by a grant from the Regional Council of Brittany (SAD program).
Acknowledgments
The authors would like to thank Klervie Bourgoin for her work on data selection and comparison with model outputs.
Publisher’s note
All claims expressed in this article are solely those of the authors and do not necessarily represent those of their affiliated organizations, or those of the publisher, the editors and the reviewers. Any product that may be evaluated in this article, or claim that may be made by its manufacturer, is not guaranteed or endorsed by the publisher.
Statements
Data availability statement
Simulation outputs used in this study are available at: 10.5281/zenodo.7031908.
Author contributions
CR designed the study, implemented the model, analyzed the results, and drafted the paper. TG, IP-P, and CM helped interpret the results. All authors contributed to revising the manuscript. All authors contributed to the article and approved the submitted version.
Conflict of interest
The authors declare that the research was conducted in the absence of any commercial or financial relationships that could be construed as a potential conflict of interest.
Supplementary material
The Supplementary Material for this article can be found online at: https://www.frontiersin.org/articles/10.3389/fmars.2022.947309/full#supplementary-material
Supplementary Figure 1MP concentration in the first layer (0-10m) of the model in g/km2.
Supplementary Figure 2MP budgets in each depth layer (kt). (A) surface (0-100m), (B) mesopelagic (100-1000m), (C) deep (>1000m).
Supplementary Figure 3Maps of the relative proportion of neutral (A, D, G ), floating (B, E ,H) and sinking (C, F ,I) MP in the surface (0-100m, a-c), mesopelagic (100-1000m, D-F) and deep (>1000m, G–I).
Supplementary Figure 4Zooplankton exposure to MP via active predation (A) and detritivory (B). Both values are unitless (see Methods).
Supplementary Figure 5MP/zooplankton biomass ratio in surface (0-100m).
References
1
Alekseenko E. Thouvenin B. Tronczyński J. Carlotti F. Garreau P. Tixier C. et al . (2018). ). Modeling of PCB trophic transfer in the gulf of lions; 3D coupled model application. Mar. Pollut. Bull.128, 140–155. doi: 10.1016/j.marpolbul.2018.01.008
2
Amélineau F. Bonnet D. Heitz O. Mortreux V. Harding A. M. A. Karnovsky N. et al . (2016). Microplastic pollution in the Greenland Sea: Background levels and selective contamination of planktivorous diving seabirds. Environ. Pollut.219, 1131–1139. doi: 10.1016/j.envpol.2016.09.017
3
Andersen T. J. Rominikan S. Olsen I. S. Skinnebach K. H. Fruergaard M. (2021). Flocculation of PVC microplastic and fine-grained cohesive sediment at environmentally realistic concentrations. Biol. Bull.240, 42–51. doi: 10.1086/712929
4
Auger P. Machu E. Gorgues T. Grima N. Waeles M. (2015). Comparative study of potential transfer of natural and anthropogenic cadmium to plankton communities in the north-West African upwelling. Sci. Tot. Environ.505, 870–888. doi: 10.1016/j.scitotenv.2014.10.045
5
Aumont O. Ethé C. Tagliabue A. Bopp L. Gehlen M. (2015). PISCES-v2: An ocean biogeochemical model for carbon and ecosystem studies. Geosci. Model. Dev.8, 2465–2513. doi: 10.5194/gmd-8-2465-2015
6
Aumont O. Maury O. Lefort S. Bopp L. (2018). Evaluating the potential impacts of the diurnal vertical migration by marine organisms on marine biogeochemistry. Global Biogeochem. Cycle32, 1622–1643. doi: 10.1029/2018GB005886
7
Auta H. S. Emenike C. U. Fauziah S. H. (2017). Distribution and importance of microplastics in the marine environment: A review of the sources, fate, effects, and potential solutions. Environ. Int.102, 165–176. doi: 10.1016/j.envint.2017.02.013
8
Baalkhuyur F. M. Bin Dohaish E.-J. A. Elhalwagy M. E. A. Alikunhi N. M. AlSuwailem A. M. Røstad A. et al . (2018). Microplastic in the gastrointestinal tract of fishes along the Saudi Arabian red Sea coast. Mar. Pollut. Bull.131, 407–415. doi: 10.1016/j.marpolbul.2018.04.040
9
Beghoura H. Gorgues T. Aumont O. Planquette H. Tagliabue A. Auger P. (2019). Impact of inorganic particles of sedimentary origin on global dissolved iron and phytoplankton distribution. J. Geophys. Res.: Ocean.124, 8626–8646. doi: 10.1029/2019JC015119
10
Berger H. Treguier A. M. Perenne N. Talandier C. (2014). Dynamical contribution to sea surface salinity variations in the eastern gulf of Guinea based on numerical modelling. Climate Dynam.43, 3105–3122. doi: 10.1007/s00382-014-2195-4
11
Bergmann M. Collard F. Fabres J. Gabrielsen G. W. Provencher J. F. Rochman C. M. et al . (2022). Plastic pollution in the Arctic. Nat. Rev. Earth Environ.3, 323–337. doi: 10.1038/s43017-022-00279-8
12
Brahney J. Mahowald N. Prank M. Cornwell G. Klimont Z. Matsui H. et al . (2021). Constraining the atmospheric limb of the plastic cycle. Proc. Natl. Acad. Sci.118, 10. doi: 10.1073/pnas.2020719118. ISBN: 9782020719117 Publisher: National Academy of Sciences Section: Physical Sciences.
13
Carpenter E. J. Smith K. L. (1972). Plastics on the Sargasso Sea surface. Science175, 1240–1241. doi: 10.1126/science.175.4027.1240
14
Chenillat F. Huck T. Maes C. Grima N. Blanke B. (2021). Fate of floating plastic debris released along the coasts in a global ocean model. Mar. Pollut. Bull.165, 112116. doi: 10.1016/j.marpolbul.2021.112116
15
Choy C. A. Robison B. H. Gagne T. O. Erwin B. Firl E. Halden R. U. et al . (2019). The vertical distribution and biological transport of marine microplastics across the epipelagic and mesopelagic water column. Sci. Rep.9, 7843. doi: 10.1038/s41598-019-44117-2
16
Chubarenko I. Bagaev A. Zobkov M. Esiukova E. (2016). On some physical and dynamical properties of microplastic particles in marine environment. Mar. Pollut. Bull.108, 105–112. doi: 10.1016/j.marpolbul.2016.04.048
17
Cole M. Coppock R. Lindeque P. K. Altin D. Reed S. Pond D. W. et al . (2019). Effects of nylon microplastic on feeding, lipid accumulation, and moulting in a coldwater copepod. Environ. Sci. Technol.53, 7075–7082. doi: 10.1021/acs.est.9b01853
18
Cole M. Lindeque P. Fileman E. Halsband C. Goodhead R. Moger J. et al . (2013). Microplastic ingestion by zooplankton. Environ. Sci. Technol.47, 6646–6655. doi: 10.1021/es400663f
19
Collignon A. Hecq J.-H. Galgani F. Collard F. Goffart A. (2014). Annual variation in neustonic micro- and meso-plastic particles and zooplankton in the bay of calvi (Mediterranean–Corsica). Mar. Pollut. Bull.79, 293–298. doi: 10.1016/j.marpolbul.2013.11.023
20
Coppock R. L. Galloway T. S. Cole M. Fileman E. S. Queirós A. M. Lindeque P. K. (2019). Microplastics alter feeding selectivity and faecal density in the copepod, calanus helgolandicus. Sci. Tot. Environ.687, 780–789. doi: 10.1016/j.scitotenv.2019.06.009
21
Cózar A. Echevarría F. González-Gordillo J. I. Irigoien X. Úbeda B. Hernández-León S. et al . (2014). Plastic debris in the open ocean. Proc. Natl. Acad. Sci.111, 10239–10244. doi: 10.1073/pnas.1314705111
22
Crawford C. B. Quinn B. (2017). “The contemporary history of plastics,” in Microplastic pollutants (Elsevier), 19–37. doi: 10.1016/B978-0-12-809406-8.00002-5
23
Dris R. Imhof H. K. Löder M. G. Gasperi J. Laforsch C. Tassin B. (2018). “Microplastic contamination in freshwater systems: Methodological challenges, occurrence and sources,” in Microplastic contamination in aquatic environments (Elsevier), 51–93. doi: 10.1016/B978-0-12-813747-5.00003-5
24
Egger M. Sulu-Gambari F. Lebreton L. (2020). First evidence of plastic fallout from the north pacific garbage patch. Sci. Rep.10, 7495. doi: 10.1038/s41598-020-64465-8
25
Evangeliou N. Grythe H. Klimont Z. Heyes C. Eckhardt S. Lopez-Aparicio S. et al . (2020). Atmospheric transport is a major pathway of microplastics to remote regions. Nat. Commun.11, 3381. doi: 10.1038/s41467-020-17201-9
26
Galgani F. Brien A.S.-o. Weis J. Ioakeimidis C. Schuyler Q. Makarenko I. et al . (2021). Are litter, plastic and microplastic quantities increasing in the ocean? Microplast. Nanoplast.1, 2. doi: 10.1186/s43591-020-00002-8
27
Gardon T. El Rakwe M. Paul-Pont I. Le Luyer J. Thomas L. Prado E. et al . (2021). Microplastics contamination in pearl-farming lagoons of French Polynesia. J. Haz. Mat.419, 126396. doi: 10.1016/j.jhazmat.2021.126396
28
GESAMP (2016). Sources, fate and effects of microplastics in the marine environment: Part two of a global assessment. Tech. Rep.93, 221.
29
Gorgues T. Aumont O. Memery L. (2019). Simulated changes in the particulate carbon export efficiency due to diel vertical migration of zooplankton in the north Atlantic. Geophys. Res. Lett.46, 5387–5395. doi: 10.1029/2018GL081748
30
Hale R. C. Seeley M. E. Guardia M. J. L. Mai L. Zeng E. Y. (2020). A global perspective on microplastics. J. Geophys. Res.125, e2018JC014719. doi: 10.1029/2018JC014719
31
Halstead J. E. Smith J. A. Carter E. A. Lay P. A. Johnston E. L. (2018). Assessment tools for microplastics and natural fibres ingested by fish in an urbanised estuary. Environ. Pollut.234, 552–561. doi: 10.1016/j.envpol.2017.11.085
32
Hamid F. S. Bhatti M. S. Anuar N. Anuar N. Mohan P. Periathamby A. (2018). Worldwide distribution and abundance of microplastic: How dire is the situation? Waste. Manage. Res56 (2), 962–973. doi: 10.1177/0734242X18785730
33
Hansen A. N. Visser A. W. (2016). Carbon export by vertically migrating zooplankton: an optimal behavior model. Limnol. Oceanog.61, 701–710. doi: 10.1002/lno.10249._eprint:https://aslopubs.onlinelibrary.wiley.com/doi/pdf/10.1002/lno.10249
34
Huck T. Bajon R. Grima N. Portela E. Molines J.-M. Penduff T. (2022). Three-dimensional dispersion of neutral “Plastic” particles in a global ocean model. Front. Anal. Sci.2. doi: 10.3389/frans.2022.868515
35
IPCC (2012). IPCmanaging the risks of extreme events and disasters to advance climate change adaptation (Cambridge University Press).
36
Isobe A. Azuma T. Cordova M. R. Cózar A. Galgani F. Hagita R. et al . (2021). A multilevel dataset of microplastic abundance in the world’s upper ocean and the laurentian great lakes. Microplast. Nanoplast.1, 16. doi: 10.1186/s43591-021-00013-z
37
Jabeen K. Su L. Li J. Yang D. Tong C. Mu J. et al . (2017). Microplastics and mesoplastics in fish from coastal and fresh waters of China. Environ. Pollut.221, 141–149. doi: 10.1016/j.envpol.2016.11.055
38
Jambeck J. R. Geyer R. Wilcox C. Siegler T. R. Perryman M. Andrady A. et al . (2015). Plastic waste inputs from land into the ocean. Science347, 768–771. doi: 10.1126/science.1260352
39
Kanhai L. D. K. Gårdfeldt K. Lyashevska O. Hassellöv M. Thompson R. C. O’Connor I. (2018). Microplastics in sub-surface waters of the Arctic central basin. Mar. Pollut. Bull.130, 8–18. doi: 10.1016/j.marpolbul.2018.03.011
40
Karthik R. Robin R. S. Purvaja R. Ganguly D. Anandavelu I. Raghuraman R. et al . (2018). Microplastics along the beaches of southeast coast of India. Sci. Tot. Environ.645, 1388–1399. doi: 10.1016/j.scitotenv.2018.07.242
41
Klevjer T. A. Irigoien X. Røstad A. Fraile-Nuez E. Benítez-Barrios V. M. Kaartvedt S. (2016). Large Scale patterns in vertical distribution and behaviour of mesopelagic scattering layers. Sci. Rep.6, 19873. doi: 10.1038/srep19873
42
Kreczak H. Willmott A. J. Baggaley A. W. (2021). Subsurface dynamics of buoyant microplastics subject to algal biofouling. Limnol. Oceanog.66, 3287–3299. doi: 10.1002/lno.11879
43
Kvale K. Prowe A. E. F. Chien C.-T. Landolfi A. Oschlies A. (2020). The global biological microplastic particle sink. Sci. Rep.10, 16670. doi: 10.1038/s41598-020-72898-4
44
Kwiatkowski L. Torres O. Bopp L. Aumont O. Chamberlain M. Christian J. R. et al . (2020). Twenty-first century ocean warming, acidification, deoxygenation, and upper-ocean nutrient and primary production decline from CMIP6 model projections. Biogeosciences17, 3439–3470. doi: 10.5194/bg-17-3439-2020
45
Law K. L. Morét-Ferguson S. E. Goodwin D. S. Zettler E. R. DeForce E. Kukulka T. et al . (2014). Distribution of surface plastic debris in the Eastern pacific ocean from an 11-year data set. Environ. Sci. Technol.48, 4732–4738. doi: 10.1021/es4053076
46
Lebreton L. Andrady A. (2019). Future scenarios of global plastic waste generation and disposal. Palgrave. Commun.5, 1–11. doi: 10.1057/s41599-018-0212-7
47
Lebreton L. C. M. Greer S. D. Borrero J. C. (2012). Numerical modelling of floating debris in the world’s oceans. Mar. Pollut. Bull.64, 653–661. doi: 10.1016/j.marpolbul.2011.10.027
48
Lebreton L. C. M. van der Zwet J. Damsteeg J.-W. Slat B. Andrady A. Reisser J. (2017). River plastic emissions to the world’s oceans. Nat. Commun.8, 15611. doi: 10.1038/ncomms15611
49
Liss P. S. (2020). Microplastics: All up in the air? Mar. Pollut. Bull.153, 110952. doi: 10.1016/j.marpolbul.2020.110952
50
Lobelle D. Kooi M. Koelmans A. A. Laufkötter C. Jongedijk C. E. Kehl C. et al . (2021). Global modeled sinking characteristics of biofouled microplastic. J. Geophys. Res.: Ocean.126, e2020JC017098. doi: 10.1029/2020JC017098
51
Longhurst A. R. Glen Harrison W. (1988). Vertical nitrogen flux from the oceanic photic zone by diel migrant zooplankton and nekton. Deep. Sea. Res. Part A. Oceanog. Res. Pap.35, 881–889. doi: 10.1016/0198-0149(88)90065-9
52
Madec G. (2008). NEMO ocean engine. available online at https://www.nemo-ocean.eu/doc/
53
Maximenko N. Corradi P. Law K. L. Van Sebille E. Garaba S. P. Lampitt R. S. et al . (2019). Toward the integrated marine debris observing system. Front. Mar. Sci.6. doi: 10.3389/fmars.2019.00447
54
Maximenko N. Hafner J. Niiler P. (2012). Pathways of marine debris derived from trajectories of Lagrangian drifters. Mar. Pollut. Bull.65, 51–62. doi: 10.1016/j.marpolbul.2011.04.016
55
Menkes C. E. Kennan S. C. Flament P. Dandonneau Y. Masson S. Biessy B. et al . (2002). A whirling ecosystem in the equatorial Atlantic. Geophys. Res. Lett.29, 48–1–48–4. doi: 10.1029/2001GL014576
56
Moore C. J. Moore S. L. Leecaster M. K. (2001). A comparison of plastic and plankton in the north pacific central gyre. Mar. Pollut. Bull.4, 1297–1300. doi: 10.1016/S0025-326X(01)00114-X
57
Moore C. J. Moore S. L. Weisberg S. B. Lattin G. L. Zellers A. F. (2002). A comparison of neustonic plastic and zooplankton abundance in southern california’s coastal waters. Mar. Pollut. Bull.44, 1035–1038. doi: 10.1016/S0025-326X(02)00150-9
58
Mountford A. S. Maqueda M. A. M. (2021). Modeling the accumulation and transport of microplastics by Sea ice. J. Geophys. Res.126, e2020JC016826. doi: 10.1029/2020JC016826
59
Mountford A. S. Morales Maqueda M. A. (2019). Eulerian modeling of the three-dimensional distribution of seven popular microplastic types in the global ocean. J. Geophys. Res.: Ocean.124, 8558–8573. doi: 10.1029/2019JC015050
60
Nelms S. E. Galloway T. S. Godley B. J. Jarvis D. S. Lindeque P. K. (2018). Investigating microplastic trophic transfer in marine top predators. Environ. Pollut.238, 999–1007. doi: 10.1016/j.envpol.2018.02.016
61
Neves D. Sobral P. Ferreira J. L. Pereira T. (2015). Ingestion of microplastics by commercial fish off the Portuguese coast. Mar. Pollut. Bull.101, 119–126. doi: 10.1016/j.marpolbul.2015.11.008
62
Nohara D. Kitoh A. Hosaka M. Oki T. (2006). Impact of climate change on river discharge projected by multimodel ensemble. J. Hydrometeorol.7, 1076–1089. doi: 10.1175/JHM531.1
63
Onink V. Jongedijk C. Hoffman M. Sebille E. v. Laufkötter C. (2021). Global simulations of marine plastic transport show plastic trapping in coastal zones. Environ. Res. Lett16 (6), 13. doi: 10.1088/1748-9326/abecbd
64
Pabortsava K. Lampitt R. S. (2020). High concentrations of plastic hidden beneath the surface of the Atlantic ocean. Nat. Commun.11, 4073. doi: 10.1038/s41467-020-17932-9
65
Peng X. Chen M. Chen S. Dasgupta S. Xu H. Ta K. et al . (2018). Microplastics contaminate the deepest part of the world’s ocean. Geochem. Perspect. Lett.9, 1–5. doi: 10.7185/geochemlet.1829
66
Phuong N. N. Zalouk-Vergnoux A. Poirier L. Kamari A. Châtel A. Mouneyrac C. et al . (2016). Is there any consistency between the microplastics found in the field and those used in laboratory experiments? Environ. Pollut.211, 111–123. doi: 10.1016/j.envpol.2015.12.035
67
Plastics Europe (2017). Plastic: The facts.available online at https://plasticseurope.org/knowledge-hub/plastics-the-facts-2017/.
68
Pohl F. Eggenhuisen J. T. Kane I. A. Clare M. A. (2020). Transport and burial of microplastics in deep-marine sediments by turbidity currents. Environ. Sci. Technol.54, 4180–4189. doi: 10.1021/acs.est.9b07527
69
Quesadas-Rojas M. Enriquez C. Valle-Levinson A. (2021). Natural and anthropogenic effects on microplastic distribution in a hypersaline lagoon. Sci. Tot. Environ.776, 145803. doi: 10.1016/j.scitotenv.2021.145803
70
Reisser J. Slat B. Noble K. du Plessis K. Epp M. Proietti M. et al . (2015). The vertical distribution of buoyant plastics at sea: An observational study in the north Atlantic gyre. Biogeosciences12, 1249–1256. doi: 10.5194/bg-12-1249-2015
71
Richardson A. J. (2008). In hot water: Zooplankton and climate change. ICES. J. Mar. Sci.65, 279–295. doi: 10.1093/icesjms/fsn028
72
Richon C. Aumont O. Tagliabue A. (2020). Prey stoichiometry drives iron recycling by zooplankton in the global ocean. Front. Mar. Sci.7. doi: 10.3389/fmars.2020.00451
73
Richon C. Tagliabue A. (2019). Insights into the major processes driving the global distribution of copper in the ocean from a global model. Global Biogeochem. Cycle.33, 1594–1610. doi: 10.1029/2019GB006280
74
Roch S. Friedrich C. Brinker A. (2020). Uptake routes of microplastics in fishes: Practical and theoretical approaches to test existing theories. Sci. Rep.10, 3896. doi: 10.1038/s41598-020-60630-1
75
Sallée J.-B. Pellichero V. Akhoudas C. Pauthenet E. Vignes L. Schmidtko S. et al . (2021). Summertime increases in upper-ocean stratification and mixed-layer depth. Nature591, 592–598. doi: 10.1038/s41586-021-03303-x
76
Savoca M. S. McInturf A. G. Hazen E. L. (2021). Plastic ingestion by marine fish is widespread and increasing. Global Change Biol.27, 2188–2199. doi: 10.1111/gcb.15533
77
Schmidt C. Krauth T. Wagner S. (2017). Export of plastic debris by rivers into the Sea. Environ. Sci. Technol.51, 12246–12253. doi: 10.1021/acs.est.7b02368
78
Sebille E. v. Wilcox C. Lebreton L. Maximenko N. Hardesty B. D. Franeker J. et al . (2015). A global inventory of small floating plastic debris. Environ. Res. Lett.10, 124006. doi: 10.1088/1748-9326/10/12/124006
79
Setälä O. Fleming-Lehtinen V. Lehtiniemi M. (2014). Ingestion and transfer of microplastics in the planktonic food web. Environ. Pollut.185, 77–83. doi: 10.1016/j.envpol.2013.10.013
80
Setälä O. Lehtiniemi M. Coppock R. Cole M. (2018). “Chapter 11 - microplastics in marine food webs,” in Microplastic contamination in aquatic environments. Ed. ZengE. Y. (Elsevier), 339–363. doi: 10.1016/B978-0-12-813747-5.00011-4
81
Suaria G. Aliani S. (2014). Floating debris in the Mediterranean Sea. Mar. pollut. Bull.86, 494–504. doi: 10.1016/j.marpolbul.2014.06.025
82
Tagliabue A. Hawco N. J. Bundy R. M. Landing W. M. Milne A. Morton P. L. et al . (2018). The role of external inputs and internal cycling in shaping the global ocean cobalt distribution: Insights from the first cobalt biogeochemical model. Global Biogeochem. Cycle.32, 594–616. doi: 10.1002/2017GB005830
83
Ter Halle A. Jeanneau L. Martignac M. Jardé E. Pedrono B. Brach L. et al . (2017). Nanoplastic in the north Atlantic subtropical gyre. Environ. Sci. Technol.51, 13689–13697. doi: 10.1021/acs.est.7b03667
84
Thompson R. C. Olsen Y. Mitchell R. P. Davis A. Rowland S. J. John A. W. G. et al . (2004). enLost at Sea: Where is all the plastic? Science304, 838–838. doi: 10.1126/science.1094559
85
Tirelli V. Suaria G. Lusher A. L. (2020). “Microplastics in polar samples,” in Handbook of microplastics in the environment. Eds. Rocha-SantosT.CostaM.MouneyracC. (Cham: Springer International Publishing), 1–42. doi: 10.1007/978-3-030-10618-8
86
van Sebille E. Aliani S. Law K. L. Maximenko N. Alsina J. M. Bagaev A. et al . (2020). The physical oceanography of the transport of floating marine debris. Environ. Res. Lett.15, 023003. doi: 10.1088/1748-9326/ab6d7d
87
van Wijnen J. Ragas A. M. J. Kroeze C. (2019). Modelling global river export of microplastics to the marine environment: Sources and future trends. Sci. Tot. Environ.673, 392–401. doi: 10.1016/j.scitotenv.2019.04.078
88
Weiss L. Ludwig W. Heussner S. Canals M. Ghiglione J.-F. Estournel C. et al . (2021). The missing ocean plastic sink: Gone with the rivers. Science373, 107–111. doi: 10.1126/science.abe0290
89
Woodall L. C. Sanchez-Vidal A. Canals M. Paterson G. L. Coppock R. Sleight V. et al . (2014). The deep sea is a major sink for microplastic debris. R. Soc. Open Sci.1, 140317. doi: 10.1098/rsos.140317
90
Zhang J. Choi C. E. (2021). Improved settling velocity for microplastic fibers: A new shape-dependent drag model. Environ. Sci. Technol. 56(2), 962–973. doi: 10.1021/acs.est.1c06188
91
Zhang F. Wang X. Xu J. Zhu L. Peng G. Xu P. et al . (2019). Food-web transfer of microplastics between wild caught fish and crustaceans in East China Sea. Mar. Pollut. Bull.146, 173–182. doi: 10.1016/j.marpolbul.2019.05.061
Summary
Keywords
zooplankton, microplastics, modeling, contamination, global ocean
Citation
Richon C, Gorgues T, Paul-Pont I and Maes C (2022) Zooplankton exposure to microplastics at global scale: Influence of vertical distribution and seasonality. Front. Mar. Sci. 9:947309. doi: 10.3389/fmars.2022.947309
Received
18 May 2022
Accepted
28 July 2022
Published
08 September 2022
Volume
9 - 2022
Edited by
Julian Blasco, Spanish National Research Council (CSIC), Spain
Reviewed by
Rachel Leads, University of North Texas, United States; Gabriel Enrique De-la-Torre, Saint Ignatius of Loyola University, Peru
Updates
Copyright
© 2022 Richon, Gorgues, Paul-Pont and Maes.
This is an open-access article distributed under the terms of the Creative Commons Attribution License (CC BY). The use, distribution or reproduction in other forums is permitted, provided the original author(s) and the copyright owner(s) are credited and that the original publication in this journal is cited, in accordance with accepted academic practice. No use, distribution or reproduction is permitted which does not comply with these terms.
*Correspondence: Camille Richon, camille.richon@univ-brest.fr
This article was submitted to Marine Pollution, a section of the journal Frontiers in Marine Science
Disclaimer
All claims expressed in this article are solely those of the authors and do not necessarily represent those of their affiliated organizations, or those of the publisher, the editors and the reviewers. Any product that may be evaluated in this article or claim that may be made by its manufacturer is not guaranteed or endorsed by the publisher.