Abstract
The oceans represent 97% of all water on Earth and contain microscopic, drifting life, plankton, which drives global biogeochemical cycles. A major hurdle in assessing marine plankton is the planetary scale of the oceans and the logistical and economic constraints associated with their sampling. This difficulty is reflected in the limited amount of scientifically equipped fleets and affordable equipment. Here we present a modular hardware/software open-source strategy for building a versatile, re-configurable imaging platform - the PlanktoScope - that can be adapted to a number of applications in aquatic biology and ecology. We demonstrate high-throughput quantitative imaging of laboratory and field plankton samples while enabling rapid device reconfiguration to match the evolving needs of the sampler. The presented versions of PlanktoScope are capable of autonomously imaging 1.7 ml per minute with a 2.8 µm/px resolution and can be controlled from any WiFi-enabled device. The PlanktoScope’s small size, ease of use, and low cost - under $1000 in parts - enable its deployment for customizable monitoring of laboratory cultures or natural micro-plankton communities. This also paves the way toward consistent and long-term measurement of plankton diversity by an international fleet of citizen vessels at the planetary scale.
1 Introduction
Life drifting in water - plankton - forms the foundation of ecological networks and biodiversity in aquatic ecosystems (Fenchel, 1988). It is a major driver of global geochemical processes, by generating nearly half of the planet’s oxygen (Field, 1998) and maintaining a flux of photosynthetically fixed carbon to deeper layers of the ocean and its floor (Field, 1998, Henson et al., 2012). However, we still know little about the ecological and evolutionary dynamics of planktonic communities or the extent of the anthropogenic impact on these communities. Unlocked by the revolution in environmental DNA sequencing, our knowledge about plankton diversity has dramatically improved over the last two decades, notably through global-scale expeditions led by biologists, including the Global Ocean Sampling (Venter et al., 2004), Tara Oceans (Karsenti et al., 2011; Duarte, 2015). In particular, Tara Oceans (2009 - 2013) has applied a standardized, eco-systems biology strategy to explore plankton diversity from genes to communities, from viruses to animals, and across coarse but planetary spatial and seasonal scales (Sunagawa et al., 2020). The combination of global ocean DNA metabarcoding, metagenomic, and metatranscriptomic datasets [e.g. (de Vargas et al., 2015) (Sunagawa et al., 2015) Carradec et al. (2018)] has unveiled the basic structures of open ocean plankton taxonomic diversity and generated hypotheses about its interactions (Chaffron et al., 2021), biogeography (Ruuskanen et al., 2021), and roles in critical ocean processes such as the carbon pump Guidi et al., 2016.
However, understanding the eco-evolutionary dynamics of plankton will require far more information across the four dimensions of the world ocean. In addition, if the molecular ‘omics’ data bring a wealth of taxonomic and metabolic knowledge, they convey relatively poor information about the phenotypes, abundances, interactions, and behaviors at the organismal level, which are driving a large extent of plankton ecology and function (Martini et al., 2021). Today, it is critical to complement the ocean ‘omics’ layer of information with quantitative imaging data as it is classically performed in cell biology, and this should be done across relevant Spatio-temporal scales of the ocean system, from micro- to meso-, to planetary scales. Quantitative imaging methods allow monitoring of both the quantity and morphological diversity of plankton communities between a few μm to and a few mm in size Lombard et al., 2019, together with measures of the many environmental or anthropogenic factors Kautsky et al., 2016 shaping them. The few existing high-throughput, automated imaging instruments, such as the FlowCam (Sieracki et al., 1998) or the IFCB (Sosik and Olson, 2007), are expensive, bulky, and not suitable for large-scale community deployment. In the ‘Plankton Planet’ initiative (de Vargas et al., 2022), we propose to harness the creativity of researchers, mariners, and makers, to co-develop a suite of user-friendly and cost-effective tools for a cooperative, global, and long-term measure of microbial aquatic life. Frugal yet scientifically sound tools shared with a large community become an effective way to tackle the problem of the cost associated with classical oceanographic instruments and vessels. For example, the Foldscope (Cybulski et al., 2014), with over two million copies distributed in 164 countries around the world, has enabled a community of citizen microscopists to share their data and discoveries at a planetary scale (http://microcosmos.foldscope.com/). Plankton ecology would greatly benefit from a low-cost portable quantitative microscope that can be used directly at sea or on the shore by the vast community of mariners enjoying and/or living from the ocean.
Here, we used modularity - a natural way to make complexity manageable and accommodate uncertainty in the evolution of design (Efatmaneshnik and Ryan, 2016) - to construct the PlanktoScope, a miniaturized modular open-source imaging platform for quantitative imaging of micro-plankton that matches the quality of much larger and more expensive commercial instruments, for costs that are affordable for personal assembly and use. Even though we develop the canonical versions of the PlanktoScope for a global homogenous measure of plankton life, every module encapsulates a simple function allowing scientists and makers to adopt the platform for their needs. This strategy enables the device to be easily upgraded instead of replaced as a whole, providing a way to take on unforeseen future applications. We demonstrate the efficiency of the PlanktoScope in obtaining high-throughput imaging from both laboratory and field samples while enabling rapid reconfiguration to match the evolving needs of aquatic ecology. Since sharing PlanktoScope with community researchers, we have recorded more than 30+ replications of the instrument worldwide - demonstrating the replicability and scale-up of our approach driven by an organic community built on the collaboration of professional and amateur scientists.
2 Materials and Equipment
2.1 Designs of Two PlanktoScope Prototypes
To design the modular version of the PlanktoScope (v.1) made of six units that can be stacked on top of each other (Figures 1A–D), we used Autodesk Fusion 360 (v2.0.5688) to create a parametric design optimizing the physical interface common to all modules. Different parameters define the interface’s areas, such as the electronic connection area, the magnetic linkage, and the optical path. The thickness of the material and the outer dimensions of all the electronics used inside the instrument were critical to characterizing the interface. The shareable online 3D environment provided by Fusion 360 contains the main 3D model, together with other models that form the electronic and optical parts. Most of these models have been generated by measuring existing objects but some have been downloaded from the online GrabCad library (https://grabcad.com/). Once the different iterations of the 3D model were ready to be machined, the sketches were extracted as DXF files from Fusion 360 and nested in Adobe Illustrator CC (version 22.1) to fit the dimensions of the sheets of used material. The parts were then machined on a 3 mm thick acrylic sheet by a laser cutter machine (RS-1610L) with an optimal resolution of 25 μm, at the UBO Open Factory in Brest, France. These laser cutter instruments are common at universities as well as a growing worldwide network of maker/fabrication spaces. Such spaces often provide user access to machines after proper training, though work can often be commissioned for a few hundred dollars. All that is required is sharing of the file found on the PlanktoScope website. The assembly of v.1 was performed manually and took c.a. 8 hours. On the other hand, the monolithic version of the PlanktoScope (v.2) (Figure 1E) has been designed for fluidic-based, quantitative observations, and thus employs a much simpler assembly process. Its form factor and robustness allow it to be carried in a backpack for field trips without risking damage. Modularity remains in the objective lens that can be swapped magnetically as well as the Ibidi Luer Slide holder, while other components such as focus stages and electronics remain fixed. The PlanktoScope v.2 can be assembled in less than 4 hours.
Figure 1
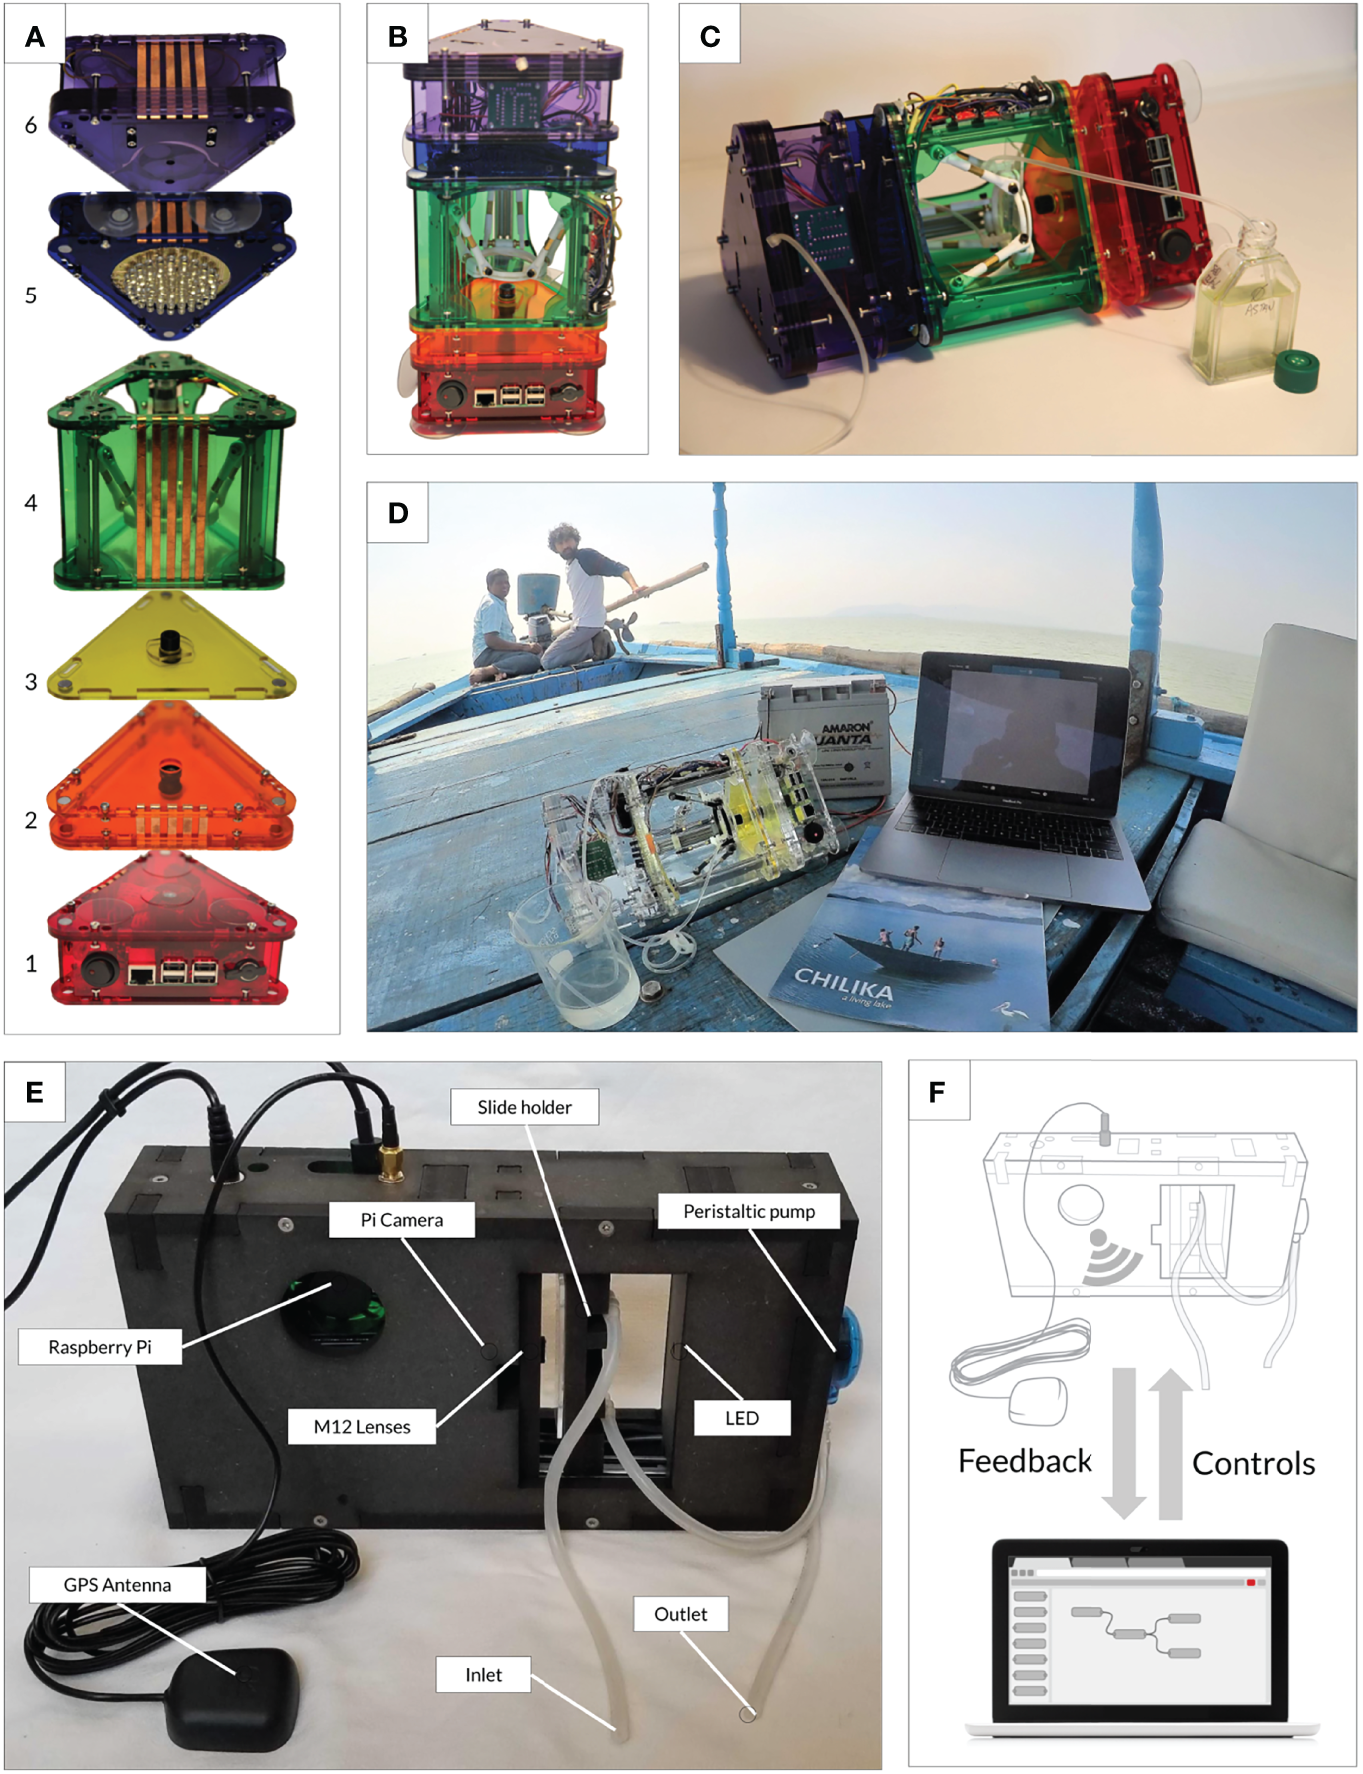
Comparison of the modular (v.1) and monolithic (v.2) PlanktoScope designs. (A) Modular stackable flow-through microscope design (bottom to top): Computational/imaging sensor (1), tube lens (2), objective lens (3), delta stage for sample manipulation and focus including flow cell mount (4), illumination (5), pump (6). The platform can be re-assembled and is held together by the alignment of fixed magnets. (B) The PlanktoScope v.1 can be used in vertical configuration for static imaging or (C) horizontal configuration for flow through imaging. (D) Deployment of the PlanktoScope v.1 on board a traditional fishing boat in lake Chilika (Orissa, India), operating autonomously on a 12V car battery. (E) Monolithic portable PlanktoScope v.2 with fixed flow-through configuration. (F) PlanktoScope is controlled via smartphone or laptop allowing real-time feedback during data collection and processing.
2.2 Content of the Modules
The bill of materials (BOM) to assemble a single PlanktoScope v.1 is about $200. The BOM for PlanktoScope v.2 is about $500 (Supplementary Material Table 1).
2.2.1 Flow-through Strategies
PlanktoScope v.1 is equipped with a peristaltic pump module (Figure 1A6) composed of a stack of 5 acrylic layers forming a closed chamber inside which 3 “rollers’’ can spin around the motor axis compressing a tube along the internal wall. The speed of the motor and the diameter of the compressed tube determine the flow rate which is about 3 ml/min at maximum speed. The compact PlanktoScope v.2 uses off-the-shelf peristaltic pumps for flow. Many are available in a 10mm x10mm form factor. Common 12V versions provide reliable flow rates of several ml/min. Several models can be easily incorporated by small modifications to the laser cut mount on the 3D model and connected to the other port of the Adafruit Stepper Motor HAT controlling the stage. In both designs, a continuous flow mode and a stop-flow mode can be used. In continuous mode, the peristaltic pump is continuously rotating at a low flow rate while the camera is taking images at a given frame rate. Since Pi Cameras are based on a rolling shutter, the imaged objects undergo a morphological deformation when imaged under continuous flow. In addition, peristaltic pumps have a pulsed flow which is difficult to characterize, making post-acquisition correction difficult. Planktoscope uses stop-flow, where rotation of the pump is stopped when each image is taken. The objects are thus stationary when imaged, canceling any morphological deformation due to flow or motion blur, thus allowing quantitative analysis. This enables a longer exposure, increasing the resolution and reducing the need for powerful illumination. This lower frame-rate strategy enables the capture of the full camera sensor for a larger field of view than via the continuous mode while maintaining high throughput. However, as the cost of high quality cameras continues to fall, we envision modifications with global shutter sensors or strobed illumination to further improve image acquisition.
2.2.2 Stage and Focus
The PlanktoScope v.1 includes a module combining the focusing and exploring functions (Figure 1A4). This linear delta design, used in some 3D printers, uses 3 vertical independent linear stepper motors that hold a platform, each with 2 arms. Each stepper is driven by an A4988 driver powered with 9V and controlled by a common Arduino mini pro present in the module. To control the location of the sample maintained by the platform, an inverse kinematic is necessary to transform an X/Y/Z desired displacement in a delta motion. Here, the code embedded in the Arduino was simplified to control the focus by moving the three stepper motors simultaneously. This Arduino has a defined I2C address allowing the Raspberry Pi to iteratively set a new focal position. The platform made of two separable magnetic bodies can host a broad range of sample holders: a slide, a petri dish, an optical chamber, or a flow cell. Focusing is made possible by controlling 3 independent drivers wired to simultaneously move the stepper motors up or down. The travel distance of the platform measures about 3.2cm with a step size of 0.15μm. This allows fine control of movement to accurately track and image micron-sized objects. For the price of about $30, this represents an affordable way to construct a motorized XYZ stage. In PlanktoScope v.2, the stage is actuated by two parallel synchronized Allegro linear stepper motors on only the Z-axis for changing focus. Both stepper motors are connected to the same port on the Adafruit Stepper Motor HAT. The flow-cell can be actuated for fine focus using 2 synchronous linear stepper motors offering a step size of 0.15μm on a travel distance measuring about 2.5cm on a single axis.
2.2.3 Illumination
In the PlanktoScope v.1, the illumination module is built of 5 concentric rings composed of 1, 6, 12, 24, and 32 white ultra-bright LEDs having a narrow-angle of 17°. The light intensity of each ring can be tuned separately to offer a broad range of illumination modes. Two main modes are (i) pure dark-field where the two external rings are used (Supplementary Material Figure 5A) and (ii) pure bright-field where the most central LEDs are used (Supplementary Material Figure 5B). In the following results, we opted to use the maximum light intensity of the central LED to maximize the depth of field in the flow cell. The compact PlanktoScope uses a single ultra-bright LED at a constant intensity with a narrow angle of 15° enabling bright-field illumination and providing a nearly collimated light source. This achieves a large depth of field for imaging plankton communities with a large size variance. This single white LED (5 mm LTW2S - 17000 mcd) is connected to the stepper board and can be toggled in the user interface.
2.2.4 Optical Modules
The optical train is defined by two inverted S-mount lenses (M12 lenses) that are both encapsulated in different detachable modules. The two modules have been designed to enable a rapid change of each M12 lens used as a couple. The alignment is set by the insertion holes cut and positioned by the laser cutter machine. The distances of the M12 lenses to each other and the sensor are defined by rotating the M12 lenses in the holes tapped using an M12x0.5 hand thread tap from Thorlabs. This optical train remains the same on both versions of the PlanktoScope.
2.2.5 Power, Computational, and Sensor Modules
The PlanktoScope v.1 is directly powered through one multi-functional module dedicated to the computation and sensor (Figure 1A1). It receives 12V either by a regular AC power adapter for lab experiments or a battery for field deployment. A custom BUS made of 6 electronic wires dedicated to power the other modules provide 12V, 5V, and Ground wires. The three other wires consist of the I2C, SDA, SCL, and a dedicated Ground enabling the exchange of data between the different modules. The camera sensor is a Pi Camera v2.1 embedded in the module. It is positioned facing up to collect the image coming from above. Under this module the user on one side of the PlanktoScope are 3 suction cups allowing the user to fix the instrument on flat surfaces and improve its vertical and horizontal stability for field experiments (e.g., inside a boat). The PlanktoScope v.2 utilizes the USB-C connector of the Raspberry Pi 4 to power itself, and the Pi HAT (Yahboom Cooling Fan HAT) is mounted on top of it to cool the Raspberry Pi and provide operational feedback to the user via 3 RGB LEDs. A ribbon cable connects the Raspberry Pi/Fan HAT to two other HATs, an Adafruit Stepper Motor HAT and the Adafruit Ultimate GPS HAT. The Stepper Motor HAT is powered via a DC Power Jack Socket to 12V 1A power. The GPS HAT uses an antenna allowing for a better GPS signal when in the field. Note that in this design, the entire GPIO of the Raspberry becomes the BUS and connects the Raspberry Pi to other physical modules that can be changed, replaced, or upgraded.
2.3 User/machine Interface and Software Architecture
By utilizing the headless configuration for the Raspberry Pi, we removed the need for a dedicated monitor, mouse, and keyboard, enabling control of the instrument from any device able to access a web browser over a WiFi connection (Figure 1F). This strategy enables any user to immediately interact with the device without OS or software compatibility issues. The user can then access a browser-based dashboard powered by Node-RED for remote control of the system; acquisition settings, interactive collection of the metadata, as well as rapid state modification of the actuators.
The software architecture (Supplementary Material Figure 3) is based on existing programs and python libraries, such as Node-RED (https://nodered.org/) for the Graphical User Interface and the first layer of the programming interface, MorphoCut (https://github.com/morphocut/morphocut) for handling the image processing from the raw images to the online platform, and EcoTaxa (https://ecotaxa.obs-vlfr.fr/) for plankton images classification and annotation.
The back-end of the GUI is also based on Node-RED, a flow-based development tool for visual programming which is provided by default on any Raspberry Pi software suite. Node-RED provides a web browser-based flow editor, which can be used to create JavaScript-based applications. Elements of applications can be saved or shared for re-use. The strategy makes it more accessible to those with limited experience in scripting. This visually modifiable program can easily be shared through a JavaScript Object Notation (.json) text file.
3 Methods
3.1 Image Workflow and Image Processing
3.1.1 Image Workflow Performed with the PlanktoScope V.1
For the first batch of acquisitions (Figures 4.1–4.6, 5, and Supplementary Material Figures 5A, B, 6), the optical configuration was a 16 mm focal length for the tube lens and a 12 mm focal length for the objective lens. The sensor mode was set to 1080p and the field of view (FOV) was then measured at 2,880 μm wide and 1,620 μm high. The flow cell used was a rectangle-shaped borosilicate glass capillary (VitroTubes), 5000 µm wide, 500 μm deep internally, and 5 cm long. The volume imaged in one frame is about 2.3 μL. Since the capillary width is larger than the FOV width, the whole volume passed in the capillary is about 4 μL per imaged frame (= FOV height * Cell width * Cell depth). The acquisition was done using a frame-rate set at 8 frames/second, which corresponds to a volume of 1.12 ml imaged per minute. We took 2000 frames per sample, at 5 minutes total, the volume imaged was 5.6 mL per sample. The image processing workflow for this batch was a custom pipeline. Using Numpy, we realized for each frame an average image from 20 frames around the considered frame (10 frames before and 10 frames after) and we subtracted this average image to the current frame using OpenCV. The cleaned frames are then processed with basic Dilation/Closing/Erosion operations in OpenCV. The binary image obtained served to detect the objects in each frame and extract the region of interest along with simple measured features provided by OpenCV such as equivalent diameter, Euler number, extent, area, filled area, major axis length, minor axis length, orientation, perimeter, and solidity. From all the segmented objects, we manually selected the objects most likely to correspond to living organisms to avoid terrigenous sediment abundant in the explored coastal sites. The current segmentation pipeline performed on the instrument is broad pertaining to objects of interest, though parameters for segmentation can be modified in the code depending on the needs of the user. Raw images can also be easily transferred and processed with any custom pipeline off the machine.
3.1.2 Image Workflow Performed with the PlanktoScope V.2
For the second batch of acquisitions (Figures 2, 3, 4.7 and Supplementary Material Figures 5C–E), the optical configuration was made using 25mm for the tube lens and 16 mm for the objective lens. The sensor mode was set to full sensor (3280 × 2464 pixels) and the field of view measured 2 300 μm wide and 1 730 μm high. In the v.2 version, the sensor is rotated 90° in comparison to the version v.1. For the camera sensor reference, the direction of the flow is from right to left rather than top to bottom. For this optical configuration and a flow cell with a channel height of 200 μm, the volume imaged in one frame is about 0.8 μL (= FOV width * FOV height * FlowCell depth). The acquisition for both versions was done using a stop flow method which consists of stopping the pump flow and then the flow when acquiring an image. The frame rate is about 1 frame/second, which corresponds to a volume of ~48 μL imaged per minute. The sample was passed through a filter (Überstrainer, PluriSelect inc.) to remove large objects that can clog the capillaries. The image processing workflow for this batch was done using MorphoCut and Ecotaxa as described in 3.1.3 below. For the acquisition shown in Figure 3, the extracted vignettes uploaded into Ecotaxa can be consulted with all their associated metadata @: https://ecotaxa.obs-vlfr.fr/prj/2748.
Figure 2
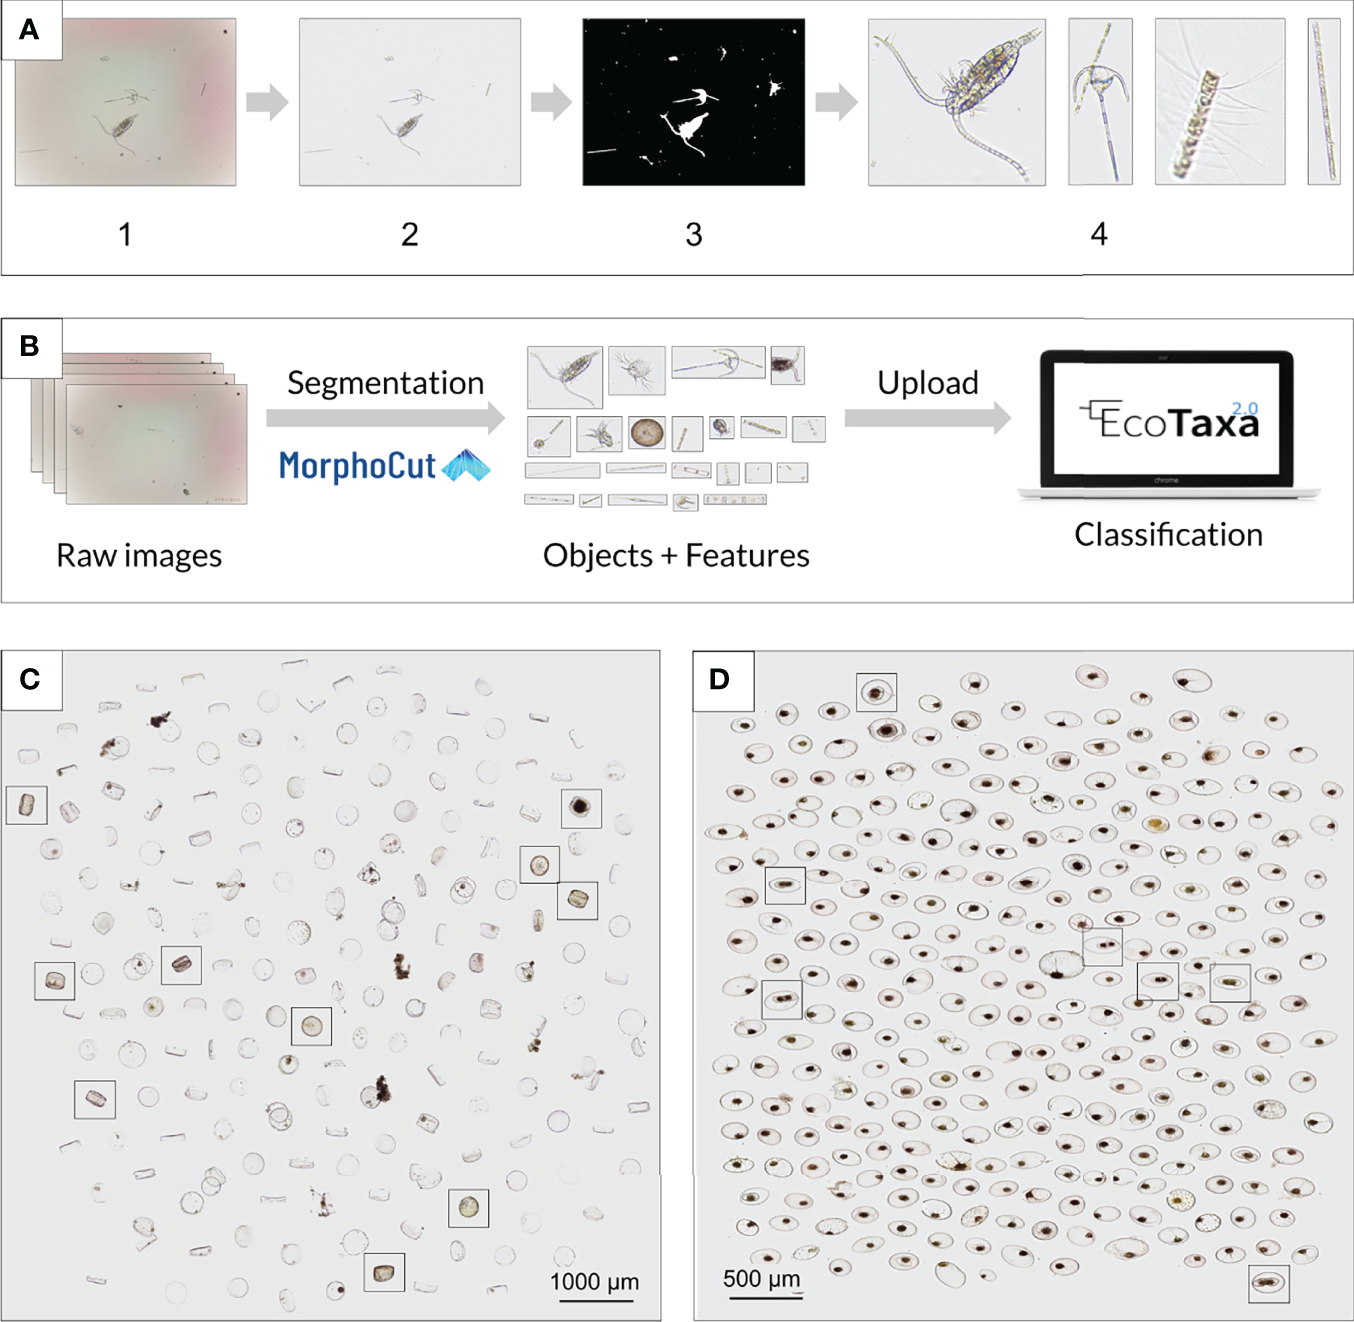
Image processing pipeline for fluidic analysis. (A) Workflow used to segment the objects imaged in a single frame and extract features. From the raw images (1) acquired in fluidic mode, MorphoCut applies a running median to approximate the background image (2) based on 5 frames; using OpenCV, a Canny Edge Detection is performed, followed by dilation, closing, and erosion functions (3); from the binary image, MorphoCut extracts the vignette/ROI for each object (4), together with a suite of mathematical image descriptors. (B) The Raw images and segments from MorphoCut along with the objects and a table containing all the measured features/metadata can then be directly uploaded on EcoTaxa for classification. (C) and (D) Non-destructive continuous monitoring of lab cultures using a PlanktoScope allows for cell morphology to be observed at single-cell resolution. (C)Coscinodiscus wailesii cultures were monitored over a period of 6 hours. Simple montages allow the user to easily quantify living or dead cells at different time points. (D)Pyrocystis noctiluca cultures were monitored over a period of 6 hours during their night-to-day transition. Dividing cells are easily identifiable.
Figure 3
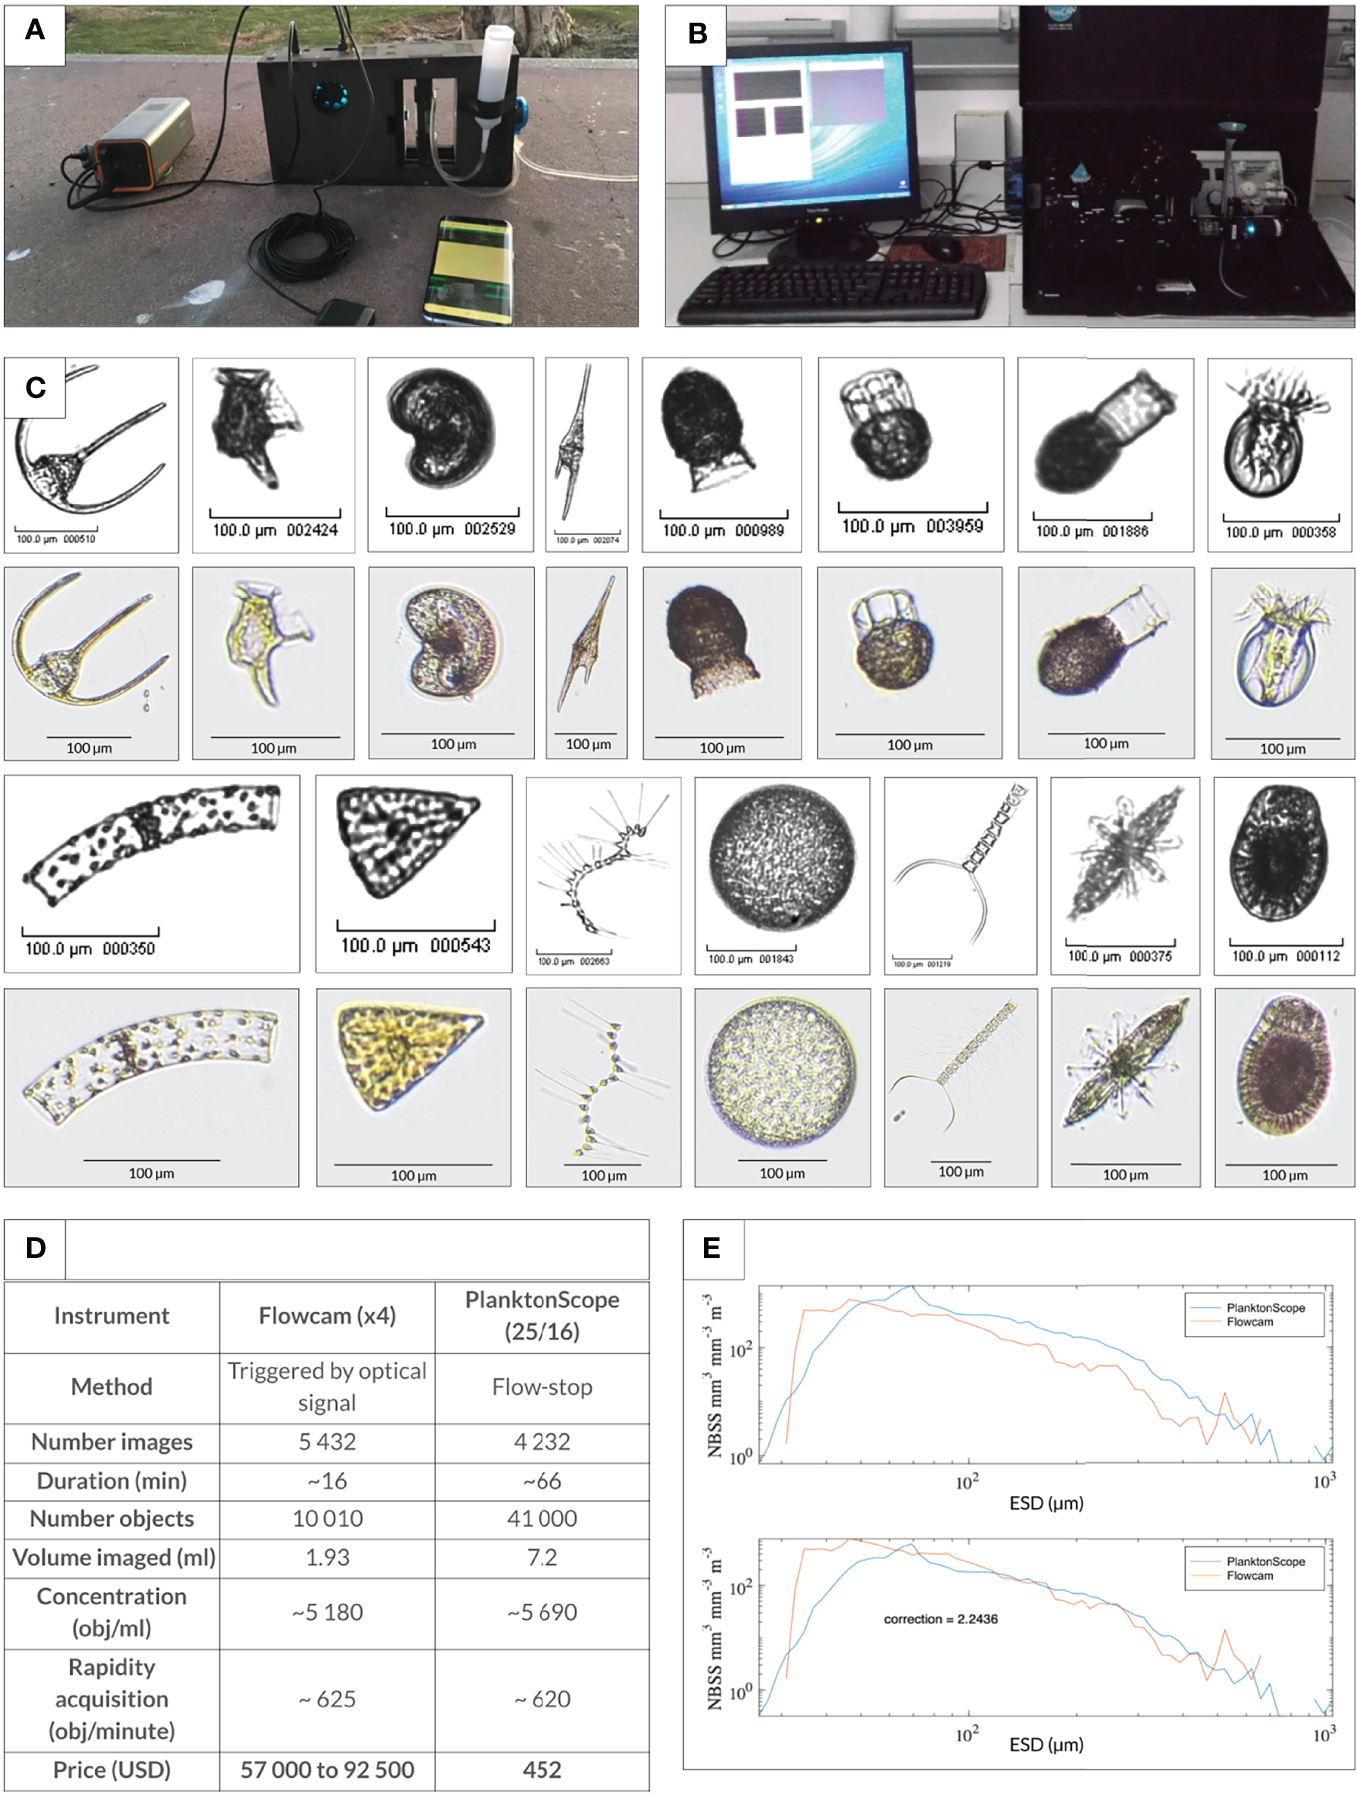
One-to-one comparison of PlanktoScope with the Flowcam. (A) Ultra-portable configuration of the PlanktoScope operated on a cell phone charger and controlled through a user interface on a smartphone. (B) Typical setup of a FlowCam on a laboratory bench. (C) One-to-one comparison of the same sample (plankton tow, Villefranche/Mer, France) passed through a PlanktoScope and Flowcam (version Benchtop B2 Series). Representative images were chosen from the two data sets (monochromatic images, Flowcam; color images, PlanktoScope) - first row from left to right: Ceratium spp., Dinophysis caudata, Peridiniales spp., Ceratium furca, Codonaria spp., Dictyocysta spp., Codonellopsis spp., Undellidae spp. Second row from left to right: Guinardia spp., Licmophora spp., Asterionellopsis spp., Coscinodiscophyceae spp., Chaetoceros spp., Acantharea, unknown sp. (D) Table comparing efficiencies for both trigger-based optical image collection (Flowcam) and flow-stop based wide field of view imaging and computational segmentation (PlanktoScope). When normalized for the total number of objects detected, PlanktoScope performed equally well compared to FlowCam. (E) Comparison of total planktonic organisms (objects) sampled with different collection methods and analyzed with different optical/imaging methods as a function of the size of organisms (expressed as equivalent spherical diameter; ESD). Total organism biovolume per size class was expressed as Normalized Biovolume Size Spectra (NBSS) by dividing the total biovolume within a size class by the biovolume interval of the considered size class. NBSS is representative of the number of organisms within a size class. The same plankton net sample was run through a Flowcam and a PlanktoScope v.2. All data are raw counts and converted to biovolume using ellipsoidal calculations. The low count at the smaller size range of each observation corresponds to an underestimation of an object’s number due to both the limited capabilities of each imaging device for small objects and net under sampling for small objects utilizing the plankton tow.
3.1.3 Image Processing
The raw images are stored on the Pi after collection and can be automatically processed on the Planktoscope by MorphoCut, a python-based library designed to handle large volumes of imaging data (https://github.com/morphocut/morphocut). Several operations are applied to the raw images (Figure 2A1) acquired in fluidic mode. MorphoCut first applies a running median to approximate the background image (Figure 2A2) based on 5 frames, a Canny Edge Detection via OpenCV is performed, followed by dilation, closing, and erosion functions (Figure 2A3) also from OpenCV. From the binary image, MorphoCut extracts the region of interest (ROI) for each present object (Figure 2A4). MorphoCut then extracts, using Scikit-image (van der Walt et al., 2014) 32 keys mathematical image descriptors. Each ROI is then stored, along with contextual metadata defined by the user on the Graphical User Interface (GUI). This way, large data sets can be compressed at sea by storing only relevant ROIs and data tables. Finally, all data outputs are zipped in a compressed file and formatted for being imported to the EcoTaxa server (Figure 2B). Ecotaxa is a web-interfaced database, which combines supervised machine learning with collaborative visual inspections/classification by taxonomy experts to classify and assign taxonomy to plankton from environmental plankton image datasets. This creates a uniform data format already utilized by plankton researchers worldwide.
3.2 Optical Characterization
Since the optical configuration is made of two reversed M12 lenses, serving respectively as objective lens and tube lens, we choose five different M12 lenses (Table 1) based on their compatibility with the chosen camera sensor (Pi Camera v2.1, Sony IMX219, 8MP, sensor area 3.68x2.76mm imaging area, pixel size 1.12x1.12um). As changing the focal length of each lens changes the effective magnification of the image projected on the sensor, we wished to see how each combination enables exploration of objects spanning different size ranges. Pairing and characterization of lens pairs with different effective focal lengths (f) were performed to establish the actual resolution experimentally. We tested the optical performance of each 25 possible configurations by imaging the USAF 1951 resolution test chart. The illumination was set to use only the central LED which represents an illumination existing in both versions. The PiCamera was set to take a picture with 1080p corresponding to a 1920 x 1080px frame. For each optical configuration, a ruler was imaged to calculate, via FiJi which is a “batteries-included” distribution of ImageJ (Broeke et al., 2015), the actual size of the field of view from which we can deduce the optical magnification for each pair of M12 lenses. The lateral resolution of each optical configuration was then calculated from the size of the field of view and the width in pixels of the image. The pixel size was deduced from the optical magnification. We found the combination of tube lens with f25mm, and objective lens f16mm provides a large field of view, good depth of focus, and ability to resolve a wide range of planktonic organisms.
Table 1
| Size of the field of view width x height (mm) | f-number of the objective lens | |||||
|---|---|---|---|---|---|---|
| 6 | 8 | 12 | 16 | 25 | ||
| f-number of the tube lens | ||||||
| 6 | 6.36 x 3.58 | 4.79 x 2.69 | 3.25 x 1.83 | 2.50 x 1.41 | 1.56 x 0.88 | |
| 8 | 8.31 x 4.68 | 6.44 x 3.62 | 4.27 x 2.40 | 3.32 x 1.87 | 2.06 x 1.16 | |
| 12 | 12.25 x 6.89 | 9.37 x 5.27 | 6.36 x 3.58 | 4.92 x 2.77 | 3.07 x 1.73 | |
| 16 | 15.62 x 8.79 | 11.69 x 6.58 | 7.90 x 4.44 | 6.19 x 3.48 | 3.90 x 2.19 | |
| 25 | 25.00 x 14.06 | 18.68 x 10.51 | 14.41 x 6.98 | 9.80 x 5.51 | 6.09 x 3.43 | |
M12 Lens matrix.
To calculate resolution with a 1951 USAF Resolution Target, we found the smallest separable groups and elements for each image of the Resolution Target taken under all the 25 optical configurations. To document the optical characteristics, we calculated the resolution in lp/mm using the following equation (“Edmund Optic” n.d.):
To convert lp/mm to microns (μm), simply take the reciprocal of the lp/mm resolution value and multiply by 1000:
3.2.1 PlanktoScope Benchmarking
We benchmarked the PlanktoScope by comparing it to the FlowCam (Sieracki et al., 1998) using identical plankton samples. Microplankton samples were collected from subsurface coastal waters in January 2020 in Villefranche Sur Mer, France, by towing a 20µm mesh size plankton net from a kayak. The samples were immediately brought back to the laboratory, split into equal parts after gentle mixing, and imaged alive on both the PlanktoScope v.2 and a Flowcam configured with similar magnification (Figures 3A, B). For Flowcam acquisition, a model Benchtop B2 Series equipped with a 4X lens was used. Prior to image acquisition, the sample was passed through a 200µm filter (Überstrainer, PluriSelect inc.) to remove large objects that can clog the capillaries. Samples were imaged on auto-trigger mode (no fluorescence trigger) by passing the sample through a 300µm width glass capillary. Raw images were recorded and processed through ZooProcess according to standardized procedures (Gorsky et al., 2010). Manuals for Flowcam use, including the methodology used, Zooprocess, and Ecotaxa are available at https://sites.google.com/view/piqv. The extracted vignettes were uploaded to ecotaxa and can be consulted with all their associated metadata @: https://ecotaxa.obs-vlfr.fr/prj/2740. For both instruments, the total abundance of organisms, as well as normalized biovolume size, Normalized Biomass Size Spectra (NB-SS) (Platt and Denman 1977) were calculated to evaluate their respective capacity to count and size plankton biodiversity. Both instruments provided enough resolution to allow quantitative taxonomic classification of plankton samples down to the genus, and often species level (Figure 3C). Furthermore, the similar NB-SS spectra generated (Figure 3E) indicate comparable capacities to measure and count planktonic populations.
3.2.2 Plankton Sampling
The v.1 has been deployed at seven locations representing different ecosystems throughout the planet. The same sampling protocol (except for the Comau Fjord and Palo Alto Baylands Nature Preserve, see below) was performed using a 20 μm mesh plankton net with a diameter of 30 cm, and a 10-minute surface tow at 2 knots. The samples were filtered with a 500 μm mesh sieve to remove larger particles. In Comau Fjord we used a horizontal water sampler from LaMotte (CODE 1087) to sample the vertical distribution of micro-plankton from 0-10 meters below the water’s surface. From the 1,200 mL samples collected for every depth, we conserved 15ml and imaged 5.6ml via 2000 frames. The salinity at every depth was measured using a hand refractometer from Atago. For the Palo Alto Baylands Nature Preserve, since the site is shallow and quite turbid, the sample was collected directly using a 50mL falcon tube from the subsurface and also filtered using the 500 μm mesh sieve. All samples were collected during the daytime.
The v.2 was first used in a lab context to realize testing on morphological diversity of cultured Pyrocystis noctiluca (LB 2504) and Coscinodiscus wailesii (CCMP2513) strains (Figure 2). Samples were passed directly in the instrument without preliminary concentration. To remove aggregated cells, we placed a mesh filter (Überstrainer, PluriSelect inc.) in between the culture and the field of view. For Pyrocystis noctiluca, we used a mesh filter of 200 μm and a µ-Slide I Luer with a channel height of 200 μm. For Coscinodiscus wailesii, we used a mesh filter of 500 μm and a µ-Slide I Luer with a channel height of 600 μm. We further tested the v.2 at Villefranche-sur-Mer, France, using plankton samples collected in front of the marine station by towing a 20 μm mesh, 30 cm diameter plankton net for 10 minutes from a kayak.
4 Result
4.1 An Open, Modular, and Miniaturized Imaging Platform for Plankton Ecology
The PlanktoScope was developed in two configurations: v.1, a modular, compartmentalized configuration maximizing multi-functionality and adaptability, and v.2, a compact version designed for rapid assembly, portability, and standardization. Both versions achieve an optical magnification of 1.3X and a pixel size of 0.9μm/px. The travel distance of the specimen stage is about 3.2cm with a step size of 0.15μm to comply with a large range of lens working distances and sample mounting strategies. For a framerate of 8 frames per second and a 500μm thick flow cell, we can image a volume at 0.1ml/min. The components are off-the-shelf and readily accessible from numerous vendors at a low cost to enable replication. The corresponding open-software strategy utilizes existing libraries for image processing and a flow-based visual programming platform to allow users to rapidly customize acquisition and processing steps. Image segmentation can be toggled for automatic processing after an acquisition sequence, allowing the user to efficiently inspect objects extracted from large volumes, even at low abundance.
The fully modular PlanktoScope v.1 is based on six triangular units (Figure 1A), each being a separate functional layer that couple together through shared optical and electronic paths: 1) a single board computer coupled to its camera sensor, 2-3) two reversed M12 lenses (an objective lens and a tube lens) separated in two modules, 4) a motorized stage and focus delta platform for sample manipulations, 5) independent programmable rings of LEDs for sample illumination, and 6) a peristaltic pump. The modules are connected mechanically, electronically, and optically, enabling simple re-configuration (Figure 1B). The instrument can be used either in the lab (Figure 1C) or in the field (Figure 1D). The compact Planktoscope v.2 (Figure 1E) is a simplification of the platform focusing on robust, flow-through plankton image acquisition in potentially rough field conditions, e.g., sailing boats. A single-board computer controlling a focus actuator holding the flow cell, a single LED for bright-field illumination, a peristaltic pump, and a GPS are all connected through stable electrical wiring.
Both designs use a laser-cut framework and are parametric, enabling the use of different thicknesses of the chosen material. These range from acrylic and recycled plastic, to wood, metal, or fiberboard. This machining strategy allows rapid design iteration and enables a precise yet flexible low-cost method for aligning and spacing optical components.
In the modular PlanktoScope v.1, three magnets are incorporated into the corners of the interface between modules (Figure 1A) enabling both proper alignment of the six units and quick reconfiguration. The microscope can be used in vertical or horizontal configurations, placed upright or inverted, depending on the need or constraints of the experimenter. For example, a vertical mode enables manual exploration of a static sample that can be placed on a glass slide, flow-cell, petri dish, or optical chambers (Figure 1B). The delta stage enables tracking of an organism with high precision or a quick survey of the sample holder area. A horizontal mode allows automated, continuous imaging of liquid samples passing through the flow cell at a predefined rate (Figure 1C). On the other hand, the compact, flow-through PlanktoScope v.2 uses a minimal structure to position and align the components, to increase robustness and stability for field deployment or in-situ installation. Modularity is still maintained by allowing the lenses and flow-cell to be quickly interchanged. While the modular version requires 10 h for the machining, soldering, and assembly, the compact version drastically reduces the build complexity enabling a complete machining/assembly in less than 4 h.
Both prototypes are based on a Raspberry Pi single-board computer that controls the electronics, acquires and processes the images, and serves as the user/machine interface (Figure 1F). The magnetic coupling of the modular PlanktoScope enables electronic connectivity through the contact of copper ribbons that connect each module at their interface to form a custom BUS for Inter-Integrated Circuit (I2C) connection and power. The different independent microcontrollers, here Arduinos, receive queries as actuators and send logs as sensors back to the Raspberry Pi. The compact version utilizes Pi HATs (Hardware Attached on Top) for both assembling and deploying code. The Pi HATs enable the rapid addition of numerous off-the-shelf specialized boards. Three HATs are utilized to serve different functions: one for cooling the CPU of the Raspberry Pi and providing visual feedback, one for controlling the focus stage and the pump, and a third HAT supporting a GPS for geolocalization of the images. Thanks to the massive community built around Raspberry Pi, hundreds of other possibilities exist for new modules and more functions built on top of this platform. Both instruments can be powered through either standard wall Alternative Current (AC) power or from battery cells for field deployment (Figure 5A). For an acquisition frequency of 0.5 Hz and a standard Lithium-ion or polymer battery of 20,000 mAh, the compact version can collect continuously for more than 8 hours.
Both versions of the PlanktoScope utilize a Raspberry Pi camera sensor. The Pi Camera V2.1 uses a Sony sensor with a still resolution of 8Mp, and a sensor imaging area of 3.68 x 2.76mm for $25. The $40 HQ Pi camera with an imaging area of 6.287mm x 4.712 mm and a 12Mp resolution can easily be incorporated. We used the high-performance and frugal lenses in a compact form factor ‘M12’ (corresponding to the metric tapping dimension) for magnification, building upon existing successful strategies for constructing low-cost microscopes (Switz et al., 2014). Two M12 lenses were conjugated to construct a reconfigurable solution to project the image of a microscopic object to a camera sensor. By using different focal lengths for both lenses, measuring the size of the field of view, and calculating the resolution of each combination, we obtained a comparative matrix of 25 different optical configurations from low (0.3X) to high (4X) magnification (Supplementary Material Figure 5C). These offer a pixel size from 4.5µm to 0.3µm (Supplementary Material Figure 5D) and a measured resolution from 15.6µm to 1.9µm (Supplementary Material Figure 5E). Since each version allows magnetic swapping of both lenses, all the described optical configurations are readily interchangeable.
4.2 Proof of Concept in Both Laboratory and Field Conditions
4.2.1 Monitoring and Phenotyping Lab Cultures
The PlanktoScope is designed with rapid adaptability in mind, so it can be transported quickly from designated use in the field to controlled data collection in a laboratory setting. We used the continuous flow mode to image monocultures of unicellular eukaryotes and benchmark the PlanktoScope’s ability to function as a lab culture monitoring system. First, a culture of the diatom Coscinodiscus wailesii was passed through the system to monitor viability over time. Processed images provided straightforward classification and quantification of dead and living cells (Figure 2C). Second, the large transparent dinoflagellate Pyrocystis noctiluca, an organism that exhibits morphological changes linked to circadian cycles (Seo and Lawrence, 2000), was imaged in flow mode across the day-to-night transition. We could observe various cell morphologies (Figure 2D), including cell-cycle states, and built a diagram of temporal phenotypes. As circadian clocks function as major drivers of behavior in most marine life (Seo and Lawrence, 2001), such controlled continuous monitoring is a source of informative, non-invasive, and easily accessible information on any cultured strain, providing valuable morphological, physiological, and behavioral data to improve culture and experimental conditions.
4.2.2 Field Plankton Ecology
The PlanktoScope platform has been primarily designed for field deployment by both experienced and citizen scientists. It is ultra-portable and battery-powered (Figure 3A), able to be transported and used for the duration of a cruise or deployed in the field with the use of a dedicated power supply. We tested the PlanktoScope’s robustness, simplicity of use, and capability to acquire high-quality and reproducible data during seven field trips worldwide (Figure 4A). By generating panels of the most frequently extracted objects (Figures 4.1–4.7), we show how the instrument can rapidly provide qualitative plankton biodiversity surveys of any water body.
Figure 4
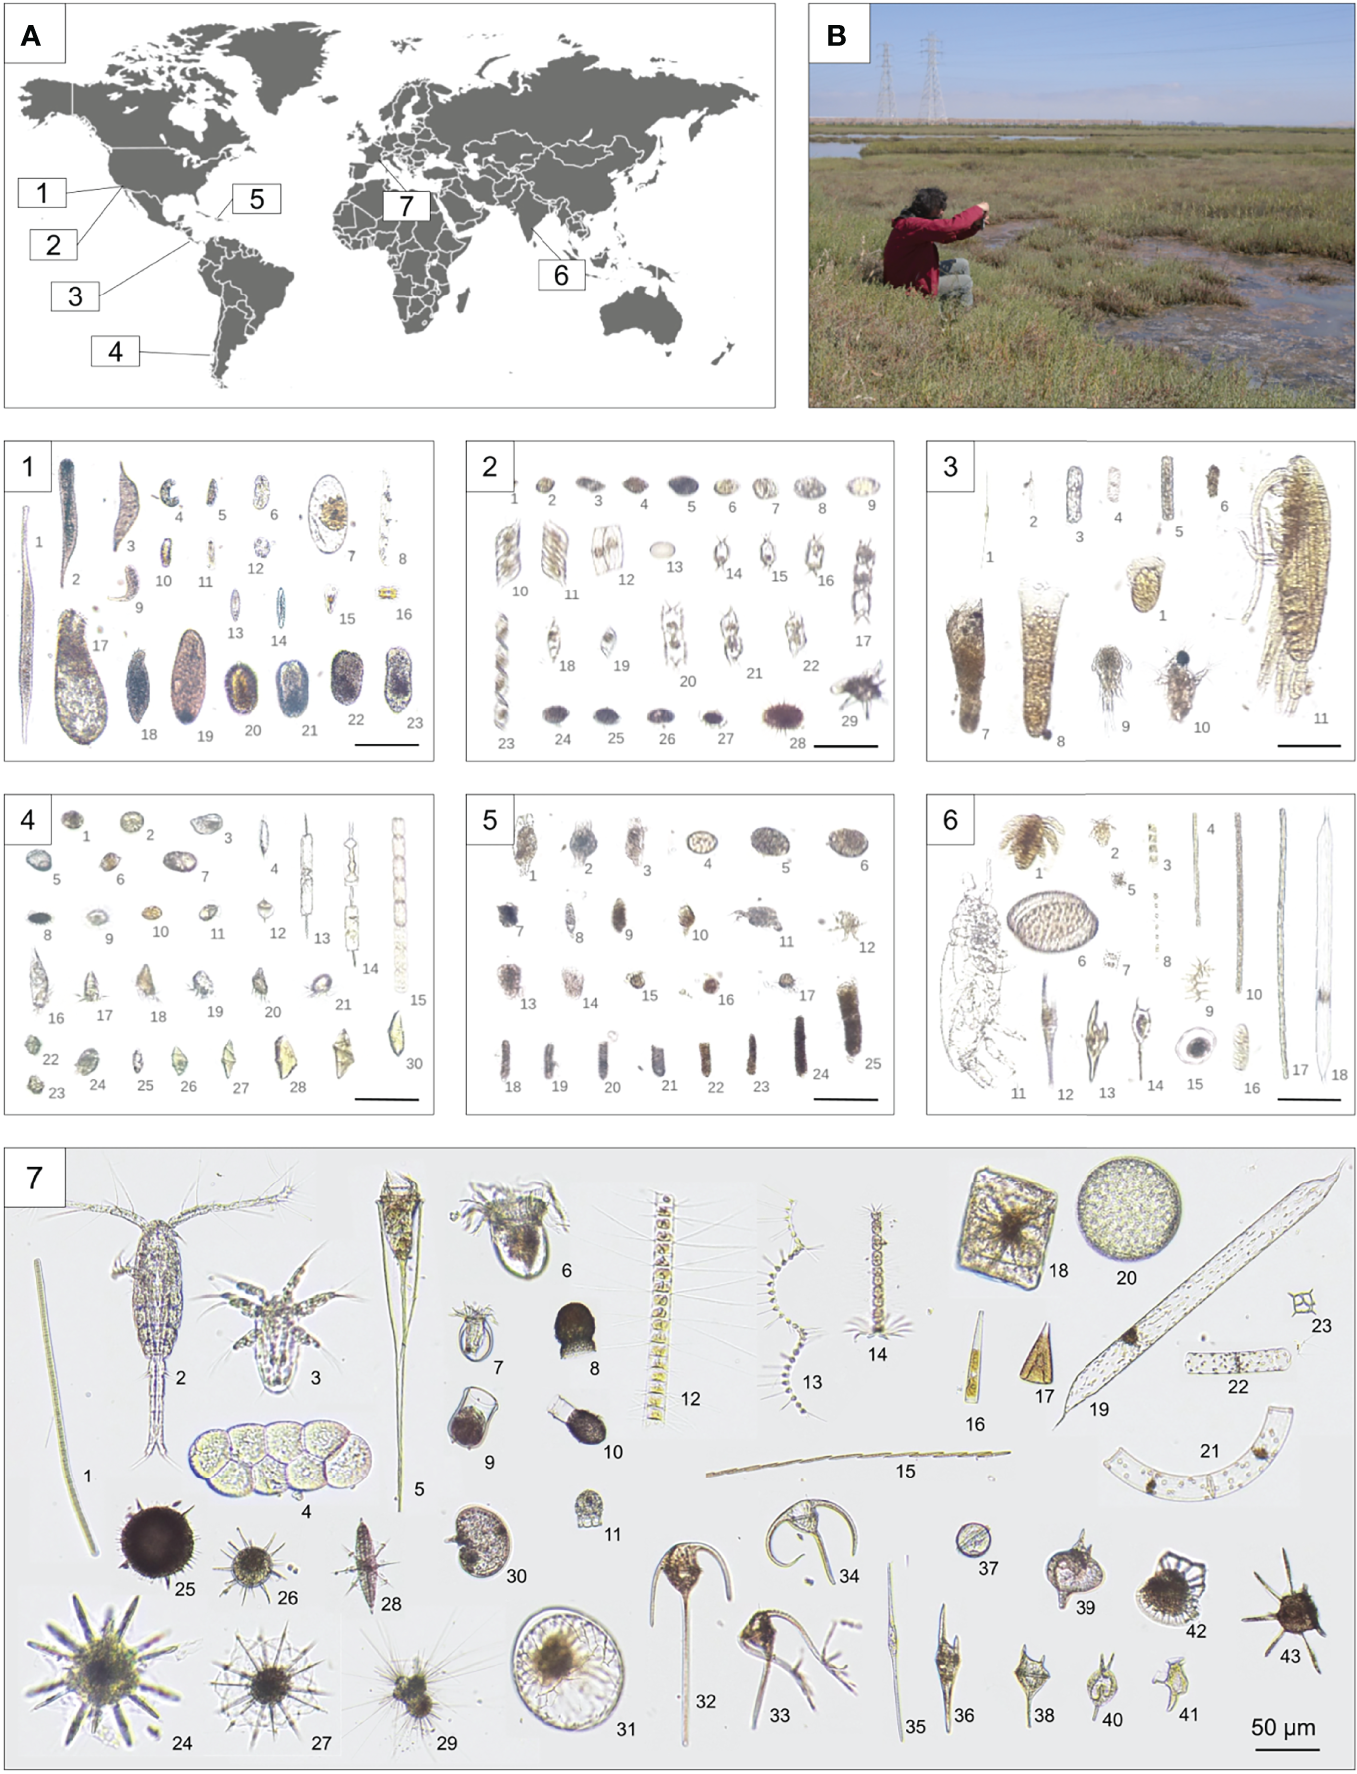
Testing of PlanktoScope at seven field sites around the world (A), with sampling and imaging done directly in the field (B) for most samples. Composite montages were made to display the objects identified with the highest frequency in each ecosystem, creating a visual representation of local biodiversity. (1) Palo Alto Baylands Nature Preserve (USA) - 1: Tracheloraphis, 2: Tracheloraphis, 3, 6, 9, 10, 18–23: Ciliate, 4: Unidentified, 5: Pennate diatom, 7: Pyrocystis sp., 8: Gyrosigma sp., 11: Pennate diatom, 12: Unidentified, 13: Pennate diatom, 14: Navicula sp., 15: Unidentified, 16: Amphiprora gigantea, 17: Enchelyodon. (2)Monterey Bay (USA) – 1–9: Unidentified, 10–12: Pennate diatom, 13: Centric diatom, 14–17, 20–22: Odontella longicruris, 18, 19, 23: Unidentified diatom, 24–26: Armored dinoflagellate (Protoperidinium)?, 27, 28: Unidentified Dinoflagellate, 29: Ornithocercus. (3) Isla Secas (Panama) - 1: Nitzschia longissima, 2, 3, 5, 8: Unidentified, 4: Centric diatom, 6: Copepod fecal pellet, 7: Ciliate, 9: Copepod, 10: Crustacean larvae, 11: Calanoid copepod. (4) Comau Fjord (Chile) – 1–6: Unidentified, 7: Unarmored dinoflagellate, 8, 9: Unidentified Dinoflagellate (resting cyst), 10: Prorocentrum compressum, 11: Dinophysis sp., 12: Protoperidinium sp., 13, 14: Ditylum brightwellii, 15: Detonula pumila, 16–21: Ciliate, 22–24: Lepidodinium chlorophorum, 25–30: Gyrodinium sp. (5) Isla Magueyes (Puerto-Rico) - 1: Copepod larva, 2: Nauplius larva, 3, 8: Chaetoceros sp., 4, 10, 17: Oscillatoria sp., 5, 7: Eucampia zodiacus, 6: Coscinodiscus sp., 9: Unidentified, 11: Calanoid copepod, 12: Ceratium furca, 13: Ceratium sp., 14: Ceratium lineatum, 15: Pyrocystis sp., 16: Unidentified, 18: Proboscia alata. (6)Chilika Lake (India) – 1–10, 13-24: Unidentified, 11: Crustacean larva, 12: Nauplius larva, 25: Ciliate. (7) Villefranche/Mer (France) - 1: Trichodesmium, 2: Copepoda, 3: Nauplii, 4: Egg, 5: Rhabdonella, 6: Cyttarocylis, 7: Undellidae, 8: Codonaria, 9: Ciliophora, 10: Codonellopsis, 11: Dictyocysta, 12: Chaetoceros, 13: Asterionellopsis, 14: Bacteriastrum, 15: Pennate chain, 16, 17: Licmophora, 18: Striatella, 19: Rhizosolenia, 20: Coscinodiscophyceae, 21: Bacillariophyceae, 22: Guinardia, 23: Dictyochophyceae, 24: Acantharea, 25, 26: Rhizaria, 27, 28: Acantharea, 29: Foraminifera, 30: Peridinales, 31: Pyrocystis, 32, 34: Neoceratium, 33: Neoceratium ranipes, 35: Neoceratium fusus, 36: Neoceratium furca, 37: Dinophyceae, 38: Neoceratium pentagonum, 39, 40: Protoperidinium, 41: Dinophysis caudata, 42: Ornithocercus quadratus, 43: Ceratocorys.
We next leveraged the PlanktoScope’s portability combined with a quantitative sampling strategy to tackle an ecological question in a Patagonian fjord. The Comau Fjord in southern Chile receives 5 m of rain per year per square meter, with numerous freshwater rivers and streams feeding into the saltwater bay. This provokes a vertical salinity gradient that evolves seasonally with sporadic weather led events such as wind and rain (Buskey and Hyatt, 2006; León-Muñoz et al., 2018). In April 2019, a typical vertical stratified salinity gradient was visible, with the salinity gradually increasing from 25‰ at the surface to a plateau of 32‰ below the pycnocline at a 5-meter depth (Figure 5A). The PlanktoScope was used to investigate whether this salinity gradient corresponded to stratified planktonic communities. We observed a > 10-fold increase in the number of images in the meter of saline water immediately beneath the pycnocline. This number falls off around 9 m below the surface, or around 4 meters below the pycnocline (Figure 5A). We then attempted to extract geometrical characteristics from that dataset that could be ecologically informative. By measuring the ratio between the maximal and minimal length of detected objects (i.e., the aspect ratio, quantifying elongation) across plankton size fractions and depth (Figure 5A), we observed a relation between the increasing number of detected objects and their aspect ratio. Most of the detected objects collected below the pycnocline and with an equivalent diameter between 36μm and 64μm had an aspect ratio of around 4, indicating the presence of a large population of elongated objects. By further exploring the vertical stratification of objects within the size fraction 53μm to 55μm, where the aspect ratio is on average about 5.9 at 6 meters, we found many elongated plankton (Figures 5B, C). This is consistent with previous observations that organisms living at depth in higher nutrient concentrations favor elongated morphologies with a higher aspect ratio [(Colin) Reynolds, 1988; Bauer et al., 2013; Ryabov et al., 2020]. Mining visual data and combining morphological attributes such as these with geochemical measurements can help better describe the regional microbial ecology.
Figure 5
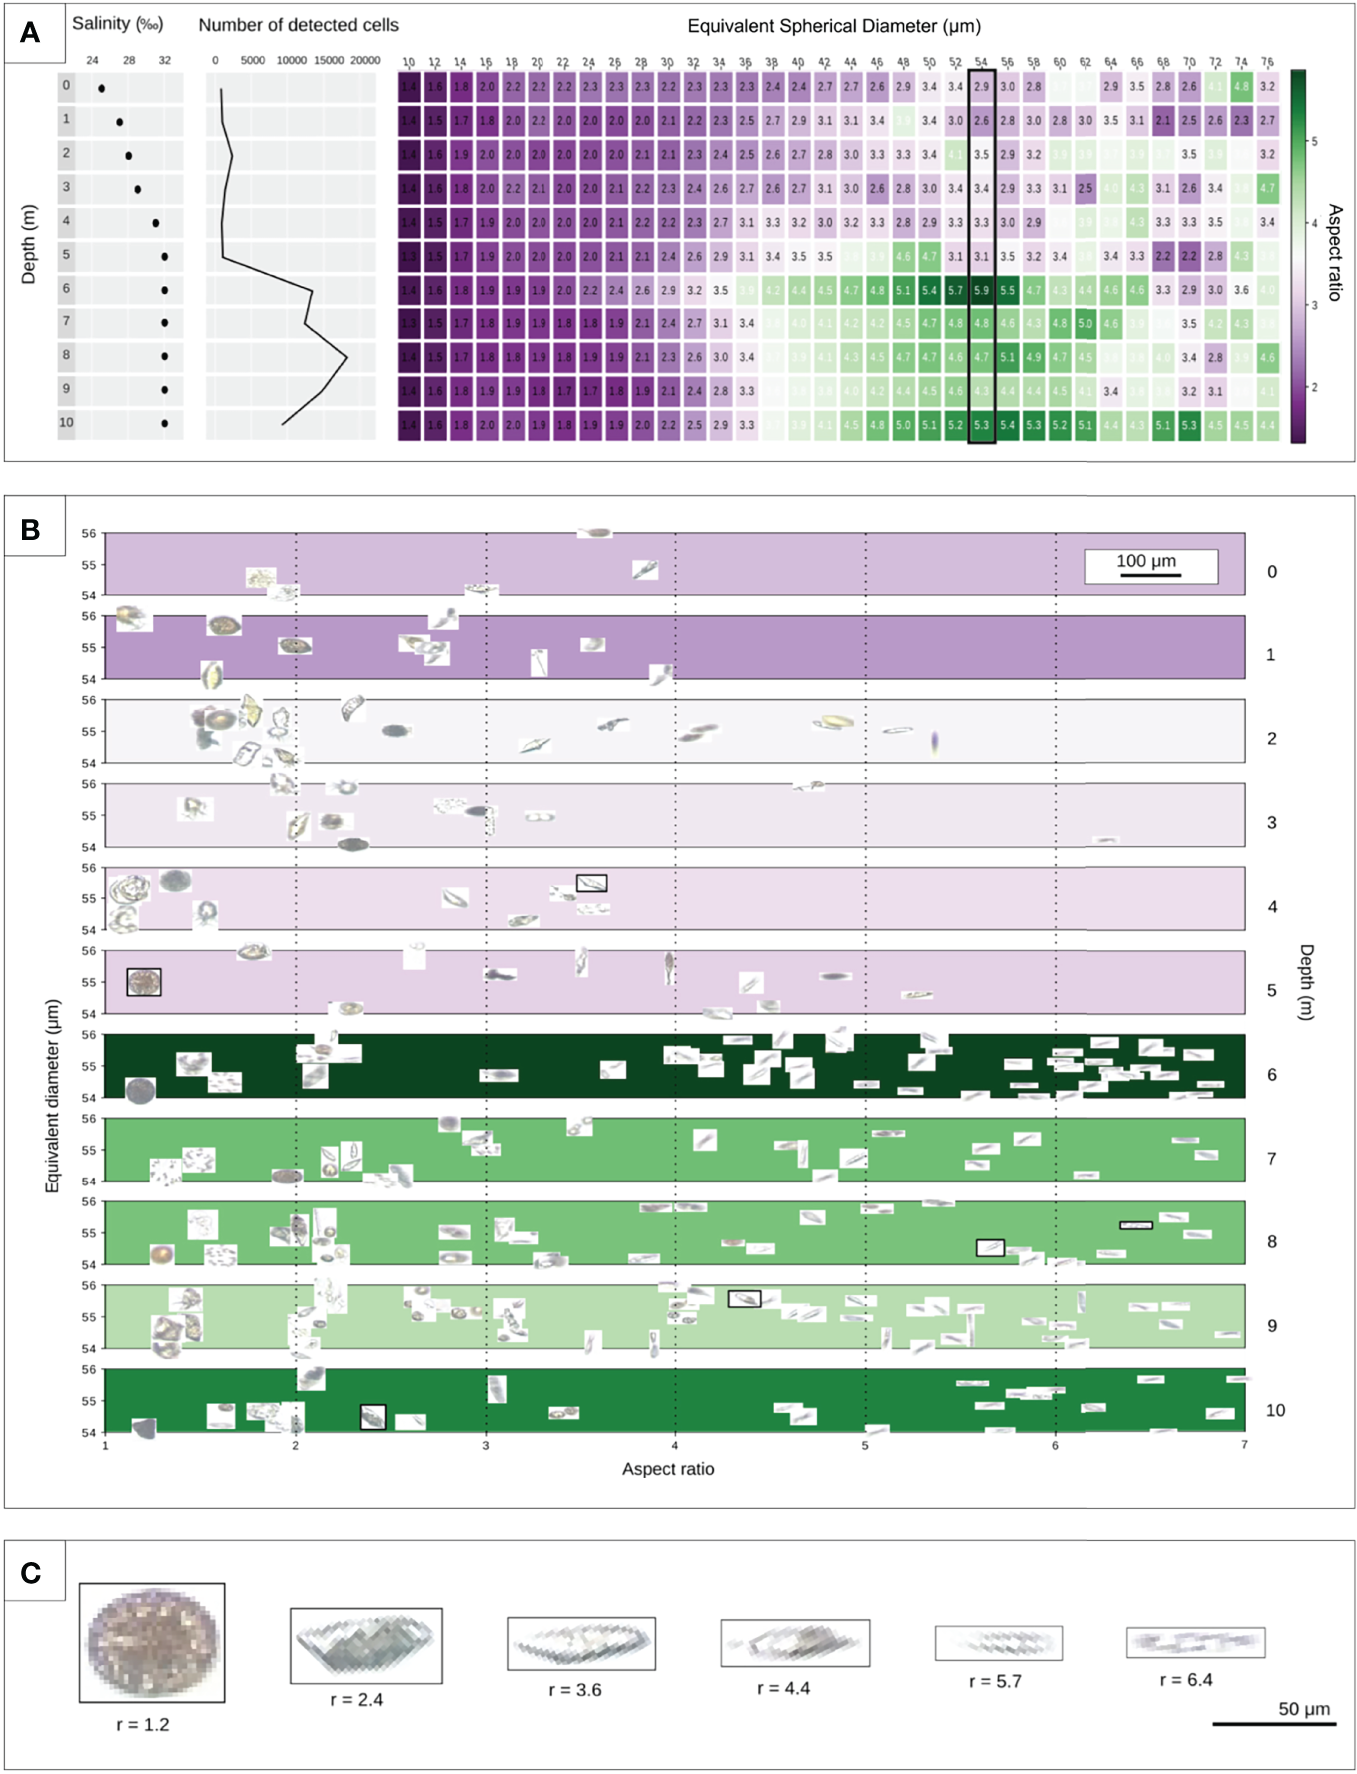
PlanktoScope assessment of micro-plankton biodiversity along a vertical gradient in a Chilean fjord. (A) The extreme salinity gradient was measured in the Patagonian Comau fjord. Using sampling at discrete depths and the PlanktoScope, we attempted to describe correlations between salinity and plankton abundance/morphology across depths. Samples were collected with a Niskin bottle at different depths and imaged under a PlanktoScope. The plot depicts a vertical snapshot of an ecosystem from 0m (surface water) to 10m (depth) with the number of identified objects and equivalent diameter (10 to 76 μm) as a function of depth (0 to 10m). The measurement of the elongation per equivalent diameter is based on 94,262 objects detected in total. Color bar represents the aspect ratio from purple (small aspect ratio) to green (large aspect ratio). (B) Display of distribution of objects with a mean size of 54 μm as a function of aspect ratio, equivalent diameter, and depths (0 to 10m). (C) Illustration of objects with a gradual aspect ratio from 1.2 to 6.4 marked in (B).
5 Conclusion and Perspective
The basis of the largest ecosystem on Earth, the Ocean, lies within the planktonic organisms invisible to the naked eye. Today, we need to magnify not only this hidden world but also our approach. An unfortunate but common reality that limits long-term surveys of planktonic communities is the high cost and erratic funding situations associated with marine research. The significant resources involved in maintaining oceanographic vessels and instruments often cripple the ability to fund studies through time, and even more in low to middle-income countries. As 40% of the world’s population lives along coastlines, monitoring these ecosystems remains incredibly important. There are still relatively few long-term time or spatial series that visually document planktonic ecosystems, and a clear tendency to quantify biodiversity and associated ecosystem services using costly and complex protocols based on high-throughput DNA sequencing. These same metagenomic studies have unveiled the massive biodiversity of micro-eukaryotes (de Vargas et al., 2015) with mostly unknown functions Carradec et al., 2018 in planktonic ecosystems. These organisms, essentially protists, are often more complex than metazoans in terms of cell structures, symbiotic interactions, and behavior Gavelis et al., 2015, (Vincent et al., 2018), properties that cannot readily be inferred from genomic data Keeling, 2019. To quantify and understand the role of micro-eukaryotic complexity in ecosystem functions, it is critical to develop instruments allowing their high-throughput imaging worldwide.
The PlanktoScope is a low cost, versatile, and high-resolution digital microscope designed to enable professional and citizen scientists to perform large scale surveys of planktonic life. We have demonstrated here its capacity to monitor morphology and physiology of eukaryotic cells in culture, or to quantify fundamental features of micro-plankton communities in a coastal water column directly in the field in Chile, a country where single blooms have created losses of over 800 million dollars locally, leading to major public health crisis (Mardones et al., 2021). Further demonstration of the PlanktoScope v.2’s efficiency for quantitative imaging is presented in the same issue (Mériguet et al., this issue), showing how the PlanktoScope and Flowcam provided comparable data while sampling along a basin-scale transect of the Tara schooner from Lorient (Britanny, France) to Punta Arenas (Chile). The current version of the PlanktoScope is limited in the plankton size range (50-200µm) it can recognize and quantify, however its fundamental modularity and relative simplicity make it possible to implement future new modules to analyze smaller or larger plankton.
The foundation of PlanktoScope lies in the principles of open-source hardware and software, combined with an open yet cohesive community of engineers, makers, researchers, and citizens in daily contact with sea-water (i.e., seatizen of the ‘Plankton Planet’ initiative, see de Vargas et al., 2022). Current trends in affordable electronics and distributed manufacturing, together with computer vision and automated image processing, make it possible to put instruments’ manufacturing and data collection in the hands of thousands of users across the planet. Therefore, we have also launched web tools to share, develop, and replicate the PlanktoScope globally. Instructions to order and/or manufacture the different components and assemble them into a functional instrument are available @ www.planktoscope.org. The PlanktoScope community shares experiences, technical advice, and ideas for new developments @Slack (https://www.planktoscope.org/join). Between May 2020 and Dec 2021, over 286 individuals representing a large spectrum of activities from 28 countries (Figure 6C) have engaged in this community. While the canonical version(s) of the PlanktoScope are being and will be developed and deployed for global standard measures plankton life by the Plankton Planet team (see de Vargas et al., 2022), we know of at least 32 functional instruments replicated, and sometimes modified, by colleagues around the world (Figure 6).
Figure 6
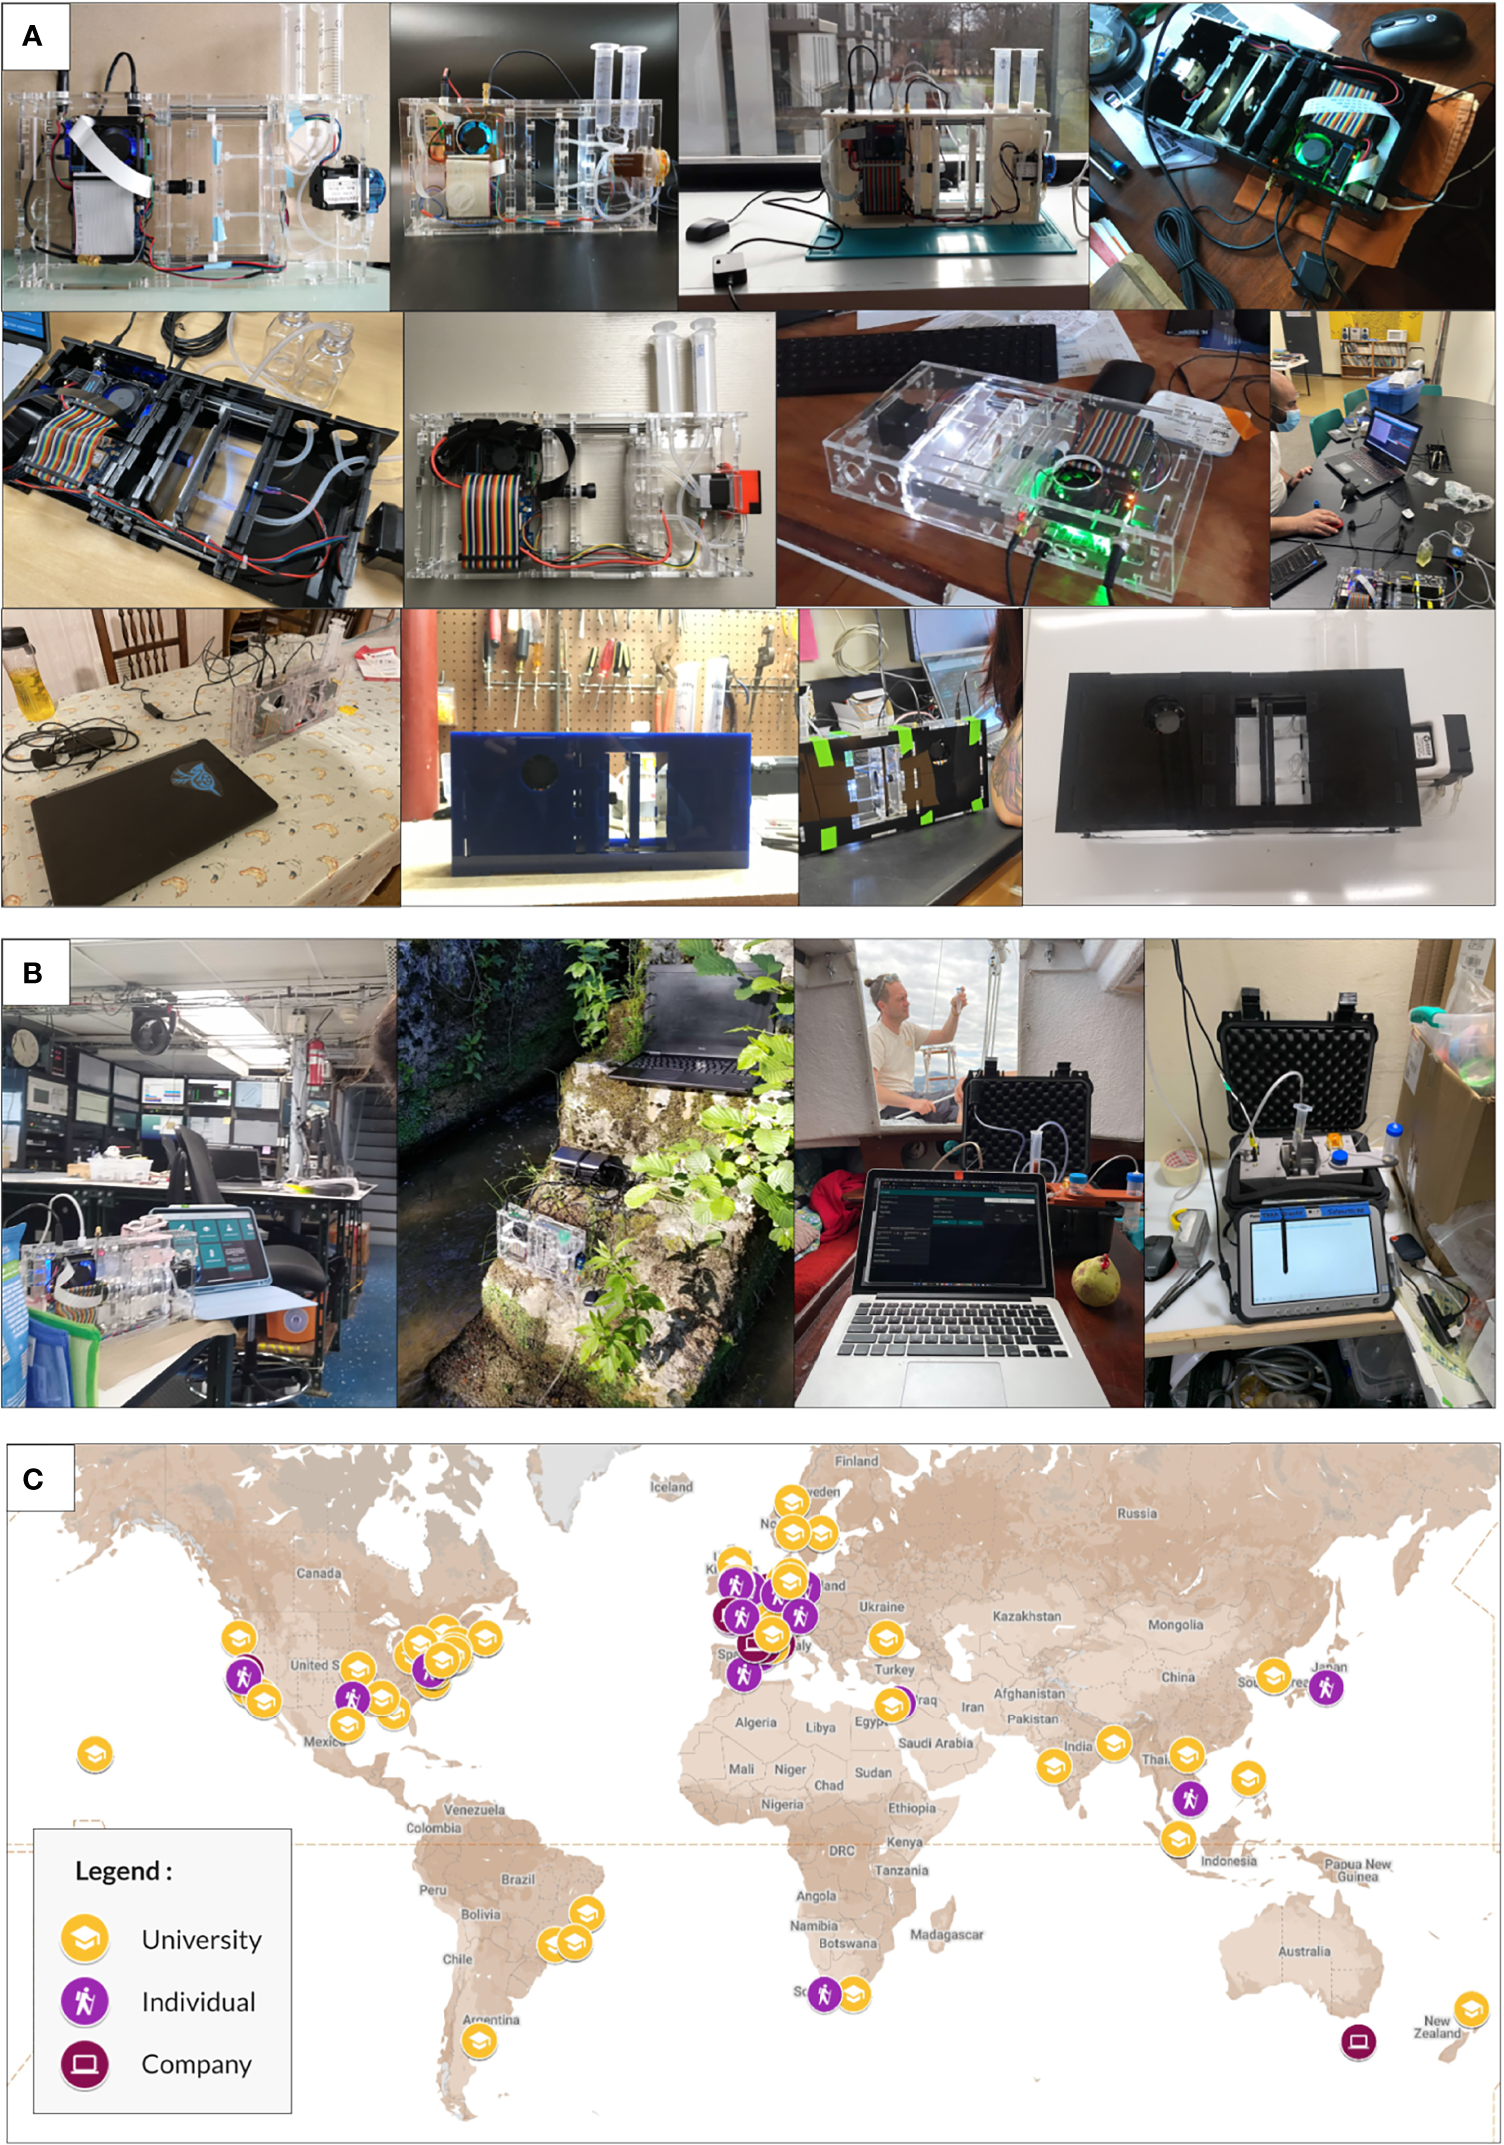
Documenting community replication of the Planktoscope. (A) Images of Planktoscopes built and implemented by the community from 2020-2021. First row (left to right), built by: Salima Rafai, Laboratoire Interdisciplinaire de Physique, CNRS - Université Grenoble Alpes; Guillaume Le Guen. Konk Ar Lab, Le Temps des Sciences and Saint Brieuc Factory; Ana Fernandez Carrera, Biological Oceanography, Leibniz Institute for Baltic Sea Research Warnemünde (IOW); Dyche Mullins, Mullins Lab, University of California - Second row (left to right): Andrian Gajigan, School of Ocean and Earth Science and Technology, the University of Hawaii at Manoa; Bronwyn Lira Dyson, Experimental Limnology, Leibniz Institute of Freshwater Ecology and Inland Fisheries (IGB); Guillaume Bourdin, School of Marine Sciences, University of Maine; PlanktoSquad, Dalhousie University - Third row (left to right): Stewart Plaistow, Institute of Integrative Biology, University of Liverpool; Alex Barth, Department of Biological Sciences, University of South Carolina; Macci Wigginton, Ocean & Earth Sciences, Old Dominion University; Yefim Radomyselskiy, Department of Physics, City University of New York - Queens College. (B) Field deployments of the Planktoscope by community members. From left to right: v.2 on a NSF science-cruise in 2021; v.2 by a river bed in Northwest France; v.2.5 onboard Tara during a cross Atlantic cruise (see Mériguet et al. this issue); v2.5 on a small sailboat off the coast of Southeast France. (C) Planktoscope community across the world as of December 2021.
Deploying a high-throughput frugal microscope platform on a global scale will bring light to the habitats under-surveyed by the large and more infrequent research cruises. Connecting these platforms with a network of climate researchers, ecologists, citizen scientists, and many others across the planet will bring further relevance to each individual measurement and build global capacity to explore our microscopic world. Since cost remains one of the key barriers to engagement in science, we intend to use “frugal science” to greatly enhance affordable approaches to scientific inquiry.
Funding
This work was initially funded by the ‘Plankton Arts’ grant from the Fondation d’Entreprise Total to CV and MP. Additional funding came from the Simons Foundation (AL), the Schmidt Futures, Moore Foundation, NSF Center for Cellular Construction (NSF STC award DBI 1548297), CZ BioHub, and HHMI-Gates Faculty Fellows Program (MP), the New Zealand Royal Society Strategic Seeding Fund (16-CAW-008-CSG), the Institut Universitaire de France (FL), and the French Government “Investissements d’Avenir” program OCEANOMICS (ANR-11-BTBR- 0008) (CV, SC) and EMBRC-France (ANR-10-INBS-02).
Publisher’s Note
All claims expressed in this article are solely those of the authors and do not necessarily represent those of their affiliated organizations, or those of the publisher, the editors and the reviewers. Any product that may be evaluated in this article, or claim that may be made by its manufacturer, is not guaranteed or endorsed by the publisher.
Statements
Data availability statement
The datasets presented in this study can be found in online repositories. The names of the repository/repositories and accession number(s) can be found in the article/Supplementary Material.
Author contributions
TP: design of the PlanktoScopes hardware, work on the software, data analysis, community building and management, wrote the initial draft of the manuscript. AL: sample acquisition, data analysis, community building and management, wrote the initial draft of the manuscript FL: planktoscope development and testing (both hardware and software), data analysis and interpretation, field work. HL: hardware development and help with project conception. DG: hardware development. SC: study design, hardware development CV: conception and supervision of the work, provided initial funding, wrote the manuscript. MP: conception, design, and supervision of the work, field work, data analysis, provided supplementary funding All authors revised and edited the manuscript, and approved the final version sent for publication.
Acknowledgments
We acknowledge all members of PrakashLab and Plankton Planet core team, as well as Romain Bazile, Anna Oddone, Simon-Martin Schröder, Daniel Elnatan, B.B. Cael, Rainer Kiko, Marie Walde, Guillaume Bourdin, Aurélie Labarre, and Flora Vincent for insightful comments and suggestions throughout this work. We thank members of the EMBRC platform PIQv for image analysis, as well as Jorge Mardones, Lara Zamora (IFOP, Chile), and Gurudeep Rastogi (Wetland Research and Training Center, Chilika Development Authority) for support during field testing in Chile and on the lake Chilika. This article is contribution number 2 of Plankton Planet.
Conflict of interest
The authors declare that the research was conducted in the absence of any commercial or financial relationships that could be construed as a potential conflict of interest.
Supplementary material
The Supplementary Material for this article can be found online at: https://www.frontiersin.org/articles/10.3389/fmars.2022.949428/full#supplementary-material
References
1
(Colin) Reynolds C. S. (1988). Functional Morphology and the Adaptive Strategies of Freshwater Phytoplankton. Cambridge Univ. Press. United Kingdom. 442 pp
2
Bauer B. Sommer U. Ursula G. (2013). High Predictability of Spring Phytoplankton Biomass in Mesocosms at the Species, Functional Group and Community Level. Freshw. Biol. 58 (3), p588–596. doi: 10.1111/j.1365-2427.2012.02780.x
3
Broeke J. Perez J. M. M. Javier P. (2015). Image Processing With ImageJ ( Packt Publishing Ltd). United Kingdom.
4
Buskey E. J. Hyatt C. J. (2006). Use of the FlowCAM for Semi-Automated Recognition and Enumeration of Red Tide Cells (Karenia Brevis) in Natural Plankton Samples. Harmful Algae. 5 (6), p685–692. doi: 10.1016/j.hal.2006.02.003
5
Carradec Q. Pelletier E. Da Silva C. Alberti A. Seeleuthner Y. Blanc-Mathieu R. et al . (2018). A Global Ocean Atlas of Eukaryotic Genes. Nat. Commun.9 (1), 373. doi: 10.1038/s41467-017-02342-1
6
Chaffron S. Delage E. Budinich M. Vintache D. Henry N. Nef C. et al . (2021). Environmental Vulnerability of the Global Ocean Epipelagic Plankton Community Interactome. Sci. Advances August. 7 (35), peabg1921. doi: 10.1126/sciadv.abg1921
7
Cybulski J. S. Clements J. Manu Prakash , (2014). Foldscope: Origami-Based Paper Microscope. PLoS One9 (6), e98781. doi: 10.1371/journal.pone.0098781
8
de Vargas C. Audic S. Henry N. Decelle J. Mahé F. Logares R. et al . (2015). Eukaryotic Plankton Diversity in the Sunlit Ocean.Science348, 6237. 1261605.
9
de Vargas C. Le Bescot N. Pollina T. Henry N. Romac S. Colin S. et al . (2022) Plankton Planet: a frugal, cooperative measure of aquatic life at the planetary scale. Frontiers.
10
Duarte C. M. (2015). Seafaring in the 21St Century: The Malaspina 2010 Circumnavigation Expedition. Limnology Oceanography Bull. 24, 11–14. doi: 10.1002/lob.10008
11
Edmund Optic Exploring 1951 USAF Resolution Targets. Available at: https://www.edmundoptics.fr/knowledge-center/application-notes/testing-and-detection/choosing-the-correct-test-target/ (Accessed July 20, 2020). ldquo][rdquon.d.
12
Efatmaneshnik M. Ryan M. j. (2016). On Optimal Modularity for System Construction. Complexity. 21 (5), 176–189. doi: 10.1002/cplx.21646
13
Fenchel T. (1988). Marine Plankton Food Chains. Annu. Rev. Ecol. Systematics. 1, 19–38. doi: 10.1146/annurev.ecolsys.19.1.19
14
Field C. B. (1998). Primary Production of the Biosphere: Integrating Terrestrial and Oceanic Components. Science. 281 (5374), p237–240. doi: 10.1126/science.281.5374.237
15
Gavelis G. S. Hayakawa S. White R. A. 3rd Gojobori T. Suttle C. A. Keeling P. J. et al . (2015). Eye-Like Ocelloids Are Built From Different Endosymbiotically Acquired Components. Nature523 (7559), 204–207.
16
Gorsky G. Ohman M. D. Picheral M. Gasparini S. Stemmann L. Romagnan J.-B. et al . (2010). Digital Zooplankton Image Analysis Using the ZooScan Integrated System. J. Plankton Res. 32 (3), 285–303. doi: 10.1093/plankt/fbp124
17
Guidi L. Chaffron S. Lucie B. Damien E. Abdelhalim L. Simon R. et al . (2016). Plankton Networks Driving Carbon Export in the Oligotrophic Ocean. Nature532 (7600), 465–470.
18
Henson S. A. Sanders R. Esben M. (2012). Global Patterns in Efficiency of Particulate Organic Carbon Export and Transfer to the Deep Ocean. Global Biogeochemical Cycles. 26 (1), pGB1028. doi: 10.1029/2011gb004099
19
Karsenti E. Acinas S. G. Bork P. Bowler C. De Vargas C. Raes J. et al . (2011). A Holistic Approach to Marine Eco-Systems Biology. PLoS Biol.9 (10), e1001177.
20
Kautsky U. Saetre P. Berglund S. Jaeschke B. Nordén S. Brandefelt J. et al . (2016). The Impact of Low and Intermediate-Level Radioactive Waste on Humans and the Environment Over the Next One Hundred Thousand Years. J. Environ. Radioactivity151 Pt 2, 395–403.
21
Keeling P. J. (2019). Combining Morphology, Behaviour, and Genomics to Understand the Evolution and Ecology of Microbial Eukaryotes. Philos. Trans. R. Soc. London. Ser. B Biol. Sci.374 (1786), 20190085. doi: 10.1098/rstb.2019.0085
22
León-Muñoz J. Urbina M. A. Garreaud René Iriarte JoséL. (2018). Hydroclimatic Conditions Trigger Record Harmful Algal Bloom in Western Patagonia (Summer 2016). Sci. Rep.8 (1), 1330.
23
Lombard F. Boss E. Anya M. Meike W. Uitz V. J. Stemmann L. Sosik H. M. et al . (2019). Globally Consistent Quantitative Observations of Planktonic Ecosystems. Front. Mar. Sci.6. doi: 10.3389/fmars.2019.00196
24
Mardones J. I. Paredes J. Godoy M. Suarez R. Norambuena L. Vargas V. et al . (2021). Disentangling the Environmental Processes Responsible for the World’s Largest Farmed Fish-Killing Harmful Algal Bloom: Chile 2016. Sci. Total Environ.766,144383. doi: 10.1016/j.scitotenv.2020.144383
25
Martini S. Larras F. Boyé A. Faure E. Aberle N. Archambault P. et al . (2021). "Functional Trait‐based Approaches as A Common Framework for Aquatic Ecologists". Limno. Oceanog.66 (3),965–994.
26
Ruuskanen M. O. Sommeria‐Klein G. Havulinna A. S. Niiranen T. J. Lahti L. (2021). "Modelling Spatial Patterns in Host‐Associated Microbial Communities". Environ. Microbiol.23, (5), 2374–2388.
27
Ryabov A. Kerimoglu O. Litchman E. Olenina I. Roselli L. Basset A. et al . (2020). Shape Matters: The Relationship Between Cell Geometry and Diversity in Phytoplankton. Biorxiv. 24 (4), p 847–861. doi: 10.1101/2020.02.06.937219
28
Seo K. S. Lawrence F. (2000). "Cell Ultrastructural Changes Correlate with Circadian Rhythms in Pyrocystis Lunula (Pyrrophyta)". J. Phycology36 (2), 351–358.
29
Seo K. S. Lawrence F. (2001). "Evidence for Sexual Reproduction in the Marine Dinoflagellates, Pyrocystis Noctiluca and Pyrocystis Lunula (Dinophyta)." J. Phycology37.4, 530–535.
30
Sieracki C. K. Sieracki M. E. Yentsch C. S. (1998) "An Imaging-in-Flow System for Automated Analysis of Marine Microplankton". Mar. Ecol.Progress Series 168, 285-296.
31
Sosik H. M. Olson R. J. (2007). Automated Taxonomic Classification of Phytoplankton Sampled With Imaging ‐ in ‐Flow Cytometry.Limno. Ocean.Methods5 (6), 204–216.
32
Sunagawa S. Coelho L. P. Chaffron S. Kultima J. R. Labadie K. Salazar G. et al (2015). Structure and Function of the Global Ocean Microbiome.Science348 (6237), 1261359.
33
Sunagawa S. Acinas S. G. Bork P. Bowler C. Eveillard D. Gorsky G. et al (2020). Tara Oceans: Towards Global Ocean Ecosystems Biology." Nat. Rev. Microbiol.18 (8), 428–445.
34
Switz N. A. D'Ambrosio M.V. Fletcher D. A. (2014). Low-cost Mobile Phone Microscopy With A Reversed Mobile Phone Camera Lens.PloS one9 (5), e95330.
35
van der Walt S. Schönberger J. L. Nunez-Iglesias J. Boulogne F. Warner J. D. Yager N. et al (2014). "Scikit-Image: Image Processing in Python." PeerJ2, e453.
36
Venter J. C. Remington K. Heidelberg J. F. Halpern A. L. Rusch D. Eisen J. A. , (2004) Environmental Genome Shotgun Sequencing of the Sargasso Sea. Science304, 5667. 66–74
37
Vincent F. J. Colin S. Romac S. Scalco E. Bittner L. Garcia Y. et al . (2018). The Epibiotic Life of the Cosmopolitan Diatom Fragilariopsis Doliolus on Heterotrophic Ciliates in the Open Ocean.ISME J.12 (4), 1094–1108.
Summary
Keywords
PlanktoScope, microplankton, frugal microscopy, quantitative imaging, open source modularity
Citation
Pollina T, Larson AG, Lombard F, Li H, Le Guen D, Colin S, de Vargas C and Prakash M (2022) PlanktoScope: Affordable Modular Quantitative Imaging Platform for Citizen Oceanography. Front. Mar. Sci. 9:949428. doi: 10.3389/fmars.2022.949428
Received
20 May 2022
Accepted
23 June 2022
Published
22 July 2022
Volume
9 - 2022
Edited by
Martin Edwards, Plymouth Marine Laboratory, United Kingdom
Reviewed by
David McKee, University of Strathclyde, United Kingdom; Rohit Ghai, Academy of Sciences of the Czech Republic (ASCR), Czechia
Updates
Copyright
© 2022 Pollina, Larson, Lombard, Li, Le Guen, Colin, de Vargas and Prakash.
This is an open-access article distributed under the terms of the Creative Commons Attribution License (CC BY). The use, distribution or reproduction in other forums is permitted, provided the original author(s) and the copyright owner(s) are credited and that the original publication in this journal is cited, in accordance with accepted academic practice. No use, distribution or reproduction is permitted which does not comply with these terms.
*Correspondence: Manu Prakash, manup@stanford.edu; Colomban de Vargas, vargas@sb-roscoff.fr
†These authors share first authorship
This article was submitted to Ocean Observation, a section of the journal Frontiers in Marine Science
Disclaimer
All claims expressed in this article are solely those of the authors and do not necessarily represent those of their affiliated organizations, or those of the publisher, the editors and the reviewers. Any product that may be evaluated in this article or claim that may be made by its manufacturer is not guaranteed or endorsed by the publisher.