Abstract
A new saltmarsh soil dataset comprising of geochemical and physical property data from 752 soil samples collected through a sampling program supported by citizen scientists has been brought together with existing data to make the first national estimates of the surficial (top 10 cm) soil OC stock for Great British (GB) saltmarshes. To allow the inclusion of secondary data in the soil stock estimate a new bespoke organic matter to organic carbon conversion for GB saltmarsh soil was developed allowing organic matter data measured using loss-on-ignition to be convert to organic carbon content. The total GB surficial soil OC stock is 2.320 ± 0.470 Mt; English saltmarshes hold 1.601 ± 0.426 Mt OC, Scottish saltmarshes hold 0.368 ± 0.091 Mt OC, and Welsh saltmarshes hold 0.351 ± 0.082 Mt OC. The stocks were calculated within a Markov Chain Monte Carlo framework allowing robust uncertainty estimates to be derived for the first time. Spatial mapping tools are available to accompany these stock estimates at individual saltmarsh habitats throughout GB. This data will aid in the protection and management of saltmarshes and represents the first steps towards the inclusion of saltmarsh OC in the national inventory accounting of blue carbon ecosystems.
Introduction
Saltmarsh ecosystems alongside other intertidal Blue Carbon habitats such as seagrass and mangroves (Nellemann and Corcoran, 2009) are recognized hotspots for the burial and long-term storage of organic carbon (OC). Globally, saltmarshes occupy an area of 54,951 km2 (Mcowen et al., 2017) and their soils store between 0.4 – 6.5 Pg of OC (McLeod et al., 2011; Duarte et al., 2013). Annually, a further 0.9 – 31.4 Tg OC is buried in saltmarsh soils globally (Ouyang and Lee, 2014). The large quantities of OC stored, coupled with the high OC burial rates in these ecosystems, has resulted in saltmarshes now being considered core components of the coastal carbon (C) cycle (Bauer et al., 2013). The potential for saltmarshes and other intertidal environments to regulate global climate through the burial and storage of OC within their soils is now widely recognized (Macreadie et al., 2019; Macreadie et al., 2021). Yet, these systems are also at risk. With increasing climate instability, sea level rise, and anthropogenic pressure, saltmarsh’s ability to trap and store OC will likely be severely reduced and a significant proportion of the OC stored within their soils may be lost by the end of this century (Crosby et al., 2016; Horton et al., 2018). Globally it is estimated that saltmarsh habitat is reducing by 1 - 2% yr-1 (Duarte et al., 2008) with approximately 25% reduction of the global habitat since 1800 (Bridgham et al., 2006; Mcleod et al., 2011). Yet, recent estimates suggest at a global scale much of the modern (1999-2019) habitat loss has been offset by the creation of new saltmarsh (Murray et al., 2022). Nevertheless, significant efforts are still required to preserve these saltmarshes and assure the significant quantities of OC held within their soil is not lost and remineralized, which would further exacerbate global climate change (Schuerch et al., 2018).
Quantifying the OC stored in saltmarsh soil is a crucial foundational step towards integrating saltmarsh OC into national C accounting, understanding the C and climate impact of habitat loss, and justifying habitat protection and restoration (Granek et al., 2010; Theuerkauf et al., 2015; Rogers et al., 2019). Yet the current global saltmarsh soil OC stocks are coarse, with estimates ranging between 0.4 – 6.5 Pg OC (McLeod et al., 2011; Duarte et al., 2013). This is largely driven by the unequal spatial distribution of current stock assessments with the majority focusing on tropical/sub-tropical areas such as Australia (Lovelock et al., 2014; Brown et al., 2016; Kelleway et al., 2016) and the Gulf of Mexico (Thorhaug et al., 2019; Vaughn et al., 2020). Only a few countries such as Australia (Young et al., 2021) and the USA (Hinson et al., 2017; Holmquist et al., 2018) have undertaken national saltmarsh OC stock assessments. A lack of stock assessments is particularly apparent across the temperate and boreal saltmarshes of the NE Atlantic region where data on saltmarsh OC stock is extremely limited (Mueller et al., 2019a; Mueller et al., 2019b). The best current OC stock data for saltmarshes in Great Britain (GB) have generally been limited to single marshes (Andrews et al., 2008; Burden et al., 2013; Porter et al., 2020) or have been geographically constrained to single regions (Burden et al., 2019; Ford et al., 2019; Austin et al., 2021). Where full national saltmarsh soil OC stock estimates have been undertaken (Beaumont et al., 2014), these are still based on extrapolation from a relatively few well-studied sites. A recent systematic review found inconsistencies in the way data was gathered and reported, makes comparisons and consolidation of knowledge difficult (Mason et al., 2022). This limited and fragmented knowledge base could hinder the inclusion of OC held within GB saltmarshes into national Greenhouse Gas (GHG) reporting and C budgets.
Reliance on data from only a few sites makes assumptions about the homogeneity of soil C stocks across different biogeographic contexts fail to account for differences due to soil type or vegetation community, leading to uncertainty in soil carbon stock estimates (Kelleway et al., 2016; Kelleway et al., 2017). A challenge for structured surveys for habitats like saltmarshes - which are widely distributed around national coastlines, but often in multiple and fragmented locations - is the ability to reliably sample sufficient sites to gather a robust national picture of variation within and across sites. The rise of citizen involvement in data collection has made large-scale sampling feasible (Aavik et al., 2020), raised public engagement in science (Phillips et al., 2019), and influenced policy formulation and implementation (Couvet et al., 2008) within the conservation sciences. By following standardized sampling procedures, systematic observations, and simple methods (Conrad and Hilchey, 2011; Parsons et al., 2011), citizen-led data collection is now widely appreciated for its quality and includability in peer-review research (McKinley et al., 2017).
In this study, we undertake a national scale assessment to quantify the OC held within the surficial soils (top 10 cm) of the saltmarshes of GB. Utilizing the well-established relationship between regional vegetation composition and surficial soil OC (Ford et al., 2019; Austin et al., 2021; Penk and Perrin, 2022) we bring together the latest national saltmarsh mapping data (Haynes, 2016; Natural Resources Wales, 2016; Environment Agency, 2021) with a new GB wide soil dataset produced following a standardized sampling methodology by citizen scientists allowing, for the first time, the quantity of OC held within surficial soils to be estimated and mapped for all saltmarshes within GB and its constituent nations (Scotland, England, and Wales). As this study only focuses on the surficial (top 10 cm) soils the calculated OC stocks will be an underestimate of the full quantity of OC held at depth within the soil of saltmarshes. Yet, the surficial soil OC stock estimates are key to understanding saltmarsh OC dynamics at national scales. The resulting broad spatial understanding of OC stocks can be used in prioritizing saltmarsh conservation, restoration, and management from a C storage viewpoint.
Saltmarshes of Great Britain
Saltmarsh habitat is widely distributed around the constituent nations (Scotland, England, and Wales) of GB (Figure 1A). The most extensive areas occur along estuaries in the counties of Hampshire, north Kent, Essex, Norfolk, Lincolnshire, and Lancashire (May and Hansom, 2003). The extent of saltmarsh habitat in the GB is estimated to be between 400 km2 and 495 km2 (Burd, 1989; Jones et al., 2011; Burden et al., 2020; Ladd, 2021). The marshes vary significantly in size from the small marshes found at the head of Scotland’s fjords to the expansive coastal systems of the Solway Firth, Morecambe Bay, and the Wash (Supplementary Figure 1).
Figure 1
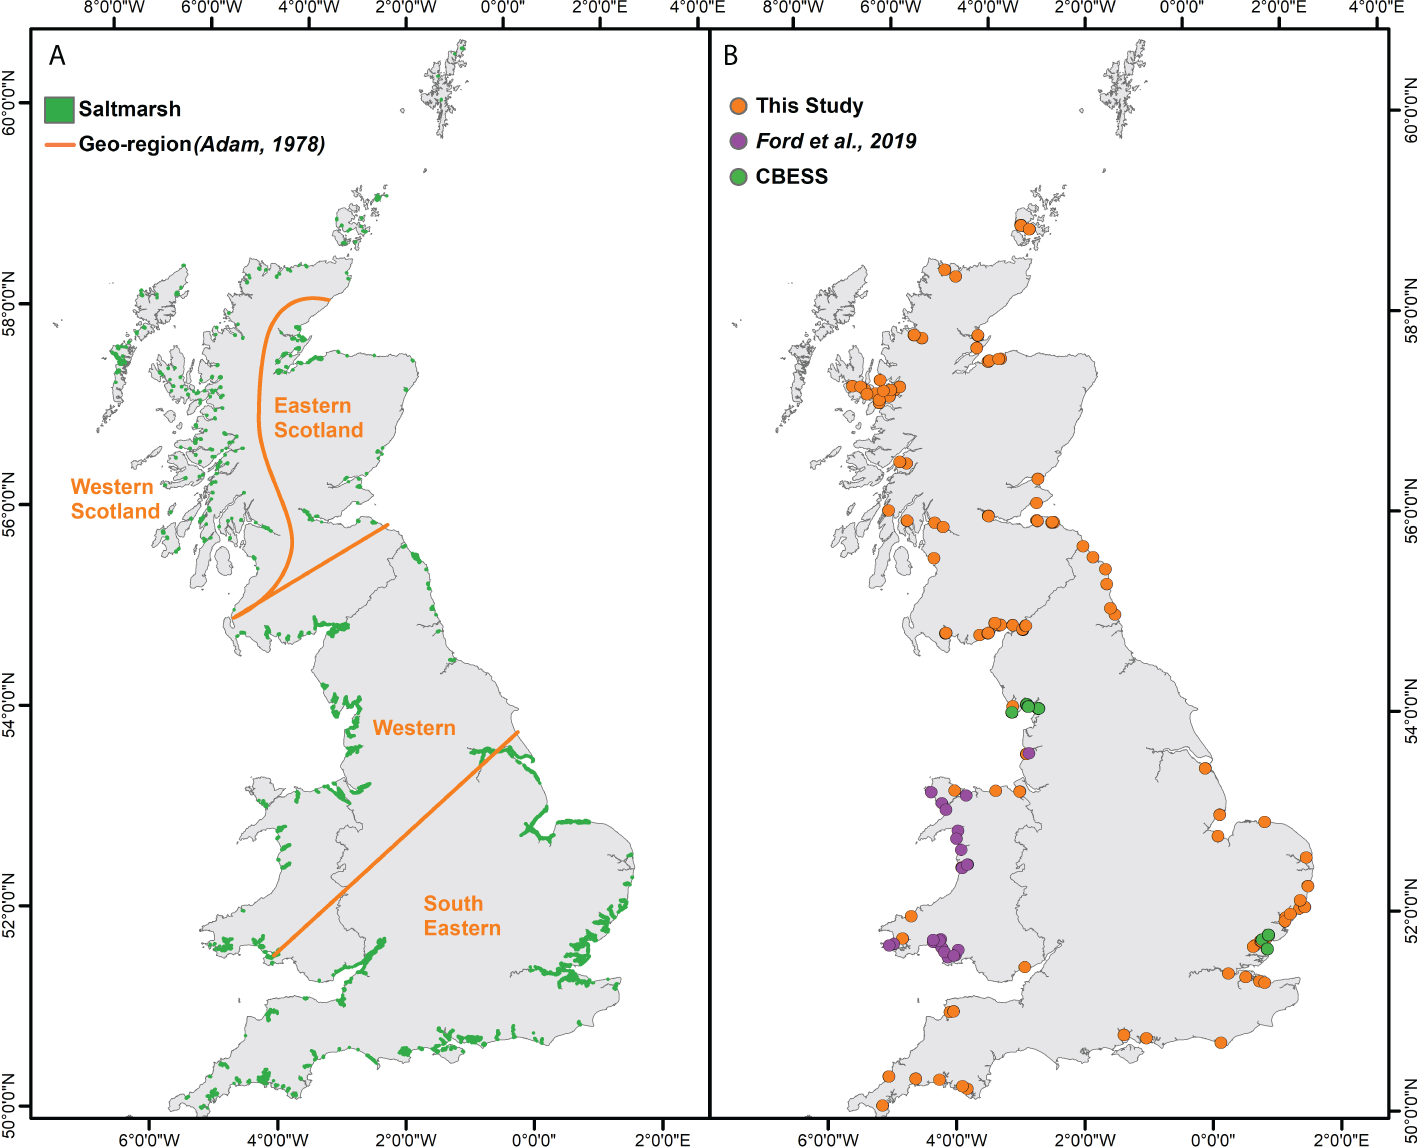
Saltmarshes of Great Britain. (A) Mapped extent of saltmarsh habitat across the nations of Great Britain (exaggerated by 1.5 times for visibility). Orange lines highlight the different saltmarsh vegetation geo-regions of Great Britain as described by Adam, 1978. (B) Sampling sites across Great British saltmarsh (orange dots) and the location of secondary data sources (green and purple dots).
In GB, saltmarsh systems can be defined into six core types (Pye and French, 1993): estuarine, embayment, back-barrier, and fringing marshes are found throughout GB, while loch-head and perched marshes are found in Scotland. Loch-head marshes are highly sheltered systems found at the landward end of Scotland’s fjords. Perched saltmarshes form on sea cliffs and in the shelter of raised rocky outcrops, where shallow soils tend to develop in the wave splash-zone (Haynes, 2016).
Saltmarsh vegetation composition across GB is driven by climatic conditions, coastal processes and soil characteristics, and hydrological regimes. GB marshes are generally dominated by SM13 (Puccinellia maritima) and SM16 (Festuca rubra) vegetation communities as described by the British National Vegetation Classification (NVC) scheme (Rodwell, 1991). These communities occupy a significant proportion of GB saltmarshes but variations in several factors, notably sediment type, climate, biotic factors, and historical management (Adam, 1978) lead to a range of differing vegetation communities developing within and between marshes (Burd, 1989).
Although the variation in saltmarsh vegetation is continuous within and between sites, it is possible to recognize combinations of vegetation types which allow several distinct geo-regions to be identified. Following the approach of Adam (1978) where four geo-regions were identified across GB:
Western Scotland: This geo-region contains all the loch-head and perched saltmarshes in GB. The marshes are generally small, on average occupying less than 0.1 km2. The vegetation structure of the marshes in this geo-region is often simple in comparison to other areas. These marshes are dominated by Puccinellia/Festuca and Juncus gerardii communities. The pioneer and low marsh communities are generally dominated by Salicornia and Suaeda (Adam, 1978; Haynes, 2016).
Eastern Scotland: Saltmarshes within this geo-region are defined as embayment, fringing, and back-barrier, with large estuarine marshes mainly absent (Haynes, 2016). These marshes are dominated by four vegetation communities which occur in varying proportions: Salicornia/Suaeda, Puccinellia, Puccinellia/Festuca, and Juncus gerardii (Adam, 1978; Burd, 1989; Haynes, 2016).
Western: The marshes in the western geo-region are significantly larger than those in the Western and Eastern Scotland geo-regions (Supplementary Figure 1), with large estuarine marshes being common (Burd, 1989). These marshes are further differentiated by their sandy soils, resulting in greater importance of P. maritima in the pioneer zone due to reduced competition from Spartina maritima and Aster tripolium. Higher precipitation in this geo-region generally leads to more brackish high marshes with Blysmetum rufi and Halimionetum portulacoidis communities are commonly found.
South Eastern: The marshes within this geo-region are smaller than those in the Western region, with exception of the Wash marshes (Supplementary Figure 1). The prevailing substrate is fine silt, and marsh vegetation is predominantly Spartina (Burd, 1989). The mid-low marsh communities, Puccinellia and Halimione, Puccinellia/Festuca occupy significant proportions of the total area. Upper marsh communities are more common than in other geo-regions, with Phragmites common across much of the region.
Methods
Harmonization of saltmarsh classifications
In the last decade there has been a concerted effort in GB to measure areal extent and habitat composition. The classifications used in saltmarsh mapping differ in England to that of Wales and Scotland. In Scotland (Figure 2A) and Wales (Figure 2B), saltmarsh data is mapped to NVC communities (Rodwell, 1991). In England, saltmarsh is mapped to a set of saltmarsh zones (Spartina, Pioneer, Mid-Low, and High Marsh) following a modified version of the European nature information system (EUNIS) classification scheme currently used by the Environment Agency (Figure 2C). For the purposes of this study, we define the extent of the saltmarsh following the approach of the Environment Agency (2021), at the seaward end the demarcation between saltmarsh and intertidal flat is described as ≥ 5% ground coverage of saltmarsh vegetation. The demarcation of the landward extent is defined when saltmarsh vegetation becomes ≥ 5% of a predominantly terrestrial vegetation community.
Figure 2
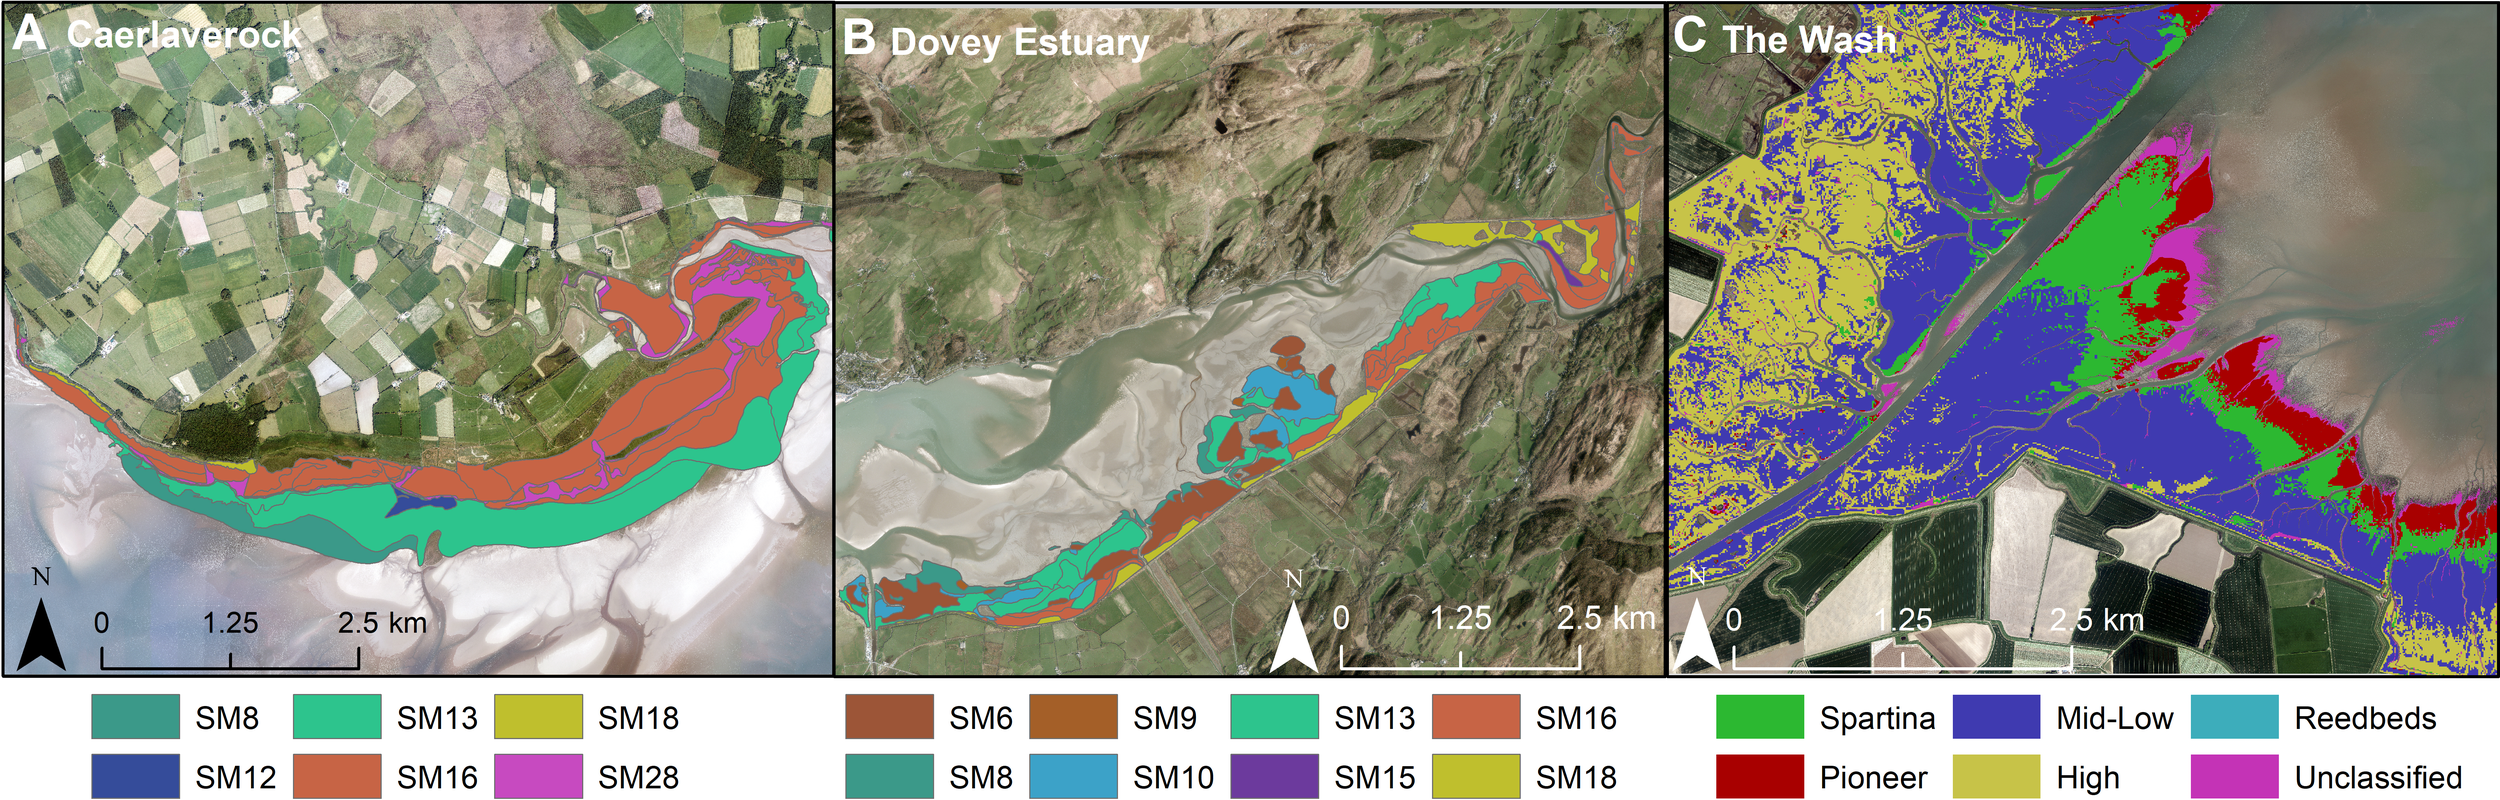
Examples of current saltmarsh mapping within (A) Scotland – Caerlaverock marsh (54.969555, -3.484984), (B) Wales – Dovey (Dyfi) Estuary (52.543454, -3.977258) and (C) England – The Wash (52.926668, 0.061452).
Prior to undertaking OC stock calculations, the mapping data must be harmonized under a single classification scheme. The modified EUNIS scheme already utilized in the English marshes was determined to be best suited to this task. The EUNIS habitat classification system is a comprehensive pan-European systems for habitat classification. Using a hierarchical approach, the habitat types are identified by specific codes, with saltmarshes being classified as A2.5. These categories can be further broken down into high (A2.52), mid-high (A2.53), low-mid (A2.54), pioneer (A2.55) and Spartina dominated (A2.55443) saltmarsh zones. In this study a modified version of the EUNIS scheme is used where the mid-high and low-mid EUNIS marsh classifications are combined into the mid-low class. The Scottish and Welsh NVC (Rodwell, 2000) data can be easily converted to follow the modified EUNIS classification (Supplementary Table 1) allowing the data to be combined with the English saltmarsh data and to allow direct comparisons with neighboring European saltmarshes in the future.
Within the mapped data, some zones were recorded as mosaics of two or more NVC communities. In these cases, the first NVC community listed was chosen as the primary classification. The perched saltmarshes found in Scotland (Haynes, 2016) have been removed from the datasets, as these marshes are generally found on cliffs, largely devoid of any underlying soil (Haynes, 2016; Porter et al., 2020).
The field surveys and photographic data used to classify marshes was collected between 2010 – 2012 for Scotland (Haynes, 2016), 2006 – 2019 for England (Environment Agency, 2021) and 2006 - 2009 for Welsh sites (Natural Resources Wales, 2016). The marsh classes therefore represent a snapshot in time of GB saltmarsh extent and vegetation composition as they were when the surveys were completed. The classes may no longer be an accurate representation of the marshes as they are today, especially considering the highly dynamic nature of the intertidal habitats (Ladd et al., 2019; Ladd, 2021). However, these mapping products remain the best quality data currently available.
Soil sampling
A total of 752 soil samples were collected from saltmarshes across GB (Figure 1B) between 2018 – 2021 with the aim of quantifying surficial OC stocks. Of these, 393 surficial soil (top 10 cm) samples were collected from Scottish saltmarshes using a mix of either modified syringe samplers (60 ml syringe with end cut away, creating a 10 cm length barrel with a 3 cm diameter), or a 3 cm gouge corer by the project team. Both sampling methods are designed to reduce the effect of compaction of the fibrous layers of saltmarsh soil (Smeaton et al., 2020). Soil samples were collected in conjunction with detailed vegetation surveys designed to explore the relationship between vegetation and soil OC, alongside investigating the accuracy of current saltmarsh mapping and to assess potential changes in vegetation composition and aerial extent since mapping occurred. The vegetation surveys were undertaken following a standard protocol where, at each site, a 1 m2 quadrat was placed on the marsh and percentage coverage of each plant species estimated. Vegetation composition was then assigned following the NVC scheme (Rodwell, 2000).
A further 369 samples were collected by volunteer citizen scientists as part of the “CarbonQuest” initiative. The citizen scientists were provided with a pack of five modified color-coded syringe samplers and instructions to collect samples at equal distances along a land-to-sea transect and to freeze the samples upon collection. Sampling locations were recorded by extracting coordinates from image files associated with photographs taken of each soil core in situ with a GPS-enabled smart phone. Surveys were completed between August and October 2019, and all samples were received by the University of St Andrews by November 2019. Samples were stored at -20°C prior to analysis. The location data was quality-checked to assure the sampling protocol was followed and that samples were collected from appropriate locations (saltmarsh vs freshwater wetland). This was achieved by comparing the sampling locations to current saltmarsh maps and high resolution (25 cm) aerial photography. If the sample location did not overlap with known saltmarsh habitats, the sample was removed from the sample set and did not undergo laboratory analysis. As the identification and quantification of vegetation coverage and composition requires specialist expertise, it was not possible for all the citizen scientists to provide this level of detail. Therefore, each sample was assigned a classification (NVC, Simplified NVC, marsh zone) using the existing saltmarsh maps.
Soil physical property and geochemical analysis
The samples within the syringe tubes were visually inspected and the length of the sample measured to assure accurate quantification of sample volumes (cm3) was recorded. The samples were extruded from the syringe and the soil was described according to the British Columbia protocol for estimating soil texture (www.for.gov.bc.ca/isb/forms/lib/fs238.pdf). This approach uses simple qualitative measures (graininess, moistness, stickiness, and ability to hold a form without breaking apart when rolled) to classify the soil to one of twelve soil categories (Supplementary Table 2) which can be further simplified into sandy, non-sandy and organic (>40% organic matter (OM) classes (Ford et al., 2019).
The extruded soil samples alongside the samples collected using the gouge corer were oven dried at 60°C for 72 hrs and weighed. Using the dry mass and the sample volume (prior to drying) the dry bulk density was calculated following the approach of Dadey et al. (1992):
The dry samples were then milled to a fine powder and split into two subsamples to undergo loss on ignition (LOI) and elemental analysis. The quantity of OM within each sample was determined by LOI following the approach of Craft et al. (1991) to allow for global comparison. Briefly, 1 g of milled sample was placed in a crucible and dried overnight at 105°C to remove any moisture the crucible was then transferred to furnace to be combusted at 450°C for 4 hrs. The sample was weighed before and after each stage allowing the OM content of the soil to be calculated.
The OC content of the soil was determined by placing 10 mg of sample into silver capsules. The samples were acidified with HCl (10%) to remove carbonate (CaCO3). The acidified samples were dried overnight at 50°C and sealed. The OC contents of the sealed samples were measured using an Elemental Analyzer (Elementar Vario EL Cube; (Verardo et al., 1990; Nieuwenhuize et al., 1994). Triplicate measurements of samples (n = 30) produced standard deviations (1σ) of 0.04% for OC. Further quality control was assured by repeat analysis of high OC sediment standard (B2151) with reference values for C of 7.45 ± 0.14%, the reference standards (n = 76) deviated from the known OC values by 0.08%.
Secondary soil data
Saltmarsh soil (top 10cm) dry bulk density and OM data for 265 sampling sites across the saltmarshes of Morecambe Bay and Essex were extracted from the Coastal Biodiversity and Ecosystem Service Sustainability (CBESS) project outputs (Ford et al., 2015; Ford et al., 2016a; Ford et al., 2016b; Ford et al., 2016c). This dataset was further supplemented by additional data from Morecambe Bay marshes (Baugh, 2019), the Ribble Estuary (Ford et al., 2012) and Welsh marshes (Ford et al., 2019).
Organic matter vs organic carbon
With the exception of Baugh (2019), the secondary datasets do not report the OC content of the soil but rather the OM content measured by LOI. To convert the OM data to OC different conversion factors can be applied, the most common of which is Van Bemmelen (1890) which assumes that 58% of OM is OC resulting in a 1.724 conversion factor to transform OM to OC (Van Bemmelen, 1890). Though widely used the Van Bemmelen (1890) approach is now considered problematic and is not supported by empirical measurements both in terrestrial and saltmarsh soils (Pribyl, 2010; Ouyang and Lee, 2020). In saltmarsh studies the OM to OC conversion developed by Craft et al. (1991) has been widely applied globally and in general performs well in organic rich systems such as those in North America. Yet, the performance of the Craft et al. (1991) conversion in organo-mineral systems such as the saltmarshes of GB is uncertain. Using the data collected from the saltmarshes of GB, a bespoke OM-OC conversion was developed following the methodology of Craft et al. (1991). Using the new bespoke conversion factor the OM data compiled from the literature were converted to OC and integrated into the main dataset.
Quantifying soil OC stocks
The surficial (top 10cm) soil OC stocks were determined for the GB saltmarshes following the calculation steps outlined in Smeaton et al. (2020) (eq.2-4). For each of the four geo-regions, the mean (and standard deviation) soil dry bulk density and OC content were compiled for each NVC, simplified NVC and marsh zone. A hierarchical approach was used to populate each of the equations (eq 1-3). Where possible dry bulk density and OC data for each NVC (i.e., SM13a) for a given geo-region was utilized in the calculations. If no data was available, surrogate values were utilized in descending order: simplified NVC (i.e., SM13), marsh zone (i.e., mid-low), geo-region average values, and finally national average values. The areal extent of the NVC and marsh zones was taken from the marsh classifications (Section 3.1).
The calculation steps (eq.2-4) were undertaken within a Markov Chain Monte Carlo (MCMC) framework allowing improved estimations of the uncertainties associated with the quantified OC stocks. MCMC analysis was applied using the OpenBUGS software package (Lunn et al., 2009) by taking 1,000,000 out of 100,000,000 random samples from a normal distribution of each variable (area, dry bulk density, OC content) to populate equations (eq.2-4). This process generates a significant quantity of solutions which follow a normal distribution. The application of standard descriptive statistical techniques to the pool of generated solutions allows the mean, standard deviation, minimum, maximum, and 5th, 50th (median), and 95th percentiles to be calculated.
For each of the four geo-regions and GB as a whole, the area normalized soil OC storage was calculated following equation 5 within the MCMC framework for each available NVC alongside the marsh zones. The outputs from these calculations were combined with the geospatial data (Section 3.1) to create a new bespoke geospatial dataset illustrating soil OC storage across the saltmarshes of GB, and allowing the quantification of individual marsh soil OC stocks.
Results and interpretation
Saltmarsh areal extent and vegetation
The GB wide mapping (Haynes, 2016; Natural Resources Wales, 2016; Environment Agency, 2021) estimates that saltmarsh habitat occupies an area of 451.65 km2, in line with previous studies (Burd, 1989; Jones et al., 2011; Burden et al., 2020). English saltmarshes represent 74% of all saltmarsh habitat in GB, with Scottish and Welsh marshes each accounting for 13% of the areal coverage (Table 1). Across the four geo-regions (Adam, 1978), 92% of saltmarsh habitat can be found in the Western (44%) and South Eastern (48%) geo-regions, with the remaining 8% spread across the Western Scotland and Eastern Scotland regions (Table 1).
Table 1
| Areal extent (km2) | ||||
|---|---|---|---|---|
| Scotland | England | Wales | Great Britain | |
| Pioneer | 3.32 | 13.75 | 1.16 | 17.36 |
| Mid-Low | 51.42 | 175.94 | 43.64 | 270.99 |
| High | 3.47 | 71.96 | 1.14 | 76.57 |
| Spartina | 0.12 | 25.15 | 6.70 | 32.83 |
| Unclassified | — | 49.01 | 4.88 | 53.89 |
| Total | 58.33 | 335.80 | 57.51 | 451.65 |
| Western Scotland | Eastern Scotland | Western | South Eastern | |
| Pioneer | 0.10 | 1.88 | 7.13 | 8.21 |
| Mid-Low | 15.87 | 14.91 | 131.28 | 108.85 |
| High | 0.43 | 1.08 | 38.16 | 36.89 |
| Spartina | 0.11 | 0.01 | 10.13 | 22.7 |
| Unclassified | — | — | 12.99 | 40.99 |
| Total | 16.51 | 17.96 | 199.69 | 217.64 |
Areal extent (km2) of saltmarsh habitat across the nations of Great Britain, and the four geo-regions (Adam, 1978; Figure 1).
The bold values represent the nations and the geo-regions.
The differences in vegetation communities within each geo-region reflect the classification developed by Adam (1978). The clearest of these differences is the zonation of the marshes and the occurrence of Spartina (Table 1; Supplementary Figure 2). The marshes located in the Western Scotland and Eastern Scotland geo-regions are similar in that 96% and 86% of the total marsh area is classified as mid-low marsh vegetation respectively (Table 1). The differentiating factor between these two regions is the greater abundance of pioneer and high marsh vegetation found in the Eastern Scotland region when compared to Western Scotland (Table 1). The marshes of the Western and South Eastern regions are still dominated by mid-low marsh vegetation with 66% and 50% aerial coverage, but a greater proportion of the vegetation is classified as pioneer and high marsh (Table 1; Supplementary Figure 2). The presence of Spartina in these regions is also a defining factor, with 7% of the Western and 18% of geo-regions marshes being dominated by Spartina in comparison only 0.7% and 0.1% of the marshes in the Western Scotland and Eastern Scotland regions (Table 1).
To determine the accuracy of the current saltmarsh maps (Haynes, 2016; Natural Resources Wales, 2016), NVC classifications (Rodwell, 1991) were derived from vegetation surveys carried out in Scotland (Miller et al., 2022) and Wales (Ford et al., 2019) and compared to the mapped NVC class in these areas. Of the simplified 584 NVCs derived from the vegetation surveys, 2% of the data points differ and these are confined to the highly dynamic (Ladd, 2021) pioneer zone. To account for lateral marsh dynamics (Ladd et al., 2019) since the vegetation classification surveys were done, an uncertainty value of 5% was applied to all areas used to determine soil OC stock to assure robust uncertainty estimates.
Saltmarsh soil physical and geochemical composition
Dry bulk density
The dry bulk density values are comparable to both global datasets from muddy and sandy intertidal soils and sediments (Bradley and Morris, 1990; Flemming and Delafontaine, 2000) and existing data from GB (Beaumont et al., 2014; Ford et al., 2019; Marley et al., 2019; Smeaton et al., 2020). Across the four geo-regions there are distinct differences, largely driven by the dominant substrate found in the estuary (e.g., mud vs sand). Both the Western Scotland and Eastern Scotland regions are dominated by soils defined as non-sandy and organic which is reflected in the dry bulk density data (Figures 3A, B). Average soil dry bulk density values of 0.39 ± 0.25 g cm-3 and 0.54 ± 0.30 g cm-3 are observed in the Western Scotland and Eastern Scotland regions respectively. The dry bulk density values found in the Western region are the highest observed (Figure 3C) reflecting the sandy nature of many of these systems (Adam, 1978; Burd, 1989; Ford et al., 2019; Harvey et al., 2019). The average soil dry bulk density from this region is 0.88 ± 0.36 g cm-3, almost double that measured in any other region. The highest values are found in the pioneer zone (1.31 ± 0.10 g cm-3), decreasing as soils become more organic in the high marsh (Figure 3C). In the South Eastern region, soil dry bulk density varies little between marsh zones with an average value of 0.63 ± 0.26 g cm-3 observed. As with the Western geo-region, the highest values are found in the pioneer zone, decreasing across the transition landward to an average dry bulk density of 0.51 ± 0.22 g cm-3 in the high marsh.
Figure 3
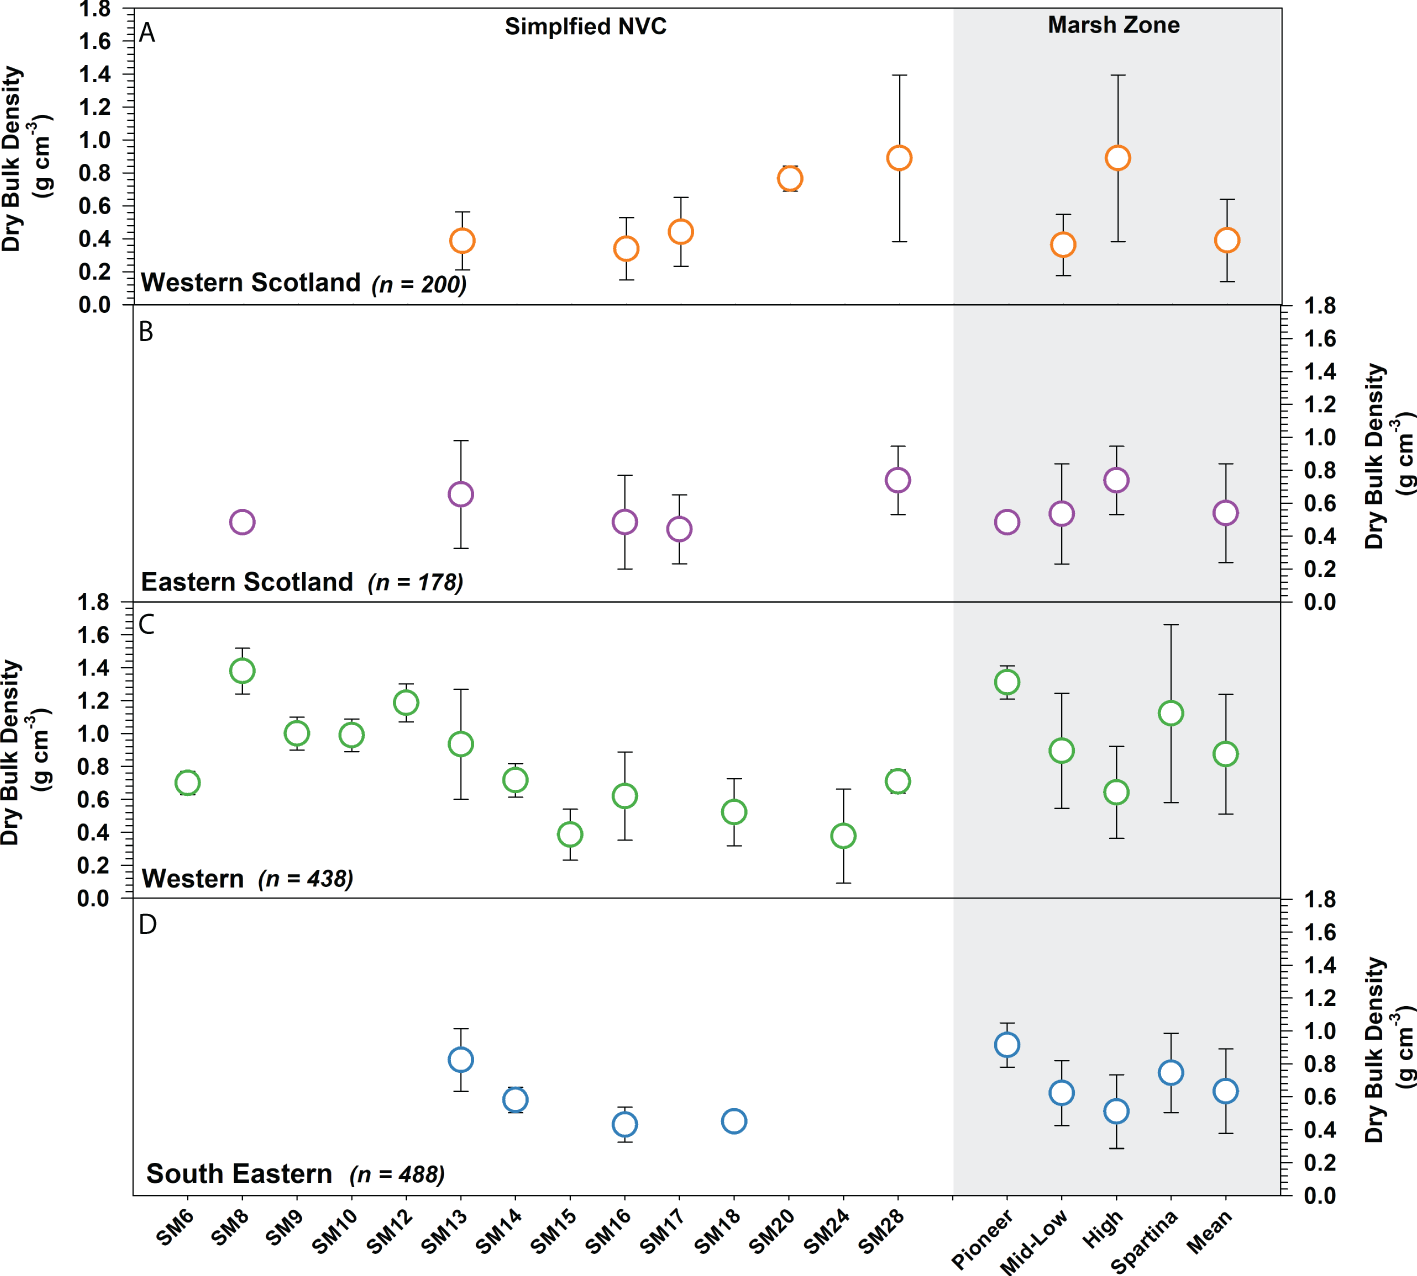
Soil dry bulk density (g cm-3) values associated with different saltmarsh vegetation and zones across the four geo-regions (A–D) of Great Britain. Error bars represent 1s. Full breakdown of the OC data can be found in Supplementary Figure 3 and Supplementary Table 4.
Organic carbon
Organic matter vs organic carbon
A linear regression between LOI and OC (p < 0.001, R2 = 0.83) produced a bespoke conversion for GB saltmarshes (eq.6).
Using this new conversion (Figure 4), the data compiled from the literature (Section 3.4) was converted from % OM data to % OC, which can be used alongside the data produced through elemental analysis (Section 3.3)
Figure 4
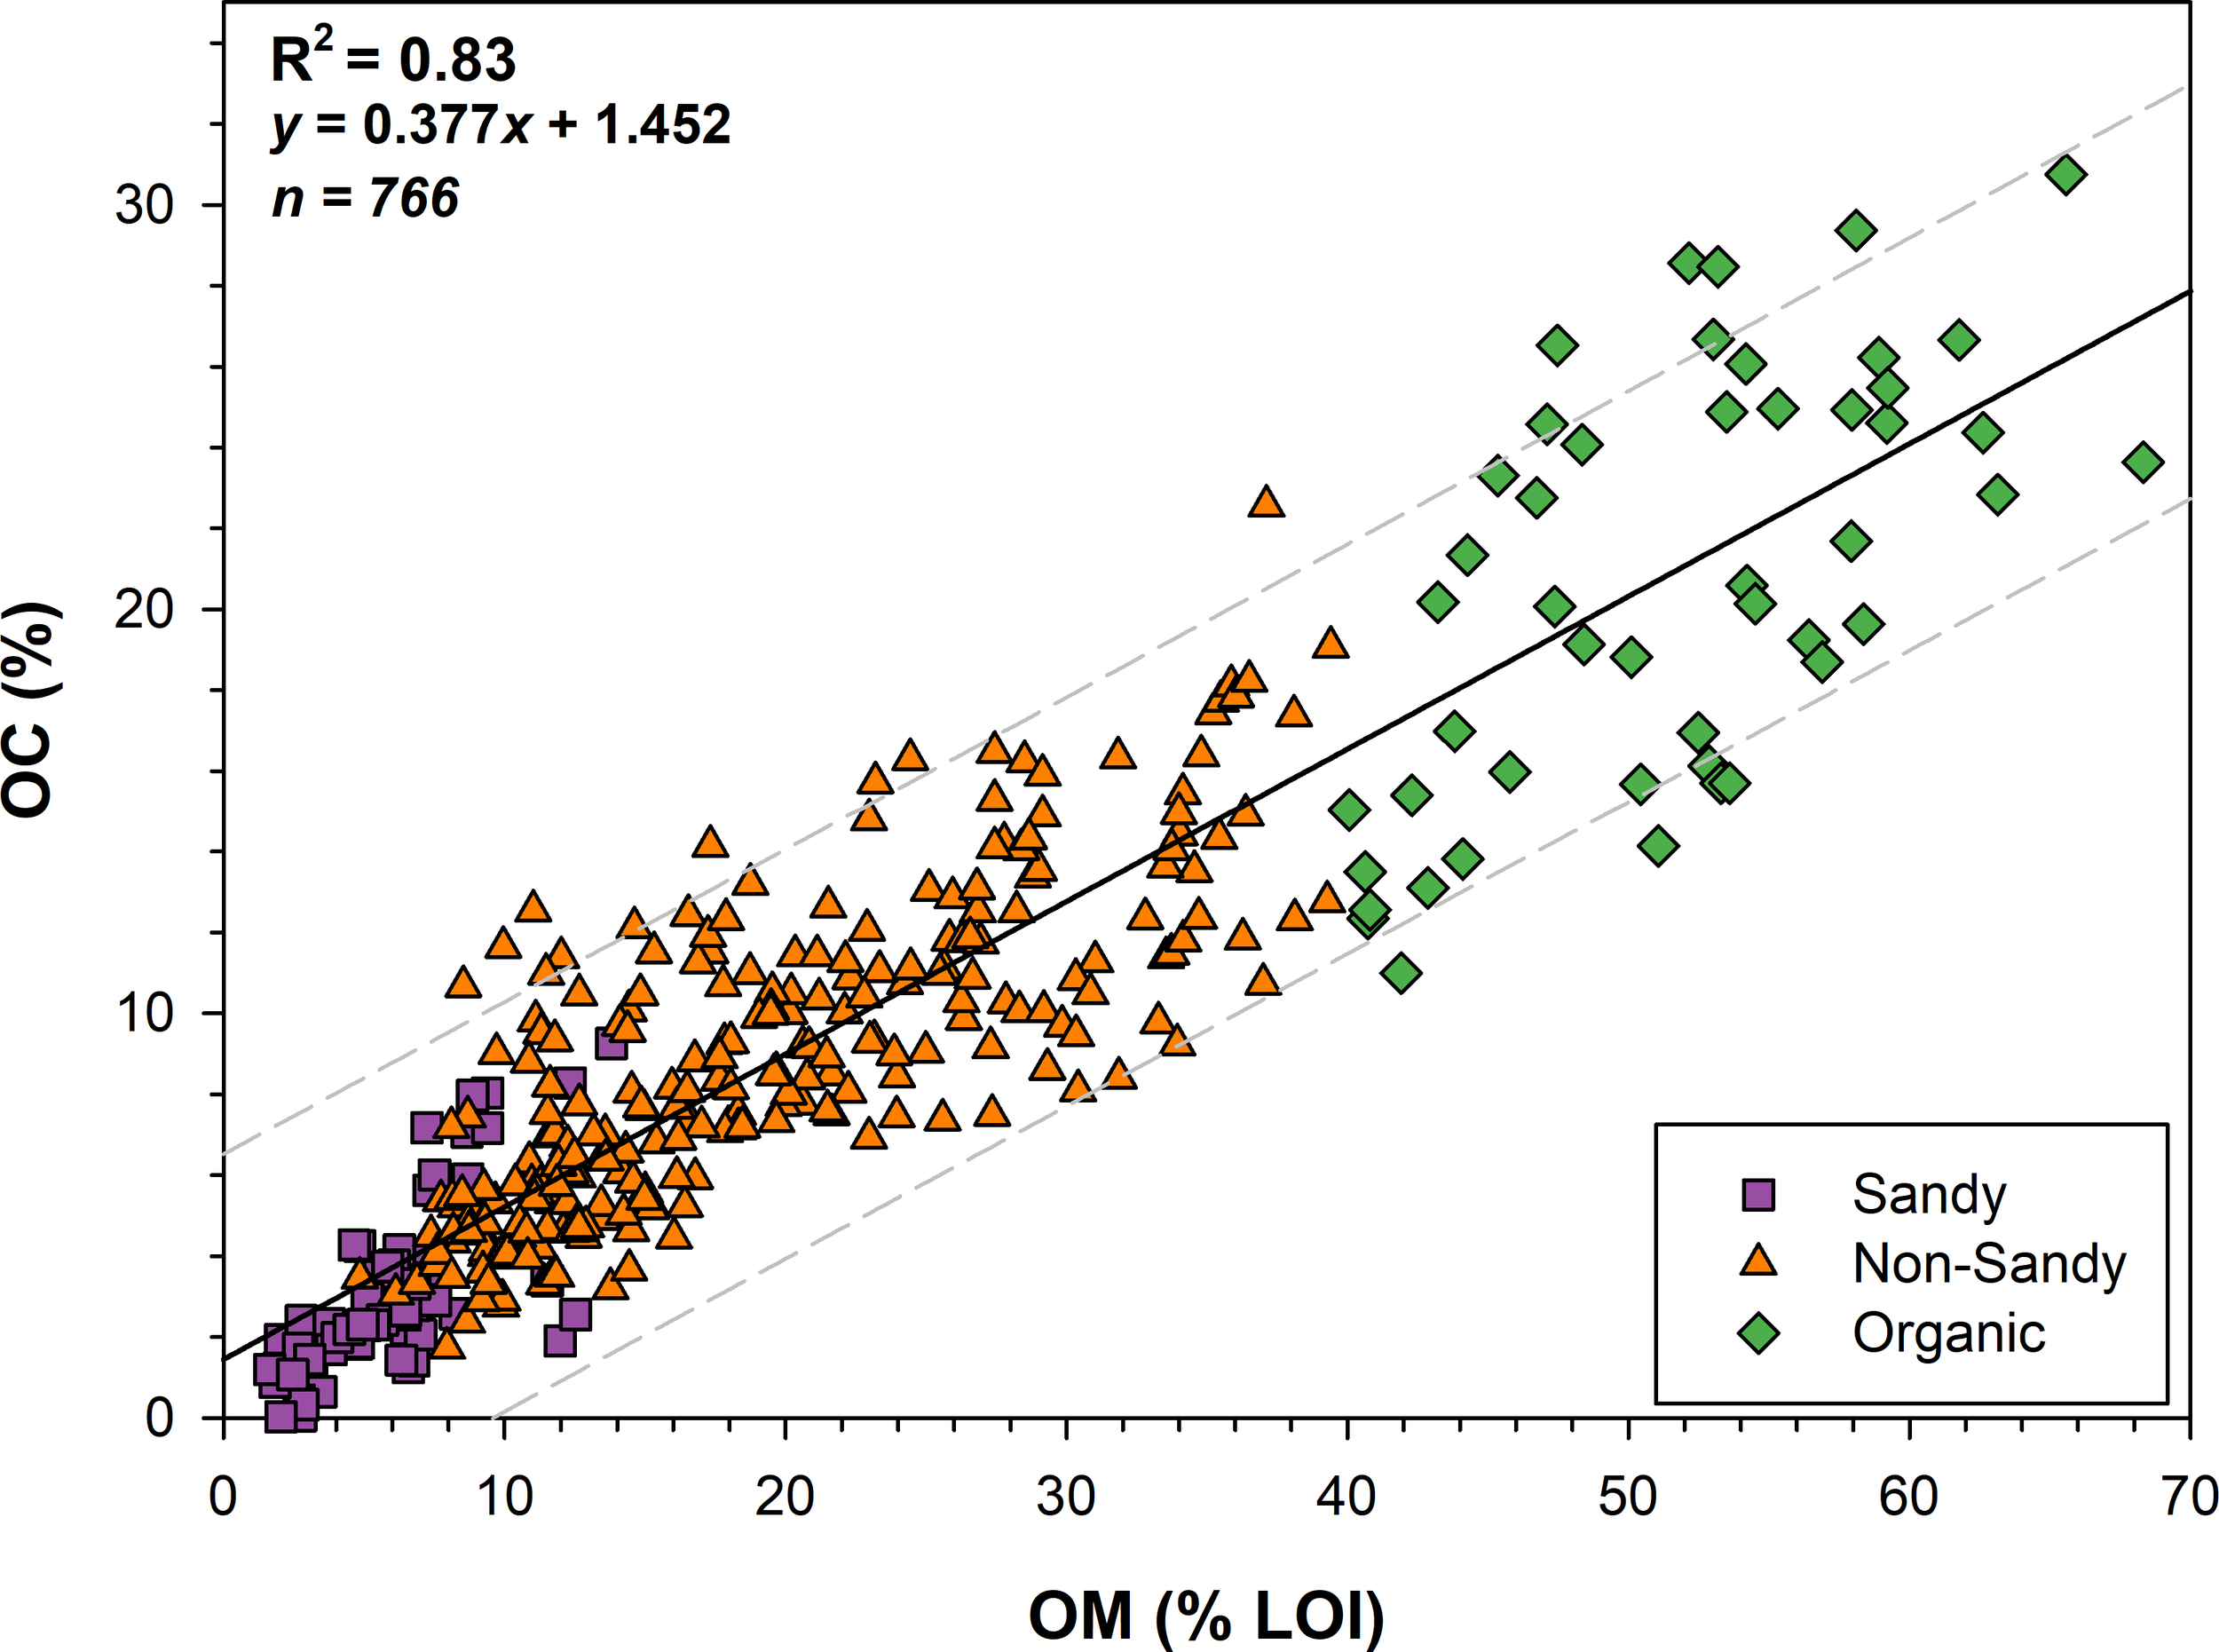
Correlation between the quantity of OM measured by loss on ignition (LOI) and OC content derived from elemental analysis for 766 saltmarsh soil samples of differing texture (sandy, non-sandy and organic) from across Great Britain (p < 0.001; R2 = 0.83). Grey dotted lines represent the 95th percentile prediction bands.
Organic carbon content
The OC content of GB saltmarshes ranges between 0.02% in sandy soils to 59.7% in organic-rich soils (Figure 5). The values measured in this study are comparable to other data from GB (Andrews et al., 2008; Burden et al., 2013; Beaumont et al., 2014; Marley et al., 2019; Smeaton et al., 2020) and other temperate saltmarshes (Mueller et al., 2019a; Mueller et al., 2019b; Penk and Perrin, 2022).
Figure 5
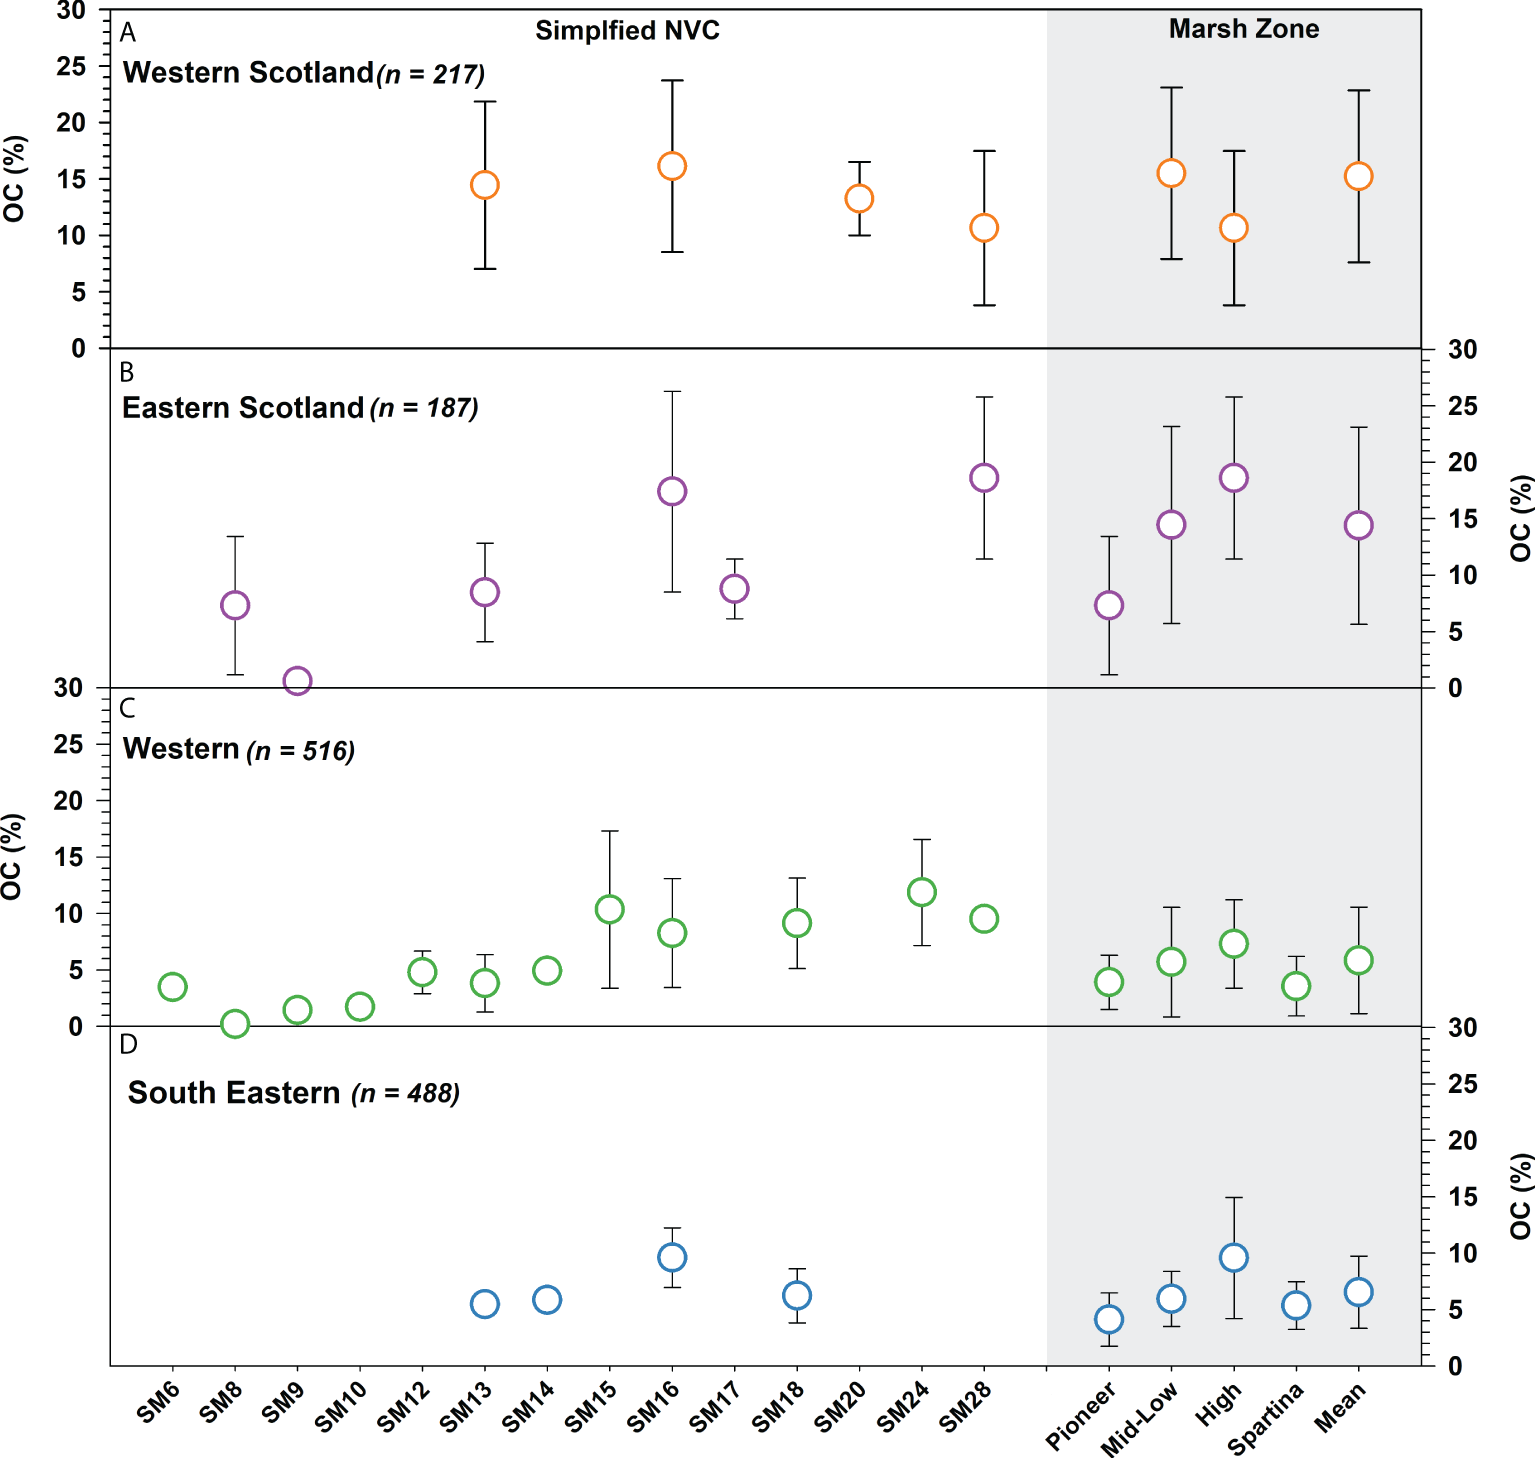
Soil OC content (%) values associated with different saltmarsh vegetation and zones across the four geo-regions (A–D) of Great Britain. Error bars represent 1s. Full breakdown of the OC data can be found in Supplementary Figure 4 and Supplementary Table 5.
All regions generally display a trend of increasing soil OC content upon moving from the pioneer to high marsh zones. Whilst these trends exist in all regions, the quantity of OC found in the soils varies. Western Scotland and Eastern Scotland contained the highest quantities of OC (Figures 5A, B), with average OC contents of 15.23 ± 7.62% and 14.39 ± 8.73% respectively. For both regions, soils associated with the vegetation classes SM13, SM16, and SM28 had the greatest OC content (Figure 5). The high OC content of the saltmarsh soils within these two geo-regions is potentially driven by high allochthonous OC input from the neighboring OC rich terrestrial environment (Lilly and Donnelly, 2012). The marshes within the Western Scotland region have the highest observed OC values (Figure 5A); within this region terrestrial derived OC has been shown to be the dominant component of near shore (fjords) sedimentary OC stores (Smeaton and Austin, 2017). Therefore it would not be unexpected that the high OC contents in the saltmarshes at head of these systems was due to the presence of large quantities of terrestrial OC. In comparison, the OC content of the Western region was considerably lower, with an average OC value of 5.85 ± 4.72%. The low OC content of these soils is likely due to these marshes being dominated by sand. The physical properties (e.g., low porosity) of sandy soils generally do not provide the conditions (e.g., low oxygen) to preserve and retain OM (Yost and Hartemink, 2019) resulting in low OC contents (Figure 4). In the Western region, there is a distinct difference in OC content of the soils upon moving landward (Figure 5C), with the pioneer zone on average containing 3.91 ± 2.40% OC, with values reaching 7.31 ± 3.92% OC in the high marsh. For context, the highest values in the Western region are broadly comparable to OC values measured in the pioneer zone of the Eastern Scotland region (Supplementary Table 5). Saltmarsh soils within the South Eastern region contain similarly low quantities of OC, with an average value of 6.53 ± 3.21%. The highest soil OC content (9.57 ± 5.37% OC) was again observed in the high marsh.
Data validation
Soil dry bulk density and OC content values were checked for outliers (Supplementary Figure 5). Two samples with very high OC contents (>60%, all other samples <35%) and two with very low bulk density were excluded.
Soil OC stocks of Great British saltmarshes
Surficial soils (top 10 cm) within GB saltmarshes hold an estimated 2.32 ± 0.47 Mt of OC. The Western geo-region saltmarsh soils hold the greatest quantity of OC (1.12 ± 0.36 Mt OC) followed by the South Eastern region (0.96 ± 0.29 Mt OC) with the soils within the Western Scotland and Eastern Scotland holding < 0.15 Mt each (Figure 6A). Despite containing lower volumes of OC per soil unit area than any other geo-region, C stocks were highest in the western geo-region by virtue of having the largest marsh extent. The Western and South Eastern marsh extent is > 10 times greater than that found in either the Western Scotland and Eastern Scotland regions (Table 1). The patterns observed in the geo-regions are closely mirrored in the national saltmarsh surficial (top 10 cm) soil OC stocks with the English marshes hold an estimated 1.601 ± 0.426 Mt of OC, whilst Scottish and Welsh marshes hold similar OC quantities (Table 2).
Figure 6
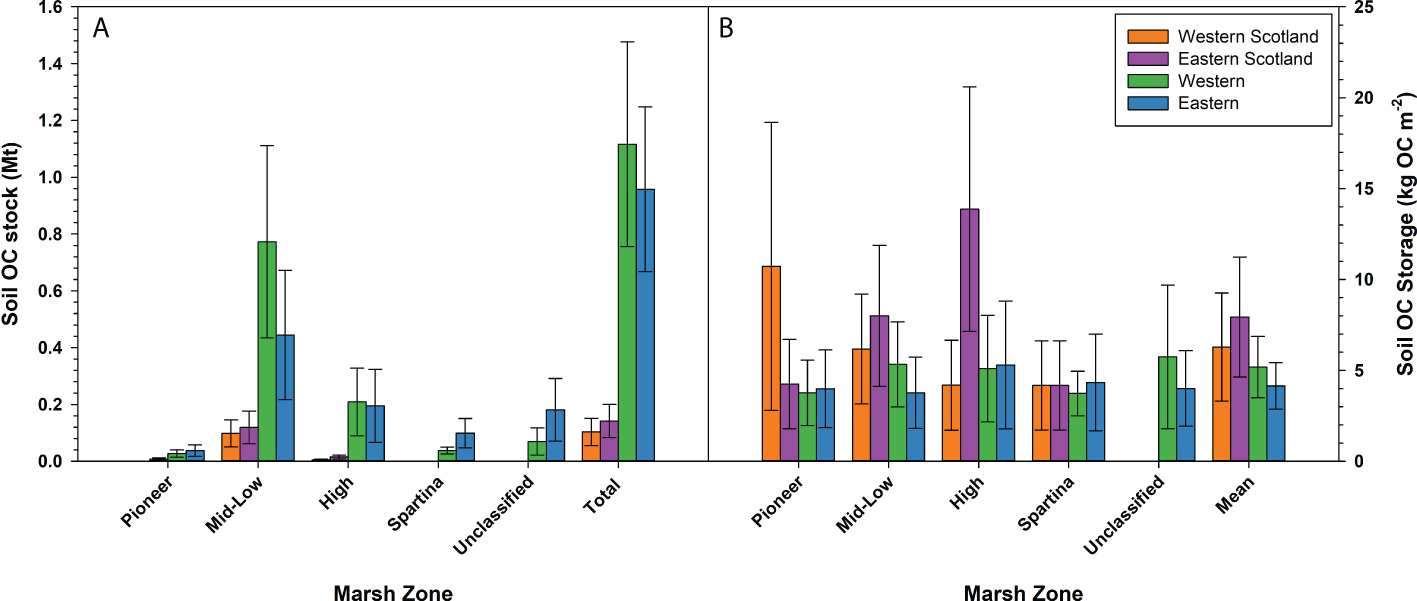
Saltmarsh surficial soil (A) OC stocks (Mt) and (B) soil OC storage (kg OC m-2) for the different saltmarsh zones within the four geo-regions of Great Britain. Error bars represent 1σ. Full statistical breakdown of the OC stocks can be found in Supplementary Tables 6-10.
Table 2
| Surficial (top 10cm) soil OC stock (Mt) | ||||
|---|---|---|---|---|
| Geo-region | Western Scotland | Eastern Scotland | Western | South Eastern |
| Pioneer | 0.001 ± 0.0003 | 0.008 ± 0.005 | 0.027 ± 0.013 | 0.038 ± 0.020 |
| Mid-Low | 0.098 ± 0.048 | 0.119 ± 0.057 | 0.773 ± 0.339 | 0.445 ± 0.228 |
| High | 0.005 ± 0.003 | 0.015 ± 0.007 | 0.209 ± 0.119 | 0.195 ± 0.129 |
| Spartina | 0.0005 ± 0.0003 | — | 0.038 ± 0.012 | 0.099 ± 0.051 |
| Unclassified | — | — | 0.070 ± 0.048 | 0.181 ± 0.110 |
| Total | 0.105 ± 0.048 | 0.142 ± 0.058 | 1.116 ± 0.360 | 0.958 ± 0.290 |
| Nation | Scotland | England | Wales | Great Britain |
| Pioneer | 0.015 ± 0.005 | 0.062 ± 0.062 | 0.003 ± 0.0004 | 0.073 ± 0.025 |
| Mid-Low | 0.320 ± 0.090 | 0.836 ± 0.836 | 0.279 ± 0.008 | 1.435 ± 0.411 |
| High | 0.033 ± 0.008 | 0.371 ± 0.371 | 0.020 ± 0.008 | 0.424 ± 0.175 |
| Spartina | 0.0005 ± 0.0003 | 0.102 ± 0.102 | 0.018 ± 0.007 | 0.137 ± 0.053 |
| Unclassified | — | 0.230 ± 0.108 | 0.020 ± 0.013 | 0.251 ± 0.119 |
| Total | 0.368 ± 0.091 | 1.601 ± 0.426 | 0.351 ± 0.082 | 2.320 ± 0.470 |
Summary of surficial (top 10 cm) soil OC stocks (Mt) for the four saltmarsh geo-regions, and nations within Great Britain. Full statistical breakdown of the OC stocks can be found in Supplementary Tables 6-10.
The bold values represent the four nations of GB and four geo-regions.
GB saltmarsh OC stocks have been estimated at 0.7 - 13 Mt OC (Beaumont et al., 2014; Luisetti et al., 2019; Legge et al., 2020), however differences in sampling depth make it difficult to directly compare these with each other and with this study at the GB scale (Table 3), therefore for fair comparisons it is important to compare like-for-like estimates (i.e. stocks derived from the top 10 cm of soil). Surficial soil (top 10 cm) OC stocks have been recently estimated for Scotland (Austin et al., 2021), Wales (ABPmer, 2020), and GB (scaled from NW Europe to match the extent of GB marshes; Legge et al., 2020) at 0.368 ± 0.102, 0.32, and 0.7 – 2.8 Mt OC respectively. The estimates for Scotland (Austin et al., 2021) were calculated using an early version of the data utilized in this study using a simplified calculation methodology, therefore the similarity in OC stocks is not surprising. The surficial (top 10 cm) saltmarsh soils of the Republic of Ireland are estimated to hold 0.265 Mt of OC (Penk, 2019). The saltmarshes of the Republic of Ireland occupy an area of 69.26 km2, are within the same climatic zone, and have similar vegetation composition (Penk and Perrin, 2022) to GB saltmarshes. These Irish systems are similar in size to the Scottish and Welsh saltmarshes and produce comparable OC stocks (Table 2).
Table 3
| Nation | Soil Depth(cm) | Soil OC Stock(Mt) | Soil OC Storage(kg OC m-2) | Reference |
|---|---|---|---|---|
| Scotland | 0-10 | 0.368 ± 0.091 | 6.31 ± 1.56 | This Study |
| England | 1.601 ± 0.426 | 4.50 ± 1.20 | ||
| Wales | 0.351 ± 0.082 | 6.10 ± 1.43 | ||
| Great Britain | 2.320 ± 0.470 | 5.14 ± 1.04 | ||
| Scotland | 0-10 | 0.368 ± 0.102 | 6.0 ± 1.8 | ( Austin et al., 2021 ) |
| Wales | 0-10 | 0.32 | 5.56 | ( ABPmer, 2020 ) |
| Republic of Ireland | 0-10 | 0.265 | 3.8 | ( Penk and Perrin, 2022 ) |
| NW Europe | 0-10 | 2.8 – 7.6 | — | ( Legge et al., 2020 ) |
| NW Europe (scaled to GB) | 0.7 – 2.8 | |||
| Scotland | 0-50 (100) | 0.49 | — | ( Beaumont et al., 2014 ) |
| England | 4.32 | |||
| Wales | 0.57 | |||
| Northern Ireland | 0.02 | |||
| Great Britain | 5.41 |
Saltmarsh surficial soil OC stock estimates from this study in comparison to existing OC soil stocks from Great British and temperate saltmarsh systems. Note that Beaumont et al. (2014) estimates are for depths 0 - 50 or 0 - 100 cm.
Across the GB saltmarshes, the greatest quantity of OC is stored in the mid-low marsh zone, followed by the high marsh (Figure 6A). This is largely because the aerial extent of the mid-low marsh zone is 3 times greater than the high marsh extent. The disparity in the extent of the high to the mid-low marsh zones is a key indicator of coastal squeeze (Hughes and Paramor, 2004) which has primarily been driven by the need to expand agricultural land in Great Britain since the 17th century (Smout, 2003). Saltmarsh soils in the Western Scotland and Eastern Scotland geo-regions have the highest soil OC storage (i.e., OC stock normalized for area; Figure 6B) with values of 6.28 ± 2.97 kg OC m-2 and 7.94 ± 3.30 kg OC m-2 respectively. In the saltmarsh soils of Western and South Eastern regions where the largest stocks are located, we observe lower OC storage values of 5.18 ± 1.69 kg OC m-2 and 4.15 ± 1.27 kg OC m-2 respectively. These differences are potentially driven by local sediment loads, sedimentation rates, dilution of the OC by minerogenic input and by the underlying substrate. Marshes with sandy soil (Western and South Eastern) generally have higher dry bulk densities (Figure 3) than their muddy counterparts and fail to trap and store OM (Figure 5) (Kelleway et al., 2016). OC storage values reported here are comparable to previous studies in Scotland (4.4 to 6.5 kg OC m-2; Austin et al., 2021), Wales (5.56 kg OC m-2; ABPmer, 2020), and the Republic of Ireland (3.8 kg OC m-2; Penk, 2019).
Mapping soil OC storage and stocks
The new spatial mapping of OC storage allows the calculation of site-specific OC stocks, providing managers and policymakers a bespoke tool to assist in the management of these systems at both the local and national scale. By combining current saltmarsh maps (Haynes, 2016; Natural Resources Wales, 2016; Environment Agency, 2021) with the calculated NVC and marsh zone specific OC densities (Supplementary Tables 11-14), it is possible to gain a geospatial understanding of OC across saltmarshes (Figure 7) and calculate saltmarsh specific surficial soil OC stocks (Figure 8). The OC density maps highlight changes in OC storage between saltmarshes and within the marshes themselves from the pioneer to high marsh zones (Figure 7).
Figure 7
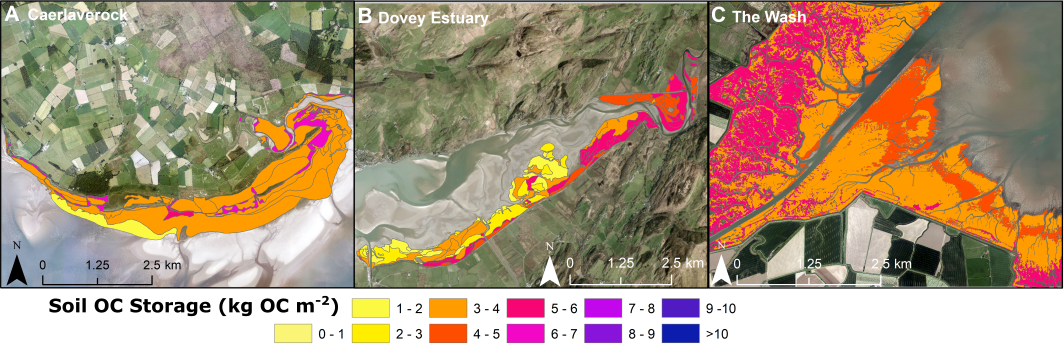
Examples of OC storage (kg OC m-2) mapped across (A) Scotland – Caerlaverock marsh (54.969555, -3.484984), (B) Wales – Dovey (Dyfi) Estuary (52.543454, -3.977258) and (C) England – The Wash (52.926668, 0.061452). Full geospatial dataset (Smeaton et al., 2022) can be found at: https://catalogue.ceh.ac.uk/documents/cb8840f2-c630-4a86-9bba-d0e070d56f04.
Figure 8
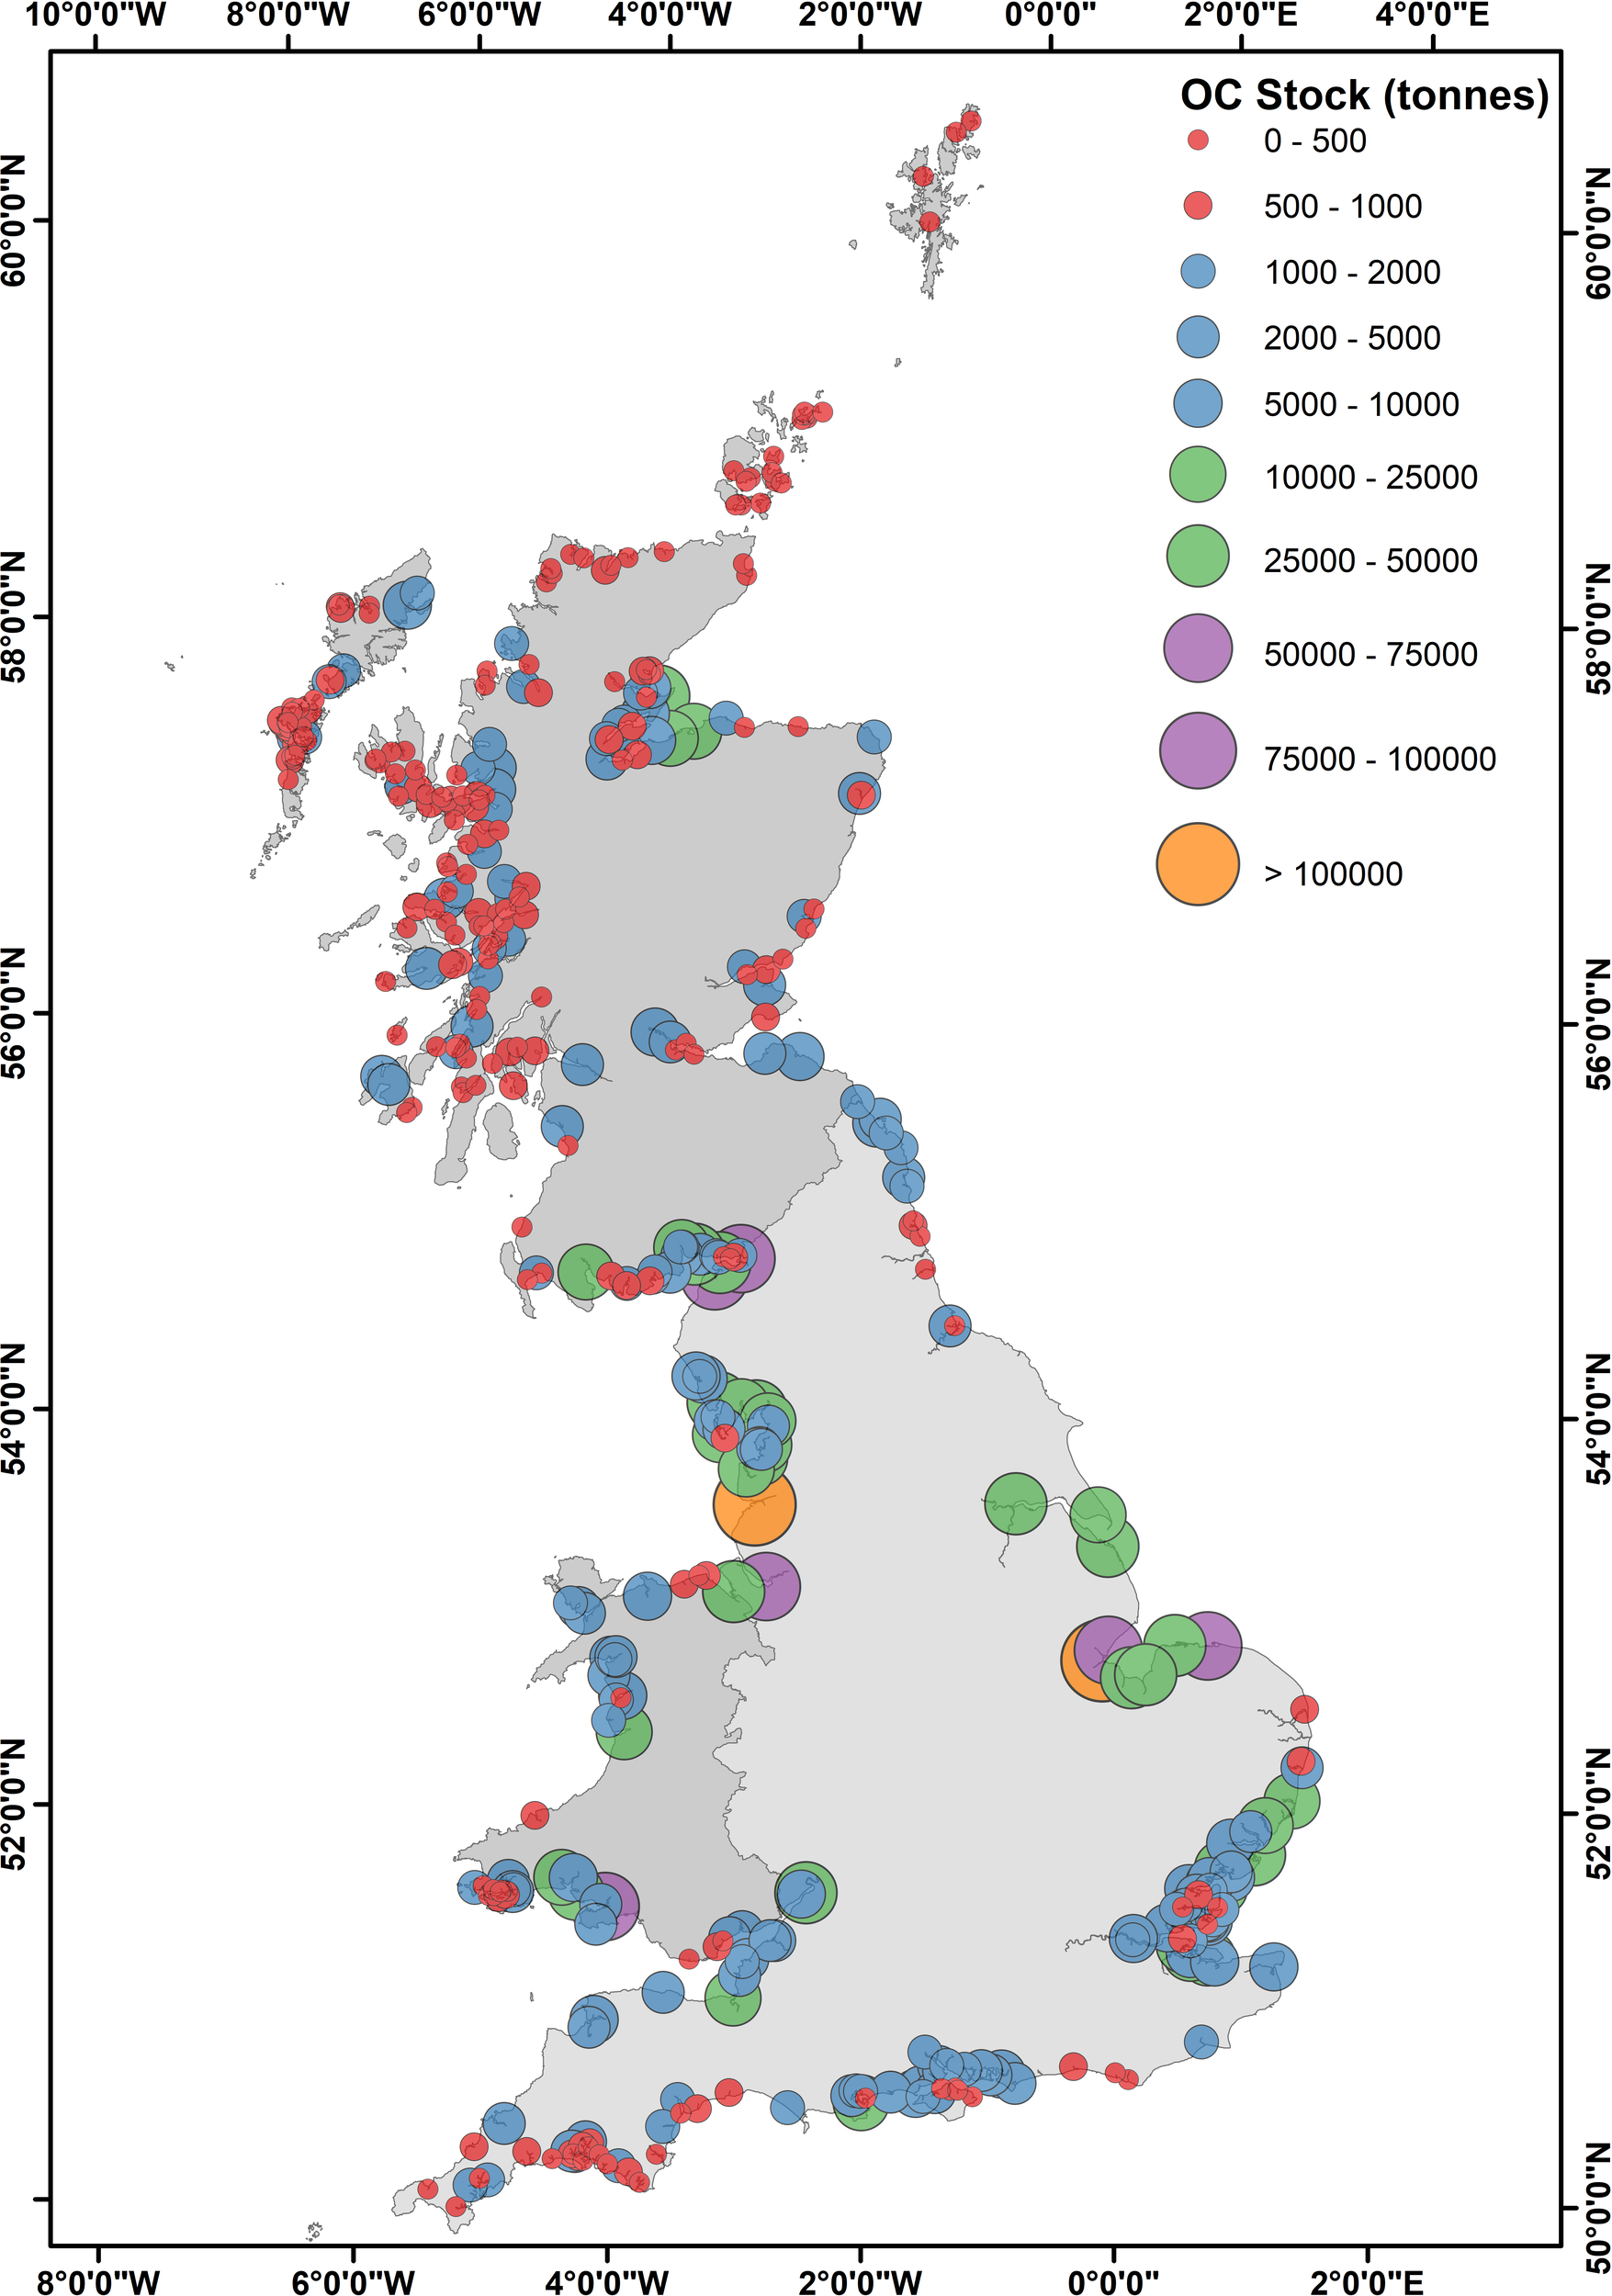
Mapped surficial soil OC stocks (tonnes) for individual saltmarshes across Great Britain. Size of circle represent the absolute magnitude of the stock (tonnes) while the colors highlight ranges: Red: < 1,000 tonnes OC, Blue 1,000 – 10,000 tonnes OC, Green: 10,000 – 50,000 tonnes OC, Purple: 50,000 – 100,000 and Orange > 100,000 tonnes OC. Full breakdown of OC stocks can be found in the supplementary data.
Marshes in the Ribble Estuary (53.711340, -2.943835) hold the largest OC stock (139,916 tonnes OC) followed by the saltmarshes found in the the major estuaries of GB such as the Wash (52.926668, 0.061452), Morecambe Bay (54.175172, -2.849556) and the Solway Firth (54.969555, -3.484984). The saltmarshes in Essex, the Solent, Dornoch Firth and Cromarty Firth are smaller and hold less OC within their soils. A large number of small marshes within these areas does result in OC stocks equivalent to the largest marshes (Figure 8; Supplementary Data). Of the 438 marshes with surficial soil OC stocks, 229 marshes hold < 1000 tonnes OC in their surficial soils, with only 30 exceeding > 20,000 tonnes of OC (Supplementary Data). This results in large disparity in the distribution of OC across GB saltmarsh with 7% of saltmarshes accounting for 55% of soil OC storage.
The spatial mapping of OC density and marsh specific OC stocks are designed to assist environmental managers and policymakers in determining how best to protect and preserve these important coastal environments and how best to move forward with the inclusion of saltmarshes in national C accounting. To that end, data used to create these maps is freely available. It is envisaged that these decision support tools will evolve as new spatial mapping is introduced and/or when additional soil parameters (e.g., dry bulk density and OC content) become available.
Conclusion
There is a growing international awareness that the burial and storage of OC in saltmarshes may provide a nature-based solution to regulating atmospheric C. A fundamental opportunity therefore presents itself to society, namely, to manage and protect these important OC hotspots from increasing climatic and anthropogenic threats. Quantifying the magnitude of the surficial soil OC stocks and how it is spatially distributed across the GB saltmarshes is a critical foundational step towards this goal. The surficial soils (top 10 cm) of GB saltmarshes contain 2.32 ± 0.47 Mt OC. Across GB marshes there is a disparity in OC stocks, the Scottish systems hold more carbon per unit area but the extreme differences in marsh extent result in the expansive marshes of England holding 69% of the total soil OC. The new spatial mapping products could not have readily been produced without the assistance of UK citizen scientists and are envisaged to provide decision support tools to assist in the management of these important C resources. The mapping has highlighted that a small number (n = 30) of large marshes located in the major estuaries (The Wash, Morecambe Bay and the Solway Firth) represent 55% of the total soil OC stock. This raises the fundamental question on how to best manage these ecosystems for C at a national scale, do we take a holistic approach for all marshes, or do we focus our efforts on the C rich areas? Although this study provides an additional contribution to the quantification and understanding of GB saltmarsh soils and their OC stores as a significant component of UKs natural capital, this new understanding of surficial soil OC stocks only represents a first step towards answering this question. The mechanisms that govern the accumulation, preservation and long-term storage of OC in these systems remain poorly defined across GB saltmarshes.
Funding
This research was finically supported by the Natural Environment Research Council funded Carbon Storage in Intertidal Environments (C-SIDE) project (grant NE/R010846/1) with additional support from the Scottish Blue Carbon Forum.
Acknowledgments
We would like to extend a special thanks to the volunteer citizen scientists that undertook soil sampling across Great Britain creating a unique and invaluable resource that is the foundation of this research. Finally, we would like to thank the Editor and reviewers for providing helpful comments that have improved the manuscript.
Publisher’s note
All claims expressed in this article are solely those of the authors and do not necessarily represent those of their affiliated organizations, or those of the publisher, the editors and the reviewers. Any product that may be evaluated in this article, or claim that may be made by its manufacturer, is not guaranteed or endorsed by the publisher.
Statements
Data availability statement
The datasets generated and analyzed for this study can be found in the Environmental Information Data Centre (www.eidc.ac.uk/) and the Marine Scotland Data (www.data.marine.gov.scot/) repository. The saltmarsh soil physical property and OC content data for England and Wales (Ruranska et al., 2022): www.catalogue.ceh.ac.uk/documents/e5554b83-910f-4030-8f4e-81967dc7047c and for Scotland, Ruranska et al. (2020): www.catalogue.ceh.ac.uk/documents/81a1301f-e5e2-44f9-afe0-0ea5bb08010f and Miller et al. (2022): https://data.marine.gov.scot/dataset/physical-and-geochemical-properties-scottish-saltmarsh-soils. The geospatial data layers (Smeaton et al., 2022) produced from this research can be found at: https://catalogue.ceh.ac.uk/documents/cb8840f2-c630-4a86-9bba-d0e070d56f04
Author contributions
The first draft of the manuscript was jointly developed by CS and AB with assistance from all authors. CL and MS organized and oversaw the citizen science sampling program. LCM, AG and WA undertook vegetation surveys and a soil sampling to ground-truth current mapping. PR and LCM conducted the physical and geochemical soil analysis under the supervision of CS and WA. CS carried out the calculations to estimate the soil OC stock with the support of AB, LJ, AG, LM and WA. All authors contributed to the manuscript revision and approved the submitted version.
Conflict of interest
The authors declare that the research was conducted in the absence of any commercial or financial relationships that could be construed as a potential conflict of interest.
Supplementary material
The Supplementary Material for this article can be found online at: https://www.frontiersin.org/articles/10.3389/fmars.2022.959459/full#supplementary-material
References
1
Aavik T. Carmona C. P. Träger S. Kaldra M. Reinula I. Conti E. et al . (2020). Landscape context and plant population size affect morph frequencies in heterostylous primula veris–results of a nationwide citizen-science campaign. J. Ecol.108 (6), 2169–2183. doi: 10.1111/1365-2745.13488
2
ABPmer (2020) Estimating the carbon sink potential of the welsh marine environment, natural resource Wales commissioned report. Available at: https://cdn.naturalresources.wales/media/692035/nrw-evidence-report-428_blue-carbon_v11-002.pdf.
3
Adam P. (1978). Geographical variation in British saltmarsh vegetation. J. Ecol., 339–366. doi: 10.2307/2259141
4
Andrews J. E. Samways G. Shimmield G. B. (2008). Historical storage budgets of organic carbon, nutrient and contaminant elements in saltmarsh sediments: Biogeochemical context for managed realignment, Humber estuary, UK. Sci. Tot. Environ.405 (1-3), 1–13. doi: 10.1016/j.scitotenv.2008.07.044
5
Austin W. Smeaton C. Riegel S. Ruranska P. Miller L. (2021). “Blue carbon stock in Scottish saltmarsh soils,” in Scottish Marine and freshwater science, vol. 12. (Marine Scotland). doi: 10.7489/12372-1
6
(2016) Natural resources Wales. Available at: https://lle.gov.wales/catalogue/item/SaltmarshExtents/?lang=en.
7
Bauer J. E. Cai W. J. Raymond P. A. Bianchi T. S. Hopkinson C. S. Regnier P. A. (2013). The changing carbon cycle of the coastal ocean. Nature504 (7478), 61–70. doi: 10.1038/nature12857
8
Baugh L. (2019). Spatial analysis of blue carbon in a UK saltmarsh: implications of carbon distribution, master’s thesis (United Kingdom: John Moores University, Liverpool). Available at: https://researchonline.ljmu.ac.uk/id/eprint/10878.
9
Beaumont N. J. Jones L. Garbutt A. Hansom J. D. Toberman M. (2014). The value of carbon sequestration and storage in coastal habitats Vol. 137 (Estuarine, Coastal and Shelf Science), 32–40.
10
Bradley P. M. Morris J. T. (1990). “Physical characteristics of salt marsh sediments: Ecological implications,” in Marine ecology progress series, vol. 61. (Oldendorf), 245–252.
11
Bridgham S. D. Megonigal J. P. Keller J. K. Bliss N. B. Trettin C. (2006). The carbon balance of north American wetlands Vol. 26 (Wetlands), 889–916.
12
Brown D. R. Conrad S. Akkerman K. Fairfax S. Fredericks J. Hanrio E. et al . (2016). Seagrass, mangrove and saltmarsh sedimentary carbon stocks in an urban estuary; coffs harbour, Australia. Region. Stud. Mar. Sci.8, 1–6. doi: 10.1016/j.rsma.2016.08.005
13
Burd F. (1989). “The saltmarsh survey of great Britain,” in An inventory of British saltmarshes, research and survey in nature conservation (Peterborough: Nature Conservancy Council).
14
Burden A. Garbutt A. Evans C. D. (2019). Effect of restoration on saltmarsh carbon accumulation in Eastern England. Biol. Lett.15, 20180773. doi: 10.1098/rsbl.2018.0773
15
Burden A. Garbutt R. A. Evans C. D. Jones D. L. Cooper D. M. (2013). “Carbon sequestration and biogeochemical cycling in a saltmarsh subject to coastal managed realignment,” in Estuarine, coastal and shelf science, vol. 120. , 12–20.
16
Burden A. Smeaton C. Angus S. Garbutt A. Jones L. Lewis H. et al . (2020). “Impacts of climate change on coastal habitats, relevant to the coastal and marine environment around the UK,” in MCCIP science review 2020.
17
Conrad C. C. Hilchey K. G. (2011). A review of citizen science and community-based environmental monitoring: issues and opportunities Vol. 176 (Environmental monitoring and assessment), 273–291.
18
Couvet D. Jiguet F. Julliard R. Levrel H. Teyssedre A. (2008). Enhancing citizen contributions to biodiversity science and public policy Vol. 33 (Interdisciplinary science reviews), 95–103.
19
Craft C. B. Seneca E. D. Broome S. W. (1991). Loss on ignition and kjeldahl digestion for estimating organic carbon and total nitrogen in estuarine marsh soils: calibration with dry combustion Vol. 14 (Estuaries), 175–179.
20
Crosby S. C. Sax D. F. Palmer M. E. Booth H. S. Deegan L. A. Bertness M. D. et al . (2016). Salt marsh persistence is threatened by predicted sea-level rise Vol. 181 (Estuarine: Coastal and Shelf Science), 93–99. doi: 10.1016/j.ecss.2016.08.018
21
Dadey K. A. Janecek T. Klaus A. . (1992). Dry-bulk density: its use and determination1. Proceedings of the ocean driling program. Sci. Res Vol. 126
22
Duarte C. M. Dennison W. C. Orth R. J. Carruthers T. J. (2008). The charisma of coastal ecosystems: addressing the imbalance Vol. 31 (Estuaries and coasts), 233–238.
23
Duarte C. M. Losada I. J. Hendriks I. E. Mazarrasa I. Marbà N. (2013). The role of coastal plant communities for climate change mitigation and adaptation. Nat. Climate Change3 (11), 961–968. doi: 10.1038/nclimate1970
24
Environment Agency (2021) Saltmarsh extent and zonation. Available at: https://data.gov.uk/dataset/0e9982d3-1fef-47de-9af0-4b1398330d88/saltmarsh-extent-zonation#licence-info.
25
Flemming B. W. Delafontaine M. T. (2000). Mass physical properties of muddy intertidal sediments: some applications, misapplications and non-applications Vol. 20 (Continental Shelf Research), 1179–1197.
26
Ford H. Garbutt A. Duggan-Edwards M. Harvey R. Ladd C. Skov M. W. (2019). Large-Scale predictions of salt-marsh carbon stock based on simple observations of plant community and soil type. Biogeosciences16 (2), pp.425–pp.436. doi: 10.5194/bg-16-425-2019
27
Ford H. Garbutt A. Jones L. Jones D. L. (2012). “Methane, carbon dioxide and nitrous oxide fluxes from a temperate salt marsh: Grazing management does not alter global warming potential,”, vol. 113. (Estuarine, Coastal and Shelf Science), 182–191.
28
Ford H. Garbutt A. Skov M. (2015). “Coastal biodiversity and ecosystem service sustainability (CBESS) dry weight root biomass from three soil depths on salt marsh sites at Morecambe bay and Essex,” in NERC environmental information data centre. doi: 10.5285/a84622db-842d-40d2-aad8-e3f85bd306c9
29
Ford H. Garbutt A. Skov M. (2016a). “Coastal biodiversity and ecosystem service sustainability (CBESS) soil organic matter content from three soil depths on saltmarsh sites at Morecambe bay and Essex,” in NERC environmental information data centre. doi: 10.5285/90457ba1-f291-4158-82dc-425d7cbb1ac5
30
Ford H. Garbutt A. Skov M. (2016b). “Coastal biodiversity and ecosystem service sustainability (CBESS) standing crop biomass on salt marsh sites at Morecambe bay and Essex,” in NERC environmental information data centre. doi: 10.5285/87114da4-3189-471f-9832-00b3e759232f
31
Ford H. Garbutt A. Skov M. (2016c). “Coastal biodiversity and ecosystem service sustainability (CBESS) soil bulk density from three soil depths on salt marsh sites at Morecambe bay and Essex,” in NERC environmental information data centre. doi: 10.5285/814be4cf-0ff2-46dd-b296-c4d9b913b6e4
32
Granek E. F. Polasky S. Kappel C. V. Reed D. J. Stoms D. M. Koch E. W. et al . (2010). Ecosystem services as a common language for coastal ecosystem-based management. Conserv. Biol.24, 207–216. doi: 10.1111/j.1523-1739.2009.01355.x
33
Harvey R. J. Garbutt A. Hawkins S. J. Skov M. W. (2019). No detectable broad-scale effect of livestock grazing on soil blue-carbon stock in salt marshes. Front. Ecol. Evol.7, 151. doi: 10.3389/fevo.2019.00151
34
Haynes T. A. (2016). “Scottish Saltmarsh survey national report,” in Scottish Natural heritage commissioned report.
35
Hinson A. L. Feagin R. A. Eriksson M. Najjar R. G. Herrmann M. Bianchi T. S. et al . (2017). The spatial distribution of soil organic carbon in tidal wetland soils of the continental united states. Global Change Biol.23 (12), 5468–5480. doi: 10.1111/gcb.13811
36
Holmquist J. R. Windham-Myers L. Bliss N. Crooks S. Morris J. T. Megonigal J. P. et al . (2018). Accuracy and precision of tidal wetland soil carbon mapping in the conterminous united states. Sci. Rep.8 (1), 1–16. doi: 10.1038/s41598-018-26948-7
37
Horton B. P. Shennan I. Bradley S. L. Cahill N. Kirwan M. Kopp R. E. et al . (2018). Predicting marsh vulnerability to sea-level rise using Holocene relative sea-level data. Nat. Commun.9, 2687. doi: 10.1038/s41467-018-05080-0
38
Hughes R. G. Paramor O. A. L. (2004). On the loss of saltmarshes in south-east England and methods for their restoration. J. Appl. Ecol.41 (3), 440–448. doi: 10.1111/j.0021-8901.2004.00915.x
39
Jones M. L. M. Angus S. Cooper A. Doody P. Everard M. Garbutt A. et al . (2011). “Coastal margins,” in UK National ecosystem assessment. understanding nature’s value to society (Cambridge: Technical Report, UNEP-WCMC), 411–457.
40
Kelleway J. J. Saintilan N. Macreadie P. I. Baldock J. A. Ralph P. J. (2017). Sediment and carbon deposition vary among vegetation assemblages in a coastal salt marsh. Biogeosciences14 (16), 3763–3779. doi: 10.5194/bg-14-3763-2017
41
Kelleway J. J. Saintilan N. Macreadie P. I. Ralph P. J. (2016). Sedimentary factors are key predictors of carbon storage in SE Australian saltmarshes. Ecosystems19 (5), 865–880. doi: 10.1007/s10021-016-9972-3
42
Ladd C. J. T. (2021). "Review on processes and management of saltmarshes across great britain.". Proc. Geol. Assoc.132, 269–283. doi: 10.1016/j.pgeola.2021.02.005
43
Ladd C. J. Duggan-Edwards M. F. Bouma T. J. Pages J. F. Skov M. W. (2019). Sediment supply explains long-term and large-scale patterns in salt marsh lateral expansion and erosion. Geophys. Res. Lett.46 (20), 11178–11187. doi: 10.1029/2019GL083315
44
Legge O. Johnson M. Hicks N. Jickells T. Diesing M. Aldridge J. et al . (2020). Carbon on the northwest European shelf: Contemporary budget and future influences. Front. Mar. Sci.7, 143. doi: 10.3389/fmars.2020.00143
45
Lilly A. B. N. Donnelly D. (2012). Map of soil organic carbon in top soils of scotland. map prepared for EU project GS-SOIL-Assessment and strategic development of INSPIRE compliant geodata-services for European soil data.
46
Lovelock C. E. Adame M. F. Bennion V. Hayes M. O’Mara J. Reef R. et al . (2014). Contemporary rates of carbon sequestration through vertical accretion of sediments in mangrove forests and saltmarshes of south East Queensland, Australia. Estuar. Coast.37 (3), 763–771. doi: 10.1007/s12237-013-9702-4
47
Luisetti T. Turner R. K. Andrews J. E. Jickells T. D. Kröger S. Diesing M. et al . (2019). Quantifying and valuing carbon flows and stores in coastal and shelf ecosystems in the UK. Ecosys. Serv.35, 67–76. doi: 10.1016/j.ecoser.2018.10.013
48
Lunn D. Spiegelhalter D. Thomas A. Best N. . (2009). The BUGS project: Evolution, critique and future directions. Stat. Med.28 (35), 3049–3067.
49
Macreadie P. I. Anton A. Raven J. A. Beaumont N. Connolly R. M. Friess D. A. et al . (2019). The future of blue carbon science. Nat. Commun.10, 3998. doi: 10.1038/s41467-019-11693-w
50
Macreadie P. I. Costa M. D. Atwood T. B. Friess D. A. Kelleway J. J. Kennedy H. et al . (2021). Blue carbon as a natural climate solution. Nat. Rev. Earth Environ.2 (12), 826–839. doi: 10.1038/s43017-021-00224-1
51
Marley A. R. Smeaton C. Austin W. E. (2019). An assessment of the tea bag index method as a proxy for organic matter decomposition in intertidal environments. J. Geophys. Res.: Biogeosci.124 (10), 2991–3004. doi: 10.1029/2018JG004957
52
Mason V. G. Wood K. A. Jupe L. L. Burden A. Skov M. W. (2022). “UK Saltmarsh code: Systematic review and evidence synthesis,” in Initial report. report to the natural environment investment readiness fund, vol. 36. (Bangor: UK Centre for Ecology & Hydrology).
53
May V. J. Hansom J. D. (2003). Coastal geomorphology of great britain. geological conservation review series no. 28 (Joint Nature Conservation Committee, Peterborough).
54
McKinley D. C. Miller-Rushing A. J. Ballard H. L. Bonney R. Brown H. Cook-Patton S. C. et al . (2017). Citizen science can improve conservation science, natural resource management, and environmental protection. Biol. Conserv.208, 15–28. doi: 10.1016/j.biocon.2016.05.015
55
McLeod E. Chmura G.L. Bouillon S. Salm R. Björk M. Duarte C.M. et al . (2011). A blueprint for blue carbon: Towards an improved understanding of the role of vegetated coastal habitats in sequestering CO2. Front. Ecol. Environ.9, 552–560. doi: 10.1890/110004
56
Mcowen C. J. Weatherdon L. V. Van Bochove J. W. Sullivan E. Blyth S. Zockler C. et al . (2017). A global map of saltmarshes. Biodivers. Data J.5). doi: 10.3897/BDJ.5.e11764
57
Miller L. C. Smeaton C. Yang H. Austin W. E. N. (2022). Physical and geochemical properties of Scottish saltmarsh soils. Mar. Scotl. Data. doi: 10.7489/12422-1
58
Mueller P. Do H. T. Jensen K. Nolte S. (2019a). “Origin of organic carbon in the topsoil of wadden Sea salt marshes,” in Marine ecology progress series, vol. 62410(1). (Wadden Sea. Ecosphere), 39–50.
59
Mueller P. Ladiges N. Jack A. Schmiedl G. Kutzbach L. Jensen K. et al . (2019b). Assessing the long-term carbon-sequestration potential of the semi-natural salt marshes in the European wadden Sea. Ecosphere10 (1), e02556. doi: 10.1002/ecs2.2556
60
Murray N. J. Worthington T. A. Bunting P. Duce S. Hagger V. Lovelock C. E. et al . (2022). High-resolution mapping of losses and gains of earth’s tidal wetlands. Science376 (6594), pp.744–pp.749. doi: 10.1038/s41586-018-0805-8
61
Nellemann C. Corcoran E. (Eds.) (2009). Blue carbon: the role of healthy oceans in binding carbon: a rapid response assessment (UNEP/Earthprint).
62
Nieuwenhuize J. Maas Y. E. Middelburg J. J. (1994). Rapid analysis of organic carbon and nitrogen in particulate materials. Mar. Chem.45 (3), 217–224. doi: 10.1016/0304-4203(94)90005-1
63
Ouyang X. Lee S. Y. (2014). Updated estimates of carbon accumulation rates in coastal marsh sediments. Biogeosciences11 (18), 5057–5071. doi: 10.5194/bg-11-5057-2014
64
Ouyang X. Lee S. Y. (2020). Improved estimates on global carbon stock and carbon pools in tidal wetlands. Nat. Commun.11 (1), pp.1–pp.7. doi: 10.1038/s41467-019-14120-2
65
Parsons J. Lukyanenko R. Wiersma Y. (2011). Easier citizen science is better. Nature471 (7336), 37–37. doi: 10.1038/471037a
66
Penk (2019). Preliminary carbon stocks of Irish saltmarshes, environmental protection agency report 2018-CCRP-SS.25.
67
Penk M. R. Perrin P. M. (2022). Variability of plant and surface soil carbon concentration among saltmarsh habitats in Ireland (Estuaries and Coasts), 1–15.
68
Phillips T. B. Ballard H. L. Lewenstein B. V. Bonney R. (2019). Engagement in science through citizen science: Moving beyond data collection Vol. 103 (Science Education), 665–690.
69
Porter J. Austin W. Burrows M. Clarke D. Davies G. Kamenos N. et al . (2020). “Blue carbon audit of Orkney waters,” in Scottish Marine and freshwater science reports, vol. 11. (Marine Scotland). doi: 10.7489/12262-1
70
Pribyl D. W. (2010). A critical review of the conventional SOC to SOM conversion factor. Geoderma156 (3-4), 75–83. doi: 10.1016/j.geoderma.2010.02.003
71
Pye K. French P. W. (1993). “Cambridge Environmental research consultants Ltd.(United kingdom); ministry of agriculture, fisheries and food, London (United kingdom);,” in Erosion and accretion processes on British saltmarshes: Volume four-modelling of saltmarsh and mudflat processes (Cambridge Environmental Research Consultants).
72
Rodwell J. S. (2000). British Plant communities, maritime communities and vegetation of open habitats Vol. 5 (Cambridge, UK: Cambridge University Press).
73
Rodwell J. S. (1991). British plant communities: Volume 5, Maritime communities and vegetation of open habitats5, Cambridge University Press.
74
Rogers K. Macreadie P. I. Kelleway J. J. Saintilan N. (2019). Blue carbon in coastal landscapes: a spatial framework for assessment of stocks and additionality. Sustain. Sci.14, 453–467. doi: 10.1007/s11625-018-0575-0
75
Ruranska P. Ladd C. J. T. Smeaton C. Skov M. W. Austin W. E. N. (2022). Dry bulk density, loss on ignition and organic carbon content of surficial soils from English and welsh salt marshes 2019 (NERC EDS Environmental Information Data Centre). doi: 10.5285/e5554b83-910f-4030-8f4e-81967dc7047c
76
Ruranska P. Miller L. C. Hindle C. Ladd C. J. T. Smeaton C. Skov M. W. et al . (2020). Dry bulk density, loss on ignition and organic carbon content of surficial soils from Scottish salt marshes 2018-2019 (NERC Environmental Information Data Centre). doi: 10.5285/81a1301f-e5e2-44f9-afe0-0ea5bb08010f
77
Schuerch M. Spencer T. Temmerman S. Kirwan M. L. Wolff C. Lincke D. et al . (2018). Future response of global coastal wetlands to sea-level rise. Nature561, 231–234. doi: 10.1038/s41586-018-0476-5
78
Smeaton C. Austin W. E. (2017). Sources, sinks, and subsidies: Terrestrial carbon storage in mid-latitude fjords. J. Geophys. Res.: Biogeosci122 (11), 2754–2768.
79
Smeaton C. Burden A. Ruranska P. Ladd C. J.T. Garbutt A. Jones L. et al (2022). Spatial mapping of surficial soil organic carbon storage and stocks across Great British saltmarshes. NERC EDS Environ. Inform. Data Centre. doi: 10.5285/cb8840f2-c630-4a86-9bba-d0e070d56f04
80
Smeaton C. Barlow N. L. Austin W. E. (2020). Coring and compaction: Best practice in blue carbon stock and burial estimations. Geoderma364, 114180. doi: 10.1016/j.geoderma.2020.114180
81
Smout T. C. (2003). 'Landscape and history since 1500', English historical review, Vol. 118. 848–850.
82
Theuerkauf E. J. Stephens J. D. Ridge J. T. Fodrie F. J. Rodriguez A. B. (2015). Carbon export from fringing saltmarsh shoreline erosion overwhelms carbon storage across a critical width threshold. Estuar. Coast. Shelf. Sci.164, 367–378. doi: 10.1016/j.ecss.2015.08.001
83
Thorhaug A. L. Poulos H. M. López-Portillo J. Barr J. Lara-Domínguez A. L. Ku T. C. et al . (2019). Gulf of Mexico estuarine blue carbon stock, extent and flux: Mangroves, marshes, and seagrasses: A north American hotspot. Sci. Tot. Environ.653, 1253–1261. doi: 10.1016/j.scitotenv.2018.10.011
84
Van Bemmelen J. M. (1890). Über die bestimmung des wassers, des humus, des schwefels, der in den colloïdalen silikaten gebundenen kieselsäure, des mangans usw im ackerboden Vol. 37 (Die Landwirthschaftlichen Versuchs-Stationen).
85
Vaughn D. R. Bianchi T. S. Shields M. R. Kenney W. F. Osborne T. Z. (2020). Increased organic carbon burial in northern Florida mangrove-salt marsh transition zones. Global Biogeochem. Cycle.34 (5), e2019GB006334. doi: 10.1029/2019GB006334
86
Verardo D. J. Froelich P. N. McIntyre A. (1990). Determination of organic carbon and nitrogen in marine sediments using the Carlo erba NA-1500 analyzer. deep Sea research part a. Oceanogr. Res. Paper.37 (1), 157–165. doi: 10.1016/0198-0149(90)90034-S
87
Yost J. L. Hartemink A. E. (2019). Soil organic carbon in sandy soils: A review. Adv. Agron.158, 217–310. doi: 10.1016/bs.agron.2019.07.004
88
Young M. A. Serrano O. Macreadie P. I. Lovelock C. E. Carnell P. Ierodiaconou D. (2021). National scale predictions of contemporary and future blue carbon storage. Sci. Tot. Environ.800, 149573. doi: 10.1016/j.scitotenv.2021.149573
Summary
Keywords
saltmarsh, carbon, vegetation, soil, organic matter, citizen science, spatial mapping, Great Britain
Citation
Smeaton C, Burden A, Ruranska P, Ladd CJT, Garbutt A, Jones L, McMahon L, Miller LC, Skov MW and Austin WEN (2022) Using citizen science to estimate surficial soil Blue Carbon stocks in Great British saltmarshes. Front. Mar. Sci. 9:959459. doi: 10.3389/fmars.2022.959459
Received
01 June 2022
Accepted
18 July 2022
Published
11 August 2022
Volume
9 - 2022
Edited by
Alberto Basset, University of Salento, Italy
Reviewed by
Yining Chen, Ministry of Natural Resources, China; Xiaoguang Ouyang, Southern Marine Science and Engineering Guangdong Laboratory (Guangzhou), China
Updates
Copyright
© 2022 Smeaton, Burden, Ruranska, Ladd, Garbutt, Jones, McMahon, Miller, Skov and Austin.
This is an open-access article distributed under the terms of the Creative Commons Attribution License (CC BY). The use, distribution or reproduction in other forums is permitted, provided the original author(s) and the copyright owner(s) are credited and that the original publication in this journal is cited, in accordance with accepted academic practice. No use, distribution or reproduction is permitted which does not comply with these terms.
*Correspondence: Craig Smeaton, cs244@st-andrews.ac.uk
†These authors share first authorship
This article was submitted to Marine Ecosystem Ecology, a section of the journal Frontiers in Marine Science
Disclaimer
All claims expressed in this article are solely those of the authors and do not necessarily represent those of their affiliated organizations, or those of the publisher, the editors and the reviewers. Any product that may be evaluated in this article or claim that may be made by its manufacturer is not guaranteed or endorsed by the publisher.