Abstract
Body color is an essential ecological phenotypic trait determining the ability of aquatic animals to adapt to or survive in a treacherous environment. However, researches regarding its underlying molecular mechanism in leopard coral groupers has been limited. Therefore, mRNAs, metabolites, and miRNAs of different-colored leopard coral grouper (Plectropomus leopardus) were sequenced to investigate the body color formation mechanism. The transcriptome analysis identified 1236 genes as differentially expressed genes (DEGs), of which 579 were up-regulated and 657 were down-regulated in the red-colored group compared with the brown-colored group (FDR < 0.01 and |log2FC| > 1). Metabolome analysis revealed 439 and 84 SDMs in POS and NEG of liquid chromatography-mass spectrometry, respectively (VIP > 1 and P < 0.05). The miRNA analysis exhibited 149 (120 up-regulated and 29 down-regulated) differentially expressed miRNAs (DEMs) in the analysis of the brown-colored vs. red-colored groups (P < 0.05 and |log2FC| > 1), including miR-144, miR-185, miR-192, miR-2188, miR-6316, novel-m0015, and novel-m0040. Integrated analysis of multiple omics exhibited that carotenoid metabolism, immune response, lipid metabolism, and amino acid metabolism were involved in the body color formation and adaptation to the environment. Therefore, the present multiomics research prepared a foundation for bright body color formation and promoted the process of preferred body-color breeding.
Introduction
Fish often display captivating color patterns that are crucial for multiple biological processes for adaptation and survival in the environment, such as predator avoidance, species identification, photoreception, structural support, thermoregulation, microbial resistance, and selective mating (Kelsh, 2004; Hubbard et al., 2010; Zhou et al., 2019). However, the underlying mechanism of these adaptation consequences is still unclear. Additionally, fish colors such as bright colors or red are preferred by humans, thus influencing fish prices (Vissio et al., 2021). Therefore, the mechanism of body color formation is quite necessary to carry out.
Body color formation involved in diverse pigment synthesis could be influenced by genetic, physiological, nutritional, and environmental conditions. Genetics is the most vital factor influencing body color formation through multiple genes and regulatory molecules (Jiang et al., 2014). With the rapid development of multiple-omics sequencing technology, several studies have explored candidate genes associated with body color. Transcriptome analysis of body color formation from different fishes has been reported in species such as Oujiang common carp, red Tilapia, East African cichlid fish, and giant stone loach (Zhu et al., 2016; Ahi et al., 2020).
Diverse phenotype traits of animals are reported that they are regulated by transcripts and metabolites and metabolome sequencing analyses could obtain different or additional information for phenotypic diversity (Yang et al., 2018; Huang et al., 2021). Integrated transcriptome and metabolome analyses have been utilized in numerous species such as Coilia nasus (Xu et al., 2016), Pinctada fucata martensii (Zhang et al., 2021), and Eriocheir sinensis (Wang et al., 2021) to analyze for phenotypic differences. The absence of metabolite resolution prevents the comprehensive understanding of the process involved in phenotypic formation (Wang et al., 2015; Yang et al., 2020).
miRNAs regulate endogenous gene expression and affect transcripts and protein levels (Bizuayehu and Babiak, 2014). Multiple miRNAs have been identified through high-throughput sequencing to explore their function in body color formation (Wang et al., 2017; Herkenhoff et al., 2018). The miRNA sequencing analyses of common carp (Luo et al., 2018), chinook salmon (Madaro et al., 2020), and red tilapia (Wang et al., 2018) have been performed, and miRNAs regulating body color formation have been identified. However, few studies report the function of miRNA on body color differentiation in leopard coral grouper.
Leopard coral grouper (Plectropomus leopardus) is characterized by different body colors that influence its survival in a changeable environment and economic value (Maoka et al., 2017). Transcriptome or genome sequencing analysis of P. leopardus explored multiple genes associated with body color formation (Wang et al., 2015; Zhu et al., 2021; Hao et al., 2022). However, studies of the underlying mechanism of body color formation in P. leopardus are still unclear. Therefore, the present study used multiomics technology, including transcriptomics and metabolomics, to explore the underlying mechanisms of miRNAs, mRNAs, and metabolites associated with body color formation of P. leopardus.
Materials and methods
Experimental samples
The leopard coral grouper P. leopardus with 4-month-old which hold relative stable body color (Chen et al., 2014) were obtained from Hainan Yonghe Biological Technology Co., Ltd., China. Both the red-colored and brown-colored groups were obtained from base stock established with the breeders collected from Hainan and Taiwan provinces of China, Australia and Philippines. They were reared in the same conditions with studies of Zhu et al. (2021) and Hao et al. (2022). The skin tissues from similar part of six fishes of every group were used for metabolome sequencing, and every two samples were mixed to make one sample for mRNA and miRNA analysis (Figure S1, Zhu et al., 2021; Hao et al., 2022). Red-colored group data of mRNA and miRNA were obtained and analyzed from the Sequence Read Archive (SRA) of the NCBI (SRR15195628, SRR15195629, SRR15195630 and SRR15647331, SRR15647332, SRR15647333, respectively). All animal experiments were conducted following the guidelines and approval of the respective Animal Care and Use Committee of Guangdong Ocean University, China.
Transcriptome analysis
A transcriptome library of the brown-colored group was constructed with NEBNext® Ultra™ RNA Library Prep Kit for Illumina® (NEB, Ipswich, MA, USA) and sequenced by the Illumina HiSeq2500/X platform. Raw data were filtered to obtain clean data and then aligned with the reference genome (Zhou et al., 2020) through TopHat v2.0.12. Cuffquant and cuffnorm (v2.2.1). Differentially expressed genes (DEGs) (FDR < 0.01 and |log2FC| > 1) were identified with the DESeq2 R package (Anders and Huber, 2010). Then DEGs were further analyzed with GOseq R package (Young et al., 2010) and KOBAS (Mao et al., 2005) to perform Gene Ontology (GO) and Kyoto Encyclopedia of Genes and Genomes (KEGG) pathway enrichment analyses.
Metabolomic analysis
Each sample (50 mg) was utilized in liquid chromatography-mass spectrometry (LC-MS)/MS and high-performance liquid chromatography analysis as per the method described by Zhu et al. (2021). Metabolite detection and identification was as per the primary and secondary spectral data with the following databases: KNApSAcK (http://kanaya.naist.jp/KNApSAcK/), HMDB (http://www.hmdb.ca/), MWDB (Wuhan Metware Biotechnology Co., Ltd.), MassBank (http://www.massbank.jp/), METLIN (http://metlin.scripps.edu/index.php), and MoToDB (http://www.ab.wur.nl/moto/). Metabolite quantification was performed with the multiple reaction monitoring mode. MetaboAnalystR (R) (V1.0.1) (Chong and Xia, 2018) was utilized for multivariate statistical analyses, including principal component analysis (PCA) and orthogonal projections to latent structures discriminant (OPLS-DA) analysis. Then, SDMs were identified (VIP > 1 and P < 0.05) and analyzed with KOBAS and Fisher’s exact tests to explore enriched KEGG pathways.
miRNA analysis
Total RNA from mRNA sequencing analysis of the brown-colored group was used for miRNA sequencing as per the method described by Hao et al. (2022). DEMs analysis between the brown-colored and red-colored groups was performed by the edgeR software (Robinson et al., 2010) (|log2FC| > 1 and p-value < 0.05). Quantitative real time PCR reactions of miRNA were preformed using 2X SG Fast qPCR Master Mix (B639271, BBI, Roche) on Roche LightCycler 480 System II according to manufacture’s instruction. miR-23 was used as endogenous control for miRNA. miRNA target genes were predicted with software such as Miranda (version 3.3a), TargetScan (version: 7.0), and RNAhybrid (version 2.1.2)+svm_light (version 6.01). Then, DEMs target genes were further analyzed with the KEGG pathway (Kanehisa et al., 2008) and GO terms. With the data of the focus pathway, the Cytoscape v3.6.0. (Shannon et al., 2003) was utilized to construct the network of DEGs and DEMs. Cytoscape v3.6.0. were also utilized to analyze the integrated analysis of focus pathway of DEGs, SDMs and DEMs.
Results
Transcriptome analysis of the brown-colored vs. red-colored groups
Transcriptome sequencing of the brown-colored group was performed, and 41.44 M clean reads were obtained. The brown-colored fish mRNA raw data were deposited in Sequence Read Archive (SRA) of NCBI (dataset identifier: SRR15195625, SRR15195626, SRR15195627). The brown-colored group exhibited the average mapping rate of 82.64% and held Q30 of 94.10%, indicating that the data quality in the present study was sufficient for the followed research (Table S1).
DEGs of the brown-colored and red-colored groups were compared, and 1236 DEGs were obtained (FDR < 0.01 and |log2FC| > 1) (Figure S2A). The red-colored group comprised 579 up-regulated and 657 down-regulated genes compared with brown-colored group. DEG annotation analysis exhibited that genes associated with carotenoid uptake, transport, and accumulation such as solute carrier family genes, low-density lipoproteins receptor (LDLR), fatty acid hydroxylase (FAX), scavenger receptor cysteine-rich related protein (SRCR), retinol dehydrogenase (RDH), dehydrogenase/reductase SDR related gene (dhrs), paired-box protein (Pax), and transcription factor Sox exhibited significantly different expression (Figure 1, Table 1).
Figure 1
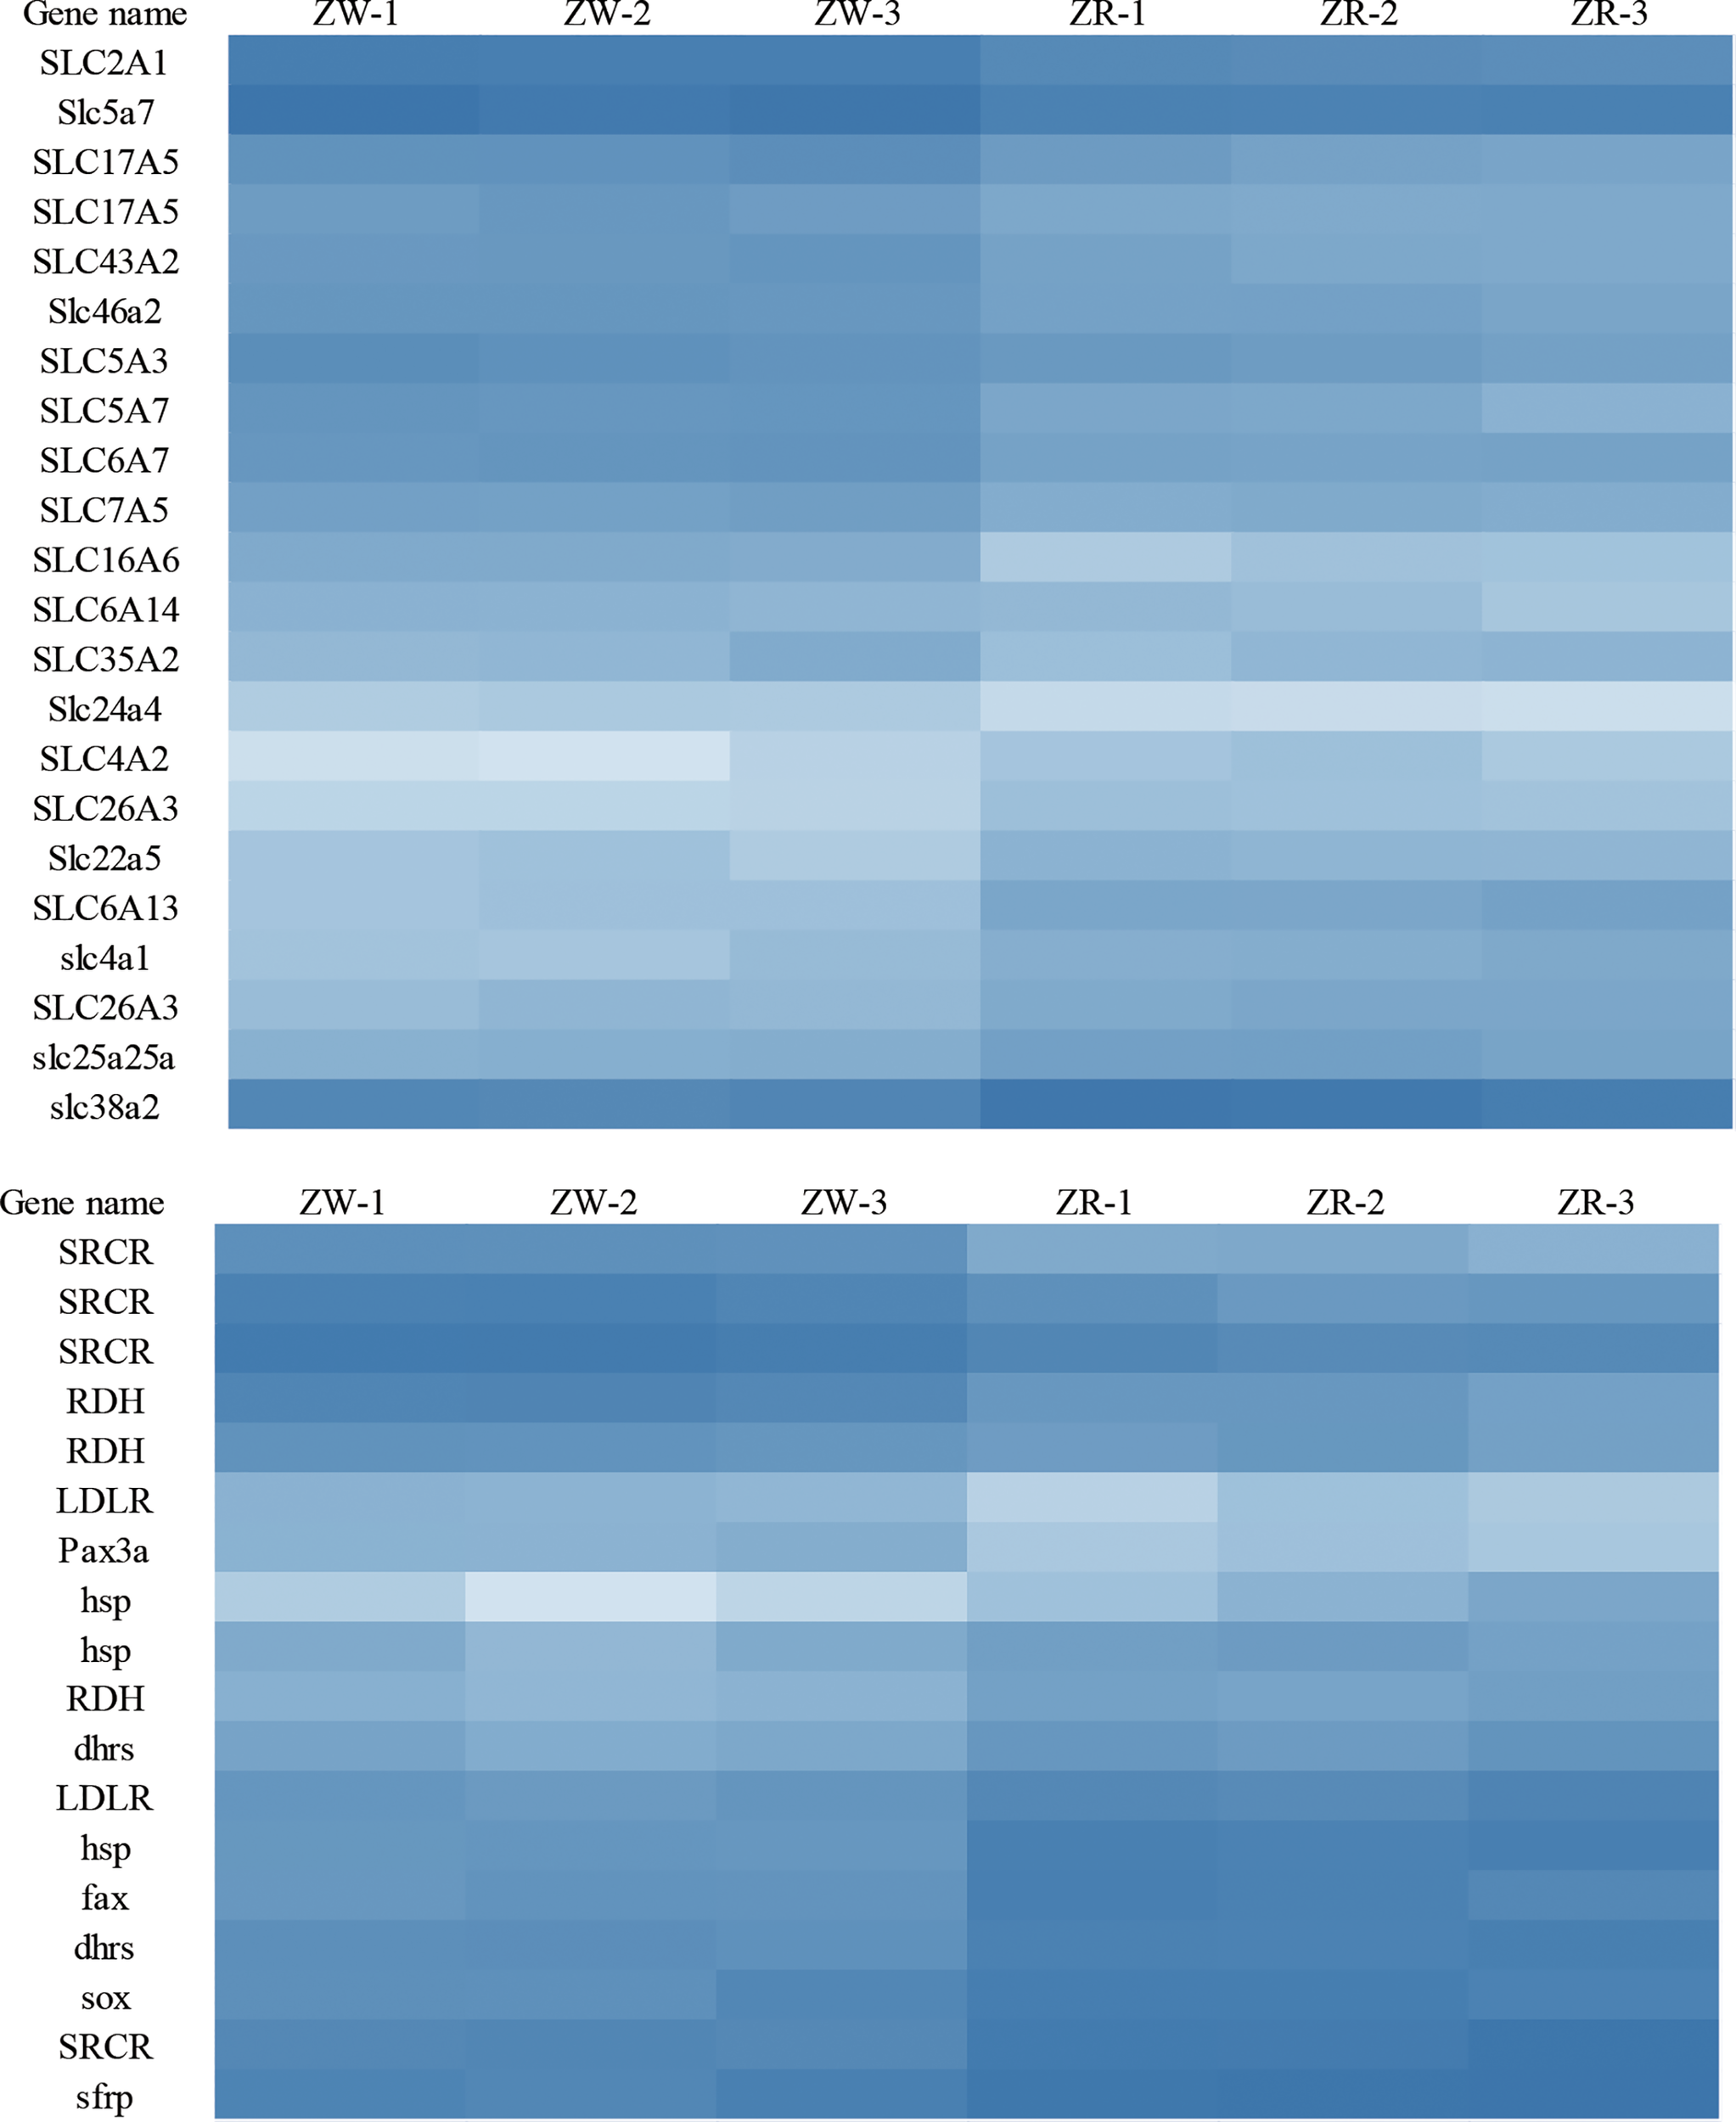
DEGs related to carotenoid uptake, transport, and accumulation. ZW represents the brown group, and ZR represents the red group.
Table 1
| Gene ID | FDR | log2FC | regulated | Gene name |
|---|---|---|---|---|
| Dxb_GLEAN_10006169 | 4.5E-19 | -2.200808 | down | SLC16A6 |
| Trans_newGene_4315 | 2.86E-05 | -1.309899 | down | SLC17A5 |
| Trans_newGene_1057 | 1.845E-05 | -1.234698 | down | SLC17A5 |
| Dxb_GLEAN_10011069 | 7.921E-05 | 1.23658 | up | Slc22a5 |
| Dxb_GLEAN_10008784 | 0.000301 | -1.230744 | down | Slc24a4 |
| Dxb_GLEAN_10018303 | 2.236E-11 | 1.2402186 | up | slc25a25a |
| Dxb_GLEAN_10004215 | 0.0001003 | 1.2935031 | up | SLC26A3 |
| Trans_newGene_3514 | 0.0007052 | 1.2759749 | up | SLC26A3 |
| Dxb_GLEAN_10022220 | 7.683E-22 | -1.289279 | down | SLC2A1 |
| Dxb_GLEAN_10002135 | 0.0006884 | -1.268108 | down | SLC35A2 |
| Dxb_GLEAN_10004177 | 2.814E-15 | 1.2906343 | up | slc38a2 |
| Dxb_GLEAN_10018412 | 3.565E-14 | -1.354515 | down | SLC43A2 |
| Dxb_GLEAN_10005388 | 3.522E-11 | -1.058723 | down | Slc46a2 |
| Dxb_GLEAN_10007543 | 1.635E-10 | 1.6564535 | up | slc4a1 |
| Dxb_GLEAN_10011669 | 0.0017135 | 1.3927896 | up | SLC4A2 |
| Trans_newGene_4518 | 3.237E-05 | -1.05782 | down | SLC5A3 |
| Dxb_GLEAN_10014954 | 2.113E-15 | -1.749821 | down | SLC5A7 |
| Trans_newGene_4327 | 5.948E-06 | -1.097287 | down | Slc5a7 |
| Trans_newGene_5179 | 2.746E-20 | 2.3656301 | up | SLC6A13 |
| Dxb_GLEAN_10021523 | 0.0012084 | -1.005708 | down | SLC6A14 |
| Dxb_GLEAN_10011454 | 1.409E-14 | -1.131354 | down | SLC6A7 |
| Dxb_GLEAN_10013475 | 3.145E-10 | -1.094227 | down | SLC7A5 |
| Dxb_GLEAN_10018772 | 3.755E-29 | -2.230029 | down | SRCR |
| Trans_newGene_12278 | 5.693E-15 | -1.709694 | down | SRCR |
| Trans_newGene_3015 | 4.293E-19 | -1.294832 | down | SRCR |
| Dxb_GLEAN_10019886 | 5.037E-16 | 1.312796 | up | SRCR |
| Trans_newGene_6258 | 8.348E-05 | 1.2551171 | up | Low-density lipoprotein receptor |
| Dxb_GLEAN_10004561 | 3.394E-05 | -1.417719 | down | Low-density lipoprotein receptor |
| Dxb_GLEAN_10014388 | 6.239E-13 | 1.2109622 | up | Secreted frizzled-related protein |
| Dxb_GLEAN_10014525 | 2.057E-59 | 2.000181 | up | hsp |
| Dxb_GLEAN_10002582 | 0.006649 | 1.0406172 | up | hsp |
| Dxb_GLEAN_10011322 | 0.000222 | 1.6573079 | up | hsp |
| Dxb_GLEAN_10020227 | 1.09E-07 | -1.35728 | down | Pax3a |
| Dxb_GLEAN_10008567 | 3.136E-08 | 1.1794414 | up | sox |
| Dxb_GLEAN_10005589 | 9.261E-13 | 1.5639884 | up | fatty acid hydroxylase |
| Dxb_GLEAN_10014241 | 6.099E-17 | 1.0463573 | up | dehydrogenase/reductase /dhrs |
| Trans_newGene_5039 | 1.59E-06 | 1.2752304 | up | dehydrogenase/reductase /dhrs |
| Dxb_GLEAN_10013940 | 3.112E-07 | -1.064006 | down | retinol dehydrogenase RDH12 |
| Dxb_GLEAN_10013941 | 2.175E-18 | -1.789969 | down | retinol dehydrogenase RDH12 |
| Dxb_GLEAN_10006098 | 4.828E-06 | 1.3285616 | up | retinol dehydrogenase RDH12 |
DEGs associated with carotenoid metabolism.
GO terms analysis of DEGs involved the analysis of the molecular function, cellular component, and biological processes (Figure S2B). GO enrichment analysis exhibited 125 GO enrichment terms (P < 0.05), including multiple immune-related terms such as chemokine activity, immune response, immune system process, inflammatory response, and cytokine activity. Immune-related pathways such as cell adhesion molecules (CAMs) (Figure 2A), tumor necrosis factor (TNF) signaling pathway, and NOD-like receptor signaling pathway, which are consistent with the result of GO terms analysis, were also enriched. Pathway enrichment analysis showed that pigment synthesis associated pathway, including the “MAPK signaling pathway” and “Wnt signaling pathway”, were enriched (P < 0.5) (Table S2, Figure S2C). Furthermore, glycine, serine, threonine, and glutathione metabolism were enriched with multiple associated enzymes with significantly higher expression levels in the red-colored group (Figures 2B, C).
Figure 2
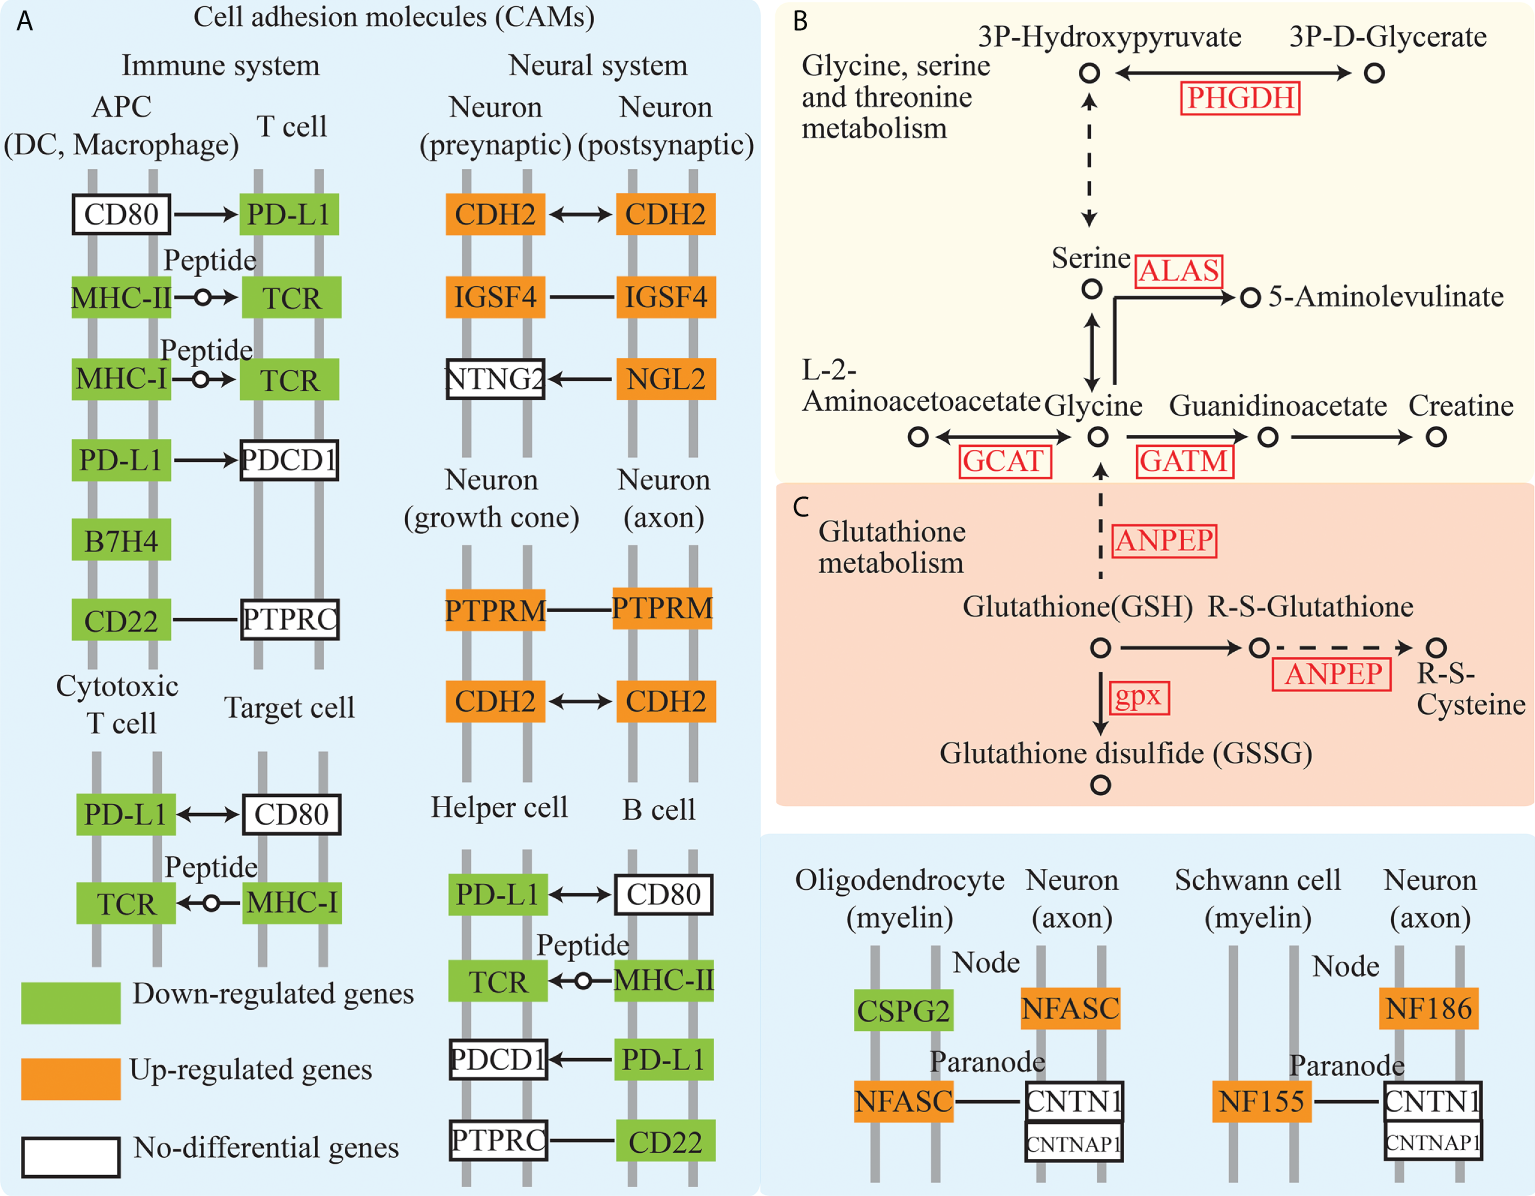
Cell adhesion molecules, glycine, serine and threonine metabolism, and glutathione metabolism pathway analysis from transcriptome. (A–C) showed the Cell adhesion molecules, glycine, serine and threonine metabolism, and Glutathione metabolism pathway, respectively.
Metabolome analysis of different-colored groups of P. leopardus
In the LC-MS analysis, 3362 valid peaks of POS and 178 valid peaks of NEG were identified. A total of 439 SDMs for POS and 84 SDMs for NEG (VIP>1 and P < 0.05, Figure S3) were detected in the brown-colored vs. red-colored groups. The red-colored group exhibited 226 up-regulated, and 213 down-regulated SDMs in POS (Table S3), whereas it exhibited 37 up-regulated and 47 down-regulated SDMs in NEG (Table S3).
SDM pathway enrichment revealed 13 and 3 pathways in POS and NEG models enriched for SDMs between two colored groups, respectively (Figures S4A, B). Metabolic pathways “glycine, serine, and threonine metabolism,” “linoleic acid metabolism,” “retinol metabolism,” and “arachidonic acid metabolism” were significantly enriched. Furthermore, metabolites related to “linoleic acid metabolism” and “arachidonic acid metabolism” such as lecithin, PGD2, phosphatidylcholine, and 12-Oxo-9(Z)-dodecenoic acid exhibited higher concentrations in the red-colored group than those in the brown-colored group (Figure 3, Table 2).
Figure 3
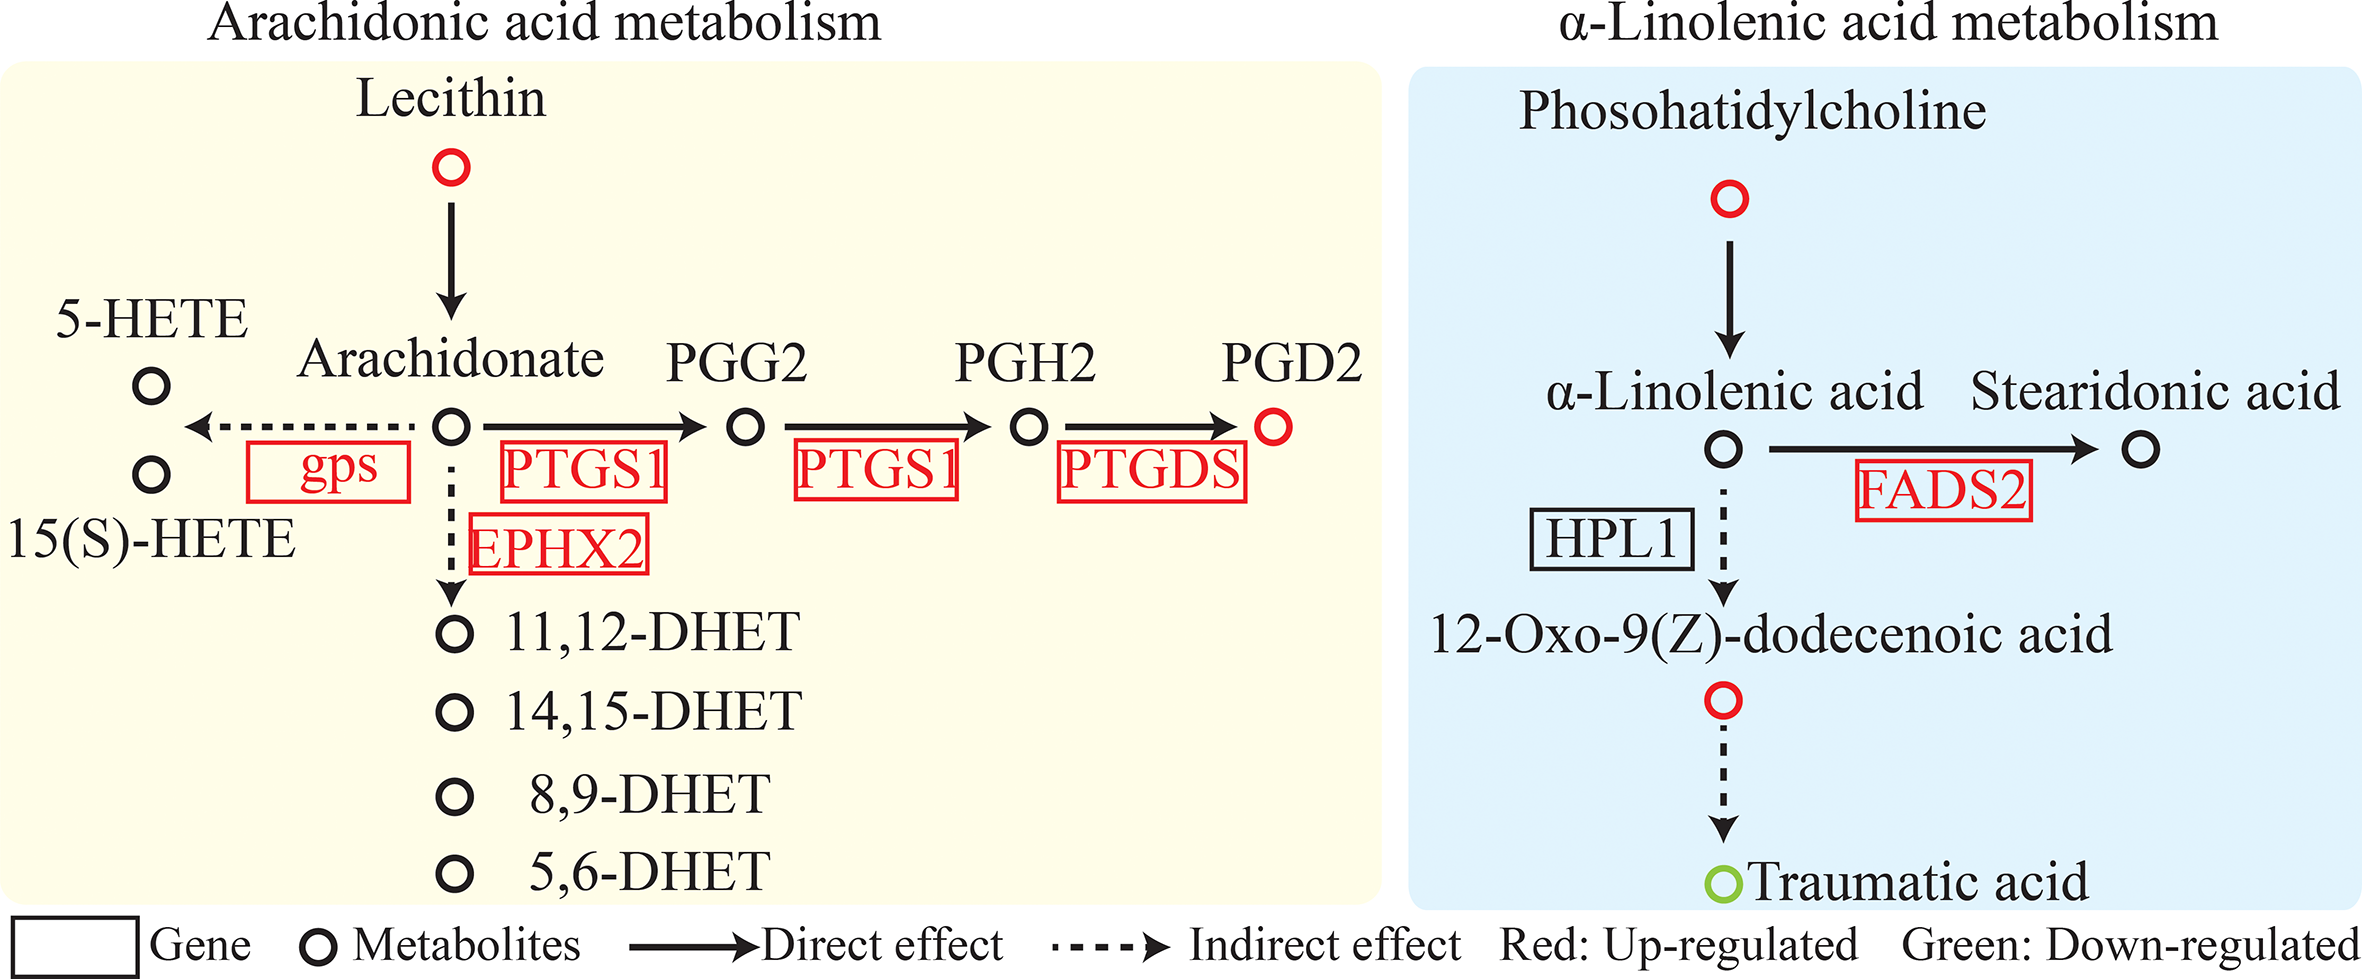
Linoleic acid metabolism and arachidonic acid metabolism pathway analysis.
Table 2
| Genes Name | FDR | pValue | Log2FC | regulated |
|---|---|---|---|---|
| gpx | 4.23E-10 | 1.18E-11 | 1.501275966 | up |
| PTGS1 | 1.96E-21 | 1.25E-23 | 1.932445412 | up |
| PTGDS | 8.64E-29 | 2.79E-31 | 2.074595235 | up |
| EPHX2 | 5.64E-09 | 1.94E-10 | 1.08502927 | up |
| FADS2 | 0.000644266 | 7.66E-05 | 1.056664818 | up |
| Metabolites Name | VIP | pValue | Log2FC | regulated |
| PGD2 | 1.451257553 | 0.041606847 | 8.511581 | up |
| Lecithin | 1.699833341 | 0.013432587 | 11.254957 | up |
| 12-Oxo-9(Z)-dodecenoic acid | 1.272757197 | 9.5566E-18 | 15.380007 | up |
| Traumatic acid | 1.493301432 | 0.030735835 | -1.4144236 | down |
Integrated analysis of DEGs and SDMs.
Integrated analysis of transcriptome and metabolome
Integrated analysis of DEGs and SDMs for pathway enrichment was performed (Figure S4C). A total of 55 significantly enriched pathways were identified, including arachidonic acid metabolism; retinol metabolism; and glycine, serine, and threonine metabolism (Figure 3, Table 2, Table S4).
miRNA-mRNA analysis of different-colored groups of P. leopardus
miRNA libraries constructed for brown-colored samples were sequenced, and 13.15 M high-quality reads were obtained (Table S5). The miRNA raw data of brown-colored fish were deposited in the SRA of NCBI (dataset identifier: SRR15647328, SRR15647329, and SRR15647330). Compared with the miRNA sequencing data of the red-colored group, 149 DEMs were identified (P<0.05 and |log2FC|>1) (Table S6), and the red-colored group exhibited 120 up-regulated and 29 down-regulated miRNAs compared with brown-colored group. Eight miRNAs were selected for validation and showed a same expression trend with the sequencing data, which indicated that the miRNA sequencing data reliably displayed the differences in miRNAs expression in the different body color groups (Figure S5).
Integrated analysis of DEGs and DEMs from brown-colored vs red-colored groups was performed, revealing 6781 mRNA–miRNA pairs that had opposite expression levels. Target DEGs were further analyzed for GO terms (Figure 4B), exhibiting 323 GO-enriched terms such as retinol dehydrogenase activity, retinol metabolic process, retinoid metabolic process, immune system process, inactivation of MAPK activity, alpha-linolenic acid metabolic process, linoleic acid metabolic process, and negative regulation of response to stimulus (Table S7). KEGG pathway analysis exhibited that target DEGs were enriched into 308 pathways such as immune system-related pathways [cell adhesion molecules (CAMs), C-type lectin receptor signaling pathway, IL-17 signaling pathway, and NOD-like receptor signaling pathway], melanin-related pathways (Wnt signaling pathway and MAPK signaling pathway), amino acid metabolism (glutathione metabolism, and glycine, serine, and threonine metabolism), and lipid metabolism (arachidonic acid metabolism, and fatty acid metabolism, and fatty acid elongation) (Figure 4A, Table S8). A miRNA–mRNA interaction network of focus genes and pathways involved in the lipid, carotenoid, and amino acid metabolism was constructed and exhibited that miRNAs participated in the body color formation through involvement in the regulation of color formation-related genes and pathways (Figure 5, Table S9). Among these miRNAs, miR-11987, miR-144, miR-17, miR-185, miR-192, miR-2188, miR-6316, novel-m0015, novel-m0040, novel-m0051, novel-m0266, and novel-m0331 could target with five more genes, exhibiting their function in body color formation.
Figure 4
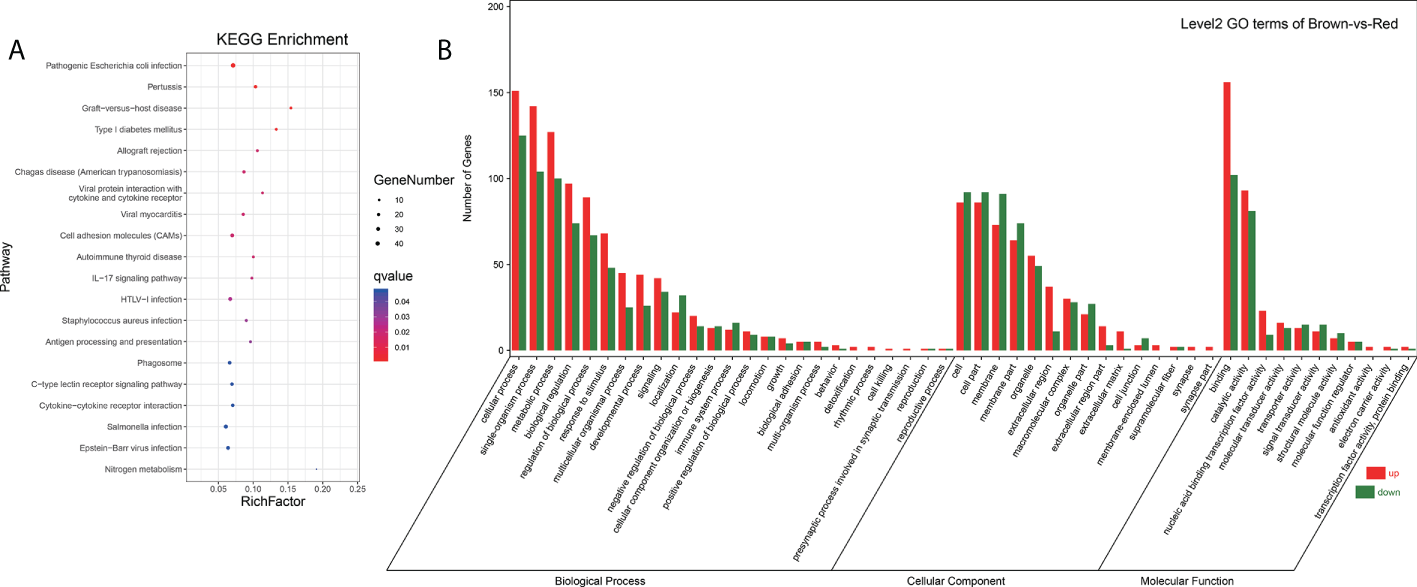
Go terms and pathway enrichment analysis of DEMs target genes (A, B) showed pathway enrichment and GO terms analysis, respectively.
Figure 5
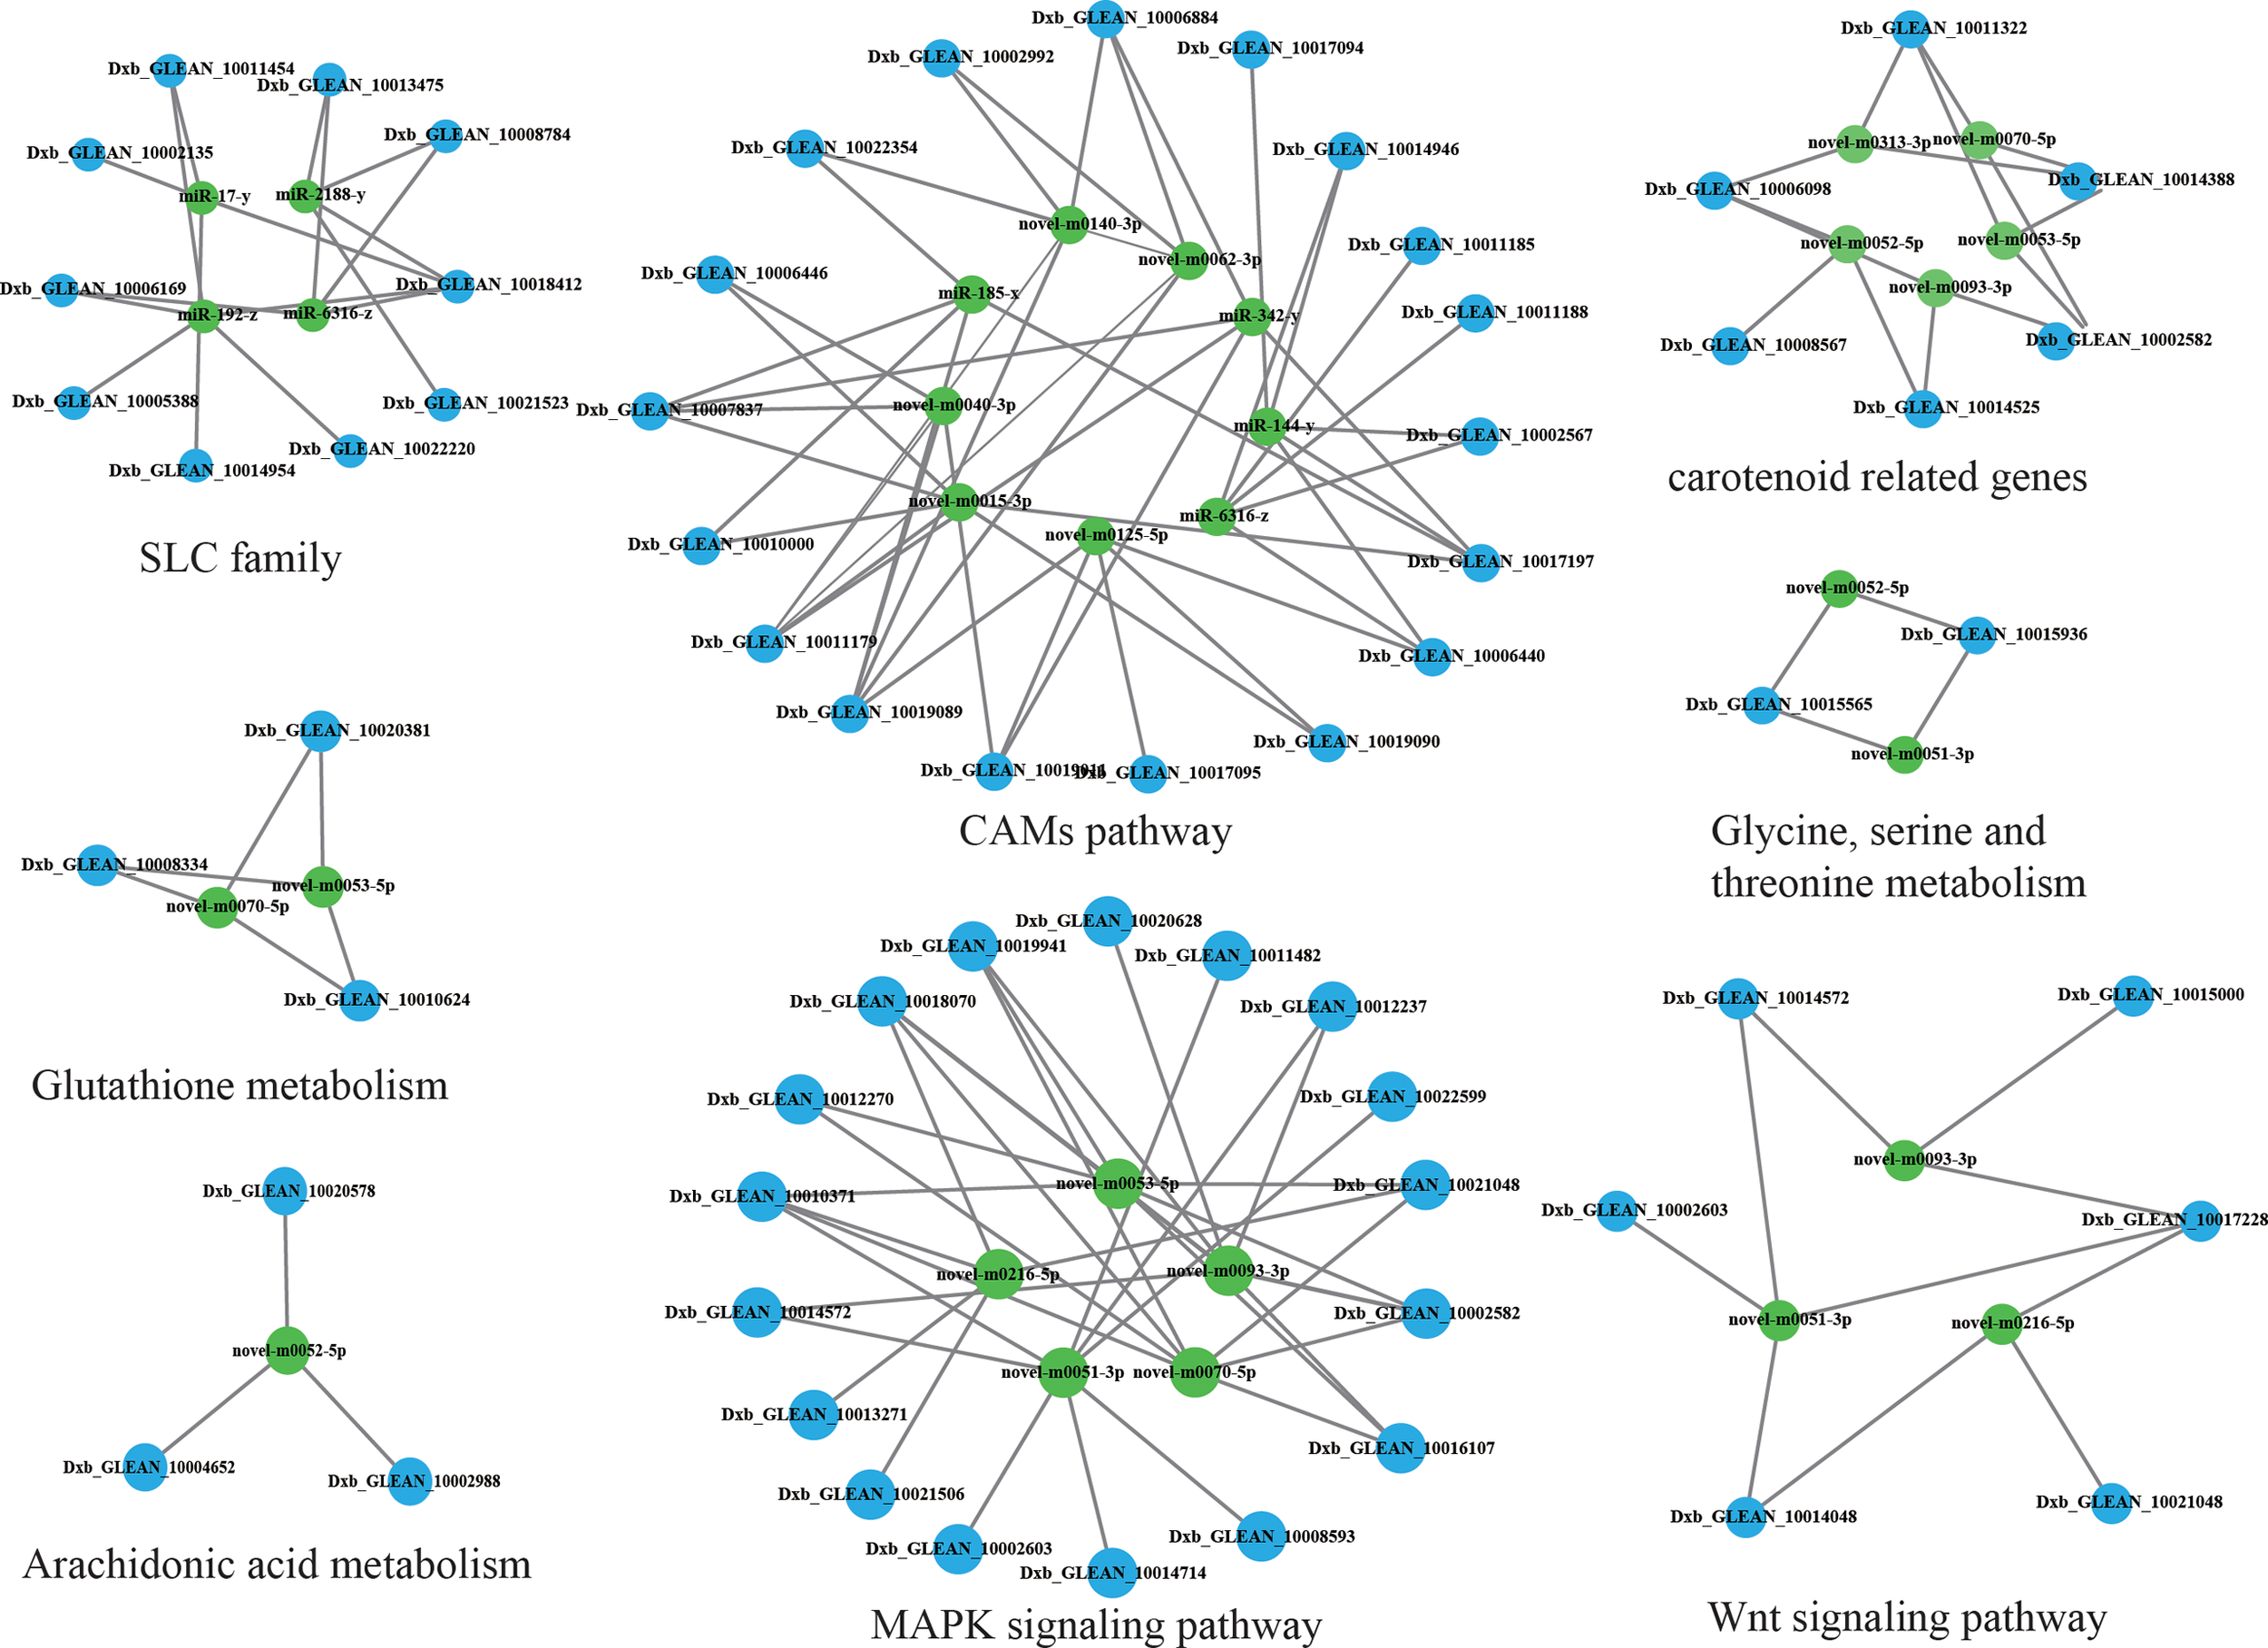
Integrated analysis of DEMs and DEGs.
Integrated analysis of focus pathway from DEGs, SDMs and DEMs
Integration analysis of focus pathway from DEGs, SDMs, and DEMs were analyzed to showed the correlation of the complex data. An overview of focus pathway between red-colored and brown-colored groups is shown in Figure S6 and showed strong correlations between genes, miRNAs and metabolites, which highlight the association of them and provide further research direction to explore the underlying mechanism of body color formation.
Discussion
Body coloration is crucial for environmental adaptation, and the mechanisms underlying it have been researched in fish (Kelsh, 2004; Beirl et al., 2014). A series of genes associated with body color formation and pigmentation have been identified in different body color individuals or tissues from coral leopard grouper (Yang et al., 2020; Zhu et al., 2021; Liu et al., 2022; Wen et al., 2022). There also reports showed the heavy metal and diet that influenced the molecular level of P. leopardus with the method of transcriptome and presented that the lipid metabolism, immune system (Wei et al., 2022);. However, the underlying mechanism of regulatory and metabolic molecular mechanism is still unclear. Therefore, omics methods such as transcriptome, metabolome, and miRNA sequencing were utilized to identify molecular and metabolic regulation mechanisms contributing to P. leopardus body color formation.
Carotenoid-related metabolism
Body coloration, especially bright colors such as red, orange, and yellow, was probably produced by diet-derived carotenoid pigments (Toomey et al., 2017). Different colors of P. leopardus have been studied, and the carotenoid contents in the skin and multiple related pigments were identified (Maoka et al., 2017). Several genes such as LDLR, FAX, RDH, dhrs, pax, and sox, which were involved in carotenoid metabolism, exhibited significantly different expression levels between red-colored and brown-colored P. leopardus groups.
Fatty acid hydroxylase (Fax) (Dxb_GLEAN_10005589) is an enzyme with the ability for catalysis for carotenoid hydroxylation (Cui et al., 2013). Low-density lipoproteins (LDLs) exhibited vital function in the process of carotenoid carriers, and the LDL receptor-related protein (LDLR, Trans_newGene_6258) could bind to LDL, which participated in carotenoid storage, transport, and metabolism (Harrison, 2019). Transcription factor gene pax7 (Dxb_GLEAN_10020227) is crucial for xanthophore in medaka and zebrafish (Kimura et al., 2014; Nord et al., 2016). Changes in pax7 expression are associated with melanophore and xanthophore in cichlids, zebrafish, and guppies (Roberts et al., 2017; Ahi et al., 2020). Sox10 (Dxb_GLEAN_10008567) is a member of the SRY-related HMG-box family genes and participated in fish chromatophores specification (Kelsh and Eisen, 2000). In zebrafish, the alleles of sox10 paralogs determined xanthophore formation quantitatively (Nagao et al., 2018).
Retinoid metabolism-related enzymes such as retinol dehydrogenase (RDH) participated in converting additional carotenoid substrates, and carotenoid color genes were identified among the retinoid metabolism genes (Toomey et al., 2016; Shyam et al., 2017). Retinoid metabolizing enzymes were highly expressed in the orange skin clownfish (Salis et al., 2019). The three RDH genes (Dxb_GLEAN_10013940, Dxb_GLEAN_10013941 and Dxb_GLEAN_10006098) exhibited significantly different expression levels in the present study. Dhrs encodes a short-chain dehydrogenase/reductase that catalyzes the retinol and retinal reversible oxidation/reduction and participates in the xanthophore organization of cichlids and zebrafish (Duester, 2000; Gu and Xia, 2017). Two Dhrs, namely Dxb_GLEAN_10014241 and Trans_newGene_5039, exhibited higher expression levels in the red-colored group. Differences in these retinoid metabolism-related DEGs suggested their function in carotenoid-related color formation.
Melanin synthesis
Black or brown coloration is closely linked to melanin synthesis (Henning et al., 2013; Zhu et al., 2021). Melanin-based coloration was associated with aggressiveness, immune function, antibiotic activity, and oxidative stress (Slominski et al., 2004; Ducrest et al., 2008). Melanin-related pathways, namely Wnt and MAPK signaling pathways, were enriched in the present study and participated in the body color formation and melanin biosynthesis (Kelsh, 2004; Jiang et al., 2014; Zhou et al., 2019). Wen et al. (2022) also reported that the signal transduction Wnt and MAKP signaling pathway involved in the body color formation of P. leopardus. A soluble modulator of the Wnt signaling pathway, Sfrp5 (secreted frizzled-related protein 5), was highly expressed in the retinal pigment epithelium (Chang et al., 1999). The sfrp gene (Dxb_GLEAN_10014388) was also up-regulated in the red-colored group. Hsp70 is involved in the MAPK signaling pathway, and its role was evaluated in human retinal pigment epithelium (Ryhanen et al., 2009). Three hsp protein genes (Dxb_GLEAN_10014525, Dxb_GLEAN_10002582, and Dxb_GLEAN_10011322) were identified as DEGs and exhibited higher expression levels in the red-colored group. Genes associated with cysteine metabolism are crucial in forming yellow or black colours in Jinbian carp (Yan et al., 2020). Soluble scavenger receptor cysteine-rich domain-containing protein genes (SSCRs), namely Dxb_GLEAN_10018772, Trans_newGene_12278, Trans_newGene_3015, and Dxb_GLEAN_10019886, were involved as DEGs in cysteine metabolism and participated in the brown-color formation.
SLCs were identified as candidate genes affecting skin pigmentation (Hoglund et al., 2011). Slc45a2 participates in the proper maturation, processing, and tracking of tyrosinase to post-Golgi melanosomes (Lao et al., 2007). Slc24a5 contributed to skin pigmentation and affected natural skin color variation in both humans and zebrafish, and its removal influenced melanogenesis in melanocytes and reduced melanin pigment production (Lamason et al., 2005; Ginger et al., 2008). Slc7a11, as a cysteine/glutamate exchanger, regulates cysteine absorption and thus directly affects the pheomelanin synthesis pathway through transportation of cystine into melanocytes, switching off the eumelanin synthesis pathway, and promoting pheomelanin synthesis (Xu et al., 2014). Diverse SLC genes with different expression patterns were observed in the different-colored skin of chickens and tilapia, further suggesting their function in different pigment production (Zhu et al., 2016; Chen et al., 2020). In the present study, 22 SLC genes were identified as DEGs, of which 14 DEGs were up-regulated in the brown-colored group, suggesting their potential in the body color formation.
Immune response of differently-colored coral groupers
Numerous immune-related genes and corresponding pathways such as cell-adhesion molecules (CAMs), TNF signaling pathway, toll-like receptor signaling pathway, and NF-kappa B signaling pathway were identified and enriched in the present study, indicating the differences in immune activity in different-colored fish. CAMs are crucial for inflammation, immune response, and neuronal tissue development (Elangbam et al., 1997). In the present study, multiple genes in the cell adhesion molecules pathway were downregulated in the red-colored group compared with brown-colored group, exhibiting the active state of immunity in the brown-colored group to adapt to the aquaculture environment. GO enrichment analysis indicated that immune-related terms such as “cell adhesion,” immune response, and inflammatory response were strongly enriched in the present study, and comparison in whole red and whole white individuals from Oujiang color common carp (Du et al., 2019). Higher melanin levels improved wound healing and immune defense of orange clownfish (Amphiprion percula) (Mcgraw, 2005; Smith et al., 2018).
Lipid metabolism
Fish acquire carotenoids from the diet, and dietary carotenoid esters are hydrolyzed together with fatty acids or lipoproteins (Sundvold et al., 2011). Lipophilic carotenoids are concentrated in erythrophore and xanthophore (Guo et al., 2009; Granneman et al., 2017). Metabolome analysis of different body wall colors Apostichopus japonicus exhibited that fatty acid metabolism participated in its color diversity (Xing et al., 2021). Lipid metabolism pathways, including arachidonic acid metabolism and unsaturated fatty acid biosynthesis, were also enriched in the present study.
As a member of unsaturated fatty acid, arachidonic acid participates in malpigmentation and pigmentation rate (Bell et al., 2003). Arachidonic acid can mediate biochemical-induced stress relevant to pigmentation and induce fucoxanthin production (Villalta et al., 2005; Zhang et al., 2017). Linoleic acid, which inhibited hyperpigmentation and promoted tyrosinase depletion, was vital for pigment development (Ando et al., 1999 and Ando et al., 2004). Linoleic acid inhibited the hyperpigmentation induced by ultraviolet radiation in the skin and could decline the arachidonic acid content. Additionally, both participated in albinism development in fugu (Liu and Belury, 1998; Ando et al., 1998; Shigeta et al., 2004; Chen et al., 2020). In the present study, lipid-related metabolism, including unsaturated fatty acid biosynthesis and arachidonic acid metabolism, was enriched, indicating lipid metabolism’s crucial role in body color formation.
Amino acids metabolism
Glycine as a common osmolyte is involved in the health states such as infection, heavy metal exposure, and hypo-osmotic conditions in marine animals (Kube et al., 2007; Liu et al., 2013). Yong et al. (2015) revealed that reduced glycine contents influenced glutathione metabolism and serine and threonine metabolism, resulting in stress-induced disruption of osmotic regulation (Hao et al., 2018 and Hao et al., 2019). Glycine participated in protein methylation and biosynthesis of heme, creatine, purines, and glutathione (Wu, 2009; Yuan et al., 2012). As a nonenzymatic small organic molecule, glutathione is vital for maintaining the cellular redox status (Wen et al., 2018). Pearl oysters launch GPx systems to resist oxidative damage in an excessive VD3 diet (Yang et al., 2019). In the present study, the up-regulated genes of enzymes including PHGDH, ALAS, GCAT, GATM, ANPEP, gpx, ANPEP which participated in the glycine, serine, threonine metabolism and glutathione metabolism revealed an active state of relative metabolism in the red-colored group. These results indicated the possibility of fish adapting to the changeable environment.
Conclusions
Through the data analysis of mRNAs, metabolites, and miRNAs from the brown-colored group vs. red-colored group, 1236 DEGs, 149 DEMs, 439 SDMs in the POS model, and 84 SDMs in the NEG model were identified. Integrated analysis exhibited that multiple biological processes were involved in body color formation of P. leopardus, including carotenoid metabolism, immune response, lipid metabolism, and amino acid metabolism. Furthermore, miRNAs regulated body color formation by targeting the related genes. The present study exhibited the vital molecules for body color formation and promoted body color breeding selection.
Funding
This work was supported by National Nature Science Foundation of China (Grant No. 32102766); Southern Marine Science and Engineering Guangdong Laboratory (Zhanjiang) (Grant No. ZJW-2019-06); Jieyang City Science and Technology Plan Project (Grant No. 2019066); National Key R&D Program of China (Grant No. 2020YFD0901100 & 2020YFD0901103).
Publisher’s note
All claims expressed in this article are solely those of the authors and do not necessarily represent those of their affiliated organizations, or those of the publisher, the editors and the reviewers. Any product that may be evaluated in this article, or claim that may be made by its manufacturer, is not guaranteed or endorsed by the publisher.
Statements
Data availability statement
The datasets presented in this study can be found in online repositories. The names of the repository/repositories and accession number(s) can be found below: https://www.ncbi.nlm.nih.gov/, SRR15195625, SRR15195626, SRR15195627 and SRR15647328, SRR15647329, SRR15647330.
Ethics statement
The animal study was reviewed and approved by Animal Care and Use Committee of Guangdong Ocean University.
Author contributions
RH and XZ performed the experiments, contributed to data analysis, and wrote the manuscript. GL conceived and supervised the experiments. CT and CZ contributed to manuscript revision and gave valuable advice for the modifications of the manuscript. All authors read and approved the manuscript.
Conflict of interest
The authors declare that the research was conducted in the absence of any commercial or financial relationships that could be construed as a potential conflict of interest.
Supplementary material
The Supplementary Material for this article can be found online at: https://www.frontiersin.org/articles/10.3389/fmars.2022.964774/full#supplementary-material
Supplementary Figure 1Images of red-colored and brown-colored coral leopard grouper of Plectropomus leopardus
Supplementary Figure 2Transcriptome analysis of brown- and red- colored groups of leopard coral grouper Plectropomus leopardus(A) DEGs of the brown-colored and red-colored groups; (B) GO terms analysis of DEGs; (C) pathway enrichment of DEGs
Supplementary Figure 3Derived PCA score plot, derived OPLS-DA score plots, and corresponding validation plots of OPLS-DA analysis. ZW represents the brown group, and ZR represents the red group.
Supplementary Figure 4Pathway enrichment analysis of SDMs and integrated analysis of DEGs and SDMs (A, B) showed the pathway analysis of SDMs from POS and NEG, respectively. (C) exhibited the integrated analysis of DEGs and SDMs.
Supplementary Figure 5Expression validation of miRNA from miRNA transcriptome.
Supplementary Figure 6Integrated analysis of fucus pathway Circle, rhombus, and triangle showed the DEGs, SDMs and DEMs, respectively. Among them, orange color showed the DEGs, SDMs, and DEMs in the focus pathway. The red and blue line showed the positive and negative correlation among DEGs, SDMs and DEMs, respectively.
References
1
Ahi E. P. Lecaudey L. A. Ziegelbecker A. Steiner O. Glabonjat R. Goessler W. et al . (2020). Comparative transcriptomics reveals candidate carotenoid color genes in an East African cichlid fish. BMC Genomics21, 54. doi: 10.1186/s12864-020-6473-8
2
Anders S. Huber W. (2010). Differential expression analysis for sequence count data. Genome Biol.11, R106. doi: 10.1186/gb-2010-11-10-r106
3
Ando H. Funasaka Y. Oka M. Ohashi A. Furumura M. Matsunaga J. et al . (1999). Possible involvement of proteolytic degradation of tyrosinase in the regulatory effect of fatty acids on melanogenesis. J. Lipid Res.40, 1312–1316. doi: 10.1016/S0022-2275(20)33493-3
4
Ando H. Ryu A. Hashimoto A. Oka M. Ichihashi M. (1998). Linoleic acid and alpha-linolenic acid lightens ultraviolet-induced hyperpigmentation of the skin. Arch. Dermatol. Res.290, 375–381. doi: 10.1007/s004030050320
5
Ando H. Watabe H. Valencia J. C. Yasumoto K. Furumura M. Funasaka Y. et al . (2004). Fatty acids regulate pigmentation via proteasomal degradation of tyrosinase: a new aspect of ubiquitin-proteasome function. J. Biol. Chem.279, 15427–15433. doi: 10.1074/jbc.M313701200
6
Beirl A. J. Linbo T. H. Cobb M. J. Cooper C. D. (2014). oca2 regulation of chromatophore differentiation and number is cell type specific in zebrafish. Pigment Cell Melanoma Res.27, 178–189. doi: 10.1111/pcmr.12205
7
Bell J. G. Mcevoy L. A. Estevez R. J. Sargent J. R. (2003). Optimising lipid nutrition in first-feeding flatfish larvae. Aquaculture227, 211–220. doi: 10.1016/S0044-8486(03)00504-0
8
Bizuayehu T. T. Babiak I. (2014). MicroRNA in teleost fish. Genome Biol. Evol.6, 1911–1937. doi: 10.1093/gbe/evu151
9
Chang J. T. Esumi N. Moore K. Li Y. Zhang S. Chew C. et al . (1999). Cloning and characterization of a secreted frizzled-related protein that is expressed by the retinal pigment epithelium. Hum. Mol. Genet.8, 575–583. doi: 10.1093/hmg/8.4.575
10
Chen Y. Gong Q. Lai J. Song M. Liu Y. Wu Y. et al . (2020). Transcriptome analysis identifies candidate genes associated with skin color variation in Triplophysa siluroides. comp. Biochem. Phys. D35, 100682. doi: 10.1016/j.cbd.2020.100682
11
Chen C. Wu L. M. Li Y. L. Song Z. X. Liang Y. Zhai J. M. et al . (2014). Morphology of the early age and the pigment occurrence and the effects of different feed additives on the body color of Plectropomus leopardus. Prog. fishery Sci.35, 83–90. doi: 10.11758/yykxjz.20140512
12
Chong J. Xia J. (2018). MetaboAnalystR: an r package for flexible and reproducible analysis of metabolomics data. Bioinformatics34, 4313–4314. doi: 10.1093/bioinformatics/bty528
13
Cui H. Yu X. Wang Y. Cui Y. Li X. Liu Z. et al . (2013). Evolutionary origins, molecular cloning and expression of carotenoid hydroxylases in eukaryotic photosynthetic algae. BMC Genomics14, 457. doi: 10.1186/1471-2164-14-457
14
Du J. Chen X. Wang J. Chen H. Yue W. Lu G. et al . (2019). Comparative skin transcriptome of two oujiang color common carp (Cyprinus carpio var. color) varieties. Fish Physiol. Biochem.45, 177–185. doi: 10.1007/s10695-018-0551-8
15
Ducrest A. L. Keller L. Roulin A. (2008). Pleiotropy in the melanocortin system, coloration and behavioural syndromes. Trends Ecol. Evol.23, 502–510. doi: 10.1016/j.tree.2008.06.001
16
Duester G. (2000). Families of retinoid dehydrogenases regulating vitamin a function: production of visual pigment and retinoic acid. Eur. J. Biochem.267, 4315–4324. doi: 10.1046/j.1432-1327.2000.01497.x
17
Elangbam C. S. Qualls C. J. Dahlgren R. R. (1997). Cell adhesion molecules-update. Vet. Pathol.34, 61–73. doi: 10.1177/030098589703400113
18
Ginger R. S. Askew S. E. Ogborne R. M. Wilson S. Ferdinando D. Dadd T. et al . (2008). SLC24A5 encodes a trans-golgi network protein with potassium-dependent sodium-calcium exchange activity that regulates human epidermal melanogenesis. J. Biol. Chem.283, 5486–5495. doi: 10.1074/jbc.M707521200
19
Granneman J. G. Kimler V. A. Zhang H. Ye X. Luo X. Postlethwait J. H. et al . (2017). Lipid droplet biology and evolution illuminated by the characterization of a novel perilipin in teleost fish. Elife6, e21771. doi: 10.7554/eLife.21771.025
20
Guo Y. Cordes K. R. Farese R. J. Walther T. C. (2009). Lipid droplets at a glance. J. Cell Sci.122, 749–752. doi: 10.1242/jcs.037630
21
Hao R. Du X. Yang C. Deng Y. Zheng Z. Wang Q. (2019). Integrated application of transcriptomics and metabolomics provides insights into unsynchronized growth in pearl oyster Pinctada fucata martensii. sci. Total Environ.666, 46–56. doi: 10.1016/j.scitotenv.2019.02.221
22
Hao R. Wang Z. Yang C. Deng Y. Zheng Z. Wang Q. et al . (2018). Metabolomic responses of juvenile pearl oyster Pinctada maxima to different growth performances. Aquaculture491, 258–265. doi: 10.1016/j.aquaculture.2018.03.050
23
Hao R. Zhu X. Tian C. Jiang M. Huang Y. Zhu C. (2022). Integrated analysis of the role of miRNA-mRNA in determining different body colors of leopard coral grouper (Plectropomus leopardus). Aquaculture548, 737575. doi: 10.1016/j.aquaculture.2021.737575
24
Harrison E. H. (2019). Mechanisms of transport and delivery of vitamin a and carotenoids to the retinal pigment epithelium. Mol. Nutr. Food Res.63, e1801046. doi: 10.1002/mnfr.201801046
25
Henning F. Jones J. C. Franchini P. Meyer A. (2013). Transcriptomics of morphological color change in polychromatic Midas cichlids. BMC Genomics14, 171. doi: 10.1186/1471-2164-14-171
26
Herkenhoff M. E. Oliveira A. C. Nachtigall P. G. Costa J. M. Campos V. F. Hilsdorf A. et al . (2018). Fishing into the MicroRNA transcriptome. Front. Genet.9, 88. doi: 10.3389/fgene.2018.00088
27
Hoglund P. J. Nordstrom K. J. Schioth H. B. Fredriksson R. (2011). The solute carrier families have a remarkably long evolutionary history with the majority of the human families present before divergence of bilaterian species. Mol. Biol. Evol.28, 1531–1541. doi: 10.1093/molbev/msq350
28
Huang J. Zhong R. Yang C. Wang Q. Liao Y. Deng Y. (2021). Dietary carbohydrate and protein levels affect the growth performance of juvenile peanut worm (Sipunculus nudus): An LC-MS-Based metabolomics study. Front. Mar. Sci.8, 702101. doi: 10.3389/fmars.2021.702101
29
Hubbard J. K. Uy J. A. Hauber M. E. Hoekstra H. E. Safran R. J. (2010). Vertebrate pigmentation: from underlying genes to adaptive function. Trends Genet.26, 231–239. doi: 10.1016/j.tig.2010.02.002
30
Jiang Y. Zhang S. Xu J. Feng J. Mahboob S. Al-Ghanim K. A. et al . (2014). Comparative transcriptome analysis reveals the genetic basis of skin color variation in common carp. PloS One9, 108200. doi: 10.1371/journal.pone.0108200
31
Kanehisa M. Araki M. Goto S. Hattori M. Hirakawa M. Itoh M. et al . (2008). KEGG for linking genomes to life and the environment. Nucleic Acids Res.36, D480–D484. doi: 10.1093/nar/gkm882
32
Kelsh R. N. (2004). Genetics and evolution of pigment patterns in fish. Pigment Cell Res.17, 326–336. doi: 10.1111/j.1600-0749.2004.00174.x
33
Kelsh R. N. Eisen J. S. (2000). The zebrafish colourless gene regulates development of non-ectomesenchymal neural crest derivatives. Development127, 515–525. doi: 10.1242/dev.127.3.515
34
Kimura T. Nagao Y. Hashimoto H. Yamamoto-Shiraishi Y. Yamamoto S. Yabe T. et al . (2014). Leucophores are similar to xanthophores in their specification and differentiation processes in medaka. Proc. Natl. Acad. Sci. U.S.A.111, 7343–7348. doi: 10.1073/pnas.1311254111
35
Kube S. Sokolowski A. Jansen J. M. Schiedek D. (2007). Seasonal variability of free amino acids in two marine bivalves, Macoma balthica and mytilus spp., in relation to environmental and physiological factors. comp. biochem. Physiol. A Mol. Integr. Physiol.147, 1015–1027. doi: 10.1016/j.cbpa.2007.03.012
36
Lamason R. L. Mohideen M. A. Mest J. R. Wong A. C. Norton H. L. Aros M. C. et al . (2005). SLC24A5, a putative cation exchanger, affects pigmentation in zebrafish and humans. Science310, 1782–1786. doi: 10.1126/science.1116238
37
Lao O. de Gruijter J. M. van Duijn K. Navarro A. Kayser M. (2007). Signatures of positive selection in genes associated with human skin pigmentation as revealed from analyses of single nucleotide polymorphisms. Ann. Hum. Genet.71, 354–369. doi: 10.1111/j.1469-1809.2006.00341.x
38
Liu K. L. Belury M. A. (1998). Conjugated linoleic acid reduces arachidonic acid content and PGE2 synthesis in murine keratinocytes. Cancer Lett.127, 15–22. doi: 10.1016/S0304-3835(97)00479-5
39
Liu H. T. Dai C. Li X. X. Luo D. P. Chen H. Cui J. et al . (2022). Analysis of the differentially expressed genes and characterization of PIMITF genes of the leopard coral grouper (Plectropomus leopardus). Aquacult. Rep.23, 101076. doi: 10.1016/j.aqrep.2022.101076
40
Liu X. Ji C. Zhao J. Wu H. (2013). Differential metabolic responses of clam Ruditapes philippinarum to Vibrio anguillarum and Vibrio splendidus challenges. Fish Shellfish Immunol.35, 2001–2007. doi: 10.1016/j.fsi.2013.09.014
41
Luo M. Wang L. Zhu W. Fu J. Song F. Fang M. et al . (2018). Identification and characterization of skin color microRNAs in koi carp (Cyprinus carpio l.) by illumina sequencing. BMC Genomics19, 779. doi: 10.1186/s12864-018-5189-5
42
Madaro A. Torrissen O. Whatmore P. Lall S. P. Schmeisser J. Verlhac T. V. et al . (2020). Red and white chinook salmon (Oncorhynchus tshawytscha): differences in the transcriptome profile of muscle, liver, and pylorus. Mar. Biotechnol. (NY)22, 581–593. doi: 10.1007/s10126-020-09980-5
43
Mao X. Cai T. Olyarchuk J. G. Wei L. (2005). Automated genome annotation and pathway identification using the KEGG orthology (KO) as a controlled vocabulary. Bioinformatics21, 3787–3793. doi: 10.1093/bioinformatics/bti430
44
Maoka T. Sato W. Nagai H. Takahashi T. (2017). Carotenoids of red, brown, and black specimens of Plectropomus leopardus, the coral trout (Suziara in Japanese). J. Oleo. Sci.66, 579–584. doi: 10.5650/jos.ess16179
45
Mcgraw K. J. (2005). The antioxidant function of many animal pigments: are there consistent health benefits of sexually selected colourants? Anim. Behav.69, 757–764. doi: 10.1016/j.anbehav.2004.06.022
46
Nagao Y. Takada H. Miyadai M. Adachi T. Seki R. Kamei Y. et al . (2018). Distinct interactions of Sox5 and Sox10 in fate specification of pigment cells in medaka and zebrafish. PloS Genet.14, e1007260. doi: 10.1371/journal.pgen.1007260
47
Nord H. Dennhag N. Muck J. von Hofsten J. (2016). Pax7 is required for establishment of the xanthophore lineage in zebrafish embryos. Mol. Biol. Cell27, 1853–1862. doi: 10.1091/mbc.e15-12-0821
48
Roberts R. B. Moore E. C. Kocher T. D. (2017). An allelic series at pax7a is associated with colour polymorphism diversity in lake Malawi cichlid fish. Mol. Ecol.26, 2625–2639. doi: 10.1111/mec.13975
49
Robinson M. D. McCarthy D. J. Smyth G. K. (2010). edgeR: a bioconductor package for differential expression analysis of digital gene expression data. Bioinformatics26, 139–140. doi: 10.1093/bioinformatics/btp616
50
Ryhanen T. Hyttinen J. M. Kopitz J. Rilla K. Kuusisto E. Mannermaa E. et al . (2009). Crosstalk between Hsp70 molecular chaperone, lysosomes and proteasomes in autophagy-mediated proteolysis in human retinal pigment epithelial cells. J. Cell. Mol. Med.13, 3616–3631. doi: 10.1111/j.1582-4934.2008.00577.x
51
Salis P. Lorin T. Lewis V. Rey C. Marcionetti A. Escande M. L. et al . (2019). Developmental and comparative transcriptomic identification of iridophore contribution to white barring in clownfish. Pigment Cell Melanoma Res.32, 391–402. doi: 10.1111/pcmr.12766
52
Shannon P. Markiel A. Ozier O. Baliga N. S. Wang J. T. Ramage N. A. et al . (2003). Cytoscape: A software environment for integrated models of biomolecular interaction networks. Genome Res.13, 2498–2504. doi: 10.1101/gr.1239303
53
Shigeta Y. Imanaka H. Ando H. Ryu A. Oku N. Baba N. et al . (2004). Skin whitening effect of linoleic acid is enhanced by liposomal formulations. Biol. Pharm. Bull.27, 591–594. doi: 10.1248/bpb.27.591
54
Shyam R. Gorusupudi A. Nelson K. Horvath M. P. Bernstein P. S. (2017). RPE65 has an additional function as the lutein to meso-zeaxanthin isomerase in the vertebrate eye. Proc. Natl. Acad. Sci. U.S.A.114, 10882–10887. doi: 10.1073/pnas.1706332114
55
Slominski A. Tobin D. J. Shibahara S. Wortsman J. (2004). Melanin pigmentation in mammalian skin and its hormonal regulation. Physiol. Rev.84, 1155–1228. doi: 10.1152/physrev.00044.2003
56
Smith G. E. Maytin A. K. Davies S. W. Mullen S. P. Buston P. M. (2018). De novo transcriptome assembly of the clown anemonefish (Amphiprion percula): a new resource to study the evolution of fish color. Front. Mar. Sci.5, 284. doi: 10.3389/fmars.2018.00284
57
Sundvold H. Helgeland H. Baranski M. Omholt S. W. Vage D. I. (2011). Characterisation of a novel paralog of scavenger receptor class B member I (SCARB1) in Atlantic salmon (Salmo salar). BMC Genet.12, 52. doi: 10.1186/1471-2156-12-52
58
Toomey M. B. Lind O. Frederiksen R. Curley R. J. Riedl K. M. Wilby D. et al . (2016). Complementary shifts in photoreceptor spectral tuning unlock the full adaptive potential of ultraviolet vision in birds. Elife5, 15675. doi: 10.7554/eLife.15675.024
59
Toomey M. B. Lopes R. J. Araujo P. M. Johnson J. D. Gazda M. A. Afonso S. et al . (2017). High-density lipoprotein receptor SCARB1 is required for carotenoid coloration in birds. Proc. Natl. Acad. Sci. U.S.A.114, 5219–5224. doi: 10.1073/pnas.1700751114
60
Villalta M. Estévez A. Bransden M. P. (2005). Arachidonic acid enriched live prey induces albinism in Senegal sole (Solea senegalensis) larvae. Aquaculture245, 193–209. doi: 10.1016/j.aquaculture.2004.11.035
61
Vissio P. G. Darias M. J. Di Yorio M. P. Perez S. D. Delgadin T. H. (2021). Fish skin pigmentation in aquaculture: the influence of rearing conditions and its neuroendocrine regulation. Gen. Comp. Endocrinol.301, 113662. doi: 10.1016/j.ygcen.2020.113662
62
Wang J. Hou X. Chen X. Zhang K. Wang J. Wang C. (2021). Comprehensive analysis of metabolomics and transcriptomics provides insights into growth difference of juvenile Eriocheir sinensis during the molting cycle. Aquaculture539, 736661. doi: 10.1016/j.aquaculture.2021.736661
63
Wang F. Jia Y. Wang P. Yang Q. Du Q. Chang Z. (2017). Identification and profiling of Cyprinus carpio microRNAs during ovary differentiation by deep sequencing. BMC Genomics18, 333. doi: 10.1186/s12864-017-3701-y
64
Wang L. Yu C. Guo L. Lin H. Meng Z. (2015). In silico comparative transcriptome analysis of two color morphs of the common coral trout (Plectropomus leopardus). PloS One10, e145868. doi: 10.1371/journal.pone.0145868
65
Wang L. Zhu W. Dong Z. Song F. Dong J. Fu J. (2018). Comparative microRNA-seq analysis depicts candidate miRNAs involved in skin color differentiation in red tilapia. Int. J. Mol. Sci.19, 1209. doi: 10.3390/ijms19041209
66
Wei L. Li Q. Ye H. Z. Han D. Guo Z. Q. Lek S. (2022). Speciation-specifc cr bioaccumulation, morphologic and transcriptomic response in liver of Plectropomus leopardus exposed to dietary Cr(III) and Cr(VI). Ecotoxicol. Environ. Saf.241, 113744. doi: 10.1016/j.ecoenv.2022.113744
67
Wen B. Jin S. R. Chen Z. Z. Gao J. Z. (2018). Physiological responses to cold stress in the gills of discus fish (Symphysodon aequifasciatus) revealed by conventional biochemical assays and GC-TOF-MS metabolomics. Sci. Total Environ.640-641, 1372–1381. doi: 10.1016/j.scitotenv.2018.05.401
68
Wen X. Yang M. Zhou K. Huang J. Fan X. Zhang W. et al . (2022). Transcriptomic and proteomic analyses reveal the common and unique pathway(s) underlying different skin colors of leopard coral grouper (Plectropomus leopardus). J. Proteomics266, 104671. doi: 10.1016/j.jprot.2022.104671
69
Wu G. (2009). Amino acids: Metabolism, functions, and nutrition. Amino Acids37, 1–17. doi: 10.1007/s00726-009-0269-0
70
Xing L. Sun L. Liu S. Zhang L. Sun J. Yang H. (2021). Metabolomic analysis of white, green and purple morphs of sea cucumber Apostichopus japonicus during body color pigmentation process. Comp. Biochem. Physiol. Part. D39, 100827. doi: 10.1016/j.cbd.2021.100827
71
Xu G. Du F. Li Y. Nie Z. Xu P. (2016). Integrated application of transcriptomics and metabolomics yields insights into population-asynchronous ovary development in Coilia nasus. sci. Rep.-Uk6, 31835. doi: 10.1038/srep31835
72
Xu P. Zhang X. Wang X. Li J. Liu G. Kuang Y. et al . (2014). Genome sequence and genetic diversity of the common carp, Cyprinus carpio. nat. Genet.46, 1212–1219. doi: 10.1038/ng.3098
73
Yang C. Du X. Hao R. Wang Q. Deng Y. Sun R. (2019). Effect of vitamin D3 on immunity and antioxidant capacity of pearl oyster Pinctada fucata martensii after transplantation: Insights from LC-MS-based metabolomics analysis. Fish Shellfish Immunol.94, 271–279. doi: 10.1016/j.fsi.2019.09.017
74
Yang C. Hao R. Du X. Wang Q. Deng Y. Sun R. et al . (2018). GC-TOF/MS-based metabolomics studies on the effect of protein sources in formulated diet for pearl oyster Pinctada fucata martensii. Aquaculture486, 139–147. doi: 10.1016/j.aquaculture.2017.12.020
75
Yang Y. Wu L. Chen J. Wu X. Xia J. Meng Z. et al . (2020). Whole-genome sequencing of leopard coral grouper (Plectropomus leopardus) and exploration of regulation mechanism of skin color and adaptive evolution. Zool. Res.41, 328–340. doi: 10.24272/j.issn.2095-8137.2020.038
76
Yan X. Wei L. Huang J. Wang J. Yang Z. Gan B. et al . (2020). Comparative skin transcriptome between common carp and the variety jinbian carp (Cyprinus carpio v. jinbian). Aquac. Res.51, 187–196. doi: 10.1111/are.14363
77
Young T. Alfaro A. C. Villas-Bôas S. (2015). Identification of candidate biomarkers for quality assessment of hatchery-reared mussel larvae via GC/MS-based metabolomics. New Zeal. J. Mar. Fresh.49, 87–95. doi: 10.1080/00288330.2014.958504
78
Young M. D. Wakefield M. J. Smyth G. K. Oshlack A. (2010). Gene ontology analysis for RNA-seq: accounting for selection bias. Genome Biol.11, R14. doi: 10.1186/gb-2010-11-2-r14
79
Yuan J. Karimi A. Zornes S. Goodgame S. Mussini F. Lu C. et al . (2012). Evaluation of the role of glycine in low-protein amino acid-supplemented diets. J. Appl. Poultry Res.21, 726–737. doi: 10.3382/japr.2011-00388
80
Zhang Y. Liu J. Peng L. Ren L. Zhang H. Zou L. et al . (2017). Comparative transcriptome analysis of molecular mechanism underlying gray-to-red body color formation in red crucian carp (Carassius auratus, red var.). Fish Physiol. Biochem.43, 1387–1398. doi: 10.1007/s10695-017-0379-7
81
Zhang J. Xiong X. Deng Y. Zheng Z. Yang C. Du X. (2021). Integrated application of transcriptomics and metabolomics provides insights into the larval metamorphosis of pearl oyster (Pinctada fucata martensii). Aquaculture532, 736067. doi: 10.1016/j.aquaculture.2020.736067
82
Zhou Q. Guo X. Huang Y. Gao H. Xu H. Liu S. et al . (2020). De novo sequencing and chromosomal-scale genome assembly of leopard coral grouper, Plectropomus leopardus. mol. Ecol. Resour.20, 1403–1413. doi: 10.1111/1755-0998.13207
83
Zhou J. Zhao H. Zhang L. Liu C. Feng S. Ma J. et al . (2019). Integrated analysis of RNA-seq and microRNA-seq depicts miRNA-mRNA networks involved in stripe patterns of Botia superciliaris skin. Funct. Integr. Genomics19, 827–838. doi: 10.1007/s10142-019-00683-2
84
Zhu X. Hao R. Tian C. Zhang J. Zhu C. Li G. (2021). Integrative transcriptomics and metabolomics analysis of body color formation in the leopard coral grouper. Front. Mar. Sci.8, 726102. doi: 10.3389/fmars.2021.726102
85
Zhu W. Wang L. Dong Z. Chen X. Song F. Liu N. et al . (2016). Comparative transcriptome analysis identifies candidate genes related to skin color differentiation in red tilapia. Sci. Rep.6, 31347. doi: 10.1038/srep31347
Summary
Keywords
body color, Plectropomus leopardus , mRNA, metabolite, miRNA
Citation
Hao R, Zhu X, Tian C, Zhu C and Li G (2022) Analysis of body color formation of leopard coral grouper Plectropomus leopardus. Front. Mar. Sci. 9:964774. doi: 10.3389/fmars.2022.964774
Received
09 June 2022
Accepted
24 August 2022
Published
12 September 2022
Volume
9 - 2022
Edited by
Youji Wang, Shanghai Ocean University, China
Reviewed by
Irfan Yulianto, IPB University, Indonesia; Jian Luo, Hainan University, China
Updates
Copyright
© 2022 Hao, Zhu, Tian, Zhu and Li.
This is an open-access article distributed under the terms of the Creative Commons Attribution License (CC BY). The use, distribution or reproduction in other forums is permitted, provided the original author(s) and the copyright owner(s) are credited and that the original publication in this journal is cited, in accordance with accepted academic practice. No use, distribution or reproduction is permitted which does not comply with these terms.
*Correspondence: Guangli Li, ligl@gdou.edu.cn
†These authors have contributed equally to this work
This article was submitted to Aquatic Physiology, a section of the journal Frontiers in Marine Science
Disclaimer
All claims expressed in this article are solely those of the authors and do not necessarily represent those of their affiliated organizations, or those of the publisher, the editors and the reviewers. Any product that may be evaluated in this article or claim that may be made by its manufacturer is not guaranteed or endorsed by the publisher.