 Ruth Branch
 Fadia Ticona Rollano
 Emma Cotter
 James R. McVey
 Robert J. Cavagnaro
 Ignatius Rigor
- 1Coastal Sciences Division, Pacific Northwest National Laboratory, Seattle, WA, United States
- 2Applied Physics Lab, University of Washington, Seattle, WA, United States
Arctic observations are becoming increasingly valuable as researchers investigate climate change and its associated concerns, such as decreasing sea ice and increasing ship traffic. Networks of sensors with frequent sampling capabilities are needed to run forecast models, improve navigation, and inform climate research. Sampling frequency and deployment duration are currently constrained by battery power limitations. In-situ power generation using marine renewable energy sources such as waves and currents can be used to circumvent this constraint. Wave and current resources vary spatially and temporally in the Arctic, with some locations and seasons being better suited for marine renewable energy power generation. Locations and seasons with small resources may still be able to use marine renewable energy because of the low power requirements of the instruments. In this study, we describe the wave and current resources in the Arctic, outline the electricity generation developments that are needed to utilize the resources, and suggest use cases. Wave and current energy converters developed to power observations in the Arctic could also be used to power observations at lower latitudes. Marine renewable energy has the potential to decrease dependence on batteries and improve data collection capabilities in the Arctic; however, this would require the development of new low power technologies that can operate in extreme Arctic environments.
Introduction
The Arctic is experiencing the dramatic effects of climate change. It is warming twice as fast as lower latitudes and these changes are resulting in warmer weather and a drastic reduction in sea ice volumes (Blunden and Arndt, 2016). In 2021, the post-winter sea ice volume was the lowest since records began and rain was reported for the first time at the 3,200 m Summit Station in Greenland (Moon et al., 2021). These changes have broader implications, as conditions in the Arctic may have an effect on the weather at lower latitudes. For example, changes in the melting of sea ice and spring snow may be responsible for mid-latitude changes in extreme weather events (Cohen et al., 2014). In-situ observations are needed to understand these changes, set initial conditions for prediction systems (i.e., weather forecasting models), and improve situational awareness in the region (Moore et al., 2019; Rainville et al., 2020).
Sensors used for Arctic marine observations measure a wide variety of physical and biological variables in the air, sea ice, and water. These sensors may be deployed on top of sea ice, in sea ice, below sea ice, and in ice-free waters. Moored buoy arrays measure physical parameters such as water temperature, salinity, pH, turbidity, and oxygen (Hauri et al., 2018). Ice-tethered profilers measure a similar set of parameters but drift with the sea ice (Krishfield et al., 2008). Moored hydrophones detect marine mammals and monitor the acoustic environment for changes as the extent of the sea ice coverage decreases (Stafford et al., 2018). Some Arctic observations are made as part of short-term process studies, while others are made as part of long-term monitoring programs (Rigor et al., 2008; Witte et al., 2021). All of these observations have one common requirement - the sensors and platforms collecting them must survive the harsh Arctic environment.
Instrument deployments in the Arctic are challenging due to the distance from major ports, cold temperatures, and the complications of growing, melting, and moving sea ice. Deployments are often centered around the date of the minimum ice extent (Berge et al., 2016). Autonomous platforms are preferred because they can increase the spatial and temporal sampling above what is possible with a ship or with personnel stationed on the ice (Lee et al., 2017). Cold temperatures drain batteries quickly and reduce the number of charge/discharge cycles (Williams et al., 2021). Extra batteries can be added to increase the power available, but the measurement systems are often weight limited and therefore limited in the amount of batteries that can be attached to the sensors. Reduced battery power means sampling rates and deployment durations are power constrained (Krishfield et al., 2008). Many oceanographic instruments such as temperature sensors, hydrophones, tsunami detection buoys, and drifting profiling floats require <10 W to operate (Green et al., 2019). Powering oceanographic instruments such as those mentioned above with marine renewable energy is an emerging market (Copping et al., 2018; Cavagnaro et al., 2020). Co-located marine renewable energy devices with continuous power generating capabilities could recharge batteries, increase the sampling rate and deployment time, and enable the use of instruments with higher power requirements.
In this study, we analyze the available marine renewable energy resource in the Arctic, discuss the power requirements of commonly used oceanographic instruments, and investigate how marine renewable energy could be used to power Arctic observations in three representative use cases. Marine renewable energy is considered here as energy that can be produced by the movement of water. We evaluate the current state of the art of marine renewable energy-based technologies and assess their potential to meet the needs of the Arctic observing community.
Arctic marine renewable energy resources
The Arctic is referred to as the test bed for renewable energy utilization because alternative energy sources are often necessary due to its remote location and lack of grid power. Solar panels can be useful in summer if the problem of frosting can be overcome; however, the solar resources in winter are extremely limited. Wind power can be used, but it is an intermittent resource and ice can accumulate on the turbine blades. To operate in the Arctic, wind turbines have to be designed to work in extreme weather conditions. Marine renewable energy may be a useful resource in the Arctic at select locations and certain times of the year when solar panels and wind turbines are not able to perform optimally. For the purposes of this study, marine renewable energy is defined as energy that is generated by water movement from waves or currents. Above the Arctic circle, the wave and current resources are relatively small compared to lower latitudes because tidal velocities are low and sea ice dampens wave energy. The international community has defined some areas below the Arctic circle as the Arctic for scientific purposes (Figure 1). Locations included in this broader definition include the Bering Sea and Aleutian islands, which have significant wave and tidal current resources that could be harvested using marine renewable energy technologies (Haas et al., 2011; García-Medina et al., 2021). Ice floe motion is also a potential source of marine renewable energy as the ice is pushed by the wind above or the current below. The ice floe motion resource varies spatially and temporally like the wave and wind resources and will be discussed in detail.
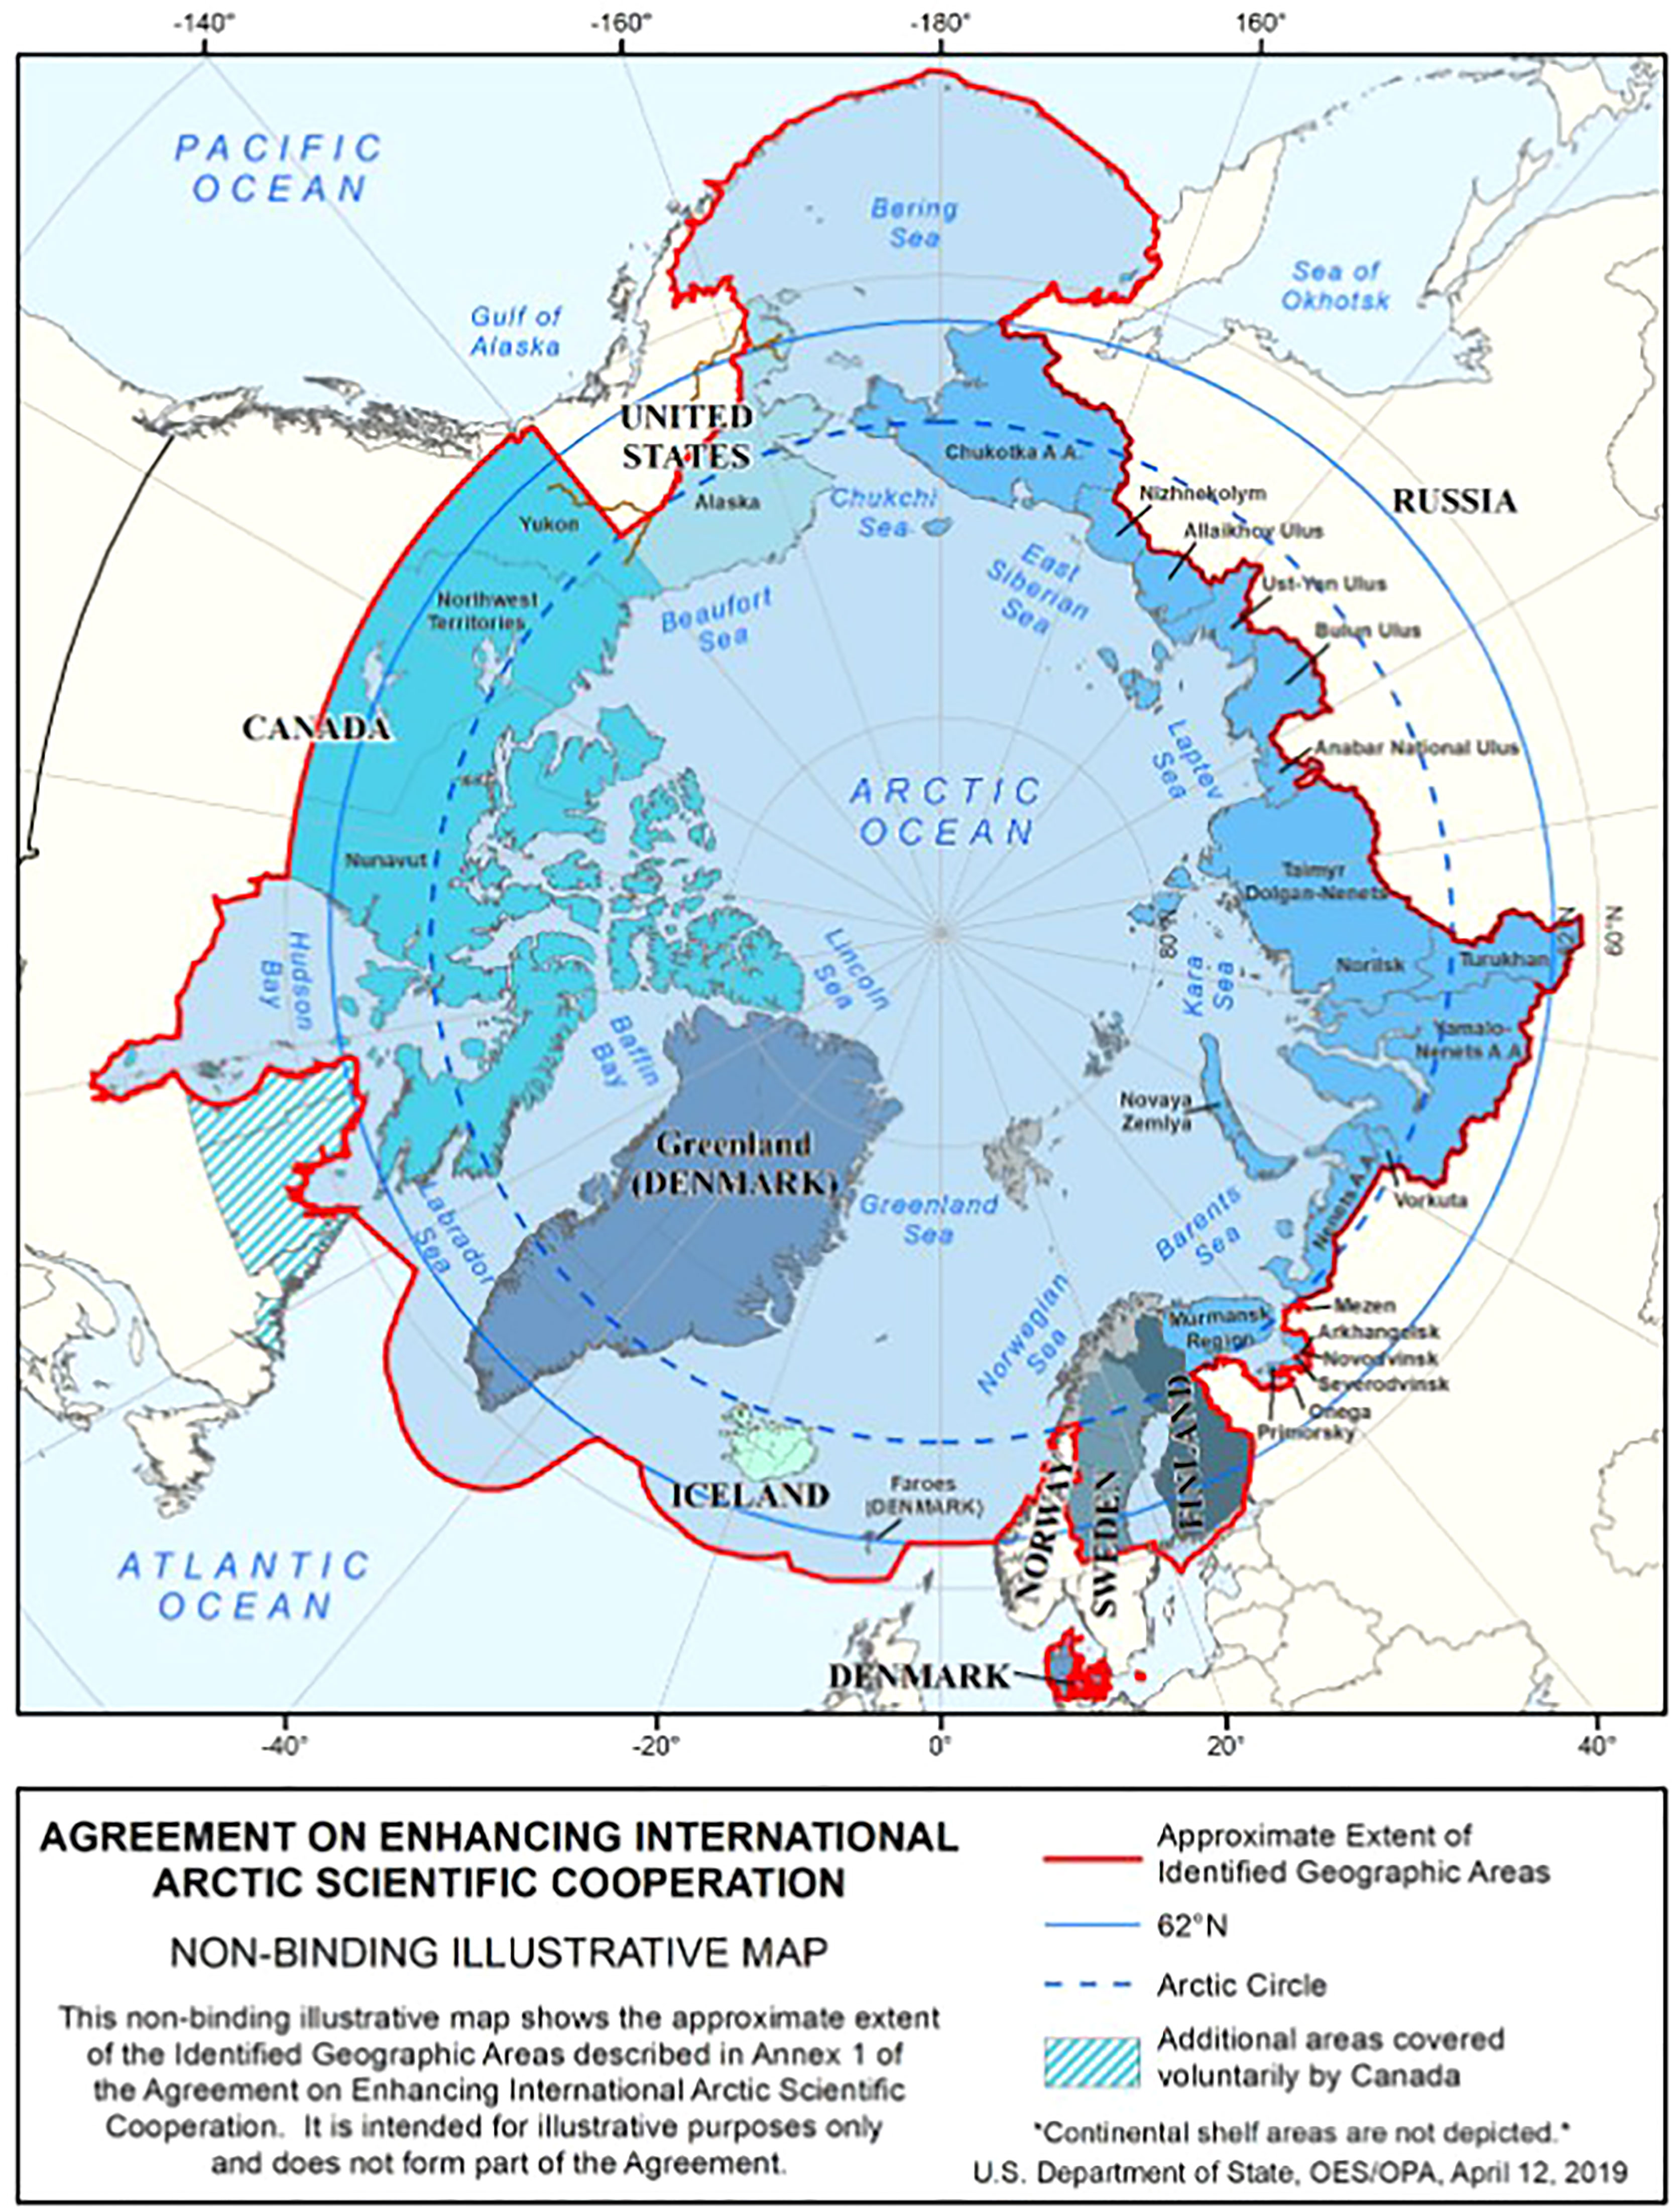
Figure 1 Map defining the internationally agreed upon Arctic boundary for the purpose of scientific studies (DOS, 2022).
Tidal currents
Tidal currents are a reliable form of marine renewable energy. Although they are in constant flux, the amount of available power can be easily predicted. Tidal energy is a localized resource depending on the geography and bathymetry of the region and it is strongest in narrow constrictions between large bodies of water. The amount of power that can be generated from currents is proportional to the cube of the water speed. Currents are typically only considered useful for harvesting energy where they are faster than 1 m/s but some turbines may operate at lower flow speeds (Polagye and Thomson, 2013). To characterize the tidal resource available in the Arctic, we used the Tide Model Driver (TMD) MATLAB toolbox (Erofeeva et al., 2020) to run the ARK5km2018 tide model (Erofeeva and Egbert, 2020). The Arc5km2018 model is a tidal barotropic model that runs over an idealized 5 km polar stereographic grid and includes 12 tidal harmonic constituents (5 semidiurnal: M2, S2, K2, N2, 2N2; 4 diurnal: K1, O1, P1, Q1; and 3 non-linear: M4, MS4, MN4). Figure 2 maps the maximum tidal velocity in the Arctic as calculated over a two week period with the Tide Model Driver toolbox. Above the Arctic circle, the Northwestern Passages of Canada, Svalbard, and several locations in Russia have maximum tidal velocities above 1 m/s (Figure 2A). Below the Arctic circle, Bristol Bay and select locations in the Aleutian Islands show maximum tidal velocities of >1 m/s, which may be useful for electricity generation (Figure 2B). We note that although it is not considered part of the Arctic per Figure 1, Cook Inlet, Alaska has been identified as a promising location for tidal energy development (Wang and Yang, 2020).
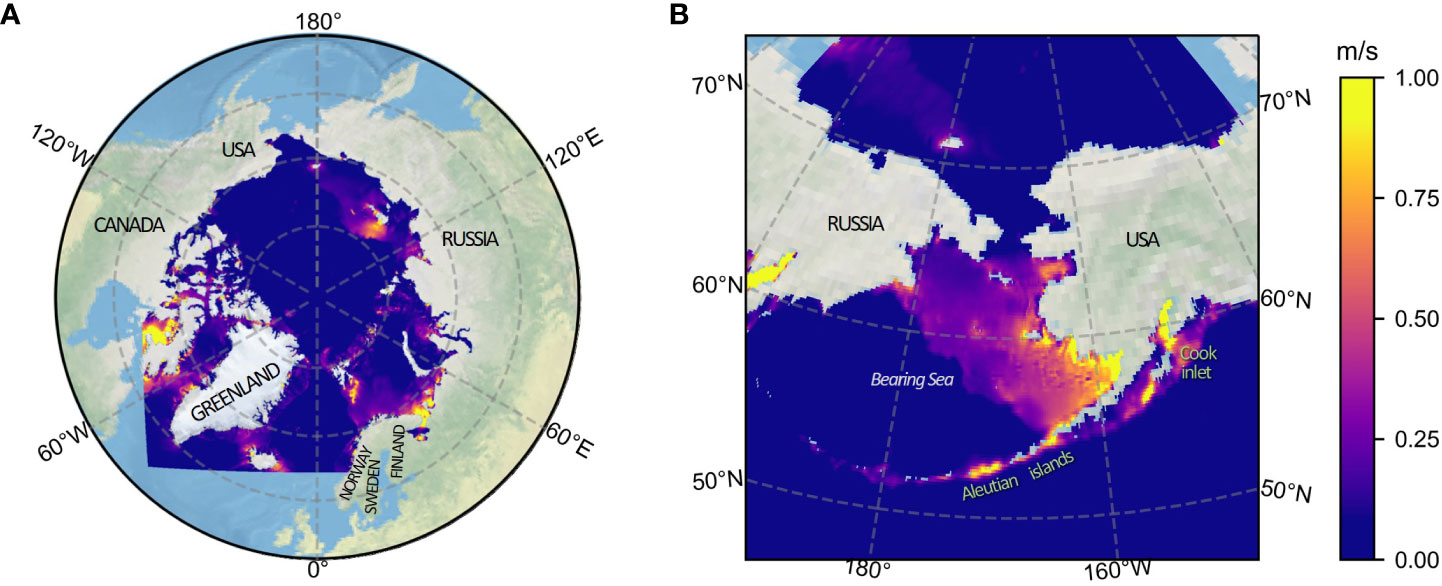
Figure 2 Maximum tidal velocity as calculated with the Tide Model Driver toolbox. (A) Arctic (B) Bering Sea and Aleutian Islands.
Waves
Wave energy is a form of marine renewable energy that is not as predictable as tidal energy, but it is readily available at more locations. In the Arctic, waves are attenuated by sea ice, but some of their energy still propagates and can cause ice breakages hundreds of kilometers from the ice edge (Kohout et al., 2014). The recent decrease in the extent of the sea ice has led to increased availability of open water for the wind to blow over (longer fetch lengths), which in turn results in an increase in the wave heights (Thomson et al., 2018). Wave energy in the Arctic varies spatially and temporally with changes in the ice cover and wind speed. Seasonal wave patterns were studied with model data from the National Oceanic and Atmospheric Administration (NOAA) National Centers for Environmental Prediction (NCEP) WAVEWATCH III Production Hindcast (NOAA, 2022), which uses operational NCEP winds and ice fields as input forcing fields. Significant wave height, Hs and peak wave period, TP model results were obtained for latitudes 50–90°N over a rectilinear 30 arc-minute grid and a 3 hr temporal resolution. The theoretical amount of power carried by waves can be derived from HS and TP. The power per unit crest length, J can be calculated as
where ρ is the density of water, g is the acceleration due to gravity, and the energy period, TE is approximated as 0.85TP. In order to calculate the power that a wave energy converter (WEC) could generate from the power per unit crest length, the efficiency η of the WEC must be known in a dimension B (Cavagnaro et al., 2020). The WEC power PW can then be estimated as
Maps of the average wave power per unit crest length from June 2014 to May 2019 show the seasonal change of the wave patterns in the Arctic (Figure 3). In spring, significant wave power exists at the southern tip of Greenland and in the Bering Sea (Figure 3A). Summer is the season with the lowest sea ice extent and the largest areas of open water however, the waves are small due to fewer storms. In fall, significant wave power is present again near Greenland and in the Bering Sea. Winter has the largest waves but the northern regions are affected by sea ice. Overall, the Arctic wave power resource is highest around Greenland and in the Bering Sea.
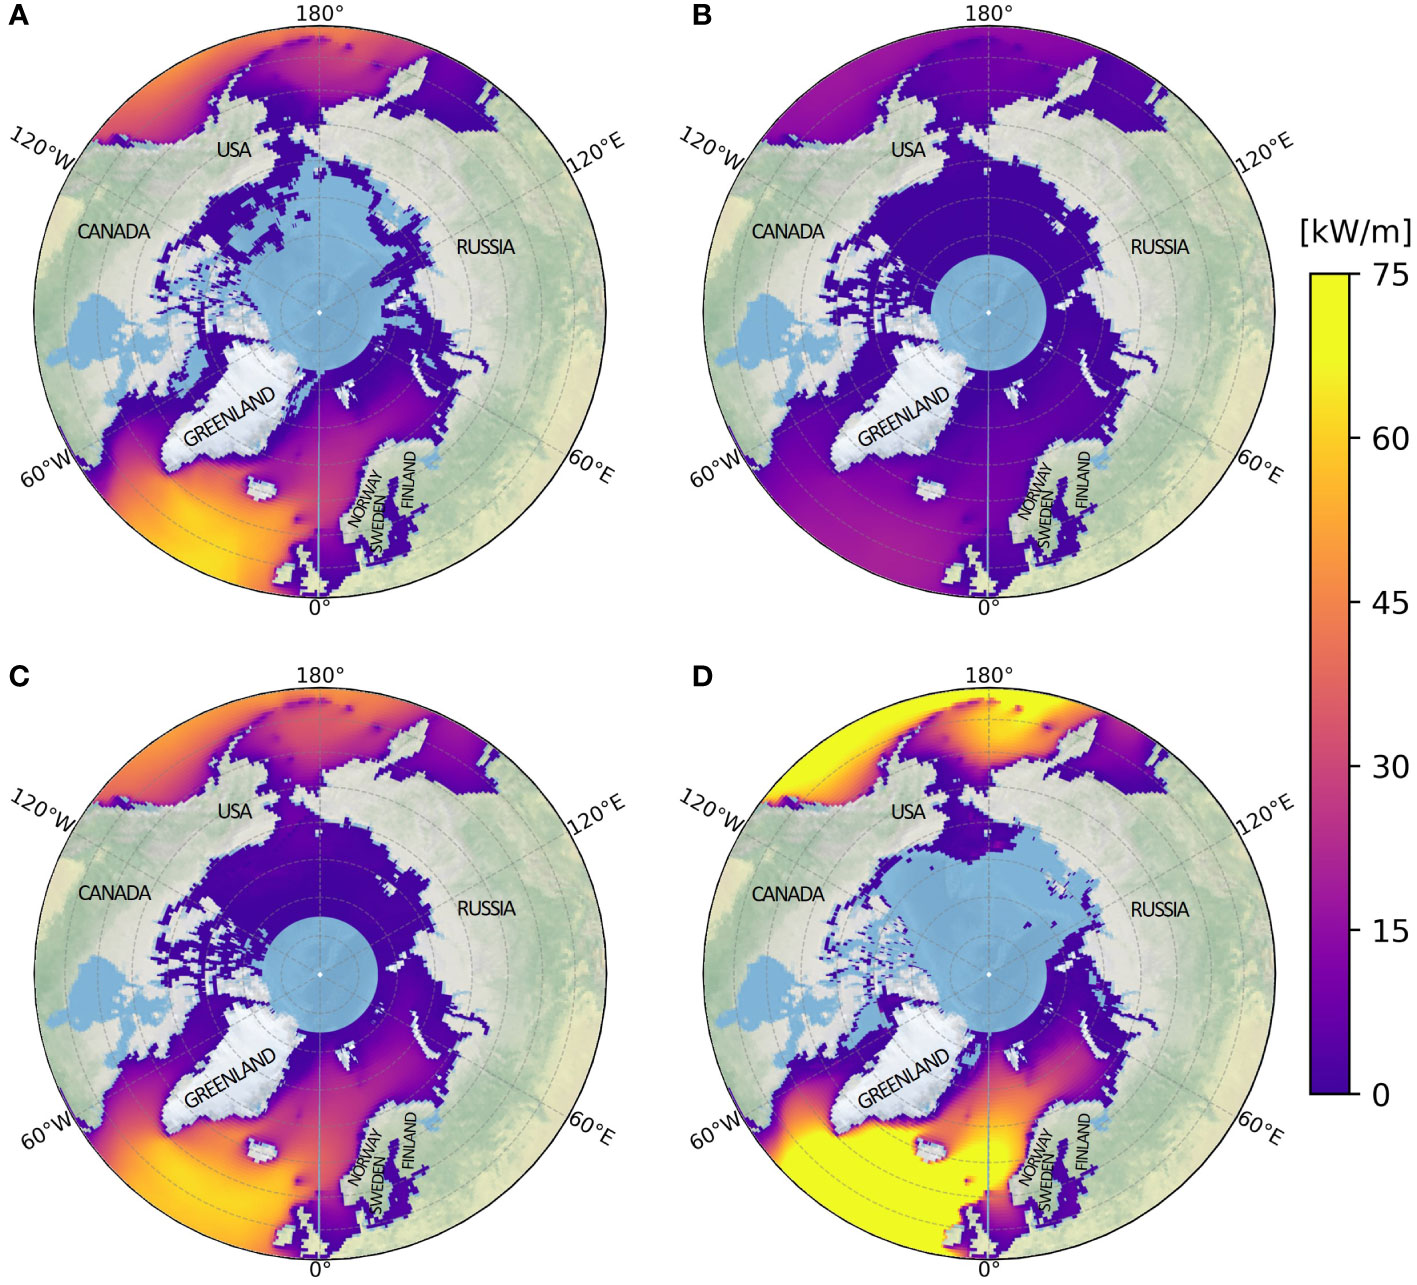
Figure 3 Seasonal wave power per unit crest length J calculated using WAVEWATCH III model output. Data are averaged from June 2014 to May 2019. (A) Spring: March-May, (B) Summer: June-August, (C) Fall: September-November, and (D) Winter: December-February.
Ice floe motion
Sea ice floes move under the pressure of wind blowing above the surface and/or water current flowing underneath the ice. Above the Arctic Circle, the highest sea ice velocities are in Fram Strait with the velocities as high as 0.4 m/s winter and 0.2 m/s in summer (Rigor et al., 2002). The overall ice motion patterns follow the two major Arctic currents, the Beaufort Gyre north of Alaska and the Transpolar Drift Stream northeast of Greenland. When ice motion is driven only by currents, there is little to no relative velocity between the ice and the water beneath it because the ice moves with the current. However, when the motion of the ice is influenced by the wind, a relative velocity between the ice and the water below it is observed. A relative velocity between the ice and the water can also occur if there is a current underlying stationary landfast ice. In either of these cases, the relative velocity could be used to generate electricity with a current energy converter (CEC), such as a turbine or a vortex-induced vibration device (VIV), if it is deployed under the ice. Vortex-induced vibration energy harvesting devices generate electricity from motion that occurs when vorticies are shed from a bluff body in a flow (Zheng et al., 2020).
The available resource for ice-water relative motion was assessed with output from the HYbrid Coordinate Ocean Model (HYCOM) (Chassignet et al., 2007). The sea ice velocities (vi) and water current velocities (vw) redicted by HYCOM were analyzed from January 1, 2020 to February 29, 2020. The relative velocity (vrel) or velocity that would be available for power generation, was calculated as the absolute value of the difference between the sea ice velocity and water current velocity (vrel =|vi – vw|). The average relative velocity is less than 0.2 m/s for most locations except along the east coast of Greenland (Figure 4). The maximum relative velocity reaches >0.2 m/s for many locations in the Arctic including the Bering Sea (Figure 5A). A 0.2 m/s cut off for analysis was selected for this study, since it is close to the minimum velocity that a VIV device has generated electricity (pers. comm. M. Bernitsas 6/10/2022). Turbines usually have a minimum operating velocity of around 0.5 m/s (Yosry et al., 2021), therefore, Figure 5B shows the maximum relative velocity with the color scale expanded to 0.5 m/s. This highlights the areas where a turbine that only generates electricity >0.5 m/s could operate.
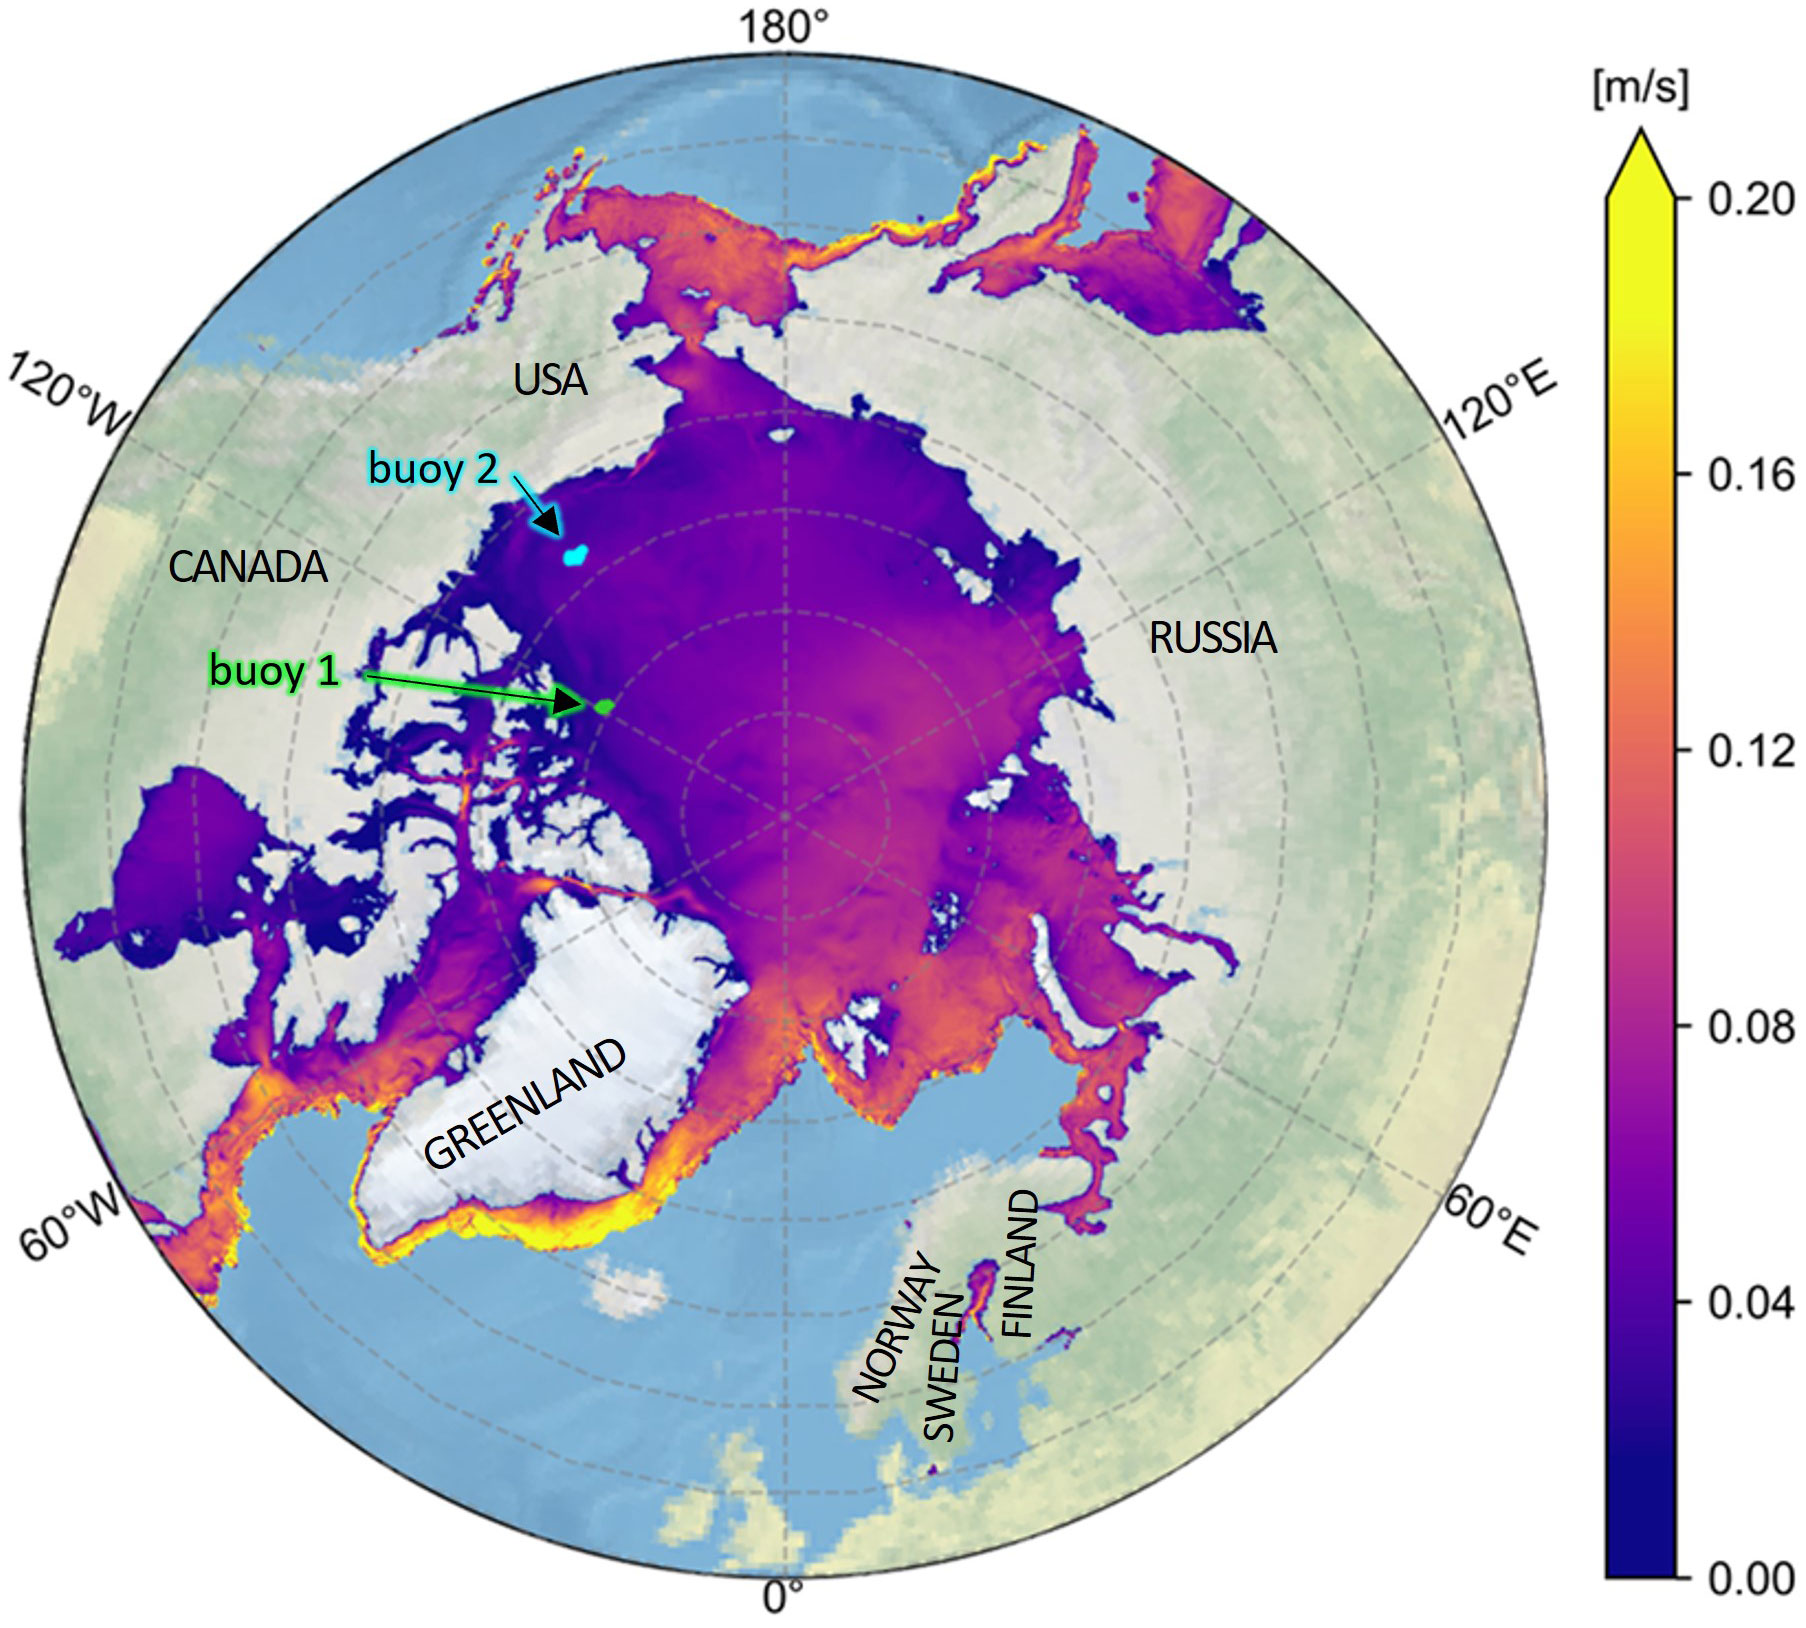
Figure 4 Average relative velocity, vrel between the surface water and sea ice, as calculated using HYCOM for time duration from January 1, 2020 and February 29, 2020. The positions of the two International Arctic Buoy Program buoys used for validation are indicated.
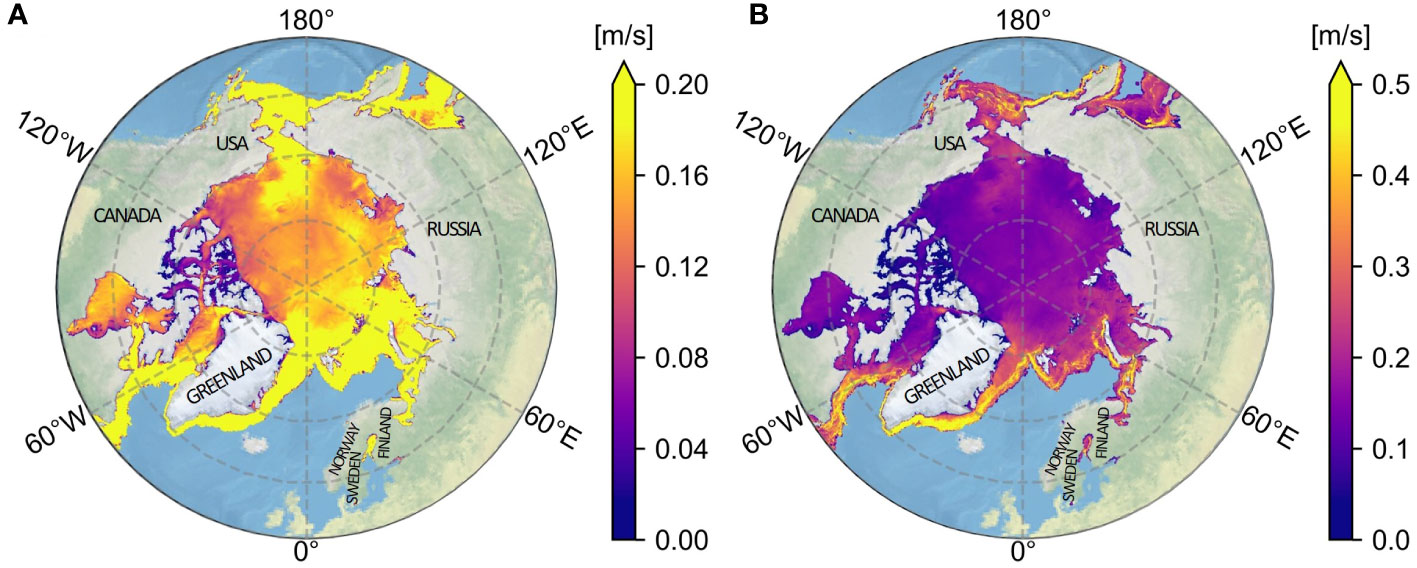
Figure 5 Maximum relative velocity, vrel between the surface water and sea ice, as calculated using the HYCOM model between January 1, 2020 and February 29, 2020. (A) Colormap from 0-0.2 m/s (B) Colormap from 0-0.5 m/s.
To validate the use of HYCOM for resource assessment in this study, we compared model-predicted values to publicly available global positioning system (GPS)-based data from buoys deployed on sea ice in the Arctic (IABP, 2022). This comparison is particularly relevant, as one use case of ice floe motion CECs is to power instruments deployed on sea ice. Two buoys reporting data during the January 1 - February 29, 2020 analysis window and located in the HYCOM area were selected for analysis (buoy IDs 300234063064350 and 300234063983340, henceforth referred to as buoys 1 and 2, respectively). The geographic locations of the two buoys are indicated in Figure 4.
The velocity of each buoy was calculated from the hourly GPS data and compared to the sea ice velocity predicted by HYCOM at the buoy’s position using linear interpolation. On average, the mean absolute differences between the buoy-measured velocities and model-predicted velocities were 0.05 and 0.03 m/s for buoys 1 and 2, respectively. While these errors are relatively high when compared to velocity magnitudes on the order of 0.1 m/s, temporal trends generally agree for both buoys (see Figure 6). HYCOM tended to underestimate the velocity of buoy 2, which was located in the Beaufort Sea, while it tended to overestimate the velocity of buoy 1, which was farther north and closer to the Queen Elizabeth Islands. While this is a limited validation, the agreement between the buoy GPS data and HYCOM generally indicate that the resource assessment reported in this study represents a realistic estimate.
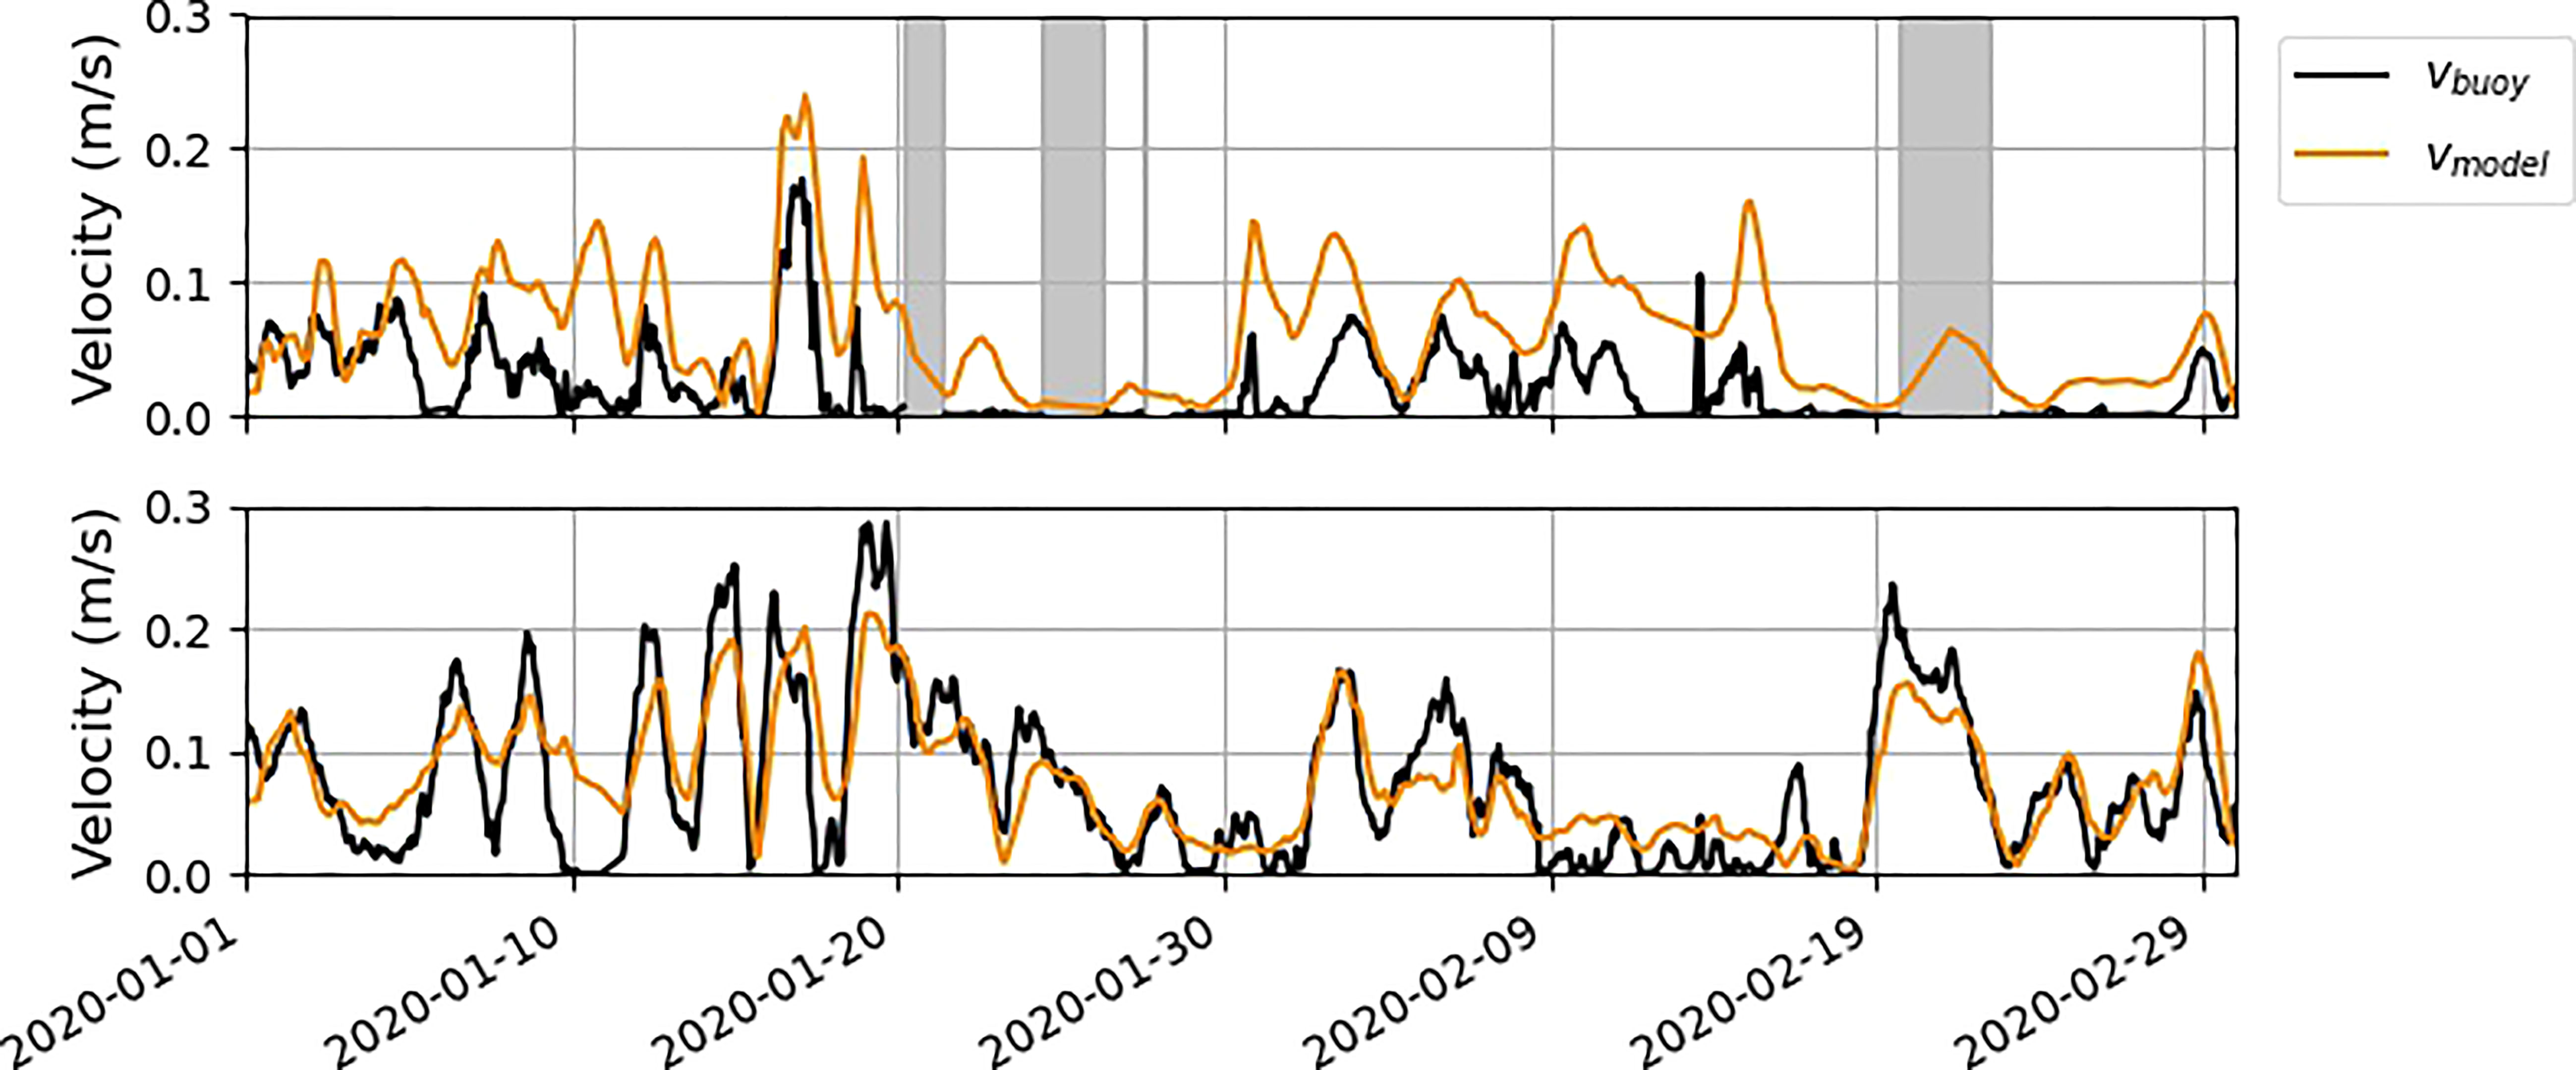
Figure 6 Velocity of buoy 1 (top) and buoy 2 (bottom) compared to HYCOM predicted sea ice velocity at the GPS position of the buoy. Buoy data gaps are highlighted in gray.
Electricity generation
The use of energy converters to power oceanographic sensors in the Arctic depends on the resources available and the desired power output. Electricity generation from marine renewable energy usually comes from tidal turbines or wave energy converters, but most devices that are commercially available or under development are designed to operate in higher energy conditions and for higher-power applications than are common in the Arctic. The average power usage requirements of many oceanographic instruments are only 1-10 W (Green et al., 2019). To our knowledge, no wave energy converters are commercially available that operate in the 1-10 W power range. There are a few options available for current energy conversion in that power range. Yosry et al. (2021) designed and tested a small turbine optimized for low water velocities that can generate 1-4 W at flow speeds of 0.43-0.69 m/s. The turbine was designed for research purposes though, and it is not commercially available. A commercially available portable turbine has been developed that can generate electricity in flow speeds of 0.3-4 m/s and operate with a maximum rated power output of 15 W (WaterLily, 2022). While it has been marketed for portable device charging, it could be used to power oceanographic instruments in a current if it could be modified to survive the harsh Arctic environment. A literature review of turbines found that larger scale commercially available turbines have cut-in speeds at or above 0.5 m/s (Lewis et al., 2021). Vortex-induced vibration energy converters may be a promising alternative to turbines, because they can operate at lower current velocities. A VIV instrument being developed by Vortex Hydro (Vortex, 2022) has published measurements of energy conversion in flows as slow as 0.25 m/s (Bernitsas et al., 2008; Li et al., 2022). Recent tank tests of the Vortex Hydro instrument showed electricity generation in flows as low as 0.19 m/s (M. Bernitsas, personal communication on June 10th, 2022). Other VIV instruments use piezoelectric energy harvesting or pendulum motion to generate electricity (Sun et al., 2019; Wickett et al., 2019). A small pendulum device is being developed by the WITT Energy company (WITT, 2022) to operate in the 1-10 W range and generate electricity from wave motion or VIV motion. Even though VIV technology development lags behind conventional turbines, these new technologies may be well suited for the slow current speeds found in the Arctic.
Arctic use cases
International Arctic buoy program
A potential use case for marine renewable energy powered Arctic observations are buoys that monitor environmental conditions. The International Arctic Buoy Program (IABP) is a network of buoys that measure variables such as sea level pressure, surface air temperature, and ice motion (Rigor et al., 2008). Researchers deploying these buoys are affiliated with 20 institutions based in 9 countries and the data generated are used for weather forecasting, sea ice condition predictions, and climate studies. After deployment, the buoys drift on the ice or in the ocean. Figure 7 shows the locations and mean velocities of IABP buoys as of January 6, 2022. More Arctic drifting buoys are needed to collect sea level pressure data, which cannot be measured by satellites and therefore must be measured by instruments on buoys (Centurioni et al., 2019). In-situ power generation on the buoys would enable increased sampling frequencies and longer deployments. Electricity could be generated for an IABP buoy by a wave energy converter when the buoy is floating on open water or by a CEC that is hung under the buoy through a hole in the ice while the buoy is floating on the ice.
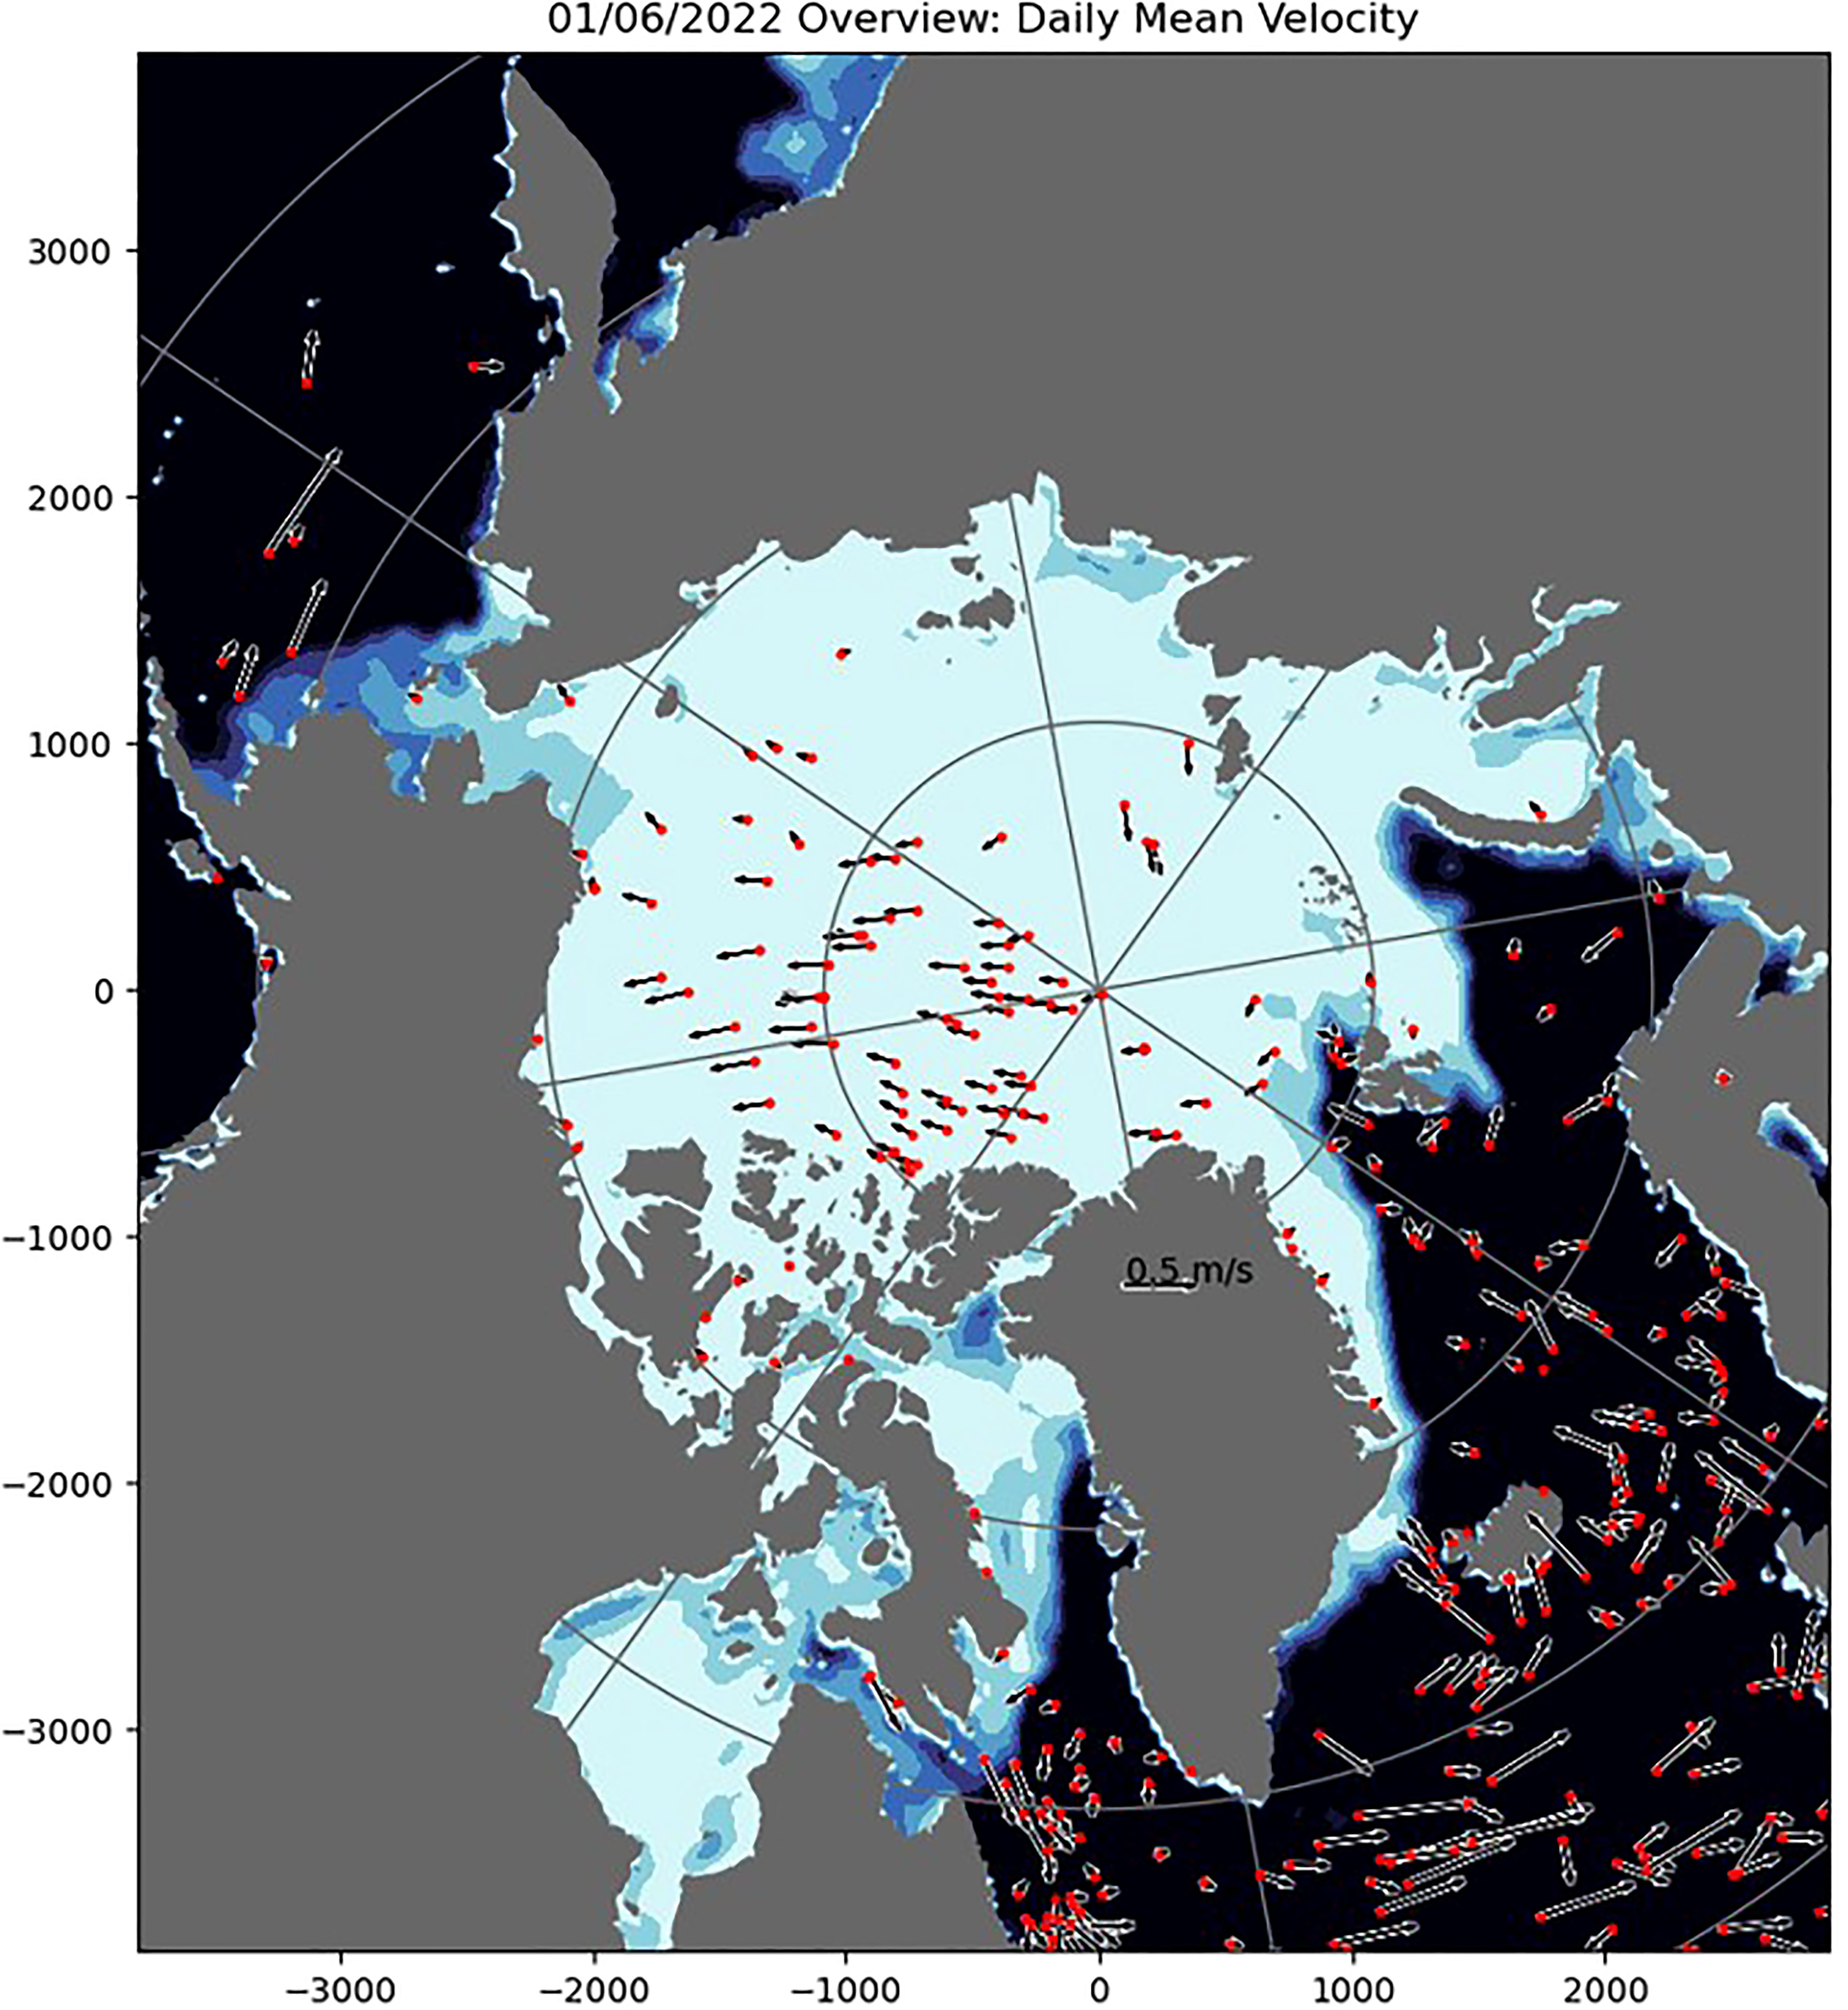
Figure 7 International Arctic Buoy Program (IABP) based buoy locations and mean velocities as on January 6, 2022 (IABP, 2022).
Wave energy converter powered buoys are currently being designed and the U.S. Department of Energy recently hosted a prize competition to encourage development in this area (DOE, 2022). A wave energy converter powered IABP buoy would be engineered similarly to a wave energy converter powered buoy for mid-latitudes, but it would be designed specifically for the wave conditions found in the Arctic. Fram Strait and the Bering Sea are the two locations where IABP buoys float in ice free waters (Figure 7) and significant wave power is present at certain times of the year (Figure 3). The amount of energy that can be harvested to power a buoy would be lower than the values shown in Figure 3 due to inefficiencies of the energy conversion process. The effective power that can be derived from the waves depends both on the wave height and wave period, as seen in Eq. 1, but will also depend on the size and design of the specific WEC deployed. Wave energy converters are designed to maximize power production for a range of wave heights and periods, but the wave height and period conditions may be different in Fram Strait and the Bering Sea depending on if they are locally generated wind waves or incoming swell. As wave energy converter powered buoys are being developed, they could be tuned for the waves where the buoys will be deployed.
A CEC hung under the buoy through a hole in the ice would be engineered similarly to hanging a hydrophone under a buoy through a hole in the ice. It would generate electricity only when the relative velocity between the ice and the water is above the cut-in speed of the CEC, which will typically be around 0.2-0.3 m/s. The IABP buoy locations that correspond to the highest relative velocities are Fram Strait and Bering Sea (Figures 7 & 5). Those would be the best locations for powering a buoy with a CEC hung under the ice. Power available to a CEC, P goes as the cube of the current velocity and is calculated as
where A is the CEC projected area, CP is the coefficient of performance, and u is the current velocity (Cavagnaro et al., 2020). The strong dependence on u indicates that a CEC under the ice will produce significantly more power if the current is 0.5 m/s than if it is only 0.2 m/s. The dependence on A is also important because the size of the CEC will be constrained by the size of the hole through the ice.
Tide gauges
Five NOAA tide gauges are currently operating in Alaska without reliable grid power (C. Gostnell, personal communication on April 22, 2021). They are powered by solar panels or a combination of diesel and wind. These power sources only work intermittently, which makes the prospect of using in-situ marine renewable energy conversion desirable if it could increase the working times of the gauges. The tide gauges are located in sheltered coves where the wave and tidal resources are limited (Figure 8). Significant wave energy is available offshore in these parts of Alaska (Figure 3), but cables would be required to connect the tide gauges to offshore wave energy converters or the tide gauges would need to be moved to channels with strong tidal velocities to use current energy converters.

Figure 8 Locations of remote NOAA tide stations that are powered by solar, diesel, or wind.
Hydrophones
Hydrophones are used extensively in Alaska to monitor vocalizing marine mammals. Figure 9 shows the locations of past, current, and future hydrophone deployments (C. Berchok, personal communication on January 19, 2022). The hydrophones rarely collect data continuously, typically recording data on a relatively sparse duty cycle (as low as 1.6 h of data collection per 24 h) (Clark et al., 2015; Wright et al., 2019). Power generation at the hydrophone locations would increase the amount of data collected, facilitating efforts to gain knowledge about the presence and behavior of marine mammals inhabiting the region.
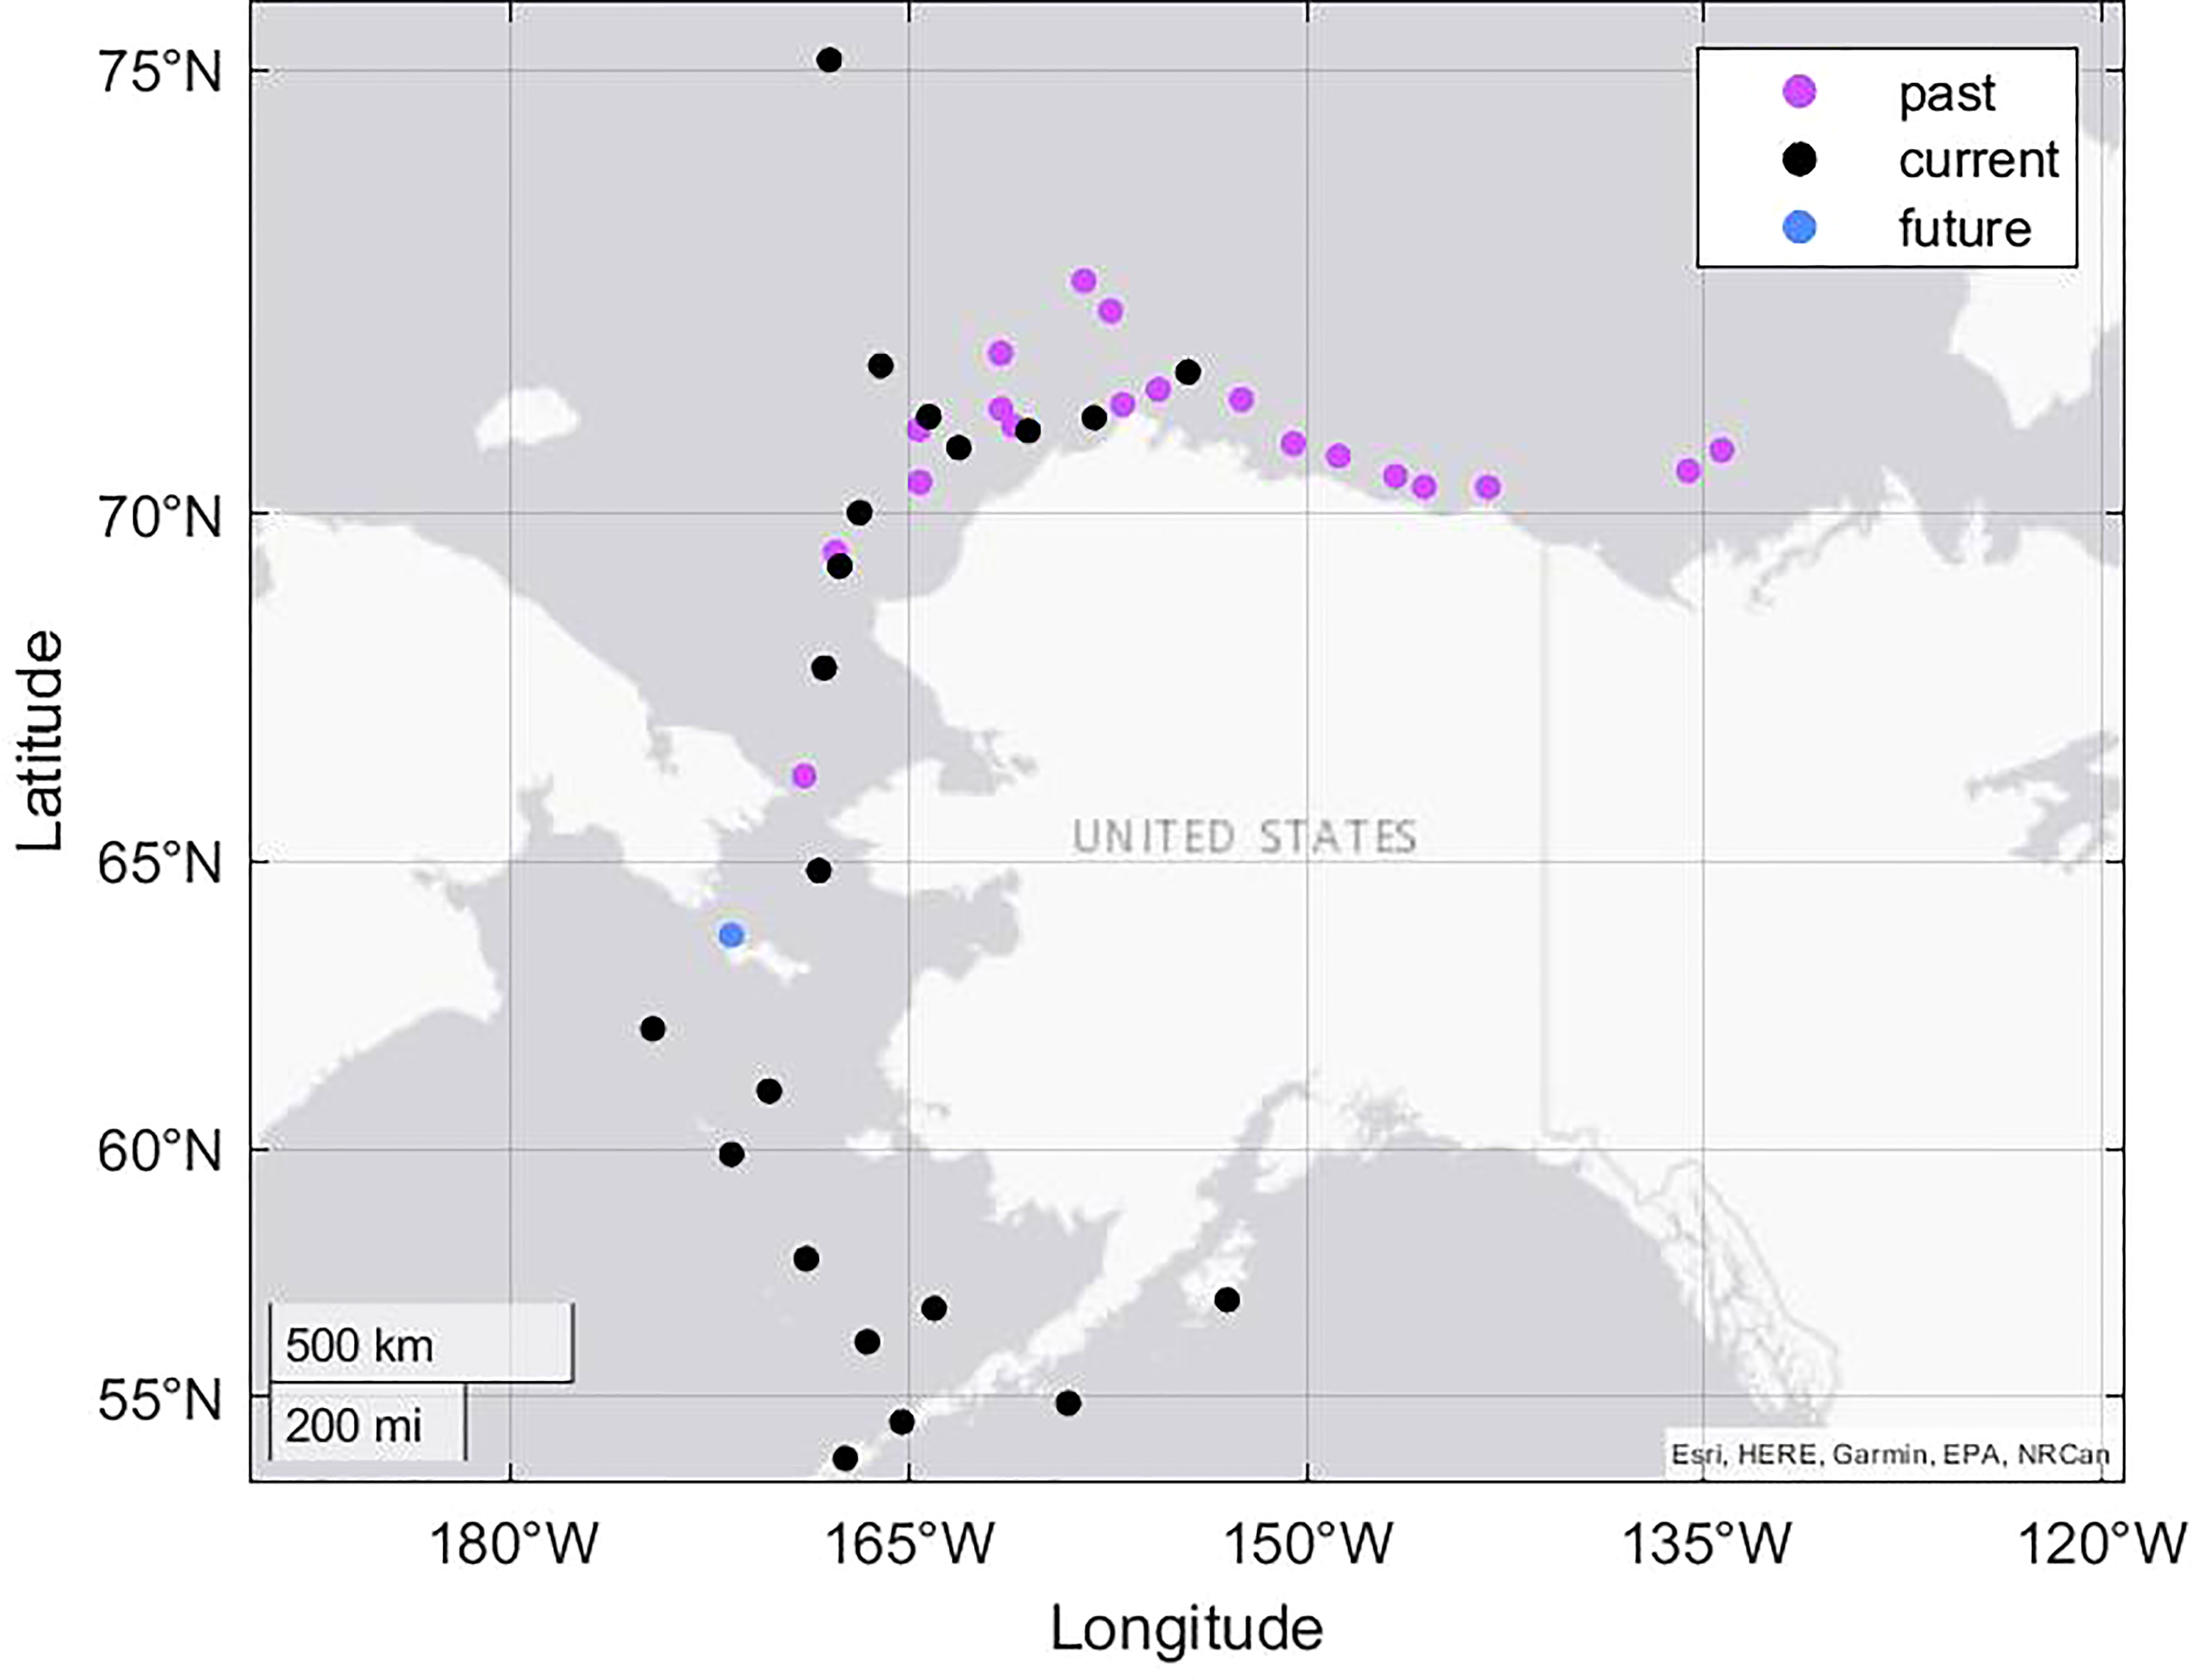
Figure 9 Locations of past, current, and future Arctic hydrophone deployments for marine mammal studies of North Pacific right whales (Wright et al., 2018) and bowhead whales (Clark et al., 2015).
While most hydrophones currently deployed in the Arctic are not in ideal locations for current energy conversion, two hydrophone locations in the Aleutian Islands could potentially be powered by tidal currents. Figure 10A shows the locations of the two hydrophones and the XTide reference stations closest to them. The XTide reference stations are locations where tidal predictions are made using the National Ocean Service algorithm. Histograms of the XTide predicted current speeds and the exceedance probability curves describe the current conditions that could be used to generate electricity. At Unimak Pass, an XTide station close to a hydrophone shows the current speed to be >0.5 m/s for 46% of the time (Figure 10B). This indicates that a turbine with a cut in speed of 0.5 m/s could contribute to powering a hydrophone or charging a battery for 46% of the time, which amounts to 11 hours of the day. The Unimak Pass hydrophone is especially important because it monitors the critically endangered eastern population of the North Pacific right whale (Wright et al., 2018). The second hydrophone that is southwest of Unimak Pass also monitors right whales, but does not have an XTide location very close to it. The closest XTide location at Paso Point shows the current distribution is narrow and the current speed is only above 0.5 m/s for 20% of the time (Figure 10C). This indicates a turbine would only provide power to a hydrophone or battery during 5 hours of the day. Further south in a narrow passage, the current speed at Konets Head is above 0.5 m/s for 78% or the time and 50% of the time it is above 1.2 m/s (Figure 10D). This is an even stronger tidal resource than in Unimak Pass. At this location energy would be supplied to a hydrophone or battery for 19 hours of the day. If the hydrophone were moved to inside the narrow passage, there would be plenty of tidal energy to be harvested to operate it. However, we note that deployment of a hydrophone in a tidal channel presents other challenges, including increased flow noise that may impact low-frequency measurements (Bassett et al., 2014).
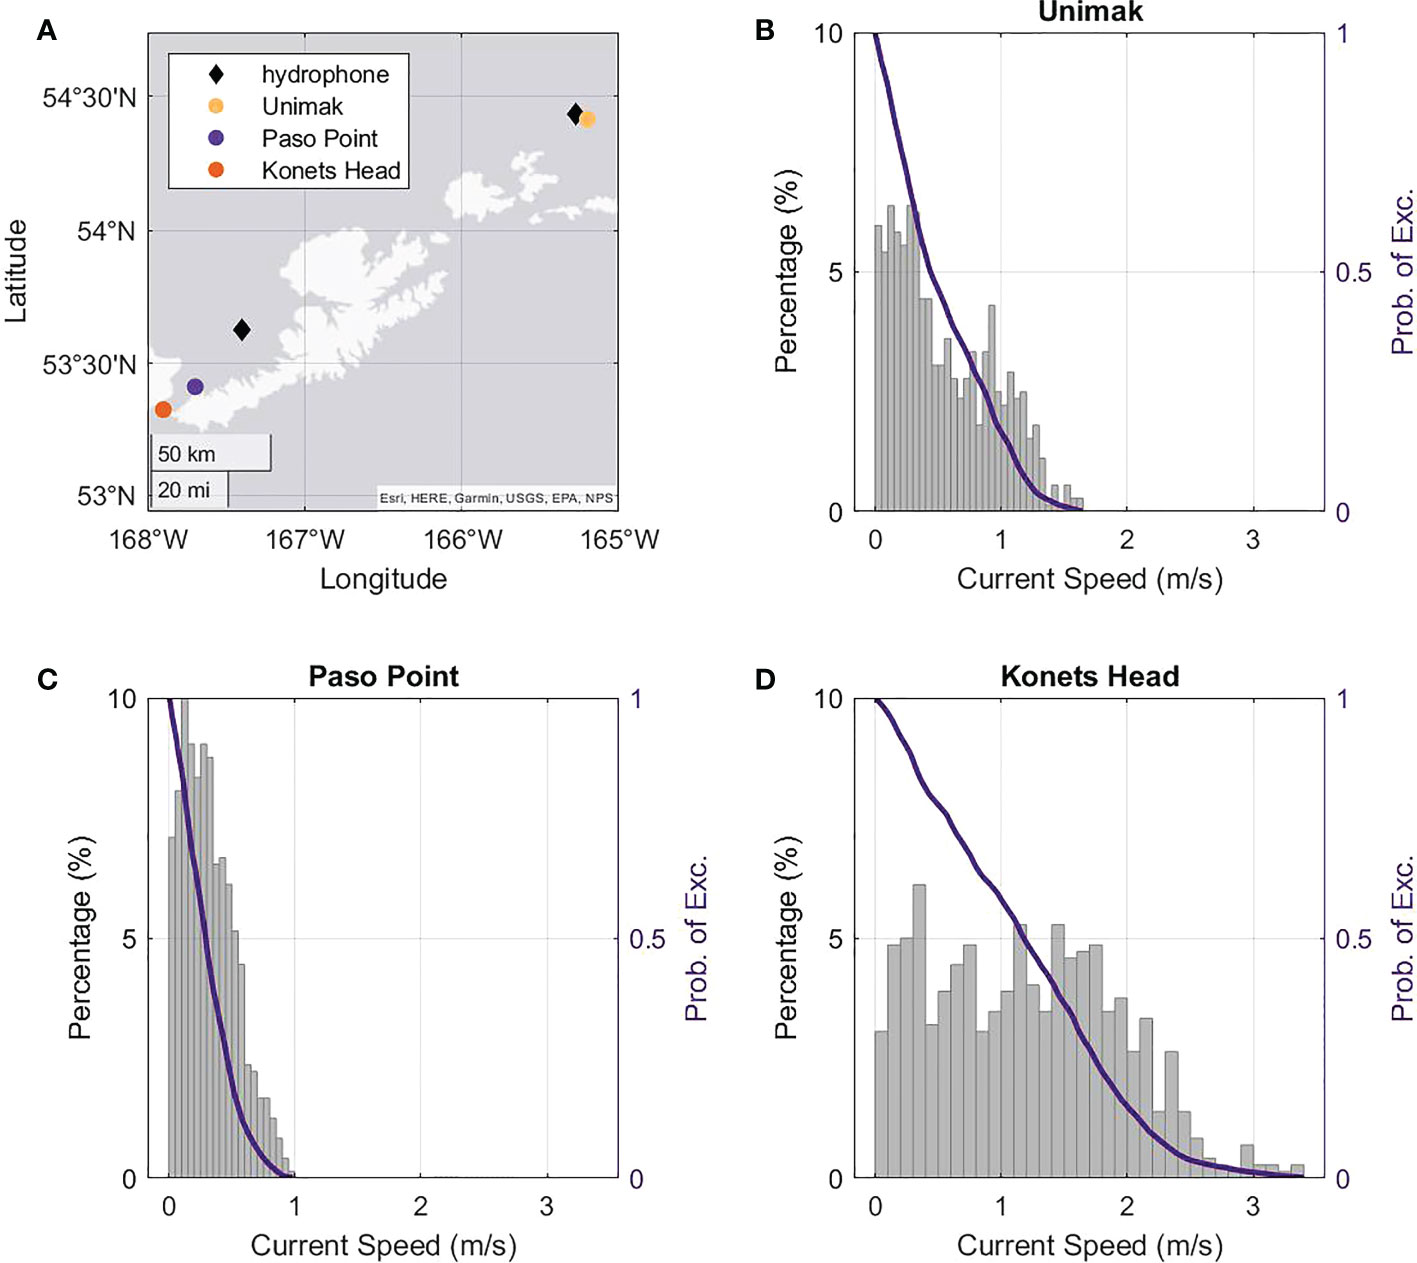
Figure 10 Map and percentage and exceedance curves of hydrophone and XTide locations in the Aleutian Islands. (A) hydrophone and XTide locations (B) XTide data from Unimak Pass (C) XTide data from Paso Point (D) XTide data from Konets Head.
Discussion and conclusions
The marine renewable energy resources of the Arctic are limited and vary spatially and temporally. The tidal energy resources are greatest near Bristol Bay and the Aleutian Islands. Wave-current interactions could increase or decrease the tidal energy resources at these locations, and they will be the topic of future research. The wave energy resources vary seasonally and with ice cover, but the Bering Sea has potential for wave energy converter usage during nine months of the year. The wave model used in this analysis did consider sea ice cover, but the physics of the dampening of waves by sea ice is not well understood and is the topic of current research (Branch et al., 2021). The relative velocity between sea ice and the water below can be considered a marine renewable energy resource if a hole can be drilled in the ice and a turbine or VIV instrument can be lowered into the water through it. It is a very localized resource that occurs where strong winds push the ice such as along the eastern shore of Greenland. Although the tidal current, wave energy, and under ice current resources are all limited, they may still be useful to power observations because most of the observational instruments used in the Arctic require<10 W to operate. Batteries could be recharged when the resource is available and the marine renewable energy resource would extend the lifetime of the deployment. As new energy storage devices such as flywheels are developed, they will enable more usage of marine renewable energy by storing the energy when intermittent resources such as waves and tides are not available.
The investigation of potential use cases such as buoys on the ice, buoys in the water, remote tide gauges, and hydrophones, revealed that some applications may be more suited for marine renewable energy conversion than others. The buoys deployed on the ice were only able to extract energy from the current below the ice when the wind pushed the ice at a speed above the turbine or VIV instrument’s cut in speed. Buoys in the water may be able to obtain power from a wave energy converter in the Bering Sea but might struggle to find enough waves north of Alaska. The remote tide gauges that are in need of supplemental power are located too far from any current or wave energy resources to be a viable use case for marine renewable energy without relocation. Hydrophones are used in many locations around the Arctic and could potentially be powered by a moored wave energy converter for those in locations with sufficient wave resources. They could also potentially be powered using turbines or VIV instruments when located in areas with significant tidal velocities.
New energy conversion technologies need to be developed to power Arctic observations with marine renewable energy. Wave energy converters and tidal turbines generating power in the range of 1-10 W range required by most Arctic instruments are not currently available. One small turbine is commercially available in that range but it was not designed to power oceanographic observations. A VIV instrument will be commercially available soon, but it has not yet been tested to power oceanographic observations. Future developments should integrate marine renewable energy technologies with Arctic observational instruments such as wave energy converters in buoys and tidal turbine powered hydrophones. Once these technologies have been developed to withstand the harsh Arctic conditions they can also be used in the Antarctic and at lower latitudes.
Data availability statement
The raw data supporting the conclusions of this article will be made available by the authors, without undue reservation.
Author contributions
RB conceptualization and writing of the original draft. EC, RC, FT, and IR writing. FT, EC, and JM data analysis. All authors contributed to the article and approved the submitted version.
Funding
This research was funded by the U.S. Department of Energy (DOE), Office of Energy Efficiency and Renewable Energy, Water Power Technologies Office under contract DE-AC05-76RL01830 to the Pacific Northwest National Laboratory.
Acknowledgments
This research was completed by the Pacific Northwest National Laboratory, which is operated by the Battelle Memorial Institute. The U.S. Government retains that the publisher, by accepting the article for publication, acknowledges that the U.S. Government retains a nonexclusive, paid-up, irrevocable, worldwide license to publish or reproduce the published form of this work, or allow others to do so, for U.S. Government purposes.
Conflict of interest
The authors declare that the research was conducted in the absence of any commercial or financial relationships that could be construed as a potential conflict of interest.
Publisher’s note
All claims expressed in this article are solely those of the authors and do not necessarily represent those of their affiliated organizations, or those of the publisher, the editors and the reviewers. Any product that may be evaluated in this article, or claim that may be made by its manufacturer, is not guaranteed or endorsed by the publisher.
Author disclaimer
The views expressed herein do not necessarily represent the views of the U.S. Department of Energy or the U.S. Government.
References
Bassett C., Thomson J., Dahl P. H., Polagye B. (2014). Flow-noise and turbulence in two tidal channels. J. Acoustical Soc. America 135, 1764–1774. doi: 10.1121/1.4867360
Berge J., Geoffroy M., Johnsen G., Cottier F., Bluhm B., Vogedes D. (2016). Ice-tethered observational platforms in the arctic ocean pack ice. IFAC-PapersOnLine 49, 494–499. doi: 10.1016/j.ifacol.2016.10.484
Bernitsas M. M., Raghavan K., Ben-Simon Y., Garcia E. (2008). Vivace (vortex induced vibration aquatic clean energy): A new concept in generation of clean and renewable energy from fluid flow. Journal of offshore mechanics and Arctic engineering 130, 1–15. doi: 10.1115/1.2957913
Blunden J., Arndt D. S. (2016). State of the climate in 2015. Bull. Am. Meteorol Soc. 97, Si–S275. doi: 10.1175/2016BAMSStateoftheClimate.1
Branch R., García-Medina G., Yang Z., Wang T., Ticona Rollano F., Hosekova L. (2021). Modeling sea ice effects for wave energy resource assessments. Energies 14, 3482. doi: 10.3390/en14123482
Cavagnaro R. J., Copping A. E., Green R., Greene D., Jenne S., Rose D., et al. (2020). Powering the blue economy: progress exploring marine renewable energy integration with ocean observations. Mar. Technol. Soc. J. 54, 114–125. doi: 10.4031/MTSJ.54.6.11
Centurioni L. R., Turton J., Lumpkin R., Braasch L., Brassington G., Chao Y., et al. (2019). Global in situ observations of essential climate and ocean variables at the air–sea interface. Front. Mar. Sci. 6, 419. doi: 10.3389/fmars.2019.00419
Chassignet E. P., Hurlburt H. E., Smedstad O. M., Halliwell G. R., Hogan P. J., Wallcraft A. J., et al. (2007). The hycom (hybrid coordinate ocean model) data assimilative system. J. Mar. Syst. 65, 60–83. doi: 10.1016/j.jmarsys.2005.09.016
Clark C. W., Berchok C. L., Blackwell S. B., Hannay D. E., Jones J., Ponirakis D., et al. (2015). A year in the acoustic world of bowhead whales in the Bering, Chukchi and Beaufort seas. Prog. Oceanogr 136, 223–240. doi: 10.1016/j.pocean.2015.05.007
Cohen J., Screen J. A., Furtado J. C., Barlow M., Whittleston D., Coumou D., et al. (2014). Recent Arctic amplification and extreme mid-latitude weather. Nat. Geosci. 7, 627–637. doi: 10.1038/NGEO2234
Copping A., LiVecchi A., Spence H., Gorton A., Jenne S., Preus R., et al. (2018). Maritime renewable energy markets: power from the sea. Mar. Technol. Soc. J. 52, 99–109. doi: 10.4031/MTSJ.52.5.3
DOE (2022) Powering the blue economy™: Ocean observing prize | american-made challenges. Available at: https://americanmadechallenges.org/challenges/oceanobserving/index.html (Accessed on 08/25/2022).
DOS (2022) Arctic Region - united states department of state. Available at: https://www.state.gov/key-topics-office-of-ocean-and-polar-affairs/arctic/. (Accessed on 08/24/2022).
Erofeeva S., Egbert G. (2020). Arc5km2018: Arctic ocean inverse tide model on a 5 kilometer grid (NSF Arctic Data Center). 2018. doi: 10.18739/A21R6N14K
Erofeeva S., Padman L., Howard L. (2020). Tide model driver (TMD) version 2.5, toolbox for Matlab (GitHub: Earth and Space Research). Available at: https://www.github.com/EarthAndSpaceResearch/TMD_matlab_toolbox_v2.5.
García-Medina G., Yang Z., Wu W.-C., Wang T. (2021). Wave resource characterization at regional and nearshore scales for the us alaska coast based on a 32-year high-resolution hindcast. Renewable Energy 170, 595–612. doi: 10.1016/j.renene.2021.02.005
Green R., Copping A., Cavagnaro R. J., Rose D., Overhus D., Jenne D. (2019). Enabling power at sea: Opportunities for expanded ocean observations through marine renewable energy integration (IEEE) (IEEE for the OCEANS).
Haas K. A., Fritz H. M., French S. P., Smith B. T., Neary V. (2011). Assessment of energy production potential from tidal streams in the united states (Atlanta, GA (United States: Tech. rep., Georgia Tech Research Corporation).
Hauri C., Danielson S., McDonnell A. M., Hopcroft R. R., Winsor P., Shipton P., et al. (2018). From sea ice to seals: a moored marine ecosystem observatory in the arctic. Ocean Sci. 14, 1423–1433. doi: 10.5194/os-14-1423-2018
IABP (2022) International arctic buoy programme. Available at: https://iabp.apl.uw.edu/data.html (Accessed on 08/24/2022).
Kohout A., Williams M., Dean S., Meylan M. (2014). Storm-induced sea-ice breakup and the implications for ice extent. Nature 509, 604–607. doi: 10.1038/nature13262
Krishfield R., Toole J., Proshutinsky A., Timmermans M.-L. (2008). Automated ice-tethered profilers for seawater observations under pack ice in all seasons. J. Atmospheric Oceanic Technol. 25, 2091–2105. doi: 10.1175/2008JTECHO587.1
Lee C. M., Thomson J., Zone M. I., Teams, A. S. S (2017). An autonomous approach to observing the seasonal ice zone in the western arctic. Oceanography 30, 56–68. doi: 10.5670/oceanog.2017.222
Lewis M., Murray R. O., Fredriksson S., Maskell J., de Fockert A., Neill S. P., et al. (2021). A standardised tidal-stream power curve, optimised for the global resource. Renewable Energy 170, 1308–1323. doi: 10.1016/j.renene.2021.02.032
Li N., Park H., Sun H., Bernitsas M. M. (2022). Hydrokinetic energy conversion using flow induced oscillations of single-cylinder with large passive turbulence control. Appl. Energy 308, 118380. doi: 10.1016/j.apenergy.2021.118380
Moon T. A., Druckenmiller M. L., Thoman R. L. (2021). Arctic Report card (NOAA Technical Report). doi: 10.25923/5s0f-5163
Moore A. M., Martin M. J., Akella S., Arango H. G., Balmaseda M., Bertino L., et al. (2019). Synthesis of ocean observations using data assimilation for operational, real-time and reanalysis systems: A more complete picture of the state of the ocean. Front. Mar. Sci. 6, 90. doi: 10.3389/fmars.2019.00090
NOAA (2022) Wavewatch III® production hindcast, multigrid: Feb 2005 to mar 2019. Available at: https://polar.ncep.noaa.gov/waves/hindcasts/prod-multi_1.php (Accessed on 08/24/2022).
Polagye B., Thomson J. (2013). Tidal energy resource characterization: methodology and field study in admiralty inlet, puget sound, wa (usa). Proc. Inst Mechanical Engineers Part A: J. Power Energy 227, 352–367. doi: 10.1177/0957650912470081
Rainville L., Wilkinson J., Durley M. E. J., Harper S., DiLeo J., Doble M. J., et al. (2020). Improving situational awareness in the arctic ocean. Front. Mar. Sci. 71024. doi: 10.3389/fmars.2020.581139
Rigor I. G., Clemente-Colón P., Hudson E. (2008). “The international arctic buoy programme (iabp): A cornerstone of the arctic observing network,” in OCEANS 2008 (IEEE), 1–3.
Rigor I. G., Wallace J. M., Colony R. L. (2002). Response of sea ice to the arctic oscillation. J. Climate 15, 2648–2663. doi: 10.1175/1520-0442(2002)015<2648:ROSITT>2.0.CO;2
Stafford K. M., Castellote M., Guerra M., Berchok C. L. (2018). Seasonal acoustic environments of beluga and bowhead whale core-use regions in the Pacific Arctic. Deep Sea Res. Part II: Topical Stud. Oceanogr 152, 108–120. doi: 1016/j.dsr2.2017.08.003
Sun W., Zhao D., Tan T., Yan Z., Guo P., Luo X. (2019). Low velocity water flow energy harvesting using vortex induced vibration and galloping. Appl. Energy 251, 113392. doi: 10.1016/j.apenergy.2019.113392
Thomson J., Ackley S., Girard-Ardhuin F., Ardhuin F., Babanin A., Boutin G., et al. (2018). Overview of the arctic sea state and boundary layer physics program. J. Geophys Research: Oceans 123, 8674–8687. doi: 10.1002/2018JC013766
Vortex (2022) Vortex hydro energy. Available at: https://www.vortexhydroenergy.com/ (Accessed on 08/24/2022).
Wang T., Yang Z. (2020). A tidal hydrodynamic model for cook inlet, alaska, to support tidal energy resource characterization. J. Mar. Sci. Eng. 8, 254. doi: 10.3390/jmse8040254
WaterLily (2022) Waterlily turbine | energy anywhere. Available at: https://www.waterlilyturbine.com/ (Accessed on 08/24/2022).
Wickett M. J., Hindley S., Wickett M. B. (2019). Witt: Harvesting energy from subsea, vortex-induced vibration. Mar. Technol. Soc. J. 53, 17–25. doi: 10.4031/MTSJ.53.4.1
Williams N. G., Lu D., McVey J. R., Cavagnaro R. J. (2021). A comparative analysis of lithium-ion battery chemistries for cold-climate maritime applications (Richland, WA (United States: Tech. rep., Pacific Northwest National Lab.(PNNL).
WITT (2022) Power from motion | witt energy | united kingdom. Available at: https://www.witt-energy.com/. (Accessed on 08/24/2022).
Witte C. R., Zappa C. J., Mahoney A. R., Goodwin J., Harris C., Schaeffer R. J., et al. (2021). The winter heat budget of sea ice in Kotzebue Sound: Residual ocean heat and the seasonal roles of river outflow (Journal of Geophysical Research).
Wright D. L., Berchok C. L., Crance J. L., Clapham P. J. (2019). Acoustic detection of the critically endangered north pacific right whale in the northern bering sea. Mar. Mammal Sci. 35, 311–326. doi: 10.1111/mms.12521
Wright D. L., Castellote M., Berchok C. L., Ponirakis D., Crance J. L., Clapham P. J. (2018). Acoustic detection of north pacific right whales in a high-traffic aleutian pass 2009-2015. Endangered Species Res. 37, 77–90. doi: 10.3354/esr00915
Yosry A. G., Fernández-Jiménez A., Álvarez-Álvarez E., Marigorta E. B. (2021). Design and characterization of a vertical-axis micro tidal turbine for low velocity scenarios. Energy Conversion Manage. 237, 114144. doi: 10.1016/j.enconman.2021.114144
Keywords: ocean observations, blue economy, autonomous platforms, wave energy converter, tidal turbine, vortex induced vibration
Citation: Branch R, Ticona Rollano F, Cotter E, McVey JR, Cavagnaro RJ and Rigor I (2022) Marine renewable energy for Arctic observations. Front. Mar. Sci. 9:970337. doi: 10.3389/fmars.2022.970337
Received: 15 June 2022; Accepted: 28 October 2022;
Published: 21 November 2022.
Edited by:
Matthew Lewis, Bangor University, United KingdomReviewed by:
Simon Neill, Bangor University, United KingdomDaniel Coles, University of Plymouth, United Kingdom
Salim Poovadiyil, Bangor University, United Kingdom
Copyright © 2022 Branch, Ticona Rollano, Cotter, McVey, Cavagnaro and Rigor. This is an open-access article distributed under the terms of the Creative Commons Attribution License (CC BY). The use, distribution or reproduction in other forums is permitted, provided the original author(s) and the copyright owner(s) are credited and that the original publication in this journal is cited, in accordance with accepted academic practice. No use, distribution or reproduction is permitted which does not comply with these terms.
*Correspondence: Ruth Branch, cnV0aC5icmFuY2hAcG5ubC5nb3Y=