Abstract
The ocean has considerable potential to function as a carbon sink, absorbing anthropogenic CO2 and buffering the effects of climate change. How the culture of shellfish can be used to increase the ocean carbon sink warrants evaluation. We analyze the production and carbon sink capacity of six important mariculture shellfish species (oyster, ark clam, mussel, scallop, clam, and razor clam) in nine coastal provinces of China from 1981–2020 using quality assessment and logarithmic mean Divisia index (LMDI) decomposition methods. Over this time period both cultured shellfish production and its contribution to the carbon sink generally increase, averaging approximately 600,000 t annually over the last four decades. Both the annual production and carbon sink capacity of China’s mariculture shellfish industry vary geographically. The total annual tonnage (scale) of cultured shellfish, and to a lesser extent, coastal shellfish species composition (structure) influence carbon sink capacity, and affect China’s plans to achieve “dual carbon goals.” Combining historical analysis and the LMDI method, we propose a scheme that optimally and more sustainably manages China’s culture of shellfish.
1 Introduction
Climate change can adversely affect species ecology, ecosystems, economic development, and human lifestyles. This change is widely attributed to increased CO2, which contributes up to 70% to the cause of global temperature rises (Jackson et al., 2017). Because greenhouse gas emissions are of global concern, governments now pay more regard to both reducing them, and to developing low-carbon economies and forms of carbon sink storage (Liu and Tang, 2013; Zhang et al., 2020; Cavan and Hill, 2022). Continued industrialization and urbanization in China has led to the unit-energy consumption of energy-intensive products being higher than that of other developed countries (Jiang and Fang, 2021). China imported 540 × 106 t of crude oil and 102 × 106 t of natural gas in 2020, which have considerable potential to contribute to further CO2 emissions (General Administration of Customs, January 2021).
In 2021 the Chinese government issued a document referred to as the “Opinions on making good carbon peaking and carbon-neutral work” (hereinafter referred to as “dual carbon goals”) that identified the capacity of ecosystems to sequester carbon (Huang et al., 2020; Huang, 2021). This requires an evaluation of the ecological carbon sink and other carbon assets to drive the carbon market toward neutrality. Many issues that require detailed study remain in the development of the national carbon emissions trading market (Lin and Ge, 2019; Yu et al., 2020a).
Compared with the “classical carbon sink” (CO2 absorption through afforestation and vegetation restoration) (Lin and Ge, 2019), the “ecological carbon sink” is more broadly defined to include ecological carbon sequestration in oceans, grasslands, wetlands, soils, permafrost, and karst habitats. As we know, terrestrial ecosystems play a significant role in carbon absorption and storage. However, the effect of forests and vegetation in terrestrial ecosystems on the carbon cycle is short-term, since the carbon will later be released into the atmosphere by decomposition (Fodrie et al., 2017; Chu et al., 2019). Additionally, the rapid expansion of human society places increasing demands on land, reducing the amount available for future large-scale afforestation for the purposes of increasing the carbon sink. Because the ocean covers 77% of the Earth’s surface and is the world’s largest carbon storage area, it has enormous ecological significance and potential as a carbon sink (Meentemeyer et al., 2015; Kondrik et al., 2018). Oceans absorb about 2 × 10⁹ t of atmospheric greenhouse gases annually, almost 30% of annual global greenhouse gas emissions (Houghton, 2007; Raven, 2018).
Filter-feeding shellfish cultured in marine environments, hereinafter referred to as “mariculture shellfish,” are promising “marine filterers” because they require no artificial feeding and are sustained by natural resources. These shellfish have a high carbon sequestration capacity (Tang et al., 2018) because their feeding activities remove considerable particulate organic carbon from seawater; they sequester this carbon as CaCO3 in their shells and soft tissues (Zhang et al., 2021). Considerable carbon is also removed from saltwater during harvest (Tang et al., 2018). Understanding just how mariculture of these shellfish sequesters carbon will improve understanding of how shallow marine ecosystems can absorb atmospheric CO2, how they regulate the global carbon cycle, and how this can be exploited to promote development of the carbon trading market based on marine fisheries. The ecological and economic benefits of mariculture shellfish and algal species in carbon sink fisheries in Liaoning Province were described by Yu et al. (2020b); the carbon-sink capacity of mariculture shellfish in coastal South China Sea waters was described by Shao et al. (2019); and logarithmic mean Divisia index (LMDI) decomposition methods confirmed the importance of scale in the carbon sink capacity of mariculture shellfish in China (Ren, 2021).
The chemical composition and scale (total annual tonnage) of net organic matter at harvest of bivalves and algae and the ratio of dry weight to total wet weight (dry weight ratio) of these shellfish and algae have traditionally been used to estimate their carbon sink capacity (Zhou et al., 2002). Existing studies have also focused on measuring the carbon sequestration capacity of cultured species, factors that influence this, and development countermeasures. However, long-term, large-scale research on the carbon-sink contribution of mariculture shellfish in coastal waters of China is lacking. Accordingly, our understanding of the ecological contribution of mariculture shellfish to carbon sequestration, and how the shellfish culture industry can be developed to further contribute to carbon sequestration, is limited. We analyze the carbon sink capacity of six major mariculture shellfish species in nine coastal provinces in China over a 40-year period, and based on this provide a theoretical basis for optimizing shellfish mariculture management to better integrate their ecological function as a carbon sink with associated economic and social benefits.
2 Materials and methods
2.1 Data sources
Production data for major mariculture shellfish species (oyster, ark clam, mussel, scallop, clam and razor clam) for nine coastal provinces of China (Liaoning, Hebei, Shandong, Jiangsu, Zhejiang, Fujian, Guangdong, Guangxi, Hainan) over 40 years from 1981–2020 were sourced from Chinese Fishery Statistical Yearbooks [Fishery Bureau of Ministry of Agriculture and Rural Affairs of China (1982–2021)].
2.2 Data processing
2.2.1 Carbon sink measurement
Because carbon in mariculture shellfish exists in both shells and soft tissues, their carbon sink is represented by the sum of individual carbon contents, determined following Tang et al. (2011):
where CB, CST, and CS denote carbon fixed by shellfish (g), carbon fixed by tissue (g), and carbon fixed by shellfish (g), respectively; P, RST, and WC denote shellfish scale (g), the proportion of dry mass of molluscan tissue (%), and carbon content of molluscan tissue (%), respectively; and RS and WCS indicate the proportion of shellfish dry mass (%), and the carbon content of shellfish (%), respectively.
Dry mass ratios of soft tissues, shells, and carbon contents for different species of shellfish are summarized in Table 1 (Zhou et al., 2002; Qi et al., 2012; Lv et al., 2014; Ye et al., 2021a).
Table 1
| Species | RST/% | RS/% | WC/% | WCS/% | References |
|---|---|---|---|---|---|
| Oyster | 1.30 | 63.80 | 44.90 | 11.50 | (Ren, 2021) |
| Mussel | 4.63 | 70.64 | 46.00 | 12.70 | (Ren, 2021) |
| Scallop | 7.32 | 56.58 | 43.90 | 11.40 | (Ren, 2021) |
| Clam | 7.67 | 44.65 | 42.80 | 11.40 | (Ren, 2021) |
| Razor clam | 6.62 | 64.78 | 44.99 | 13.24 | (Ye et al., 2021a; Zhang et al., 2021) |
| Ark clam | 3.66 | 34.33 | 45.86 | 11.29 | (Tang et al., 2018) |
Tissues and shell dry mass ratios and carbon contents of six mariculture shellfish species in China.
RST, proportion of dry mass of shellfish tissue (%); WC, shellfish tissue carbon content (%); RS, proportion of dry mass of shell (%); WCS, shell carbon content (%).
2.2.2 Influencing factor analysis method
Based on the LMDI decomposition method of Ang (2015), we deem the following to be representative factors influencing the carbon sink capacity of shellfish: carbon sink coefficient (CSC), shellfish structure factor (SSF) (i.e.), and shellfish scale factor (SQ) (i.e.),. Relationships among them are as follows (Ji and Wang, 2016; Zhang et al., 2017):
Where n represents the each mariculture shellfish species (n = 6), CS is the total carbon sink, CSi is the carbon sink of shellfish species i, SQi is the production of shellfish species i, and SQ is total shellfish production.
Using a one-year time spacing, the base period for calculating the results in year t was year t−1, and base data were brought into the LMDI index decomposition method formula. The change in the carbon sink in period t relative to the base period can be expressed as:
Basic equations for the contribution values of different decomposition factors are:
Where . The contribution rates (R) of different decomposition factors are:
R CSC =exp(θ×ΔCSCSC)
R SSF =exp(θ×ΔCSSSF)
Let
We assume that no interannual variation in the carbon sink coefficient of mariculture shellfish exists, the contribution value of carbon sink coefficient variation is 0, and the contribution rate is 1. Based on these assumptions, we evaluate the influences of species composition and tonnage on the carbon sink of mariculture shellfish.
3 Results
3.1 Interannual variation in mariculture shellfish production and carbon sink
Production of mariculture shellfish in China, and the carbon sink represented by these species has risen consistently over time (Figure 1). From 1981–2006, production increased from 9.8 × 10⁴ t to 9.8 × 10⁶ t. The first dip in production over the 40-year period occurred in 2007, after which production again trended upward to 1.35 × 10⁷ t in 2020. The carbon sink increased from 1× 10⁴ t to 1.17 × 10⁶ t from 1981–2020.
Figure 1
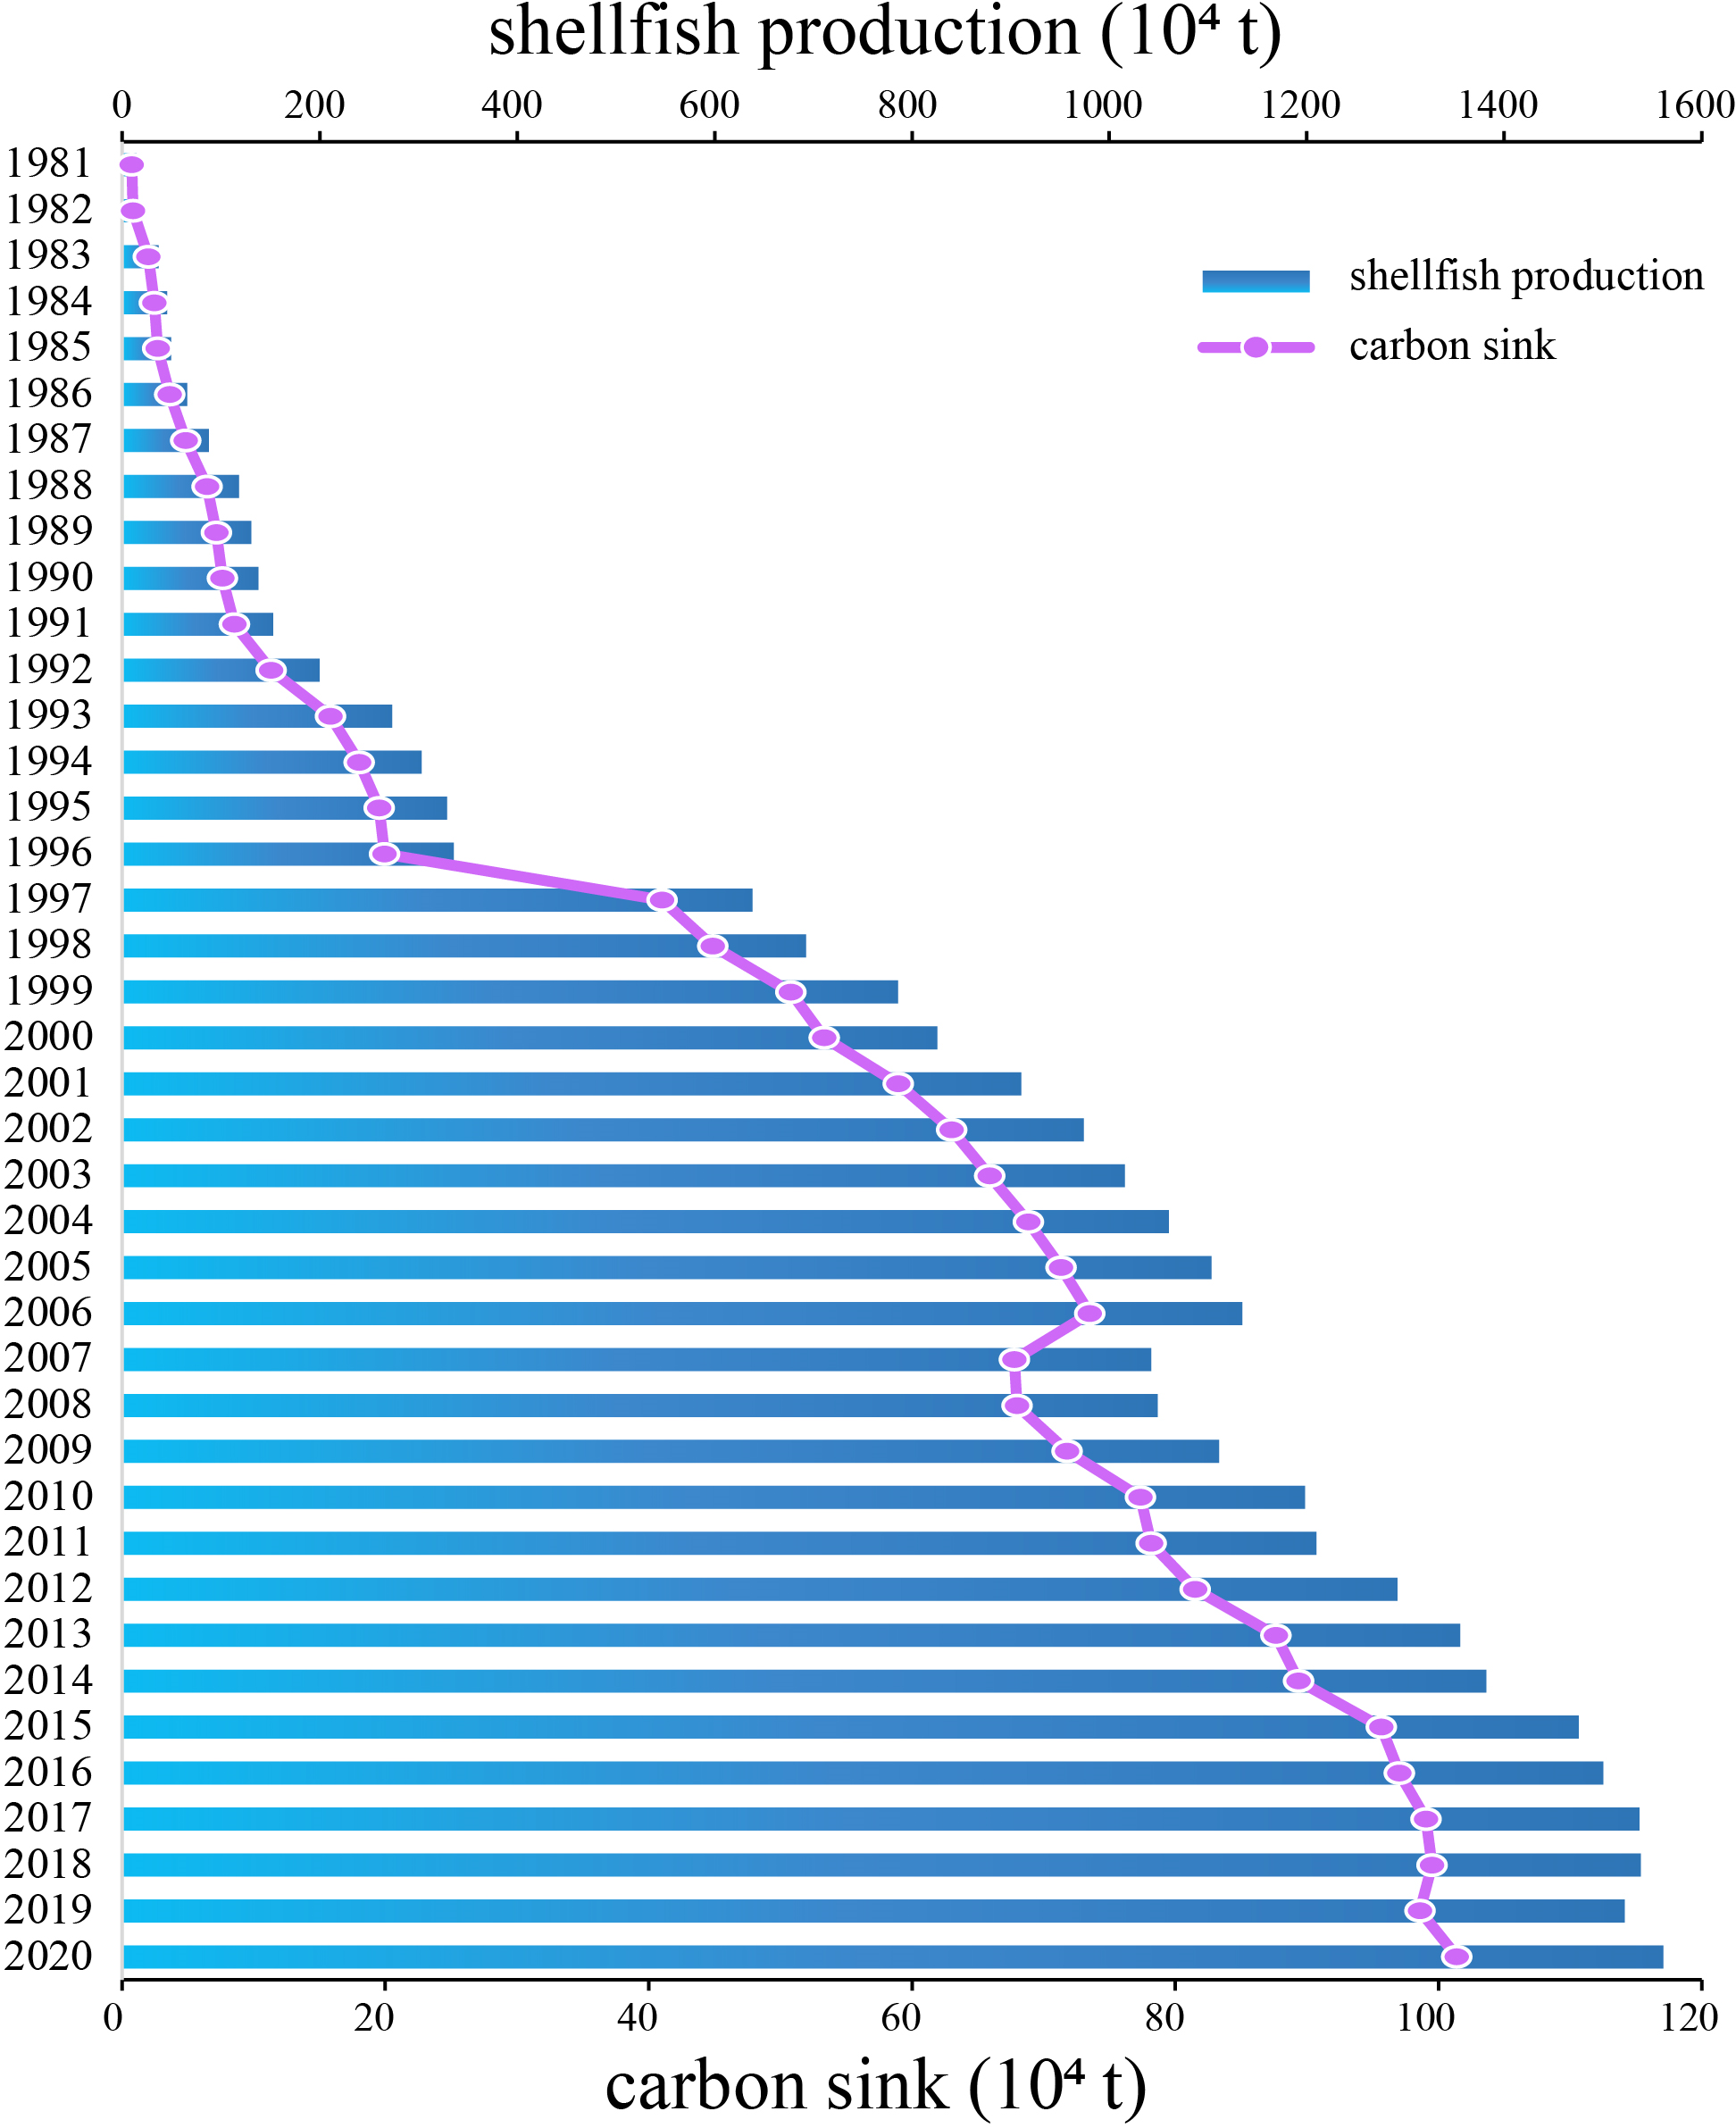
Annual mariculture shellfish production and carbon sink tonnage (× 104) in China, 1981–2020.
3.2 Spatial and temporal patterns in mariculture shellfish carbon sink tonnage
The carbon sink in nine coastal provinces trended upward from 1981–2020 (Table 2), and was higher in Shandong, Fujian, and Liaoning provinces (Figure 2). From 2001, the carbon sink in Guangdong Province exceeded that of Zhejiang Province; sink values in other provinces were relatively similar.
Table 2
| Zone | Year | Oyster(t) | Ark-clam(t) | Mussel(t) | Scallop(t) | Clam(t) | Razor-clam(t) |
|---|---|---|---|---|---|---|---|
| Liaoning | 1981-2000 | 66745 | 865 | 384418 | 120336 | 124494 | 2742 |
| 2001-2020 | 314603 | 51844 | 150400 | 646512 | 1517072 | 65109 | |
| Overall | 381347 | 52710 | 534818 | 766847 | 1641566 | 67851 | |
| Shandong | 1981-2000 | 160091 | 6012 | 250467 | 524416 | 270490 | 40506 |
| 2001-2020 | 1095275 | 12100 | 783879 | 1452812 | 2014822 | 330736 | |
| Overall | 1255366 | 18112 | 1034346 | 1977228 | 2285312 | 371242 | |
| Heibei | 1981-2000 | 238 | 3089 | 2248 | 14877 | 19271 | 46 |
| 2001-2020 | 5565 | 12905 | 5408 | 465143 | 82440 | 613 | |
| Overall | 5803 | 15994 | 7656 | 480020 | 101712 | 659 | |
| Jiangsu | 1981-2000 | 1656 | 2046 | 0 | 0 | 58740 | 7593 |
| 2001-2020 | 67752 | 22852 | 66549 | 73 | 541880 | 149345 | |
| Overall | 69407 | 24898 | 66549 | 73 | 600620 | 156939 | |
| Zhejiang | 1981-2000 | 31893 | 36467 | 16962 | 605 | 14291 | 238587 |
| 2001-2020 | 239193 | 144362 | 212127 | 1661 | 122025 | 620986 | |
| Overall | 271086 | 180829 | 229089 | 2265 | 136316 | 859572 | |
| Fujian | 1981-2000 | 486321 | 4482 | 67455 | 6600 | 104536 | 170529 |
| 2001-2020 | 2610521 | 51333 | 182467 | 17214 | 532086 | 506753 | |
| Overall | 3096842 | 55815 | 249922 | 23814 | 636623 | 677283 | |
| Hainan | 1981-2000 | 1676 | 313 | 32 | 95 | 2460 | 0 |
| 2001-2020 | 5643 | 2179 | 163 | 1522 | 14502 | 0 | |
| Overall | 7319 | 2493 | 195 | 1617 | 16961 | 0 | |
| Guangdong | 1981-2000 | 602360 | 22301 | 122994 | 36176 | 238843 | 18848 |
| 2001-2020 | 1210682 | 33533 | 102295 | 102317 | 427009 | 19264 | |
| Overall | 1813042 | 55834 | 225290 | 138494 | 665852 | 38113 | |
| Guangxi | 1981-2000 | 119892 | 2487 | 2212 | 867 | 74902 | 18 |
| 2001-2020 | 654659 | 4378 | 19137 | 8974 | 324485 | 4489 | |
| Overall | 774551 | 6865 | 21349 | 9841 | 399387 | 4508 |
Mariculture shellfish carbon sink capacities in nine coastal provinces, China, 1981–2000 and 2001–2020.
Figure 2
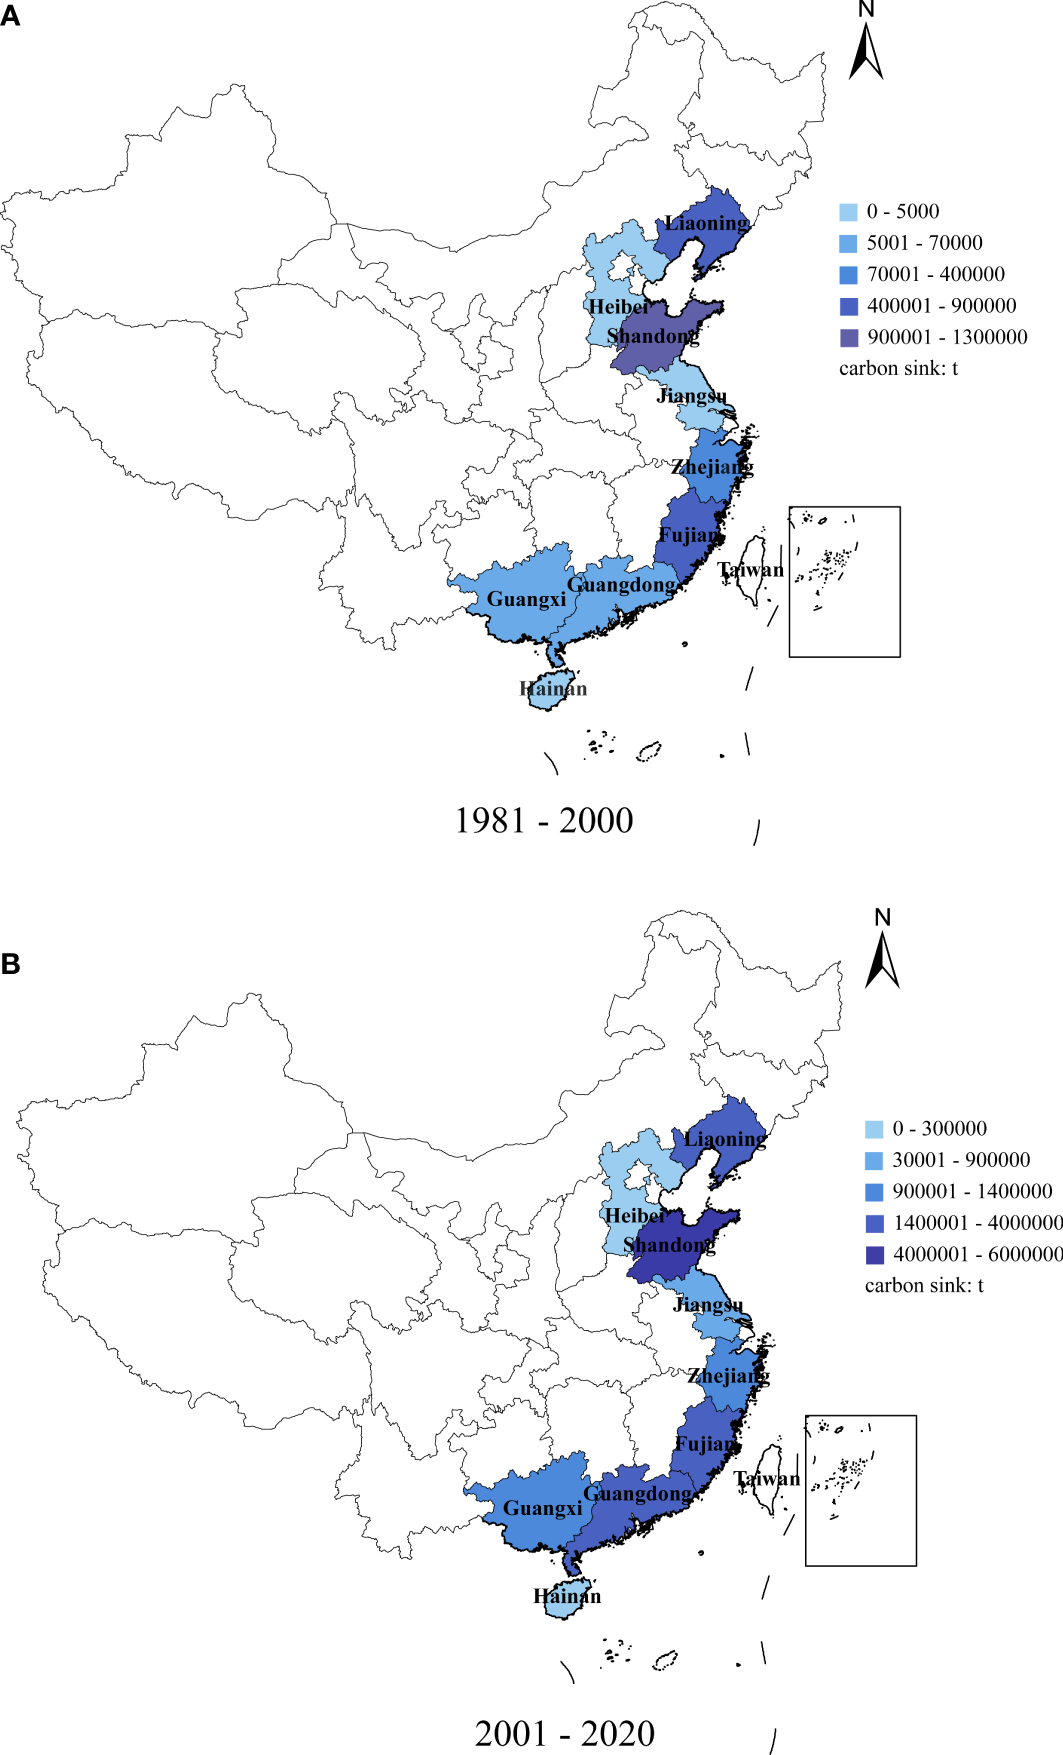
Total carbon sequestration tonnage of mariculture shellfish in nine coastal provinces, China: (A) 1981–2000, (B) 2001–2020.
From 1981–2000, sink values in Shandong (1.25 × 10⁶ t), Fujian (8.4 × 10⁵ t), and Liaoning (7 × 10⁵ t) provinces were high. These were followed by Zhejiang (3.4 × 10⁵ t), Guangdong (2.5 × 10⁵ t), Guangxi (2 × 10⁵ t), Jiangsu (7 × 10⁴ t), Hebei (4 × 10⁴ t), and Hainan (0.5 × 10⁴ t) provinces. From 2001 to 2020, Shandong, Fujian, and Liaoning provinces had high carbon sinks (5.96 × 10⁶ t (up 4.71 × 10⁶ t), 4.07 × 10⁶ t (up 2.32 × 10⁶ t), and 2.9 × 10⁶ t (up 2.2 × 10⁶ t), respectively), followed by Guangdong (2.52 × 10⁶ t (up 2.27 × 10⁶ t)), Zhejiang (1.4 × 10⁶ t (up 1.06 × 10⁶ t)), and Guangxi (1.24 × 10⁶ t (up 1.04 × 10⁶ t)) provinces. Jiangsu (8.9 × 10⁵ t, up 8.2 × 10⁵ t), Hebei (6 × 10⁵ t, up 5.6 × 10⁵ t), and Hainan (2.5 × 10⁴ t, up 2 × 10⁴ t) provinces had low carbon sinks, with the total carbon sink in Hebei and Jiangsu provinces rising significantly (14% and 12%, respectively). Zhejiang Province has the lowest growth rate of 3.12%.
The distributions of oyster, ark clam, mussel, scallop, clam, and razor clam have varied considerably over time, particularly from 2001, and for each were generally higher than the preceding 20 years (Table 2). In northern China (Liaoning, Shandong, Hebei), scallops and clams were significantly higher than those in the other four species. However, oysters and clams were generally higher than those of the other four species in southern China (Zhejiang, Fujian, Hainan, Guangdong, Guangxi).
3.3 Factors affecting mariculture shellfish carbon sink tonnage
Contributions of individual shellfish species to carbon sink tonnage in China from 1985–2020 are presented in Table 3. Ranked by scale factor, the value for 1997 (2.0568) was the highest among years, differing by 0.6559 from the second highest value (1.4009) in 1993, third in 1988 (1.3442), fourth in 1987 (1.3344), and fifth in 1986 (1.3298); for remaining years the contributions were more consistent, from ~1.1 (2007) to < 1.0 (2019). The top two species (and mean values) ranked by structure factor from 1985–1993 were scallops (1.5153) and clams (1.1445); from 1994–2002, oysters (1.3078) and Arcidae (1.0411); from 2003–2011, clams (1.1162) and scallops (1.0055); from 2012–2020, oysters (1.0122) and scallops (1.0052); and from 2012–2020, again, oysters (1.0122) and scallops (1.0052).
Table 3
| structure factor(SSF) | scale factor(SQ) | ||||||
|---|---|---|---|---|---|---|---|
| year | oyster | ark clam | mussel | scallop | clam | razor clam | |
| 1985 | 1.1313 | 1.0129 | 0.8537 | 1.9726 | 1.3242 | 1.0341 | 1.1051 |
| 1986 | 0.8130 | 1.0894 | 1.2293 | 2.1429 | 0.9937 | 0.7547 | 1.3298 |
| 1987 | 0.8931 | 1.0350 | 1.1123 | 1.3807 | 0.9617 | 0.7935 | 1.3344 |
| 1988 | 0.8394 | 0.7573 | 1.0223 | 2.0795 | 0.8784 | 0.7833 | 1.3442 |
| 1989 | 0.8910 | 1.0153 | 1.0300 | 0.9575 | 1.2466 | 0.8881 | 1.1083 |
| 1990 | 1.0614 | 1.0169 | 0.9515 | 1.0687 | 1.1855 | 0.9538 | 1.0625 |
| 1991 | 0.9505 | 0.9108 | 0.8995 | 1.1481 | 1.2571 | 1.0543 | 1.1169 |
| 1992 | 1.0589 | 0.7102 | 0.8141 | 1.3496 | 1.3216 | 0.9046 | 1.3288 |
| 1993 | 0.9774 | 1.0001 | 0.6750 | 1.5381 | 1.1315 | 0.8009 | 1.4009 |
| 1994 | 1.6400 | 1.1408 | 0.7180 | 0.9988 | 1.0676 | 1.0000 | 1.1349 |
| 1995 | 1.0957 | 1.1802 | 0.9204 | 1.0218 | 0.8895 | 1.1166 | 1.0864 |
| 1996 | 0.9818 | 1.0380 | 0.8606 | 1.0686 | 0.9442 | 1.0857 | 1.0205 |
| 1997 | 3.0286 | 0.6444 | 0.5309 | 0.4872 | 1.2639 | 0.5067 | 2.0568 |
| 1998 | 1.1127 | 1.1123 | 1.2423 | 0.5747 | 1.0214 | 1.0718 | 1.0934 |
| 1999 | 0.9313 | 1.0557 | 0.9926 | 0.9992 | 1.1298 | 1.0195 | 1.1327 |
| 2000 | 1.0488 | 1.0068 | 0.8369 | 1.2292 | 0.8563 | 1.0983 | 1.0503 |
| 2001 | 0.9594 | 1.0549 | 0.9619 | 0.9448 | 1.1275 | 0.9777 | 1.1053 |
| 2002 | 0.9724 | 0.9576 | 1.0937 | 0.9122 | 1.0694 | 0.9960 | 1.0681 |
| 2003 | 1.0035 | 1.3273 | 1.0208 | 0.9520 | 1.0975 | 1.0495 | 1.0461 |
| 2004 | 0.9435 | 0.9383 | 0.9688 | 0.9355 | 1.0144 | 0.9282 | 1.0446 |
| 2005 | 0.9845 | 0.9069 | 1.0388 | 1.0981 | 0.9852 | 1.0185 | 1.0362 |
| 2006 | 0.9869 | 1.0093 | 0.9375 | 1.0761 | 1.0251 | 0.9229 | 1.0306 |
| 2007 | 0.9778 | 0.9594 | 0.6522 | 1.1001 | 1.0624 | 1.0814 | 0.9221 |
| 2008 | 0.9461 | 1.0412 | 1.0779 | 0.9688 | 2.3740 | 1.1089 | 1.0027 |
| 2009 | 0.9878 | 0.8935 | 1.2873 | 1.0698 | 0.4494 | 0.8603 | 1.0562 |
| 2010 | 0.9663 | 1.0384 | 1.0209 | 1.0216 | 1.0270 | 0.9708 | 1.0779 |
| 2011 | 1.0208 | 0.9351 | 0.9973 | 0.9186 | 1.0107 | 1.0320 | 1.0102 |
| 2012 | 1.0077 | 0.9139 | 1.0343 | 1.0403 | 0.9918 | 0.9312 | 1.0428 |
| 2013 | 0.9939 | 1.1200 | 0.9133 | 1.1742 | 0.9614 | 0.9338 | 1.0753 |
| 2014 | 1.0118 | 1.0289 | 1.0576 | 0.8946 | 1.0096 | 1.0707 | 1.0196 |
| 2015 | 0.9817 | 0.9631 | 0.9800 | 1.0112 | 0.9442 | 0.9423 | 1.0704 |
| 2016 | 1.0421 | 0.9936 | 1.0251 | 1.0273 | 1.0260 | 1.0222 | 1.0144 |
| 2017 | 0.9886 | 0.9406 | 1.0340 | 1.0569 | 0.9806 | 1.0266 | 1.0209 |
| 2018 | 1.0486 | 1.0511 | 0.9695 | 0.9511 | 0.9724 | 0.9844 | 1.0045 |
| 2019 | 1.0258 | 1.0507 | 0.9725 | 0.9618 | 0.9810 | 1.0283 | 0.9911 |
| 2020 | 1.0095 | 0.9660 | 0.9906 | 0.9289 | 1.0338 | 0.9624 | 1.0283 |
Contribution rates of factors influencing the carbon sink tonnage of individual mariculture shellfish species in China, 1985–2020.
Scale generally dominated the influence of the mariculture carbon sink in China, with species composition (structure) playing a lesser role. From 1985–2020, the overall contribution of scale factor to China’s mariculture carbon sink has exceeded that of structure and been greater than 1.0, with highest values of ~1.4. Overall levels were relatively stable, but fluctuated in 2007 and 2019. The structure factor also fluctuated, with significant differences between the lowest and highest values, but the contribution to the carbon sink has remained positive, mostly ~1.0. Oysters, clams, and scallops had a greater structure factor, while differences between remaining shellfish products were lower.
4 Discussion
4.1 Coastal shellfish culture
China is the largest global producer of mariculture shellfish (Yu et al., 2020a) in an industry gaining importance for providing high-protein food, increasing coastal resident employment, and promoting regional economic development (Engle et al., 2022). We report China’s mariculture shellfish production to trend upward from 9.8 × 10⁴ t in 1981 to 1.35 × 10⁷ t in 2020. Until 2018, China’s contribution to global shellfish production was 75.9%, and consumption 75.7%, with oysters, clams, and scallops being the most important species affecting China’s carbon sink capacity between 1981 and 2020 (Food and Agriculture Organization (FAO), 2020). Oysters (Ostrea gigas), clam (Ruditapes philippinarum), and scallops accounted for 29.5%, 23.6%, and 11% of projected global mollusk production, respectively (Food and Agriculture Organization (FAO), 2020). The huge potential of shellfish farming in coastal waters of China will directly influence the biological carbon capability, future studies should focus on selecting dominant shellfish species, developing integrated multi-trophic level aquaculture models, and expanding aquaculture areas (Ye et al., 2021b).
China has 3 × 10⁶ km2 of sea area under its jurisdiction, which in cludes more than 4.7 × 10⁶ km2 of marginal sea area, and nearly 217.04 × 10⁶ hectares of coastal mudflats potentially available for shellfish farming (Zhang et al., 2017). However, mariculture in China mainly occurs in bays and near-shore areas. However, most areas suitable for near-shore mariculture have been exploited. High coastal aquaculture density, limited space, and reduced shellfish product quality and unit production, all constrain further development of coastal mariculture (Teng et al., 2021). Planning for coastal and coastal marine areas is a relatively new responsibility of China’s government policymakers.
Management approaches to develop sustainable coastal shellfish farming combined with other coastal activities in Dutch coastal North Sea waters were examined by Jansen et al. (2016). The growing demand for proteins derived from aquatic sources suggests that bivalve shellfish mariculture will become increasingly important. It is imperative that development of environmentally and economically sustainable coastal aquaculture is based on science (Cheney et al., 2010).
4.2 Climate change and shellfish carbon sink potential
China is committed to achieving “peak carbon and carbon neutrality” to address global climate change. Global warming affects many aspects of nature and humanity, and many of these changes may be irreversible. Rising temperatures and sea levels, and frequent extreme weather events pose significant long-term threats and challenges to global food supply, ecology, energy, and human survival and development (Eastwood, 2021). For the Chinese government to achieve carbon neutrality within 40 years, it must explore low-carbon strategies and ecological carbon sink technologies. In fact, global development of ecological carbon sink technology is of the utmost importance in the 21st century.
In addition to forest and grassland ecosystems, the importance of carbon sequestration by marine organisms as an ecological carbon sink is becoming increasingly recognized (McKay et al., 2021). Remote islands and seamounts of the United Kingdom’s Tristan da Cunha archipelago Marine Protected Zone support substantial biogenic carbon stocks, the conservation of which (and other such carbon-rich natural habitats) can significantly mitigate against climate change (Barnes et al., 2021). Macrophytic algae also sequester more carbon than seagrasses, salt marshes, and mangroves, and play an essential role in marine organic carbon storage (Raven, 2018). Previous studies on the roles of shellfish mariculture in carbon sequestration have mainly used shellfish wet and dry weight ratios in calculations, and their roles as sinks or sources of CO2 is controversial. Bartolini et al. (2021) developed a bioenergetic model of the carbon sequestration potential of mariculture shellfish to calculate CO2 fluxes, taking into consideration respiration (CO2 emissions) and shell (CaCO3) calcification, and demonstrated seasonal variability in the shellfish carbon sink and carbon source conversion. This study mainly considers the role of shellfish as a carbon sink and reports the development of carbon sink fisheries, especially shellfish farming, to have far-reaching implications for improving watershed environments, mitigating against global greenhouse effects, and for the economy and social functioning (Mcleod et al., 2011). Bivalve shellfish farming benefits society beyond its traditional market value (Houghton, 2007). We report the average annual removable carbon sink of mariculture shellfish in China to exceed 1 × 10⁶ t, and for 2020, to have reached 1.17 × 10⁶ t. As of September 2021, the cumulative volume of carbon emission allowances traded on the Chinese carbon market was ~17.65 × 10⁶ t, with a cumulative transaction value of ~US$126 × 106 (Yi et al., 2018). Based on estimated expenditure of US$150–600 t−1 for CO2(C) reduction in industrialized countries according to the 1997 Kyoto Protocol (Filgueira et al., 2015), the economic value of mariculture shellfish in China for reducing atmospheric CO2 from 1981–2020 is equivalent to US$80–330 × 106 annually.
4.3 Developing shellfish aquaculture in China
Justification for expanding shellfish aquaculture in China should take the ecological benefits of this industry as a carbon sink, and the environmental role it plays in controlling algae into consideration. Development plans should incorporate regional characteristics of natural marine areas, also take shellfish biological characteristics and habitat suitability into consideration, and be guided by market demand to more effectively promote realization of energy conservation, emission reduction, and the dual carbon goals in China. Shellfish farming technology and ecological enrichment, shellfish and nearshore mudflat farming waters combined with the construction of shellfish reef symbiotic ecological pasture will usher in new research opportunities.
In recent years, conservation of coastal resources has involved the closure of many areas to farming, and pollution from aquaculture to have been otherwise regulated. However, from an economic perspective, and for carbon sequestration, the downside of these conservation efforts is that the amount of coast suitable for shellfish aquaculture has reduced. Currently, coastal beach farming licenses are issued by the Bureau of Agriculture and Rural Affairs (in charge of fisheries and aquaculture). Additionally, the use of coastal resources for aquaculture requires the approval of the Bureau of Natural Resources, in the form of a ‘sea area use permit,’ which requires an environmental impact assessment be undertaken for the aquaculture project. Approval of the environmental impact assessment is the responsibility of the Bureau of Ecology and Environment. A revised organizational and administrative model would streamline this process. Accordingly, we propose that a working body be established to coordinate the integrated management of coastal aquaculture waters, and a conceptual framework (Figure 3) to rationalize the shellfish industry’s structural layout under the dual carbon goal. Because the Ministry of Agriculture prohibits the use of raking gear for shellfish collection, development of ecologically friendly fishing technologies is also necessary for efficient harvest and habitat protection.
Figure 3
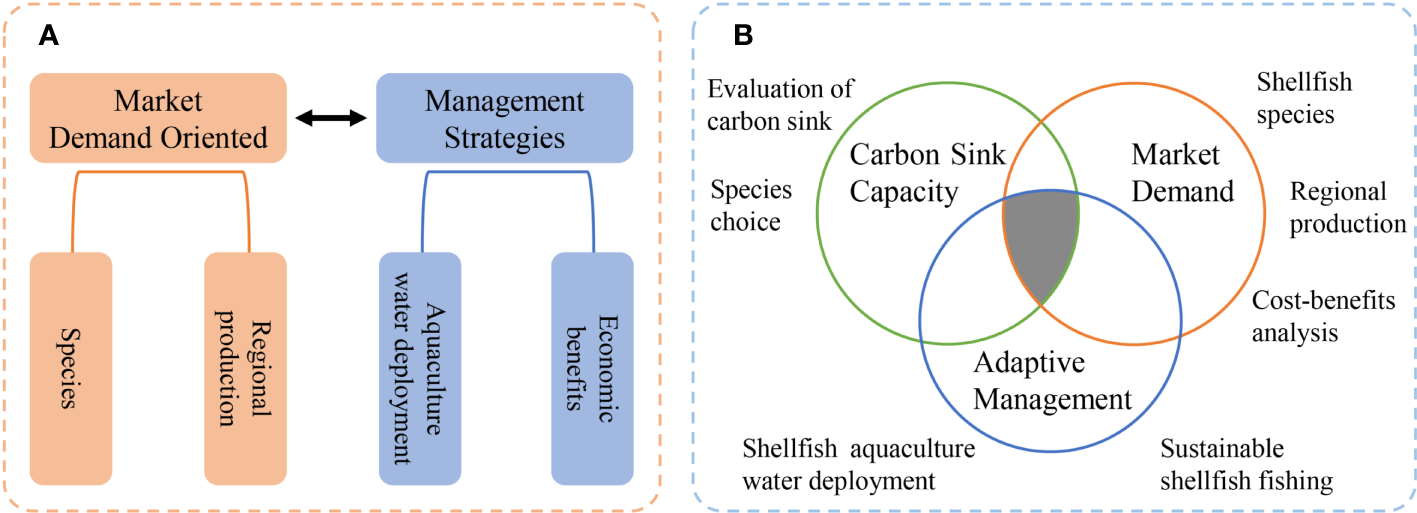
Shellfish aquaculture development models: (A) Traditional; (B) Ecology-oriented.
5 Conclusion
This study analyzed the spatial and temporal distribution characteristics and main influencing factors of the carbon sink capacity of mariculture shellfish in China. We found that the average annual removable carbon sink of mariculture shellfish in China exceeded 1 × 10⁶ t, and it climbed to 1.17 × 10⁶ t in 2020 with an upward overall trend. Among them, Oysters, clams, and scallops were the main source of removable carbon sinks in China’s mariculture. Furthermore, the shellfish in China’s mariculture is very extensive and has been widely cultivated in coastal regions of China. With the deepening of technology in China’s mariculture, the scale and production of shellfish will be updated, which will contribute substantially to China’s fishery carbon sink. However, evaluation for the carbon sink of mariculture shellfish has not yet a unified standard and needs to be further studied.
Funding
This study was supported by the fund of Sino-Indonesian technical cooperation in coastal marine ranching (12500101200021002) and the National Key Research and Development Program of China (2020YFD0901103).
Acknowledgments
We thank Dr. Liqiang Zhao for his valuable comments and Mr. Bingnan Li for assisting with figure drawing. We thank Steve O’Shea, PhD, from Liwen Bianji (Edanz) (www.liwenbianji.cn/), for his editing of the English text of a draft of this manuscript.
Publisher’s note
All claims expressed in this article are solely those of the authors and do not necessarily represent those of their affiliated organizations, or those of the publisher, the editors and the reviewers. Any product that may be evaluated in this article, or claim that may be made by its manufacturer, is not guaranteed or endorsed by the publisher.
Statements
Data availability statement
The original contributions presented in the study are included in the article/supplementary material. Further inquiries can be directed to the corresponding author.
Author contributions
YG: methodology and initial draft preparation. SL and ZC: revision and data collection; LW: conceptualization and data analysis. XW: experiment design, reviewing and editing, supervision, and funding acquisition. All authors contributed to the article and approved the submitted version.
Conflict of interest
The authors declare that the research was conducted in the absence of any commercial or financial relationships that could be construed as a potential conflict of interest.
References
1
Ang B. W. (2015). LMDI decomposition approach: A guide for implementation. Energy Policy86, 233–238. doi: 10.1016/j.enpol.2015.07.007
2
Barnes D. K. A. Bell J. B. Bridges A. E. Ireland L. Howell K. L. Martin S. M. et al . (2021). Climate mitigation through biological conservation: Extensive and valuable blue carbon natural capital in tristan da cunha’s giant marine protected zone. Biology10, 1339. doi: 10.3390/biology10121339
3
Bertolini C. Bernardini I. Brigolin D. Matozzo V. Milan M. Pastres R. et al . (2021). A bioenergetic model to address carbon sequestration potential of shellfish farming: Example from Ruditapes philippinarum in the Venice lagoon. Ices J. Mar. Sci.78, 2082–2091. doi: 10.1093/icesjms/fsab099
4
Cavan E. L. Hill S. L. (2022). Commercial fishery disturbance of the global ocean biological carbon sink. Glob. Change Biol.28, 1212–1221. doi: 10.1111/gcb.16019
5
Cheney D. Langan R. Heasman K. Friedman B. Davis J. (2010). Shellfish culture in the open ocean: Lessons learned for offshore expansion. Mar. Technol. Soc J.44, 55–67. doi: 10.4031/MTSJ.44.3.6
6
Chu X. Zhan J. Li Z. Zhang F. Qi W. (2019). Assessment on forest carbon sequestration in the three-north shelterbelt program region, China. J. Clean. Prod.215, 382–389. doi: 10.1016/j.jclepro.2018.12.296
7
Eastwood M. A. (2021). Global warming and the laws of nature. Qjm- Int. J. Med.114, 227–228. doi: 10.1093/qjmed/hcaa152
8
Engle C. R. Hanson T. Kumar G. (2022). Economic history of US catfish farming: Lessons for growth and development of aquaculture. Aquac. Econ. Manage.26, 1–35. doi: 10.1080/13657305.2021.1896606
9
Filgueira R. Byron C. J. Comeau L. A. Costa-Pierce B. Cranford P. J. Ferreira J. G. et al . (2015). An integrated ecosystem approach for assessing the potential role of cultivated bivalve shells as part of the carbon trading system. Mar. Ecol. Prog. Ser.518, 281–287. doi: 10.3354/meps11048
10
Fishery Bureau of Ministry of Agriculture and Rural Affairs of China (1982-2021). China Fishery statistical yearbook (Beijing: China Agriculture Press).
11
Fodrie F. J. Rodriguez A. B. Gittman R. K. Grabowski J. H. Lindquist N. L. Peterson C. H. et al . (2017). Oyster reefs as carbon sources and sinks. Proc. R. Soc B-Biol. Sci.284, 20170891. doi: 10.1098/rspb.2017.0891
12
Food and Agriculture Organization (FAO) (2020). The state of world fisheries and aquaculture 2020 (Rome: FAO Fisheries and Aquaculture Department).
13
Houghton R. A. (2007). Balancing the global carbon budget. Annu. Rev. Earth Planet. Sci.35, 313–347. doi: 10.1146/annurev.earth.35.031306.140057
14
Huang R. (2021). Bringing the targets of carbon peak and carbon neutrality into the overall layout of ecological civilization construction. Environ. Prot., 49, 8–10.
15
Huang L. Chen K. Zhou M. (2020). Climate change and carbon sink: a bibliometric analysis. Environ. Sci. pollut. Res.27, 8740–8758. doi: 10.1007/s11356-019-07489-6
16
Jackson R. B. Le Quere C. Andrew R. M. Canadell J. G. Peters G. P. Roy J. et al . (2017). Warning signs for stabilizing global CO2 emissions. Environ. Res. Lett.12, 110202. doi: 10.1088/1748-9326/aa9662
17
Jansen H. M. Van Den Burg S. Bolman B. Jak R. G. Kamermans P. Poelman M. et al . (2016). The feasibility of offshore aquaculture and its potential for multi-use in the north Sea. Aquac. Int.24, 735–756. doi: 10.1007/s10499-016-9987-y
18
Jiang W. Fang J. (2021). Effects of mussel-kelp ratios in integrated mariculture on the carbon dioxide system in sanggou bay. J. Sea Res.167, 101983. doi: 10.1016/j.seares.2020.101983
19
Ji J. Wang P. (2016). Carbon sink decomposition research of seawater cultured shellfish based on the modified laspeyres index decomposition method. Chin. Fish. Econ.34, 79–84.
20
Kondrik D. V. Pozdnyakov D. V. Johannessen O.M. (2018). Satellite evidence that e-huxleyi phytoplankton blooms weaken marine carbon sinks. Geophys. Res. Lett.45, 846–854. doi: 10.1002/2017GL076240
21
Lin B. Ge J. (2019). Carbon sinks and output of china’s forestry sector: An ecological economic development perspective. Sci. Total Environ.655, 1169–1180. doi: 10.1016/j.scitotenv.2018.11.219
22
Liu H. Tang Q. (2013). Review on worldwide study of ocean biological carbon sink. J. Fish. Sci. China18, 695–702. doi: 10.3724/SP.J.1118.2011.00695
23
Lv H. Liu J. Chen J. Shen H. Wu Y. (2014). Study on carbon and nitrogen budgets of three bivalves in Yangtze river estuary. Mar. Sci.38, 37–42. doi: 10.11759/hykx20130916001
24
McKay D. I. A. Cornell S. E. Richardson K. Rockstroem J. (2021). Resolving ecological feedbacks on the ocean carbon sink in earth system models. Earth Syst. Dyn.12, 797–818. doi: 10.5194/esd-12-797-2021
25
Mcleod E. Chmura G. L. Bouillon S. Salm R. Björk M. Duarte C. M. et al . (2011). A blueprint for blue carbon: Toward an improved understanding of the role of vegetated coastal habitats in sequestering CO 2. Front. Ecol. Environ.9, 552–560. doi: 10.1890/110004
26
Meentemeyer R. K. Dorning M. A. Vogler J. B. Schmidt D. Garbelotto M. (2015). Citizen science helps predict risk of emerging infectious disease. Front. Ecol. Environ.13, 189–194. doi: 10.1890/140299
27
Qi Z. Wang J. Huang H. Liu Y. Li C. Chen S. et al . (2012). Potential assessment of carbon sink capacity by marine bivalves and seaweeds in guangdong province. South China Fish. Sci.8, 30–35.
28
Raven J. (2018). Blue carbon: past, present and future, with emphasis on macroalgae. Biol. Lett.14, 20180336. doi: 10.1098/rsbl.2018.0336
29
Ren W. (2021). Study on the removable carbon sink estimation and decomposition of influencing factors of mariculture shellfish and algae in China-a two-dimensional perspective based on scale and structure. Environ. Sci. pollut. Res.28, 21528–21539. doi: 10.1007/s11356-020-11997-1
30
Shao G. Liu B. Li C. (2019). Evaluation of carbon dioxide capacity and the effects of decomposition and spatio temporal differentiation of seawater in china’s main sea area based on panel data from 9 coastal provinces in China. Acta Ecol. Sin.39, 2614–2625. doi: 10.5846/stxb201801080049
31
Tang J. Ye S. Chen X. Yang H. Sun X. Wang F. et al . (2018). Coastal blue carbon: Concept, study method, and the application to ecological restoration. Sci. China Earth Sci.61, 637–646. doi: 10.1007/s11430-017-9181-x
32
Tang Q. Zhang J. Fang J. (2011). Shellfish and seaweed mariculture increase atmospheric CO2 absorption by coastal ecosystems. Mar. Ecol. Prog. Ser.424, 97–104. doi: 10.3354/meps08979
33
Teng X. Zhao Q. Zhang P. Liu L. Dong Y. Hu H. et al . (2021). Implementing marine functional zoning in China. Mar. Policy132, 103484. doi: 10.1016/j.marpol.2019.02.055
34
Ye X. Liu Q. Lu H. Zeng J. Su Z. Yu X. et al . (2021b). Research on the mixed polyculture patterns of shellfish–—IMTA model analysis of shellfish, algae and sea urchin. Fish. Sci.48, 192–196. doi: 10.16446/j.fsti.20201100108
35
Ye W. Zhang M. Sun H. Gao Z. Zhang J. Li Y. et al . (2021a). Progress in carbon sequestration estimation and comprehensive warming potential assessment in marine aquaculture of shellfish and seaweed. J. Appl. Oceanogr., 1–11.
36
Yi L. Li Z. Yang L. Liu J. Liu Y. (2018). Comprehensive evaluation on the “maturity” of china’s carbon markets. J. Clean. Prod.198, 1336–1344. doi: 10.1016/j.jclepro.2018.07.117
37
Yu Z. Xie X. Zhu S. Du S. Li X. Li D. et al . (2020b). Potential assessment of carbon sink capacity by bivalves and seaweeds in mariculture in liaoning province. J. Dalian Ocean Univ.35, 382–386. doi: 10.16535/j.cnki.dlhyxb.2019-121
38
Yu J. Yin W. Liu D. (2020a). Evolution of mariculture policies in China: Experience and challenge. Mar. Policy119, 104062. doi: 10.1016/j.marpol.2020.104062
39
Zhang Y. Fang L. Jing P. (2020). Analysis of broad leaved forest carbon sinks changes and forest economics and management in China. Environ. Sci. pollut. Res.27, 12922–12931. doi: 10.1007/s11356-019-05772-0
40
Zhang J. Liu J. Zhang Y. Li G. (2021). Strategic approach for mariculture to practice “Ocean negative carbon emission”. Bull. Chin. Acad. Sci.36, 252–258. doi: 10.16418/j.issn.1000-3045.20210217101
41
Zhang Y. Zhao M. Cui Q. Fan W. Qi J. Chen Y. et al . (2017). Processes of coastal ecosystem carbon sequestration and approaches for increasing carbon sink. Sci. China Earth Sci.60, 809–820. doi: 10.1007/s11430-016-9010-9
42
Zhou Y. Yang H. Liu S. He Y. Zhang F. (2002). Chemical composition and net organic production of cultivated and fouling organisms in sishili bay and their ecological effects. J. Fish. China26, 21–27.
Summary
Keywords
mariculture shellfish, China, ocean carbon sink, logarithmic mean divisia index, mariculture management
Citation
Gu Y, Lyu S, Wang L, Chen Z and Wang X (2022) Assessing the carbon sink capacity of coastal mariculture shellfish resources in China from 1981–2020. Front. Mar. Sci. 9:981569. doi: 10.3389/fmars.2022.981569
Received
29 June 2022
Accepted
27 September 2022
Published
12 October 2022
Volume
9 - 2022
Edited by
Kit Yue Kwan, Beibu Gulf University, China
Reviewed by
Xizhi Huang, Johannes Gutenberg University Mainz, Germany; Jinpei Yan, State Oceanic Administration, China
Updates
Copyright
© 2022 Gu, Lyu, Wang, Chen and Wang.
This is an open-access article distributed under the terms of the Creative Commons Attribution License (CC BY). The use, distribution or reproduction in other forums is permitted, provided the original author(s) and the copyright owner(s) are credited and that the original publication in this journal is cited, in accordance with accepted academic practice. No use, distribution or reproduction is permitted which does not comply with these terms.
*Correspondence: Xuefeng Wang, xuefeng1999@126.com
This article was submitted to Marine Conservation and Sustainability, a section of the journal Frontiers in Marine Science
Disclaimer
All claims expressed in this article are solely those of the authors and do not necessarily represent those of their affiliated organizations, or those of the publisher, the editors and the reviewers. Any product that may be evaluated in this article or claim that may be made by its manufacturer is not guaranteed or endorsed by the publisher.