 Yongqiang Ge1,2
 Jiawang Chen1,2,3*
 Peihao Zhang1
 Chen Cao1Xiaoling Le1Jingkun Ai1,2Peng Zhou1Tao Liang1
- 1Ocean College, Zhejiang University, Zhoushan, China
- 2Hainan Institute, Zhejiang University, Sanya, China
- 3The Engineering Research Center of Oceanic Sensing Technology and Equipment, Ministry of Education, Zhoushan, China
Seafloor strata deformation monitoring is important for gas hydrate exploitation and the monitoring and early warning of seabed instabilities. Due to the limitation of in situ monitoring technology, existing observations are carried out with geophysical methods to provide basic geomorphological characteristics and stratigraphic structures. However, it is of equal importance to study the in situ evolution mechanism of the process of strata deformation, which relies heavily on long-term in situ observations. An in situ monitoring instrument for seabed strata deformation monitoring is presented. Sufficient theoretical, numerical, and experimental studies were carried out to conduct a mechanical analysis on the entire deployment process of the instrument. The maximum penetration resistance and reaming pressure were calculated during the deployment process, and the stability and feasibility of the deployment method were verified. To validate the maximum penetration resistance obtained and the monitoring performance of the instrument, field tests were conducted on a tidal flat in Changzhi Island. The penetration resistance of the instrument and the strata deformation of the tidal flat were measured and obtained. The results demonstrate the feasibility of the presented instrument.
1 Introduction
Gas hydrate is an ice-like substance comprised of water and low-molecular-weight gases, usually methane, that forms within sediment under a proper condition of high pressure and low temperature (You et al., 2019; Ruppel and Waite, 2020). The decomposition of gas hydrates may reduce the strength of sediments and cause seafloor instabilities (i.e., seabed subsidence and uplift, strata deformation, and slides) (Nixon and Grozic, 2007; Wang et al., 2017). These instabilities can pose dramatic risks to seabed infrastructure, such as offshore oil platforms, pipelines, and submarine cables, causing significant environmental and economic consequences (Xu et al., 2019). Therefore, seabed instabilities have been the focus of marine geological studies. Studies on seabed strata observations are conventionally carried out through acoustic surveys, including side scan sonar, multibeam echosounder, and various sub-bottom profiling techniques. They can acquire and collect the geomorphological characteristics and stratigraphic structure of the seabed strata (Koch et al., 2015; Paull et al., 2015). However, these acoustic instruments need to be installed on survey platforms (i.e., scientific ship and underwater vehicle) and have a long observation period, preventing long-term continuous monitoring (Xu et al., 2019). Field monitored data are essential for studying the mechanism and process of seabed strata deformation. Thus, it is necessary to develop an in situ long-term instrument for seabed deformation monitoring.
At present, with the development of submarine monitoring technologies, in situ long-term seafloor deformation measurement methods have been achieved worldwide, utilizing technologies such as high-precision ocean pressure gauges (Phillips et al., 2008; Tsushima et al., 2012) and triaxial accelerometers (Prior et al., 1989; Saito and Yokoyama, 2008). The pressure gauges can be deployed on the seabed and monitor the water pressure changes with seafloor subsidence or uplift. However, most quart pressure gauges undergo a drift at unpredictable rates that are typically equivalent to 20 cm/year (Polster et al., 2009), and it cannot measure horizontal deformation. The single tri-axial accelerometers are spatially restricted and can only measure the deformation of a single point. Moreover, the seabed deformation was calculated through the double-integral method, which has a large accumulative error over time (Wang et al., 2018). On the other hand, the technology of the microelectromechanical system (MEMS) developed rapidly. MEMS accelerometers and inclinometers have been widely used on seafloor subsidence and landslide monitoring (Wang et al., 2020; Ge et al., 2021). Although there are many methods to monitor the seafloor deformation, the random occurrence of seafloor instabilities often leads to high investments in field observation and a low data return rate. The in situ monitoring of the seabed deformation is thus still in a relatively preliminary stage and needs further development.
In this paper, an innovative monitoring system was presented to monitor the seabed strata deformation process at different depths. Theoretical, numerical, and experimental studies were carried out to conduct a mechanical analysis on the entire deployment process of the monitoring instrument, proving the feasibility of the deployment and application of the instrument. To validate the deformation monitoring performance of the instrument, the in situ deformation monitoring test of a tidal flat was conducted in Changzhi Island. Finally, the discussion and conclusion are presented.
2 Instrument design
2.1 Overview of the instrument
Figure 1 shows the overview diagram of the instrument, which consists of the auxiliary deployment part (ADP) and in situ monitoring part (IMP). The APD includes a U-handle, plug, stainless steel casing pipe, and conical drill. The conical drill is connected to the IMP and the casing pipe and can reduce resistance during the deployment process and ensure that the IMP vertically penetrates into the strata. The plug and tight wires connect the casing pipe to the conical drill to prevent them from separating. The IMP is composed of multiple MEMS sensors, sensor chambers, corrugated pipes, watertight cables, and electronic chamber. The MEMS sensors placed in the sensor chamber can withstand the water pressure of 30 MPa. The corrugated pipe is regarded as a soft joint, connects the adjacent sensor chamber, and will bend and twist when slides or deformation occurs in the strata. The watertight cable and the tensioned steel wire are in the corrugated pipe. The watertight cable is responsible for communication and data transmission, and the steel wire rope can bear the axial tension and lateral shear force (to avoid the stress of the watertight cable). The electronic chamber includes data acquisition and control circuit, and battery to realize the timing and synchronous data acquisition, control, and power supply. The specifications of the monitoring instrument are shown in Table 1.
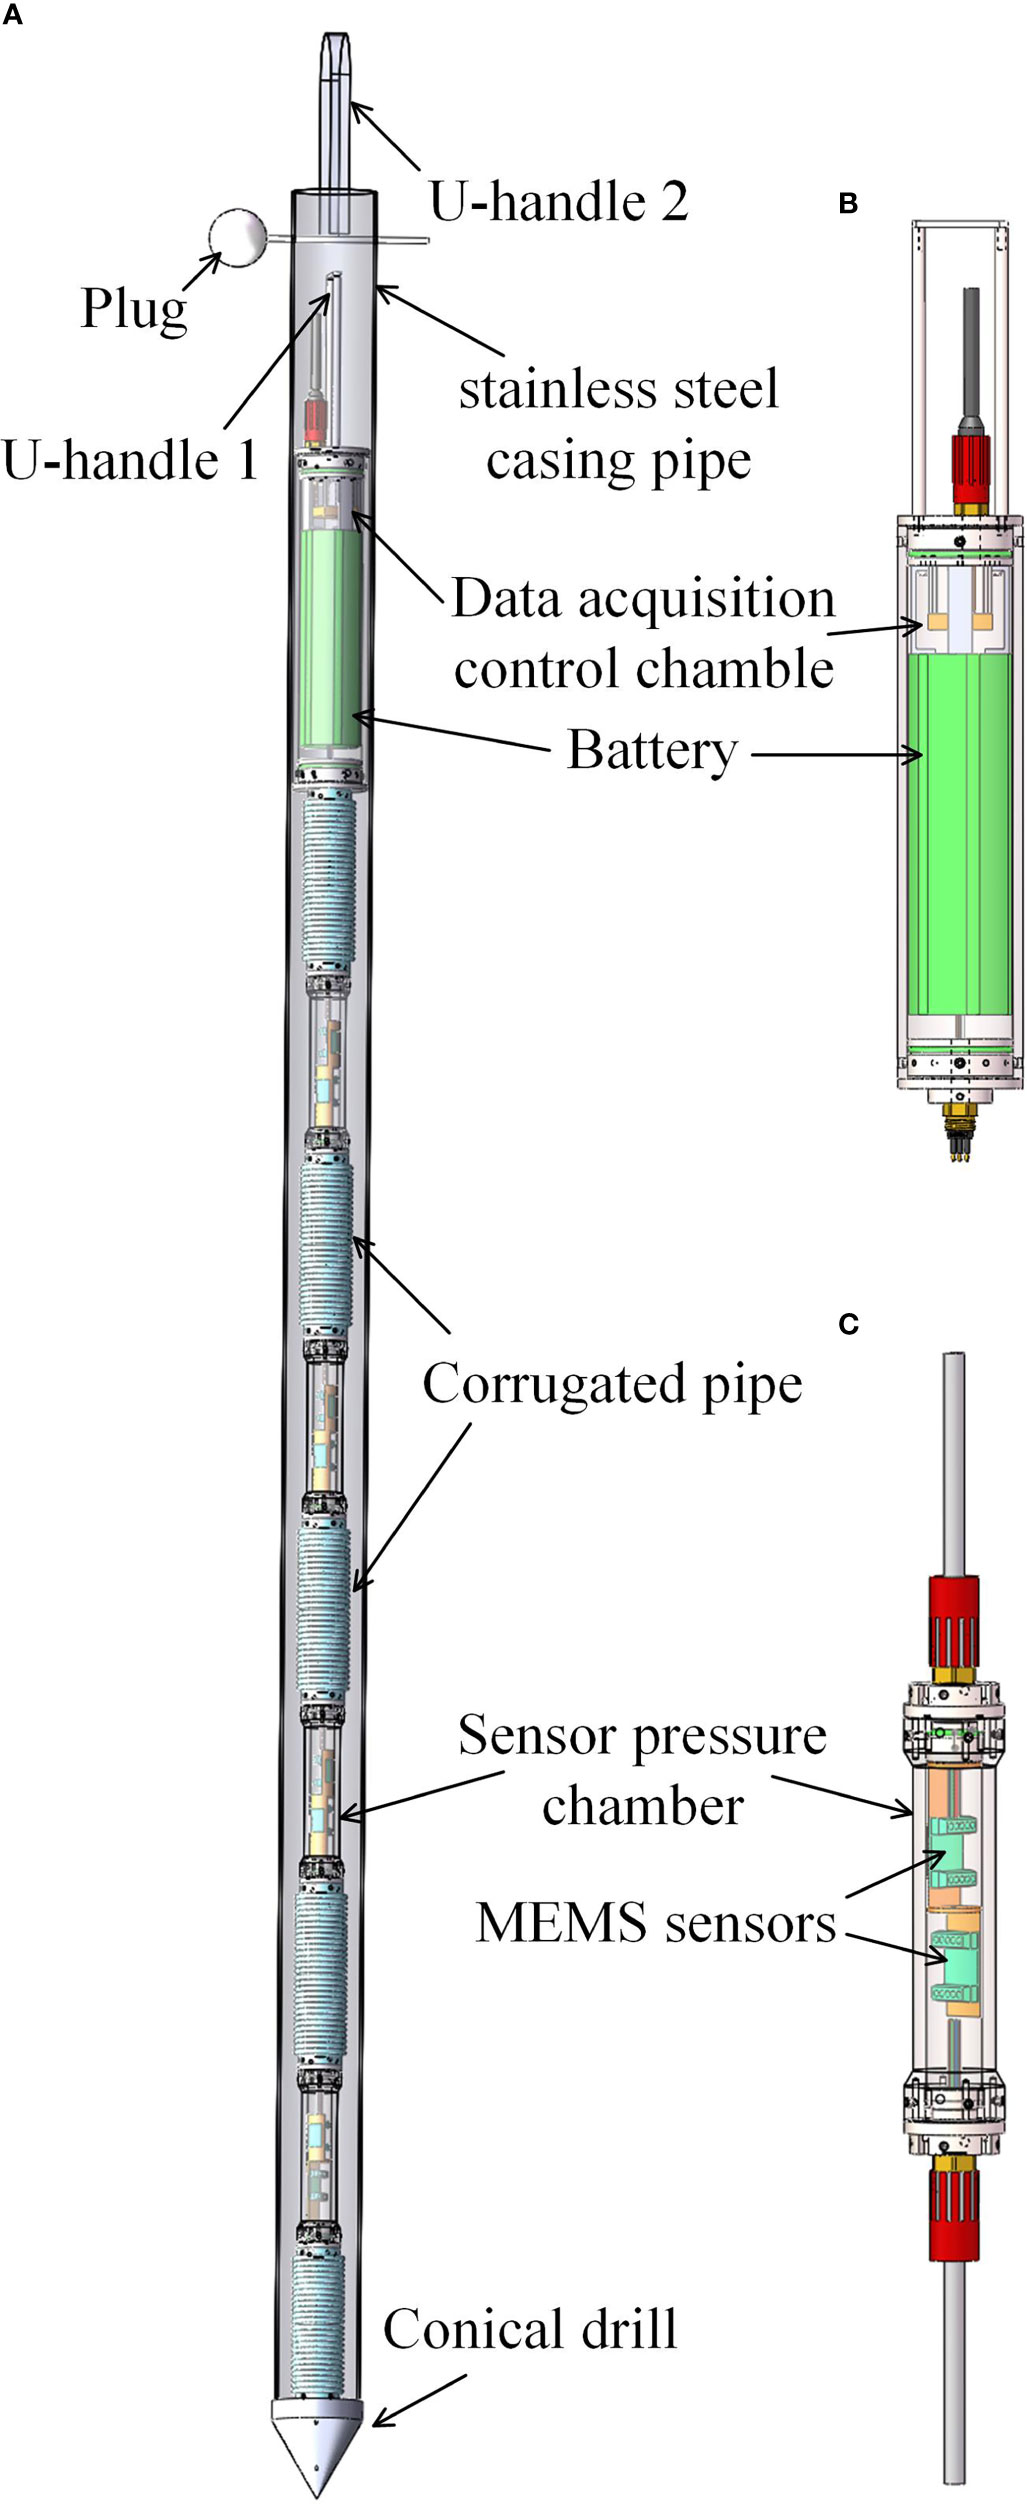
Figure 1 The diagram of the monitoring instrument: (A) the overview of the instrument; (B) the data acquisition chamber; and (C) the sensor chamber.

Table 1 The specifications of the monitoring instrument.
2.2 The in situ deployment of the instrument
The direct penetration method (without ADP) is relatively simple, but the flexible joints will deform with large deflections, resulting in the instability and failure of the monitoring instrument during the deployment process. Therefore, in order to ensure the monitoring performance of the monitoring instrument and coupling relationship with the surrounding soil layer, the ADP is used to deploy it into a specific depth of the strata. The deployment processes are shown in Figure 2. The monitoring instrument is deployed with the assistance of an operation ROV (remotely operated vehicle), and the deployment processes are as follows: (a) the ROV carries the monitoring instrument, submerges, and sits on a suitable position on the seabed; (b) the monitoring instrument is penetrated into the seabed sediment segment by segment by the ROV’s manipulator; (c) after the monitoring instrument is penetrated to a specific depth, the plug is pulled out, and the casing pipe is separated from the conical drill; and (d) finally, the ROV’s manipulator holds the U-handle and pulls out the casing pipe, leaving the IMP in the strata to conduct monitoring tasks.
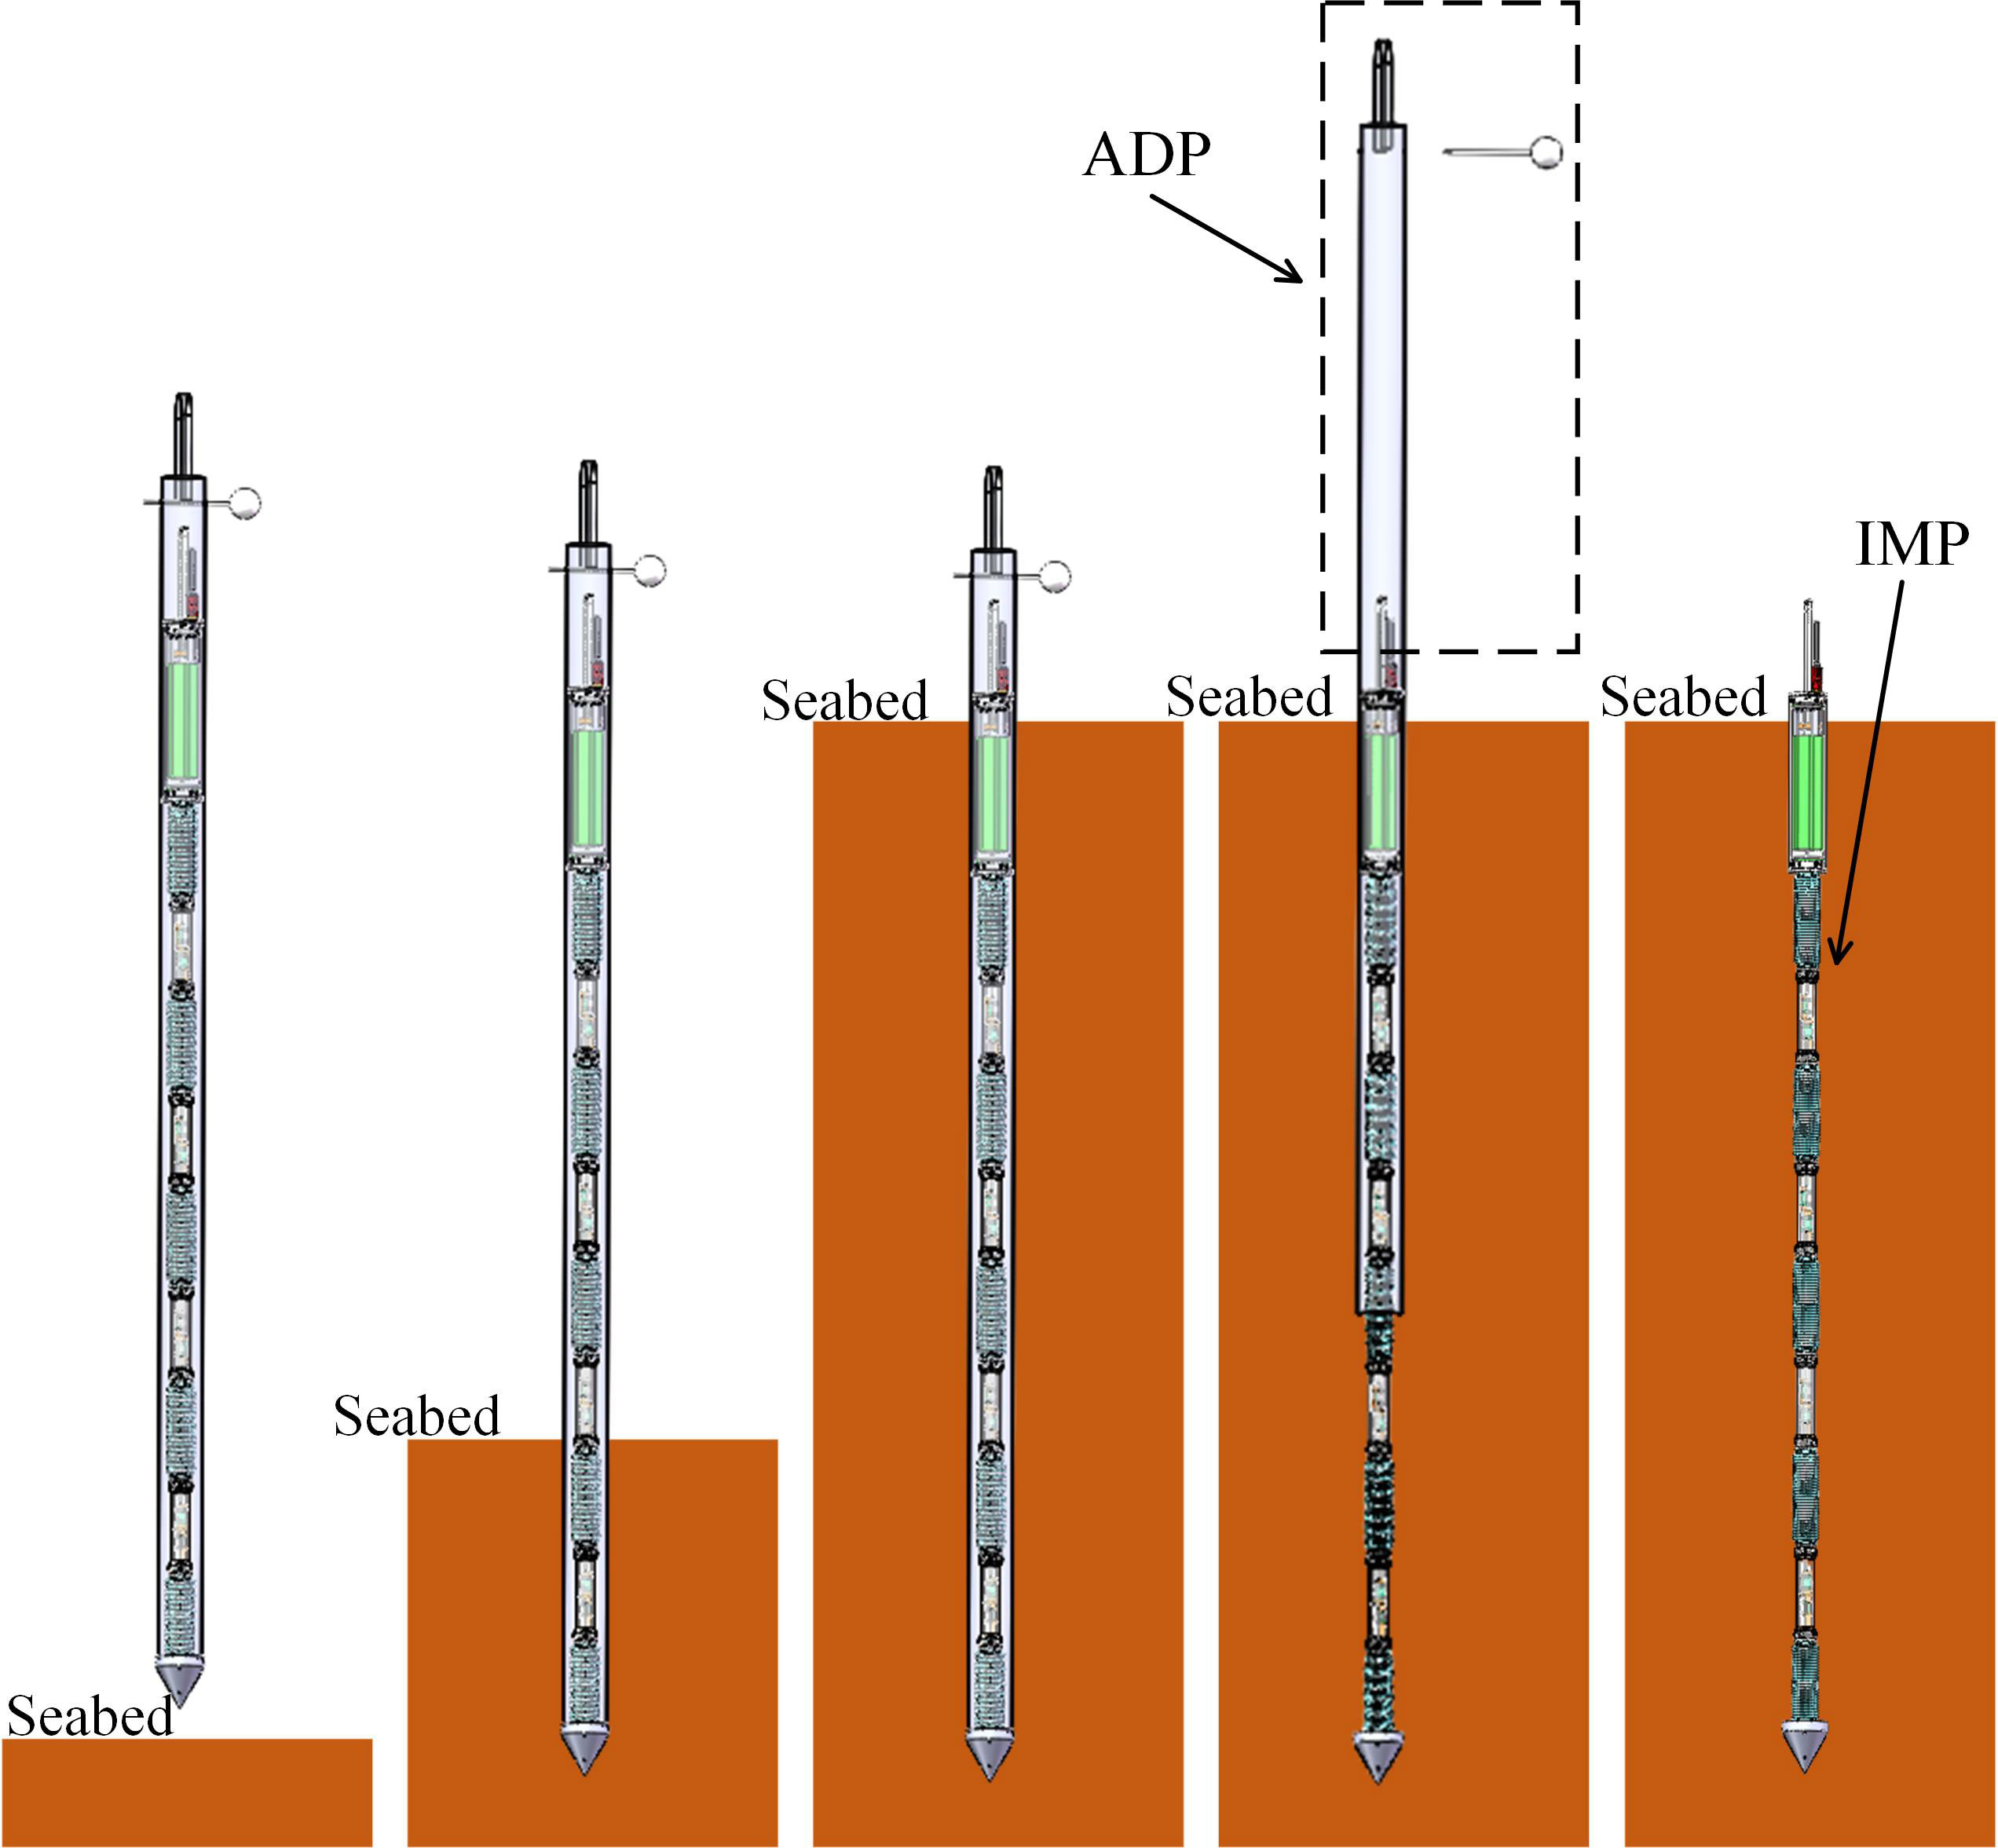
Figure 2 The deployment process of the instrument.
2.3 Design of the acquisition and control system
The IMP integrates a self-capacity lithium battery, a data acquisition and control circuit, and multiple MEMS sensors to realize the long-term in situ monitoring of the seabed strata deformation. The output voltage and capacity of the lithium battery is 12 V and 30 AH, respectively. The acquisition and control system is designed with low power consumption, and the static and work power consumption is 0.24 and 4.08 W, respectively. The external crystal periodically turns on the relay the relay to realize the intermittent operation of MEMS sensors.
In order to ensure the stability and reliability of the communication between the acquisition and control system and the sensing nodes and to satisfy the requirement of increasing the sensing node and monitoring range in the future, a communication bus based on RS485 is designed, which can realize the synchronous acquisition of 32 sensing nodes, and the communication distance can reach 1,200 m. The sensors on the RS485 communication bus have a unique physical address, and the acquisition system inquires the data of each sensor in turn and stores it in the Secure Digital Memory Card (SD) card after interpretation and filtering is completed.
3 Mechanics analysis on the deployment process
The penetration process of the instrument in seabed sediment is similar to the pile-sinking process in saturated clay, which can be regarded as similar to the cylindrical/spherical cavity expansion under undrained conditions to study the soil-squeezing effect. The mechanism analysis of the penetration process in this paper is based on the following assumptions: (1) soil is the ideal elastic–plastic material that is uniform and isotropic; (2) the stress–strain relation of soil in the plastic zone should obey the modified Lade–Duncan yield criterion; (3) the cylindrical and spherical cavity expansions are regarded as an undrained process, and soil is incompressible; and (4) regardless of the self-weight effect of the sensor array, the ultimate expansion radius of the cavity is equal to that of the sensor array.
3.1 Calculation of the side resistance during penetration process
The study of the squeeze of the monitoring instrument during the penetration process is usually idealized and simulated to a series of spherical holes expanding to an equivalent diameter formed by the cylindrical cavity continuum (Tao et al., 2018). As shown in Figure 3, the surrounding soil is damaged, and the damage shape includes the elastic zone and plastic zone. As shown in Figure 3A, the initial radius of the cavity is R0(0≤R0≤Ru) , where Ru is the ultimate radius after cavity expansion, and the corresponding reaming pressure is pu . Radial displacement after the expansion of soil is up . The radius of the elastic–plastic interface is Rp . For the region r>Rp , the soil elements obey the generalized Hooke’s law. For the region Ru<r<Rp , indicating that plastic yield has occurred and the stress–strain relation of soil should obey the modified Lade–Duncan model. The zone, which satisfies R0≤r≤Ru , indicates the complete damage of soils.
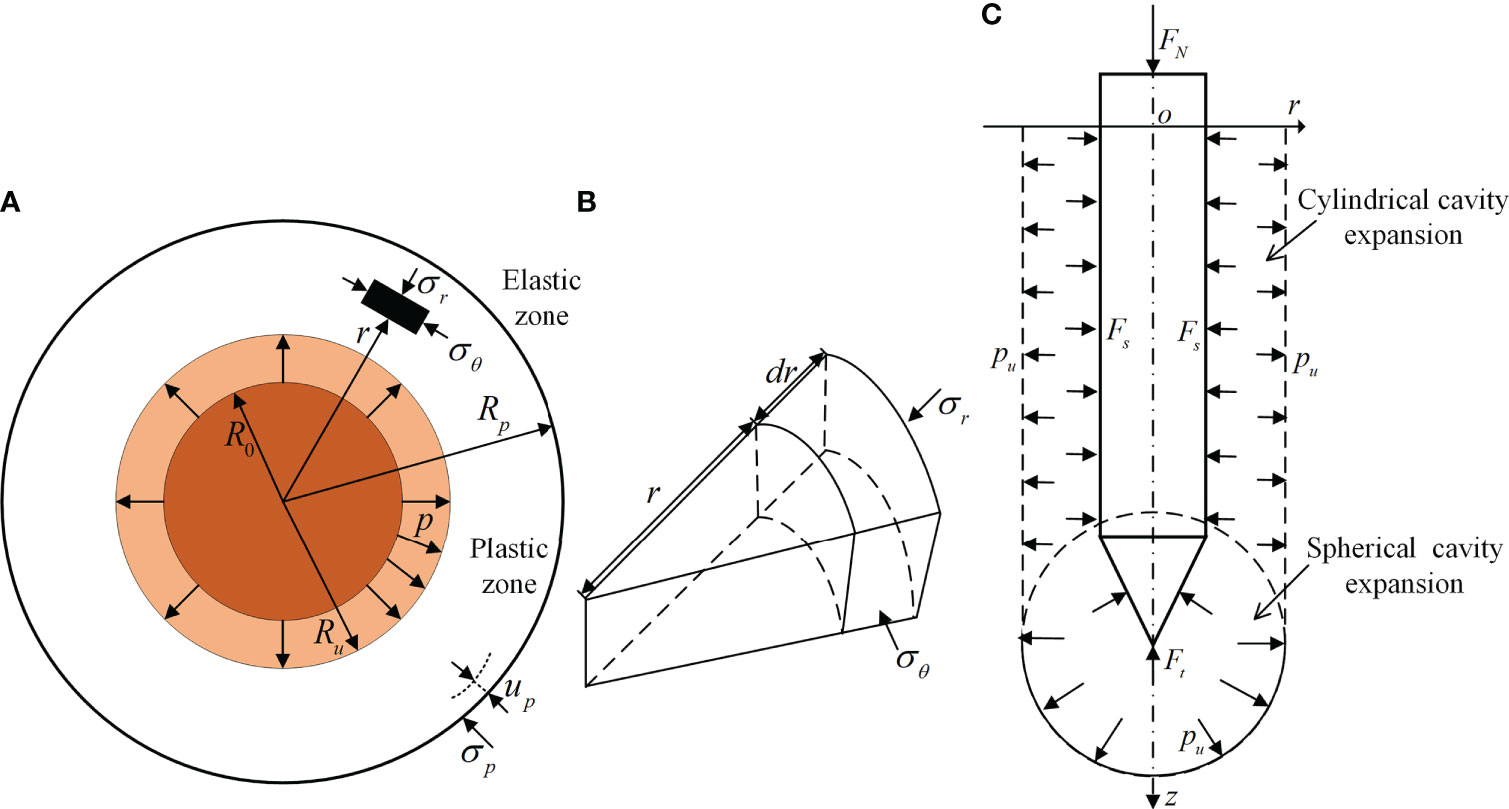
Figure 3 (A) Cylindrical cavity expansion model diagram; (B) force analysis of soil elements; and (C) spherical cavity expansion diagram.
The boundary conditions are given as follows:
Strain softening is a significant mechanical characteristic of clay; in fact, during sensor array insertion, soil undergoes large shear deformation, and the damage zone is formed around the sensor array. Soil is squeezed and reaches a plastic flow state in the damage zone. In order to obtain the displacement and stress of soil in the plastic zone, the modified Lade–Duncan Model is introduced (Lade and Duncan, 1975; Ewy, 1999), which can be expressed as
Considering the boundary condition r=Ru,σr=pu and r=Rp , σr=σp , the stress in the plastic zone can be expressed as
The reaming pressure after cavity expansion can be expressed as (Cao, 2020)
3.2 Calculation of the tip resistance during penetration process
The tip resistance and side friction resistance are independent and unrelated to each other during the monitoring instrument penetration, and the final penetration resistance is the sum of the two. The squeeze effect caused by the conical drill, and soil during the penetration process can be idealized and simulated to a spherical hole expansion in a half-space soil.
When soil reaches the state of plastic, based on the modified Lade–Duncan model and boundary condition (r=Ru,σr=pu ), the stress in plastic zone can be calculated as
3.3 Stability analysis on deployment process of casing pipe
Table 2 shows the theoretical calculation parameters and results of the side friction resistance and tip resistance. As shown in Figure 3C, during the penetration process, the casing pipe is subjected to the axial force (FN ) of the ROV’s manipulator, and the penetration resistance (FR ) due to the soil-squeezing effect. Assuming that the penetrating velocity is uniform, the axial force and the compressive stress of casing pipe can be expressed as
Considering the casing pipe as a thin-walled cylinder, the critical compressive stress based on the small deflection theory and large deflection theory can be respectively expressed as (Batdorf et al., 1947)
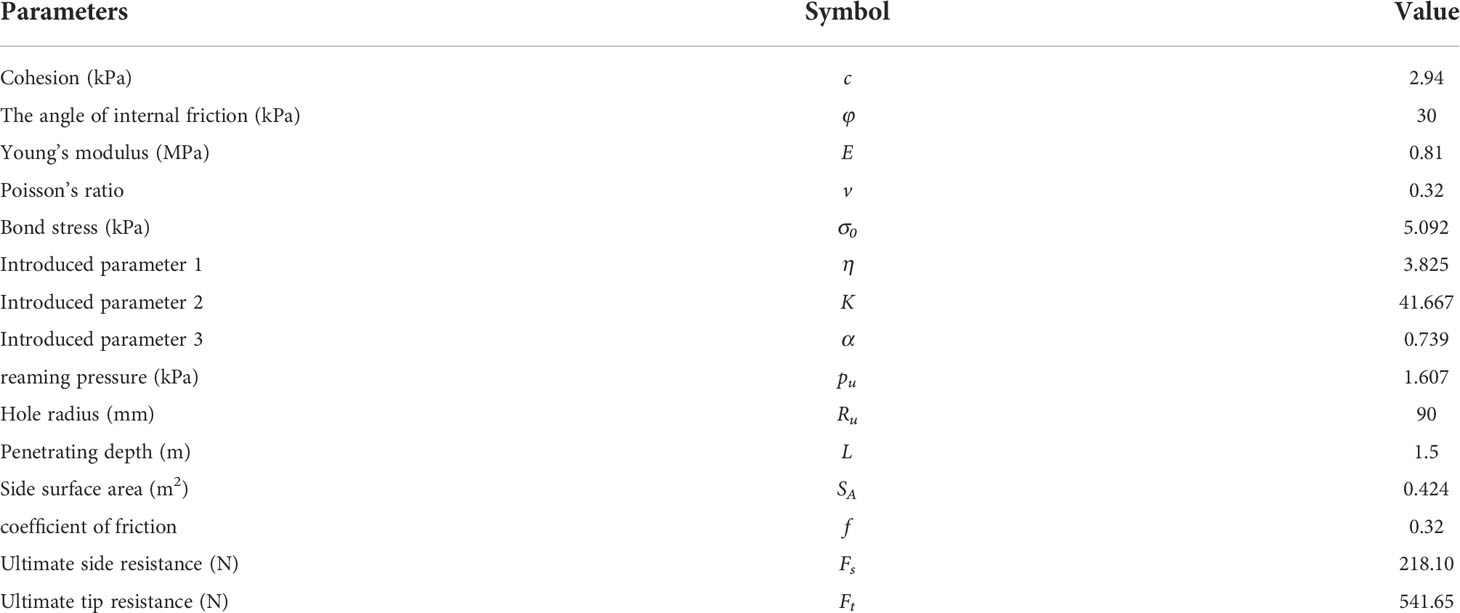
Table 2 The parameters for resistance calculation.
The parameters for stability analysis are shown in Table 3.
3.4 Numerical simulation and results
3.4.1 Finite-element model
Considering that the penetration process of the strata deformation monitoring instrument may cause a large deformation of the mesh in the model, the coupled Eulerian–Lagrangian (CEL) method is applied. Hu et al. (2014) and Zheng et al. (2015) investigated various geotechnical problems using the CEL approach and confirmed its applicability to solve problems involving large deformations. Soil is tracked as it flows through a Eulerian mesh, fixed in space, by computing the material volume friction in each element. The elements, such as the tube or ADP, are discretized with Lagrangian elements, which can move through the Eulerian mesh without resistance until they encounter Eulerian elements containing soil.
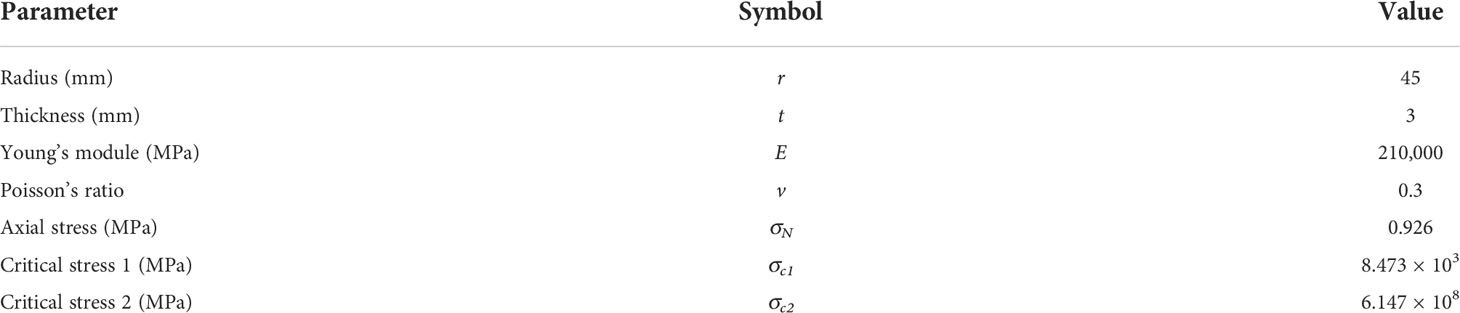
Table 3 The parameters for stability analysis during penetration.
3.4.2 Geometry, material parameters, and constitutive law
The geometry and material parameters are shown in Table 2. In order to model realistic soil, an investigation was conducted through reported cases and field tests (Jiang, 2001; Hu et al., 2009). The material properties of soil in Table 2 are derived from the reported cases and field tests in the Zhoushan Island (Wang et al., 2011). The soil was modeled obeying the Mohr–Coulomb yield criterion. The model is extensively used to model cohesive geological materials, such as soils and rocks (ABAQUS, 2008).
3.4.3 Mesh and boundary conditions
Considering the symmetry of the deployment process, only half-soil was modeled. The diameter and height of the soil zone were 13 Da and 2 Lp , respectively, to ensure that the soil extension is sufficiently large to avoid a boundary effect in dynamics analysis. The soil zone is separated into two parts: the lower part, filled with soil, and the void upper part (i.e., material-free), which is used to allow soil to heave by containing the extruded soil during the deployment process. A typical mesh grid is shown in Figure 4. The mesh comprised eight-node linear brick element EC3D8R with decreased integration, and a fine mesh region is generated to accommodate the auxiliary deployment device during the entire deployment process. The auxiliary deployment device was simplified as a rigid part and assumed to remain vertical during the entire deployment process. The ADP dynamic deployment was modeled from the soil surface, with a given velocity of 150 mm/s.
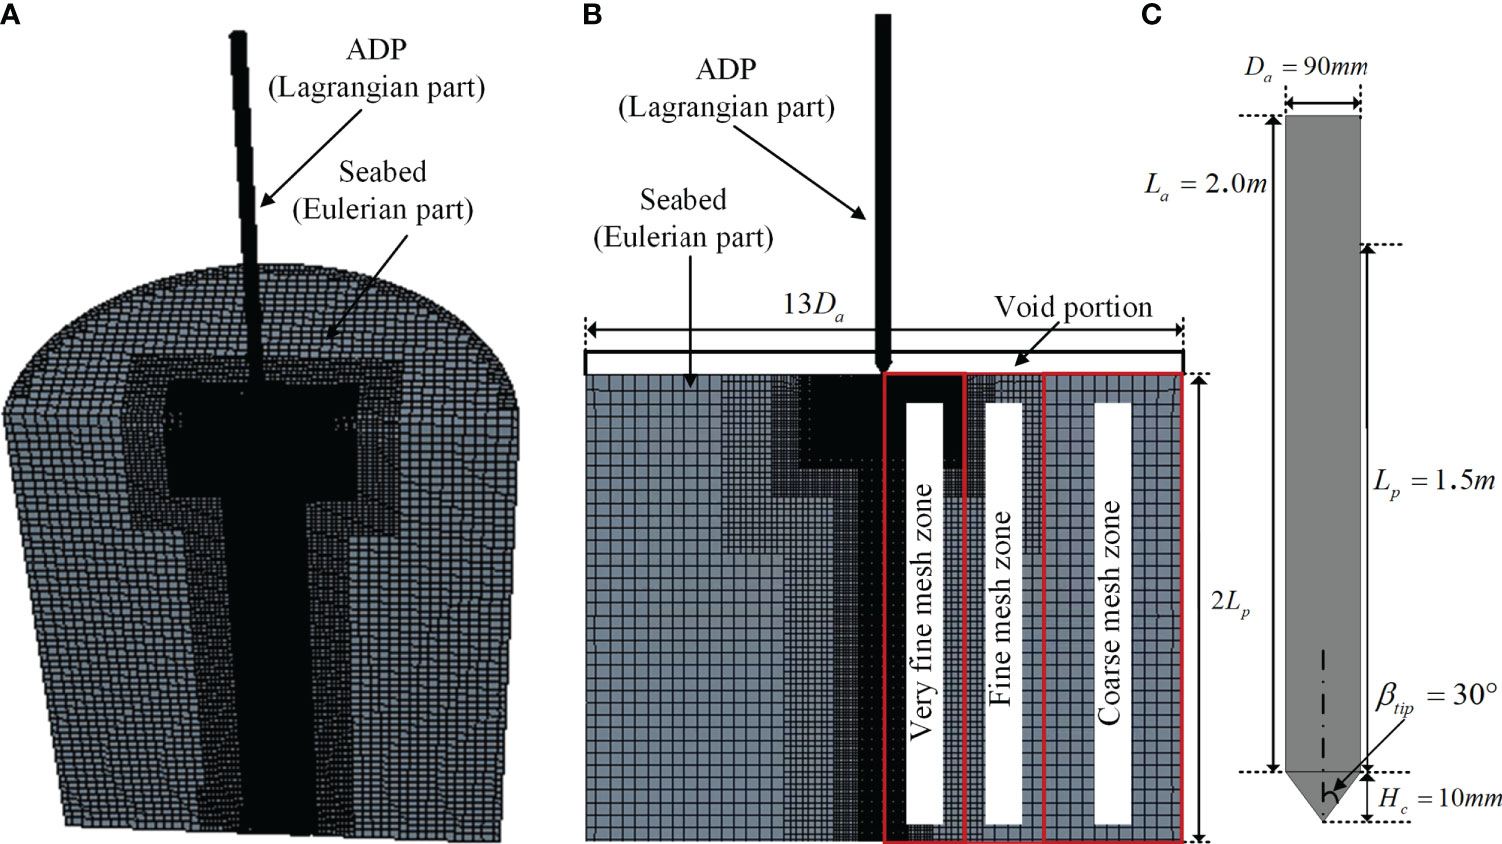
Figure 4 Typical mesh and geometry parameters used in coupled Eulerian–Lagrangian (CEL) analysis: (A) three-dimensional (3D) mesh; (B) side view; and (C) the geometry parameters of the auxiliary deployment part (ADP).
3.4.4 Simulation results
Figure 5 shows the results of Mises stress contour in CEL analysis. During the penetration process, the instrument is mainly subjected to two resistances (side friction resistance and tip resistance), the value of which are shown in Figure 6. The tip resistance changes rapidly at the initial penetration, and the total resistance is almost equal to the tip resistance. Yang et al. (2020) concluded that if the penetration depth is large enough, the tip resistance will tend to be a stable value. Obviously, the critical depth has not been reached in this case, so the tip resistance increases as the penetration depth increases and eventually reaching 549.32 N. The side friction resistance is mainly due to the soil-squeezing effect, which will increase as the penetration depth increases. The maximum side friction resistance is 251.61 N at the depth of 1.5 m. During the pull-out process of the casing pipe, since the conical drill and IMP remain in the strata, the resistance in this process is only the side friction resistance, which is much smaller than the maximum penetration resistance.
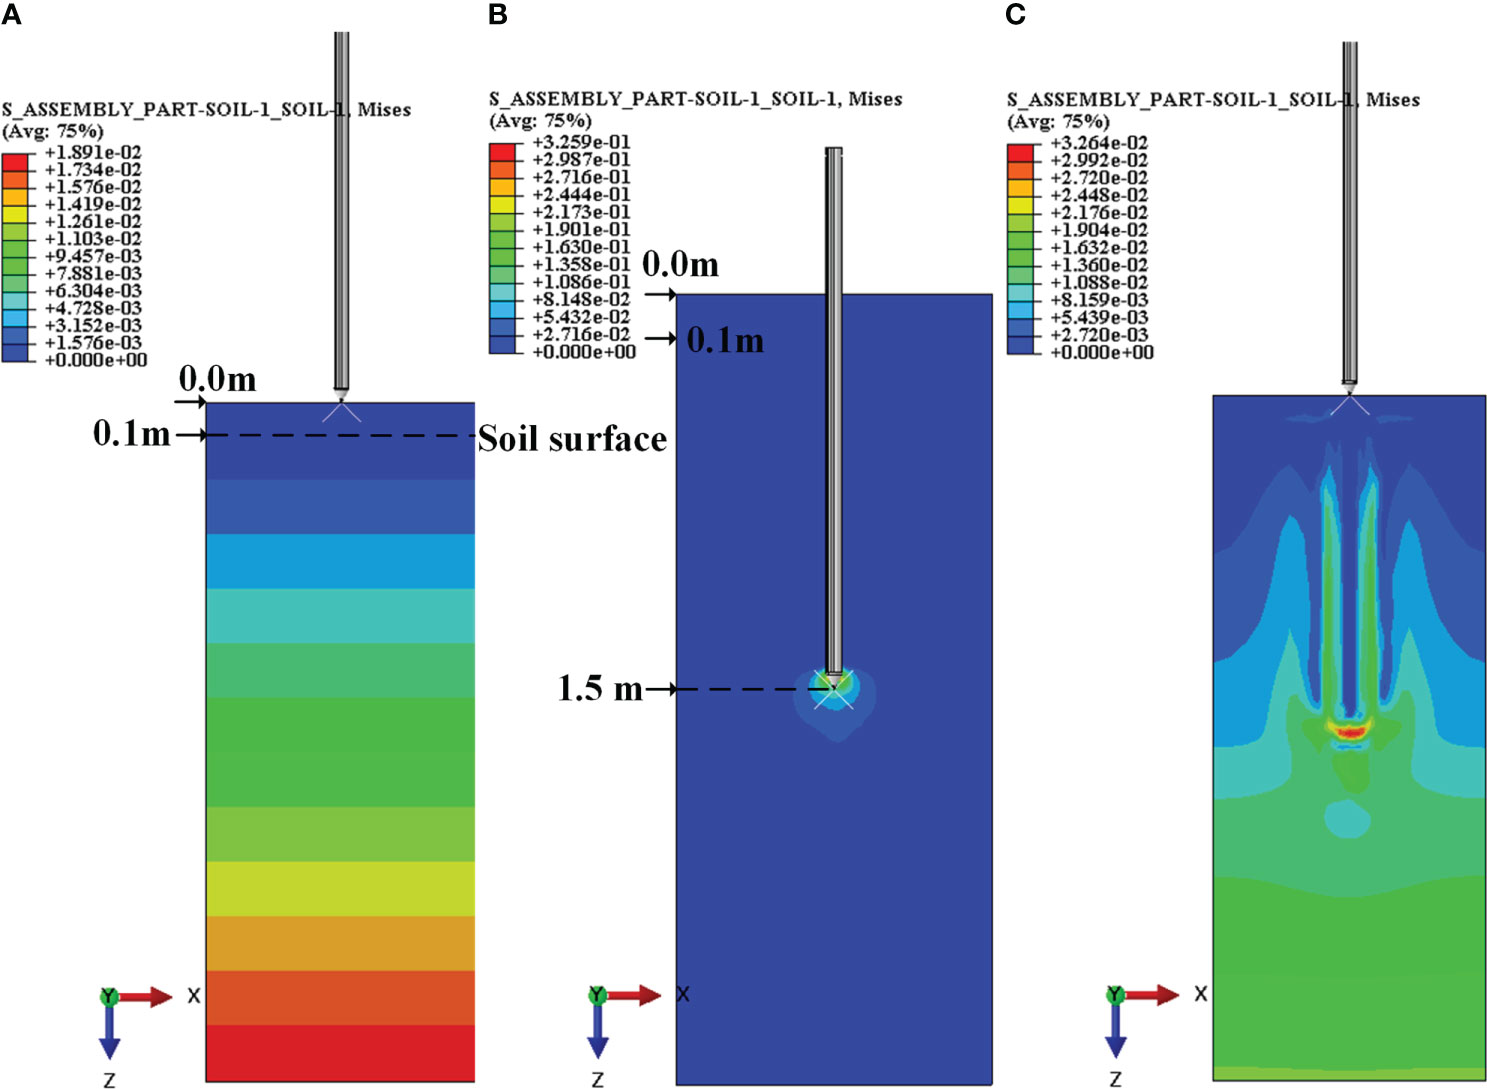
Figure 5 Mises stress contour in CEL analysis (A) at the initial state; (B) at a penetration depth of 1.5 m; and (C) after deployment.
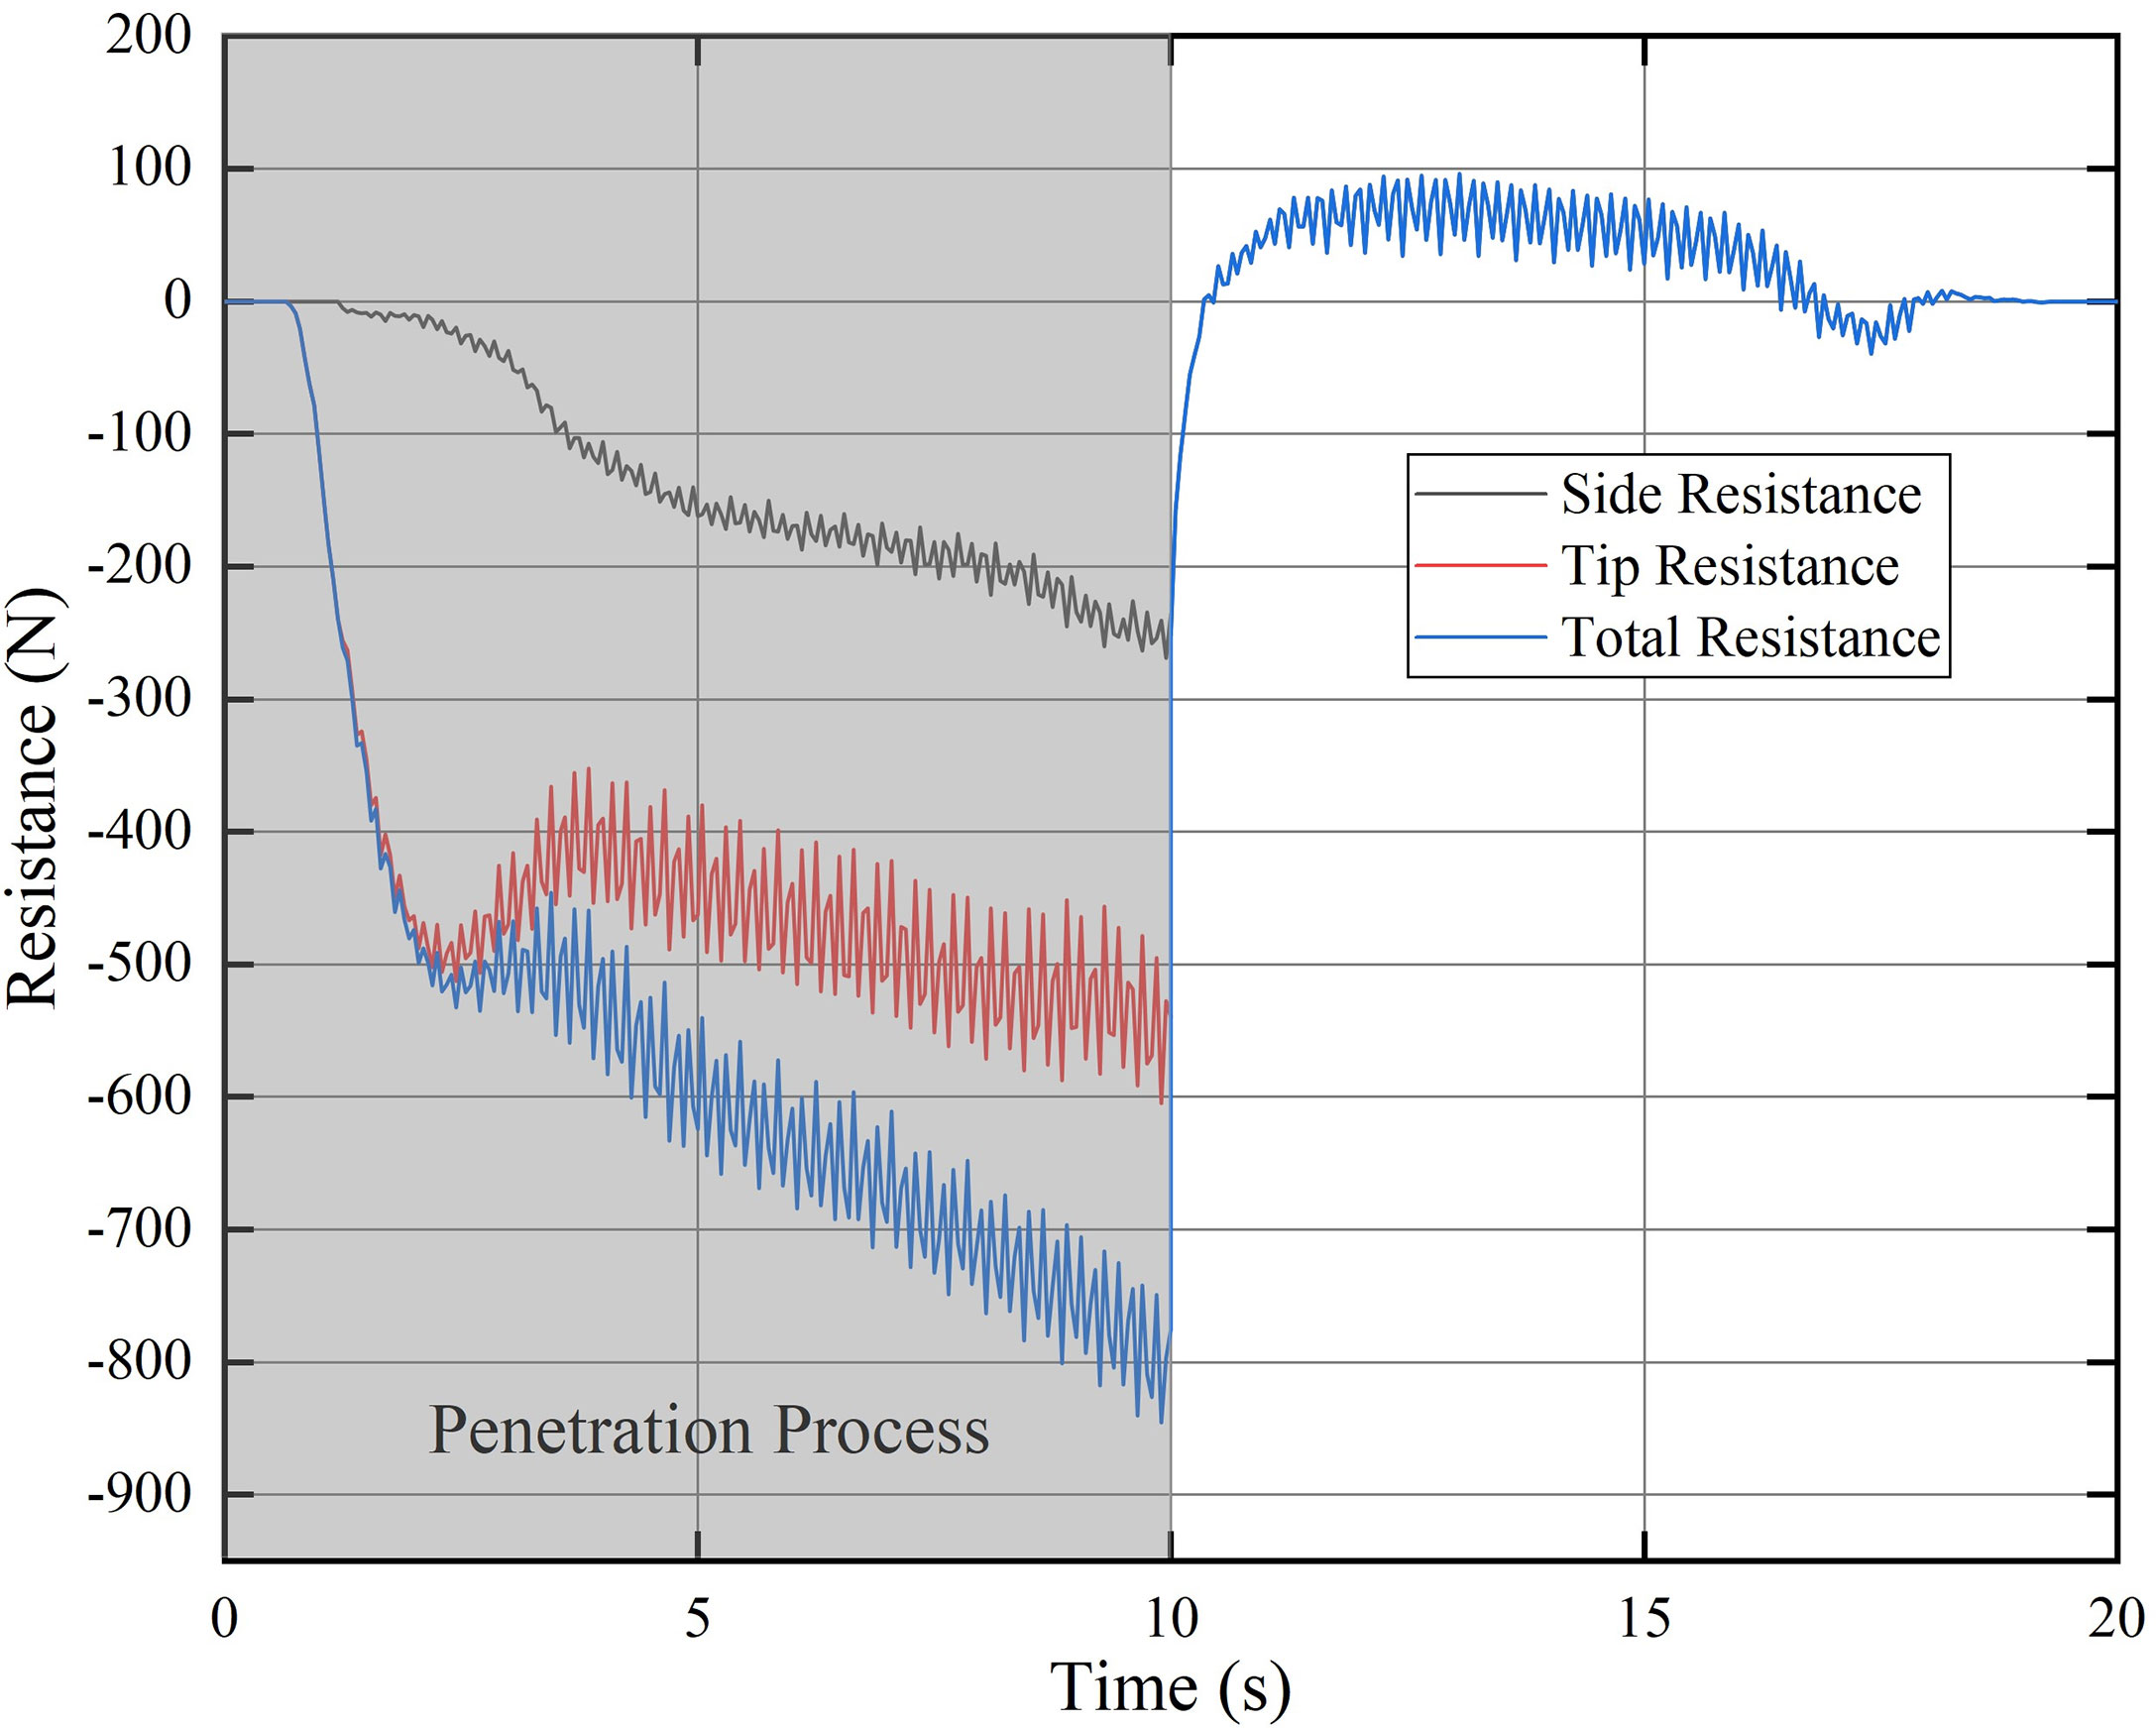
Figure 6 The resistance of ADP during the entire deployment process.
4 Experiment and results
4.1 Mechanical test of indoor deployment process
4.1.1 Design of the experiment
4.1.1.1 Experimental setup
The experimental setup is schematically illustrated in Figure 7. It is comprised of a 3.5-m height experiment platform, a guide rail, a lead screw, a servo motor, a motor controller, a plastic cylindrical tank with well-stirred saturated soft soil, the ADP, and a force sensor. The diameter and depth of the soil tank is 800 and 900 mm, respectively. The length and diameter of the ADP are 1,500 and 90 mm, respectively. The servo motor is installed on the top of the lead screw and can push down or pull up the lead screw along the guide trail at a specific velocity. A high-precision force sensor is placed between the ADP and lead screw to record the stress.
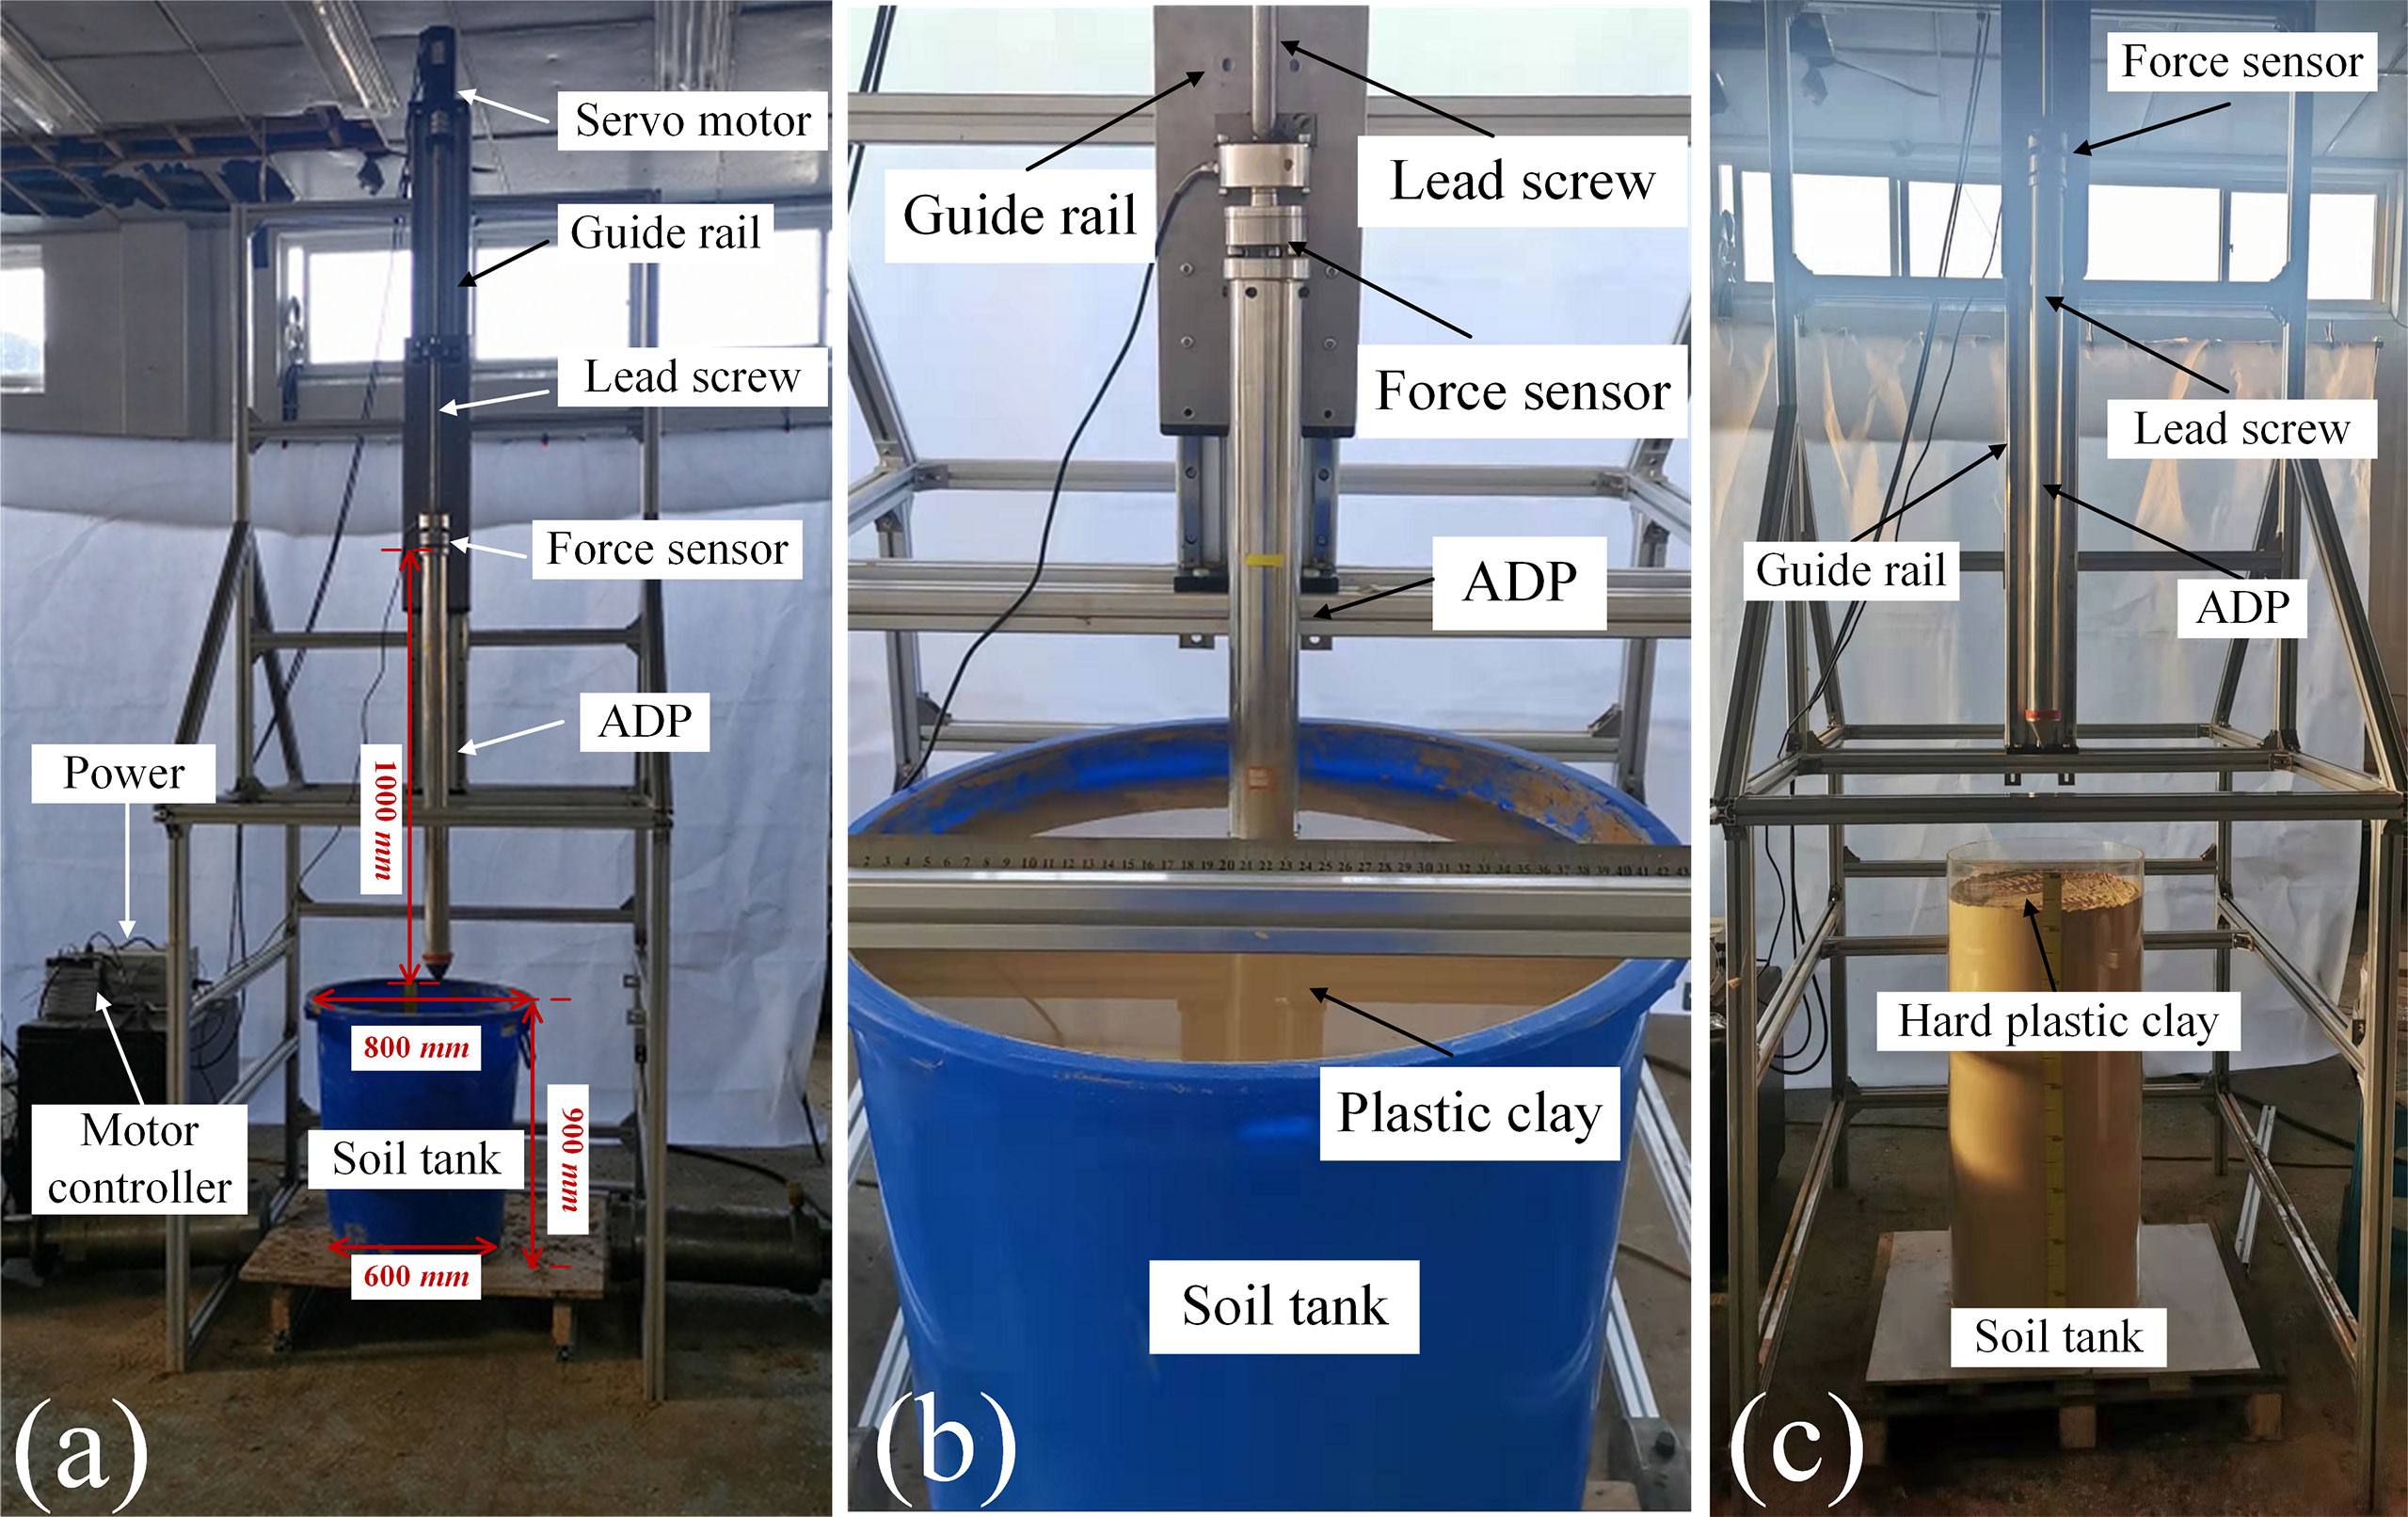
Figure 7 Layout of the experiment setup: (A) global view of the test bench; (B) ADP and plastic clay; and (C) ADP and dry plastic clay.
4.1.1.2 Model ADP, soil preparation, and characteristic
The model ADP and solid conical drill was manufactured for the test as shown in Figure 7. The length, diameter and thickness of the ADP is 1, 63, and 1 mm, respectively. The length, diameter and the cone angle of the conical drill is 70 and 65 mm and 30° . The combination of bentonite and fine sand was used to modulate the simulated soil for seabed sediment through the analysis of the physical properties and field sampling data of the seabed sediment (Li and Li, 2010), the mass proportions of which are 70% and 30%, respectively. The soil preparation and characteristic refer to the Wang (2016) reference. Three different properties of soil (flow plastic clay, plastic clay, and try plastic clay) were used in the experiment, as shown in Figure 7.
4.1.1.3 Test procedure
The test processes were as follows: first, some connections and adjustments were completed. The tilt angle of the guide rail and lead screw were adjusted to ensure that the penetration direction of the ADD is perpendicular to the soil bed. Next, the servo motor controller was set up, and the motor as set to make the lead screw move down and keep a velocity of 10 mm/s. Then, the serial port of the host computer was opened to record and save the value of the resistance at a frequency of 1 Hz. Finally, the rotation direction of the motor was changed to pull up the lead screw. The experimental test was repeated three times in order to eliminate the single measurement errors. After each test, the soil bed was stirred with a cement vibrator and stand settlement for 2 days to ensure that soil was fully reconsolidated. The averaged resistance was regarded as the final penetration resistance.
4.1.2 Experiment results and analysis
Three types of soils with different water content were used in tests. The results of maximum penetration force are shown in Table 4, and the forces during penetration are shown in Figure 8. The dry plastic clay is without water in the void; thus, the friction between soil particles is large, resulting in large penetration resistance. The water content of the plastic clay is approximately 25%, similar to the mass ratio in the reference (Wang, 2016). The maximum penetration resistance in plastic clay is close to the numerical results. Flow plastic clay is saturated clay and is covered with water. Excessive water molecules in the voids of soil particles reduce the friction between particles, so the penetration resistance is the smallest.

Table 4 Results of the penetration tests.
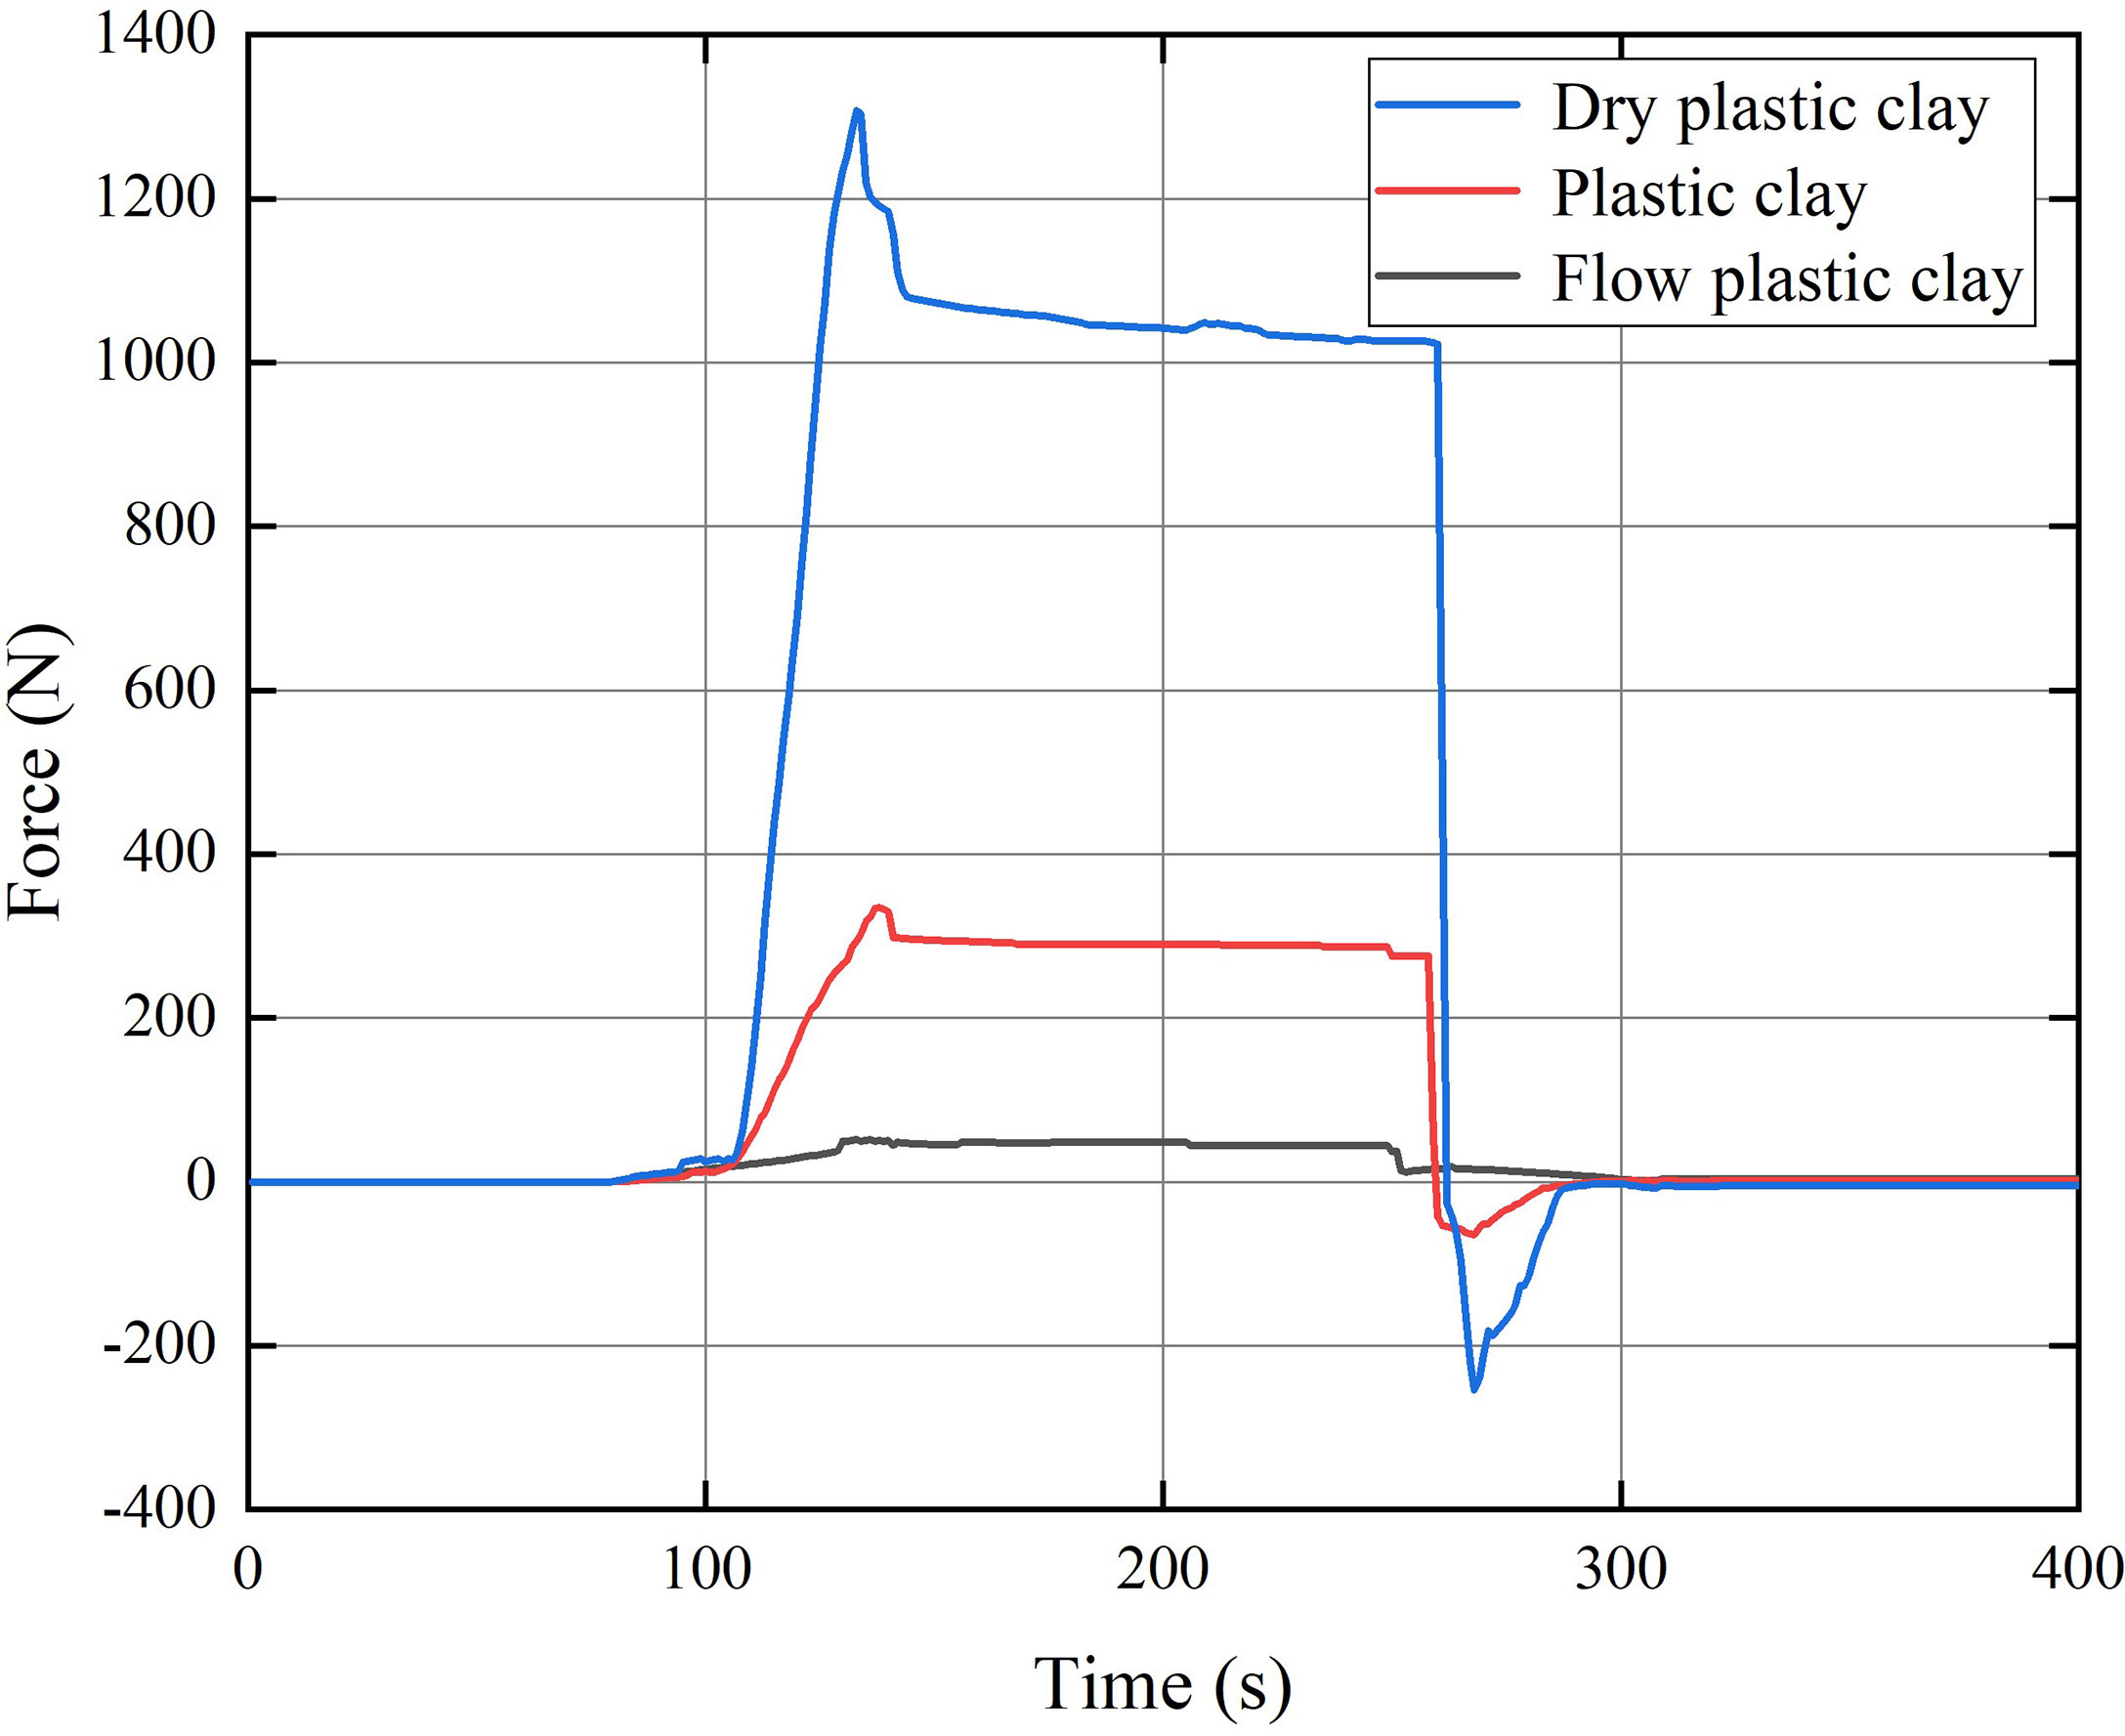
Figure 8 Penetration resistance in three types of clay.
4.2 Mechanical test of deployment process in tidal flat
4.2.1 Study area
Changzhi Island (122°10'E,29°58'N ) is located in the south of Zhoushan Island in Zhejiang, China, as shown in Figure 9. The Changzhi Island is 7.3 km away from Dinghai district and 350 m away from Zhoushan Island. The coastline is 13.82 km long and covers the land area is 6.30 km². The experiment area is the north of Changzhi Island, as shown in Figure 9. The natural experimental conditions on the Changzhi Island are very good. A large range of muddy tidal flat have been formed in Changzhi Island after several sea reclamations, and contains thick soft sediment that has high water content and a large initial void ratio and is mainly flow plastic clay (Xiong et al., 2019).

Figure 9 The location of the Changzhi Island in Zhoushan Island, China.
4.2.2 Tidal flat penetration experiment
Figure 10 presents a diagram of the penetrating experimental setup. The experimental setup and test procedure have been introduced in Section 5.1. In the field tidal flat experiment, the ADP penetrated into the tidal flat with the driving of the servo motor at a velocity of 10 mm/s, and the force sensor and PC recorded the resistance during the entire penetrating process. In order to eliminate the single position error, three repeatable tests were carried out in three adjacent positions (with a distance of 1 m from each other).
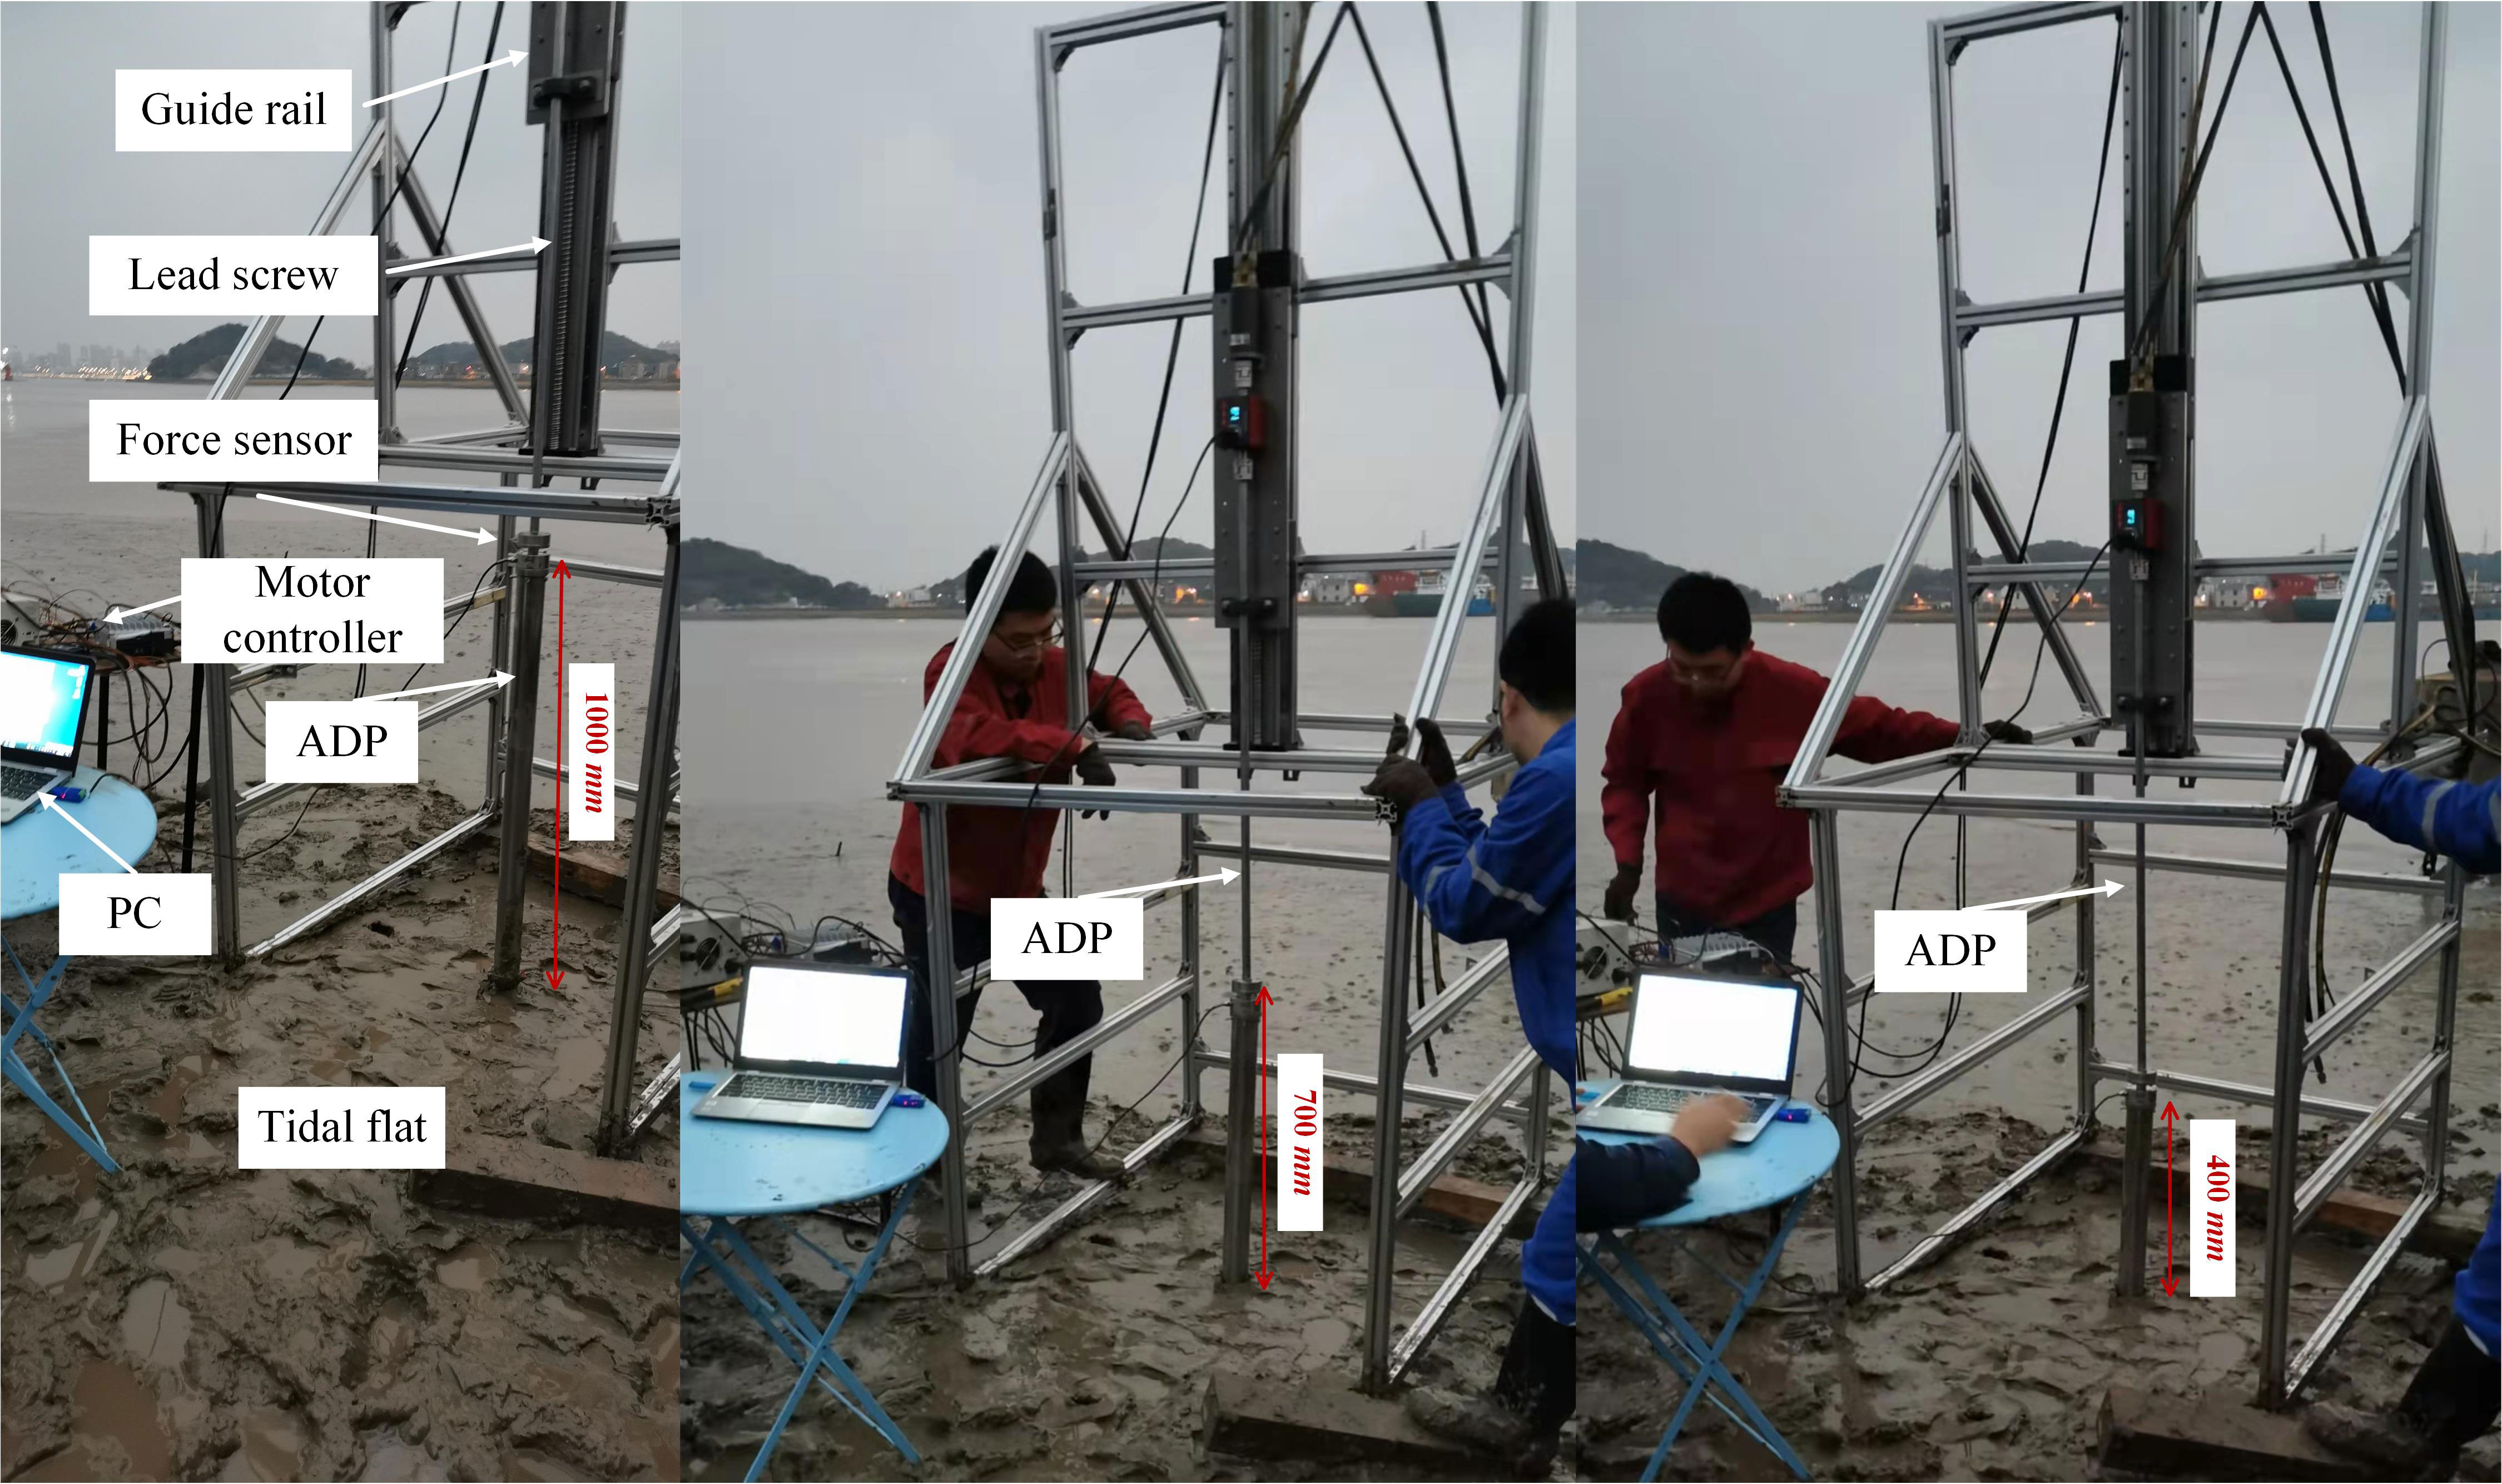
Figure 10 Tidal flat penetrating experimental setup.
4.2.3 Experiment results and analysis
Figure 11 shows the penetration resistance in a tidal flat experiment. The maximum penetration resistance of test 1, test 2, and test 3 are 349, 365, and 378 N, and the averaged maximum penetration resistance is 364 N. Since the sediment layer is relatively uniform, no obvious abrupt changes were recorded in the force sensor. The penetration resistance increases as the penetration depth increases and then gradually decreases after it reaches the maximum penetration depth and remains stable. The pull-out force and penetration force are in opposite directions; thus, the force direction changes abruptly as the pull-out operation is performed. However, the maximum resistance during the pull-out process is much smaller than that in the penetration process. The final weight of the ADP is 10–20 N larger than the initial weight due to the adhesion of mud on the surface and inside.
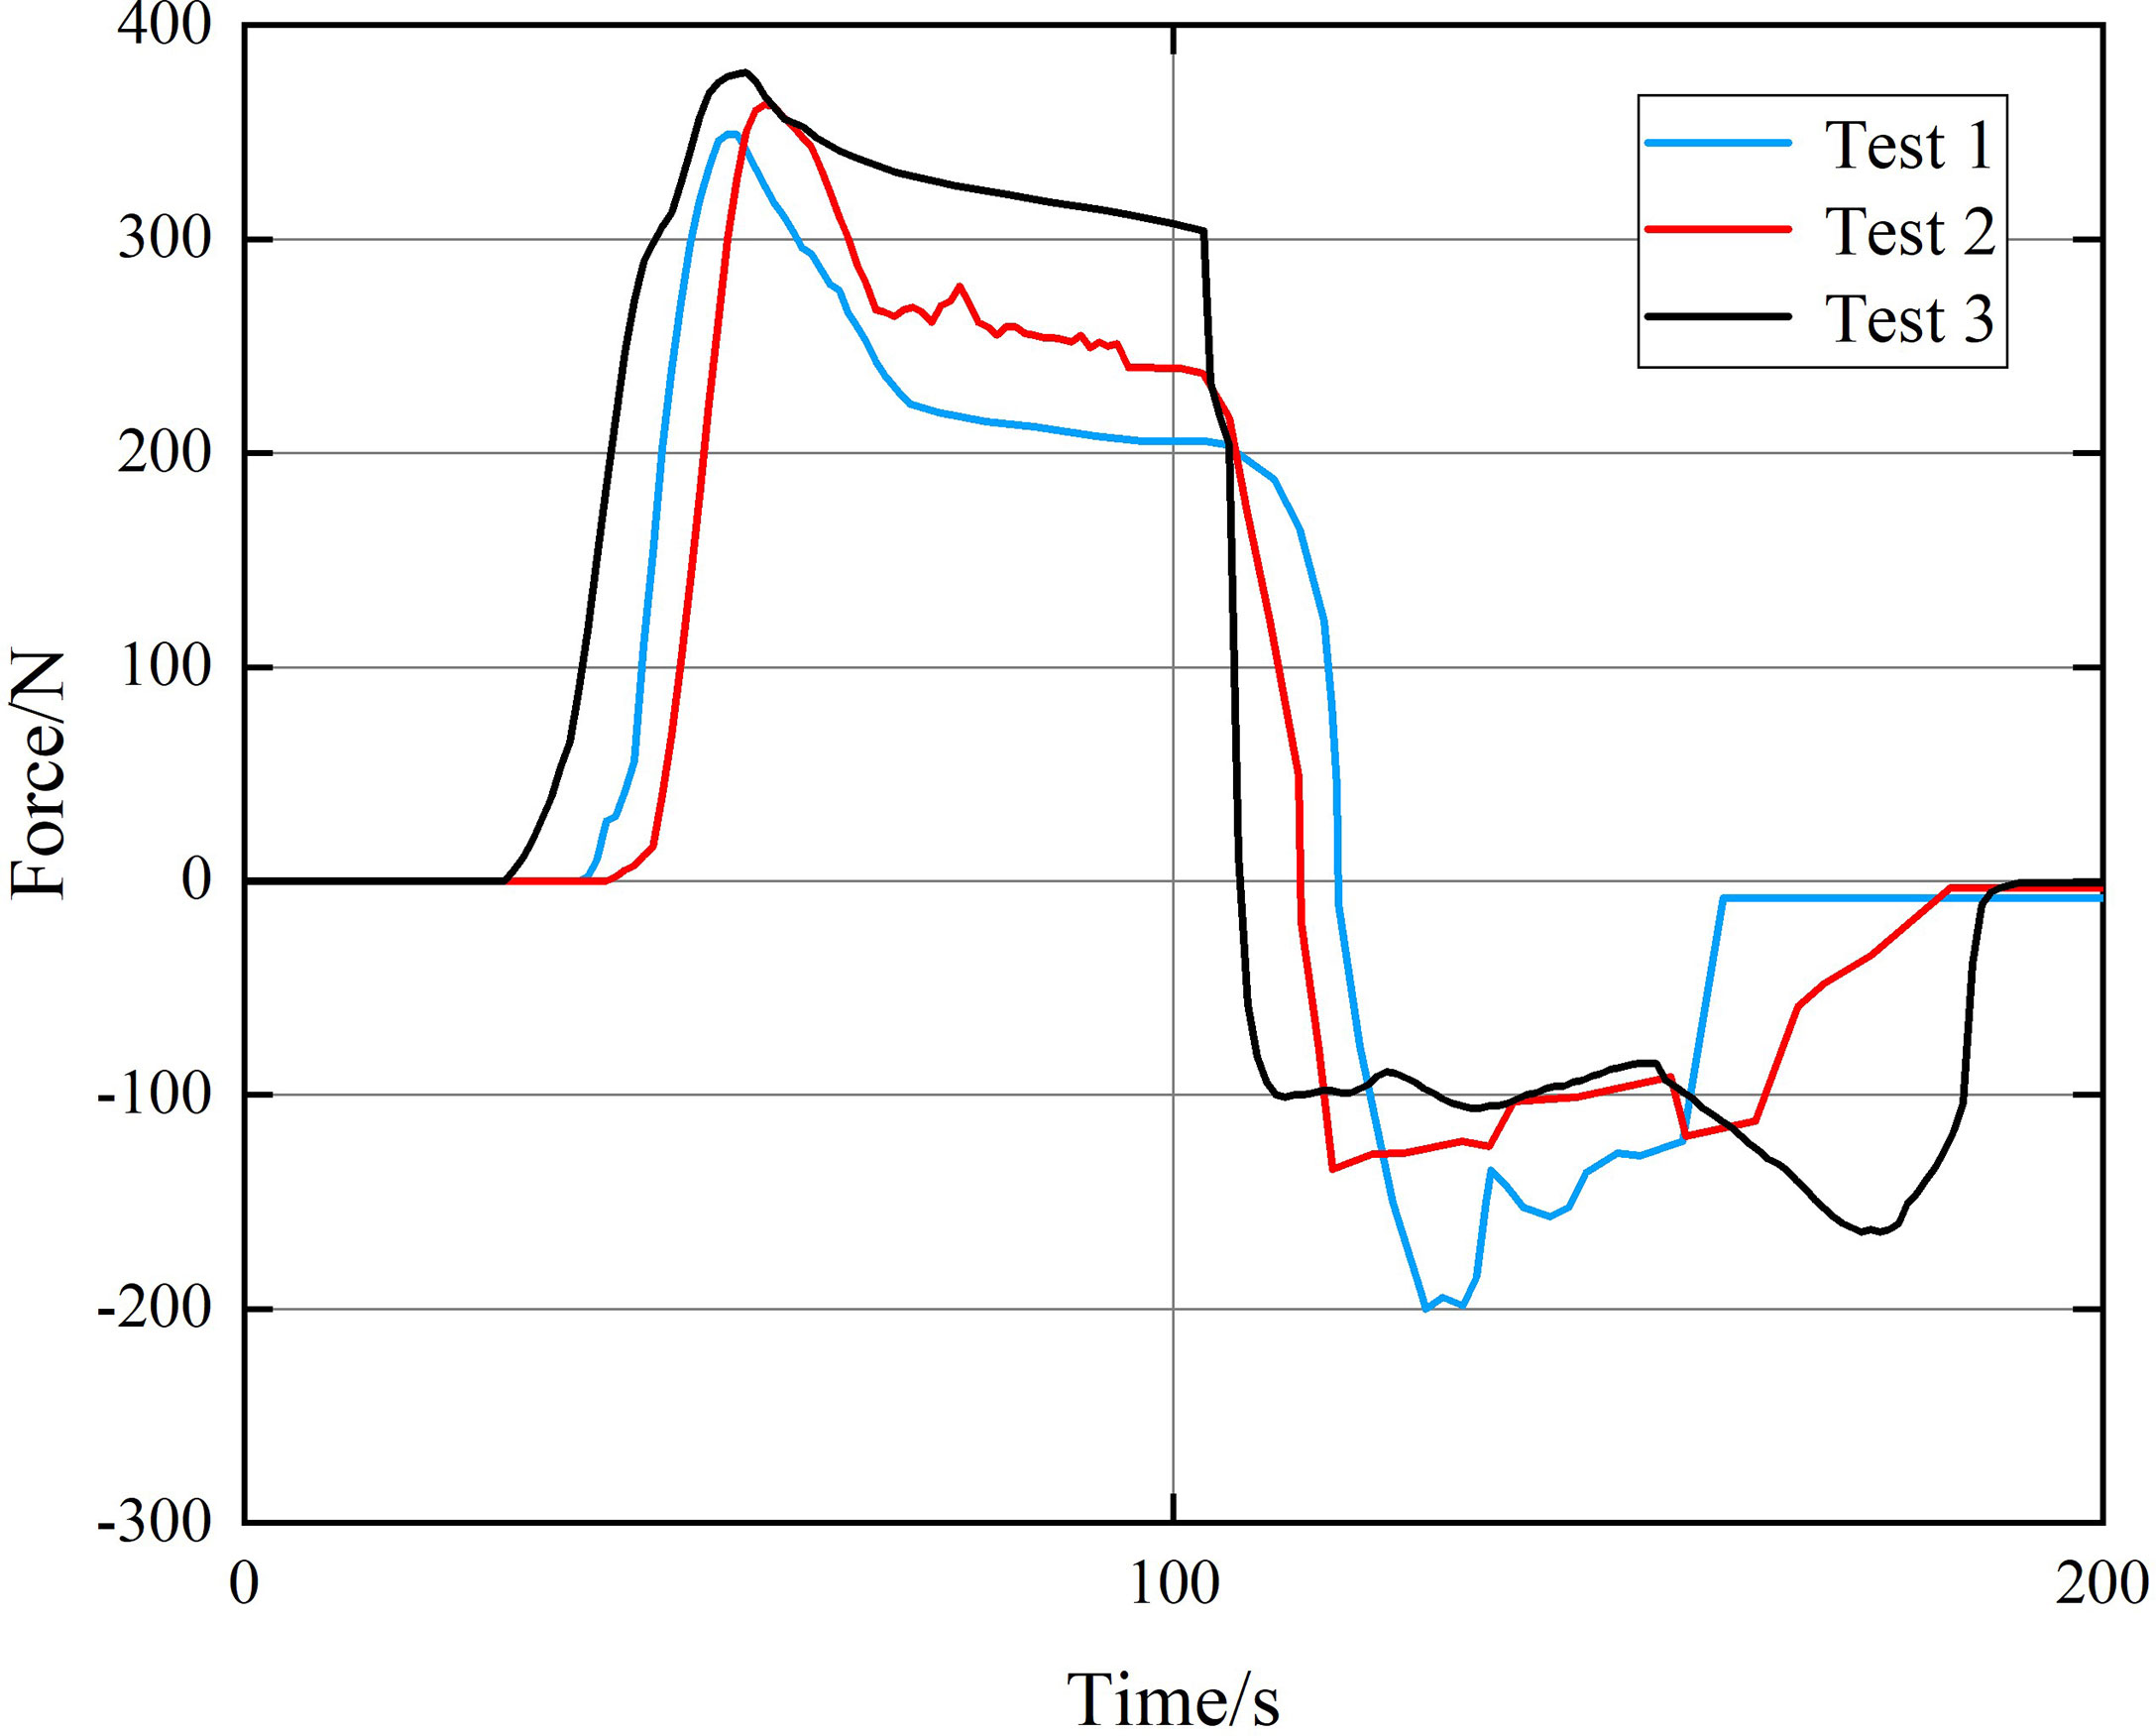
Figure 11 Penetration resistance in a tidal flat experiment.
4.3 In situ strata deformation monitoring test, results, and analysis of tidal flat
In order to verify the in situ deployment method and the monitoring performance of the strata deformation monitoring instrument, an in situ deploying and monitoring experiment was carried out in a tidal flat. The presented instrument operated for five consecutive days. The in situ deployment location is in the field experiment site described in Section 5.2. The deployment process is shown in Figure 12. There are five monitoring nodes in the instrument, and each node has two MEMS sensors to monitor the strata deformation in the X and Y directions.
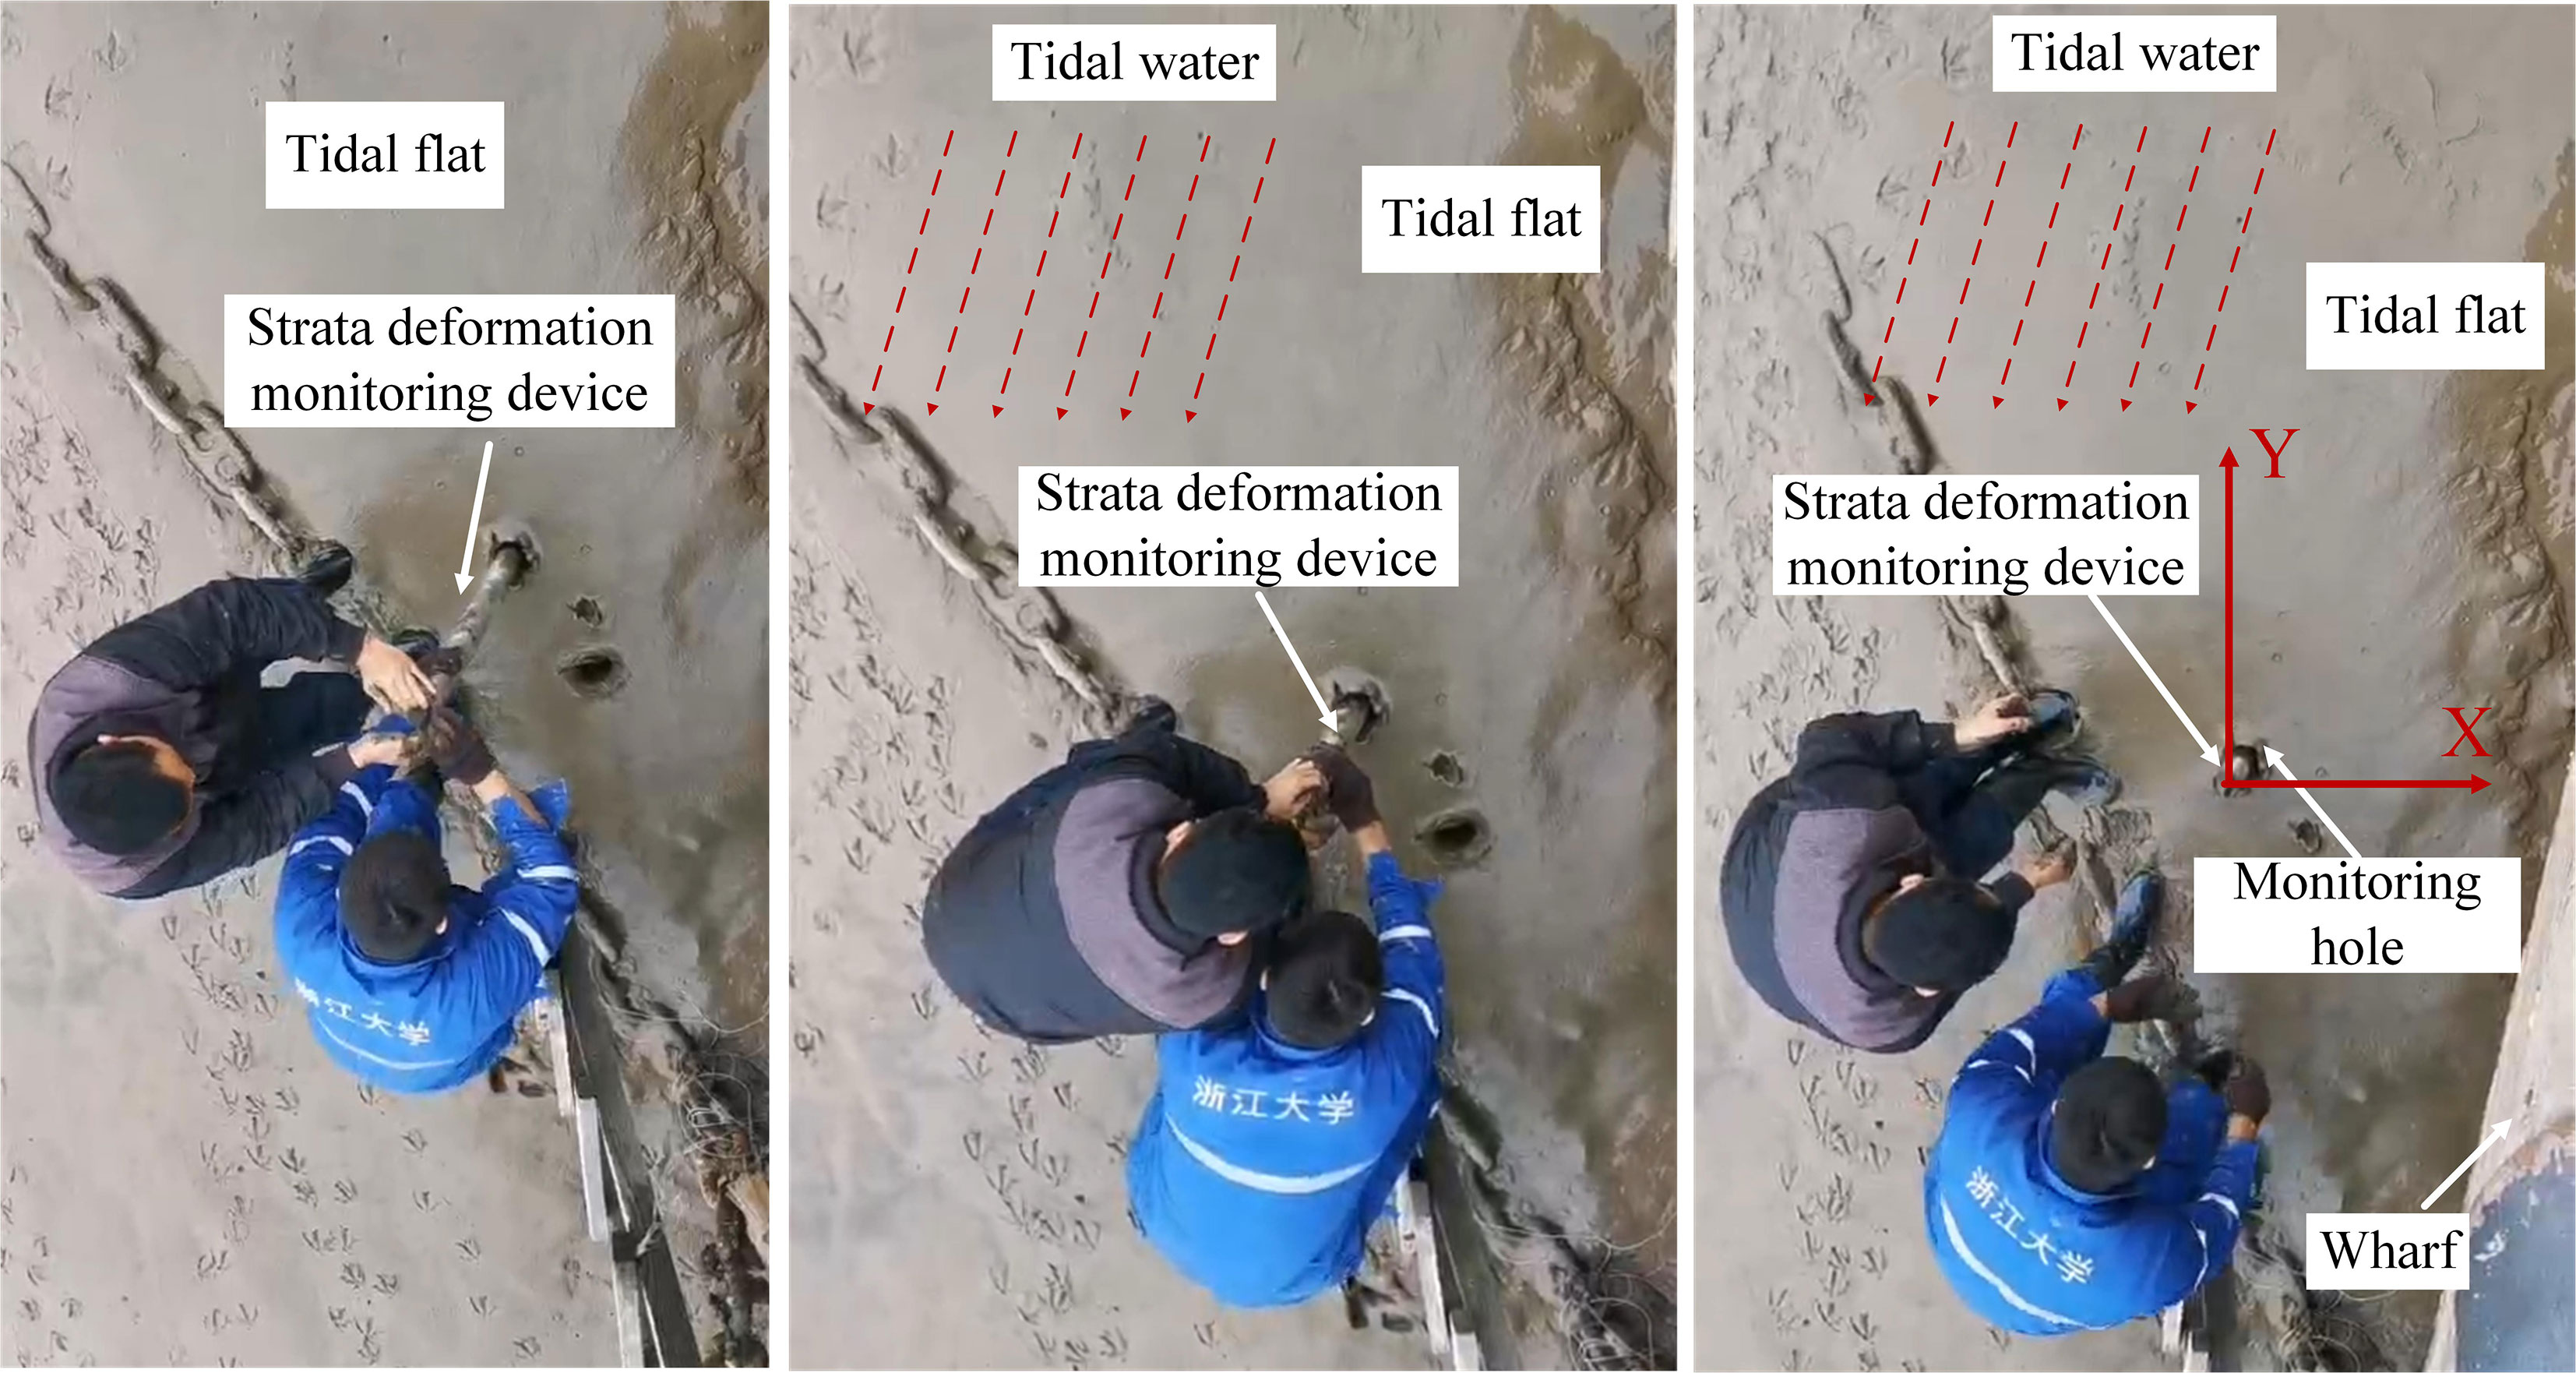
Figure 12 Deployment process of the monitoring instrument.
Figure 13 shows the pitch angle of the sensors every 6 h. The initial shape of the IMP is not straight since the sediment layer is soft and the surrounding soil flows and squeezes the IMP as the deployment process is accomplished. The initial deflection angles of the first monitoring node in the direction of X and Y are 11.01 ° nd 12.08 ° respectively. The strata will deform or move under the action of tides, waves, etc. Since the data acquisition period is 6 h, the obtained data cannot reflect the influence of the tide change or specific waves, but it can reflect the cumulative deformation changes of the tidal flat.
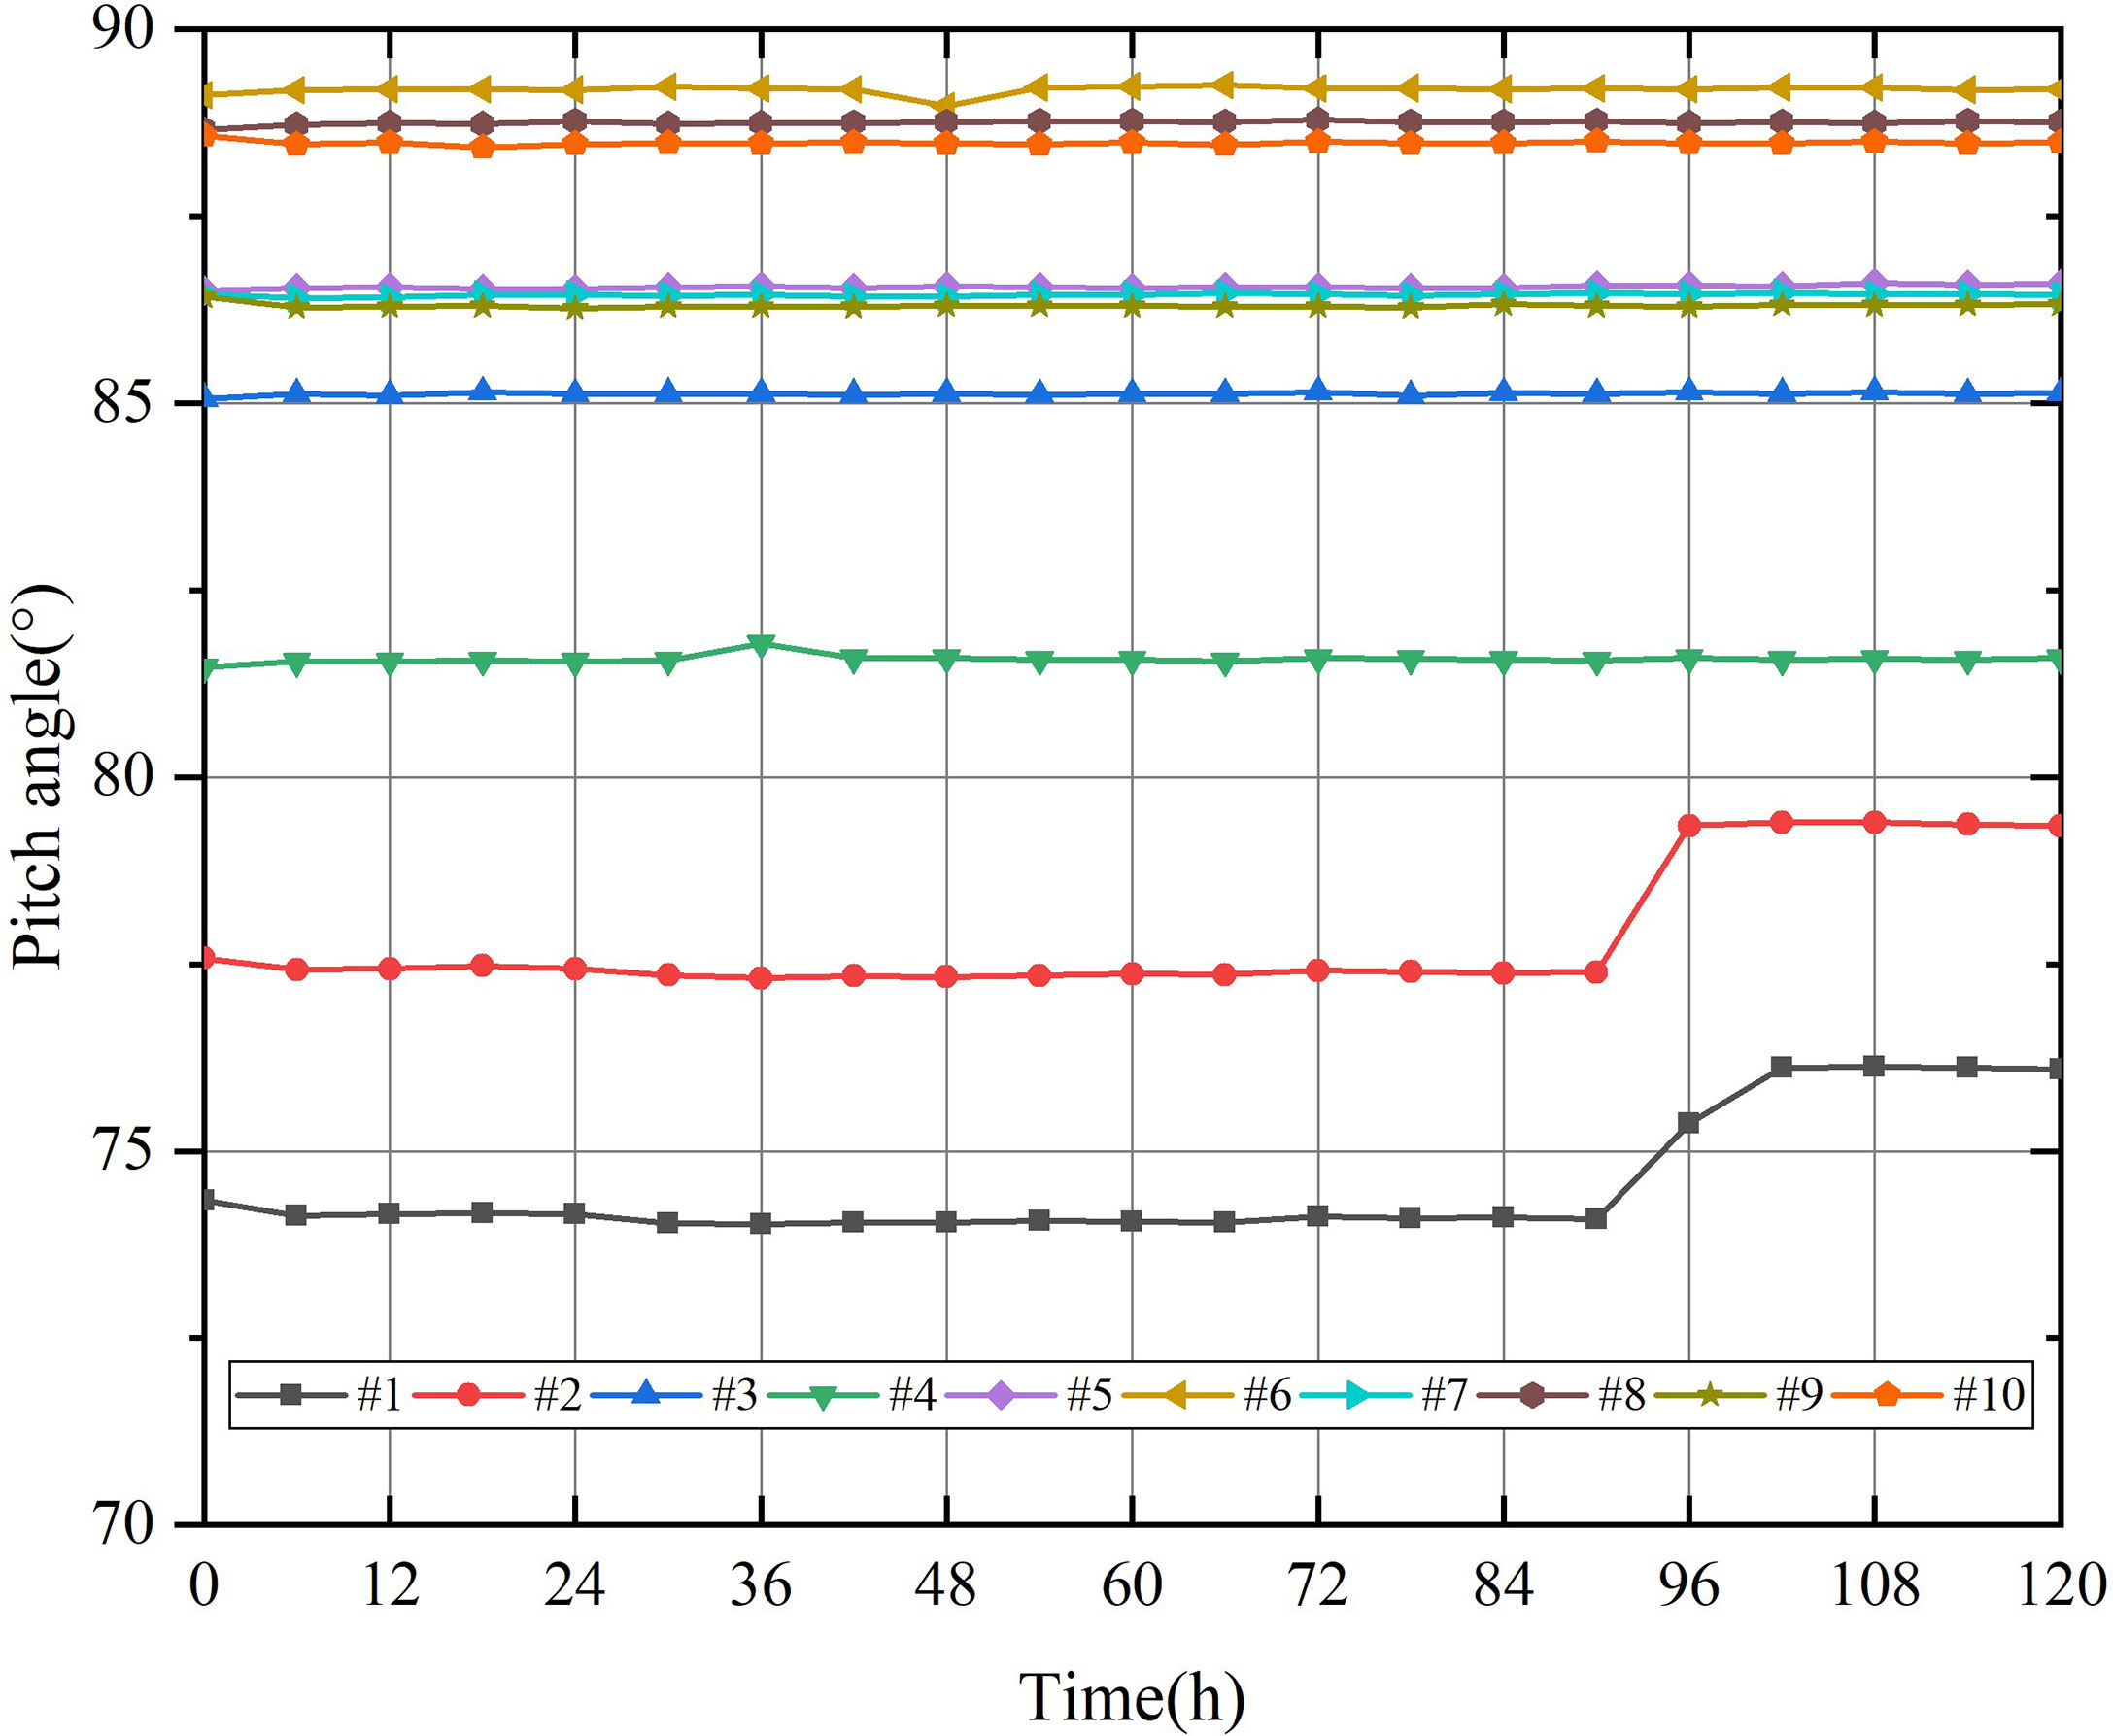
Figure 13 Pitch angle of the sensor nodes.
Figure 14 shows the deformation of the strata. The maximum and average deformations of the strata are shown in Table 5. The maximum deformation of the first monitoring node is 1.66 cm, and the deformations in the X and Y direction are 1.19 and 1.17 cm, respectively. The deep strata changes very little; on the contrary, the shallow layer changes more frequently due to the influence of the tide and wave. It is worth noting that although the average deformation of the forth monitoring node (sensor #7 and #8, at a depth of 1.6 m) is large, the deformation mainly comes from the first monitoring period (2022-1-25-10-00-00 to 2022-1-25-16-00-00). It can be considered that the soil around the IMP was crushed and damaged during deployment and recovered and consolidated after experiencing a tidal change. After that, the monitoring node has a good coupling relationship with soil; thus, the following deformation changes are relatively small.
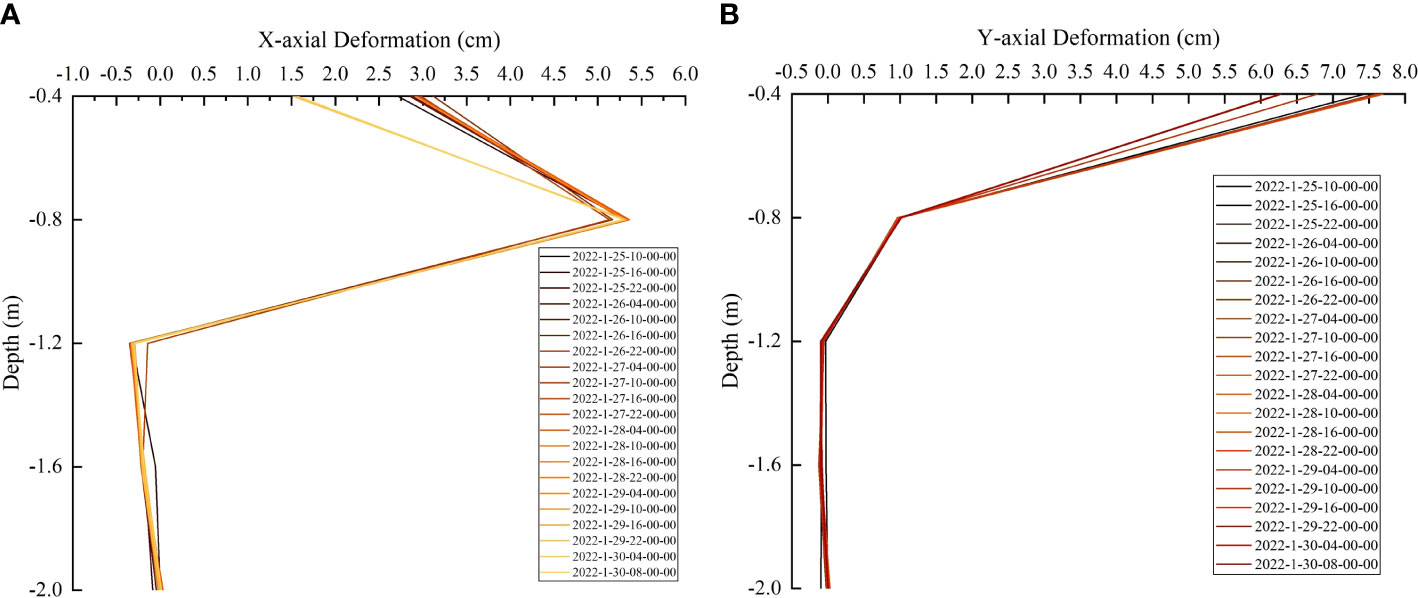
Figure 14 Deformation of the monitoring instrument. (A) the deformation in X-axis, (B) the deformation in Y-axis.

Table 5 The maximum and average deformation of the strata.
5. Discussion and conclusion
In this paper, an innovative monitoring instrument was presented for seabed strata deformation monitoring. A sufficient mechanical analysis of the entire deployment process was carried out through theoretical, numerical, and experimental research. Firstly, the reaming pressure and penetration resistance were studied based on the cavity expansion model and modified Lade–Duncan yield criterion. Then, based on the software of ABAQUS, the finite-element model was established and the coupled Euler–Lagrangian method was carried out to numerically simulate the entire deployment process, proving the stability and feasibility of the deployment method. A series of indoor and field tests were conducted to validate the maximum penetration resistance obtained and the monitoring ability of the proposed instrument. The experimental results demonstrate the feasibility of the proposed monitoring instrument. The main results of this paper are as follows:
1. The numerical simulation and theoretical results show that when the penetration depth of the instrument is 1.5 m, the maximum penetration resistance is 800.93 and 759.65 N, respectively. Although the penetration resistance calculated in numerical simulation is slightly larger than that in theoretical analysis, the required penetration force can be provided by the manipulators of ROV. The reliability and stability of the in situ deployment method with the auxiliary deployment part are verified.
2. The experimental results show that when the penetration depth is 900 mm, the maximum penetration resistance in theoretical analysis and indoor and field tests is 357, 335, and 378 N. Since the field test is located in the tidal flat, the sediment layer is not continuous and the water layer is in the lower layer, the upper layer is harder, and the penetration resistance obtained is the largest. However, the trend of the penetration resistance is similar during the entire deployment process. As the penetration depth increases, the penetration resistance will gradually increase, and the maximum resistance will eventually drop a little and remain stable at the deepest position. The direction of the resistance will change during the pull-out process due to the changes of the pulling force, but the maximum pull-out resistance is smaller than the penetration resistance.
3. The results of the monitoring test of the tidal flat in Changzhi Island show that the deformation of the surface sediment layer is most affected by the tidal and waves. The maximum deformation of the monitoring node in the surface layer (0.4 m) is 1.66 cm, and the average deformation in the direction of X and Y are 0.13 and 0.10 cm, respectively.
Data availability statement
The original contributions presented in the study are included in the article/supplementary material. Further inquiries can be directed to the corresponding author.
Author contributions
Methodology: YG and JC. Formal analysis: CC and YG. Experiment: PenZ, YG, TL, JA, and XL. Data curation, PeiZ, XL and YG. Writing—original draft preparation, YG. Writing—reviewand editing, YG. Visualization, PeiZ and YG. Project administration, JC. Funding acquisition, JC. All authors contributed to the article and approved the submitted version.
Funding
This study was funded by the National Natural Science Foundation of China (41976055), Finance Science and Technology Project of Hainan Province (ZDKJ202019), and Key Research and Development Project of Zhejiang Province (2018C03SAA01010).
Conflict of interest
The authors declare that the research was conducted in the absence of any commercial or financial relationships that could be construed as a potential conflict of interest.
Publisher’s note
All claims expressed in this article are solely those of the authors and do not necessarily represent those of their affiliated organizations, or those of the publisher, the editors and the reviewers. Any product that may be evaluated in this article, or claim that may be made by its manufacturer, is not guaranteed or endorsed by the publisher.
References
Batdorf S. B., Schildcrout M., Stein M. (1947). Critical stress of thin-walled cylinders in axial compression National Advisory Comittee For Aeronotics 543, 543–550.
Cao J. (2020). Characteristics and numerical simulation of jacked pile driving in saturated clay (Yanshan, Hubei, China: Yanshan University).
Ewy R. T. (1999). Wellbore-stability predictions by use of a modified lade criterion. Spe Drill Completion 14 (2), 85–91. doi: 10.2118/56862-PA
Ge Y. Q., Chen J. W., Cao C., He J. M., Zhou P., Gao F., et al. (2021). Development and Sea trial of the terrain monitoring device based on MEMS sensing array. IOP Conf. Ser.: Earth Environ. Sci. 861 (7), 072008. doi: 10.1088/1755-1315/861/7/072008
Hu P., Wang D., Cassidy M. J., Stanier S. A. (2014). Predicting the resistance profile of a spudcan penetrating sand overlying clay. Can. Geotech J. 51(10), 1151–1164. doi: 10.1139/cgj-2013-0374
Hu R. J., Wu J. Z., Zhu L. H., Ma F. (2009). Characteristic of surface sediment transport in zhoushan archipelago Sea area, East China Sea (in chinese). Periodical Ocean Univ. China 3, 7. doi: 10.16441/j.cnki.hdxb.2009.03.022
Jiang G. J. (2001). The characteristics of hydro-dynamics and sediments in the strait channels of zhoushan islands area (in chinese). J. Zhejiang Univ. 28 (1), 10. doi: 10.3321/j.issn:1008-9497.2001.01.016
Koch S., Berndt C., Bialas J., Haeckel M., Greinert J. (2015). Gas-controlled seafloor doming. Geology 43 (7), 571–574. doi: 10.1130/G36596.1
Lade P. V., Duncan J. M. (1975). Elastoplastic stress-strain theory for cohesionless soil. J. Geotech Eng. Div 101 (10), 1037–1053. doi: 10.1061/AJGEB6.0000204
Li L., Li S. L. (2010). Simulation and mechanical characteristics of terramechanics of the surface soil on deep-sea bed (in chinese). Eng. Mech 11, 213–220. doi: 10.3724/SP.J.1011.2010.01138
Nixon M. F., Grozic J. L. H. (2007). Submarine slope failure due to gas hydrate dissociation. preliminary quantif: Can. Geotech J. 44 (3), 314–325. doi: 10.1139/t06-121
Paull C. K., Caress D. W., Thomas H., Lundsten E., Anderson K., Gwiazda R., et al. (2015). Seafloor geomorphic manifestations of gas venting and shallow subbottom gas hydrate occurrences. Geosphere 11 (2), 491–513. doi: 10.1130/GES01012.1
Phillips K. A., Chadwell C. D., Hildebrand J. A. (2008). Vertical deformation measurements on the submerged south flank of kīlauea volcano, hawai'i reveal seafloor motion associated with volcanic collapse. J. Geophys Res. 113, 1–15. doi: 10.1029/2007jb005124
Polster A., Fabian M., Villinger H. (2009). Effective resolution and drift of paroscientific pressure sensors derived from long-term seafloor measurements. Geochem Geophy Geosys 10 (8), 1–19. doi: 10.1029/2009GC002532
Prior D. B., Suhayda J. N., Lu N. Z., Bornhold B. D., Keller G. H., Wiseman W. J., et al. (1989). Storm wave reactivation of a submarine landslide. Nature 341 (6237), 47–50. doi: 10.1038/341047a0
Ruppel C. D., Waite W. F. (2020). Grand challenge: Timescales and processes of methane hydrate formation and breakdown, with application to geologic systems. J. Geophys Res.: Solid Earth. 125, 1–43. doi: 10.1029/2018JB016459
Saito H., Yokoyama T. (2008). “Development of seafloor displacement monitoring system using a 3-component servo-accelerometer,” in Proceedings oceans. (Kobe, Japan: MTS/IEEE Kobe Techno-Ocean)
Tao C., Yu Z., Zheng J. J., Du J., Garg A. (2018). Improvement of the cavity expansion theory for the measurement of strain softening in over consolidated saturated clay. Measurement 119, 156–166. doi: 10.1016/j.measurement.2018.01.069
Tsushima H., Hino R., Tanioka Y., Imamura F., Fujimoto H. (2012). Tsunami waveform inversion incorporating permanent seafloor deformation and its application to tsunami forecasting. J. Geophys Res. Solid Earth 117 (B3), 1–20. doi: 10.1029/2011JB008877
Wang M. (2016). Key technology research of submarine self-propelled tracked trencher (in chinese) (Shanghai, China: Shanghai Jiao Tong University).
Wang Y., Feng J.-C., Li X.-S., Zhang Y., Han H. (2017). Experimental investigation on sediment deformation during gas hydrate decomposition for different hydrate reservoir types. Energy Proc. 142, 4110–4116. doi: 10.1016/j.egypro.2017.12.333
Wang Z., Jia Y., Liu X., Dong, Shan ,.H., Guo (2018). In situ observation of storm-wave-induced seabed deformation with a submarine landslide monitoring system. Bull. Eng. Geol Environ. 24, 701–709. doi: 10.1007/s10064-017-1130-4
Wang Z. H., Pan Y. J., Pan G. F., Chen P. X. (2011). Statistic analysis of physical and mechanical indices of quaternary marine sediments in the western sea area between zhoushan and daishan island (in chinese). Mar. Sci. Bull. 30 (5), 557–561. doi: 10.11840/j.issn.1001-6392.2011.5.013
Wang Z., Sun Y., Jia Y., Shan Z., Wen S. (2020). Wave-induced seafloor instabilities in the subaqueous yellow river delta–initiation and process of sediment failure. Landslides 7, 1–14. doi: 10.1007/s10346-020-01399-2
Xiong Z., Wang M. Y., Shan Z. G., Yan Q., Wang Y. J., Li T. (2019). Physical and chemical characteristics of marine sediments in the offshore of zhoushan (in chinises). Coast. Eng. 38 (1), 6. doi: 10.3969/j.issn.1002-3682.2019.01.006
Xu C., Chen J., Zhu H., Liu H., Lin Y. (2019). Experimental research on seafloor mapping and vertical deformation monitoring for gas hydrate zone using nine-axis MEMS sensor tapes. IEEE J. Oceanic Eng. 44 (4), 1090–1101. doi: 10.1109/JOE.2018.2859498
Yang S., Liu J., Zhang M., Wang Y. (2020). Analytical solution and field test of critical bearing capacity and settlement of pile tip. Stavební obzor - Civil Eng. J. 29 (1), 61–73. doi: 10.14311/CEJ.2020.01.0006
You K., Flemings P. B., Malinverno A., Collett T. S., Darnell K. (2019). Mechanisms of methane hydrate formation in geological systems. Rev. Geophy 57 (4), 1146–1196. doi: 10.1029/2018RG000638
Zhang M. Y., Deng A. F. (2003). A spherical cavity expansion-sliding friction calculation model on penetration of pressed-in piles. Rock Soil Mech. 24, 701–709. doi: 10.1142/S0252959903000104
Keywords: strata deformation monitoring, cavity expansion, penetration resistance, in-situ monitoring, field experiment
Citation: Ge Y, Chen J, Zhang P, Cao C, Le X, Ai J, Zhou P and Liang T (2022) A novel technique for seabed strata deformation in situ monitoring. Front. Mar. Sci. 9:987319. doi: 10.3389/fmars.2022.987319
Received: 06 July 2022; Accepted: 12 September 2022;
Published: 29 September 2022.
Edited by:
Juan Jose Munoz-Perez, University of Cádiz, SpainReviewed by:
Polina Lemenkova, Université libre de Bruxelles, BelgiumYangting Liu, Ministry of Natural Resources, China
Copyright © 2022 Ge, Chen, Zhang, Cao, Le, Ai, Zhou and Liang. This is an open-access article distributed under the terms of the Creative Commons Attribution License (CC BY). The use, distribution or reproduction in other forums is permitted, provided the original author(s) and the copyright owner(s) are credited and that the original publication in this journal is cited, in accordance with accepted academic practice. No use, distribution or reproduction is permitted which does not comply with these terms.
*Correspondence: Jiawang Chen, YXJ3YW5nQHpqdS5lZHUuY24=