Abstract
Semicarbazide (SMC), also known as carbamoyl hydrazide, is a key intermediate for the organic synthesis of drugs, pesticides, and a panoply of other applications. It is also regarded as a landmark metabolite of nitrofurazone, a banned veterinary drug. SMC produced in different ways will eventually enter the ocean and become an emerging marine pollutant, affecting the physiological metabolism, behavioral activities, and even survival of aquatic organisms. Sea cucumbers are sediment-feeding organisms, and their risk of exposure to pollutants has attracted increasing attention. In this study, an integrated proteomic and metabolomic approach was used to investigate the responses of Apostichopus japonicus treated with SMC (3.72 g/L) for 72 h. After SMC treatment, the proteins and metabolites of A. japonicus intestine changed significantly. The results showed that 342 differentially expressed proteins were identified, of which 174 were upregulated, 168 were downregulated, and 74 differentially expressed metabolites, of which 62 were upregulated and 12 were downregulated. These differential proteins and metabolites were primarily involved in energy metabolism, lipid metabolism, signal transduction, immune regulation, autophagy, and apoptosis. On the basis of a combination of proteomic and metabolomic data, a hypothetical network of proteins, metabolites, and pathways in sea cucumbers was also described; the resulting network indicated several significant biological activities in response to SMC. This work offers a thorough analysis of the intricate mechanisms by which sea cucumbers respond to SMC stress and indicates numerous possible indicators for further research on creatures exposed to SMC. Further, our results provide scientific guidance for pollution control of Apostichopus japonicus culture to ensure healthy breeding.
Introduction
Semicarbazide (SMC) is a highly water-soluble compound [100.0 g/L (20°C)] that is mainly derived from azodicarbonamide’s thermal decomposition and nitrofurazone’s breakdown (Tarek et al., 1987; Maingot et al., 2013; Raja et al., 2017). The chemical structure of SMC is very stable, which facilitates its persistence in the environment (Dhandapani et al., 2014). At present, SMC accumulates in aquatic organisms as a new type of water environmental pollutant. According to earlier research, SMC caused male zebrafish (Danio rerio) to had lower plasma estrogen levels, thus demonstrating the stress of SMC on the nervous system (Yu et al., 2017). Additionally, a study revealed that SMC can change the morphological structures of important tissues and organs in Sprague-Dawley rats and that it has a certain degree of influence on the male and female reproductive system (Maranghi et al., 2009). Yue et al. (2017) demonstrated that SMC had an endocrine disrupting effect on the thyroid of Paralichthys olivaceus. SMC also interfered with neural signaling by antagonizing N-methyl-D-aspartate receptors (NMDARs) and inhibiting glutamate decarboxylase (GAD) (Santos et al., 2008). According to these results, SMC caused specific stress in aquatic creatures.
Apostichopus japonicus is a sediment-feeding organism that inhabits the shallow temperate coasts of the Pacific Northwest (Zhao et al., 2016). In China, it is an economically important food species, and sea cucumber culture has become an important part of the marine aquaculture industry (Xue et al., 2015). Due to the economic importance and ecological value of A. japonicus, research on the stress of sea cucumbers by marine pollutants has received increasing attention. In previous research, it was found that SMC was widely distributed in aquatic ecosystems, and the concentration of this compound in A. japonicus was very high (Zhao et al., 2016). However, no studies have focused on the stress response of A. japonicus to SMC or on its underlying molecular mechanisms.
The omics method in systems biology is a technology based on high-throughput analysis and includes transcriptomics, proteomics, and metabolomics. These methods can be used to analyze organisms’ responses to changes in their environment; in particular, the methods can provide richer transcript, protein, and metabolite level information for biological stress studies, thereby revealing biological stress responses to pollutants (Wu et al., 2013; Rossi et al., 2018; Sun et al., 2021). Proteomics involves the study of proteins, and it can identify significant differences between pollutant stress conditions and control conditions (Sun et al., 2016; Yu et al., 2016; Ji et al., 2019). This allows understanding of the complexity of cell functions and provides a direct explanation for the stress response of organisms following exposure to pollution. Metabolomics can accurately track the changes of metabolites in cells, tissues, and biological fluids (Zhao and Lin, 2014). Numerous metabolomic studies have been conducted to examine an organism’s stress response to toxic compounds (Ji et al., 2015; Yang et al., 2018; Cao et al., 2021). The production and metabolism of metabolites are the final results of a series of regulatory events, and the functional changes caused by the proteome will be amplified at the metabolic level. Combining proteomics and metabolomics can help us better understand the biological impacts of stresses on organisms since they both have the ability to quantify the disruption of proteins and metabolites engaged in the same metabolic pathway. (Ji et al., 2020). Therefore, in this study, isobaric relative and absolute quantification (iTRAQ) and liquid chromatography-tandem mass spectrometry (LC-MS/MS) were adopted to study the proteome and metabolome of A. japonicus after treatment with SMC in order to analyze the protein and metabolic changes, determine the molecular events and pathways that may be related to SMC stress, and ultimately decipher the relevant molecular and metabolic response mechanisms.
Materials and methods
Animals and SMC treatment
Forty A. japonicus (weight 100 ± 18 g) used in this experiment were obtained from Penglai Anyuan Aquatic Products Co., Ltd (Shandong Province, China). and were adapted for 10 days in the laboratory (18–20°C). After adapting to the environment, A. japonicus were divided into a control group (n = 20) and an SMC exposure group (n = 20). For treatment, 0.322 L of SMC hydrochloride solution (350 g/L) was added to the exposure group to control the concentration of SMC hydrochloride per tank to 3.72 g/L (LC50). The same amount of blank sea water was added to each tank of the control group. After 72 h of exposure, at least 15 A. japonicus were taken from each group, and their intestines were sampled, quickly frozen in liquid nitrogen, and then kept at −80°C until subsequent experiments. For proteomics analysis, three sets of biological replicates were performed in each group (the control groups were C1, C2, and C3, and the treatment groups were T1, T2, and T3). For metabolomics analysis, 10 samples were used for each group (C1–C10 for the control groups and T1–T10 for the treatment groups).
iTRAQ-based proteomic analysis
Samples were extracted by the lysis buffer (4% (w/v) SDS, 100 mM Tris/HCl pH 7.6, 0.1 M DDT) lysis method to extract a protein, and the BCA method was used to quantify the protein. Each sample’s protein was extracted in the proper quantity, and trypsin digestion was carried out using the filter-aided proteome preparation (FASP) technique. Then, we used a C18 Cartridge to desalt the enzymatically hydrolyzed peptides, after which the peptides were freeze-dried. Then, 40 µL of dissolution buffer was added for reconstitution, and the peptides were quantified (OD280) using isobaric tags for relative and absolute quantification (iTRAQ) technology. According to the manufacturer’s protocol, 100 µg peptide samples were labeled using iTRAQ 8-plex reagent (AB SCIEX). The labeled peptides of each group were mixed and graded with AKTA Purifier 100. Each fractionation sample was separated by an HPLC liquid system (Easy nLC) with a nanoliter flow rate. The materials were separated by chromatography and then examined using a Q-Exactive mass spectrometer. Protein identification and quantitative analysis were performed using the software Mascot 2.2, and Proteome Discoverer 1.4. Blast2GO (Version 3.3.5) was used to annotate the target protein set with GO functions. The online Kyoto Encyclopedia of Genes and Genome (KEGG) database (http://geneontology.org) was employed for pathway annotation. The distribution of each GO classification or KEGG pathway in the target protein and the total protein sets were compared using Fisher’s exact test, and GO annotation or KEGG pathway annotation enrichment analysis was performed on the target protein set.
The quantitative data of the target protein collection was first adjusted (normalized to the (1, 1) interval) for protein hierarchical clustering analysis. Then, the two dimensions of the sample and protein expression were categorized simultaneously (distance algorithm: Euclidean, connection type: Average linkage) using the Complexheatmap R package (R Version 3.4), which also produced a hierarchical clustering heat map.
The protein interaction network analysis was based on the information in the IntAct (http://www.ebi.ac.uk/intact/main.xhtml) or STRING (http://string-db.org/) databases to identify the relationships between the target proteins. We identified the direct and indirect interaction linkages and generated and analyzed the interaction network using CytoScape software (version 3.2.1).
LC-MS/MS-based metabonomic analysis
The samples underwent full-spectrum analysis using HILIC UHPLC-Q-TOF MS technology and the data-dependent acquisition method to collect primary and secondary mass spectrometry data, and XCMS was utilized for peak extraction and metabolite identification. In short, each tissue sample (60 mg) was homogenized after being combined with 200 μL of ultrapure water. The sample was then mixed with 800 l methanol/acetonitrile (1:1, v/v) by eddy current, and then subjected to low-temperature ultrasonic treatment to induce precipitation. The protein precipitate was centrifuged at 13000 rpm for 15 minutes at 4°C after being incubated at −20°C for 1 hour. The supernatant was then collected for analysis. Throughout the analysis process, the sample was placed in an autosampler at 4°C. The sample was separated using an Agilent 1290 Infinity LC Ultra High Performance Liquid Chromatography (UHPLC) HILIC column; the column temperature was 25°C; the flow rate was 0.3 mL/min, and the injection volume was 2 µL. The mobile phase composition was A: water + 25 mM ammonium acetate + 25 mM ammonia; B: acetonitrile, and the gradient elution procedure was as follows: 0–1 min, 95% acetonitrile; 1–14 min, acetonitrile linearly decreasing from 95% to 65%; 14–16 min, acetonitrile linearly decreasing from 65% to 40%; 16–18 min, acetonitrile maintained at 40%; 18–18.1 min, acetonitrile linearly increasing from 40% to 95%; and 18.1–23 min, acetonitrile maintained at 95%. The QC samples were inserted in the sample queue for monitoring to evaluate the stability of the system and the reliability of the experimental data. Electrospray ionization (ESI) in both positive and negative ion modes was used to examine each sample. The samples were separated using UHPLC and analyzed on a Triple TOF 5600 mass spectrometer (AB SCIEX).
Peak alignment, retention time correction, and peak area extraction were performed using the XCMS program after the original data had been transformed by ProteoWizard to mzXML format. For metabolite structure identification, the laboratory’s self-built database was searched, and accurate mass matching (25 ppm) and secondary spectrum matching were utilized. We eliminated ion peaks from the XCMS data whose total was more than 2/3. Integration of the positive and negative ion peaks and application of SIMCA-P14.1 were used for pattern recognition. After the data were normalized and preprocessed, multi-dimensional statistical analysis was performed, including unsupervised principal component analysis (PCA), supervised partial least squares discriminant analysis (PLS-DA), and orthogonal partial least squares discriminant analysis (OPLS-DA). Single-dimensional statistical analysis included Student’s t-test. R software was used to draw a volcano map.
Results
Proteomic response of A. japonicus to SMC
iTRAQ quantitative proteomics technology was used to screen the differentially expressed proteins (DEPs) between the control group and the SMC treatment group. A total of 3953 proteins were identified in the SMC-treated and untreated control samples. The statistics of protein quantification results are displayed in the form of volcano plots (Figure 1). Differentially expressed proteins were screened according to the standard of expression fold change (FC) ≥ 1.2 (FC upregulation ≥ 1.2 or downregulation ≤ 0.83) and a p value < 0.05. Differential expression analysis showed that 342 proteins were significantly differentially expressed between the two groups. Among these, 168 proteins were downregulated and 174 proteins were upregulated. Full details of DEPs are presented in Table 1. In the GO enrichment analysis (Figure 2), dynactin complex was the most enriched cellular component, while the most enriched biological processes were nitrate assimilation, aminoglycan metabolic process, and nitrate metabolic process. The differentially expressed proteins were involved in molecular functions such as cation channel activity, oxygen carrier activity, molecular carrier activity, and oxygen binding. KEGG pathway enrichment analysis showed that DEPs were involved in glycerolipid metabolism, oxytocin signaling pathway, RNA degradation, myocardial contraction, and other important pathways (Figure 3).
Figure 1
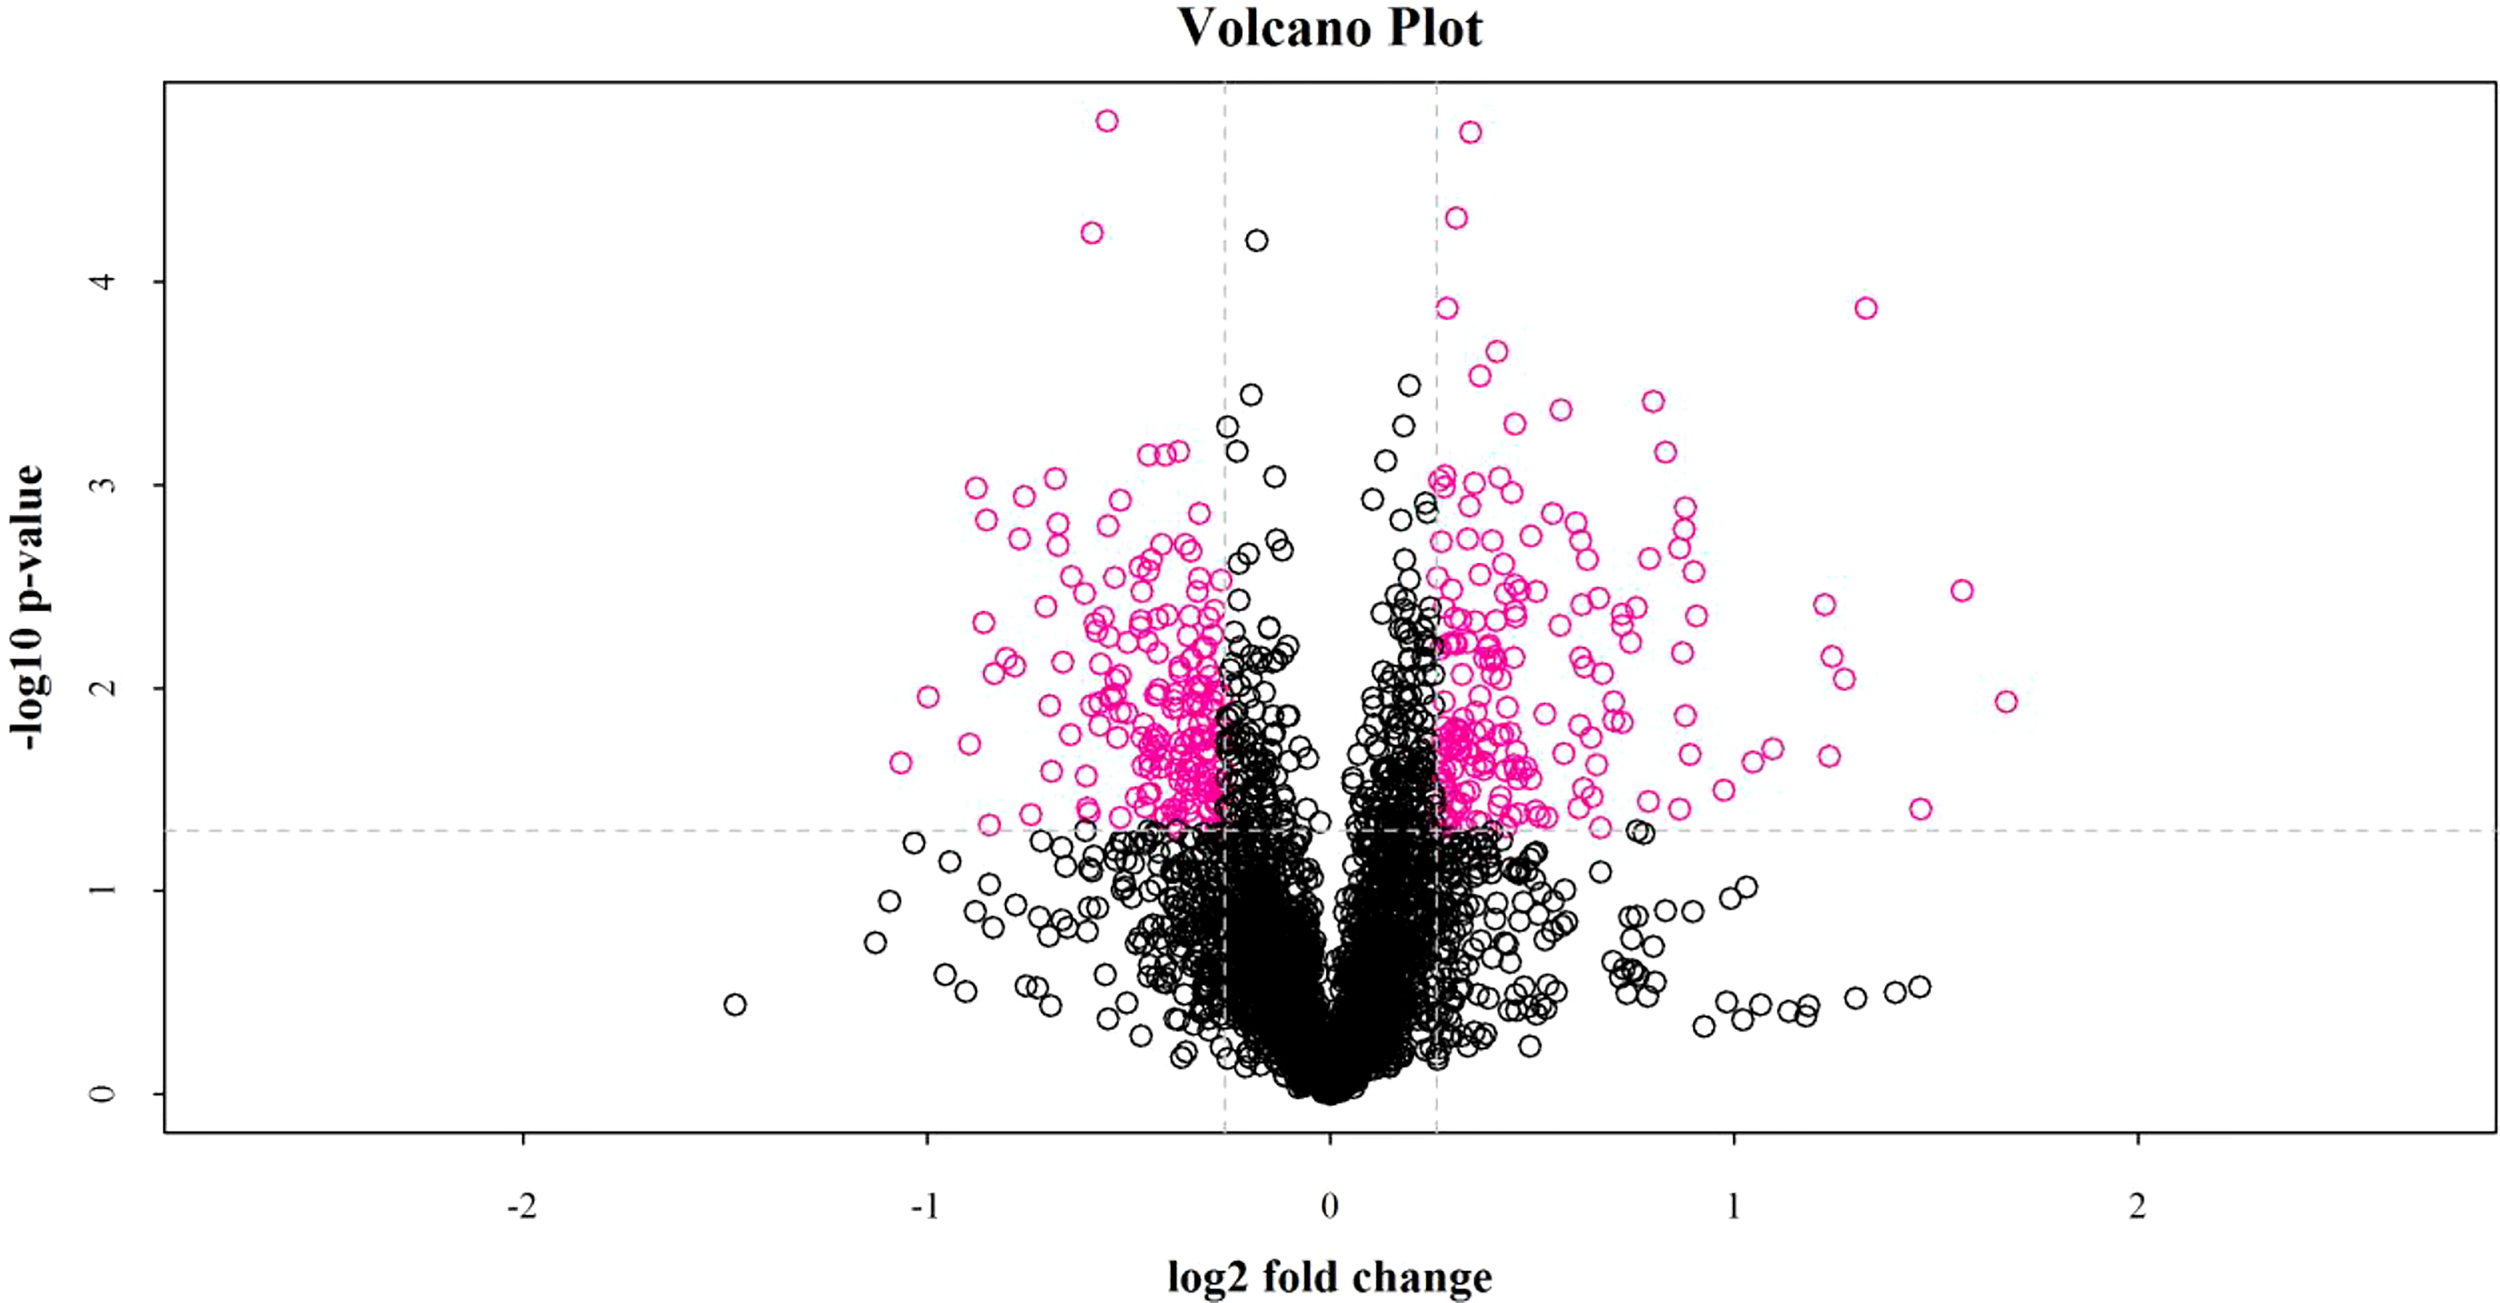
The fold change of protein expression between the two groups of samples and the p value obtained by the T test were used to draw a volcano plot to show the significant difference between the two groups of sample data. The abscissa is the difference fold (the logarithmic change with the base of 2), the ordinate is the significant p value of the difference (the logarithmic transformation with the base of 10), and the red dots in the figure are the significantly differentially expressed proteins, and the black dots are the proteins with no difference.
Table 1
| Protein accession | Protein description | Fold change | P value |
|---|---|---|---|
| Energy metabolism | |||
| A0A2G8KBU0 | Cytochrome c oxidase subunit | 0.7494 | 0.0433 |
| C3W4X1 | Cytochrome c oxidase subunit 2 | 0.7377 | 0.0179 |
| A0A2G8LGC5 | NADH dehydrogenase | 0.7162 | 0.0346 |
| A0A2G8JQD0 | Isocitrate dehydrogenase [NAD] subunit, mitochondrial | 0.6673 | 0.0048 |
| A0A2G8K9N8 | Ubiquinone biosynthesis monooxygenase COQ6, mitochondrial | 0.7849 | 0.0369 |
| A0A2G8K5R8 | 2-oxoisovalerate dehydrogenase subunit alpha | 0.6824 | 0.0016 |
| A0A2G8L542 | Delta-1-pyrroline-5-carboxylate dehydrogenase, mitochondrial | 0.7823 | 0.0123 |
| A0A2G8K828 | Short/branched chain specific acyl-CoA dehydrogenase, mitochondrial | 0.7703 | 0.0125 |
| A0A2G8L6B2 | Dihydropyrimidine dehydrogenase [NADP(+)] | 0.5379 | 0.0189 |
| Lipid metabolism | |||
| A0A2G8KP95 | Glycerate kinase | 1.3162 | 0.0255 |
| A0A2G8LRB2 | Phosphoinositide phospholipase C | 1.3402 | 0.0061 |
| A0A2G8JB67 | Tyrosine-protein phosphatase corkscrew | 1.5709 | 0.0042 |
| A0A2G8LQV1 | Receptor-type tyrosine-protein phosphatase T isoform X2 | 0.7903 | 0.0174 |
| A0A2G8L4V5 | Phosphatidate phosphatase LPIN2 | 0.7646 | 0.0116 |
| A0A2G8JP51 | Lipid phosphate phosphohydrolase 3 | 0.7231 | 0.0174 |
| A0A2G8JXM3 | Glycerol-3-phosphate acyltransferase 1 | 0.5009 | 0.0110 |
| Signal Transduction | |||
| A0A2G8L6K5 | Tyrosine-protein phosphatase corkscrew | 1.4066 | 0.0194 |
| A0A2G8KYA0 | Non-specific serine/threonine protein kinase | 1.4143 | 0.0010 |
| A0A2G8JHD5 | ATP-binding cassette sub-family D member 3 isoform X2 | 1.4478 | 0.0147 |
| A0A142DS44 | Heat shock factor binding protein 1 | 1.3162 | 0.0423 |
| P21251 | Calmodulin | 0.8118 | 0.0402 |
| A0A2G8L0R0 | Myosin light chain kinase | 0.7915 | 0.0100 |
| A0A2G8L782 | Ryanodine receptor 2 | 0.7420 | 0.0193 |
| H2ETN1 | Epidermal growth factor receptor | 0.6558 | 0.0034 |
| A0A2G8LH01 | Low-density lipoprotein receptor-related protein 2 | 0.7867 | 0.0021 |
| A0A2G8K3G5 | Anthrax toxin receptor 1 | 0.7452 | 0.0101 |
| A0A2G8JYN2 | Tubulointerstitial nephritis antigen-like | 0.7210 | 0.0050 |
| A0A2G8LIX4 | Scavenger receptor cysteine-rich domain-containing group B protein | 0.7399 | 0.0205 |
| A0A2G8JTD8 | Trimeric intracellular cation channel type A | 0.6831 | 0.0056 |
| A0A2G8LG86 | Acid-sensing ion channel 1-like | 0.7327 | 0.0228 |
| A0A2G8JV85 | Apolipophorins-like | 0.6267 | 0.0015 |
| A0A2G8LEG7 | Sideroflexin-2 | 0.6809 | 0.0000 |
| A0A2G8KBS9 | V-type proton ATPase subunit a | 0.7720 | 0.0184 |
| A0A2G8LDD9 | Inactive tyrosine-protein kinase 7 | 0.7242 | 0.0239 |
| A0A2G8L0Y9 | Eukaryotic elongation factor 2 kinase-like | 0.5613 | 0.0084 |
| A0A2G8LHE4 | Leucine carboxyl methyltransferase 1 | 0.6915 | 0.0107 |
| Oxidative stress and immunity | |||
| A0A2G8LIZ2 | Heat shock protein 70 | 2.3528 | 0.0215 |
| A0A2G8JND6 | Retinol dehydrogenase 8 | 2.9528 | 0.0033 |
| F1JTA0 | Complement factor B | 1.2210 | 0.0435 |
| A0A2G8KPN5 | Superoxide dismutase [Cu-Zn] | 0.6392 | 0.0170 |
| A0A2G8LQQ1 | Cystathionine gamma-lyase | 0.8313 | 0.0250 |
| Autophagy and apoptosis | |||
| A0A1C9UNC6 | Caspase-6 | 1.6578 | 0.0271 |
| A0A2G8KUS1 | Poly [ADP-ribose] polymerase | 1.4631 | 0.0014 |
| A0A2G8L795 | Poly(ADP-ribose) polymerase pme-5 isoform X2 | 1.4086 | 0.0018 |
| A0A2G8K567 | Vacuolar protein sorting-associated protein 13A-like | 0.8330 | 0.0159 |
| A0A2G8KR16 | Cathepsin L | 0.7963 | 0.0097 |
| A0A2G8KM37 | Cathepsin D | 0.7532 | 0.0424 |
| A0A2G8JRR0 | Cathepsin B | 0.5860 | 0.0018 |
| Other functions | |||
| A0A2G8JUX8 | Ste20-like protein kinase | 1.3226 | 0.0070 |
| A0A2G8JYA3 | Pollen-specific leucine-rich repeat extensin-like protein 1 | 1.3198 | 0.0085 |
| A0A2G8JWD2 | Transmembrane protein | 1.3184 | 0.0019 |
| A0A2G8LMJ9 | Neuroblast differentiation-associate d protein AHNAK | 1.3150 | 0.0073 |
| A0A2G8JX38 | B-cell receptor-associated protein 31 | 1.3128 | 0.0062 |
| A0A2G8JVJ5 | Voltage-dependent calcium channel subunit alpha-2/delta-3 isoform X1 | 1.3080 | 0.0063 |
| A0A2G8KQP7 | Alpha-crystallin B chain-like isoform X2 | 1.5840 | 0.0036 |
| A0A2G8JEW3 | Secreted protein | 1.5791 | 0.0238 |
| A0A2G8KSR7 | Adipocyte plasma membrane-associated protein-like | 1.4823 | 0.0049 |
| A0A2G8LH06 | IgGFc-binding protein | 1.4491 | 0.0433 |
| A0A2G8KSK3 | Heterogeneous nuclear ribonucleoprotein U-like protein 1 isoform X2 | 1.4209 | 0.0402 |
| A0A2G8JHQ8 | Eukaryotic peptide chain release factor GTP-binding subunit ERF3A | 1.3794 | 0.0415 |
| A0A2G8JJ17 | Serine/threonine-protein kinase 25 isoform X4 | 1.3758 | 0.0206 |
| A0A2G8K113 | Protein kinase C | 1.3392 | 0.0090 |
| A0A2G8K7H6 | Ran-binding protein 3 | 1.3335 | 0.0378 |
| A0A2G8KF70 | Non-specific serine/threonine protein kinase | 1.3288 | 0.0073 |
| A0A2G8K8A8 | Rregulator of chromatin subfamily A member 5 isoform X4 | 1.3027 | 0.0160 |
| A0A2G8KZ85 | YTH domain-containing family protein 3 | 1.3015 | 0.0236 |
| A0A2G8LP15 | E3 ubiquitin-protein ligase UBR4 isoform X5 | 1.2998 | 0.0231 |
| A0A2G8JLN5 | Heterogeneous nuclear ribonucleoprotein A1-like 3 | 1.2922 | 0.0110 |
| A0A2G8JZF1 | Putative UPF0505 protein C16orf62 | 1.2918 | 0.0003 |
| A0A2G8JYR6 | Putative ras-related GTP-binding protein A-like | 1.2843 | 0.0130 |
| A0A2G8JBN0 | Eukaryotic translation initiation factor 1A, X-chromosomal | 1.2825 | 0.0166 |
| A0A2G8LDC9 | Cysteine sulfinic acid decarboxylase | 1.2823 | 0.0244 |
| A0A2G8JW91 | Kinesin-like protein | 1.2698 | 0.0013 |
| A0A2G8LI32 | Putative enhancer of mRNA-decapping protein 4 | 1.2573 | 0.0329 |
| A0A2G8LGG8 | Acid-sensing ion channel 1-like | 0.8187 | 0.0276 |
| A0A2G8K2J1 | Peptidylprolyl isomerase | 0.8182 | 0.0126 |
| A0A2G8JPU5 | Carbohydrate sulfotransferase 1-like | 0.8134 | 0.0488 |
| A0A2G8K131 | Dynamin-1-like protein isoform X2 | 0.8111 | 0.0045 |
| A0A2G8KLQ0 | Peptidylprolyl isomerase | 0.8090 | 0.0079 |
| A0A2G8LLQ5 | Vesicle-associated membrane protein 7 isoform X2 | 0.8072 | 0.0326 |
| A0A2G8LPE6 | COP9 signalosome complex subunit 4 | 0.8041 | 0.0287 |
| A0A2G8JTI2 | GRIP and coiled-coil domain-containing protein 2-like | 0.7840 | 0.0256 |
| A0A2G8JZV6 | Alcohol dehydrogenase | 0.7834 | 0.0151 |
| A0A2G8JBH7 | Lysosomal Pro-X carboxypeptidase | 0.7801 | 0.0250 |
| A0A2G8JGF7 | Dystrophin-like protein | 0.7788 | 0.0191 |
| A0A2G8KK99 | Maleylacetoacetate isomerase isoform X2 | 0.7716 | 0.0078 |
| A0A2G8L8B4 | Glutathione S-transferase theta-1 | 0.7223 | 0.0047 |
| A0A2G8L161 | Cell division cycle protein 23-like isoform X2 | 0.6912 | 0.0092 |
| A0A2G8KU36 | Quinone oxidoreductase PIG3 | 0.6867 | 0.0113 |
| A0A2G8LMT2 | C-1-tetrahydrofolate synthase, cytoplasmic-like | 0.6857 | 0.0109 |
| A0A2G8K4U6 | Alpha-ketoglutarate-dependent dioxygenase alkB-like 7, mitochondrial | 0.6774 | 0.0044 |
| A0A2G8JM08 | Sorbitol dehydrogenase isoform X1 | 0.6727 | 0.0118 |
| A0A2G8L9S6 | Mmall ubiquitin-related modifier 1-like | 0.6692 | 0.0052 |
| A0A2G8L0G9 | UPF0420 protein C16orf58-like isoform X2 | 0.6585 | 0.0390 |
| A0A2G8LMU2 | Pregnancy zone protein | 0.6412 | 0.0028 |
| A0A2G8L834 | DnaJ-like subfamily C member 3 | 0.7705 | 0.0007 |
| A0A2G8JX80 | Prolyl 4-hydroxylase subunit alpha-1 | 0.7699 | 0.0488 |
| C3S1H6 | Beta-actin | 0.7684 | 0.0395 |
| A0A2G8KY65 | GTP-binding protein SAR1b-like isoform X2 | 0.7634 | 0.0126 |
| A0A2G8JWN8 | RNA-binding protein with serine-rich domain 1 | 0.7619 | 0.0465 |
| A0A2G8LP79 | 40S ribosomal protein S5-like | 0.7614 | 0.0392 |
Details of differentially expressed proteins (DEPs) in A. japonicus in response to SMC treatment.
Figure 2
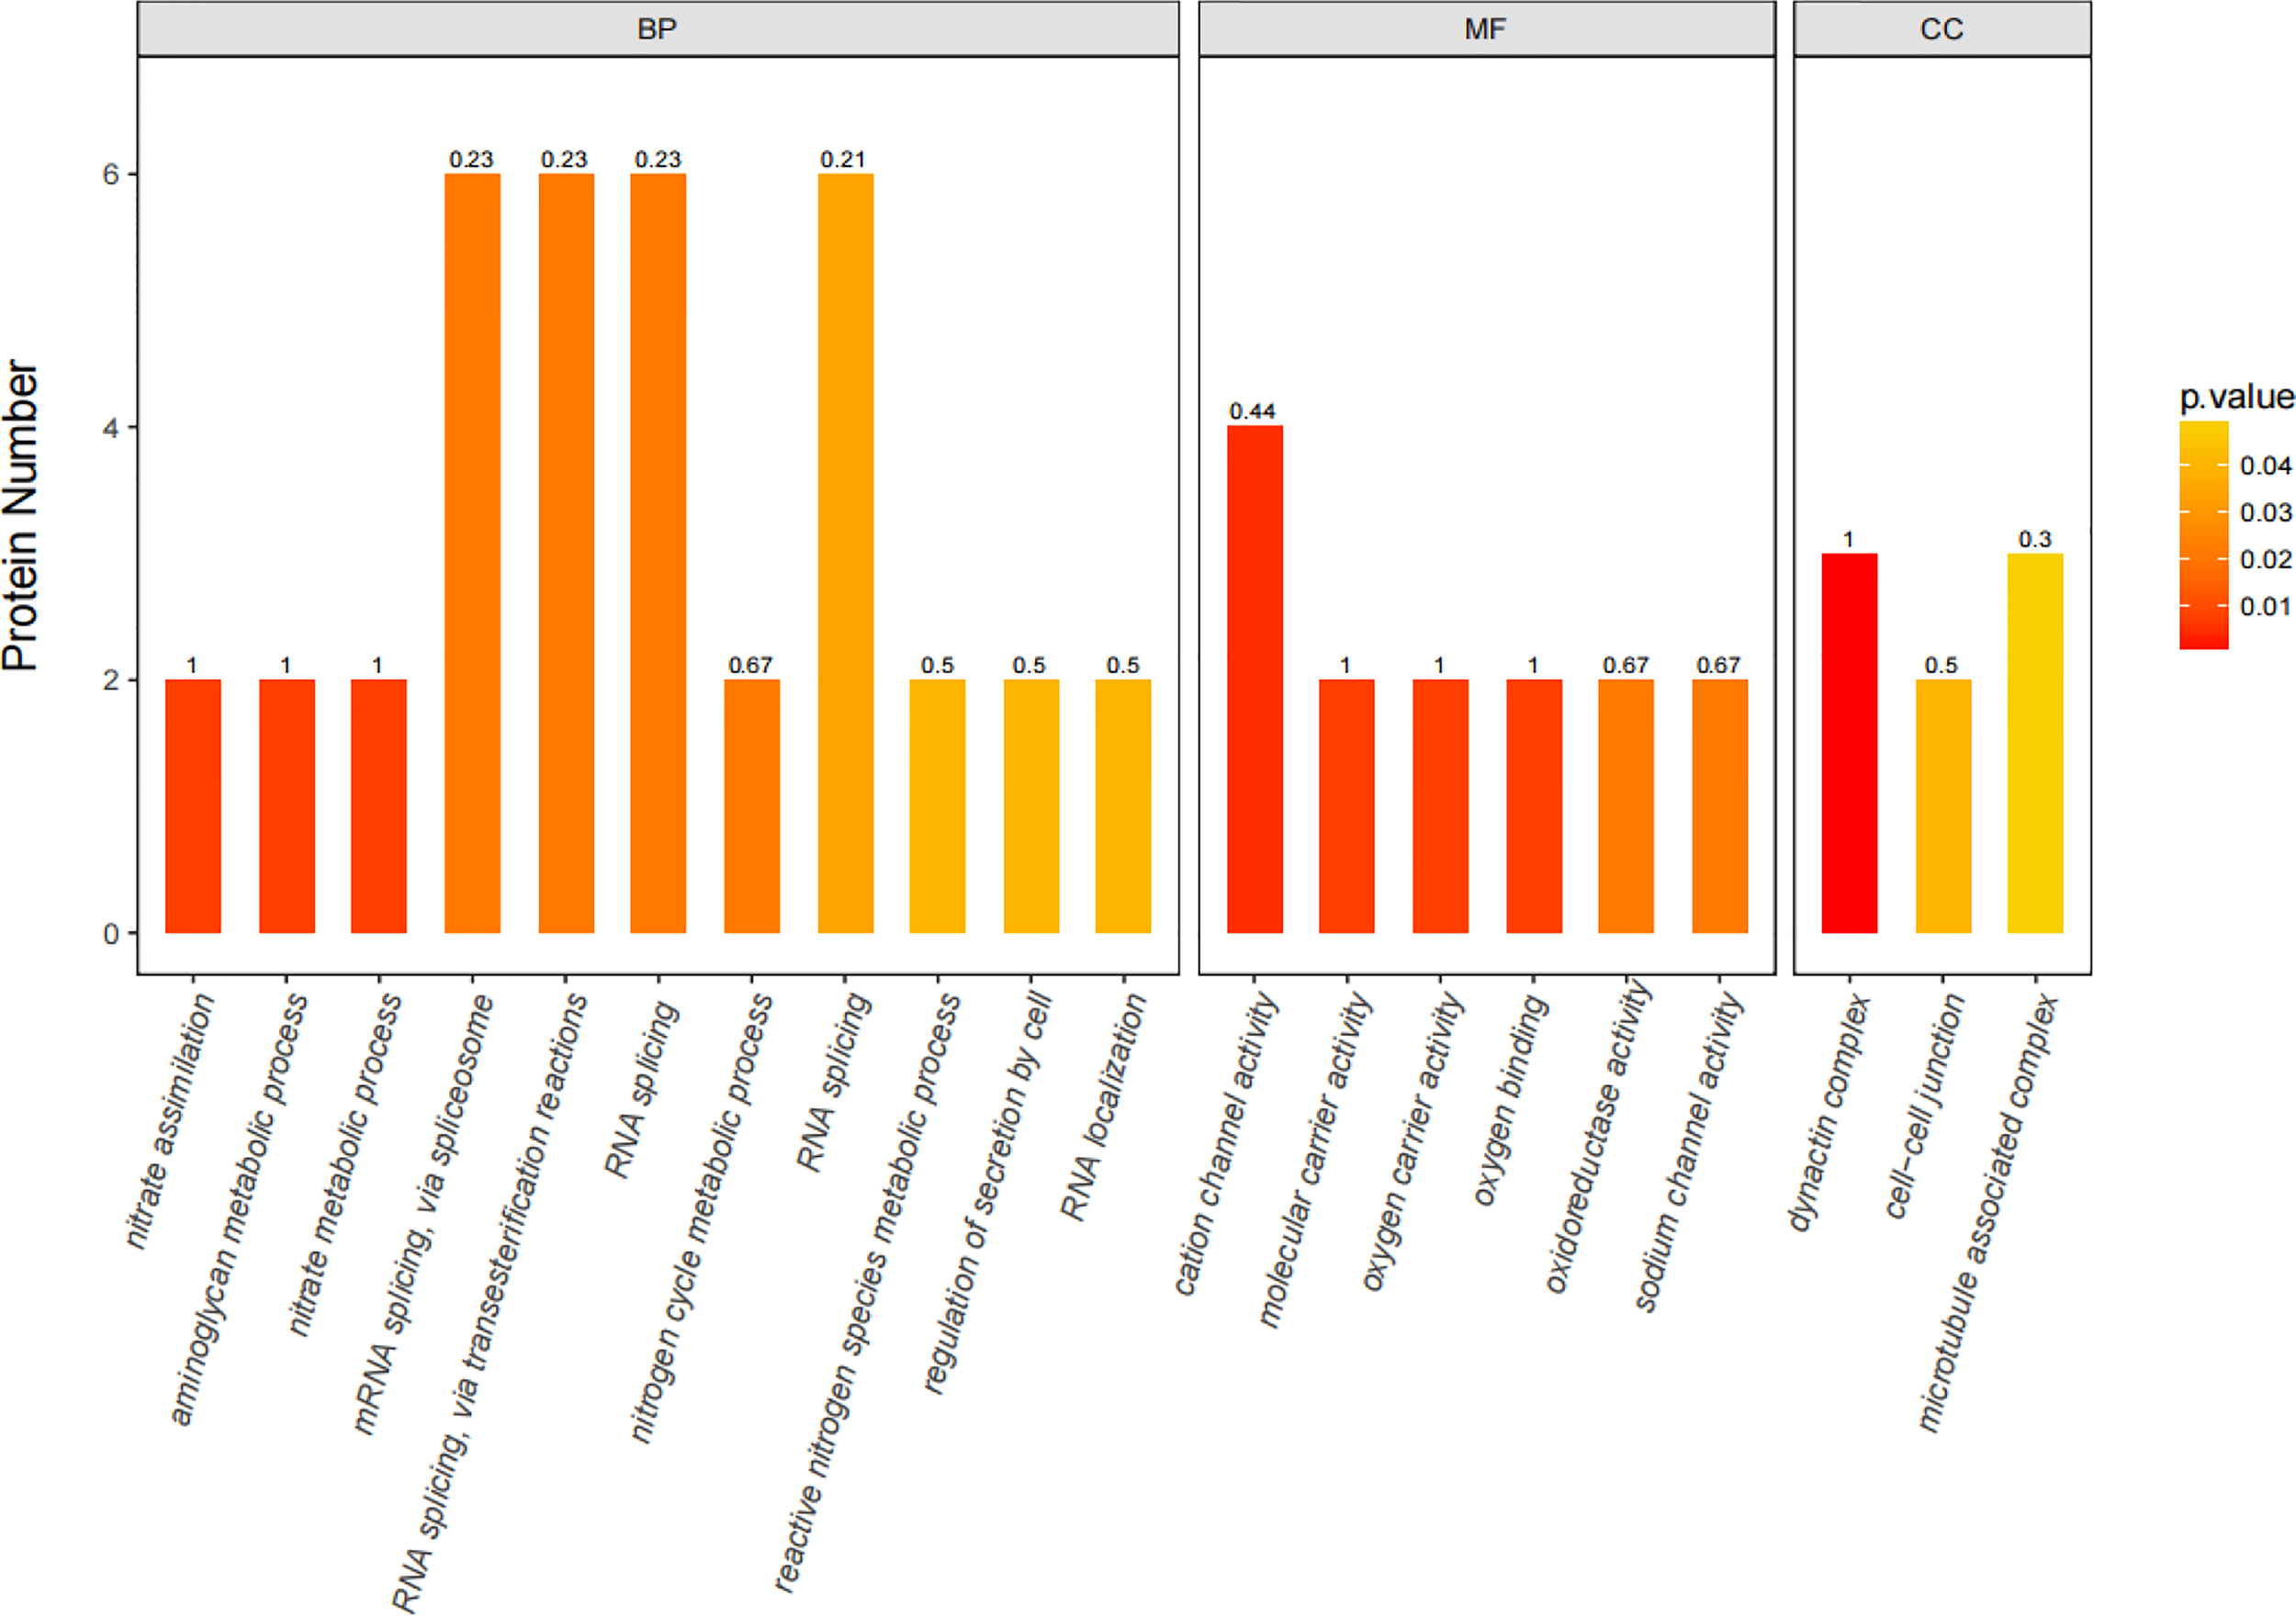
The 20 most significantly (p < 0.05) enriched GO terms based on differentially expressed proteins (DEPs) in SMC-treated sea cucumbers. GO enrichment for three ontologies (BP, biological process; MF, molecular function; CC, cellular component). The color bar shows the adjusted p-value calculated using Fisher’s exact test combined with Benjamini Hochberg’s correction. Rich Factor represents the ratio of the number of DEPs to the number of all annotated genes in this GO term, marked at the top of the bar graph.
Figure 3
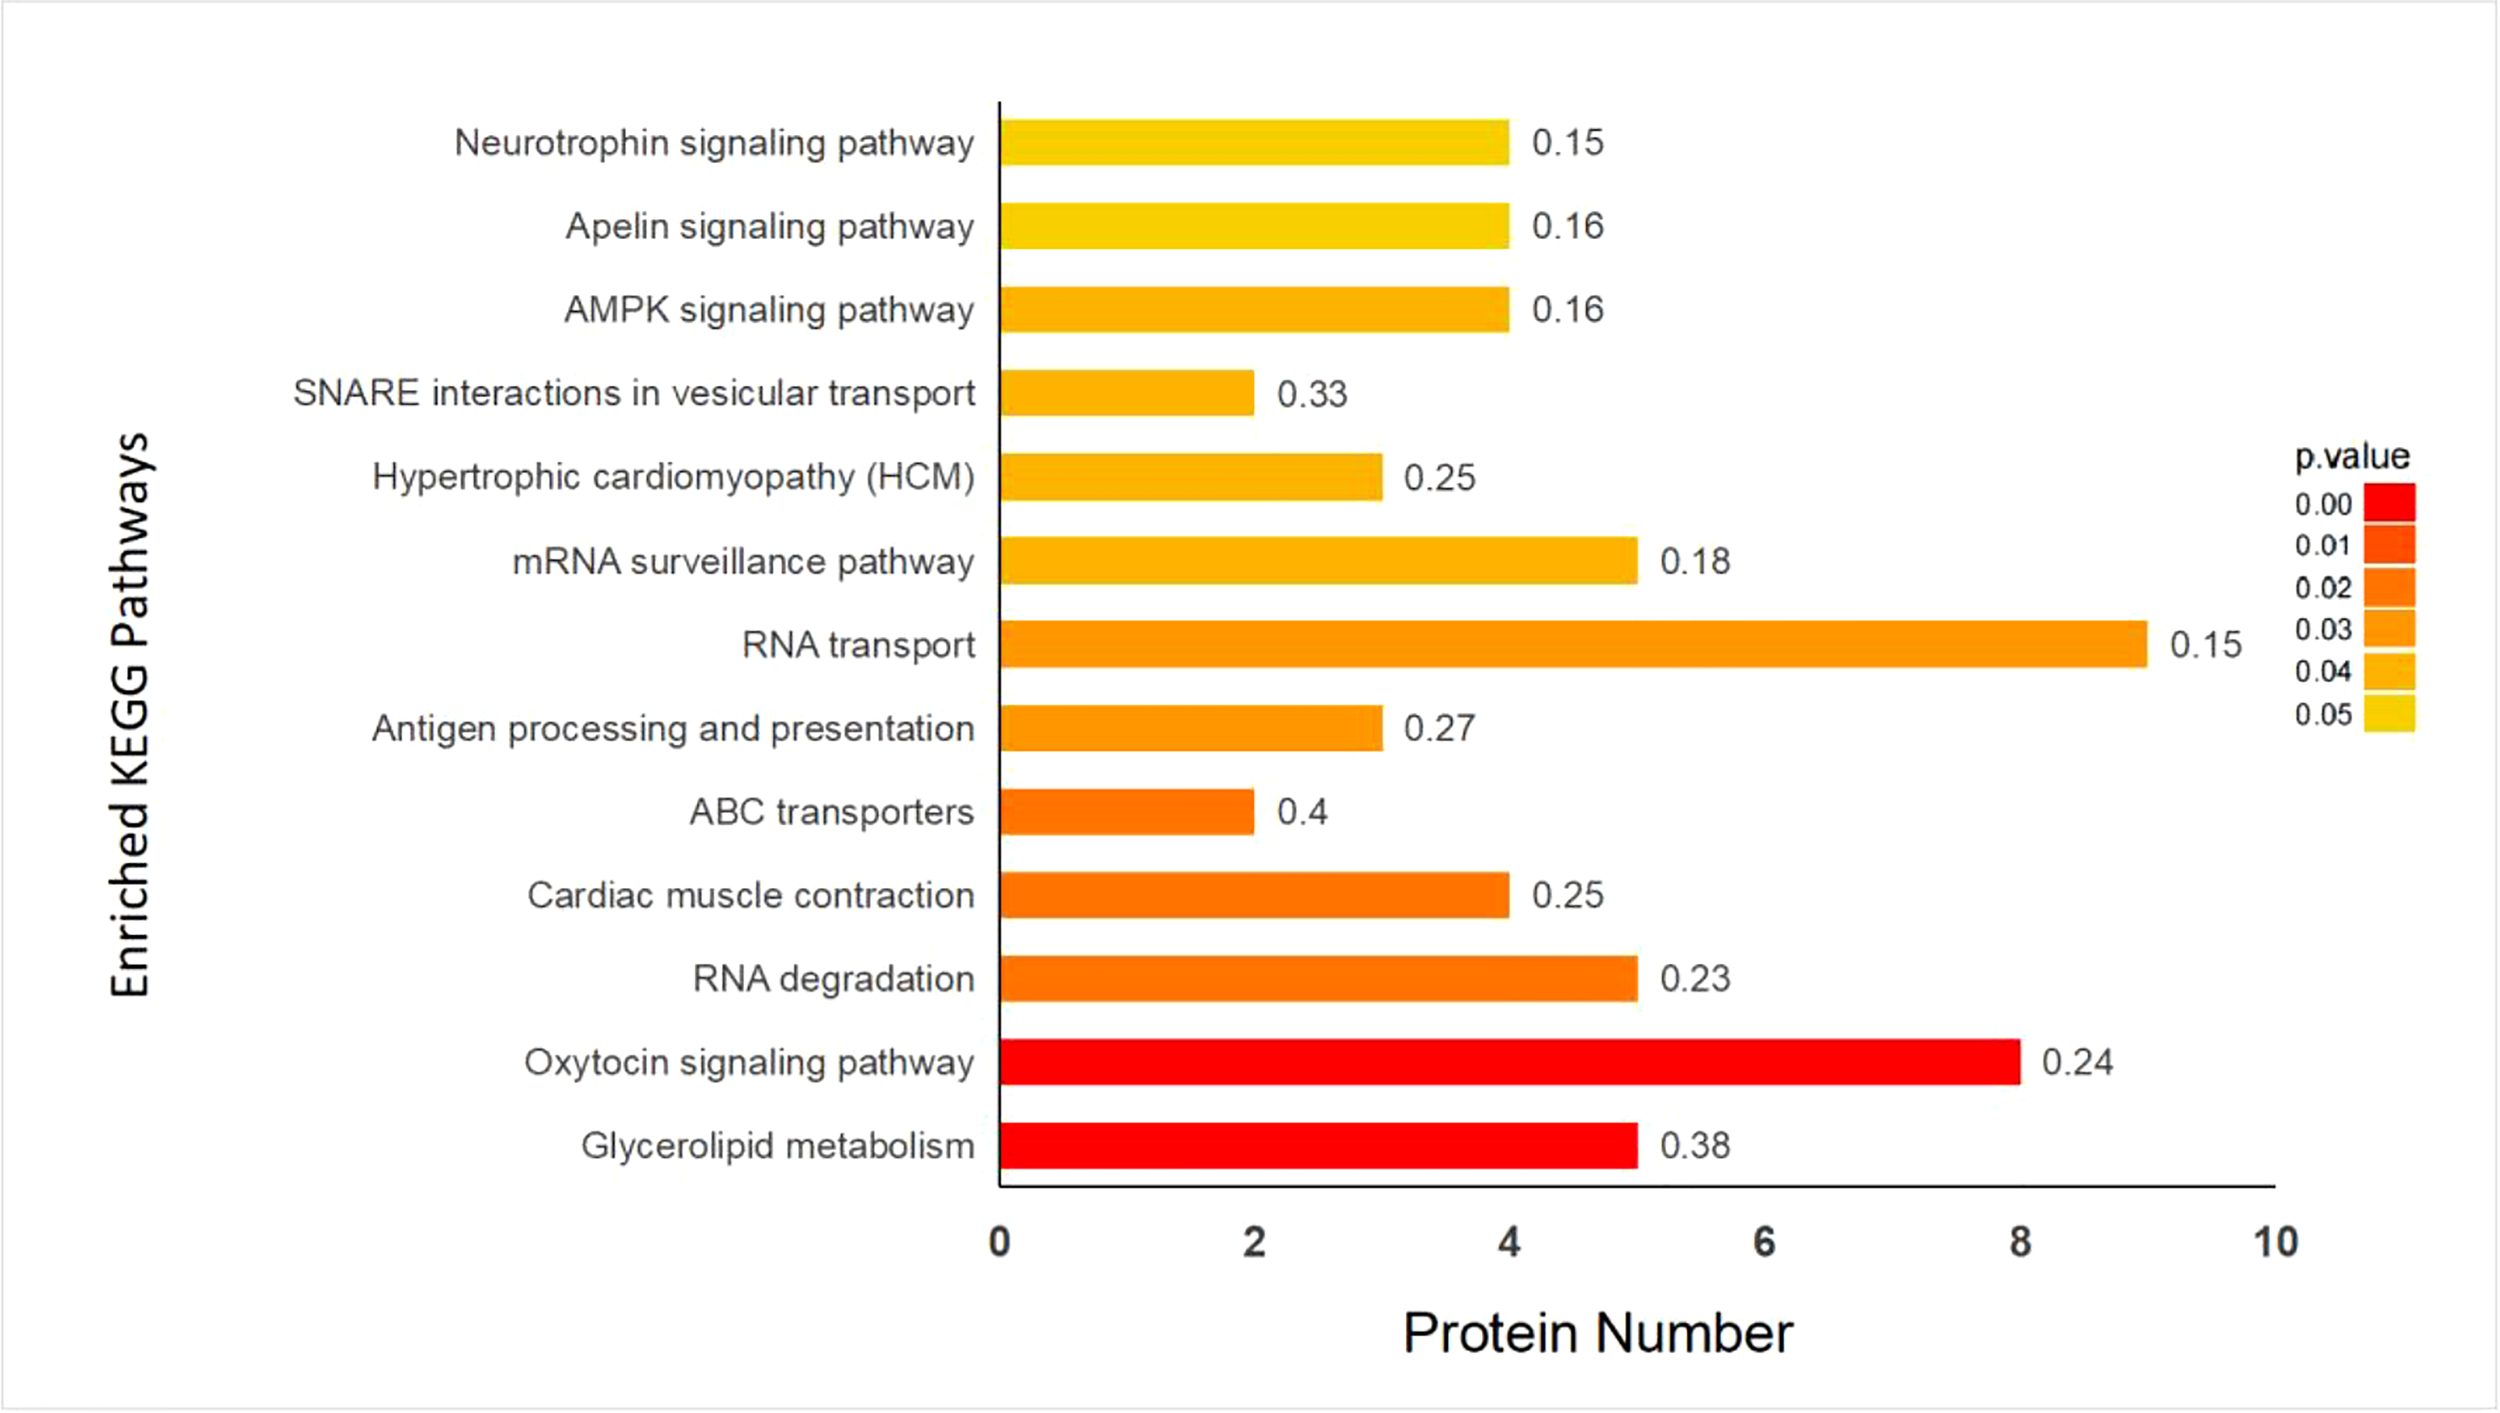
Enrichment analysis of KEGG pathway in control (C) and SMC-treated (T) group. The color bar displayed the corrected p-value, which was determined using the Fisher’s exact test and Benjamini-Hochberg adjustment. Rich Factor that means the ratio of the DEPs number and the number of all annotated genes in this KEGG pathway was labeled on the top of bar diagram.
Metabolic response of A. japonicus to SMC
Through the UPLC-Q-TOF-HDMS method, a total of 4450 ion signals were recorded in the positive ion mode, and 3916 ion signals were detected in the negative ion mode. Figure 4 shows the PCA score chart that represents the distributions between the control group and the treatment group in the positive and negative ion modes (Figures 4A, B). A clear separation between the control and treatment groups was observed, suggesting that SMC treatment significantly affected the metabolism of A. japonicus. As shown in Figure 5, the O-PLS-DA model demonstrated a significant (p < 0.05) metabolic difference between the control and SMC-treated groups, with Q2 values of 0.905 and 0.911 in the positive/negative ion mode, respectively (Figures 5A, B), indicating their robustness and reliability. According to the volcano plots (Figures 6A, B), there were significant differences in metabolites between the SMC-treated and control samples. In addition, high-resolution MS and MS/MS fragments and database analysis were used for metabolite identification. According to the above scheme, many different metabolites were identified; these are listed in Table 2, with VIP > 1.0 and p < 0.1 as the screening criteria. A total of 74 metabolites were identified in the SMC-treated A. japonicus samples, of which 62 were upregulated and 12 were downregulated. Several types of metabolites were identified, including amino acids (threonine, leucine, valine, tyrosine, aspartate, isoleucine), fatty acids (α-linolenic acid, stearic acid, oleic acid, palmitic acid), energy metabolites (inosine, phosphorylcholine), neurotransmitters (acetylcholine, dopamine), intermediates in the tricarboxylic acid cycle (succinic acid), and permeates (taurine). The pathways related to differential metabolites were identified via the KEGG pathway enrichment analysis. As shown in Figure 7, SMC treatment significantly affected a set of pathways in A. japonicus. Specifically, the ABC transporters, central carbon metabolism in cancer, protein digestion and absorption, aminoacyl-tRNA biosynthesis, and biosynthesis of unsaturated fatty acids were important pathways showing significant changes. According to these findings, A. japonicus was negatively affected by SMC stress, and several pathways were dysregulated.
Figure 4
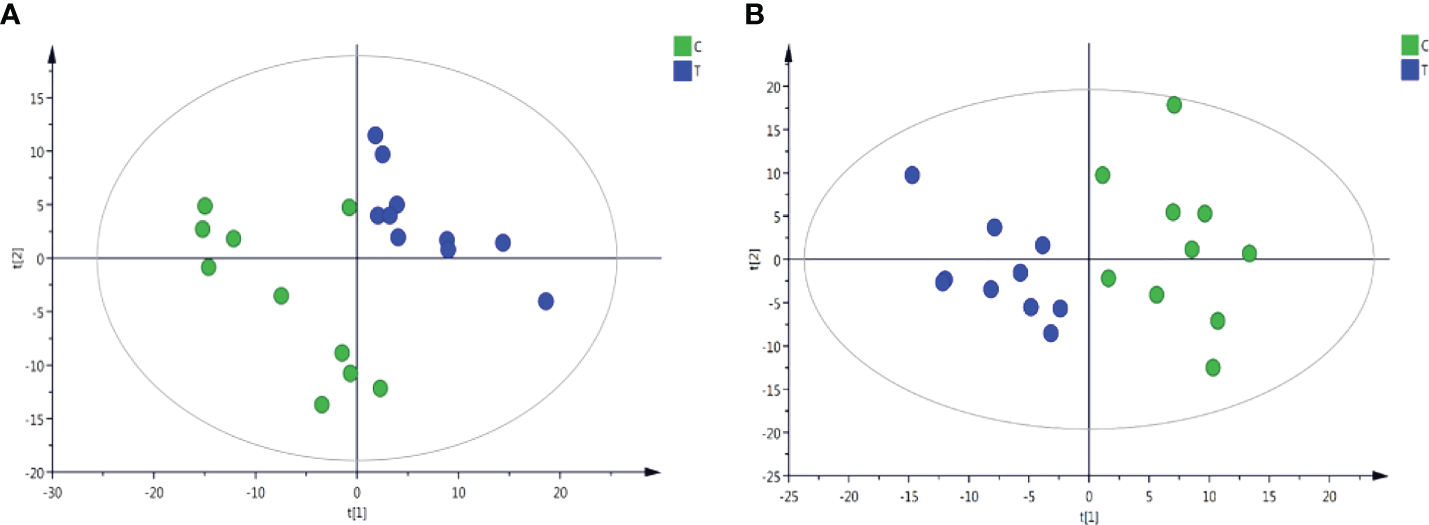
Plots of PCA scores of sea cucumber samples from control (C) and SMC-treated (T) samples in the positive and negative ion modes. (A), positive ion mode; (B), negative ion mode. t[1] represents the first principal component PC1, and t[2] represents the second principal component PC2.
Figure 5
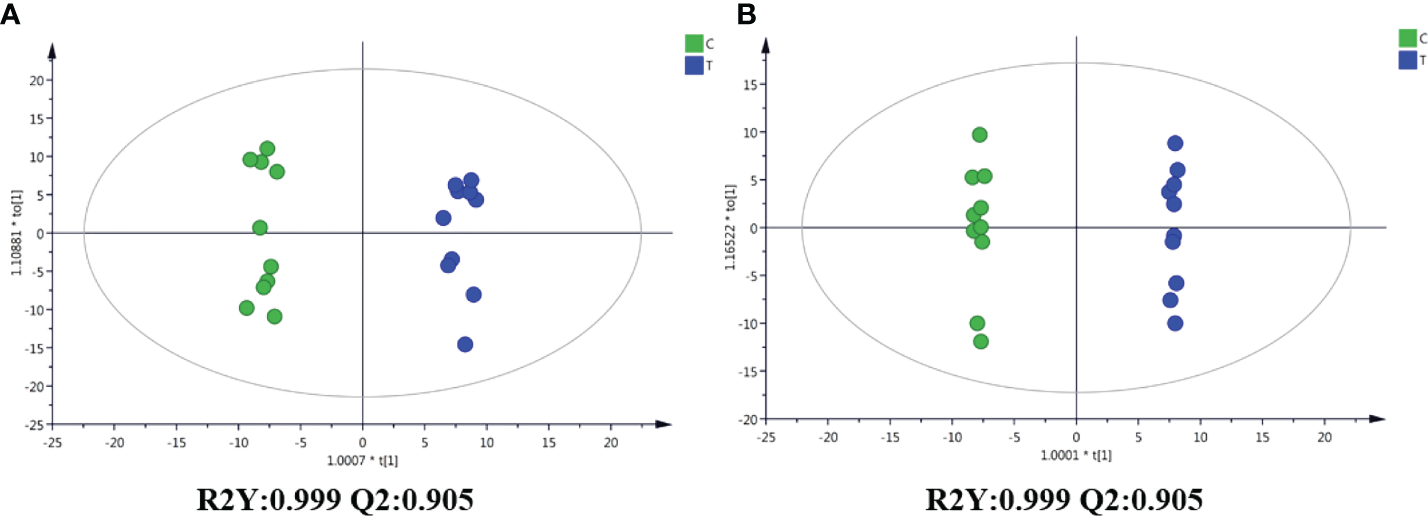
OPLS-DA score graphs of the control and SMC-treated (T) sea cucumber samples in the positive and negative ion modes. (A), positive ion mode; (B), negative ion mode.
Figure 6
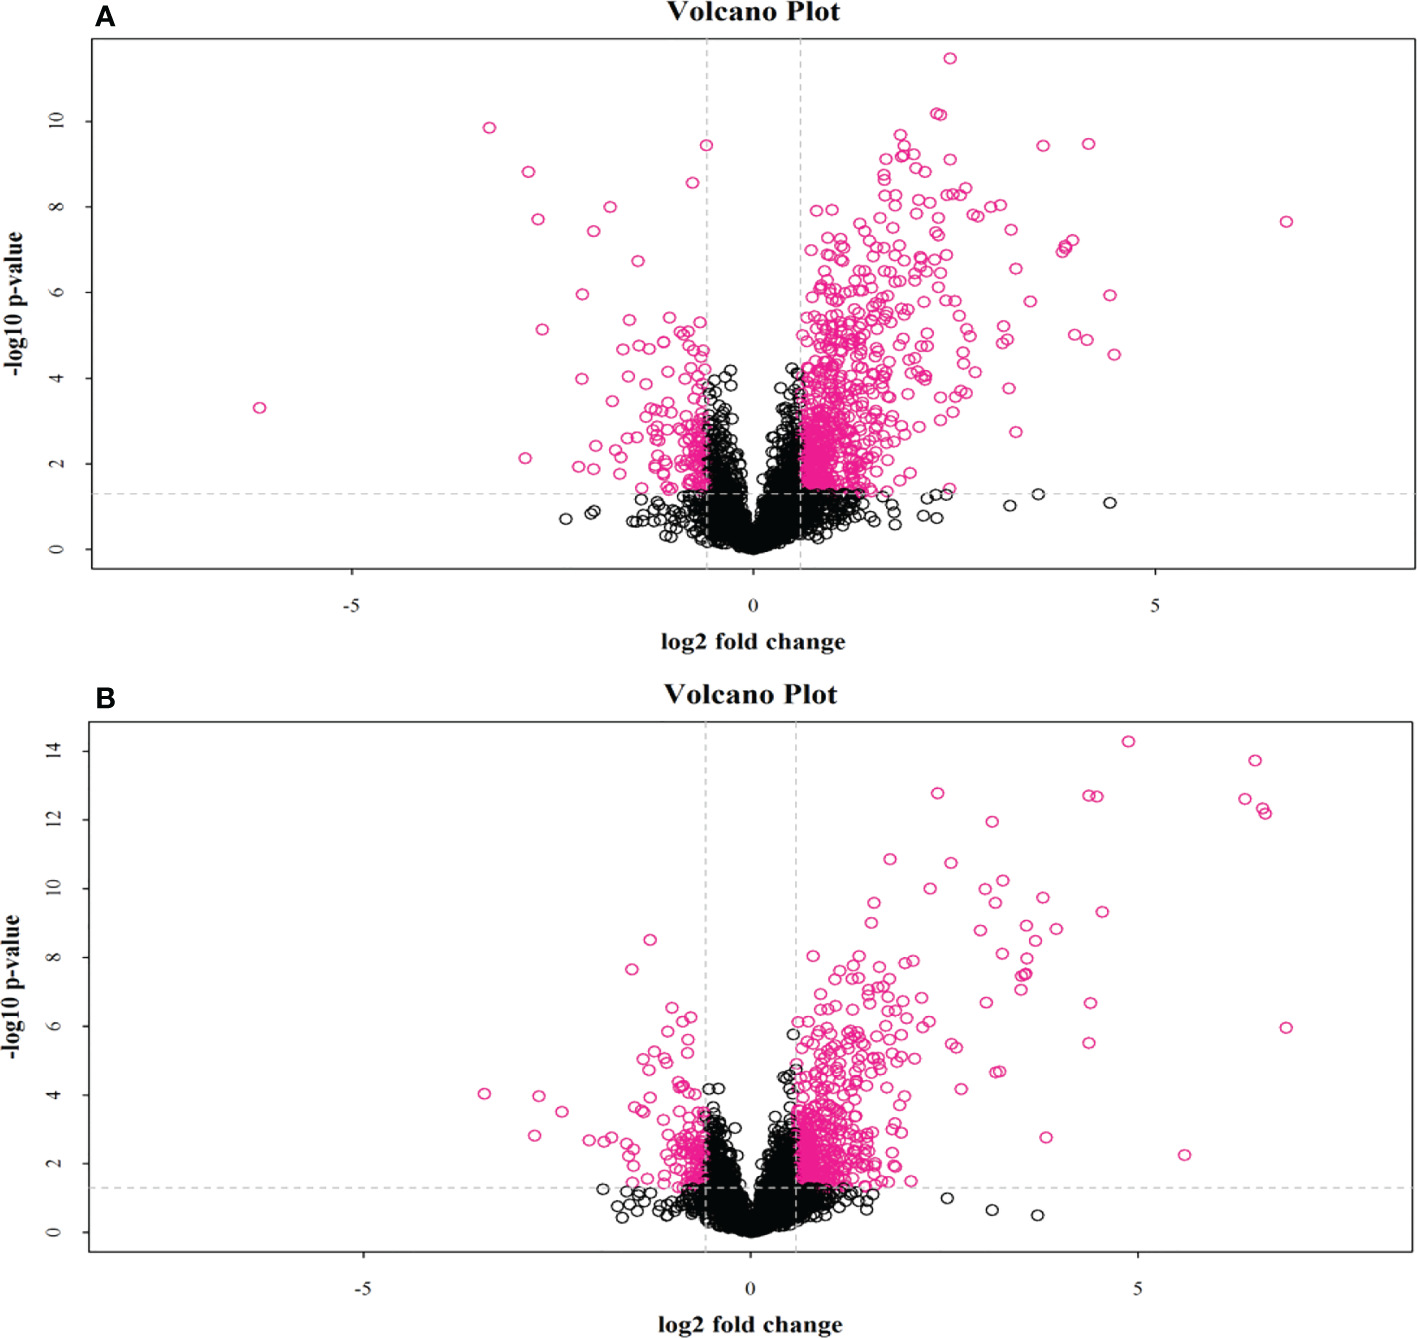
Volcano plot of positive and negative ion mode data. The red dots in the figure are metabolites with FC > 1.5 and P value < 0.05, (A), positive ion mode; (B), negative ion mode, i.e., the differential metabolites screened by univariate statistical analysis.
Table 2
| Metabolites accession | Metabolites description | Fold change | p-value |
|---|---|---|---|
| Amino acid | |||
| M132T462 | Leucine | 1.5732 | 0.0945878 |
| M118T649 | Threonine | 1.7212 | 6.86E-06 |
| M116T529 | Valine | 1.8550 | 5.70E-05 |
| M182T530 | Tyrosine | 1.9851 | 6.85E-05 |
| M148T717 | Glutamate | 0.7823 | 0.000511788 |
| M132T738 | Aspartate | 1.7356 | 0.000571896 |
| M130T455 | Isoleucine | 1.9345 | 0.001292413 |
| M383T717 | Cysteine | 3.8935 | 7.67E-05 |
| Fatty acid | |||
| M296T172 | alpha-Linolenic acid | 2.2786 | 0.00207822 |
| M362T68 | 20-Hydroxya ra-chidonic acid | 1.4313 | 0.0017793 |
| M281T69_2 | Oleic acid | 1.2823 | 0.001928974 |
| M241T72_2 | Pentadecanoic Acid | 1.5202 | 0.003739824 |
| M199T74 | Dodecanoic acid | 0.7745 | 0.016345587 |
| M157T77 | Pelargonic acid | 0.8345 | 0.017256928 |
| M297T76_3 | Nname,cis-9,10-Epoxystearic acid | 0.7534 | 0.070186037 |
| M301T69_2 | Eicosapentaenoic acid | 1.1745 | 0.094951041 |
| Energy metabolites | |||
| M258T699 | Glycerophosphocholine | 0.7378 | 0.09366439 |
| M506T324 | Phosphocholine | 1.4653 | 0.09979502 |
| M249T217 | Inosine | 5.4545 | 7.76E-10 |
| M117T703_2 | Succinate | 0.5976 | 2.69E-09 |
| Neurotransmitter | |||
| M146T305_2 | Acetylcholine | 1.4334 | 0.02043245 |
| M136T531 | Dopamine | 1.8745 | 3.11E-05 |
| Other metabolites | |||
| M232T396 | N1-Acetylspermidine | 12.7714 | 3.30E-09 |
| M251T217 | Inosine | 3.9781 | 1.45543E-08 |
| M162T740 | DL-2-Aminoadipic acid | 2.4934 | 1.71697E-08 |
| M300T216 | Phytosphingosine | 4.6020 | 1.4888E-07 |
| M298T151 | S-Methyl-5’-thioadenosine | 3.6522 | 3.56749E-07 |
| M250T164 | Adenosine | 3.1360 | 8.19256E-06 |
| M230T578 | Ergothioneine | 1.3756 | 3.28526E-05 |
| M428T262 | Stearoylcarnitine | 2.5642 | 4.19356E-05 |
| M152T387 | 2-Hydroxyadenine | 1.7713 | 0.000205599 |
| M130T717 | L-Pyroglutamic acid | 0.7200 | 0.000342016 |
| M379T40 | Vitamin D2 (Ergocalciferol) | 1.6052 | 0.001334576 |
| M137T306 | Hypoxanthine | 1.4872 | 0.00193461 |
| M360T300 | Sphingosine | 1.7989 | 0.002362769 |
| M102T717 | 1-Aminocyclopropanecarboxylic acid | 0.7462 | 0.002437015 |
| M317T77 | 15-Deoxy-delta-12,14-PGJ2 | 0.4993 | 0.00285459 |
| M869T82 | PC(20:5(5Z,8Z,11Z,14Z,17Z)/20:5(5Z,8Z,11Z,14Z,17Z)) | 0.7187 | 0.002878113 |
| M400T272 | L-Palmitoylcarnitine | 2.0490 | 0.003991729 |
| M104T416 | Choline | 1.3247 | 0.006405996 |
| M345T77_1 | Retinene | 0.5879 | 0.022496004 |
| M138T497 | Anthranilic acid (Vitamin L1) | 1.4820 | 0.031229 |
| M126T517_2 | Taurine | 1.1014 | 0.032144836 |
| M118T467_2 | Betaine | 1.0878 | 0.044871677 |
| M184T82 | Phosphorylcholine | 0.8147 | 0.055524807 |
| M554T315 | 1-O-Octadecyl-sn-glyceryl-3-phosphorylcholine | 1.8648 | 0.063942809 |
| M237T66_2 | Phe-Ala | 2.1471 | 0.072509611 |
| M204T538 | Acetylcarnitine | 1.1321 | 0.082245277 |
| M123T109 | Nicotinamide | 0.8443 | 0.097966808 |
| M189T76_1 | Val-Ala | 2.0813 | 0.098723381 |
| M281T245 | 2’-O-methylinosine | 5.9525 | 5.33569E-09 |
| M142T242 | 5-Amino-4-carbamoylimidazole (AICA) | 14.7897 | 9.12311E-08 |
| M160T741_2 | DL-2-Aminoadipic acid | 2.8017 | 1.41601E-07 |
| M227T191_1 | 2’-Deoxyuridine | 3.1831 | 1.19342E-06 |
| M356T172 | S-Methyl-5’-thioadenosine | 3.7894 | 2.49949E-06 |
| M181T525 | D-Sorbitol | 2.4867 | 6.34808E-06 |
| M255T187 | Palmitic acid | 1.8663 | 1.72084E-05 |
| M125T112 | Thymine | 3.2190 | 4.16774E-05 |
| M130T525 | L-Leucine | 1.5919 | 5.64283E-05 |
| M180T532 | L-Tyrosine | 1.9852 | 6.85307E-05 |
| M283T186 | Stearic acid | 1.7626 | 6.85813E-05 |
| M253T71 | cis-9-Palmitoleic acid | 2.3058 | 8.60702E-05 |
| M225T73 | Myristoleic acid | 4.3993 | 8.92268E-05 |
| M111T143 | Uracil | 3.0844 | 9.22862E-05 |
| M251T305 | Deoxyinosine | 1.6709 | 9.48503E-05 |
| M303T67_4 | Arachidonic Acid (peroxide free) | 1.2636 | 0.000168795 |
| M135T286 | Hypoxanthine | 1.3682 | 0.000238828 |
| M146T717 | L-Glutamate | 0.7816 | 0.000511788 |
| M351T60 | PGF3a | 3.3160 | 0.000769106 |
| M102T718 | (S)-2-aminobutyric acid | 0.7413 | 0.000818827 |
| M257T240 | Ribothymidine | 5.0191 | 0.000946338 |
| M119T190 | Purine | 2.5946 | 0.003457822 |
| M138T464_3 | 3-Aminopropanesulphonic Acid | 1.4511 | 0.003577674 |
| M411T73 | Grayanotoxin I | 1.9272 | 0.005195049 |
| M243T271_1 | Uridine | 1.3285 | 0.007598538 |
| M124T517_2 | Taurine | 1.0860 | 0.022698784 |
| M367T105 | Perindopril | 1.5961 | 0.0389509 |
| M464T333 | Glycocholic acid | 1.6780 | 0.050821061 |
| M227T73 | Myristic acid | 1.6856 | 0.05478768 |
| M337T64_3 | Erucic acid | 1.2606 | 0.054950855 |
| M165T207 | 3-Methylxanthine | 2.5673 | 0.084715075 |
The details of some differential metabolites in A. japonicus after SMC treatment.
Figure 7
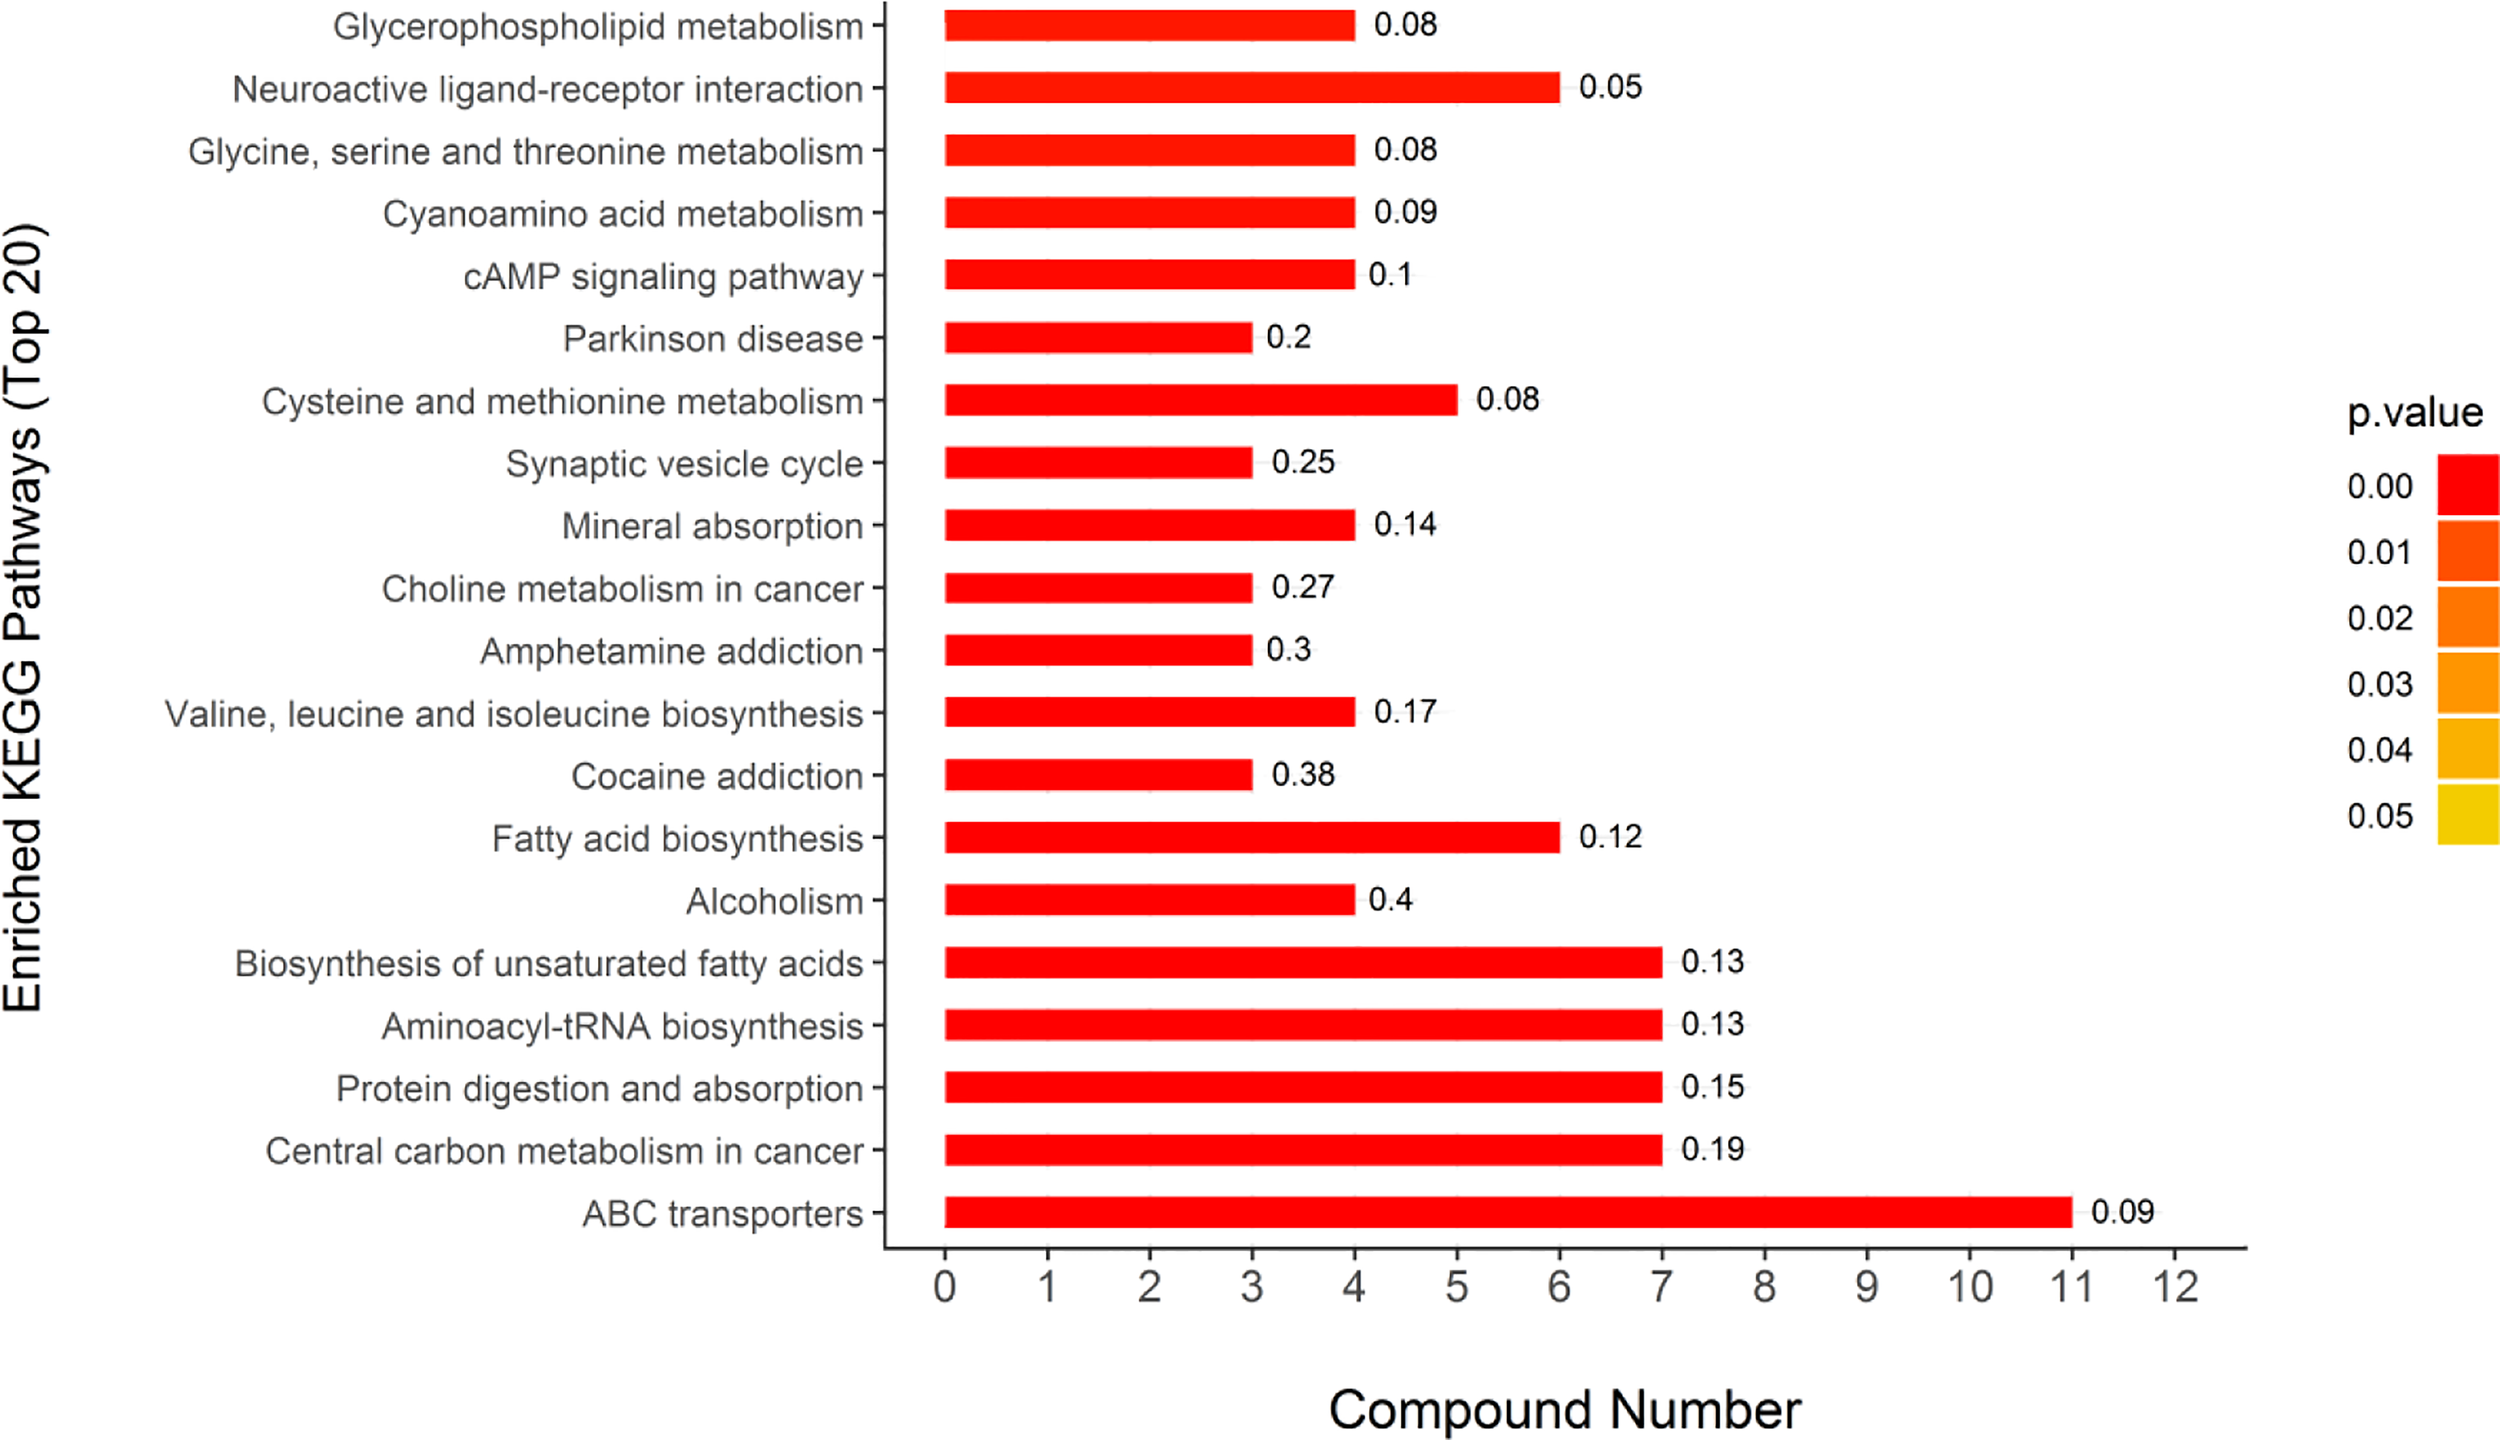
KEGG pathway enrichment analysis results of different metabolites. The color bars represent the adjusted p-values calculated using Fisher’s exact test in conjunction with Benjamini-Hochberg correction. Rich Factor means the ratio of the number of DEPs to the number of all annotated genes in this KEGG pathway; this is labeled at the top of the bar diagram.
Discussion
Overview of proteomics and metabolomics reactions
iTRAQ as an emerging omics combined with LC-MS can quantitatively screen the entire proteome within a detectable dynamic range to determine the differences in protein expression between individuals and groups under different physiological conditions (Xia et al., 2016). By seeking to capture whole metabolic networks rather than just a small number of individual metabolic pathways, metabolomics marks a paradigm change in metabolic research (Song et al., 2018). Briefly, metabolomics is the thorough analysis of endogenous metabolites in biological systems in relation to their total environment.
Currently, researchers have begun to use a combination of metabolomics and proteomics to identify biological stress responses to environmental pollutants. For example, combined metabolomic and proteomic methods confirmed that exposure to tetrabromobisphenol A (TBBPA) affected the growth, development, material metabolism, and energy metabolism of Mytilus galloprovincialis (Ji et al., 2016). Chen et al. (2016) studied P. martensii exposed to different concentrations of Benzo[a]pyrene (BaP) and observed severe disturbances in osmoregulation, energy metabolism, and signal transduction.
As an important component of marine ecosystems, A. japonicus is an echinoderm suitable for studying stress responses (Xue et al., 2015). The combination of metabolomic and proteomic analyses enables a deeper comprehension of molecular responses to SMC. Considering the important differential proteins and metabolites discovered from the aforementioned investigation, a hypothetical network of A. japonicus responses to SMC was summarized (Figure 8). Overall, SMC treatment significantly affected multiple biological pathways at the molecular level, including energy production, lipid synthesis, signal transduction, immune regulation, autophagy, and apoptosis. Possible detailed regulatory processes will be developed in the following discussion.
Figure 8
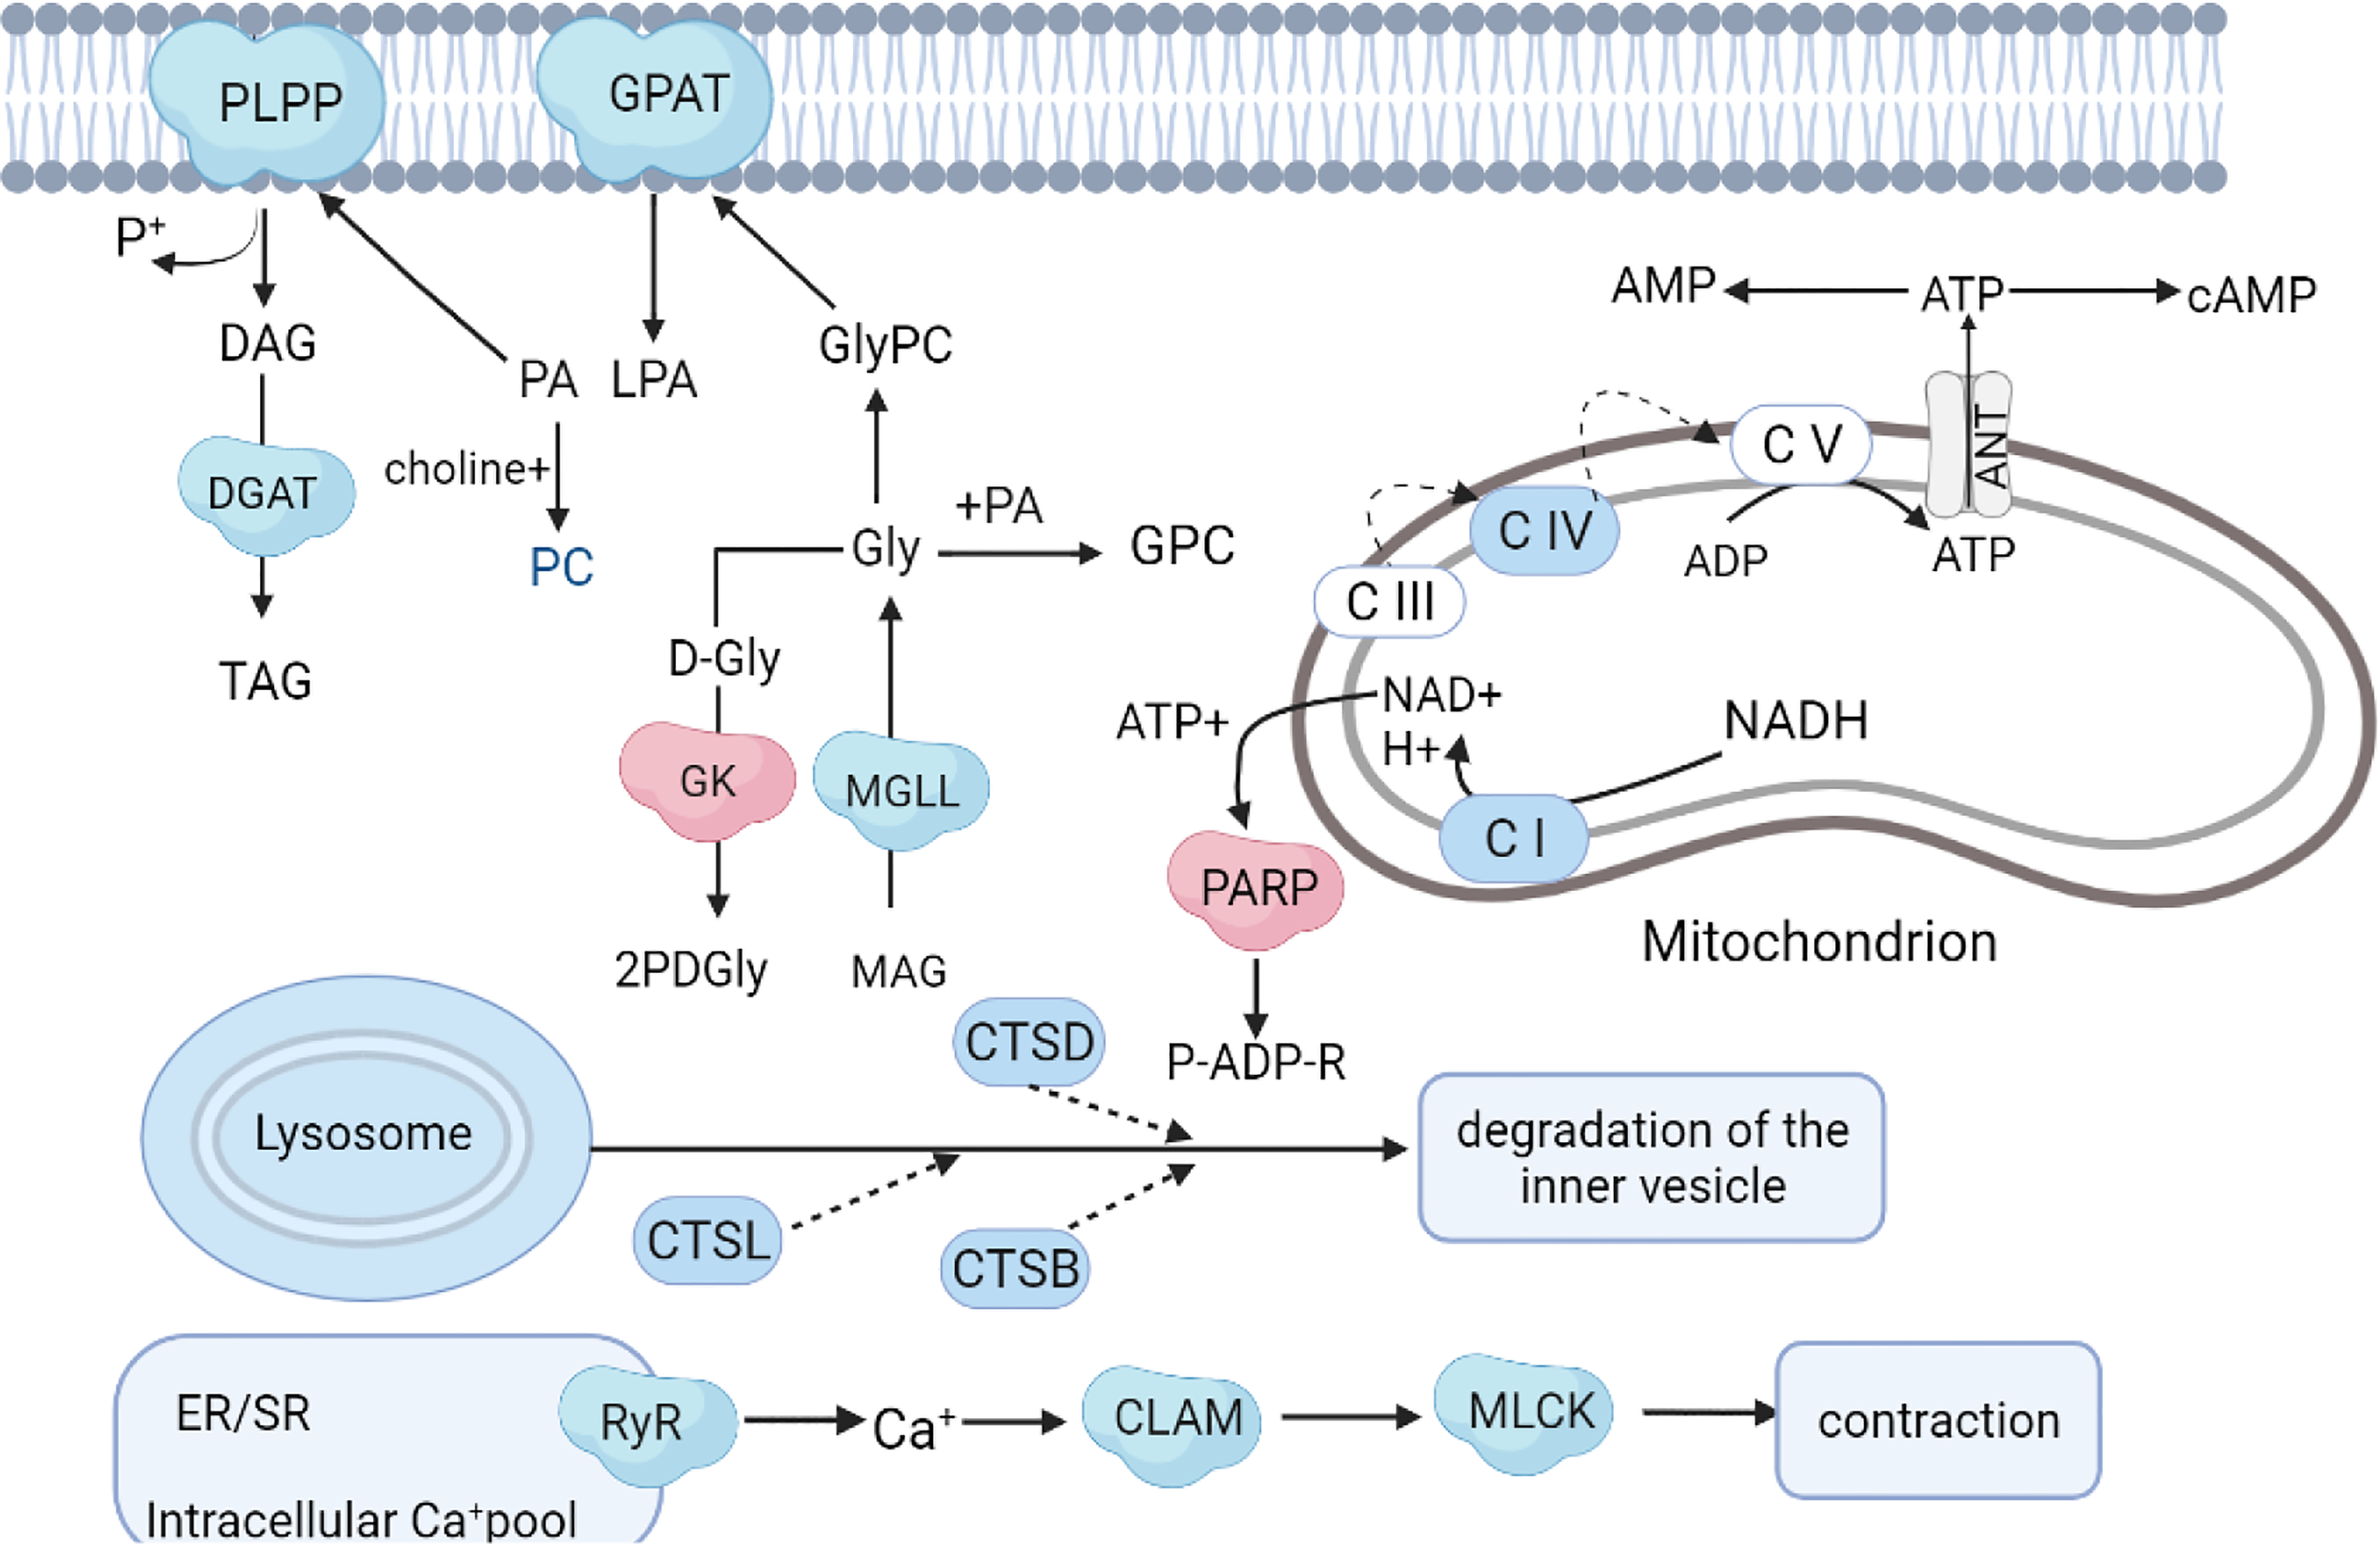
Hypothetical network of proteins, metabolites, and pathways in A. japonicus affected by SMC treatment. The colors red and blue represent up- and down-regulation, respectively.
Changes in energy metabolism related to SMC
In this study, one of the most striking energy-related changes following SMC stress was the downregulation of oxidative phosphorylation and ATP synthesis-related proteins. It is well known that mitochondria are the main site of aerobic respiration in cells, as they participate in the regulation of energy metabolism through oxidative phosphorylation to produce adenosine triphosphate (ATP) (Papa et al., 2012). The primary source of oxidative phosphorylation and ATP generation, the mitochondrial respiratory chain, supplies around 95% of the energy needed for cell survival. The respiratory chain is located in the inner mitochondrial membrane and consists of four functional complexes (I–IV), NADH ubiquinone oxidoreductase (Complex I), succinate ubiquinone oxidoreductase (SQR) (Complex II), ubiquinone oxidoreductase (Complex II), quinone-cytochrome c reductase (QCR) (Complex III), cytochrome oxidase (Complex IV), and coenzyme Q and cytochrome C composition (Kim et al., 2015). In the present study, NADH dehydrogenase (ubiquinone) Fe-S protein 7 (NDUFS7), cytochrome C oxidase subunit 2 (COX2), and cytochrome C oxidase subunit 6b (COX6B) were significantly downregulated in the treatment group. NDUFS7 is an important part of mitochondrial complex I, and its mutation may lead to the degeneration of dopaminergic neurons (Shen et al., 2020). Studies have shown that COX6B1 is involved in various processes such as COX assembly, mitochondrial function, and oxidative phosphorylation (Faxén et al., 2005; Björck and Brzezinski, 2018; Björck et al., 2019). Both of these enzymes were significantly downregulated (Figure 8), indicating that SMC inhibited the function of A. japonicus mitochondria and reduced energy output. In the metabolomic analysis, the metabolite succinate involved in energy metabolism was significantly downregulated. Succinate is the end result of the anaerobic breakdown of glucose and is a crucial intermediate product in the energy metabolism pathway of invertebrates (Skorokhodova et al., 2013). This indicates that the energy metabolism dysfunction was caused by SMC in sea cucumbers.
In the KEGG pathway enrichment analysis of the proteome, we found that eight differentially expressed proteins were significantly enriched in the oxytocin signaling pathway. Studies have shown that prolactin maintains energy balance by promoting the catabolism of fat and glucose in peripheral tissues (Florian et al., 2010; Eckertova et al., 2011). In addition, prolactin can increase the level of glucose in the plasma and increase the utilization of glucose by the body (Skowronski et al., 2017; Khant et al., 2021). Hypothermia, loss of thermoregulation, and altered expression of adrenergic receptor genes were observed in oxytocin receptor-deficient mice (Farland et al., 2017). These results suggest that under SMC stress, A. japonicus may decompose fat and glucose through the oxytocin signal transduction pathway to cope with the effects of impaired mitochondrial function and maintain energy balance.
Changes in lipid metabolism associated with SMC
Lipid metabolism is a process in which most of the ingested fat is emulsified into small particles by bile, and then the fatty acids are hydrolyzed to monoglycerides by lipase (Niot et al., 2009). Marine organisms are usually rich in polyunsaturated fatty acids (Ridzwan et al., 2014; Zhang et al., 2020). In this study, four distinct proteins involved in lipid metabolism were identified, namely, glycerol-3-phosphate O-acyltransferase (GPAT), glycerate 2-kinase (GLXK), monoacylglycerol lipase (MGLL), and phosphatidate phosphatase (PLPP). Only GK was upregulated in SMC-treated A. japonicus. GLXK is a key protein in glycerolipid metabolism that catalyzes the conversion of D-glycerate to 2-phospho-D-glyceride (Luzarowski et al., 2021). The hydrolysis of monoacylglycerols into glycerol and fatty acids is catalyzed in large part by MGLL (Jing et al., 2021). PLPP belongs to the phosphatidic acid phosphatase family and is a membrane protein that catalyzes the dephosphorylation of various phosphatidic acids (Carman and Han, 2009). Phosphatidic acid forms diglyceride under the catalysis of phosphatidic acid phosphatase and then generates triglyceride (TAG) under the catalysis of diacylglycerol acyltransferase (DGAT). TAG can regulate intracellular fat metabolism and lipid metabolism precipitation (Norbeck et al., 1996). The changes in these common proteins indicated that the lipid metabolism process of A. japonicus was disturbed due to the exposure to SMC. The changes in fatty acids such as the significant increases in oleic acid, α-linolenic acid, and palmitic acid, as well as the downregulation of lauric acid, also demonstrated the disturbance to normal lipid metabolism.
GPAT is distributed in the membranes of cells and is involved in various lipid biosynthesis processes such as dephosphorylation, phosphatidic acid, and long-chain fatty acid synthesis (Gimeno and Cao, 2008). In addition, studies have shown the importance of GPAT in regulating energy, glucose, and lipid homeostasis (Wang et al., 2007). GPAT is also a key protein that catalyzes the synthesis of glycerophospholipids (Cao et al., 2006). The majority of phospholipids in the body are glycerophospholipids. In addition to constituting biological membranes, they participate in the identification and signal transduction of proteins by cell membranes and are a component of bile and membrane surfactants. (Zheng and Zou, 2001). Downregulation of GPAT indicated that glycerophospholipid synthesis was inhibited; coincidentally, the significant downregulation of phosphatidylcholine, a common glycerophospholipid in metabolomics, also confirmed the inhibition of glycerophospholipid synthesis (Figure 8).
Changes in signal transduction associated with SMC
A major source of Ca signaling is the internal store primarily located in the endoplasmic/sarcoplasmic reticulum (ER/SR), with cyclic ADP-ribose (cADPR) regulated Ca2+ release via ryanodine receptors (RyRs) (Otsu et al., 1990). Studies have shown that in mice in which the expression of ryanodine receptor 2 (RyR2) is inhibited, the calcium ion concentration and the expression of calcium ion pathway-related proteins are reduced (Tunwell et al., 1996). In this work, RYRs were significantly downregulated in SMC-treated A. japonicus, indicating that their intracellular Ca2+ release was inhibited.
Calmodulin is a multifunctional protein that is ubiquitously present in various eukaryotic cells and can bind to calcium ions (Sengupta et al., 1987). Calmodulin participates in a variety of intracellular signaling pathways and is essential for Ca2+-dependent signaling pathways. (Wawrzynczak and Perham, 1984). It is a dynamic Ca2+ sensor that can respond to a wide range of Ca2+ concentrations and transmit signals downstream (Chin and Means, 2000). Furthermore, Thibodeau et al. demonstrated that calmodulin is a partner of NCX4, an important mediator of Ca2+ efflux, especially in neurons associated with sensory conduction (Thibodeau et al., 2020). Calmodulin was downregulated in this study, indicating that calcium ion transport was inhibited. Myosin light chain kinase (MLCK) is a calmodulin-dependent protein kinase that promotes muscle contraction by mediating the phosphorylation of myosin-regulated light chain (Kazuhiro et al., 1996). In this study, the downregulation of MLCK indicated that SMC inhibited the contraction of A. japonicus intestinal muscles (Figure 8), which may be attributed to downregulated calmodulin. In metabolomics, two common neurotransmitters, acetylcholine and dopamine, with fold changes of 1.43 and 1.87, respectively, were significantly elevated. Choline acetyltransferase (CHAT) catalyzes the synthesis of the neurotransmitter acetylcholine from choline and acetyl-CoA. Dopamine is also an important chemical in the transmission of neural impulses (Chambers et al., 2019). Changes in these two metabolites support our hypothesis.
In addition, the neurotrophin signaling pathway was significantly enriched. This was manifested by upregulation of tyrosine protein phosphatase, phosphatidyl phospholipaseC (PI-PLC), and serine/threonine protein phosphatase. Neurotrophin signaling pathways control many aspects of neuronal survival, development, and function (Reichardt, 2006). Serine/threonine protein phosphatases and tyrosine protein phosphatases belong to the family of protein phosphatases, which control many physiological activities via diverse signaling pathways. (Zhang et al., 2011). PI-PLC regulates an increase in free Ca levels in the cytoplasm, a decrease in intercellular pH, and an oxidative burst (Abd-El-Haliem and Joosten, 2017). Moreover, other significantly enriched signaling pathways such as the NOD-like receptor signaling pathway, the Apelin signaling pathway, the cAMP signaling pathway, the AMPK signaling pathway, and the Ras signaling pathway were affected to varying degrees by SMC exposure.
Oxidative stress and immune response associated with SMC
Heat shock proteins (HSPs) are a family of stress-response proteins that have been shown to play important roles in surviving external environmental stressors by participating in oxidative stress and immune processes (Kregel, 2002; Liu et al., 2015). Recent studies have indicated that HSPs reduce the levels of reactive oxygen species (ROS) to protect the normal function of the body under stressful conditions (Heckathorn et al., 2002; Rahman et al., 2015). L-glutamate is an important neurotransmitter involved in immune regulation and anti-oxidative stress responses (Long et al., 2015). The significant upregulation of HSPs and the significant reduction of L-glutamate indicated that A. japonicus suffered significant oxidative stress on SMC exposure.
Retinoic acid (RA) is an intermediate metabolite of vitamin A. Retinol dehydrogenase (RDH) is the main enzyme in the synthesis of RA. It plays a biological role through the RA signaling pathway and can promote epithelial differentiation and growth of cells involved in the regulation of the immune system (Pino-Lagos et al., 2008). The significant upregulation of RDH, as well as the increase of RA, suggested that A. japonicus may counteract the effects of SMC by accumulating RA and reducing ROS levels. Studies have linked cysteine to metals and oxidative stress. Cysteine is normally present at low levels in the body and can be upregulated when the organism is exposed to toxins (Takemoto, 2014). Similar results were obtained in our study, with a significant (3.89-fold) increase in cysteine after SMC exposure.
Hydrogen sulfide (H2S) molecules are present in the nervous system and smooth muscle cells, and H2S plays an important physiological regulatory role by participating in inflammation and anti-inflammatory responses (Kimura et al., 2005). Endogenous H2S is produced by cysteine as a substrate and is catalyzed by the rate-limiting enzymes cystathionine-β synthase (CBS) and cystathionine γ-lyase (CSE) (Chen et al., 2010). In this study, we found that CSE was significantly downregulated in SMC-treated A. japonicus, suggesting that it may affect the synthesis of H2S, leading to the occurrence of inflammatory reactions.
Autophagy and apoptosis associated with SMC
A cellular catabolic mechanism known as autophagy includes non-selective cytoplasmic component breakdown, organelle turnover, and protein degradation (van der Lienden et al., 2018; Fang et al., 2019). The autophagy process is controlled by a variety of proteins. Among the lysosomal proteins, cathepsin (CTS) is the most abundant protease required to activate autophagy, and it plays an important role in degrading proteins in lysosomes (Meijer and Codogno, 2004). In this work, three cathepsins (CTSB, CTSD, and CTSL) were identified as being reduced due to SMC treatment (Figure 8). Studies have shown that autophagy-lysosomal protein degradation was impaired in a CTS knockout mouse model, and mitochondrial clearance was defective, resulting in increased ROS (Lee et al., 2021). Furthermore, in this study, we initially found that the vacuolar protein sorting-associated protein 13A (VPS13A) was significantly downregulated in SMC-treated A. japonicus. Studies have shown that members of the VPS13 family are closely involved in a variety of neurodegenerative diseases (Seifert et al., 2011; Schormai et al., 2018). The reduction in autophagy seen in the absence of VPS13A may be the result of more general defects in endocytic transport and lysosomal degradation (Muñoz-Braceras et al., 2019). The latter study also discovered a strong relationship between VPS13A and mitochondria, indicating that VPS13A’s function in the endolysosomal pathway may be connected to intracellular communication. These results suggest that autophagy can be reduced through the mitochondrial pathway under SMC stress conditions.
Apoptosis, also known as programmed cell death, is a genetically programmed process that eliminates damaged or redundant cells by activating caspases (Savitskaya and Onishchenko, 2015). In this work, two apoptosis-related proteins were altered upon SMC treatment, manifesting as upregulation of poly[ADP-ribose]polymerase 1 (PARP) and caspase 6 (CASP6). PARP is a major molecule in apoptosis, and its overactivation uses a large amount of NAD+ as a substrate for poly-ADP-ribosylation, resulting in ATP depletion that eventually leads to cell death (Ahel et al., 2008). Caspases are a relatively evolutionarily conserved family of cysteinyl proteases that initiate and execute apoptosis through specific cleavage of a large number of cellular substrates via aspartic acid (Lee et al., 2006). Changes in these two proteins indicated increased apoptosis in A. japonicus cells after SMC stress.
Conclusion
In this study, proteomic and metabolomic techniques were used to analyze the proteins and metabolites of A. japonicus under SMC stress. The results showed that SMC inhibited the energy metabolism, fat metabolism, Ca2+ transmission pathway of A. japonicus, and was accompanied by severe oxidative stress and inflammation. In conclusion, this study provides a basis for the interpretation of the response mechanism of A. japonicus under SMC stress as well as a reference for the screening of molecular indicators for the detection of SMC pollution in A. japonicus in aquaculture. The findings are also of significance for the protection and utilization of A. japonicus resources in the natural environment.
Funding
The research was supported by grants from the National Key R&D Program of China (2018YFD0901602), Modern Agriculture Industry System of Shandong Province (SDAIT-22-02), Natural Science Foundation of Shandong Province (ZR2021MC023), and TaiShan Industrial Experts Programme, China (tscy20190114).
Publisher’s note
All claims expressed in this article are solely those of the authors and do not necessarily represent those of their affiliated organizations, or those of the publisher, the editors and the reviewers. Any product that may be evaluated in this article, or claim that may be made by its manufacturer, is not guaranteed or endorsed by the publisher.
Statements
Data availability statement
The Metabolomics data presented in the study are deposited inthe EMBL-EBI MetaboLights repository, accession number MTBLS5758 (https://www.ebi.ac.uk/metabolights/MTBLS5758). The Proteome data presented in the study are deposited in the iProX repository, accession number 1667637087317CuFi (https://www.iprox.cn/page/PSV023.html;?url=1667637087317CuFi).
Author contributions
GS and JY designed and supervised the study. LL, LR, LJ and XX prepared the samples. LL, LJ, YF, GS, WW and ZL analyzed all sequencing data. LL and GS wrote the manuscript. All authors contributed to the article and approved the submitted version.
Conflict of interest
The authors declare that the research was conducted in the absence of any commercial or financial relationships that could be construed as a potential conflict of interest.
Abbreviations
ANT, adenine nucleotide translocator; CALM, calmodulin; CI, complex I; CIII, complex III; C IV, complex IV; CV, complex; CTS, cathepsin; DAG, diacylglycerol DGAT, diacylglycerol O-acyltransferase; D-Gly, D-Glycerate; DGP, D-Glycerate 2-phosphate; ER/SR, endoplasmic/sarcoplasmic reticulum; Gly, Glycerate; GLXK, glycerate2-kinase; GPAT, glycerol-3-phosphate acyltransferase; MGLL, acylglycerol lipase; GPC, glycerol choline phosphate; LPA, lysophosphatidic acids; MAG, monoacylglycerol; PC, phosphatidylcholine; MLCK, myosin-light-chain kinase; NADH, nicotinamide adenine dinucleotide; PA, phosphatidic acid; PARP, poly[ADP-ribose]polymerase; P-ADP-R, poly-ADP-ribose; PLPP, phosphatidate phosphatase; RyR, ryanodine receptor.
References
1
Ahel I. Matsusaka T. Clark A. J. Pines J. Boulton S. J. (2008). Poly(ADP-ribose)-binding zinc finger motifs in DNA repair/checkpoint proteins. Nature.451 (7174), 81–85. doi: 10.1038/nature06420
2
Abd-El-Haliem A. M. Joosten M. H. (2017). Plant phosphatidylinositol-specific phospholipase c at the center of plant innate immunity. J. Integr. Plant Biol.59 (3), 164–179. doi: 10.1111/jipb.12520
3
Björck M. L. Brzezinski P. (2018). Control of transmembrane charge transfer in cytochrome c oxidase by the membrane potential. Nat. Commun.9 (1), 3187. doi: 10.1038/s41467-018-05615-5
4
Björck M. L. Vilhjálmsdóttir J. Hartley A. M. Meunier B. Näsvik Öjemyr L. Maréchal A. et al . (2019). Proton-transfer pathways in the mitochondrial s. cerevisiae cytochrome c oxidase. Sci. Rep.9 (1), 20207. doi: 10.1038/s41598-019-56648-9
5
Cao J. Liao Y. Yang W. Jiang X. Li M. (2021). Enhanced microalgal toxicity due to polystyrene nanoplastics and cadmium co-exposure: From the perspective of physiological and metabolomic profiles. J. Hazard Mater.427, 127937. doi: 10.1016/j.jhazmat.2021.127937
6
Cao J. Li D. Li J. Tobin F. Gimeno R. E. (2006). Molecular identification of microsomal acyl-CoA: Glycerol-3-phosphate acyltransferase, a key enzyme in de novo triacylglycerol synthesis. Proc. Natl. Acad. Sci. U S A.103 (52), 19695–19700. doi: 10.1073/pnas.0609140103
7
Carman G. M. Han G. S. (2009). Phosphatidic acid phosphatase, a key enzyme in the regulation of lipid synthesis. J. Biol. Chem.284 (5), 2593–2597. doi: 10.1074/jbc.R800059200
8
Chambers N. E. Meadows S. M. Taylor A. Sheena E. Lanza K. Conti M. et al . (2019). Effects of muscarinic acetylcholine m1 and m4 receptor blockade on dyskinesia in the hemi-parkinsonian rat. Neuroscience.409, 180–194. doi: 10.1016/j.neuroscience.2019.04.008
9
Chen H. Song Q. Diao X. Zhou H. (2016). Proteomic and metabolomic analysis on the toxicological effects of benzo[a]pyrene in pearl oyster Pinctada martensii. Aquat Toxicol.175, 81–89. doi: 10.1016/j.aquatox.2016.03.012
10
Chen L. Yang T. Yang L. Guo X. Meng L. Cui Y. et al . (2010). Hydrogen sulphide protects H9c2 cells against chemical hypoxia-induced injury. Clin. Exp. Pharmacol. Physiol.37 (3), 316–321. doi: 10.1111/j.1440-1681.2009.05289.x
11
Chin D. Means A. R. (2000). Calmodulin: a prototypical calcium sensor. Trends Cell Biol.10 (8), 322–28. doi: 10.1016/s0962-8924(00)01800-6
12
Dhandapani A. Manivarman S. Subashchandrabose S. (2014). Molecular structure and vibrational analysis on (E)-1-(3-methyl-2,6-diphenyl piperidin-4-ylidene) semicarbazide. J. Mol. Struct.1058, 41–50. doi: 10.1016/j.molstruc.2013.09.052
13
Eckertova M. Ondrejcakova M. Krskova K. Zorad S. Jezova D. (2011). Subchronic treatment of rats with oxytocin results in improved adipocyte differentiation and increased gene expression of factors involved in adipogenesis. Br. J. Pharmacol.162 (2), 452–463. doi: 10.1111/j.1476-5381.2010.01037.x
14
Fang H. Yao S. Chen Q. Liu C. Cai Y. Geng S. et al . (2019). De novo -designed near-infrared nanoaggregates for super-resolution monitoring of lysosomes in cells, in whole organoids, and in vivo. ACS Nano.13 (12), 14426–14436. doi: 10.1021/acsnano.9b08011
15
Farland L. V. Mu F. Eliassen A. H. Hankinson S. E. Tworoger S. S. Barbieri R. L. et al (2017). Menstrual cycle characteristics and steroid hormone, prolactin, and growth factor levels in premenopausal women. Cancer Causes Control.28 (12), 1441–1452. doi: 10.1007/s10552-017-0971-2
16
Faxén K. Gilderson G. Ädelroth P. Peter B. (2005). A mechanistic principle for proton pumping by cytochrome c oxidase. Nature.437 (7056), 286–289. doi: 10.1038/nature03921
17
Florian M. Jankowski M. Gutkowska J. (2010). Oxytocin increases glucose uptake in neonatal rat cardiomyocytes. Endocrinology.151 (2), 482–491. doi: 10.1210/en.2009-0624
18
Gimeno R. E. Cao J. (2008). Thematic review series: Glycerolipids. mammalian glycerol-3-phosphate acyltransferases: new genes for an old activity. J. Lipid Res.49 (10), 2079–2088. doi: 10.1194/jlr.R800013-JLR200
19
Heckathorn S. A. Ryan S. L. Baylis J. A. Wang D. Cundiff L. Luthe D. S. (2002). In vivo evidence from an Agrostis stolonifera selection genotype that chloroplast small heat-shock proteins can protect photosystem II during heat stress. Funct. Plant Biol.29 (8), 935–946. doi: 10.1071/PP01191
20
Ji C. Cao L. Fei L. (2015). Toxicological evaluation of two pedigrees of clam ruditapes philippinarum as bioindicators of heavy metal contaminants using metabolomics. Environ. Toxicol. Pharmacol.39 (2), 545–554. doi: 10.1016/j.etap.2015.01.004
21
Ji C. Li F. Wang Q. Zhao J. Sun Z. Wu H. (2016). An integrated proteomic and metabolomic study on the gender-specific responses of mussels mytilus galloprovincialis to tetrabromobisphenol a (TBBPA). Chemosphere.144, 527–539. doi: 10.1016/j.chemosphere.2015.08.052
22
Ji C. Lu Z. Xu L. Li F. Cong M. Shan X. et al (2019). Evaluation of mitochondrial toxicity of cadmium in clam ruditapes philippinarum using iTRAQ-based proteomics. Environ. pollut.251, 802–810. doi: 10.1016/j.envpol.2019.05.046
23
Ji C. Lu Z. Xu L. Li F. Cong M. Shan X. et al (2020). Global responses to tris(1-chloro-2-propyl) phosphate (TCPP) in rockfish Sebastes schlegeli using integrated proteomic and metabolomic approach. Sci. Total Environ.724, 138307. doi: 10.1016/j.scitotenv.2020.138307
24
Jing Y. Song Y. Shi Q. Fu L. (2021). Research progress on FASN and MGLL in the regulation of abnormal lipid metabolism and the relationship between tumor invasion and metastasis. Front. Med.15 (5), 649–656. doi: 10.1007/s11684-021-0830-0
25
Kazuhiro K. Ye L. H. Hayakawa K. Okagaki T. (1996). Myosin light chain kinase: an actin-binding protein that regulates an ATP-dependent interaction with myosin-ScienceDirect. Trends Pharmacol. Sci.17 (8), 284–287. doi: 10.1016/0165-6147(96)10033-x
26
Khant A. Z. Kokay I. C. Grattan D. R. Ladyman S. R. (2021). Prolactin-induced adaptation in glucose homeostasis in mouse pregnancy is mediated by the pancreas and not in the forebrain. Front. Endocrinol. 12, 765976. doi: 10.3389/fendo.2021.765976
27
Kim S. E. Mori R. Komatsu T. Chiba T. Hayashi H. Park S. et al . (2015). Upregulation of cytochrome c oxidase subunit 6b1 (Cox6b1) and formation of mitochondrial supercomplexes: implication of Cox6b1 in the effect of calorie restriction. Age (Dordr). 37 (3), 9787. doi: 10.1007/s11357-015-9787-8
28
Kimura H. Nagai Y. Umemura K. Kimura Y. (2005). Physiological roles of hydrogen sulfide: synaptic modulation, neuroprotection, and smooth muscle relaxation. Antioxid Redox Signal.7 (5-6), 795–803. doi: 10.1089/ars.2005.7.795
29
Kregel K. C. (2002). Invited review: Heat shock proteins: modifying factors in physiological stress responses and acquired thermotolerance. J. Appl. Physiol.92 (5), 2177–2186. doi: 10.1152/japplphysiol.01267.2001
30
Lee C. Chan J. Clement M. Pervaiz S. (2006). Functional proteomics of resveratrol-induced colon cancer cell apoptosis: caspase-6-mediated cleavage of lamin a is a major signaling loop. Proteomics.6 (8), 2386–2394. doi: 10.1002/pmic.200500366
31
Lee J. Jang S. Choi M. Kang M. Lim S. G. Kim S. Y. et al . (2021). Overexpression of cathepsin s exacerbates lupus pathogenesis through upregulation TLR7 and IFN-alpha in transgenic mice. Sci. Rep.11 (1), 16348. doi: 10.1038/s41598-021-94855-5
32
Liu H. Yang L. (2021). Application of high performance liquid chromatography-mass spectrometry in protein detection. J. Chem. Pharm.40, 76–80. doi: 10.13506/j.cnki.jpr.2021.07.012
33
Liu P. Fu J. Xu P. Wang X. Li S. (2015). The role of heat shock proteins in oxidative stress damage induced by Se deficiency in chicken livers. Biometals28, 163–73. doi: 10.1007/s10534-014-9812-x
34
Long S. M. Tull D. L. Jeppe K. J. De Souza D. P Dayalan S. Pettigrove V. J. et al . (2015). A multi-platform metabolomics approach demonstrates changes in energy metabolism and the transsulfuration pathway in chironomus tepperi following exposure to zinc. Aquat Toxicol.162, 54–65. doi: 10.1016/j.aquatox.2015.03.009
35
Luzarowski M. Vicente R. Kiselev A. Wagner M. Schlossarek D. Erban A. et al . (2021). Global mapping of protein-metabolite interactions in saccharomyces cerevisiae reveals that ser-leu dipeptide regulates phosphoglycerate kinase activity. Commun. Biol.4 (1), 181. doi: 10.1038/s42003-021-01684-3
36
Maranghi F. Tassinari R. Lagatta V. Moracci G. Macrì C. Eusepi A. (2009). Effects of the food contaminant semicarbazide following oral administration in juvenile sprague–dawley rats. Food Chem. Toxicol.47 (2), 472–479. doi: 10.1016/j.fct.2008.12.003
37
Maingot L. Elbakali J. Dumont J. Bosc D. Cousaert N. Urban A. et al (2013). Aggrecanase-2 inhibitors based on the acylthiosemicarbazide zinc-binding group. Eur. J. Med. Chem.69, 244–261. doi: 10.1016/j.ejmech.2013.08.027
38
Meijer A. J. Codogno P. (2004). Regulation and role of autophagy in mammalian cells. Int. J. Biochem. Cell Biol.36, 45–62. doi: 10.1016/j.biocel.2004.02.002
39
Muñoz-Braceras S. Tornero-Écija A. Vincent O. Escalante R. (2019). VPS13A, a closely associated mitochondrial protein, is required for efficient lysosomal degradation. Dis. Model. Mech. 12 (2), dmm036681. doi: 10.1242/dmm.036681
40
Niot I. Poirier H. Tran T. Besnard P. (2009). Intestinal absorption of long-chain fatty acids: Evidence and uncertainties. Prog. Lipid Res.48 (2), 101–115. doi: 10.1016/j.plipres.2009.01.001
41
Norbeck J. Påhlman A. K. Akhtar N. Blomberg A. Adler L. (1996). Purification and characterization of two isoenzymes of DL-Glycerol-3-phosphatase from saccharomyces cerevisiae. J. Biol. Chem.271 (23), 13875–13881. doi: 10.1074/jbc.271.23.13875
42
Otsu K. Willard H. F. Khanna V. K. Zorzato F. Maclennan D. H. (1990). Molecular cloning of cDNA encoding human and rabbit forms of the Ca2+ release channel (ryanodine receptor) of skeletal muscle sarcoplasmic reticulum. J. Biol. Chem.265 (4), 2244–2256. doi: 10.1016/00086215(90)80036-3
43
Papa S. Martino P. L. Capitanio G. Gaballo A. Petruzzella V. (2012). The oxidative phosphorylation system in mammalian mitochondria. Adv. Exp. Med. Biol.942, 3–37. doi: 10.1007/978-94-007-2869-1_1
44
Pino-Lagos K. Benson M. J. Noelle R. J. (2008). Retinoic acid in the immune system. Ann. N. Y. Acad. Sci.1143, 170–187. doi: 10.1196/annals.1443.017
45
Rahman M. A. Ren L. Wu W. Yan Y. (2015). Proteomic analysis of PEG-induced drought stress responsive protein in TERF1 overexpressed sugarcane (Saccharum officinarum) leaves. Plant Mol. Biol.33, 16–30. doi: 10.1007/s11105-014-0784-3
46
Raja R. Seshadri S. Santhanam V. Vedhavalli D. (2017). Growth and characterization of nonlinear optical crystal semicarbazide picrate. J. Mol. Struct.1147, 515–519. doi: 10.1016/j.molstruc.2017.06.035
47
Reichardt L. F. (2006). Neurotrophin-regulated signalling pathways. Philos. Trans. R Soc. Lond B Biol. Sci.361 (1473), 1545–1564. doi: 10.1098/rstb.2006.1894
48
Ridzwan H. Nurzafirah N. Hanis K. Hanis Z. F. (2014). Free fatty acids composition in lipid extracts of several Sea cucumbers species from Malaysia. J. Biochem. Mol. Biol.4, 204–207. doi: 10.7763/ijbbb.2014.v4.340
49
Rossi C. Marzano V. Consalvo A. Zucchelli M. Mortera S. Casagrande V. et al . (2018). Proteomic and metabolomic characterization of streptozotocin-induced diabetic nephropathy in TIMP3-deficient mice. Acta Diabetol.55 (2), 121–29. doi: 10.1007/s00592-017-1074-y
50
Santos J. M. Macedo C. E. Brandão M. L. (2008). Gabaergic mechanisms of hypothalamic nuclei in the expression of conditioned fear. Neurobiol. Learn Mem.90 (3), 560–568. doi: 10.1016/j.nlm.2008.06.007
51
Savitskaya M. A. Onishchenko G. E. (2015). Mechanisms of apoptosis. Biochemistry.80 (11), 1393–1405. doi: 10.1134/S0006297915110012
52
Schormai B. Kemlin D. Mollenhauer B. Fiala O. Machetanz G. Rot J. et al . (2018). Diagnostic exome sequencing in early-onset parkinson’s disease confirms VPS13C as a rare cause of autosomal-recessive parkinson’s disease. Clin. Genet.93 (3), 603–612. doi: 10.1111/cge.13124
53
Seifert W. Kuhnisch J. Maritzen T. Horn D. Haucke V. Hennies H. C. (2011). Cohen Syndrome-associated protein, COH1, is a novel, giant golgi matrix protein required for golgi integrity. J. Biol. Chem.286 (43), 37665–37675. doi: 10.1074/jbc.M111.267971
54
Sengupta B. Friedberg F. Detera-Wadleigh S. D. (1987). Molecular analysis of human and rat calmodulin complementary DNA clones. evidence for additional active genes in these species. J. Biol. Chem.262 (34), 16663–16670. doi: 10.1016/S0021-9258(18)49306-4
55
Shen J. Zha Q. Gao X. Cheng S. (2020). Construction of mutant NDUFS7 plasmid and its effects on neural cells. J. Chem. Pharm.51, 599–606. doi: 10.11665/j.issn.1000-5048.20200512
56
Skorokhodova A. Y. Gulevich A. Y. Morzhakova A. A. Shakulov R. S. Debabov V. G. (2013). Metabolic engineering of Escherichia coli for the production of succinic acid from glucose. Appl. Biochem. Microbiol.49, 29–37. doi: 10.1134/S0003683813070053
57
Skowronski M. T. Mlotkowska P. Tanski D. Lepiarczyk E. Oklinski M. K. Nielsen S. et al . (2017). Pituitary gonadotropins, prolactin and growth hormone differentially regulate AQP1 expression in the porcine ovarian follicular cells. Int. J. Mol. Sci.19 (1), 5. doi: 10.3390/ijms19010005
58
Song Y. Chai T. Yin Z. Zhang X. Zhang W. Qian Y. et al . (2018). Stereoselective effects of ibuprofen in adult zebrafish (Danio rerio) using UPLC-TOF/MS-based metabolomics. Environ. pollut.241, 730–739. doi: 10.1016/j.envpol.2018.06.009
59
Sun Q. Liu C. Jiang K. Fang Y. Kong C. Fu J. et al (2021). A preliminary study on the neurotoxic mechanism of harmine in Caenorhabditis elegans. Comp. Biochem. Physiol. C Toxicol. Pharmacol.245, 109038. doi: 10.1016/j.cbpc.2021.109038
60
Sun J. Tang S. Peng H. Saunders D. M. Doering J. A. Hecker M. et al . (2016). Combined transcriptomic and proteomic approach to identify toxicity pathways in early life stages of Japanese medaka (Oryzias latipes) exposed to 1,2,5,6-tetrabromocyclooctane (TBCO). Environ. Sci. Technol.50 (14), 7781–7790. doi: 10.1021/acs.est.6b01249
61
Takemoto Y. (2014). Cardiovascular actions of l-cysteine and l-cysteine sulfinic acid in the nucleus tractus solitarius of the rat. Amino Acids46 (7), 1707–1713. doi: 10.1007/s00726-014-1733-z
62
Tarek M. Zaki M. Fawzy M. H. Mokhtar M. A. (1987). Application of rhodanine, fluorene and semicarbazide hydrochloride as new spectrophotometric reagents for quinones. Microchimica Acta. 90 (5), 321–328. doi: 10.1007/BF01199274
63
Thibodeau S. Yang W. Sharma S. Lytton J. (2020). Calmodulin binds and modulates k+ dependent Na+/Ca2+ exchanger isoform 4, NCKX4. J. Biol. Chem.296, 100092. doi: 10.1074/jbc.RA120.015037
64
Tunwell R. E. Wickenden C. Bertrand B. M. Shevchenko V. I. Walsh M. B. Allen P. D. et al (1996). The human cardiac muscle ryanodine receptor-calcium release channel: identification, primary structure and topological analysis. Biochem. J.318 (Pt 2), 477–487. doi: 10.1042/bj3180477
65
van der Lienden M. J. C. Gaspar P. Boot R. Aerts J. M. F. G. Eijk M. (2018). Glycoprotein non-metastatic protein b: An emerging biomarker for lysosomal dysfunction in macrophages. Int. J. Mol. Sci.20 (1), 66. doi: 10.3390/ijms20010066
66
Wang S. Lee D. P. Gong N. Schwerbrock N. M. Mashek D. G. Gonzalez-Baró M. R. et al . (2007). Cloning and functional characterization of a novel mitochondrial n-ethylmaleimide-sensitive glycerol-3-phosphate acyltransferase (GPAT2). Arch. Biochem. Biophys.465 (2), 347–358. doi: 10.1016/j.abb.2007.06.033
67
Wawrzynczak E. J. Perham R. N. (1984). Isolation and nucleotide sequence of a cDNA encoding human calmodulin. Biochem. Int.9 (2), 177–185. doi: 10.1021/bi00321a602
68
Wu H. Liu X. Zhang X. Ji C. Zhao J. Yu J. (2013). Proteomic and metabolomic responses of clam Ruditapes philippinarum to arsenic exposure under different salinities. Aquat. Toxicol.136, 91–100. doi: 10.1016/j.aquatox.2013.03.020
69
Xia G. Zhang D. Ma C. Zhou J. Su R. (2016). Characterization and comparison of proteomes of albino sea cucumber Apostichopus japonicus (Selenka) by iTRAQ analysis. Fish Shellfish Immunol.51, 229–239. doi: 10.1016/j.fsi.2015.12.027
70
Xue Z. Li H. Wang X. Li X. Liu Y. Sun J. et al (2015). A review of the immune molecules in the sea cucumber. Fish Shellfish Immunol.44 (1), 1–11. doi: 10.1016/j.fsi.2015.01.026
71
Yang W. Zhao F. Fang Y. Li L. Li C. Ta N. (2018). H-1-nuclear magnetic resonance metabolomics revealing the intrinsic relationships between neurochemical alterations and neurobehavioral and neuropathological abnormalities in rats exposed to tris(2-chloroethyl) phosphate. Chemosphere.200, 649–659. doi: 10.1016/j.chemosphere.2018.02.056
72
Yue Z. Yu M. Zhang X. Dong Y. Tian H. Wang W. et al . (2017). Semicarbazide-induced thyroid disruption in Japanese flounder (Paralichthys olivaceus) and its potential mechanisms. Ecotoxicol Environ. Saf.140, 31–40. doi: 10.1016/j.ecoenv.2017.02.043
73
Yu M. Feng Y. Zhang X. Wang J. Tian H. Wang W. et al . (2017). Semicarbazide disturbs the reproductive system of male zebrafish (Danio rerio) through the GABAergic system. Reprod. Toxicol.73, 149–157. doi: 10.1016/j.reprotox.2017.08.007
74
Yu D. Ji C. Zhao J. Wu H. (2016). Proteomic and metabolomic analysis on the toxicological effects of as (III) and as (V) in juvenile mussel Mytilus galloprovincialis. Chemosphere.150, 194–201. doi: 10.1016/j.chemosphere.2016.01.113
75
Zhao Y. Lin C. (2014). UPLC-MSE application in disease biomarker discovery: The discoveries in proteomics to metabolomics. Chem. Biol. Interact.215, 7–16. doi: 10.1016/j.cbi.2014.02.014
76
Zhang J. Zhang Y. Du Y. Chen S. Tang H. (2011). Dynamic metabonomic responses of tobacco (Nicotiana tabacum) plants to salt stress. J. Proteome Res.10 (4), 1904–1914. doi: 10.1021/pr101140n
77
Zhang X. Ning X. He X. Sun X. Yu X. Cheng Y. et al . (2020). Fatty acid composition analyses of commercially important fish species from the pearl river estuary, China. PloS One15 (1), e0228276. doi: 10.1371/journal.pone.0228276
78
Zhao H. Guo W. Quan W. Jiang J. Qu B. (2016). Occurrence and levels of nitrofuran metabolites in sea cucumber from dalian, China. Food Addit Contam Part A Chem. Anal. Control Expo Risk Assess.33 (11), 1672–1677. doi: 10.1080/19440049.2016.1217069
79
Zheng Z. Zou Y. (2001). The initial step of the glycerolipid pathway: Identification of glycerol 3-phosphate/dihydroxyacetone phosphate dual substrate acyltransferases in saccharomyces cerevisiae. J. Biol. Chem.276 (45), 41710–41716. doi: 10.1074/jbc.M104749200
Summary
Keywords
sea cucumber, semicarbazide, proteomics, metabolomics, iTRAQ, UHPLC-Q-TOF-MS, stress response
Citation
Lu L, Ren L, Jiang L, Xu X, Wang W, Feng Y, Li Z, Yang J and Sun G (2022) Integrative proteomics and metabolomics reveal the stress response of semicarbazide in the sea cucumber Apostichopus japonicus. Front. Mar. Sci. 9:992753. doi: 10.3389/fmars.2022.992753
Received
13 July 2022
Accepted
09 November 2022
Published
02 December 2022
Volume
9 - 2022
Edited by
Chenghua Li, Ningbo University, China
Reviewed by
Xueqiang Lu, Nankai University, China; Dongxue Xu, Qingdao Agricultural University, China
Updates
Copyright
© 2022 Lu, Ren, Jiang, Xu, Wang, Feng, Li, Yang and Sun.
This is an open-access article distributed under the terms of the Creative Commons Attribution License (CC BY). The use, distribution or reproduction in other forums is permitted, provided the original author(s) and the copyright owner(s) are credited and that the original publication in this journal is cited, in accordance with accepted academic practice. No use, distribution or reproduction is permitted which does not comply with these terms.
*Correspondence: Guohua Sun, sgh_smile@163.com; Jianmin Yang, ladderup@126.com; Zan Li, lizanlxm@163.com
This article was submitted to Marine Biology, a section of the journal Frontiers in Marine Science
Disclaimer
All claims expressed in this article are solely those of the authors and do not necessarily represent those of their affiliated organizations, or those of the publisher, the editors and the reviewers. Any product that may be evaluated in this article or claim that may be made by its manufacturer is not guaranteed or endorsed by the publisher.