Abstract
Increasing the preservation and creation of natural and nature-based features (NNBF), like wetlands, living shorelines, beaches, dunes and other natural features to improve community resilience in the face of increasing coastal flooding may be achieved by highlighting the locally relevant benefits that these features can provide. Here we present a novel application of the least-cost geospatial modeling approach to generate inundation pathways that highlight landscape connections between NNBF and vulnerable infrastructure. Inundation pathways are then used to inform a ranking framework that assesses NNBF based on their provision of benefits and services to vulnerable infrastructure and for the broader community including 1) the flooding mitigation potential of NNBF, 2) the relative impact of those NNBF on local infrastructure, and 3) co-benefits for the broader community linked to incentive programs like nutrient reduction crediting and the Federal Emergency Management Agency’s Community Rating System. Inundation pathways are also used to identify locations lacking in benefits from NNBF as target areas for NNBF restoration or creation. This approach, applied here for coastal Virginia, with project outputs available via an interactive map viewer1, can be customized for application in any community to identify high-priority NNBF that are particularly beneficial for preservation and to identify target areas for new or restored features.
1 Introduction
1.1 General
Coastal flooding resulting from high tides and storm surge, exacerbated by accelerating rates of sea-level rise (SLR), causes significant impacts on infrastructure of coastal communities in Virginia (Ezer, 2018) and globally (Vitousek et al., 2017). In fact, coastal Virginia SLR rates are some of the highest in the U.S. (5.4mm/yr) surpassed only by locales on the U.S. Gulf Coast (Boon et al., 2018). Preserving existing and/or creating new natural and nature-based features (NNBF) are increasingly recognized as beneficial and cost-effective solutions for coastal management (Temmerman et al., 2013; Bridges et al., 2015; Bilkovic et al., 2016; Reguero et al., 2018; Sutton-Grier et al., 2018; Powell et al., 2019; Bridges et al., 2021).
NNBF such as living shorelines, beaches, dunes, wetlands (tidal and nontidal), and forests can provide an array of benefits for coastal communities. These include mitigating flooding and erosion damage (Shepard et al., 2011; Spalding et al., 2014a; Saleh and Weinstein, 2016; Narayan et al., 2017; Salgado and Martinez, 2017; Glass et al., 2018; Sutton-Grier et al., 2018; Bridges et al., 2021). Provision of additional benefits include improving water quality, sequestering carbon, providing habitat for economically important species, benefitting local economies through tourism and water-dependent industries, and even providing mental health benefits for people, among others (Costanza et al., 1997; Millennium Ecosystem Assessment, 2005; Liquete et al., 2013; Ninan and Inoue, 2013; Sutton-Grier et al., 2015).
There are state and federal policies and incentives designed to support the preservation and restoration of NNBF in the U.S., and specifically living shorelines, as a preferred management strategy for shoreline erosion control in appropriate settings. However, there remains in Virginia the perception that NNBF are not as effective at protecting shorelines as more traditional shoreline armoring approaches (Center for Coastal Resources Management, 2014; Bilkovic et al., 2016). NNBF are being lost throughout coastal zones, in part due to the lack of detailed and local actionable information about the many services and benefits that these features can provide (Arkema et al., 2017). It is suggested that providing targeted information can help bolster local decisions that preserve and create new NNBF (Center for Coastal Resources Management, 2014; Spalding et al., 2014b; Restore America’s Estuaries, 2015; Sutton-Grier et al., 2015; Arkema et al., 2017).
Here we present an adaptable and generalized framework, informed by input from community partners that ranks existing NNBF and enables identification of areas where new or restored NNBF would provide maximum benefits for community resilience to coastal flooding. With the goal of providing actional information for local decision-making via an interactive map viewer1, this framework utilizes a geographic information system (GIS) approach that links NNBF with buildings using high resolution elevation data to create inundation pathways. While benefit frameworks can be modified to evaluate the provision of different combinations of services (VanZomeren and Acevedo-Mackey, 2019), our approach focuses on two primary benefits: 1) mitigating coastal flooding impacts on built infrastructure, and 2) allowing communities to take advantage of Federal and state incentives for communities to reduce flood risk and improve water quality, specifically the Federal Emergency Management Agency’s (FEMA) National Flood Insurance Program (NFIP) Community Rating System (CRS) (hereafter CRS) Credit Program, and the water quality load reduction credits for approved best management practices of the Chesapeake Bay Program Total Maximum Daily Load (TMDL).
1.2 Study area
The study area encompasses coastal areas that are contiguous to the Chesapeake Bay, its tributaries, and Atlantic Ocean, and generally lie at less than 3 meters (10 feet) in elevation above a tidal shoreline (Center for Coastal Resources Management, 2019) (Figure 1). These at-risk areas were identified based on local experience of past storms (e.g., Hurricane Isabel in 2003, Lawrence et al., 2005), and land most vulnerable to coastal flooding (Boon, 2012; Sallenger et al., 2012; Ezer and Atkinson, 2014; Dahl et al., 2017; Boon et al., 2018; Ezer, 2019).
Figure 1
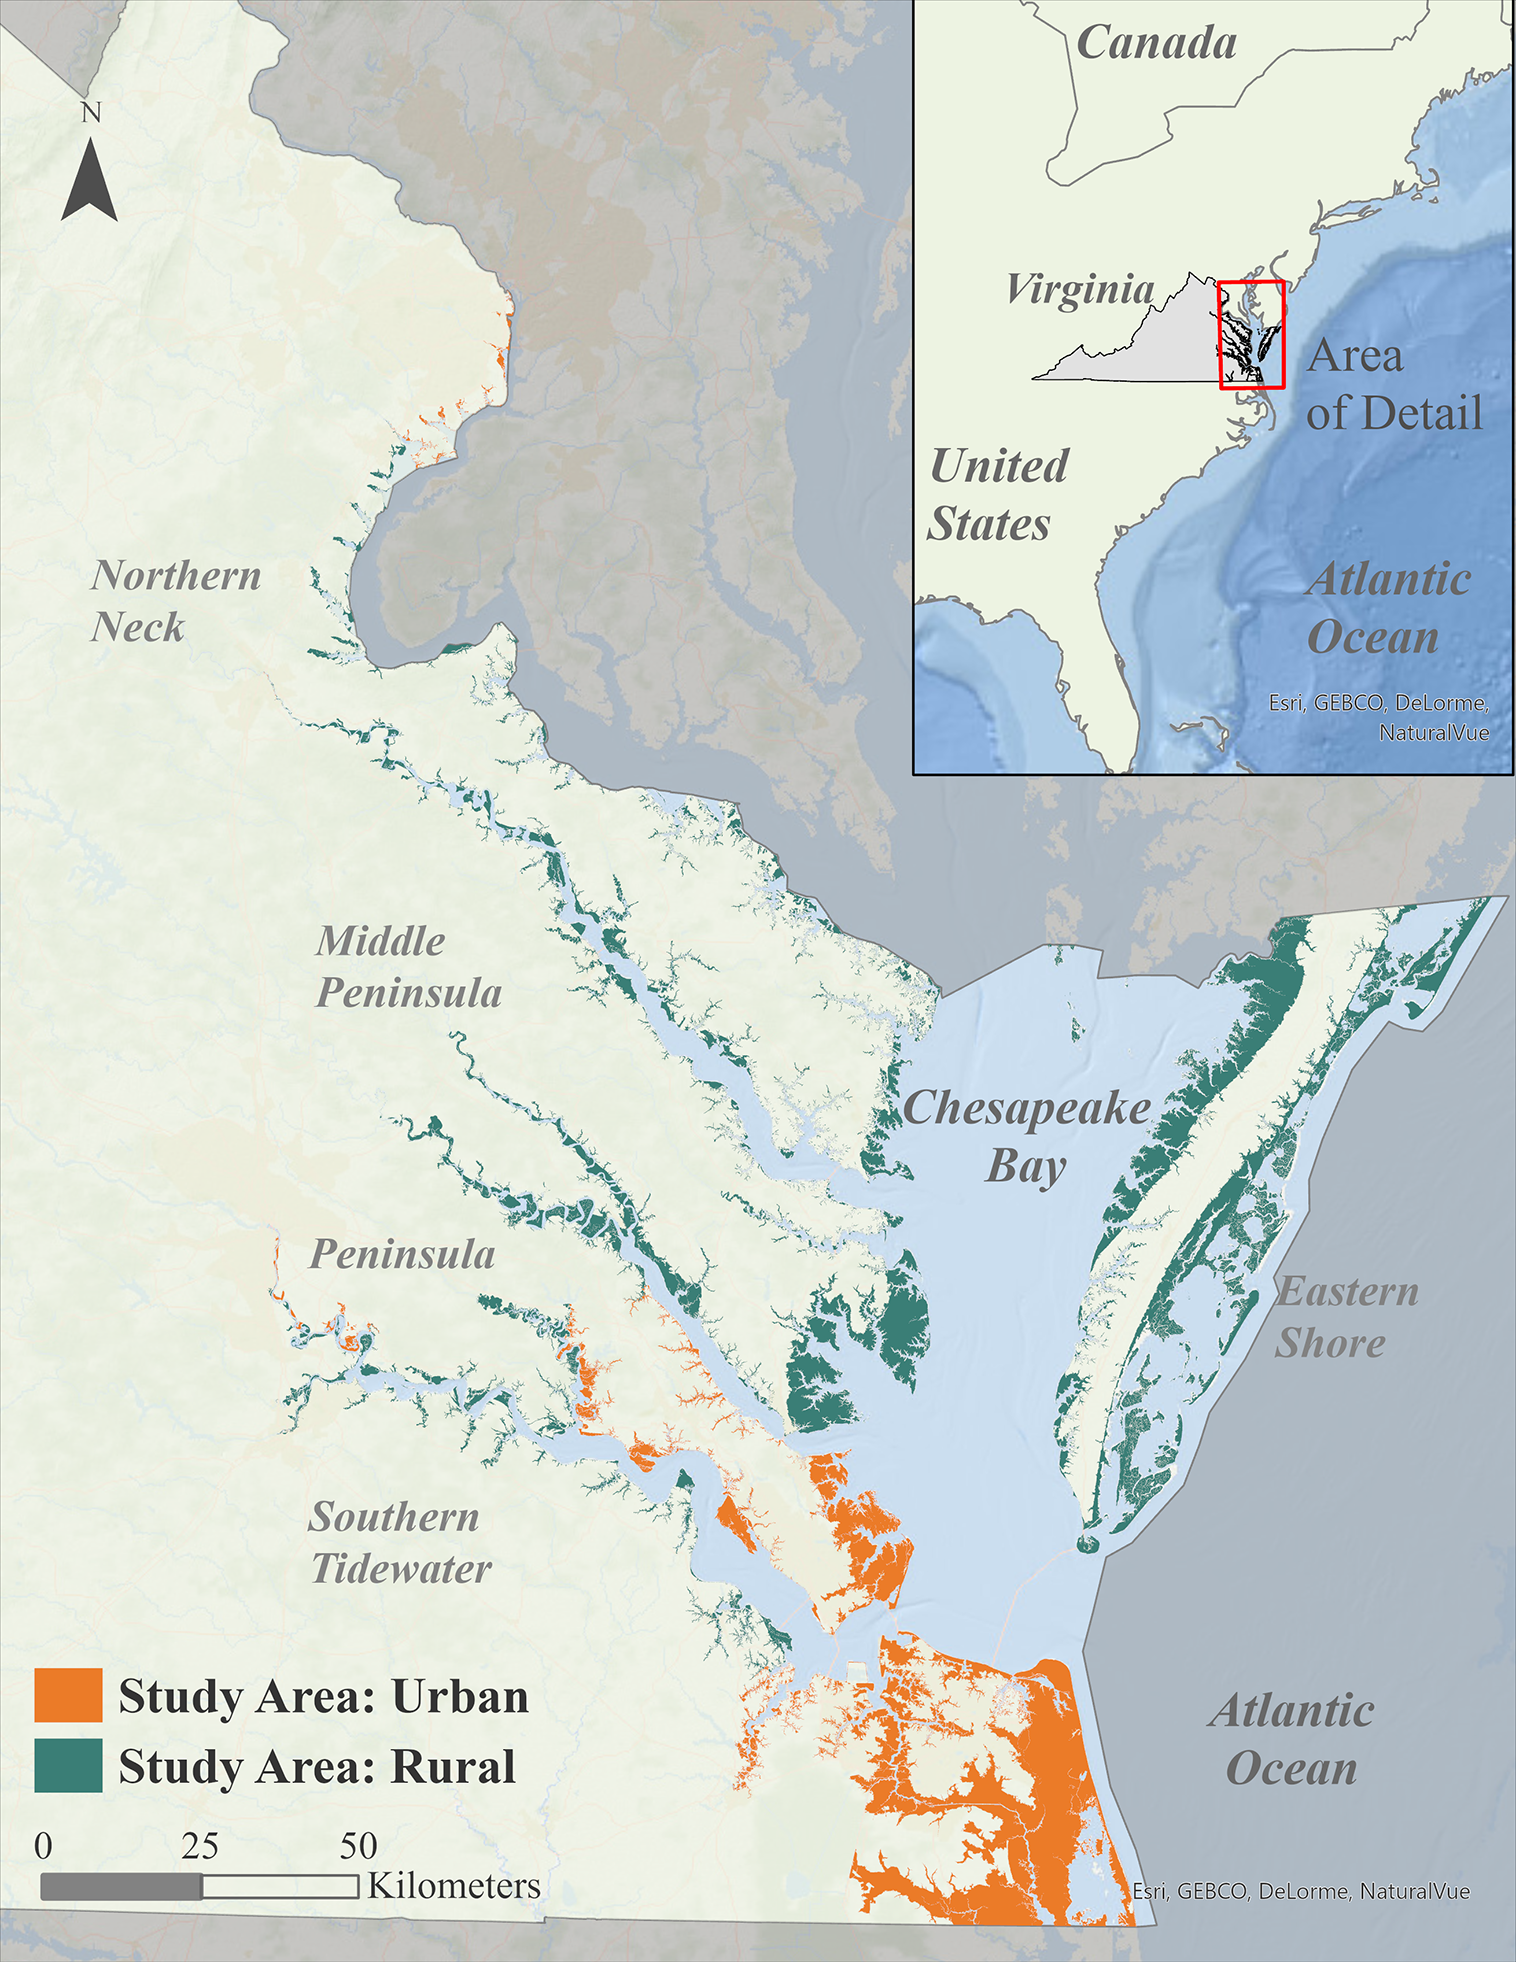
Map of study area with regions, and urban and rural areas denoted. (Imagery source: Esri, DigitalGlobe, GeoEye, i-cubed, USDA FSA, USGS, AEX, Getmapping, Aerogrid, IGN, IGP, swisstopo, and the GIS User Community).
In coastal Virginia, these low-lying and vulnerable areas comprise approximately 2,829 square kilometers of land, approximately 5% of the total area of Virginia (110,784 square kilometers). Within these areas are more than 22,100 kilometers of tidal shoreline, more than 170,000 primary buildings, and all or portions of 45 counties and cities, based on our analysis. For reference, the coastal Virginia localities encompassing the study area are home to 6 million people, or 70% of the state’s population, and provide 78% of the gross domestic product (Virginia Coastal Resilience Master Plan, 2021). The coastal land ownership includes significant areas of public ownership (22%), including large military facilities, with the remaining lands in private ownership (78%) (Virginia Natural Heritage Program, 2018).
Virginia’s coastal lands are split into five regions by the Chesapeake Bay and its tributaries: Northern Neck, Middle Peninsula, Peninsula, Southern Tidewater, and the Eastern Shore (Figure 1). It consists of a heterogeneous landscape of low-lying and steeply graded topography, extensive tidal marshes and beach and dune systems, and rural and urban development patterns. These regions, commonly known as Tidewater Virginia, include areas with steep grades and high banks, and areas typified by large tidal rivers, low-relief, and low banks (Ludwig, 2016). Development patterns are also heterogeneous, with a mix of very urbanized and rural localities. Urban areas, as defined by the U.S. Census Bureau (Virginia Department of Health, 2006), include those of the Southern Tidewater, Northern Virginia and limited areas in or near the Richmond metropolitan area (portions east of Richmond are in the study area). Rural localities are located across the Middle Peninsula, Eastern Shore, and the Northern Neck.
2 Materials and methods
2.1 Datasets
Assessment of coastal resources and their benefits to infrastructure requires spatial datasets for NNBF, as well as the inputs necessary for developing IPs: source points (building footprints) and elevation data. Available datasets were utilized to capitalize on existing data and expertise while also improving the exportability of the approach for localities with different data availability.
No comprehensive mapped NNBF inventory exists for many coastal areas, including for Virginia. NNBF datasets from multiple local, state, and national sources were collected and updated. Table 1 details data sources for each NNBF type and any processing completed.
Table 1
| NNBF Type | Processing and Data Sources |
|---|---|
| Beach | Beaches are coded as linear features indicating presence in Center for Coastal Resources Management (2019). To create polygons: linear beaches coded as ‘Wide’ were buffered by 20ft, other beaches were buffered by 5 feet. Additional beach areas were identified by extracting land cover areas coded as ‘barren’ and adjacent to Chesapeake Bay waters (Virginia Geographic Information Network, 2017b). Polygons were verified using aerial imagery (Virginia Geographic Information Network, 2017c). |
| Dune | Dune locations were digitized from Milligan et al., 2005 using aerial imagery (Virginia Geographic Information Network, 2017b) and buffered by 10 feet to create polygons. Only digitized dunes that were present in the 2005 report and in 2017 imagery (Virginia Geographic Information Network, 2017c) were included. |
| Hybrid Living Shoreline: Breakwater, Marsh Sill, and Oyster Sills |
Select permitted hybrid living shoreline projects installed between 2002-2017 were extracted from an unpublished permit database compiled by CCRM (Center for Coastal Resources Management, 2022). Project location points were mapped and buffered based on the permitted length of the project. Spatial analysis required polygons on shore, so these were projected to the shoreline digitized in Center for Coastal Resources Management (2019). Elevations of these NNBF were defined as breakwater = 0-3 feet, marsh sill = 0-2 feet, and oyster sill = 0-2 feet, based on best professional judgment. |
| Non-Tidal Emergent Wetlands, Non-Tidal Forested Wetlands, Non-Tidal Scrub-Shrub Wetlands |
Selected all wetland polygons from the National Wetlands Inventory (U.S. Forest Service, 2017) except for ‘marine’, ‘lake’, ‘riverine’, ‘freshwater pond’, and ‘other’. Eliminated areas that were overlain by the Tidal Marsh Inventory (Center for Coastal Resources Management, 2019) tidal marshes. Grouped remaining marshes into “forested”, “scrub-shrub”, and “non-tidal” based on NWI coding. |
| Scrub-Shrub | Extracted ‘scrub/shrub’ polygons from Virginia land cover classification data (Virginia Geographic Information Network, 2017b). To reduce misclassification errors, polygons in the water and adjacent to riprap were eliminated. |
| Tidal Marsh | Tidal marshes from the Tidal Marsh Inventory (Center for Coastal Resources Management, 2019). |
| Wooded | Extracted ‘forested’ and ‘tree’ polygons from Virginia land cover classification data (Virginia Geographic Information Network, 2017b). Inspection of the land cover data revealed inconsistencies with how forest and tree areas were defined (i.e., forested areas were defined as areas of more than 1 acre but many areas in the map were coded as forest but smaller than one acre). Because data seemed not to support two separate classifications, these were combined into a ‘wooded’ class. To reduce other misclassification errors, polygons in the water and adjacent to riprap were eliminated. |
List of sources and processing steps used to create an inventory of NNBF across the study area.
Multiple data sources were used to create the primary buildings layer with identifiers for important community infrastructure. The statewide building footprint dataset (Virginia Geographic Information Network, 2017a) was processed to reduce the inclusion of secondary structures like boathouses and freestanding garages by extracting only those footprints that exceeded a minimum area of 80 m2, a threshold determined by test runs in urban and rural locales. The statewide building footprint dataset is based on locality-supplied data, and some localities lack footprint polygons. For those localities, Virginia land cover data (Virginia Geographic Information Network, 2017b) was processed to capture building footprints. The USGS National Structures Dataset (U.S. Geological Survey, 2018) was used to add information to buildings identified as critical community facilities.
Elevation data was extracted from a 1-meter resolution digital elevation model (DEM) (Danielson et al., 2016) and used to create the study area boundary, supply elevation information for NNBF, and for the spatial modeling steps detailed in Section 2.2.
2.2 Spatial modeling
Characterizing landscape connections between vulnerable infrastructure (in this study, primary buildings) and NNBF was accomplished using a least-cost path analysis. Least-cost approaches are used to delineate the most cost-effective routes across a landscape, where cost can be a function of economic cost (money), time, distance, or, as here, elevation. Using elevation as the cost function has been previously applied in hydrologic characterizations to identify concentrated flowpaths or preferential water flows across a landscape (Etherington, 2016; Wallace et al., 2018; Luo et al., 2019), and in Virginia for evaluating stormwater management and flows (Chesapeake Conservancy, n.d.). Using elevation values as the cost function results in a delineation of the lowest overall elevation connections from source points (in this case, building footprints) to the destination at the shoreline (the lowest elevation cells in the DEM), and were termed inundation pathways (IPs) for this study. The least cost path is best used as a qualitative rather than a quantitative measure of connectivity (Etherington, 2016), and IPs are best interpreted as highlighting areas where coastal flooding is likely to flow through on approach towards buildings. IPs are therefore locations where the presence of an NNBF is highly likely to provide flooding mitigation benefits for community infrastructure.
A series of geoprocessing steps were undertaken to create IPs using tools in ESRI’s ArcMap 10.6.1 Spatial Analyst toolbox (ESRI, 2017) using ESRI’s guidance for generating least-cost pathways (ESRI). Prior to running least-cost tools, the DEM was clipped to the tidal shoreline digitized from aerial imagery (Center for Coastal Resources Management, 2019) so that the lowest elevation cells of the DEM nearest to a source point coincided with the boundaries of digitized fine-scale hydrologic features like tidal channels and small coastal inlets. This addressed the loss in detail including small tidal marsh channels across relatively flat tidal marsh terrain, a known issue resulting from processing steps undertaken in least- cost analyses (Callow et al., 2007; Kenny et al., 2008).
Creation of the cost surface was accomplished by smoothing imperfections in the raster data then running the Flow Direction tool to calculate elevation differences across cells. Finally, the Cost Path tool was run iteratively for each of the more than 170,000 buildings to create the IPs. Computer processing time for these analyses was significant, so geoprocessing models were created to restrict each Cost Path analysis to a 2000-meter buffer around each building. This step decreased processing time without restricting resultant IP size. To further decrease processing times, geoprocessing was run in batches by region (e.g., for the Eastern Shore, for the Middle Peninsula, etc). Even with these adjustments, the geoprocessing still took months on dedicated computers. While this study utilized the best available tools and knowledge available at the time of analysis, for subsequent applications it is likely that using more current software (e.g., ESRI’s ArcPro) or utilizing other scripting (e.g., Python) tools could reduce processing time.
The resultant IPs can be complex in shape and often indicate more than one distinct pathway for a single building (Figure 2). Each building’s collection of flow paths is considered as one IP. IPs lie along low elevation connections anywhere on the land surface (Figure 2A) and not only directly from the closest tidal shoreline. This reflects the possibility of coastal flooding approaching from other places such as a nearby low-lying area like a wetland. Multiple building IPs often overlap in low-relief areas (Figure 2B). IPs are a simplified representation of the areas with highest probability to intercept coastal flooding flow, and do not map flooding extents or represent timing of flooding.
Figure 2
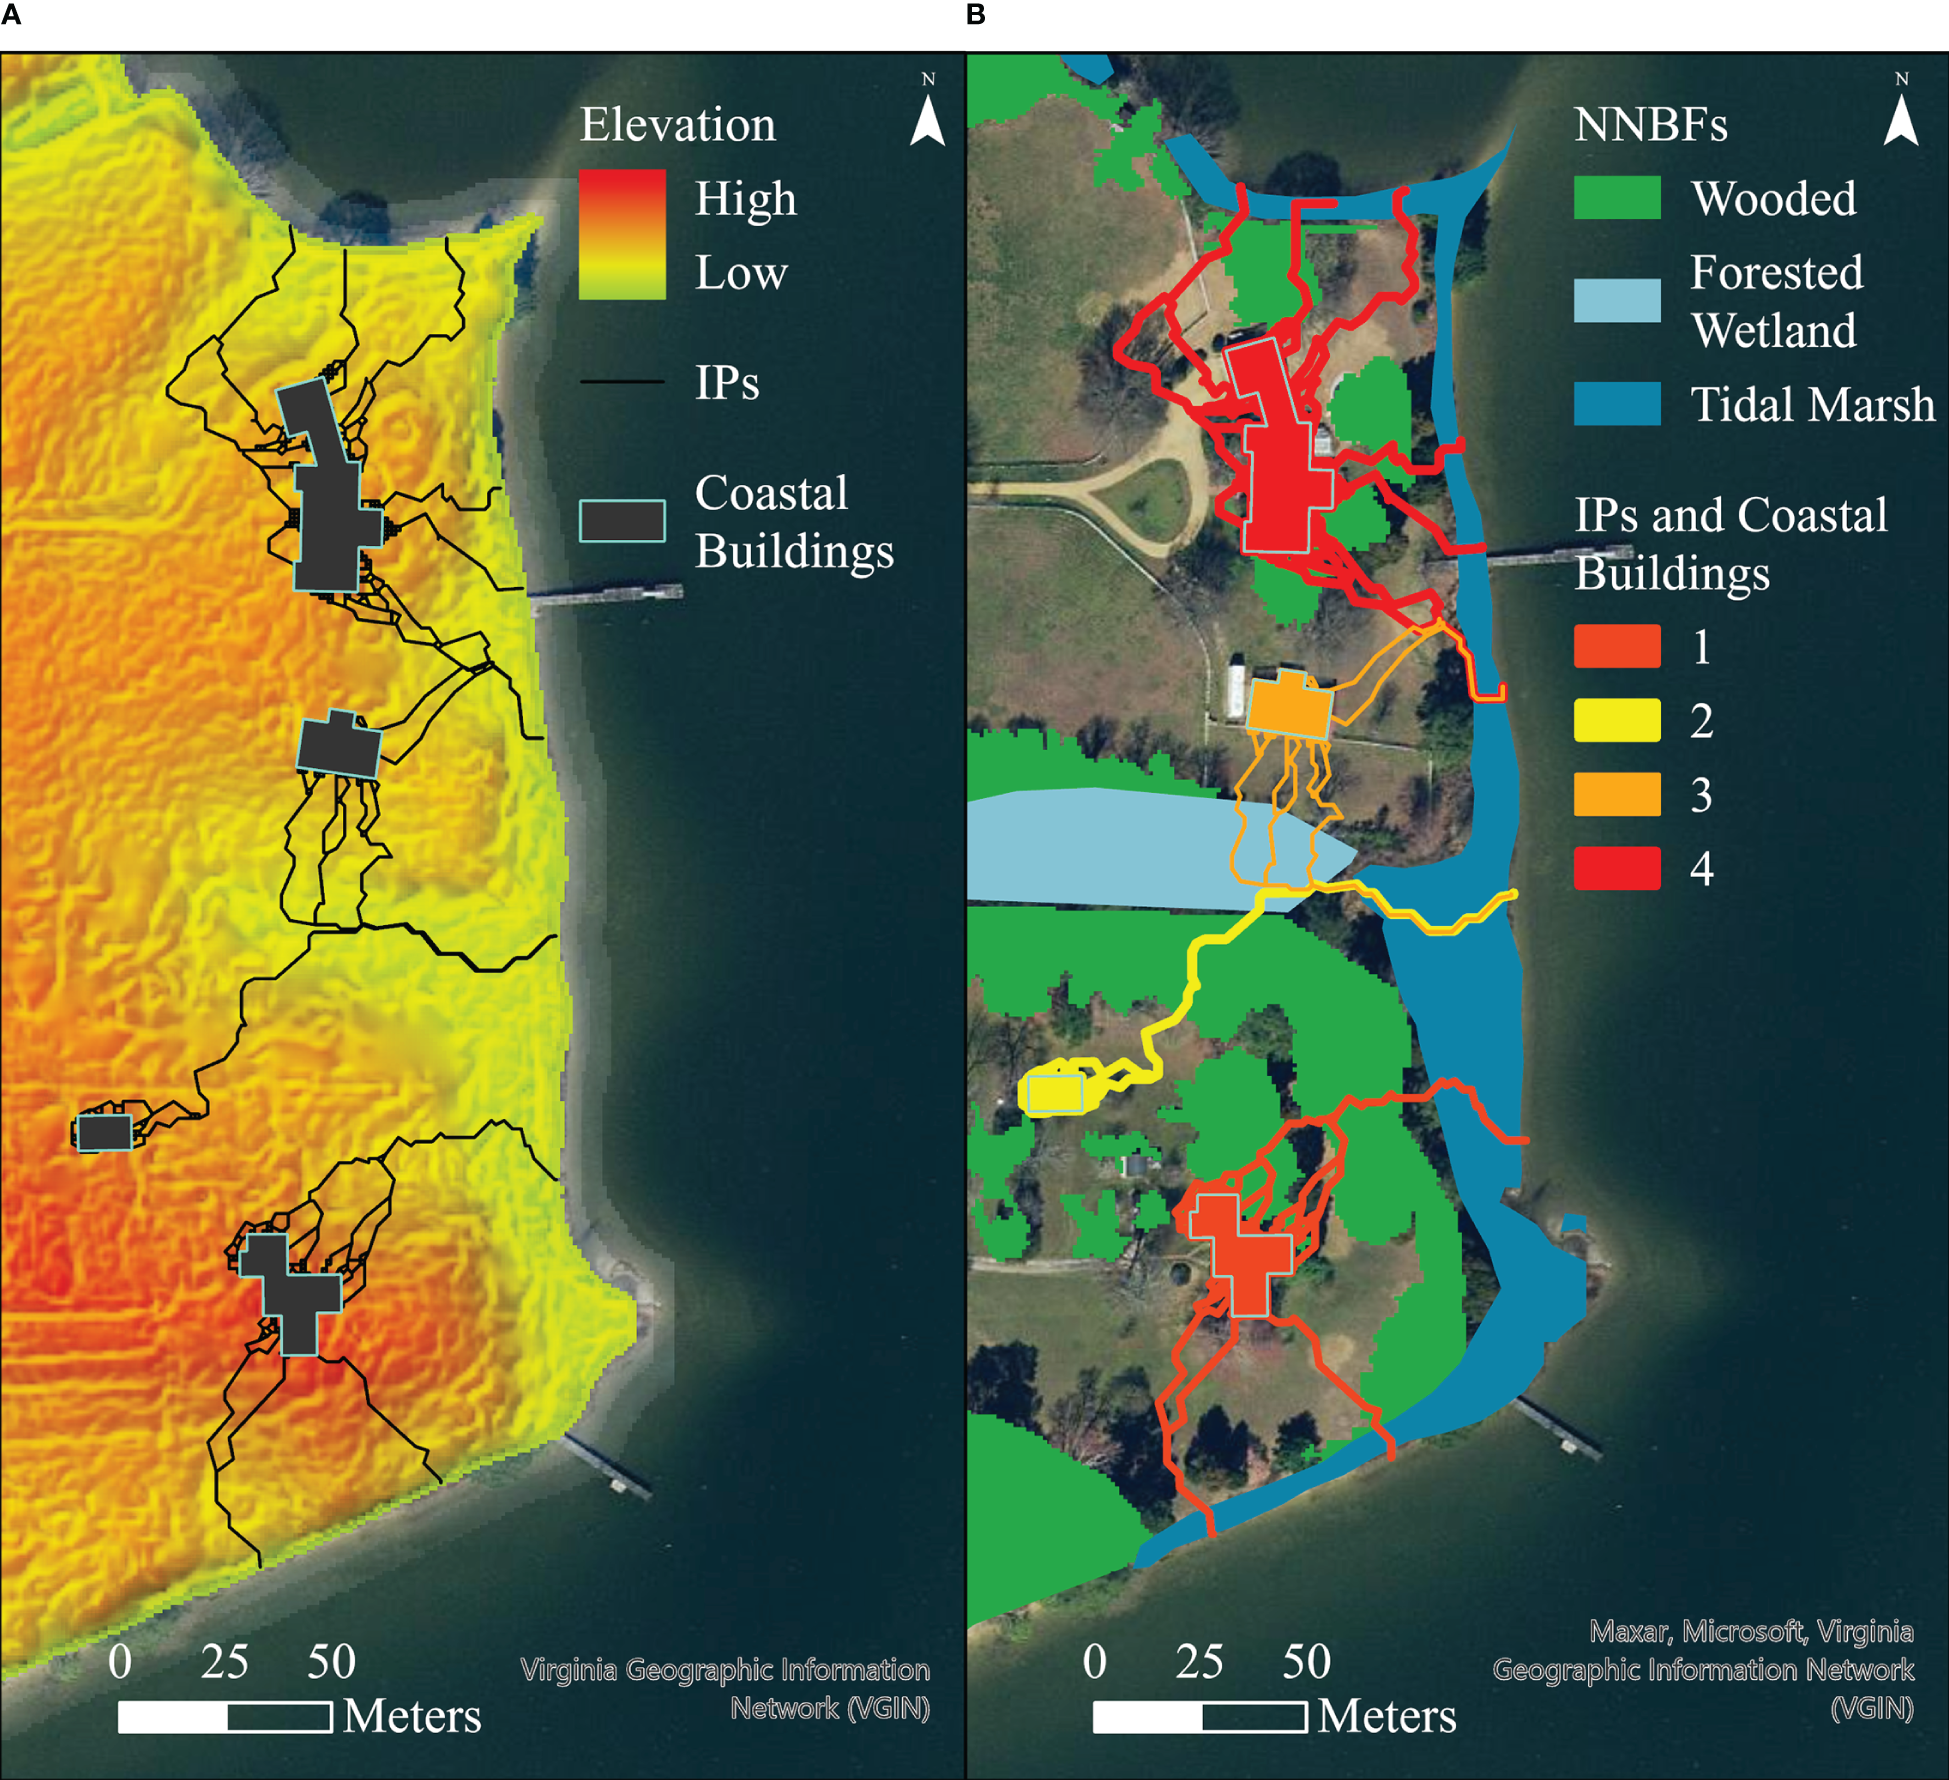
Maps depicting Inundation Pathways (IPs) and coastal building footprints for a location in the Middle Peninsula. (A) shows buildings and IPs with the underlying elevation raster, illustrating that IPs follow the lowest overall elevation connections between a building and the shoreline. (B) depicts those same buildings and IPs showing how each IP/building may be complex in shape and that buildings can have overlapping IPs. This figure also displays the spatial relationship between IPs and NNBF. (Imagery source: Virginia Geographic Information Network, 2017c).
Assessing the relative provision of benefit of an NNBF to community infrastructure is accomplished by using the Spatial Join tool to count the number of IPs that intersect an NNBF. For example, Figure 2B depicts IPs from building 2 and building 3, both of which intersect a forested wetland and a tidal marsh; each of those NNBF would have two IP intersections recorded. NNBF that intersect IPs for many buildings are identified as highly beneficial and used to score criteria 2 and 3 of the Coastal Benefit Index, described in Section 2.3. The IP approach also allows for identifying buildings that lack benefits from NNBF (i.e., IPs with 0 intersecting NNBF) which defines target areas for the creation of new NNBF, described in Section 2.4.
2.3 The coastal benefit index
The Coastal Benefit Index (CBI) was developed to highlight those NNBF that provide the most benefits for communities, so that those features can be prioritized for preservation and/or restoration at the local level. The CBI ranking approach consists of four criteria or indicators intended to evaluate the degree that an NNBF can provide flooding mitigation services for community buildings and allow communities to take advantage of incentive programs that provide financial or other benefits for the community. The four criteria evaluated in this study are (1) NNBF Flooding Mitigation Potential, (2) Coastal Building Benefit, (3) Critical Community Facility Benefit, and (4) Co-Benefits Potential, and are ranked from 1 to 3, with rank 1 representing low benefit provision and rank 3 representing high benefit provision.
2.3.1 NNBF flooding mitigation potential
The potential for an NNBF to provide coastal flooding mitigation services is a function of both its intrinsic physical characteristics that can mitigate flooding impacts (‘capacity’), and its elevation, which controls the frequency that the feature is exposed to flooding (‘opportunity’).
NNBF capacity was assigned based on three physical characteristics important for attenuating wave energy and allowing for the infiltration of flooding waters: permeability of ground soils, surface roughness, and vegetation roughness (i.e., stem density), and is shown in Table 2. A simple ranking approach to assigning relative scores for these characteristics was based on literature review and best professional judgment. For example, surface roughness values in Table 2 are informed by Manning’s roughness coefficients used in hydrodynamic modelling, but do not directly relate to those values. This study is focused on assessing the relative provision of flooding mitigation actions from NNBF across a heterogeneous mix of landscape types of varying slope and soil composition, across seasons, and for a range of flooding depth scenarios – all factors which change the appropriate roughness coefficients (see Ye et al., 2018 for one discussion of roughness coefficient dynamics). Thus, relative scores were used.
Table 2
| Scoring: 1=low, 2=moderate, 3 = high | |||||
|---|---|---|---|---|---|
| Flooding Mitigation Factors | |||||
| NNBF Type | Permeability | Surface Roughness | Vegetation Roughness | Total | Capacity Score (Normalized) |
| Beach | 3 | 1 | 0 | 4 | 0.4 |
| Dune | 3 | 2 | 2 | 7 | 0.7 |
| Hybrid Living Shoreline: Breakwater* | 0 | 3 | 0 | 7 | 0.7 |
| Hybrid Living Shoreline: Marsh Sill* | 0 | 3 | 0 | 10 | 1 |
| Hybrid Living Shoreline: Oyster Sill* | 0 | 3 | 0 | 10 | 1 |
| Non-Tidal Emergent Wetlands | 2 | 3 | 2 | 7 | 0.7 |
| Non-Tidal Forested Wetlands | 2 | 3 | 3 | 8 | 0.8 |
| Non-Tidal Scrub-Shrub Wetlands | 2 | 3 | 3 | 8 | 0.8 |
| Scrub-Shrub | 3 | 3 | 3 | 9 | 0.9 |
| Tidal Marsh | 2 | 3 | 2 | 7 | 0.7 |
| Wooded | 3 | 2 | 3 | 8 | 0.8 |
Capacity scores assigned to NNBF types characterize the relative potential for an NNBF to mitigate flooding damage and were scored using literature review and best professional judgment.
*total score for these NNBF reflects contribution of structure and planted marsh/beach together.
The opportunity for an NNBF to provide flooding mitigation services is related to its location in the landscape, and specifically its elevation in relation to coastal flooding events. Rather than evaluating flooding scenarios based on historic events (spatial data for which are often lacking, as here in Virginia) or using hydrodynamic modeling (also not commonly available), water level records from a nearby tidal gauge (Virginia Natural Heritage Program, 2018) were used to calculate the opportunity score (Table 3), which is based on the frequency of high-water events reaching a set of elevation zones. High-water events were defined as distinct episodes of consecutive water level recordings above 0m. Each NNBF was then assigned an opportunity score based on the minimum elevation band that it occupies. Low elevation NNBF, which encounter flooding waters first and most often, are most frequently able to mitigate coastal flooding impacts, and therefore receive a higher score.
Table 3
| Maximum elevation of flooding event | Percentage of flooding events reaching elevation | Opportunity Score (Decimal Value) |
|---|---|---|
| > 5 ft | 0.1% | 0.001 |
| > 4 ft | 0.3% | 0.003 |
| > 3 ft | 1% | 0.01 |
| > 2 ft | 10% | 0.1 |
| > 0 ft | 100% | 1 |
Opportunity scores represent how often an NNBF encounters coastal flooding waters and has the opportunity to mitigate coastal flooding impacts and is based on the elevation of the NNBF.
A flooding mitigation potential score was calculated for each NNBF by multiplying capacity and opportunity scores. Resultant scores ranged from 0-1 and the values were divided into three groups containing approximately equal numbers of NNBF (i.e., tertiles), to reflect the relative ranking of low, medium, or high for each individual NNBF to provide flooding mitigation services (Table 4).Ranking and scoring scheme for each of the four criteria considered in the Coastal Benefits Index (CBI).
2.3.2 Coastal building benefit
To assess the benefit of an NNBF to buildings in the study area, IP intersections were counted for each NNBF as shown in Figure 2B, except for dunes. Dune features were evaluated using a slightly different approach because IPs do not intersect the relatively high-elevation dune features. However, because dunes provide important flooding mitigation benefits for communities (Fernández-Montblanc et al., 2020), they are important to include. Dunes were scored by counting the number of IPs within 100-feet of the dune polygon.
To score this criterion, NNBF were grouped into tertiles to represent the ranking of low, medium, and high, described in Table 4.
Table 4
| Criteria | Rank (Score) | ||
|---|---|---|---|
| Some Benefits Low/No (1) |
Many Benefits Moderate (2) | Most Benefits High (3) |
|
| NNBF Flooding Mitigation Potential (score) Flooding mitigation potential score based on elevation and feature type. |
Lower Tertile 0-0.008 |
Middle Tertile 0.008-0.4 |
Upper Tertile >0.4 |
| Coastal Building Benefit (# buildings) Number of IPs that intersect the NNBF. |
Lower Tertile 0 |
Middle Tertile 1 |
Upper Tertile 2 or more |
| Critical Community Facility Benefit Whether an IP for a critical facility intersects the NNBF. |
No | Yes | |
| Co-Benefits Potential (# Co-Benefits) Potential for NNBF to generate CRS or water quality credits. |
0 | 1 | 2 |
Ranking and scoring scheme for each of the four criteria considered in the Coastal Benefits Index (CBI).
2.3.3 Critical community facility benefit
Of particular importance for community resilience are critical facilities like law enforcement facilities, medical buildings, schools, and emergency response centers. These facilities often serve as community shelters and/or bases for emergency response during storm events. An NNBF that intersects an IP from a critical community facility was assigned a high score for this category, as described in Table 4.
2.3.4 Co-benefits potential
The fourth variable considers the potential for the presence of an NNBF to be used by local governments to take advantage of Federal and state incentive programs. This study considered two programs: 1) FEMA CRS crediting program for participating localities’ floodplain management activities and 2) TMDL credits for employing Best Management Practices (BMPs) to improve water quality.
Participating in the CRS program allows localities to lower flood insurance premiums for residents by engaging in floodplain management activities. The amount of discount available is determined by the number of credits a locality receives based on particular activities they undertake, including, under Section 420, preserving natural open space and natural floodplain functions (Federal Emergency Management Agency, 2017). In Virginia, the Chesapeake Bay Preservation Act mandates the conservation and protection of a Riparian Protection Area (RPA) which consists of natural features (e.g., wetlands) that are hydrologically connected to the Chesapeake Bay and a 100-foot buffer (as this dimension is specified in law, we are using the imperial system of measurement) landward of those features. Any NNBF within the RPA buffer and the FEMA-mapped special hazard flood area has the potential to gain CRS credits for the locality (Jarbeau and Stiff, 2017). Taking advantage of NNBF to provide CRS credits for the locality means that NNBF can indirectly provide financial support for residents who own flood-vulnerable property (Stiff, 2017).
Also considered is the potential for an NNBF to provide water quality services through the reduction of sediment and nutrient pollution and thereby qualify to receive water quality credits through the Chesapeake Bay TMDL program. The Bay TMDL established nutrient and sediment targets for Bay jurisdictions and accredited more than 200 BMPs including tidal and non-tidal wetlands and riparian buffers (Chesapeake Bay Program, 2022). Thus, all vegetated NNBF (i.e., NNBF except for beaches, dunes, and hybrid living shorelines with breakwaters) were considered to have the potential to receive water quality credits for localities. NNBF were scored based on how many of the two co-benefits could be provided, as described in Table 4.
2.4 Target areas for new or restored NNBF
Using the IP analysis, it is possible to identify high-priority areas where buildings currently lack benefit from NNBF and the creation or restoration of NNBF could be particularly beneficial. Target areas were defined as a 100-foot diameter circle centered on the shoreline in locations where IPs with zero intersecting NNBF cross. The 100-foot dimension was chosen to encompass the nearshore area protected by the RPA buffer, as discussed in Section 2.3.4. In some cases, multiple zero IPs hit the shoreline within 100-feet from each other, and in these cases, target area circles were merged into one polygon (Figure 3).
Figure 3
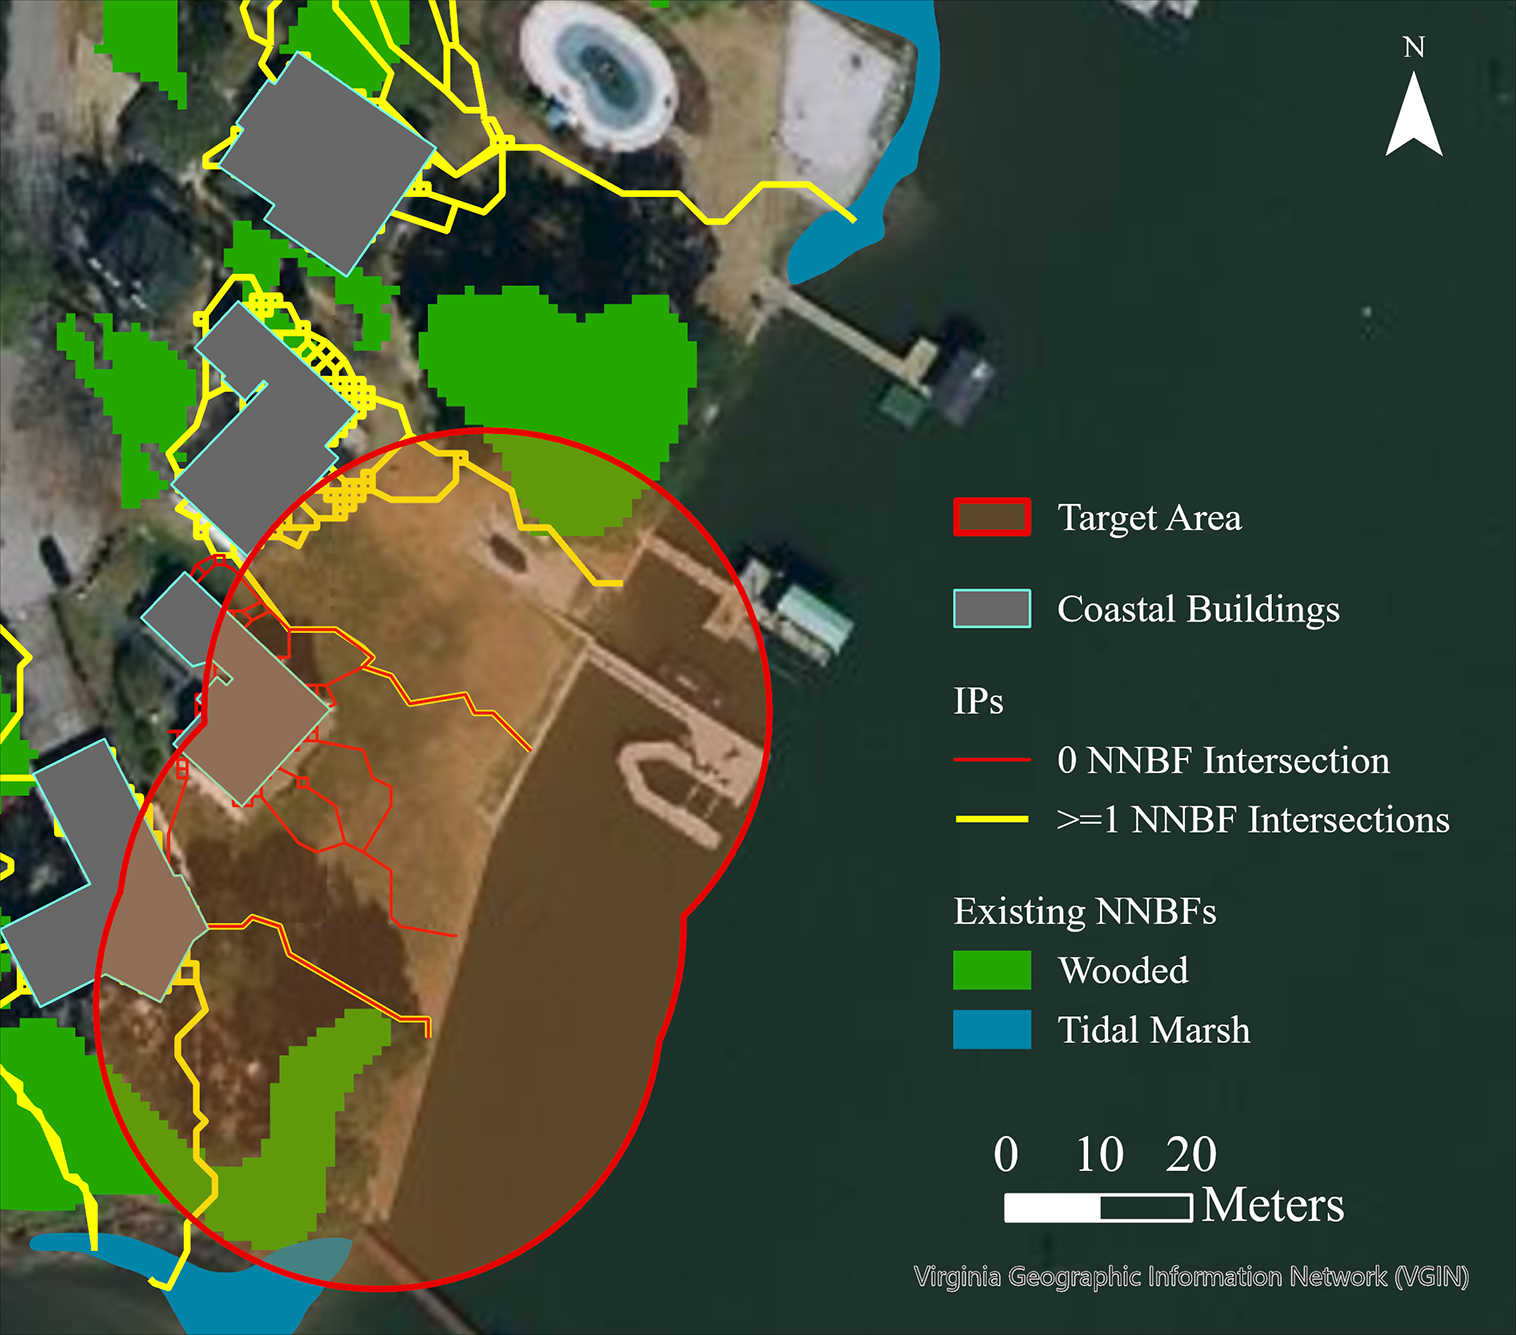
Target area in the Peninsula region that is centered on a building IP with zero intersecting NNBF, with existing adjacent tidal marsh and wooded NNBF. This target area has existing impervious surfaces and turf grass, is recommended for a non-structural living shoreline by the SMM, and structure enhancement suggestions include adding natural features to the existing bulkhead. (Imagery source: Virginia Geographic Information Network, 2017c).
While creating an NNBF along any portion of the IP would confer benefits to the associated building (or buildings), placing an NNBF on or near the shoreline maximizes the potential for the assessed benefits for the community. NNBF on or near the shoreline 1) act as a first line of defense for coastal flooding, 2) exist within the regulated and protected RPA and can therefore be used to capitalize on existing state and Federal incentive programs as discussed above, and 3) can enhance the connectivity of valuable shoreline habitats and riparian buffers. Another practical reason for centering target areas on the shoreline was the ability to capitalize on existing guidance on suitable shoreline practices for tidal shoreline erosion control via CCRM’s Shoreline Management Model (SMM). The SMM is a decision-support tool initially developed for and applied to Virginia coastlines, with expanded use for Maryland shorelines and for some Gulf of Mexico localities (Nunez et al., 2022). SMM management recommendations reflect Virginia policy requiring the use of NNBF approaches such as living shorelines, beaches, and vegetated buffers, where suitable, and can guide decision-makers on the potential NNBF practices that are suitable along a shoreline.
Relevant information to support decision making regarding potential NNBF placement in the target area was collected and provided. This includes four primary pieces of information: 1) the number of buildings with IPs intersecting the target area to provide context for how impactful a new NNBF may be for the local community, 2) land cover within and adjacent to the target area to identify existing cover types with potential for BMP credits if converted to NNBF (e.g., turf grass), 3) existing adjacent NNBF that provide an indicator of the likelihood of success for NNBF restoration or creation, as well as identifying opportunities for filling gaps along or across shoreline habitats, and 4) SMM recommendations for shoreline within the target area that can be used to guide decisions on potential suitable NNBF practices.
3 Results
3.1 NNBF and inundation pathways
Inundation pathways were delineated for more than 174,636 buildings and the NNBF they intersected. NNBF cover approximately 70% of the study area, with tidal marshes accounting for the largest extent (28%) of that (Figure 4). Yet, more than half (63%) of NNBF did not have any intersecting IPs, and the range in number of IPs per NNBF was extreme: from 0 IP intersections to a maximum of 2,468. The NNBF with the maximum number of IP intersections occurred in a forested wetland in a heavily developed area of Virginia Beach, which illustrates the important influence of both development patterns and topography on the IP analysis. Southern Tidewater and the Peninsula, both with areas of highly urbanized development, also tend to be lower relief, and therefore wide swaths of these communities with hundreds of buildings and NNBF were included within the study area. Figure 5 summarizes NNBF by region. As expected, these mostly urban and low relief of Southern Tidewater localities had a higher frequency of NNBF with IPs (52% of the NNBF in the region) than the very rural and higher relief Northern Neck region (12% of NNBF in the region). The more rural areas of the Eastern Shore and Middle Peninsula exhibit low relief but, in contrast with urban locales, contain sparser development which results in a lower frequency of NNBF with IPs (25% and 26%, respectively). The Northern Neck is the low outlier with 12% of NNBFs with 1 or more intersecting IPs, given that it is both rural and exhibits relatively higher topographic relief, resulting in a limited study area and fewer buildings and NNBF to be considered overall.
Figure 4
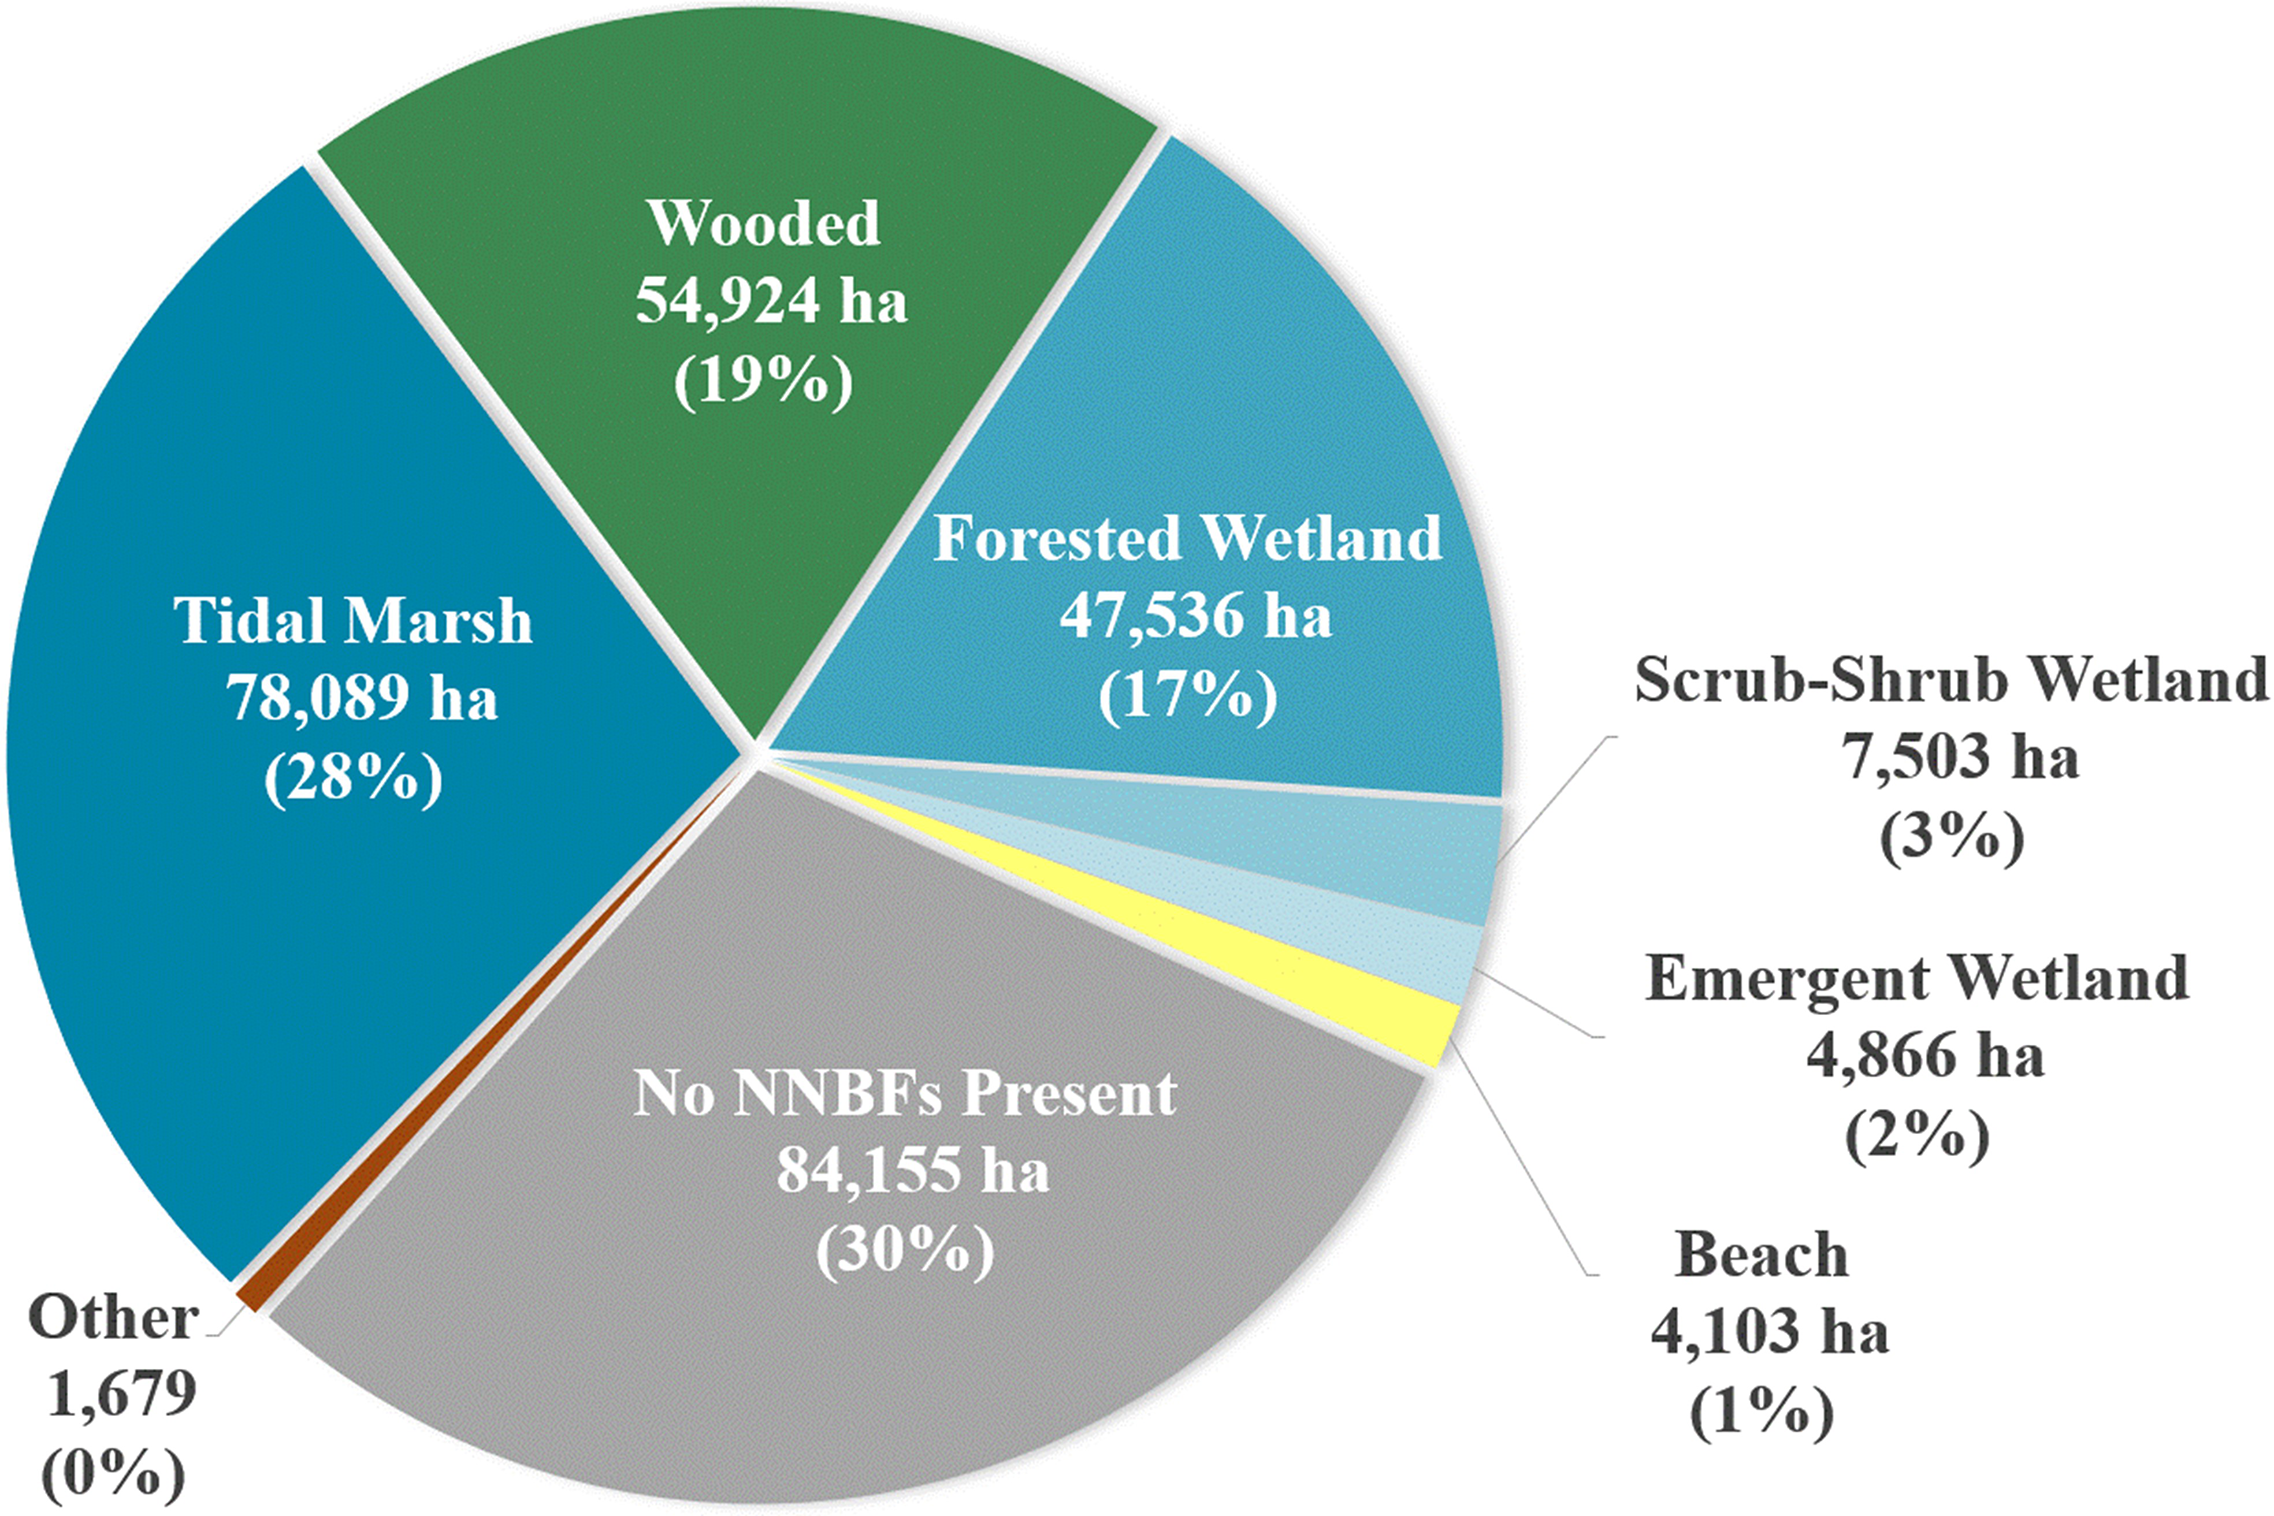
Summary of areal extent within the less than 10-ft study area, by NNBF Type. The ‘Other’ category includes NNBF types that constitute less than 1% of the study area, including: scrub-shrub (1,609ha), dune (52 ha), marsh sill (12 ha), breakwater (5 ha), and oyster sill (2 ha).
Figure 5
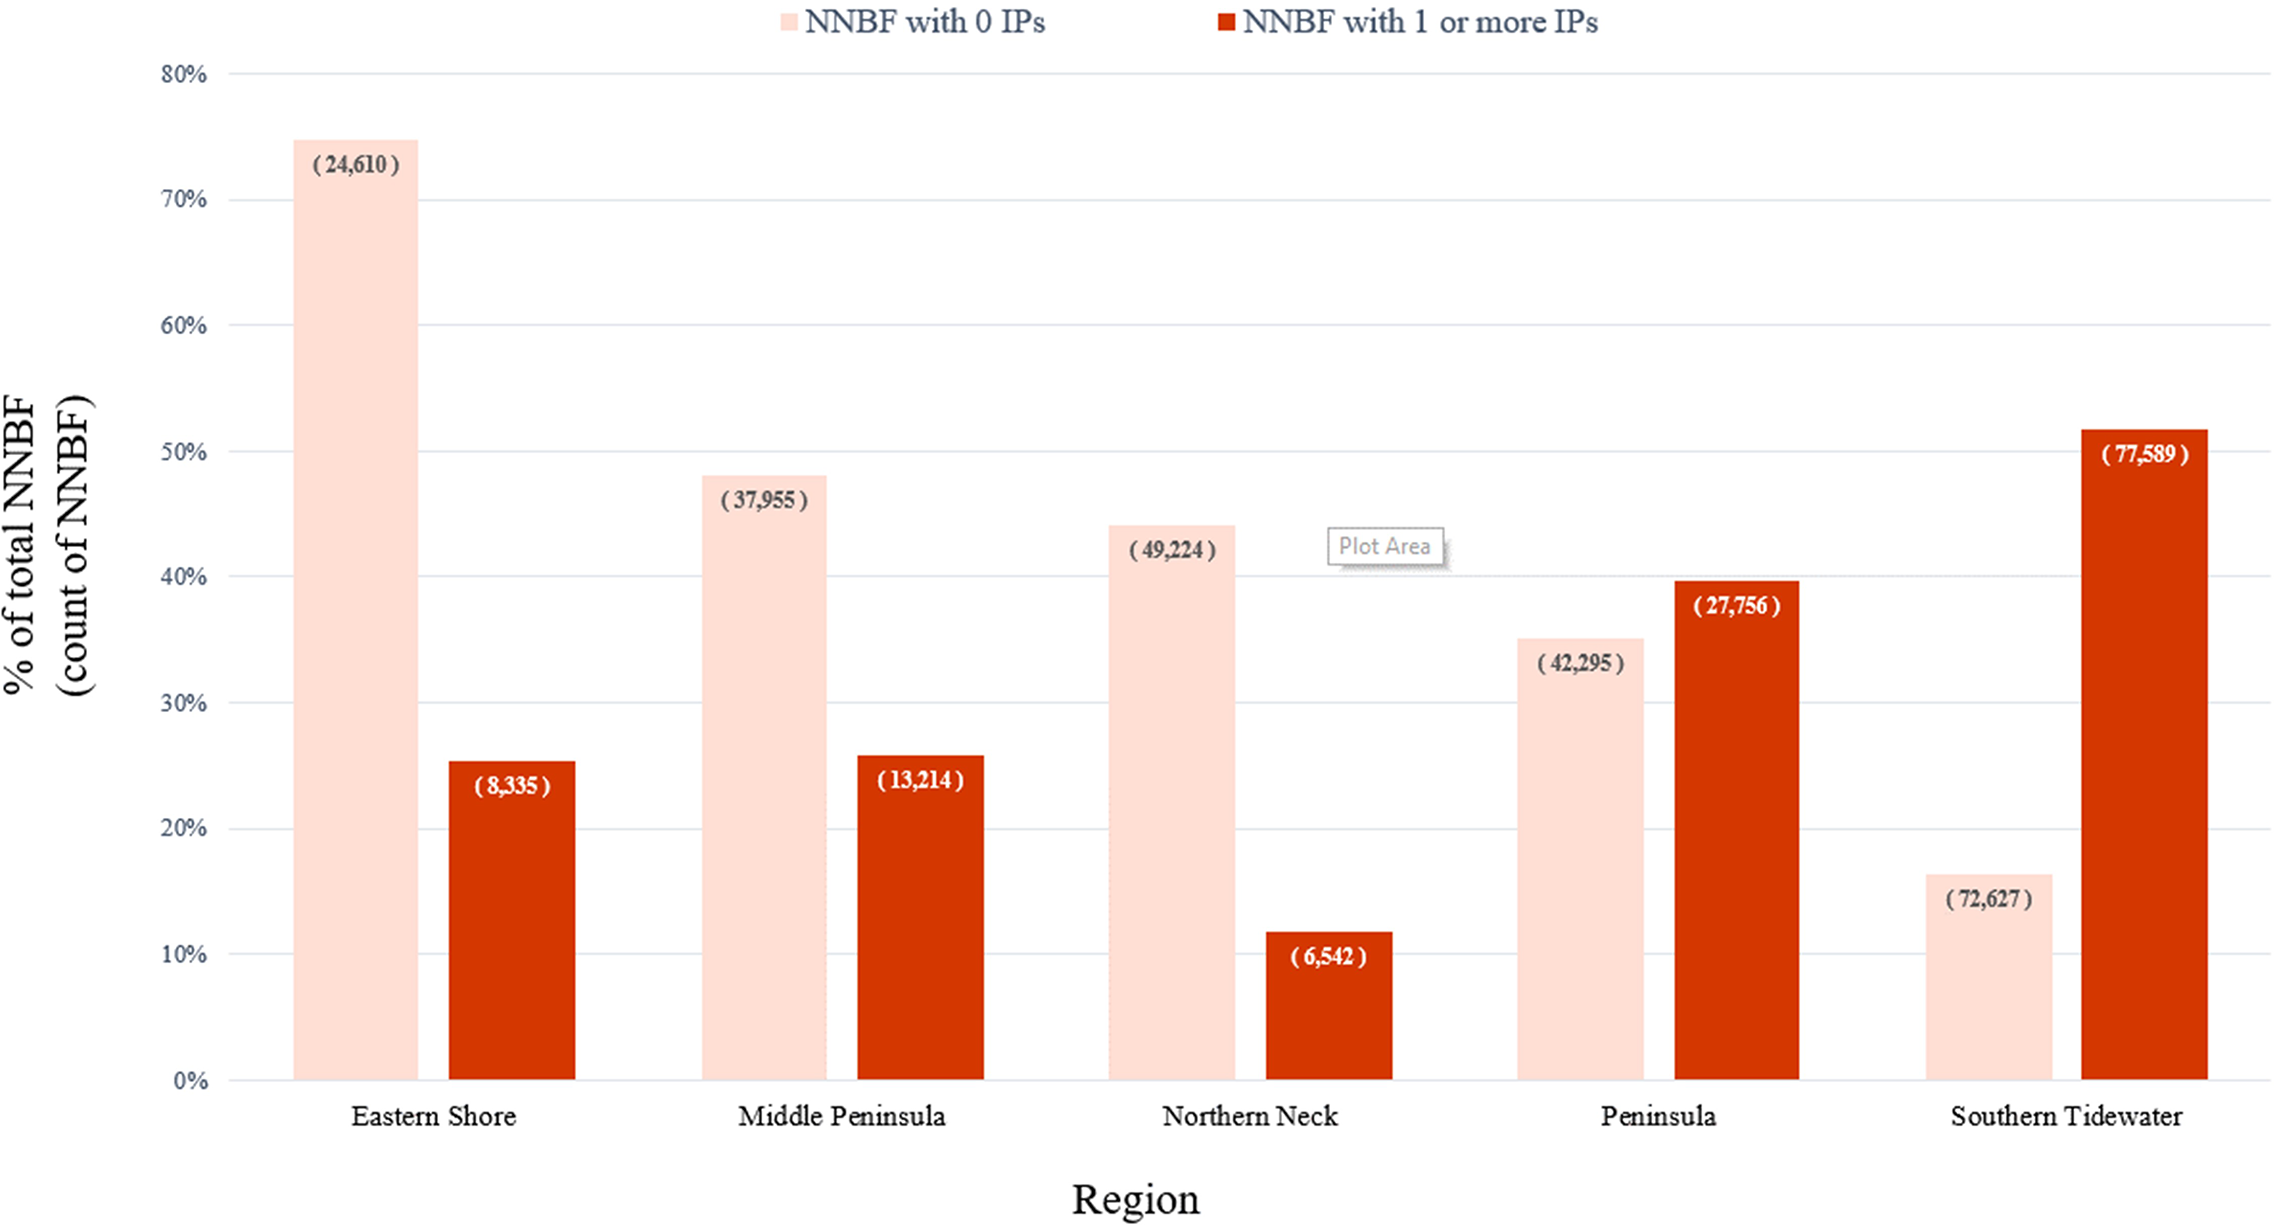
NNBF summarized by the number of IPs intersecting, per study area region.
Rankings were calculated for 360,153 existing NNBF. NNBF of all types were represented in the highest overall ranking of ‘most benefits provided’ (Figure 6).
Figure 6
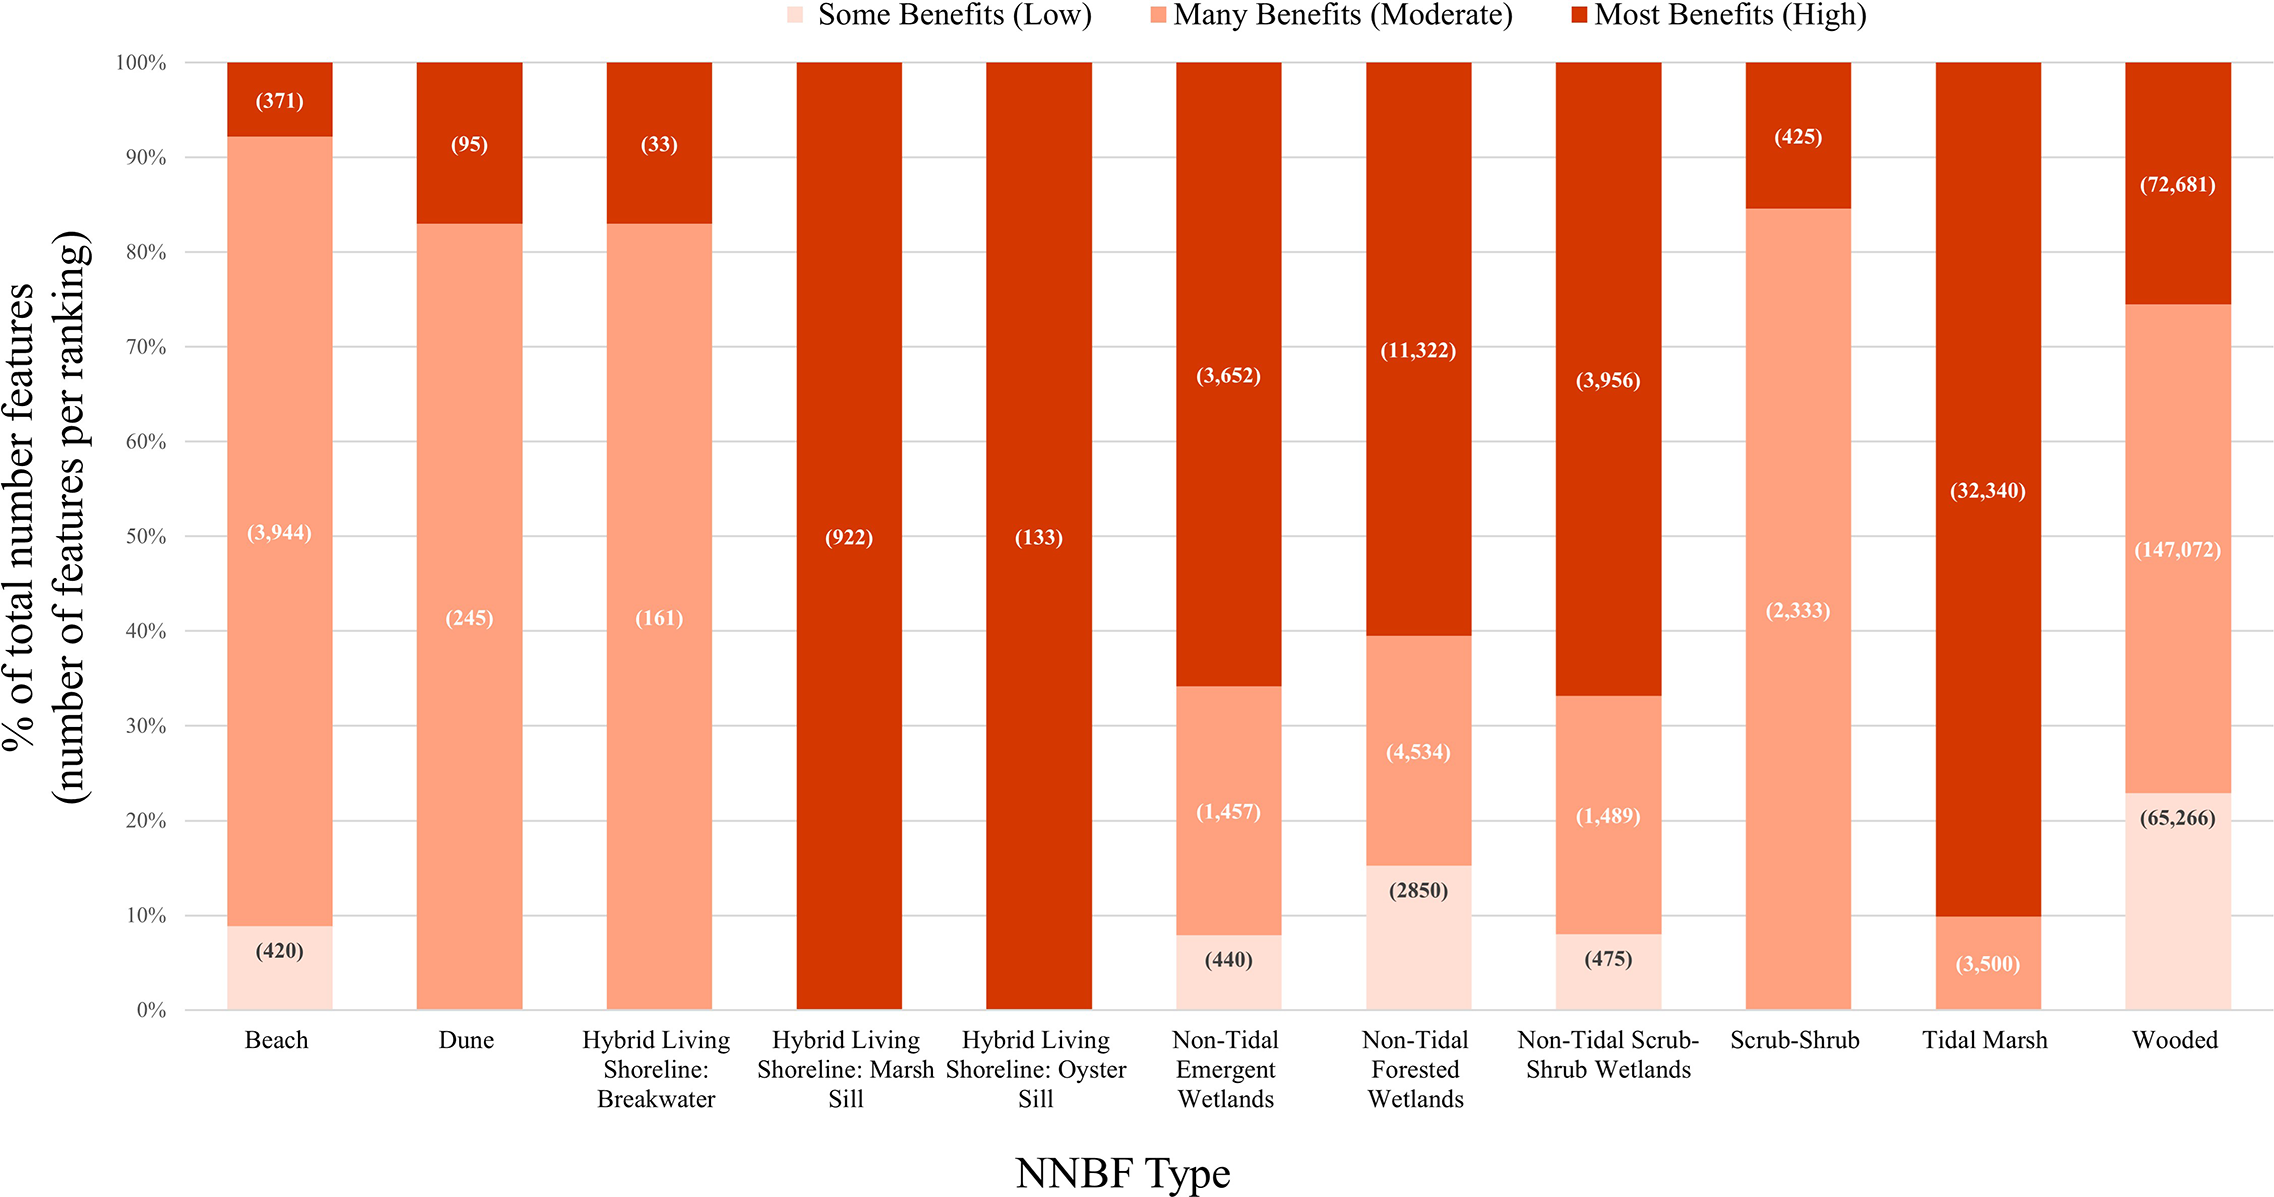
NNBF features and their CBI ranking, by percent of total number of features.
3.2 Target areas for new or restored NNBF
Target areas are locations where a building (or buildings) lack NNBF benefits (i.e., building IPs have no intersecting NNBF); see Figure 3. In the study area, only 3% of buildings had zero associated NNBF (5,637 buildings). Most buildings had one or more NNBF intersecting their IP, and buildings most commonly had either 2 or 3 associated NNBF (90% of buildings) (Figure 7). From the buildings that lack NNBF benefits, 867 unique target areas were identified. These target areas encompass 104 km (341,059 feet) of shoreline and 2.9 square kilometers (725 acres) of land area. This area is likely a conservative estimate of potential new NNBF, if implemented projects extend beyond the 100-foot diameter, which is possible, especially in less developed areas of suburban and rural settings. New or restored NNBF placed in those locations have the potential to provide benefits for 18,745 buildings in coastal Virginia. Importantly, 28 of the NNBF target areas would provide additional benefits to critical community facilities.
Figure 7
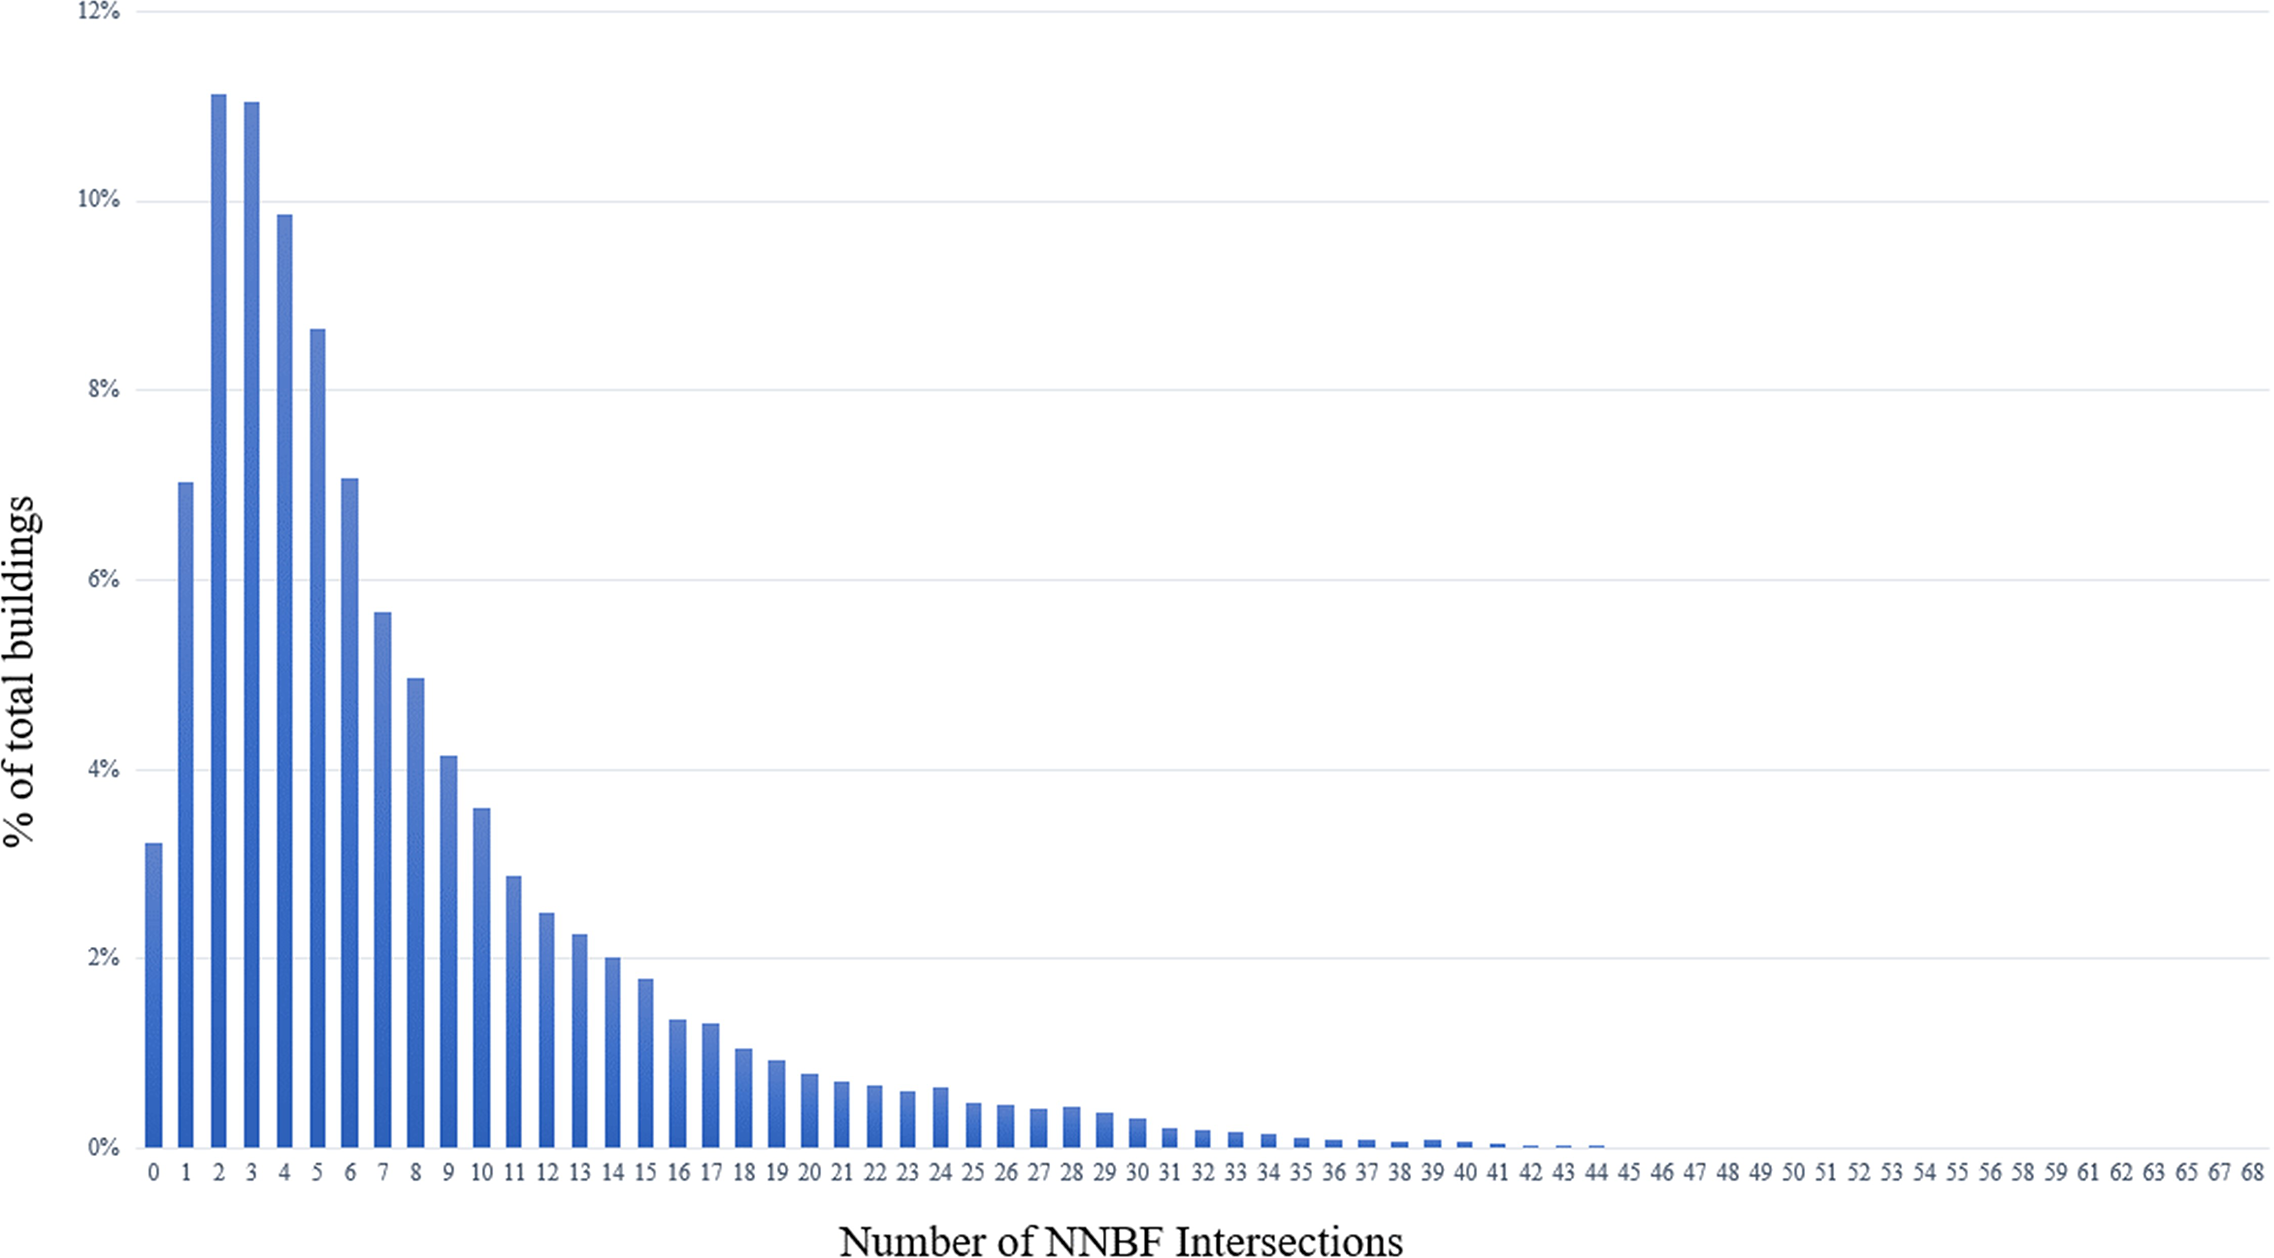
Buildings summarized by the number of NNBFs intersecting their IPs.
4 Discussion
Application of the GIS least-cost path analysis to inform the ranking of NNBF for provision of ecosystem services is a novel application of this modeling tool. Generating a visualization of the pathways for coastal water flooding allows for observations not readily made without the IPs, such as the inundation pathways shared by hundreds of buildings in urban settings. This approach also highlights instances where IPs indicate potential flooding pathways not only from the closest or readily observable tidal waters, but from other directions or some distance away.
The fine scale used in this analysis is uniquely applicable for local planning, with NNBF impacts measured on an individual building scale, because these decisions are commonly made on a parcel-by-parcel basis. NNBF targets are also at the building or parcel scale, identifying potential small-scale restoration opportunities. For example, the majority of target areas in Virginia (92%) currently include some amount of turf grass land cover, which if converted to natural cover (i.e., NNBF) would provide additional opportunity for the locality to capitalize on CRS credits and water quality incentives. When coupled with the CBI ranking for existing NNBF, the approach allows consideration of the potential cumulative benefits across the entire system that can be provided by preserving individual existing or creating new NNBF projects within a community (de Vries et al, 2021). Thus, the value of this GIS approach affords analysis and understanding at parcel, local, and regional perspectives.
The benefits ranking of NNBF also enables informed decisions to protect and preserve these features via local and state decision-making processes including for tidal and nontidal wetlands permit reviews, RPA buffer impact applications, site plan reviews, land conservation planning and acquisition, and comprehensive planning. NNBF with the highest CBI ranking are those that have the most potential to provide the most benefits assessed in this analysis and are therefore of highest priority for those preservation actions. In this study, NNBF types with the highest average CBI ranking were tidal marshes and hybrid living shorelines with marsh (i.e., projects that plant vegetation along with an oyster sill or marsh sill). More than 90% of tidal marshes and 100% of living shorelines with marsh receive the highest ranking. In general, the highest CBI rankings were achieved by vegetated NNBF at low elevation, because these features have higher flooding mitigation potential scores and the greatest potential to qualify for programmatic incentive co-benefits. Other non-tidal wetland types (emergent, scrub-shrub, and forested) were also ranked highly, with slightly more than half of those NNBF (66%, 61%, and 67%, respectively) receiving the highest rank. Upland NNBF like wooded and scrub-shrub areas, and sandy features with little to no vegetation (e.g., beaches, dunes, and hybrid living shorelines with breakwaters), tended to receive a moderate ranking. Overall, more than 125,000, or 35%, of NNBF covering 1,523 km2 receive the highest ranking of ‘most benefits provided’.
In addition, identifying gaps in NNBF benefits via the target areas can be used to direct limited resources towards new or restored NNBF in locations that increase the resilience of communities. Because of this study’s focus on benefits for buildings, target areas are skewed towards relatively developed areas. This is reflected in the high prevalence of target areas (65%) where the SMM indicates that the shoreline is within a highly modified area and recommends seeking expert advice for shoreline management to address the complex landscape setting. Despite this, most target areas (71%) are adjacent to existing NNBF like tidal marshes and upland wooded areas, and 34% of target areas had SMM recommendations to create non-structural or hybrid living shorelines as a preferred approach to addressing shoreline erosion. Creating same type NNBF within these areas would benefit habitat connectivity, and the presence of existing features could be an indicator of suitable conditions for an NNBF project.
An advantage of the indicator ranking framework and geospatial analysis is that it is flexible and can be adapted and customized to the community of focus by including additional ecosystem, economic, and/or cultural services. The approach can be modified to incorporate additional physical parameters of flooding mitigation action that NNBF can provide, additional vulnerable infrastructure such as roads, and an array of additional socio-economic criteria such as social vulnerability, agricultural commodities, consideration of the housing stock within the study area or economic valuation of coastal buildings, among others.
While this study was completed based on available data, future datasets and research could improve the methodology and geospatial modeling. Improvements include the addition of built flood water conveyance structures such as culverts and storm drains when delineating IPs, particularly in urban areas, as these types of structures can be conveyances for coastal flooding (Loftis et al., 2019; Habel et al., 2020). In coastal Virginia, adequately detailed datasets for these structures are incomplete and/or outdated. Another improvement to the overall methodology would be developing a model to directly link important offshore NNBF to communities they benefit. NNBF such as sand spits, submerged aquatic vegetation (SAV, e.g., seagrass), and barrier islands, are demonstrated to have flooding mitigation benefits for backshore communities (Pinsky et al., 2013; Hanley et al., 2014; Altman et al, 2021), and are therefore important as part of the overall picture of NNBF and community resilience.
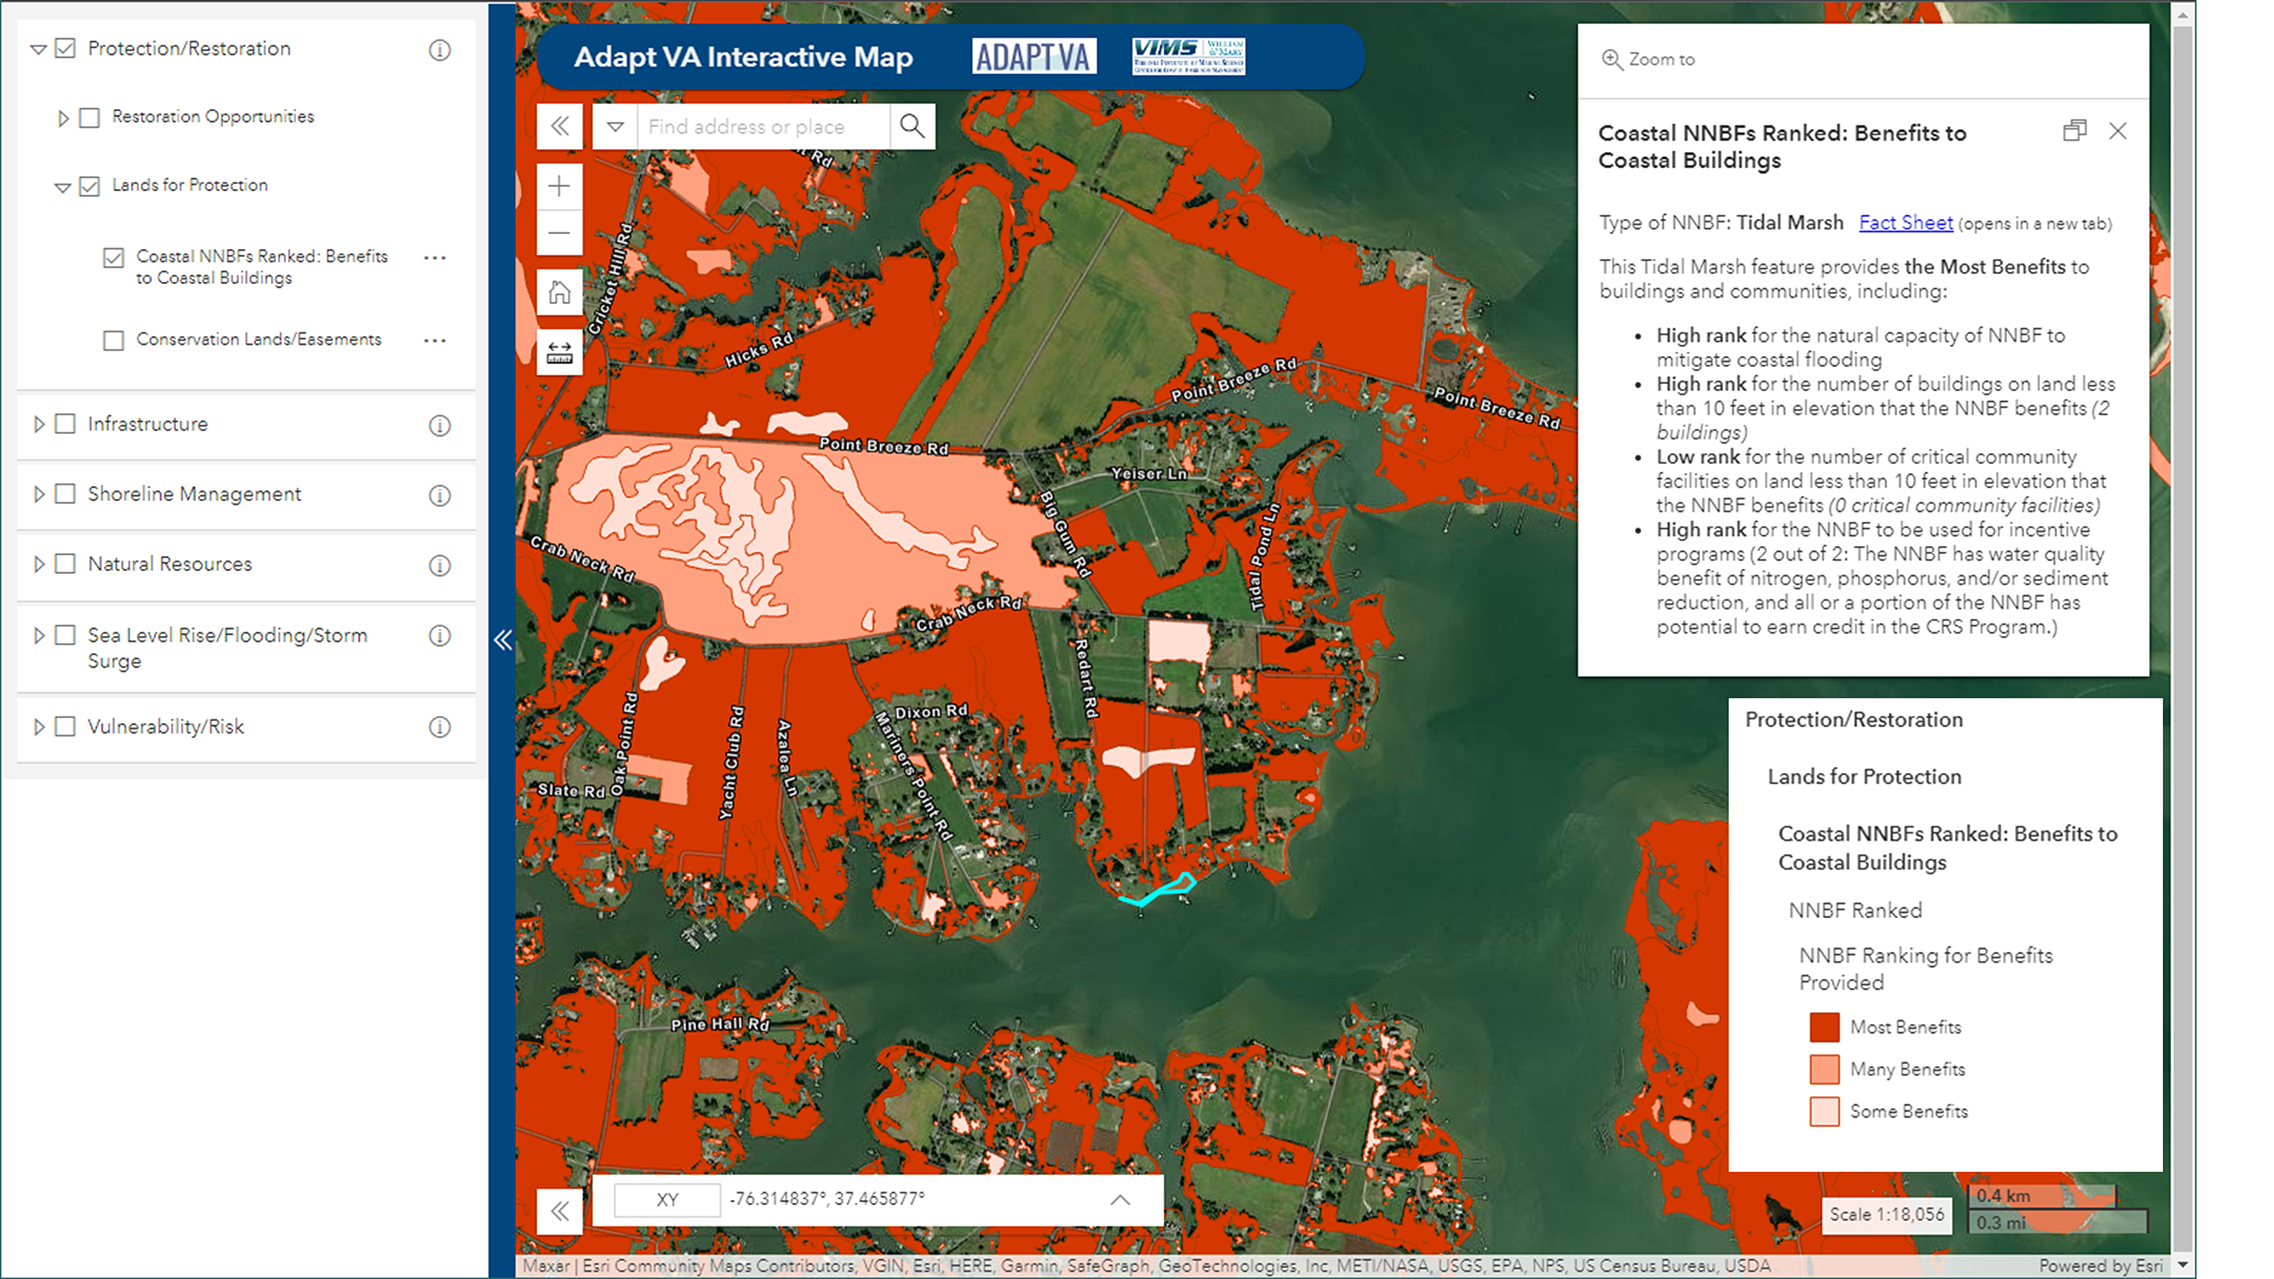
To maximize the utility of outputs for communities, project outputs were developed in consultation with and for use primarily by local decision-makers. Locality representatives were engaged during data development and modeling, as well as post modeling, to provide direction for data service and project documentation. Project information are served via an interactive map tool 1 housed on a collaborative website, AdaptVA. Figures 8, 9 show screenshots of the ranked NNBF output and informational popup located under the Lands for Protection section, and target areas and associated popup located under the Restoration Opportunities group. Project information and NNBF fact sheets are served on the CCRM website2 and accompanied by outreach and training to potential data users from local and state agencies.
Figure 8
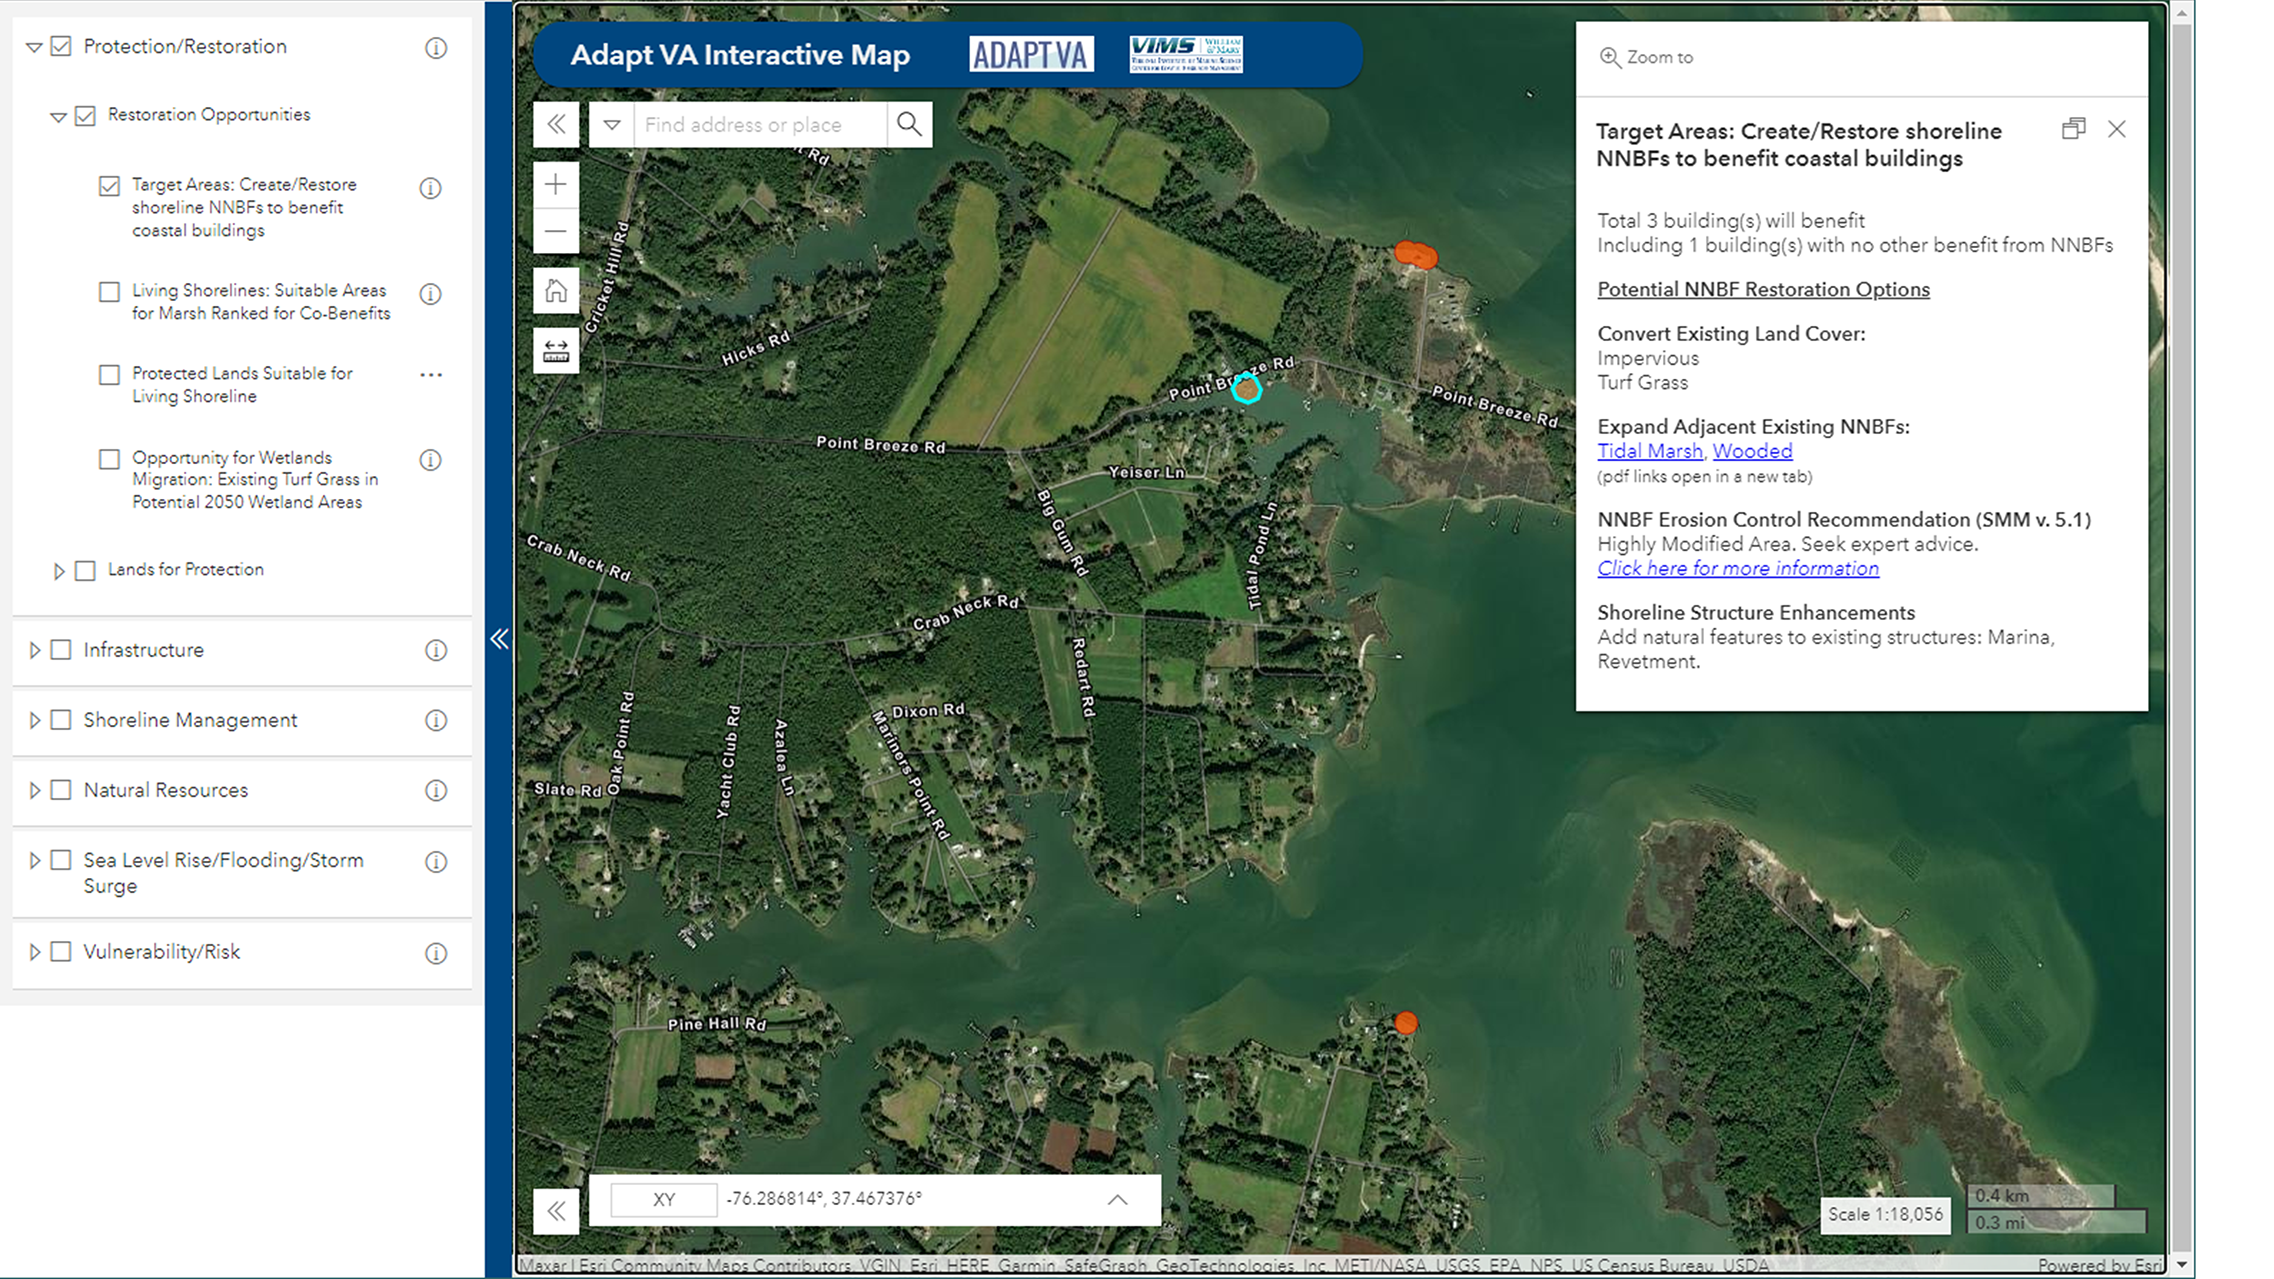
Project outputs are served on the interactive mapping tool located at AdaptVA1. This screenshot shows the ranked NNBF layer, located under the Lands for Protection tab, with informational popup containing information useful to managers.
Figure 9
Project outputs are served on the interactive mapping tool located at AdaptVA1. This screenshot shows target areas, the layer located under Restoration Opportunities, with its informational popup designed to guide decisions on potential NNBF suitable for that location.
5 Conclusion
In summary, the inundation pathways presented here represent a novel application of a geospatial approach to assessing NNBF at a community level. IPs are used to inform an NNBF ranking framework, the Coastal Benefits Index, that considers multiple benefits of NNBF for resilience, including flooding mitigation services to flood-vulnerable and important critical community buildings, water quality improvement, and community financial benefits in terms of potential CRS credits. This approach is also used to identify priority target areas to restore or create new NNBF that would maximize benefits for communities.
While the approach detailed in this study has been tailored for coastal Virginia communities, it can be readily adapted to any community of focus through the inclusion of additional or alternative ecosystem, economic, social, and cultural services that NNBF can provide. In addition, using a relative assessment of these benefits rather than a quantitative measure of risk reduction or mitigation means that this approach can be adjusted based on newly available science and/or changes in the understanding of the risk mitigation that NNBF provide. Therefore, the best available science can be used to support local decision making to preserve, protect, restore, and create NNBF for community resilience.
Statements
Data availability statement
The datasets presented in this study can be found in online repositories. The names of the repository/repositories and accession number(s) can be found below: William & Mary ScholarWorks: https://doi.org/10.25773/d9pv-gb12.
Author contributions
CH and PM contributed to conception and design of the study. JHen and JHer performed the geospatial analyses. JHen wrote the first draft of the manuscript. JHen, PM, and JHer wrote sections of the manuscript. All authors contributed to manuscript revision, read, and approved the submitted version.
Funding
This work was funded by the National Oceanic and Atmospheric Administration (NOAA) through grant # NA17NOS4730142. These data and related items have not been formally disseminated by NOAA, and do not represent any agency determination, view, or policy.
Acknowledgments
The authors want to thank the following scientists who contributed to this project from the Center of Coastal Resources Management at the Virginia Institute of Marine Science including Marcia Berman, Molly Mitchell, Karinna Nunez, and Karen Duhring. We would also like to thank collaborators on this project: Skip Stiles, Mary-Carson Saunders Stiff, Ross Weaver and Shereen Hughes, Wetlands Watch; Elizabeth Andrews and Jesse Reiblich, Virginia Coastal Policy Center, William & Mary; and Stacey Feken and Trish Murphy, Albemarle Pamlico National Estuarine Program. The authors would also like to thank the manuscript reviewers for their valuable input.
Conflict of interest
The authors declare that the research was conducted in the absence of any commercial or financial relationships that could be construed as a potential conflict of interest.
Publisher’s note
All claims expressed in this article are solely those of the authors and do not necessarily represent those of their affiliated organizations, or those of the publisher, the editors and the reviewers. Any product that may be evaluated in this article, or claim that may be made by its manufacturer, is not guaranteed or endorsed by the publisher.
Footnotes
1.^ https://cmap22.vims.edu/AdaptVA/AdaptVA_viewer.html
2.^ https://www.vims.edu/ccrm/research/climate_change/adaptation/nnbfs/index.php
References
1
Altman S. Cairns C. Whitfield P. Davis J. Finkbeiner M. McFall B. (2021). “Plant systems: Submerged aquatic vegetation and kelp,” in International guidelines on natural and nature-based features for flood risk management. Eds. BridgesT. S.KingJ. K.SimmJ. D.BeckM. W.CollinsLodderQ.et al (Vicksburg, MS: U.S. Army Engineer Research and Development Center), 363–700.
2
Arkema K. K. Griffin R. Maldonado S. Silver J. Suckale J. Guerry A. D. (2017). Linking social, ecological, and physical science to advance natural and nature-based protection for coastal communities. Ann. N. Y. Acad. Sci.1399, 5–26. doi: 10.1111/nyas.13322
3
(2021). Virginia Coastal resilience master plan: Phase 1. Available at: https://www.dcr.virginia.gov/crmp/plan#plan (Accessed November 2022).
4
Bilkovic D. M. Mitchell M. Mason P. Duhring K. (2016). The role of living shorelines as estuarine habitat conservation strategies. Coast. Manage.44, 161–174. doi: 10.1080/08920753.2016.1160201
5
Boon J. D. (2012). Evidence of sea level acceleration at U.S. and Canadian tide stations, Atlantic coast, north America. J. Coast. Res.285, 1437–1445. doi: 10.2112/jcoastres-d-12-00102.1
6
Boon J. D. Mitchell M. Loftis J. D. Malmquist D. (2018). Anthropocene Sea Level Change: A History of Recent Trends Observed in the U.S. East, Gulf, and West Coast Regions. Special Report in Applied Marine Science and Ocean Engineering (SRAMSOE), No. 467. Virginia Institute of Marine Science, Gloucester Point: William & Mary. doi: 10.21220/V5T17T
7
Bridges T. King J. Simm J. Beck M. Collins G. Lodder Q. et al . (2021). International Guidelines on Natural and Nature‑Based Features for Flood Risk Management. (Vicksburg, MS: U.S. Army Engineer Research and Development Center). doi: 10.21079/11681/41946
8
Bridges T. Wagner P. W. Burks-Copes K. A. Bates M. E. Collier Z. A. Fischenich C. J. et al . (2015). Use of natural and nature-based features (NNBF) for coastal resilience, north Atlantic coast comprehensive study: Resilient adaptation to increasing risk.
9
Callow J. N. Van Niel K. P. Boggs G. S. (2007). How does modifying a DEM to reflect known hydrology affect subsequent terrain analysis? J. Hydrol.332, 30–39. doi: 10.1016/j.jhydrol.2006.06.020
10
Center for Coastal Resources Management, Virginia Institute of Marine Science . (2014). Living Shoreline Implementation: Challenges and Solutions. Rivers & Coast, Summer 2014 issue. vol. 9, no. 2. (Gloucester Point, Virginia: Virginia Institute of Marine Science, William & Mary). Available at: doi: 10.21220/m2-2d2k-a602
11
Center for Coastal Resources Management . (2019). Shoreline & tidal marsh inventory. William & Mary (Gloucester Point, Virginia: Virginia Institute of Marine Science, William & Mary). Available at: http://www.vims.edu/ccrm/research/inventory/index.php.
12
Center for Coastal Resources Management, Virginia Institute of Marine Science . (2022). Virginia Tidal Shoreline Permit Database (Unpublished data). Gloucester Point, Virginia: Virginia Institute of Marine Science, William & Mary.
13
Chesapeake Bay Program . (2022). Chesapeake Bay program quick reference guide for best management practices (BMPs): Nonpoint source BMPs to reduce nitrogen, phosphorus and sediment loads to the Chesapeake bay and its local waters. CBP/TRS-323-18, 2nd ed. doi: 10.21079/11681/41946
14
Chesapeake Conservancy . (2021). Concentrated flow path mapping. Available at: https://www.chesapeakeconservancy.org/what-we-do/innovate/stormwater-management-tool/concentrated-flow-path-mapping/.
15
Costanza R. D’Arge R. de Groot R. Farber S. Grasso M. Hannon B. et al . (1997). The value of the world’s ecosystem services and natural capital. Nat.387, 253–260. Available at: https://royalroads.on.worldcat.org/oclc/4592801201
16
Dahl K. A. Fitzpatrick M. F. Spanger-Siegfried E. (2017). Sea level rise drives increased tidal flooding frequency at tide gauges along the U.S. East and gulf coasts: Projections for 2030 and 2045. PloS One12, e0170949. doi: 10.1371/journal.pone.0170949
17
Danielson J. J. Poppenga S. K. Brock J. C. Evans G. A. Tyler D. J. Gesch D. B. et al . (2016). Topobathymetric elevation model development using a new methodology: Coastal national elevation database. J. Coast. Res.76, 75–89. doi: 10.2112/SI76-008
18
de Vries J. Reed D. McKay S. K. Bouma T. Cunniff S. Grasmeijer B. et al (2021). “Planning and implementing NNBF using a systems approach, chapter 4,” in International guidelines on natural and nature-based features for flood risk management. Eds. BridgesT. J.KingJ.SimmM.BeckG.CollinsQ.LodderQ.MohanR. (Vicksburg, MS: U.S. Army Engineer Research and Development Center). Available at: https://hdl.handle.net/11681/41946.
19
ESRI Creating the least-cost path. Available at: https://desktop.arcgis.com/en/arcmap/latest/tools/spatial-analyst-toolbox/creating-the-least-cost-path.htm (Accessed February 2017).
20
ESRI . (2017). ArcGIS desktop: Release 10.6.1 (Redlands, CA: Environmental Systems Research Institute).
21
Etherington T. R. (2016). Least-cost modelling and landscape ecology: Concepts, applications, and opportunities. Curr. Landsc. Ecol. Rep.1, 40–53. doi: 10.1007/s40823-016-0006-9
22
Ezer T. (2018). The increased risk of flooding in Hampton roads: On the roles of sea level rise, storm surges, hurricanes, and the gulf stream. Mar. Technol. Soc J.52, 34–44. doi: 10.4031/MTSJ.52.2.6
23
Ezer T. (2019). Analysis of the changing patterns of seasonal flooding along the U.S. East Coast. Ocean Dynamics70, 241–255. doi: 10.1007/s10236-019-01326-7
24
Ezer T. Atkinson L. (2014). Accelerated flooding along the U.S. East coast: On the impact of sea-level rise, tides, storms, the gulf stream, and the north Atlantic oscillations. Available at: https://www.researchgate.net/publication/263970192_Accelerated_flooding_along_the_U_S_East_Coast_On_the_impact_of_sea_level_rise_tides_storms_the_Gulf_Stream_and_NAO.
25
Federal Emergency Management Agency . (2017). National flood insurance program community rating system - CRS coordinator’s manual. Available at: https://www.fema.gov/media-library/assets/documents/8768.
26
Fernández-Montblanc T. Duo E. Ciavola P. (2020). Dune reconstruction and revegetation as a potential measure to decrease coastal erosion and flooding under extreme storm conditions. Ocean Coast. Manage.188, 105075. doi: 10.1016/j.ocecoaman.2019.105075
27
Glass E. M. Garzon J. L. Lawler S. Paquier E. Ferreira C. M. (2018). Potential of marshes to attenuate storm surge water level in the Chesapeake bay. Limnol. Oceanogr.63, 951–967. doi: 10.1002/lno.10682
28
Habel S. Fletcher C. H. Anderson T. R. Thompson P. R. (2020). Sea-Level rise induced multi-mechanism flooding and contribution to urban infrastructure failure. Sci. Rep.10, 1–12. doi: 10.1038/s41598-020-60762-4
29
Hanley M. E. Hoggart S. P. G. Simmonds D. J. Bichot A. Colangelo M. A. Bozzeda F. et al . (2014). Shifting sands? coastal protection by sand banks, beaches and dunes. Coast. Eng.87, 136–146. doi: 10.1016/j.coastaleng.2013.10.020
30
Jarbeau S. H. Stiff M.-C. (2017). Flood protection pay-offs, a local government guide to the community rating system. Available at: www.wetlandswatch.org (Accessed May 2021).
31
Kenny F. Matthews B. Todd K. (2008). Routing overland flow through sinks and flats in interpolated raster terrain surfaces. Comput. Geosci.34, 1417–1430. doi: 10.1016/j.cageo.2008.02.019
32
Lawrence M. B. Avila L. A. Beven J. L. Franklin J. L. Pasch R. J. Stewart S. R. (2005). Atlantic Hurricane season of 2003. Monthly Weather Rev.133, 1744–1773. doi: 10.1175/mwr2940.1
33
Liquete C. Piroddi C. Drakou E. G. Gurney L. Katsanevakis S. Charef A. et al . (2013). Current status and future prospects for the assessment of marine and coastal ecosystem services: A systematic review. PloS One8 (7), e67737. doi: 10.1371/journal.pone.0067737
34
Loftis J. D. Mitchell M. Schatt D. Forrest D. R. Wang H. V. Mayfield D. et al . (2019). Validating an operational flood forecast model using citizen science in Hampton roads, VA, USA. J. Mar. Sci. Eng.7 (8), 242. doi: 10.3390/jmse7080242
35
Ludwig J. C. (2016). Overview of the physiography and vegetation of Virginia. Virginia Dept. Conserv. Recreat. Div. Nat. Herit Version 2.0, 24–75.
36
Luo Z. Niu J. Xie B. Zhang L. Chen X. Berndtsson R. et al . (2019). Influence of root distribution on preferential flow in deciduous and coniferous forest soils. Forests10, 986. doi: 10.3390/f10110986
37
Millennium Ecosystem Assessment . (2005). Ecosystems and human well-being: Synthesis (Washington, DC: Island Press).
38
Milligan D. A. Hardaway C. Thomas G. R. Varnell L. M. Barnard T. A. Reay W. G. et al . (2005). Chesapeake Bay dune systems: Monitoring (Gloucester Point, VA: Virginia Institute of Marine Science, William & Mary). doi: 10.21220/V5VB1Z
39
Narayan S. Beck M. W. Wilson P. Thomas C. J. Guerrero A. Shepard C. C. et al . (2017). The value of coastal wetlands for flood damage reduction in the northeastern USA. Sci. Rep.7, 1–12. doi: 10.1038/s41598-017-09269-z
40
National Oceanic and Atmospheric Administration . (2018). Tidal gauge water levels for glouceste– 2003) and yorktow-2017). Available at: https://tidesandcurrents.noaa.gov/api.
41
Ninan K. N. Inoue M. (2013). Valuing forest ecosystem services: What we know and what we don’t. Ecol. Econ.93, 137–149. doi: 10.1016/j.ecolecon.2013.05.005
42
Nunez K. Rudnicky T. Mason P. Tombleson C. Berman M. (2022). A geospatial modeling approach to assess site suitability of living shorelines and emphasize best shoreline management practices. Ecol. Eng.179, 106617. doi: 10.1016/j.ecoleng.2022.106617
43
Pinsky M. L. Guannel G. Arkema K. K. (2013). Quantifying wave attenuation to inform coastal habitat conservation. Ecosphere4 (8), 1–16 doi: 10.1890/ES13-00080.1
44
Powell E. J. Tyrrell M. C. Milliken A. Tirpak J. M. Staudinger M. D. (2019). A review of coastal management approaches to support the integration of ecological and human community planning for climate change. J. Coast. Conserv.23, 1–18. doi: 10.1007/s11852-018-0632-y
45
Reguero B. G. Beck M. W. Bresch D. N. Calil J. Meliane I. (2018). Comparing the cost effectiveness of nature-based and coastal adaptation: A case study from the gulf coast of the united states. PloS One13 (4), e0192132. doi: 10.1371/journal.pone.0192132
46
Restore America’s Estuaries . (2015). Living shorelines: From barriers to opportunities. Available at: https://www.estuaries.org/first-national-report-on-living-shorelines-institutional-barriers-released (Accessed May 2020).
47
Saleh F. Weinstein M. P. (2016). The role of nature-based infrastructure (NBI) in coastal resiliency planning: A literature review. J. Environ. Manage.183, 1088–1098. doi: 10.1016/j.jenvman.2016.09.077
48
Salgado K. Martinez M. L. (2017). Is ecosystem-based coastal defense a realistic alternative? exploring the evidence. J. Coast. Conserv.21, 837–848. doi: 10.1007/s11852-017-0545-1
49
Sallenger A. H. C.OMMAJ.R.X.X.X Doran K. S. Howd P. A. (2012). Hotspot of accelerated sea-level rise on the Atlantic coast of north America. Nat. Climate Change2, 884–888. doi: 10.1038/nclimate1597
50
Shepard C. C. Crain C. M. Beck M. W. (2011). The protective role of coastal marshes: A systematic review and meta-analysis. PloS One6 (11), e27374. doi: 10.1371/journal.pone.0027374
51
Spalding M. D. Mcivor A. L. Beck M. W. Koch E. W. Möller I. Reed D. J. et al . (2014b). Coastal ecosystems: A critical element of risk reduction. Conserv. Lett.7, 293–301. doi: 10.1111/conl.12074
52
Spalding M. D. Ruffo S. Lacambra C. Meliane I. Hale L. Z. Shepard C. C. et al . (2014a). The role of ecosystems in coastal protection: Adapting to climate change and coastal hazards. Ocean Coast. Manage.90, 50–57. doi: 10.1016/j.ocecoaman.2013.09.007
53
Stiff M.-C. (2017). The costs & benefits of the CRS program in Virginia. Available at: www.wetlandswatch.org (Accessed May 2021).
54
Sutton-Grier A. E. Gittman R. K. Arkema K. K. Bennett R. O. Benoit J. Blitch S. et al . (2018). Investing in natural and nature-based infrastructure: Building better along our coasts. Sustain10 (2), 523. doi: 10.3390/su10020523
55
Sutton-Grier A. E. Wowk K. Bamford H. (2015). Future of our coasts: The potential for natural and hybrid infrastructure to enhance the resilience of our coastal communities, economies and ecosystems. Environ. Sci. Policy51, 137–148. doi: 10.1016/j.envsci.2015.04.006
56
Temmerman S. Meire P. Bouma T. J. Herman P. M. J. Ysebaert T. De Vriend H. J. (2013). Ecosystem-based coastal defence in the face of global change. Nature504, 79–83. doi: 10.1038/nature12859
57
U.S. Fish and Wildlife Service . (2017). National wetlands inventory data. In: National wetlands inventory. Available at: https://www.fws.gov/program/national-wetlands-inventory/wetlands-data (Accessed November 2018).
58
U.S. Geological Survey . (2018). National structures dataset. Available at: https://catalog.data.gov/dataset/usgs-national-structures-dataset-nsd-downloadable-data-collection-national-geospatial-data-ass.
59
VanZomeren C. Acevedo-Mackey D. (2019). “A review of coastal vulnerability assessments: Definitions, components, and variables,” in Ecosystem management and restoration research program. (Vicksburg, MS: Engineer Research and Development Center), 1–36.
60
Virginia Geographic Information Network . (2017a). Virginia Building footprints 2017Q4. Available at: https://vgin.vdem.virginia.gov/datasets/virginia-building-footprints/about (Accessed December 2017).
61
Virginia Geographic Information Network . (2017b). Virginia Land cover dataset. Available at: https://vgin.vdem.virginia.gov/apps/virginia-land-cover-dataset/explore (Accessed May 2018).
62
Virginia Geographic Information Network . (2017c). Orthoimagery. In: Virginia Base mapping program. Available at: https://gismaps.vdem.virginia.gov/arcgis/rest/services/VBMP_Imagery/VBMP2017_WGS/MapServer/0 (Accessed May 2018).
63
Virginia Department of Health . (2006). Virginia Census 2000: Rural –urban areas. Available at: https://www.vdh.virginia.gov/health-equity/rural-virginia-defined (Accessed December 15, 2020).
64
Virginia Natural Heritage Program . (2018). Conservation lands. Available at: https://www.dcr.virginia.gov/natural-heritage/cldownload (Accessed December 2018).
65
Vitousek S. Barnard P. L. Fletcher C. H. Frazer N. Erikson L. Storlazzi C. D. (2017). Doubling of coastal flooding frequency within decades due to sea-level rise. Sci. Rep.7, 1–9. doi: 10.1038/s41598-017-01362-7
66
Wallace C. McCarty G. Lee S. Brooks R. Veith T. Kleinman P. et al . (2018). Evaluating concentrated flowpaths in riparian forest buffer contributing areas using LiDAR imagery and topographic metrics. Remote Sens.10, 614. doi: 10.3390/rs10040614
67
Ye A. Zhou Z. You J. Ma F. Duan Q. (2018). Dynamic manning’s roughness coefficients for hydrological modelling in basins. Hydrol. Res.49, 1379–1395. doi: 10.2166/nh.2018.175
Summary
Keywords
geographic information systems (GIS), natural and nature-based features (NNBF), coastal management, ecosystem services, co-benefits, cost distance, resilience, local
Citation
Hendricks J, Mason P, Herman J and Hershner C (2023) Prioritizing the protection and creation of natural and nature-based features for coastal resilience using a GIS-based ranking framework – an exportable approach. Front. Mar. Sci. 10:1005827. doi: 10.3389/fmars.2023.1005827
Received
28 July 2022
Accepted
30 January 2023
Published
14 February 2023
Volume
10 - 2023
Edited by
Ali Mohammad Rezaie, University of Asia Pacific, Bangladesh
Reviewed by
Juan L. Garzon, University of Algarve, Portugal; Md Saidur Rahman, Khulna University, Bangladesh
Updates
Copyright
© 2023 Hendricks, Mason, Herman and Hershner.
This is an open-access article distributed under the terms of the Creative Commons Attribution License (CC BY). The use, distribution or reproduction in other forums is permitted, provided the original author(s) and the copyright owner(s) are credited and that the original publication in this journal is cited, in accordance with accepted academic practice. No use, distribution or reproduction is permitted which does not comply with these terms.
*Correspondence: Jessica Hendricks, jhendricks@vims.edu
†These authors have contributed equally to this work and share first authorship
This article was submitted to Coastal Ocean Processes, a section of the journal Frontiers in Marine Science
Disclaimer
All claims expressed in this article are solely those of the authors and do not necessarily represent those of their affiliated organizations, or those of the publisher, the editors and the reviewers. Any product that may be evaluated in this article or claim that may be made by its manufacturer is not guaranteed or endorsed by the publisher.