 Jian Yang
 Minhai Liu1
 Qi Li
Qi Li Zhihua Lin
- 1Ninghai Institute of Mariculture Breeding and Seed Industry, Zhejiang Wanli University, Ningbo, China
- 2Key Laboratory of Mariculture, Ministry of Education, Ocean University of China, Qingdao, China
DNA methylation is a critical epigenetic modification that dynamically regulates gene expression in organisms facing abiotic stress. However, few studies have comprehensively examined the role of DNA methylation in marine fish during environmental adaptation. Therefore, this study explored the methylome dynamics and DNA methylation regulation mechanisms in large yellow croaker (Larimichthys crocea) during low-salinity adaption. The methylation level in the gills was notably raised in the S-group (5‰ salinity) compared to C-group (25‰ salinity). A total of 109 differentially methylated promoter target genes and 581 differentially expressed genes were identified via whole-genome bisulfite sequencing (WGBS) and RNA-seq of gills in the two salinity groups, respectively. Moreover, 23 hypo-methylated/up-regulated differentially methylated genes (DMGs) and 28 hyper-methylated/down-regulated DMGs were identified through integrative analysis, which were mainly enriched in signal transduction, ion exchange, energy metabolism, and cytoskeleton system and other biological processes. Collectively, our findings suggested that low-salinity stress can induce adaptive genome-wide DNA methylation changes, which can in turn affect the transcription of genes in large yellow croaker during low-salinity adaptation. Therefore, our findings provide new insights into the regulatory mechanisms of marine fish in response to rapid environmental changes.
Background
Epigenetic modifications can regulate gene transcription without altering DNA sequences, thus enabling organisms to adapt to environmental challenges (Busconi et al., 2015; Li et al., 2018). Among these epigenetic modifications, DNA methylation is currently among the most well-documented epigenetic modifications, which is critical in the regulation of normal physiological activities and environmental adaption (Richards et al., 2010; Bossdorf and Zhang, 2011). Previous studies have indicated that genome-wide DNA methylation can be highly flexible in animals and plants facing complex and changeable environmental stressors (Weyrich et al., 2016; Artem et al., 2017; Huang et al., 2021).
Changes in environmental salinity can directly influence the distribution, size, growth, development, and reproduction of marine organisms (Macdonald et al., 2010). Due to global warming, extreme precipitation events are becoming increasingly frequent worldwide (Peter et al., 2019), which increases surface runoff. Sudden climate changes can thus severely and abruptly change the salinity of inshore aquaculture areas. Large yellow croaker (Larimichthys crocea) is the most productive cultured marine fish species in China, and coastal cage culture is the most widely implemented aquaculture model for this species. Recently, low-salinity conditions caused by extreme precipitation have resulted in serious economic losses to the inshore aquaculture industry. Therefore, elucidating the regulatory mechanisms of low-salinity adaptation in large yellow croaker and selecting new varieties with better adaptability to these conditions have garnered increasing attention. Previous studies on the salinity acclimation of large yellow croaker have mainly focused on osmotic regulation, energy metabolism, and immune responses (Zeng et al., 2017; Lu et al., 2020; Teng et al., 2020). However, few studies have assessed the role of DNA methylation in marine organisms facing low-salinity stress.
Whole genome bisulfite sequencing (WGBS) and high-throughput sequencing technologies provide a powerful means to investigate genome-wide DNA methylation dynamics at a near-base-pair-level resolution (Adusumalli et al., 2015). Here, we performed an integrative analysis of WGBS and RNA-seq to clarify the association between the transcriptome and methylome dynamics in the gills of large yellow croaker under low-salinity stress. Importantly, our study not only sought to explore the underlying epigenetic regulation mechanisms of DNA methylation during the acclimation of marine fishes, but also to establish a theoretical basis for the selection of new varieties with better environmental adaptability to minimize losses to the aquaculture sector.
Materials and methods
Animal experiments and sample collection
Experimental fish were collected from aquaculture facilities located in Xiangshan Bay, Zhejiang Province, China. Before initiating the experiments, 120 individuals were randomly selected and allowed to acclimate in a tank (3 m diameter) with 25‰ salinity seawater for 30 days. Next, 60 similarly-sized healthy fish (body weight 69.49 ± 15.20 g, body length 168.82 ± 12.99 mm) were randomly selected and transferred to six tanks (1 m diameter; 10 individuals per tank with 500 L 25‰ seawater) to adapt to the experimental conditions for 7 days. During this period, the fish were fed daily with commercial mixed feed and the water was exchanged once per day to eliminate residual feed and excrement. After this secondary adaptation period, all of the fish from each tank were randomly assigned to two salinity treatments [5‰ (S-group) and 25‰ (C-group)] in triplicate. During the experiment, the temperature and DO were 21–23°C and 8.3–8.9 mg L−1, respectively. The fish were fed once per day with commercial feed and 1/3 of the water was exchanged daily. After 7 days of exposure, 5 individuals from each tank were randomly selected and anesthetized with 50 mg/L MS-222, after which the gill tissues were dissected and immediately flash-frozen in liquid nitrogen. The samples were divided into five sections (technical triplicates were obtained for each section) to conduct gene expression, methylation sensitive amplification polymorphism (MSAP) analysis, RNA-seq, WGBS, and Mass Array analysis.
MSAP analysis
Genomic DNA from gill tissues was isolated using the TIANamp Marine Animals DNA Kit (TIANGEN, Beijing, China) according to the manufacturer’s instructions. DNA concentration and integrity were examined using a NanoDrop 8000 spectrophotometer and 1.5% agarose gel electrophoresis, respectively.
MSAP experiments were conducted as described by Xiong et al. (1999). Gill DNA samples were double digested by (EcoRI + HpaII) or (EcoRI + MspI). Each reaction was conducted using the following components: genomic DNA, 400 ng; 10× T4 Buffer, 2 μl; 20 μM EcoRI, 0.4 μl; HpaII (or MspI), 0.4 μl; 0.1% BSA, 0.2 μl; sterile water was added to a final volume of 20 μl. The mixture was incubated at 16°C for 12 h. Afterward, the ligated DNA was pre-amplified in a 20 μl reaction system as follows: digested product, 2 μl; 10 mM dNTPs, 0.4 μL; 10× Buffer, 2 μL; 5 U/μL Taq polymerase, 0.2 μL; 10 μM pre-amplification E-A primer, 0.5 μL; 10 μM pre-amplification HM-T primer, 0.5 μL; sterile water, 14.6 μL. PCR was conducted under the following thermal profile: 94°C denaturation for 5 min; 26 cycles of 94°C for 30 s, 56°C for 1 min, and 72°C for 1 min; 72°C extension for 10 min. The pre-amplification products were 20-fold diluted with sterile water and used as the template for the selective amplification reactions. The selective amplification reactions system had the following components: 20-fold diluted pre-amplification product, 2 μL; 10 mM dNTPs, 0.4 μL; 10× Buffer, 2 μL; 5 U/μL Taq Polymerase, 0.2 μL; 10 μM E-primer, 0.5 μL; 10 μM M-primer, 0.5 μL; sterile water was added to reach a 20 μL volume. The reactions were conducted using the program described by Li et al. (2017). The sequences of the adaptors and pre-amplification primers are summarized in Table 1. The selective amplification products were separated and examined using capillary electrophoresis. The GeneMarker software (version 2.2) was used to analyze and visualize gill MSAP data. Data analyses were performed as described by Li et al. (2017).
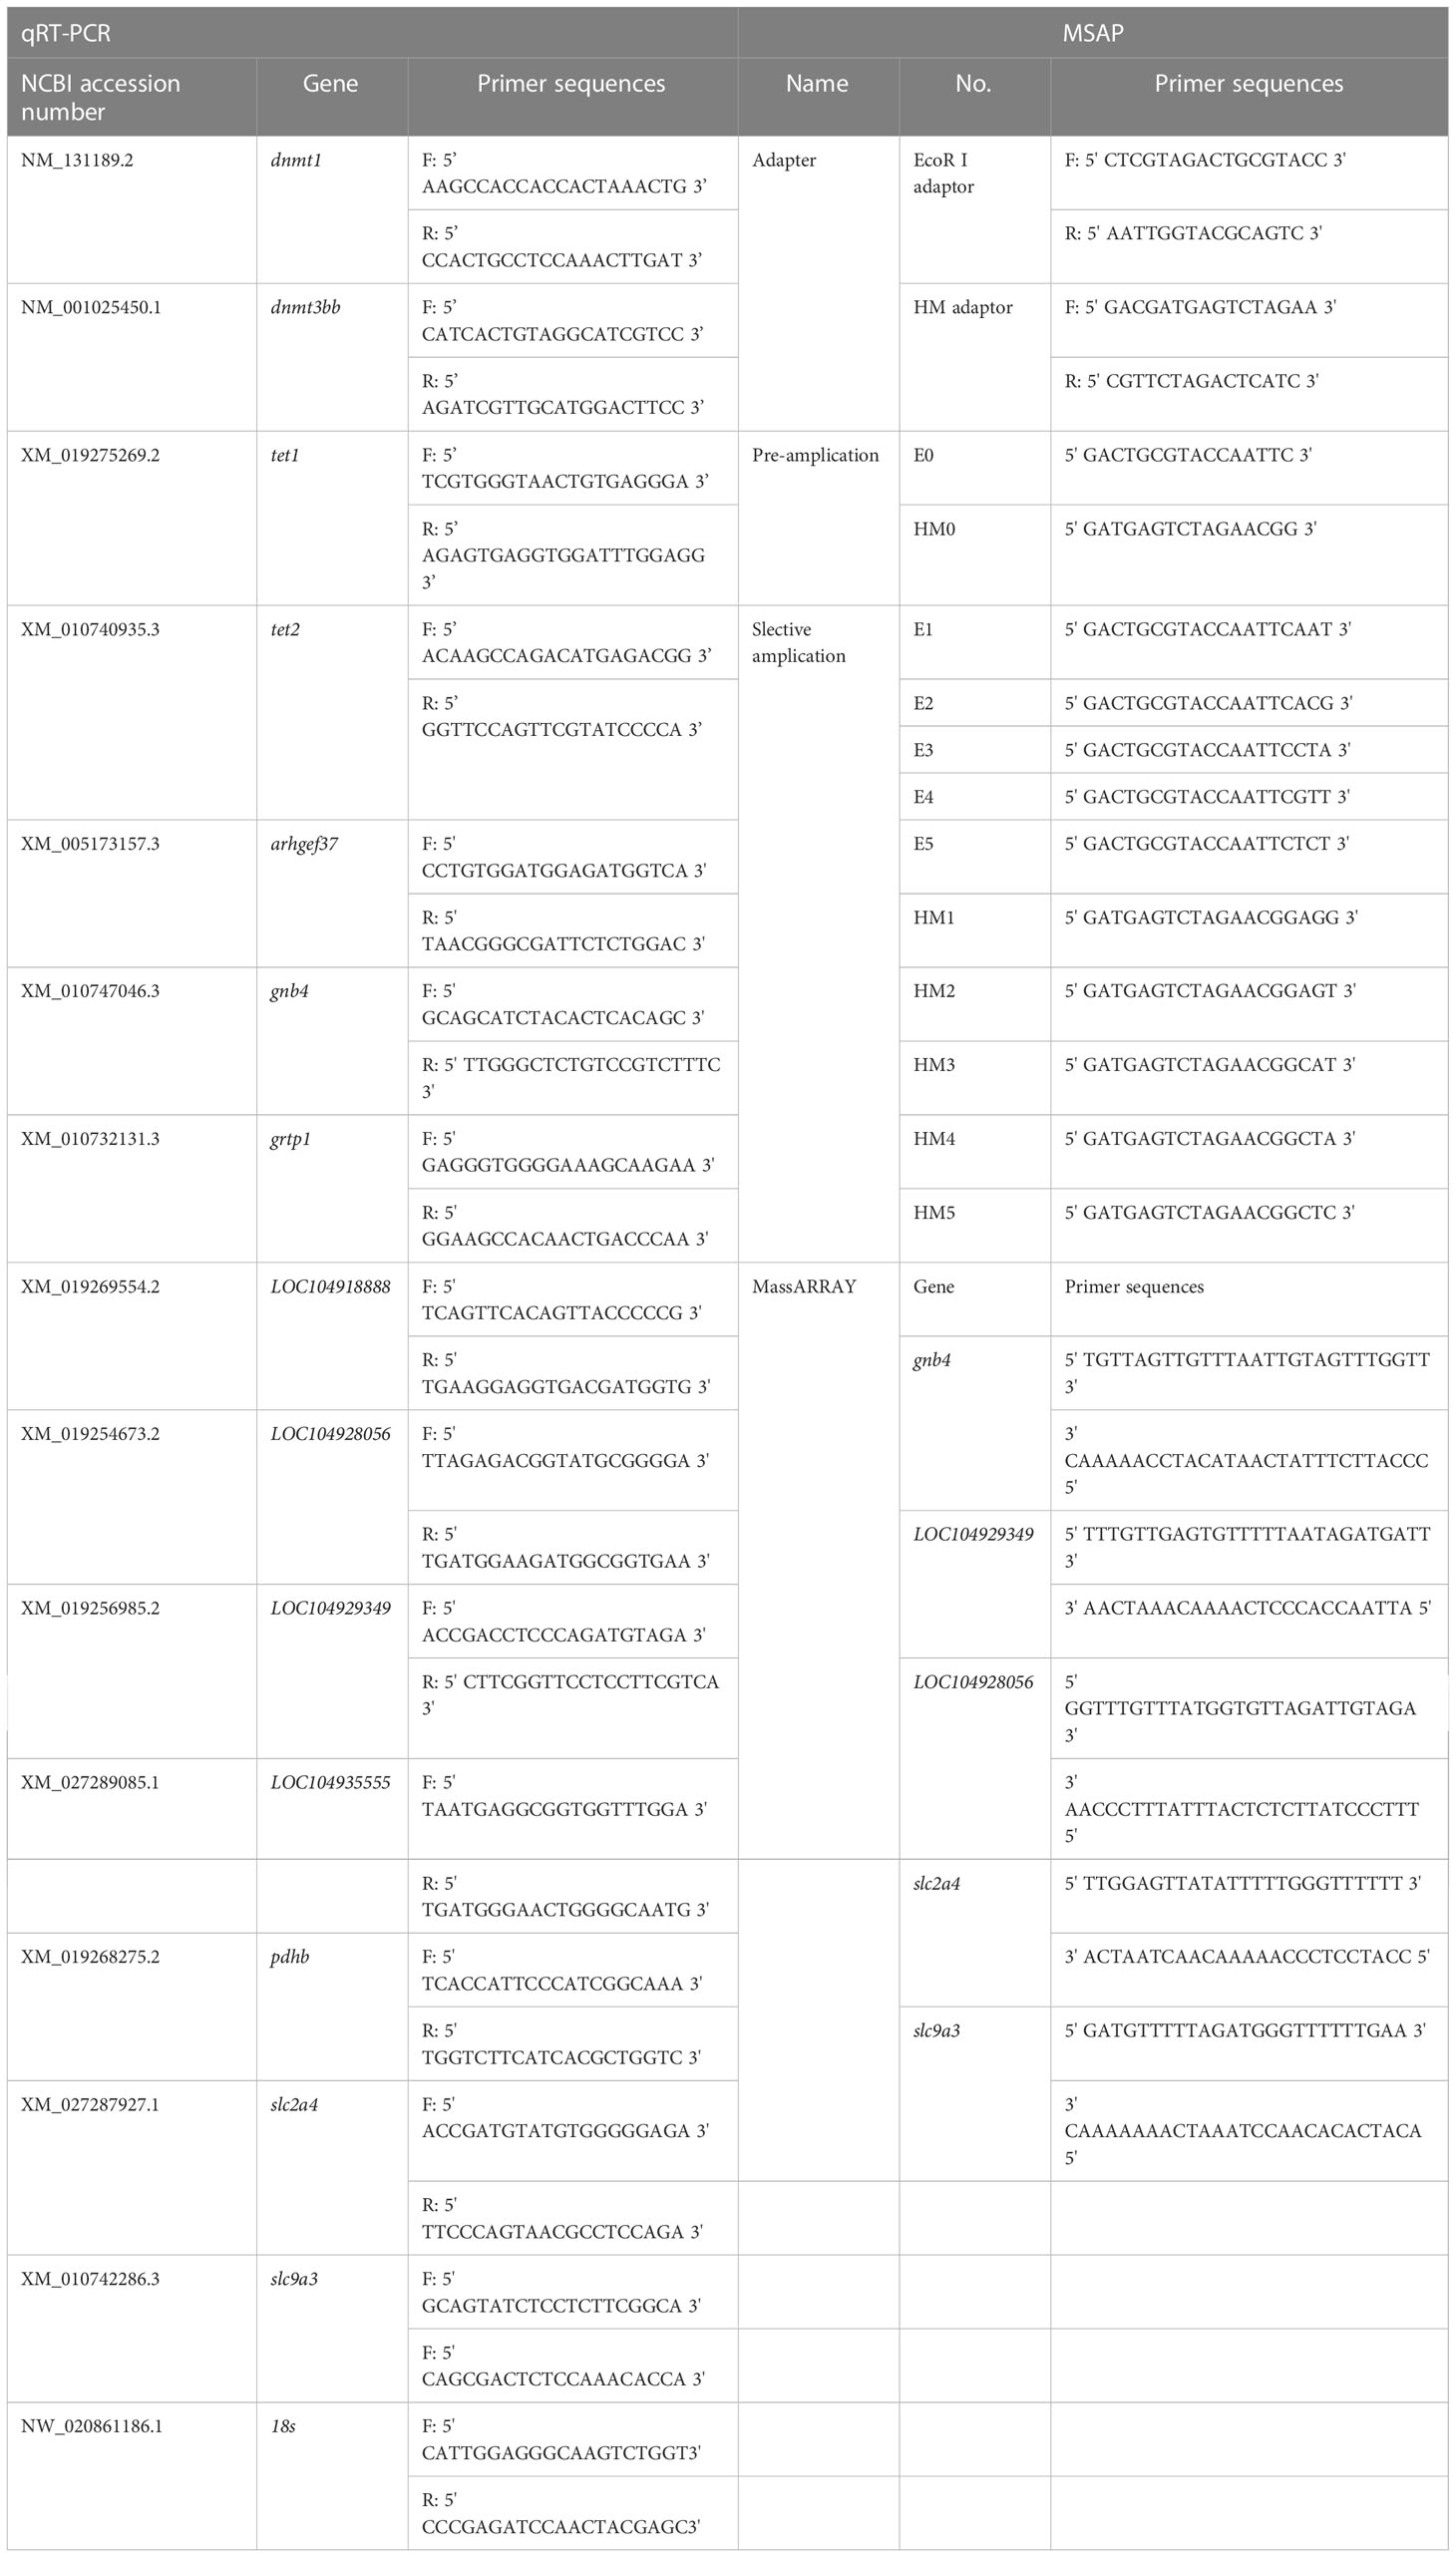
Table 1 Primers used in this work.
Expression of DNA methylation and demethylation genes
The expression of genes related to DNA methylation (dnmt1, dnmt3bb, tet1 and tet2) was analyzed through qRT-PCR. The primers were designed using the Primer3 program (Table 1). qRT-PCR was performed using the TB Green Premix Ex Taq II Kit (TaKaRa, Dalian, China). The amplification program was set as indicated by the manufacturers. The 18S rRNA gene was used as a reference.
RNA-seq library construction, sequencing, and data analysis
The total RNA of gill tissues was extracted from six large yellow croaker individuals from the S-group and C-group in triplicate (i.e., three fish per group). The concentration and integrity of the total RNA samples were measured using Qubit® RNA Assay Kit in a Qubit® 2.0 Fluorometer and 1.5% agarose gel electrophoresis, respectively. Afterward, a strand-specific RNA library was constructed using the NEB Next Ultra™ RNA Library Prep Kit (NEB, MA, USA), and the obtained library reads were purified using the AMPure XP system (Beckman Coulter, CA, USA). After library preparation, 150 bp paired-end sequencing was performed on a NovaSeq 6000 sequencer. Differential expression analysis was performed using DESeq2 (Love et al., 2014), with a false discovery rate (FDR) ≤ 0.05, and |log2(fold change)| > 1. GO and KEGG pathway enrichment analyses of DEGs were performed using ‘GOseq’ R package (Ashburner et al., 2000) and KOBAS software (Xie et al., 2011), respectively.
DNA methylation library construction, sequencing, and data analysis
Genomic DNA of six gill tissues from the S-group and C-group were extracted using the TIANamp Marine Animals DNA Kit (TIANGEN, Beijing, China). The concentration and integrity of genomic DNA was examined using a Nanodrop ND2000 spectrophotometer (Thermo Scientific, MA, USA) and 1% agarose gel electrophoresis, respectively. Genomic DNA samples were fragmented to 200–300 bp using a Covaris S220 sonicator (Covaris, MA, USA). Afterward, the DNA samples were bisulfite-treated according to the EZ DNA Methylation-Gold kit (Zymo Research, CA, USA) instructions. After bisulfite treatment, un-methylated cytosine became uracil, and methylated cytosine remained unchanged. After end repair and adenylation reaction, the bisulfite DNA fragments were subjected to PCR amplification to construct the sequencing library. After quantifying the library and examining the inserted DNA fragments using a Qubit 2.0 fluorometer and an Agilent 2100 Bioanalyzer, qRT-PCR was conducted to determine the final concentration of the library (library concentration >2n M). The qualified DNA libraries were then sequenced using an Illumina HiSeq 2500 sequencer.
The raw reads were quality checked and filtered to obtain clean reads. Then, the sequencing reads were compared to the reference genome of large yellow croaker (https://ftp.ncbi.nlm.nih.gov/genomes/all/GCF/000/972/) using the Bismark software (version 0.12.5) (Krueger and Andrews, 2011). After bisulfite treatment, the unmethylated cytosine (C) converted into thymine (T), and the methylated C remain unchanged; thus, the reads cannot be located accurately, and the methylated sites cannot be identified in the reference genome. However, using in silico bisulfite conversion algorithm of the Bismark software, we can comparatively analyze the mapping result of the bisulfite treated reads and no bisulfite treated reads to definite the methylated C sites by changing the entire C base in the reference genome into T base. Next, the methylated sites and differentially methylated regions (DMRs) identified using the MethylKit software (version 0.99.2) (Akalin et al., 2012) were compared with the results obtained with the Bismark software. In order to analyze the methylation status of different gene elements, we carried out a profiling analysis. The analytical procedure is dividing the gene elements into 20 bins first, and then comparing the methylation level of each bin to reflect the methylation difference of each gene elements of each gill samples of S-group and C-group. Moreover, the number of methylated and demethylated DMRs in different gene elements and chromosomes were statistically analyzed to reflect the methylation dynamics in gill under low-salinity stress. Upon characterizing the distribution of DMRs, differentially methylated genes (DMGs) were identified by detecting which genes overlapped with the DMRs. GO and KEGG analyses of the identified DMGs were performed using the ‘cluster Profiler’ R package (Yu et al., 2012). Significant differences were identified via Student’s t-test (p < 0.05).
Integrative analysis of DNA methylation and gene expression
To evaluate the correlation between DNA methylation and gene expression in the gills of large yellow croaker submitted to low-salinity stress, Pearson correlation analyses were conducted to screen the transcriptome data and WGBS data, and identify the mutual DMGs among the DEGs in RNA-seq and the DMR target genes in WGBS. Afterward, GO and KEGG enrichment analyses of the obtained DMGs were conducted using the ‘GOseq’ R package and the KOBAS software, respectively.
Validation of the DMGs overlapped from WGBS and RNA-seq
10 DEGs (arhgef37, gnb4, grtp1, LOC104929349, LOC104928056, LOC104918888, LOC104935555, pdhb, slc2a4, and slc9a3) and 5 DMGs (gnb4, LOC104929349, LOC104928056, slc2a4, and slc9a3) were selected to verify the reliability of the RNA-seq and WGBS data, respectively. The validation of the DEGs and DMRs (which were significantly enriched in ion channels, energy metabolism, cytoskeleton, and other key gene pathways) was conducted using qRT-PCR and Mass Array methylation analysis. qRT-PCR was carried out as described above. For the Mass Array procedure, genomic DNA was isolated using the QIAamp DNA Mini Kit (QIAGEN, Dusseldorf, Germany), and bisulfite modification of the genomic DNA was carried out using an EpiTect Bisulfite Kit (QIAGEN, Dusseldorf, Germany). Quantitative methylation analyses of the 5’ promoter of the DMGs were performed using the Sequenom Mass Array platform (Oebiotech, Shanghai, China) according to the manufacturer’s instructions. The primers used for qRT-PCR and Mass Array methylation analysis are summarized in Table 1.
Statistical analyses
Gene expression differences between the S-group and C-group were identified via two-way ANOVA followed by Bonferroni’s post hoc test. The differences in the methylation levels between the S-group and C-group were identified via one-way ANOVA with Duncan’s multiple range tests. A p-value <0.05 was considered statistically significant.
Results
Methylation status in the gills of large yellow croaker under low-salinity stress
To clarify the DNA methylation status in the gills of large yellow croaker under low-salinity stress, we first detected the expression of DNA transmethylase genes (dnmt1 and dnmt3bb) and demethyltransferase genes (tet1 and tet2). The expression levels of the four genes were significantly increased in the S-group compared to the C-group (Figure 1A). Moreover, we examined the methylation status in gill tissues using the MSAP technique. The hemi-methylation, full-methylation, and total methylation levels of gill genomic DNA in the C-group were 26.92%, 23.68%, and 50.60%, whereas the levels of the S-group were 29.19%, 27.41%, and 56.60%, respectively (Figure 1B). All three methylation indices were significantly different between the S-group and C-group. The analyses of the genomic DNA CpG methylated sites indicated that 33.36% CpG sites remained unchanged, whereas 32.83% CpG sites were methylated and 33.81% were demethylated in the S-group compared to the C-group (Figure 1C).
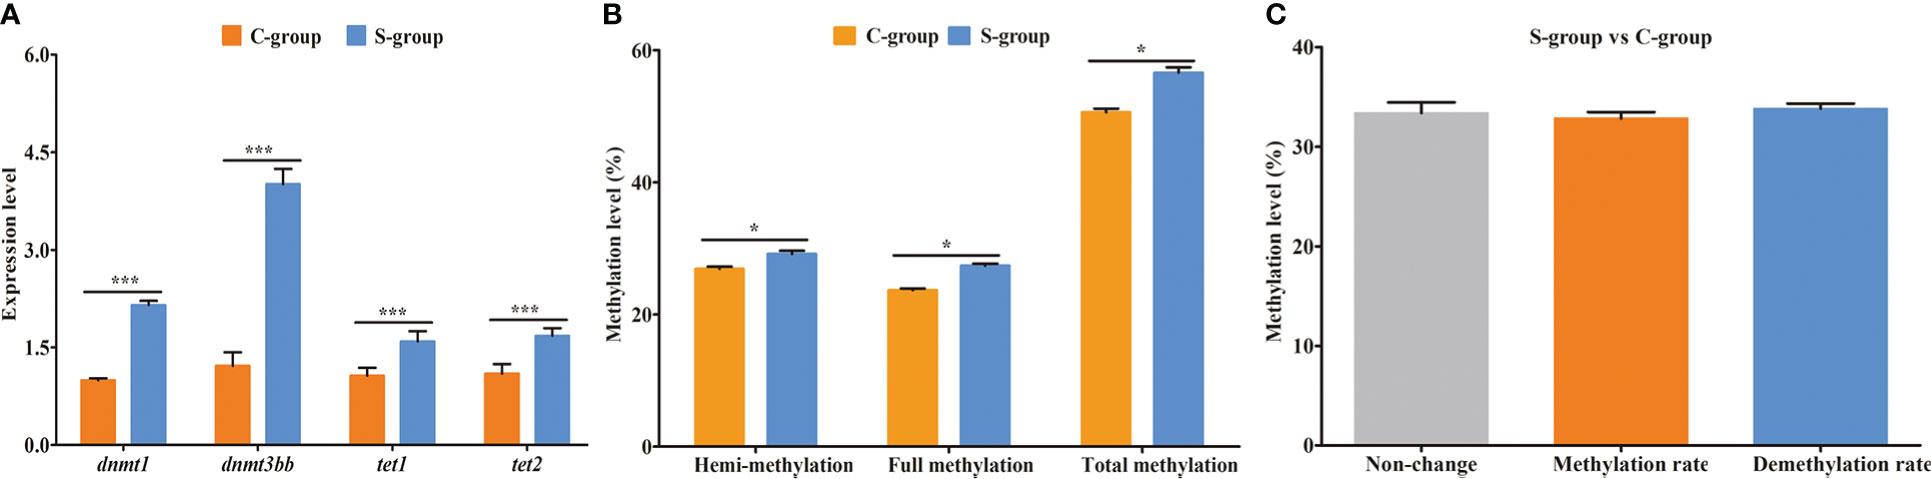
Figure 1 Expression of methyltransferase genes and genomic DNA methylation status in gills of large yellow croaker under low-salinity stress. (A) relative expression of DNA transmethylase genes (dnmt1 and dnmt3bb) and demethyltransferase genes (tet1 and tet2); (B) methylation level of gill in the S-group and C-group; (C) genomic DNA CpG site methylation status. *, represent the difference is significant (p<0.05); ***, represent the difference is extremely significant (p<0.01).
Comparative transcriptome analysis in gill tissues of large yellow croaker under low-salinity stress
After filtering low quality reads, a total of 263 million clean reads were generated, and at least 88.75% clean reads were uniquely mapped to the reference genome (Table 2). To clarify the effects of low-salinity stress on gene expression in the gills, principal component analysis (PCA) was conducted between the S-group and C-group individuals. As expected, the results showed a high similarity in gene expression among individuals under the same salinity treatment, and significant differences between the S-group and C-group (Figure 2A). Moreover, comparative analysis of FPKM (Fragments Per Kilobase of transcript per Million mapped reads) values indicated that the level of gene expression in the S-group individuals was significantly lower than that of the C-group individuals (p < 0.05) (Figure 2B). Furthermore, the gene expression levels in each of the gill samples were analyzed based on the range of the FPKM value (Figure 2C), and the results showed that gene expression was higher in the S-group compared to the C-group. Overall, these results demonstrated that low salinity stress significantly affected the gene expression patterns of gills.
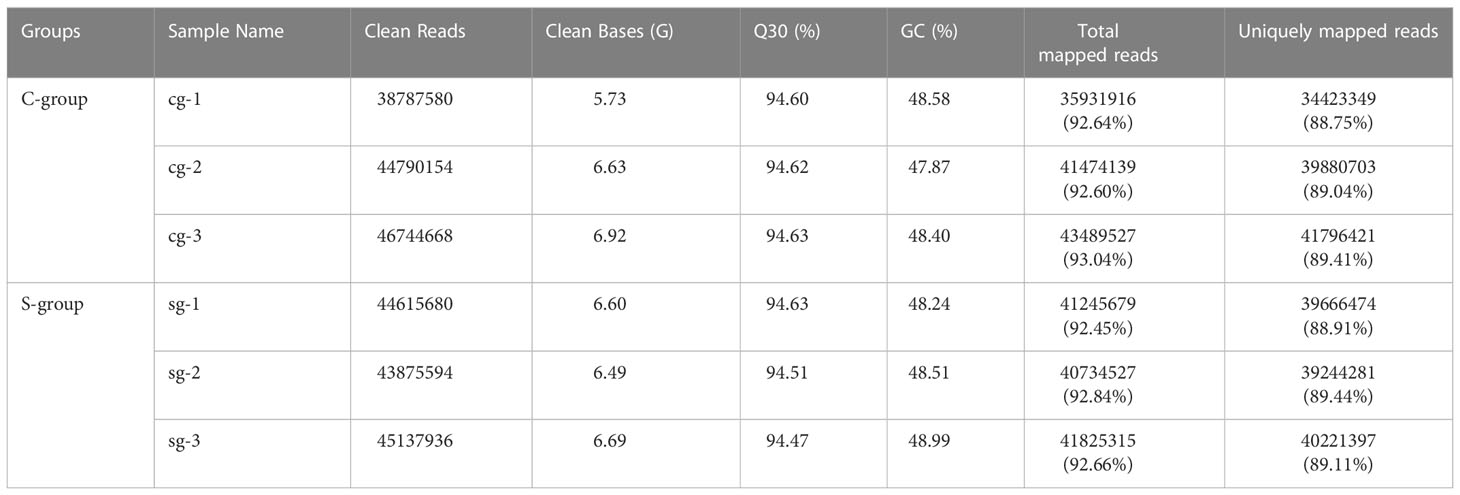
Table 2 Summary of gill RNA-seq data of large yellow croaker under low-salinity stress.
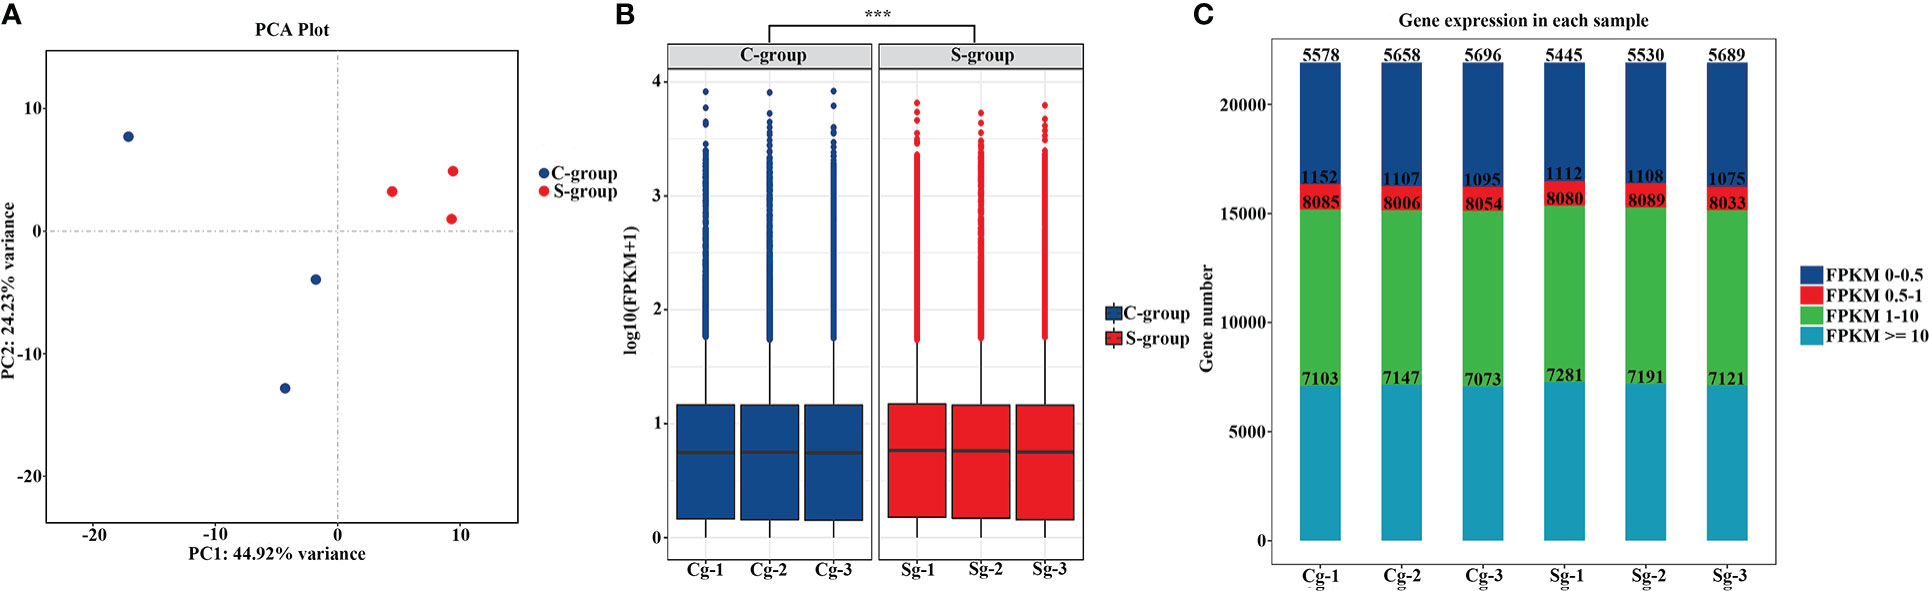
Figure 2 Assessment of low-salinity stress on gene expression. (A) PCA of gene expression levels among different salinity treatment; (B) Box plots showing the differences in gene expression levels between two salinity treatments; (C) Distribution of the expressed gene number based on the differences in FPKM value between the two salinity treatments. ***, represent the difference is extremely significant (p<0.01).
To determine the transcriptome dynamics in gill under low-salinity stress, a total of 581 differential expressed genes (DEGs) were identified based on a ∣log2(Fold Change)∣> 1.5 and q-value < 0.05 threshold. Among the identified DEGs, 330 were down-regulated and 281 were up-regulated in the S-group compared to the C-group (Figure 3A). Functional enrichment analysis of the DEGs showed that these DEGs were significantly enriched in GO terms involved in “metabolic process,” “stress response related biological regulation,” among other pathways (Figure 3B, Table 3). KEGG pathway analysis indicated that the up- and down-regulated DEGs were significantly enriched in the “cell adhesion molecules (CAMs),” “cytokine-cytokine receptor interaction,” “cellular process,” and “tight junction” gene pathways, among others (Figure 3C, Table 4).
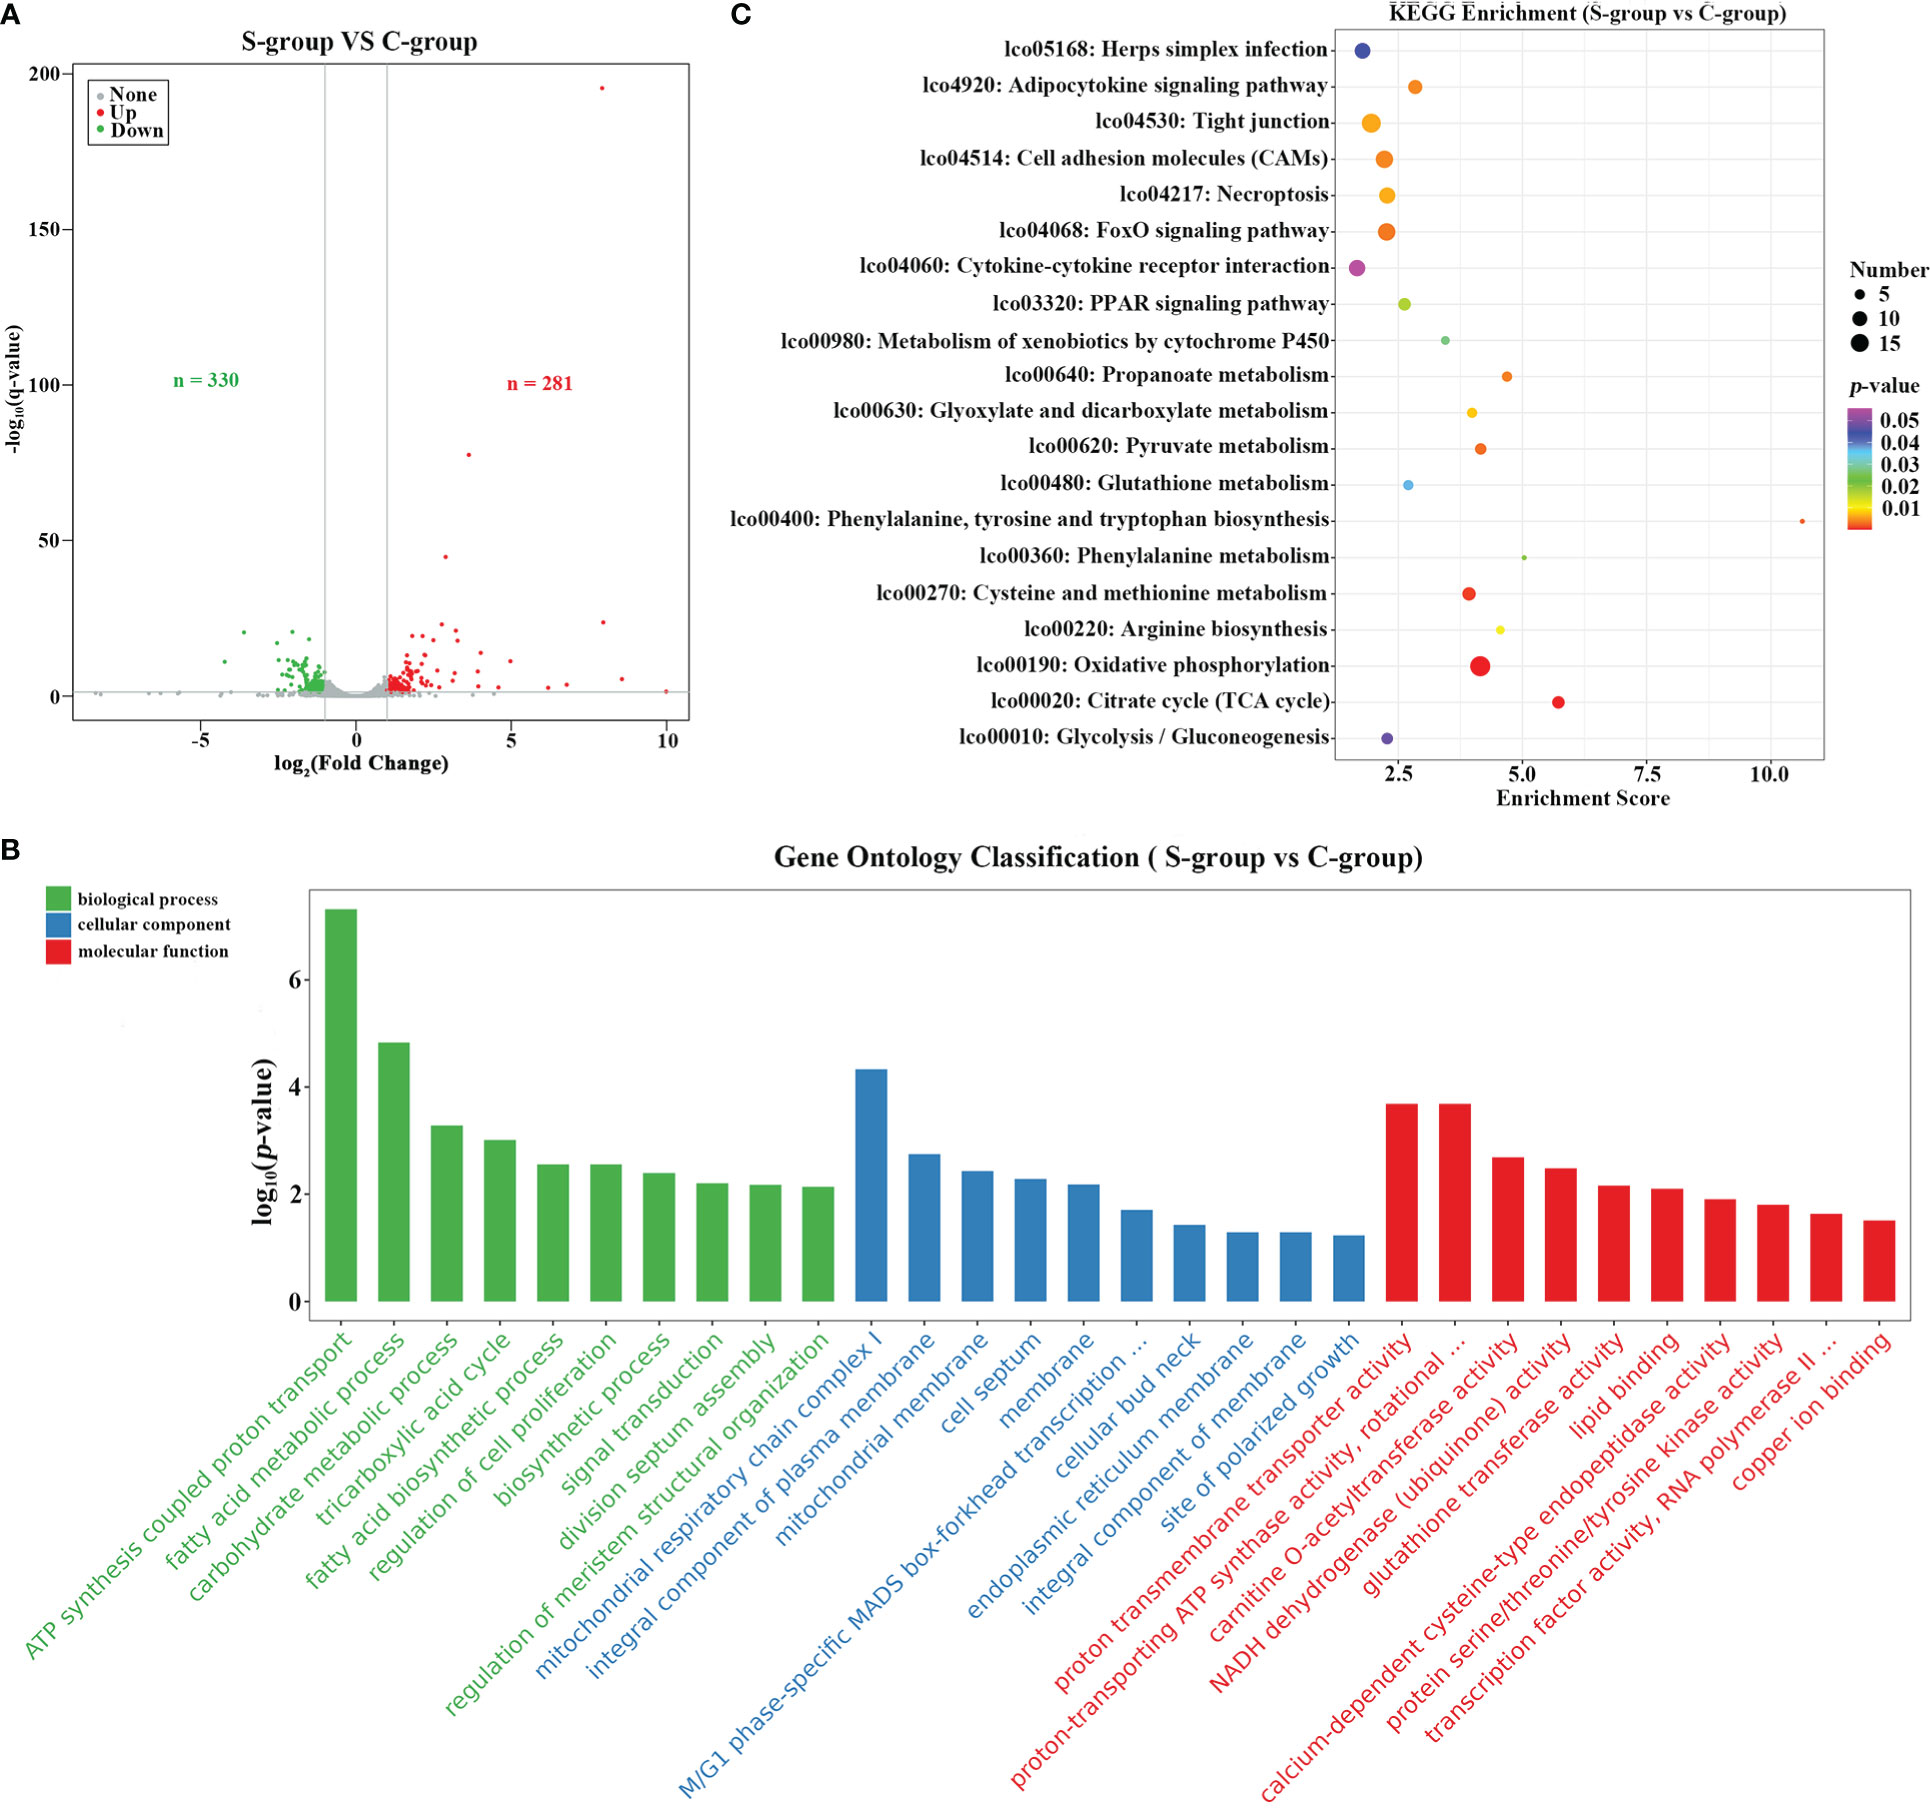
Figure 3 Functional enrichment analysis of DEGs. (A) Volcano plot showing the DEGs between different salinity treatments; (B) KEGG pathway enrichment analysis of the up- and down-regulated DEGs; (C) GO enrichment analysis of up- and down-regulated DEGs.
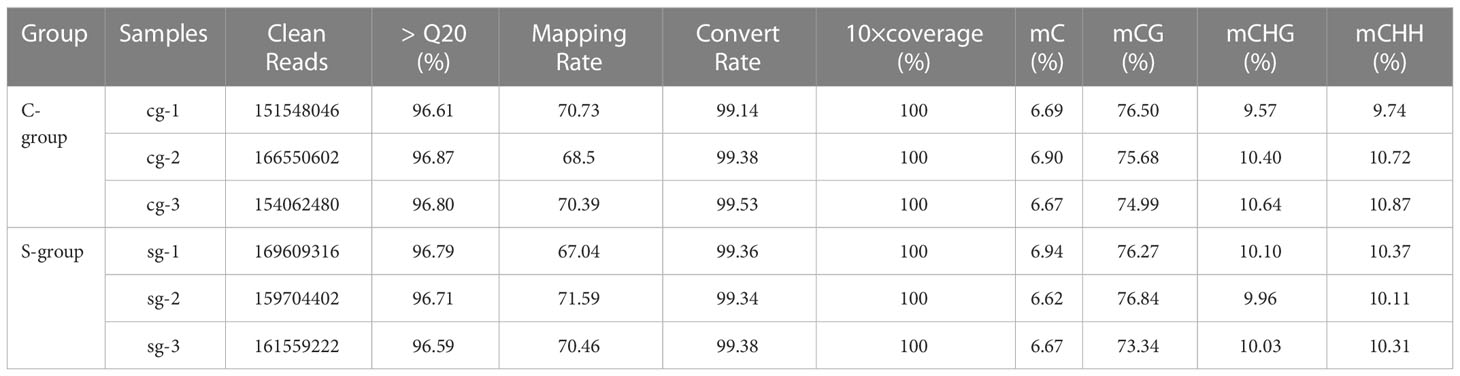
Table 3 Summary of the gills WGBS data of large yellow croaker under low-salinity stress.
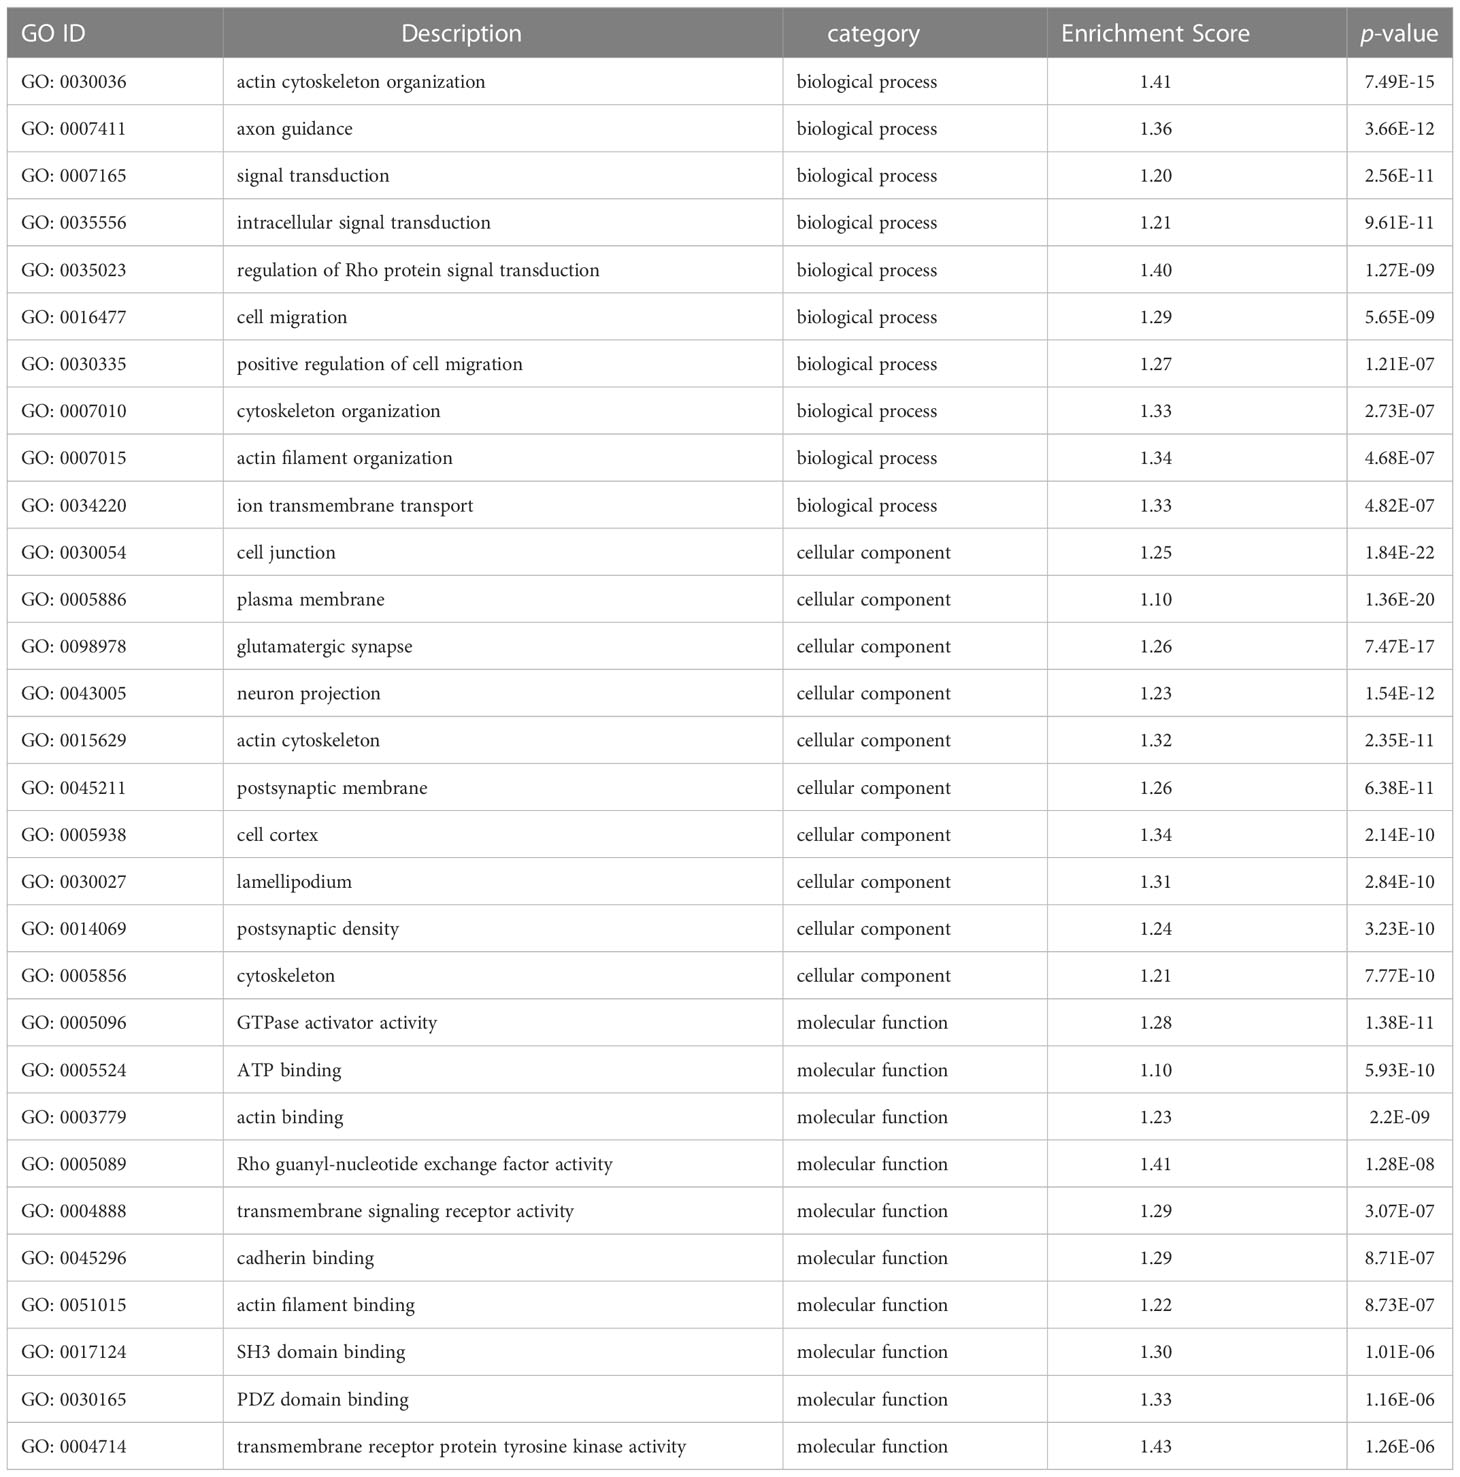
Table 4 GO analysis of DMRs target DMGs in gills of large yellow croaker under low-salinity stress.
Validation of the DEGs in the transcriptome analysis
A total of 10 DEGs in the gill transcriptome were selected for expression validation using qRT-PCR. Our results confirmed that the expression of arhgef37, gnb4, LOC104929349, LOC104928056, and LOC104918888 were significantly decreased, whereas the expression of grtp1, LOC104935555, pdhb, slc2a4, and slc9a3 were significantly increased. These findings were consistent with our RNA-seq results, thus confirming the reliability of the transcriptome sequencing data (Figure 4).
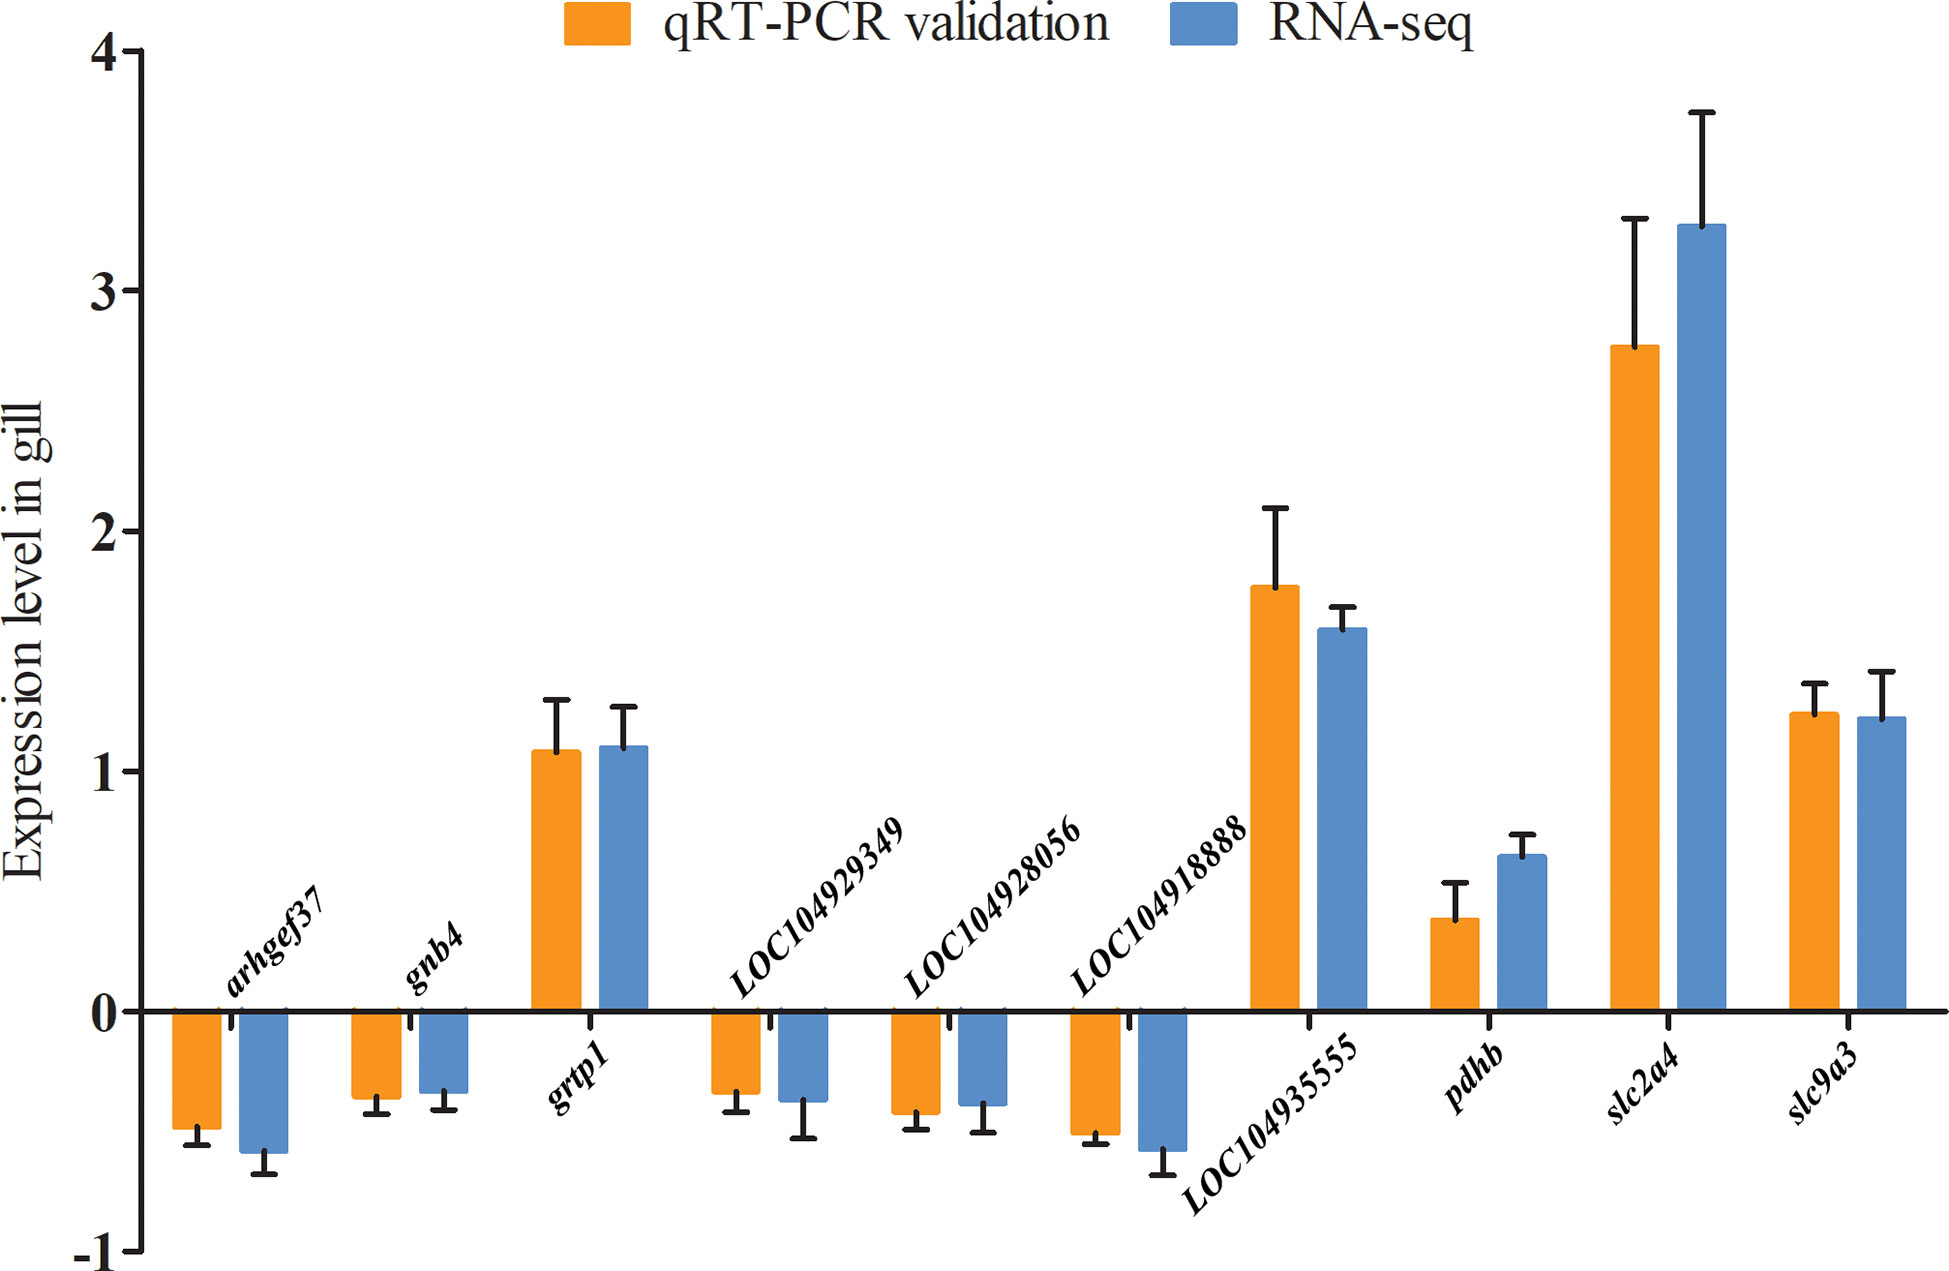
Figure 4 qRT-PCR validation of DEGs in the gills of large yellow croaker under low-salinity stress.
DNA methylation dynamics in the gills of large yellow croaker under low-salinity stress
To reveal the effects of low-salinity stress on the gill tissues of large yellow croaker, bisulfite-treated genomic DNA libraries were constructed using samples from the gill tissues of three individuals each from the S-group and the C-group. After quality control, 490.87 million and 472.16 million clean reads were obtained for the C-group and the S-group, respectively, and at least 67.04% of the clean reads were uniquely mapped to the reference genome. Therefore, the sequencing depth and density were deemed sufficient to conduct genome-wide methylation analysis. Furthermore, the bisulfite conversion rate of each sample exceeded 99%, thus ensuring reliable results for the WGBS analysis (Table 5). The genome-wide cytosine methylation levels of three sequence contexts (CG, CHG, and CHH; where “H” represents either A, T, or C) were also calculated. The average methylation levels of CG, CHG, and CHH in the C-group were 75.72 ± 0.76%, 10.20 ± 0.56%, and 10.44 ± 0.61%, respectively, whereas the levels for the S-group were 75.48 ± 1.88%, 10.03 ± 0.07%, and 10.26 ± 0.14%.
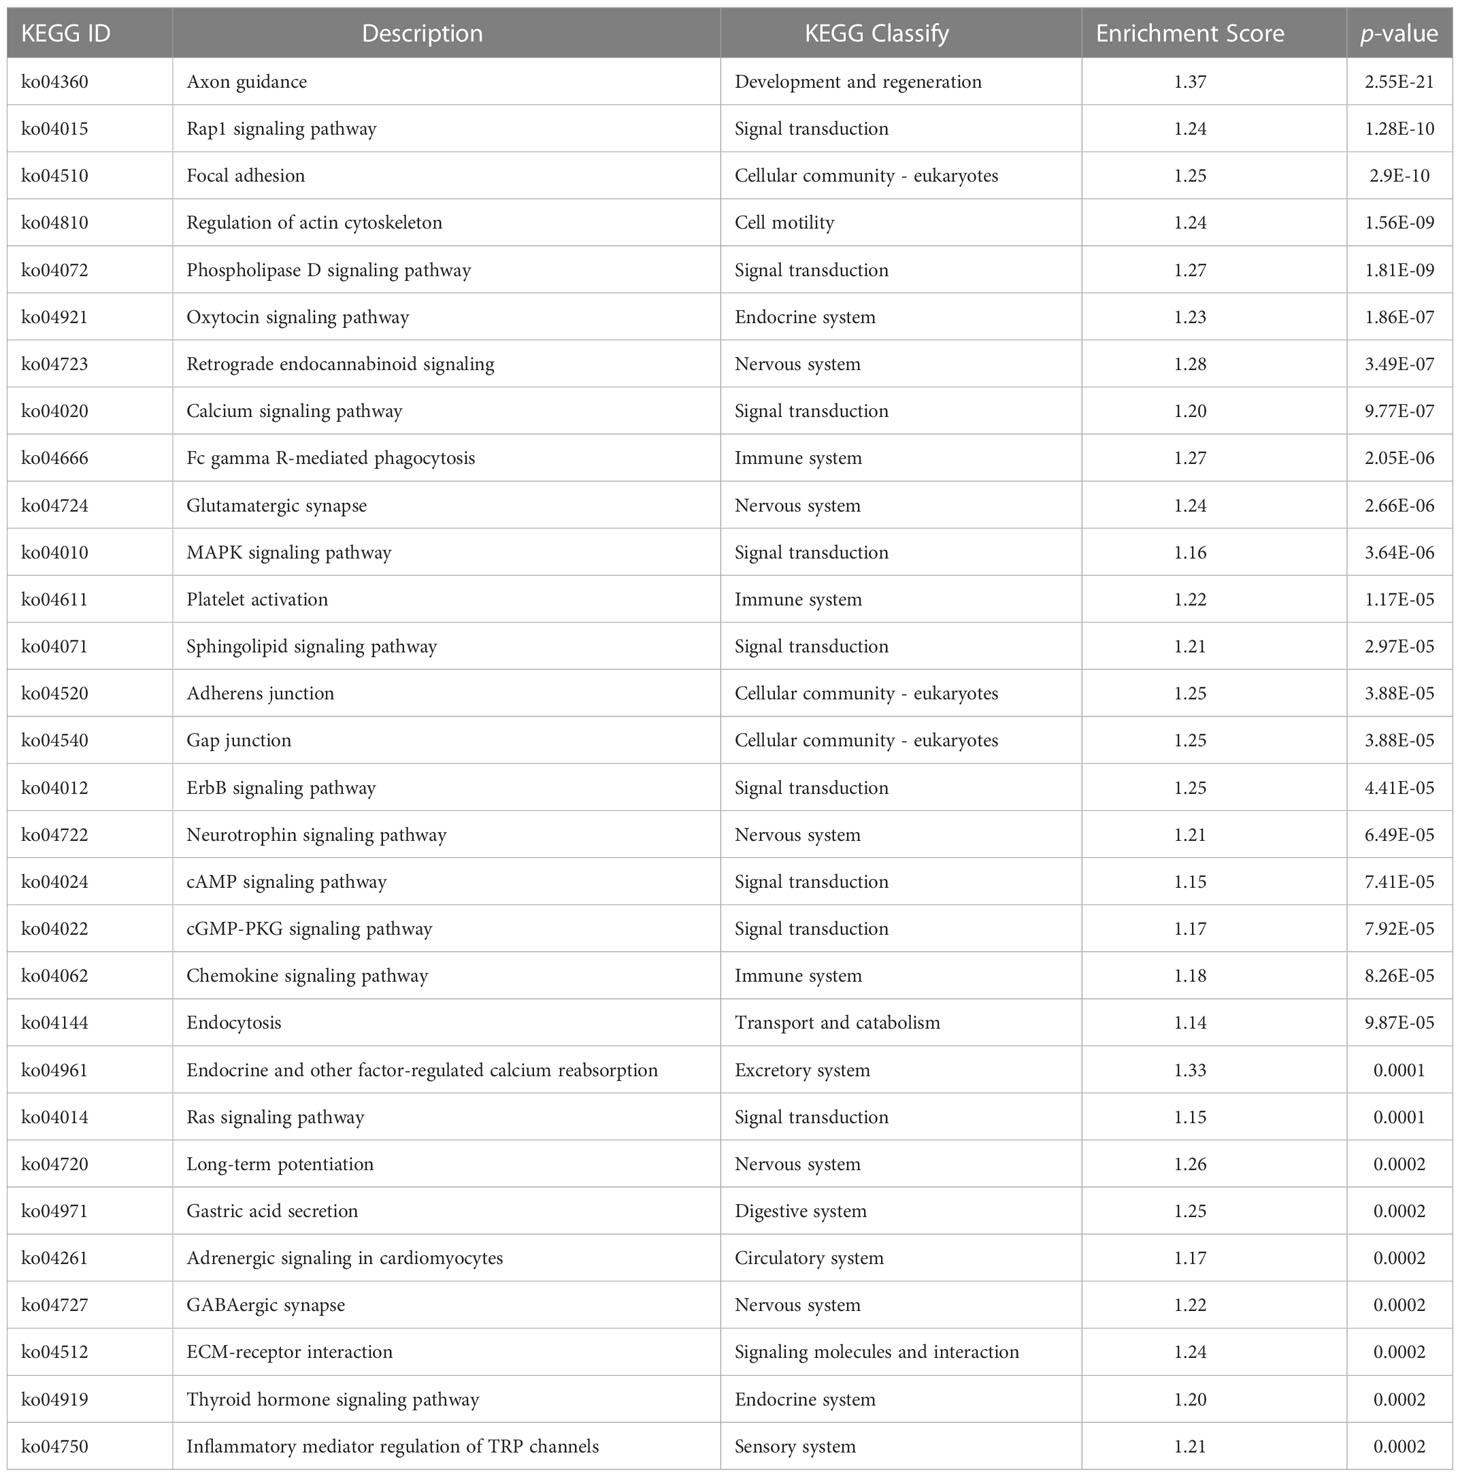
Table 5 KEGG analysis of DMRs target DMGs in gills of large yellow croaker under low-salinity stress.
To identify the genomic DNA methylation dynamics between the S-group and the C-group, we next analyzed the genome-wide gill methylation. Our findings indicated that exon and intron regions showed higher methylation levels than promoter and downstream regions. Furthermore, the S-group exhibited higher methylation levels than the C-group among different genomic elements (Figures 5A, B), and similar CG-type methylation patterns were observed at the chromosome level (Figure 5C). Moreover, differential methylation analysis showed that there were fewer hyper-methylated regions than hypo-methylated regions among different gene regions (Figure 5D).
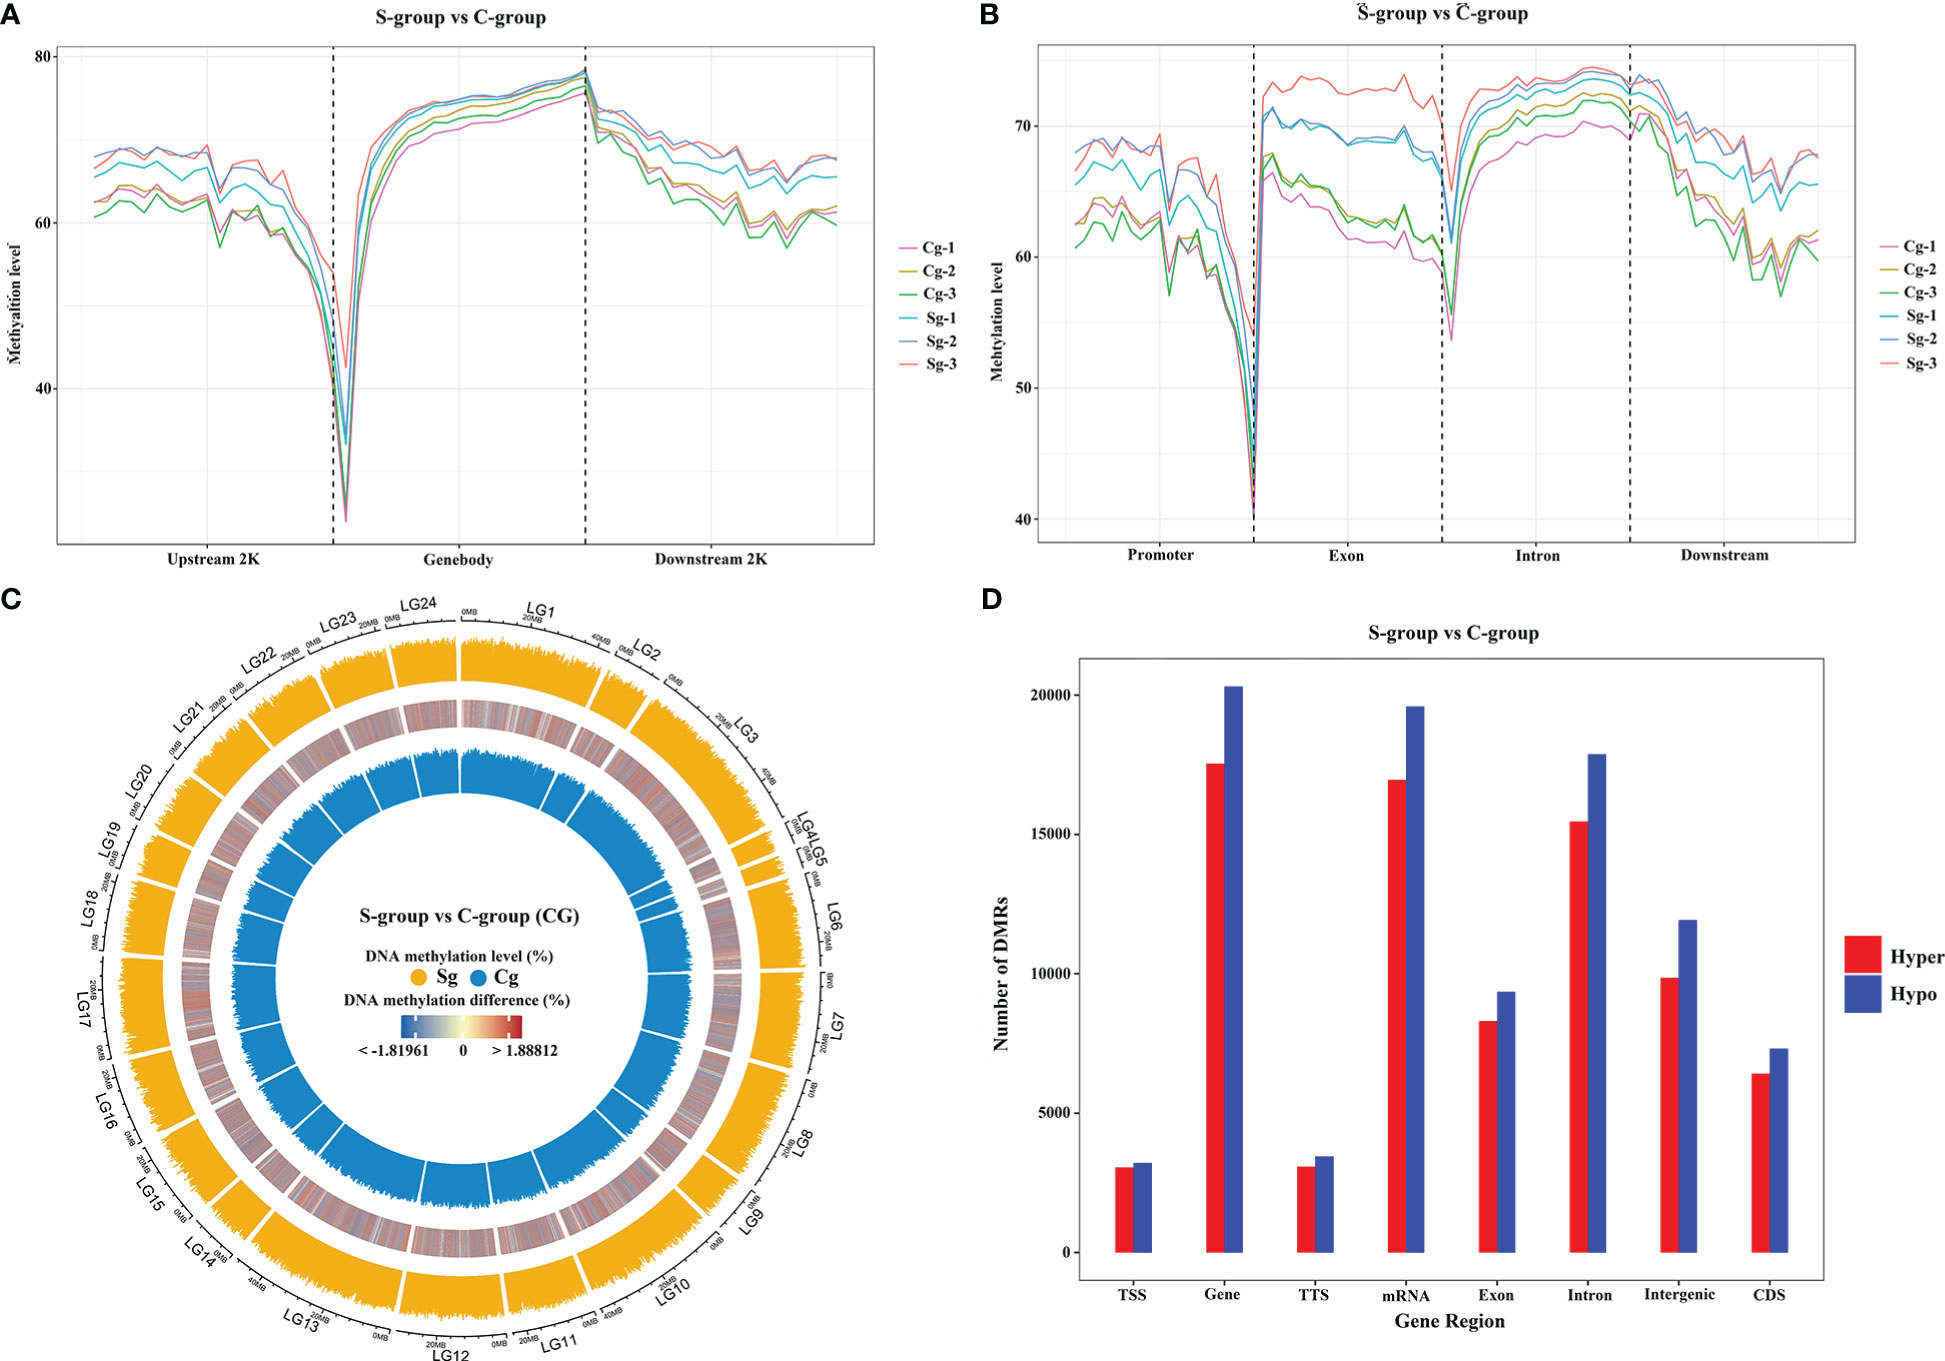
Figure 5 Comparative methylome analysis in the gills of large yellow croaker under low-salinity stress. (A) Density plot of methylation levels in different regions of up-stream, gene body, and down-stream regions. (B) Density plot of methylation levels on different functional genomic elements. (C) Circos plot of CG-type methylation levels between S-group and C-group, the outer circle represents the S-group, the inner circle represents the C-group, and the middle circle is the differential methylation levels between the two groups; LG1 – 24 indicated large yellow croaker chromosome (NC_040011.1, NC_040012.1, NC_040013.1, NC_040014.1, NC_040015.1, NC_040016.1, NC_040017.1, NC_040018.1, NC_040019.1, NC_040020.1, NC_040021.1, NC_040022.1, NC_040023.1, NC_040024.1, NC_040025.1, NC_040026.1, NC_040027.1, NC_040028.1, NC_040029.1, NC_040030.1, NC_040031.1, NC_040032.1, NC_040033.1, NC_040034.1) (D) Distribution of hypo-methylated and hyper-methylated DMR numbers between the S-group and C-group in different functional genomic elements.
According to previous studies, the CG context accounts for the largest proportion of genome-wide DNA methylation (Dodge et al., 2002; Lister et al., 2009; Lister et al., 2013), which was consistent with our findings. Therefore, downstream analyses of the relationship between DNA methylation and gene expression were conducted based on the CG context methylation. WGBS analyses elucidated a total of 16,027 DMRs and 3,858 DMPs (differentially methylated promoters). The GO and KEGG analysis results of the DMR target genes are summarized in Table 6 and Table 7, respectively. Functional analysis indicated that low salinity induced changes in DNA methylation were primarily involved in ion exchange, energy material transport, energy metabolism, cytoskeleton system, nervous system, signal transduction, and other biological processes in the gills of large yellow croaker.
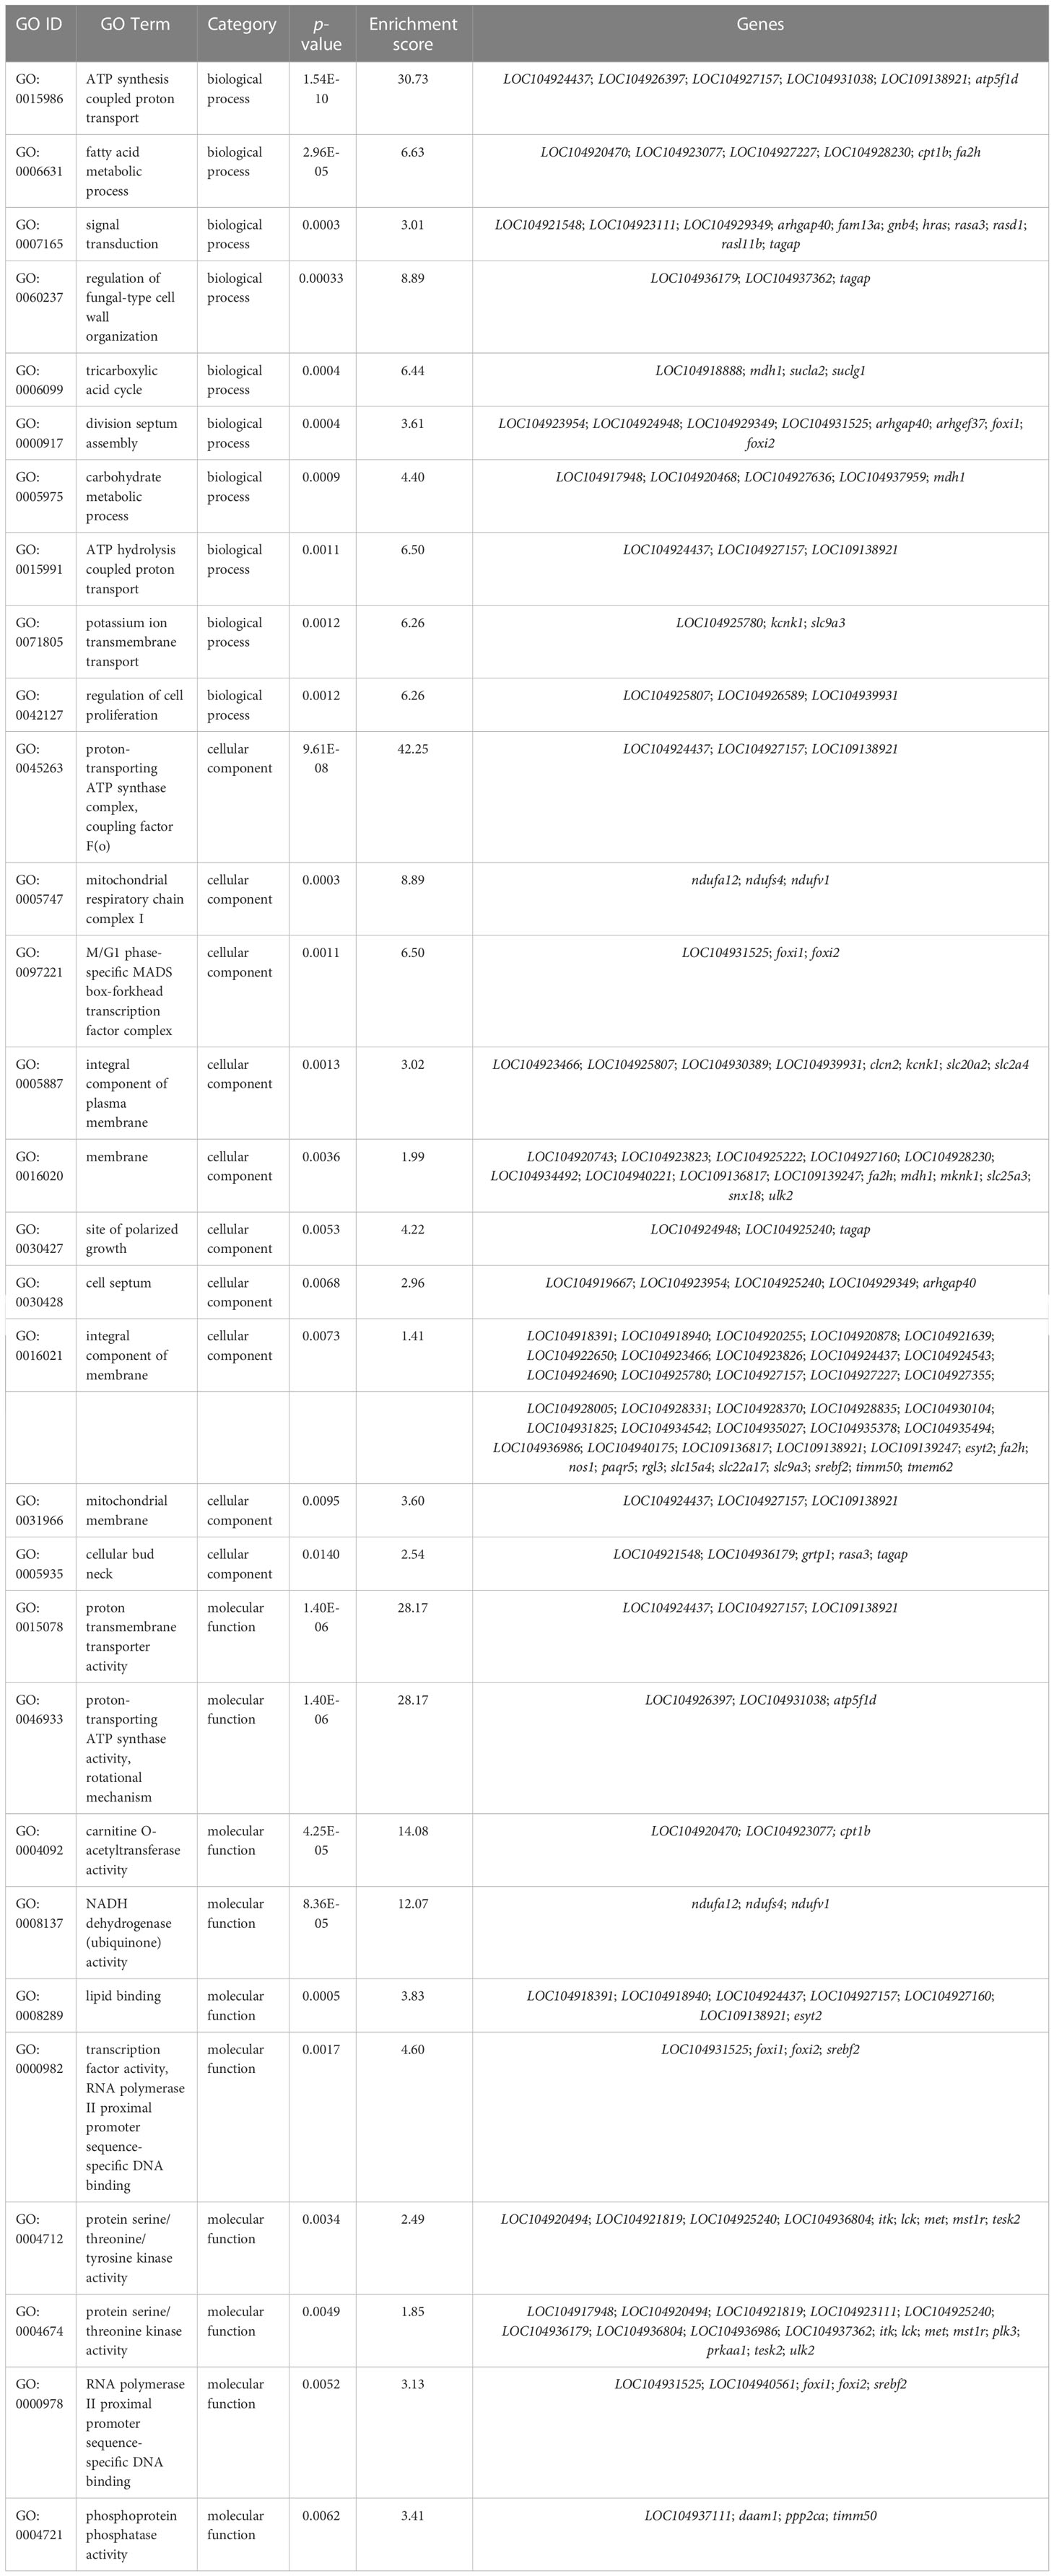
Table 6 GO analysis of the overlapped DMRs target DMGs in gills of large yellow croaker under low-salinity stress.
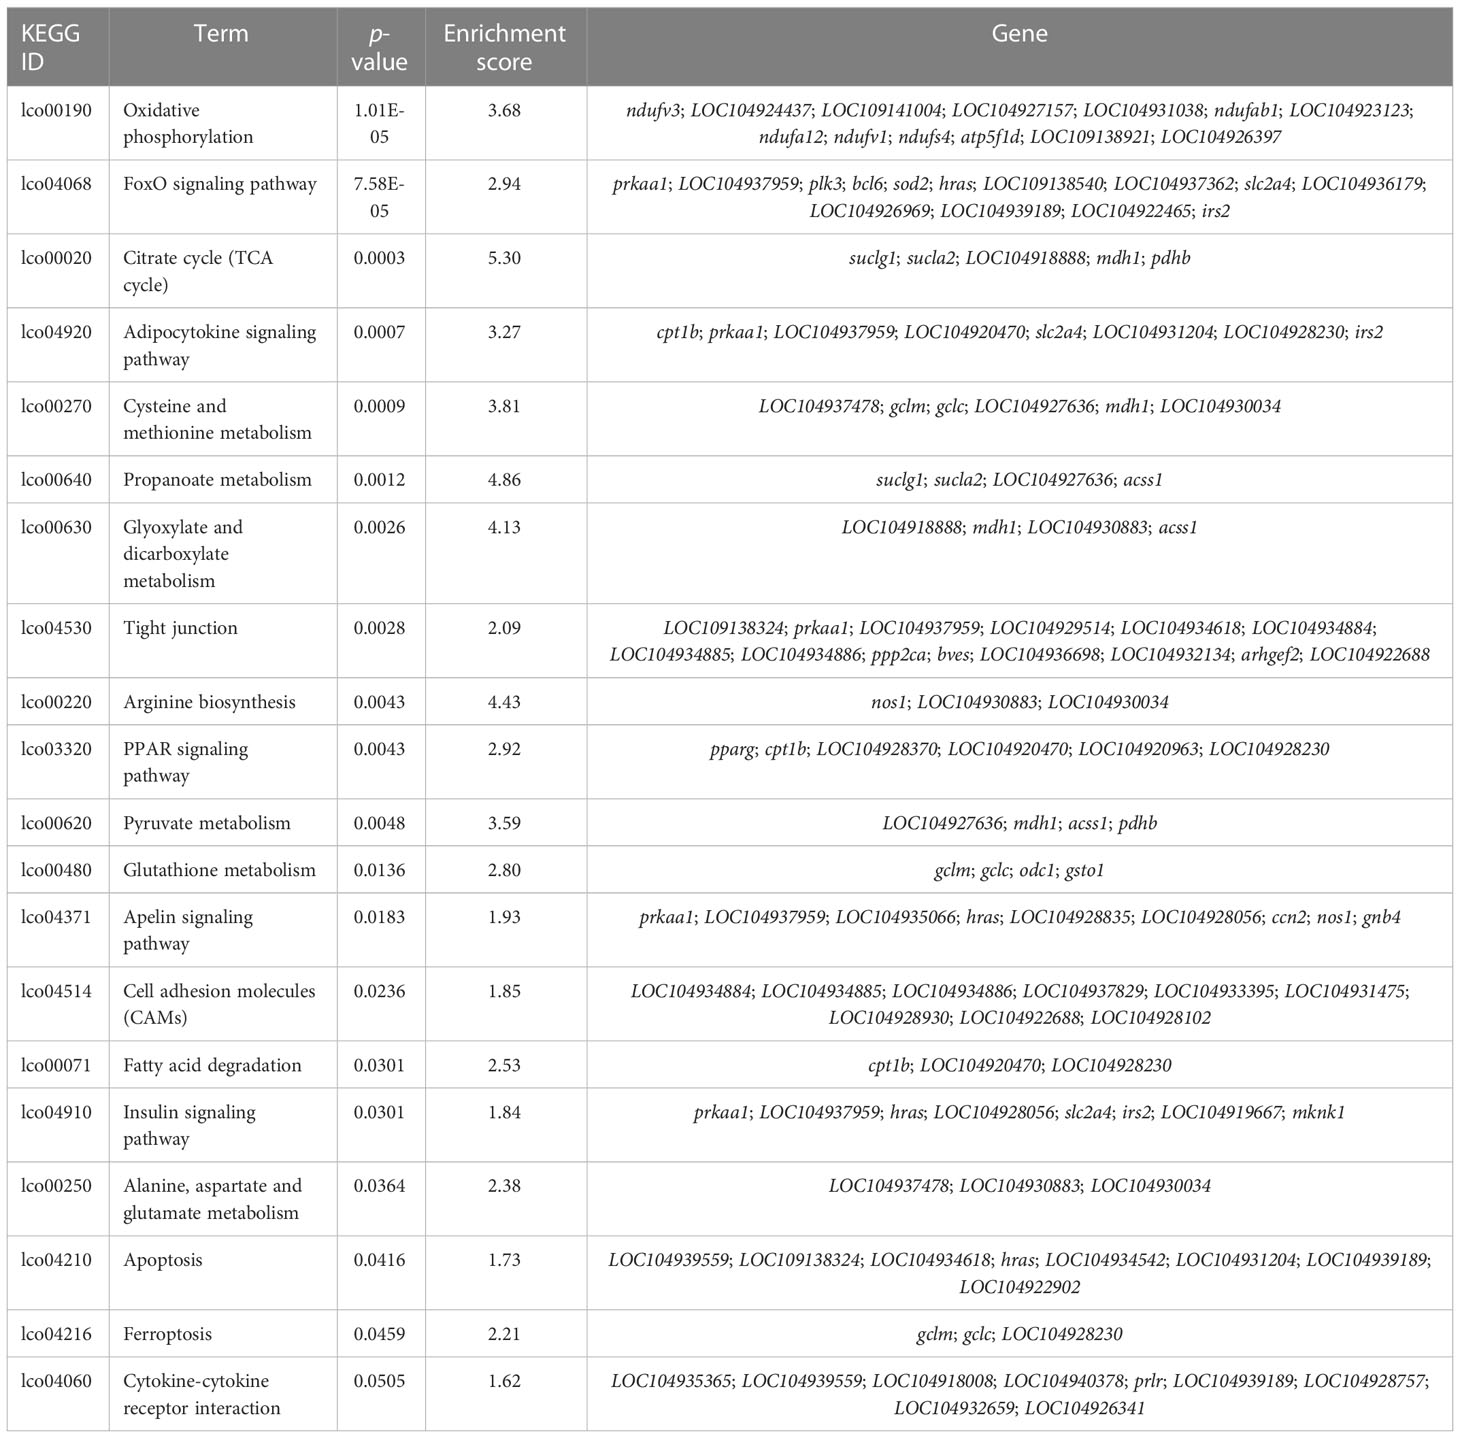
Table 7 KEGG enrichment of the overlapped DMRs target DMGs in gills of large yellow croaker under low-salinity stress.
Correlation analysis between DNA methylation and gene expression
The integrative analysis of RNA-seq with WGBS indicated that there were 422 and 109 DMGs among the identified DMRs and DMPs, respectively (Figure 6A). The expression/methylation correlations of the DMR and DMP target DMGs are illustrated in Figures 6B, C, respectively. Furthermore, the differences in the expression level of the DEGs and the methylation status of the entire DMRs in gill between the S-group and C-group are illustrated in Figure 6D.
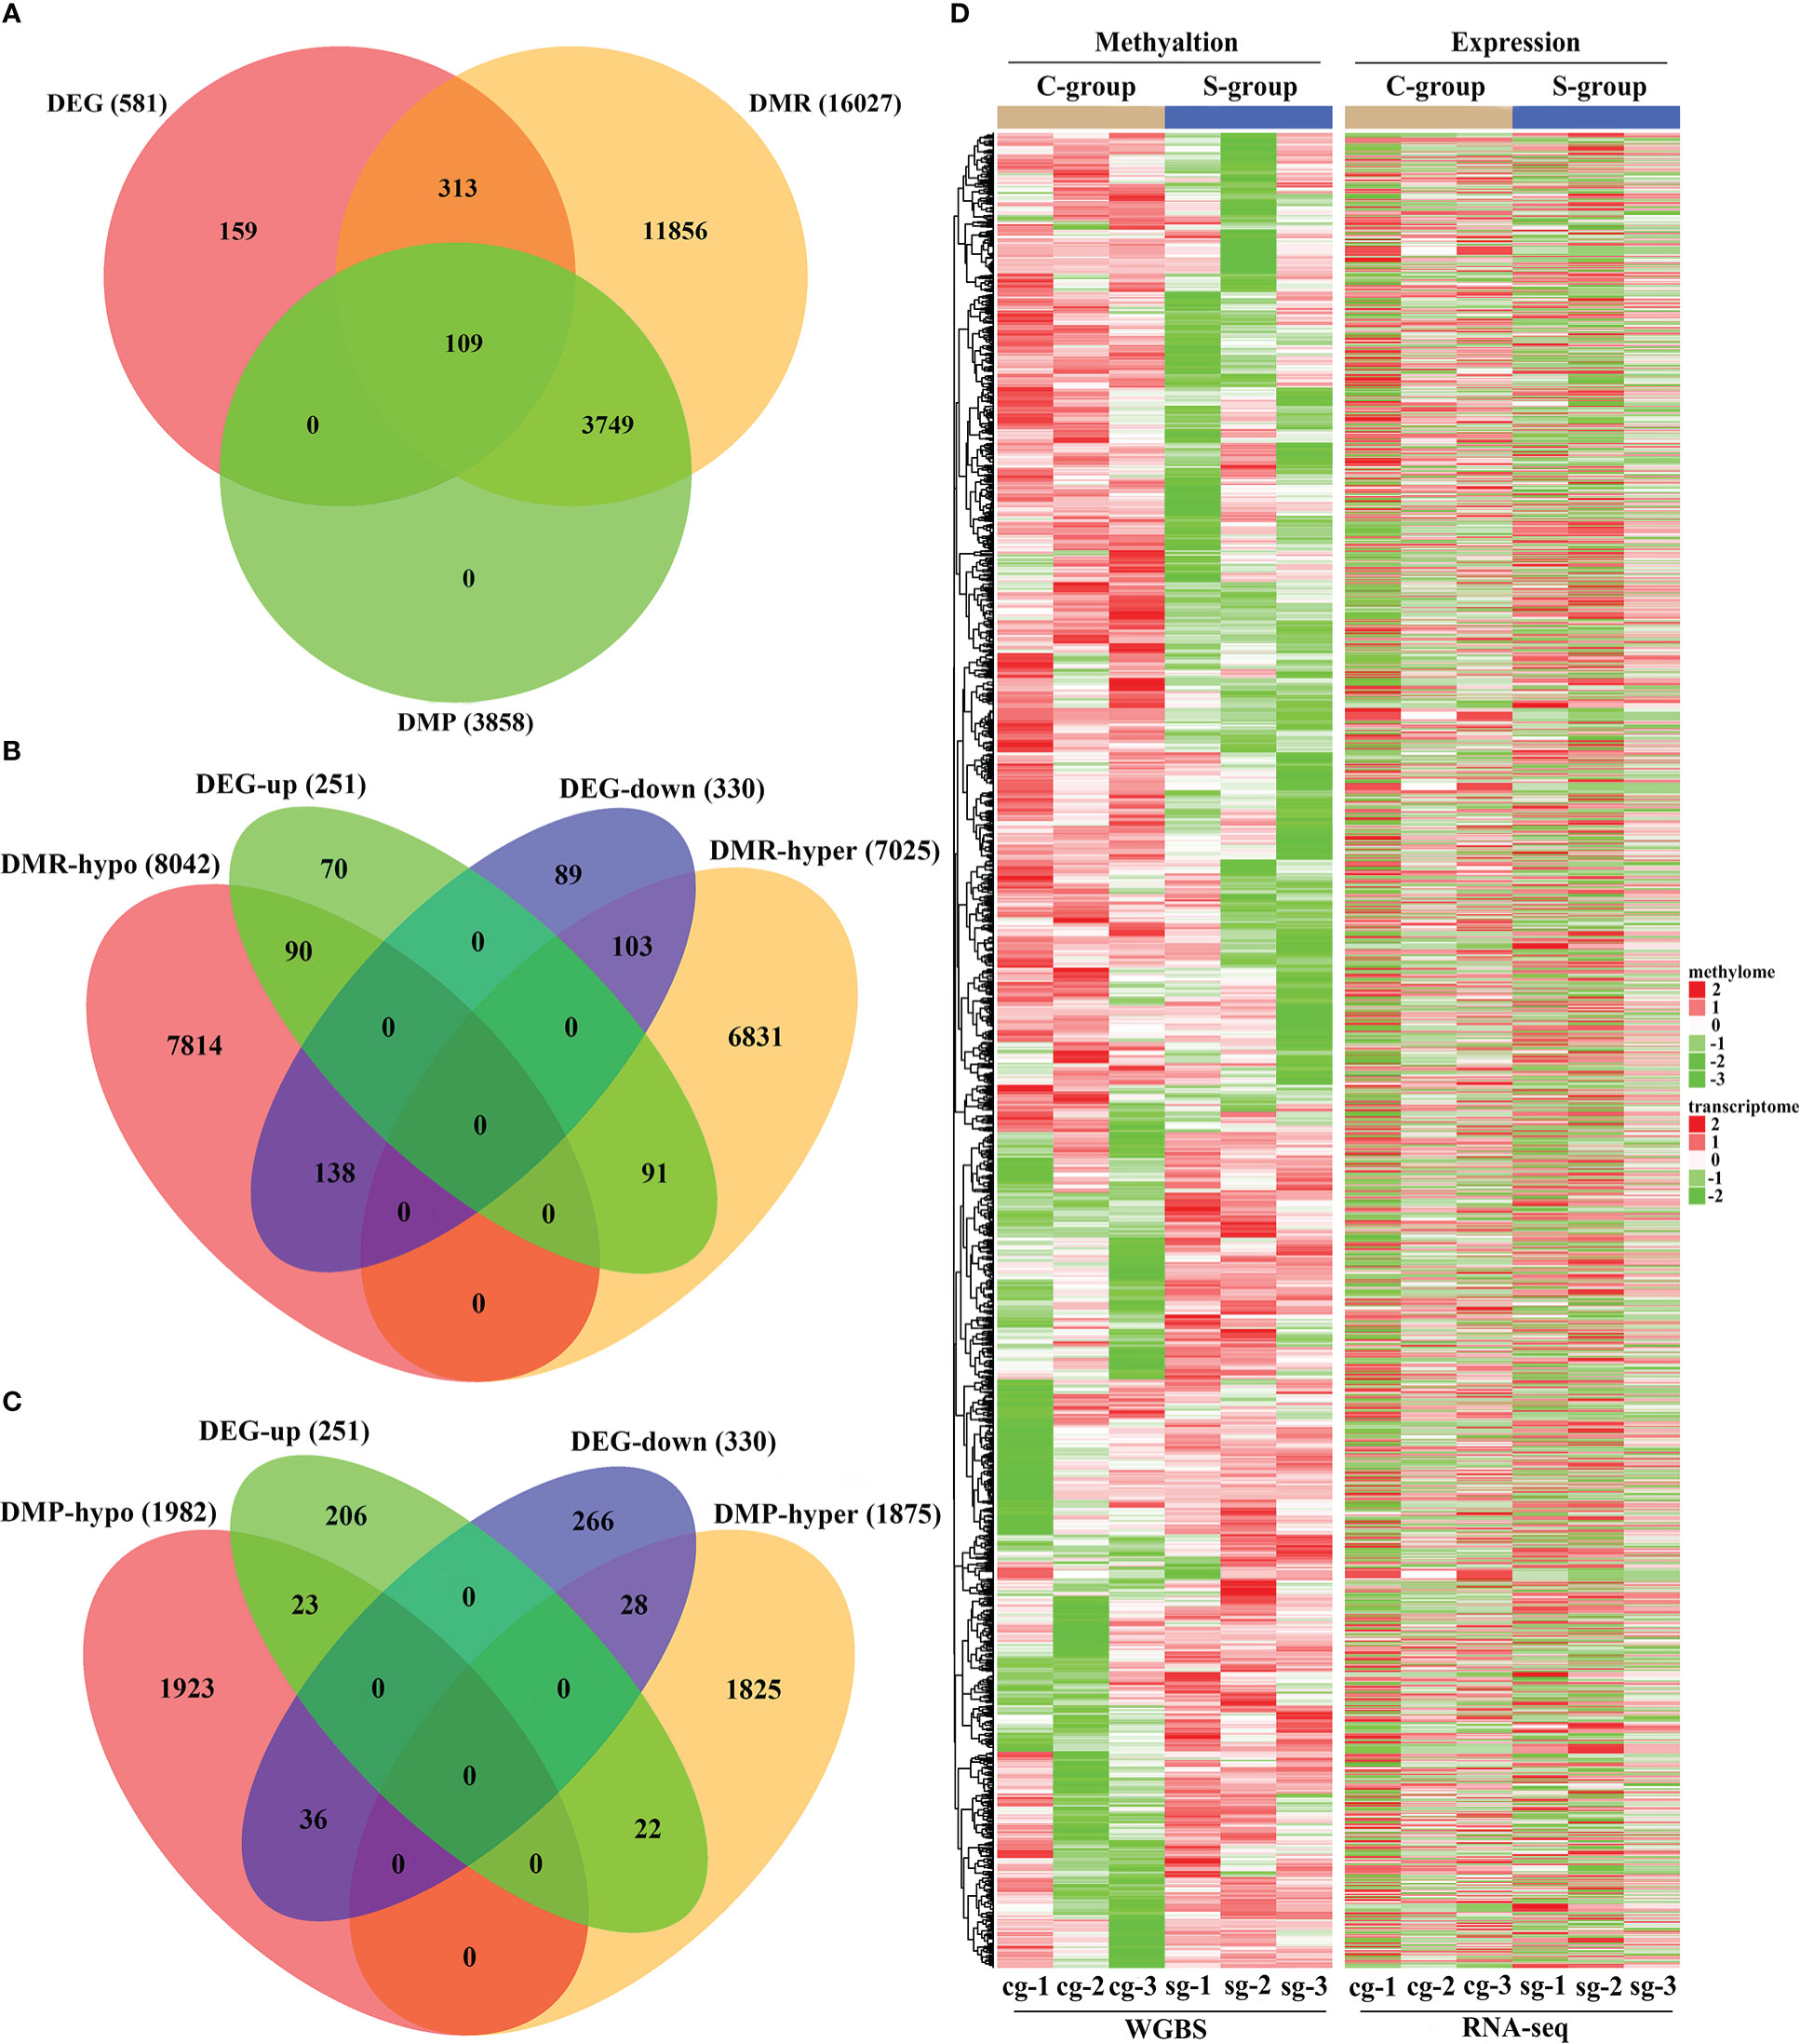
Figure 6 Integrative analysis of RNA-seq and WGBS data of gill tissue of large yellow croaker under low-salinity stress. (A) Venn diagram of overlapped genes of DMGs and DEGs in gill tissue of large yellow croaker between the S-group and C-group; (B) Venn diagram of overlapped genes of DEG expression and DMR target DMGs in gills between the S-group and C-group; (C) Venn diagram of overlapped genes of DEG expression and DMP target DMGs in gills between the S-group and C-group; (D) Heatmap showing the patterns between the DEG expression and methylation of the DMR target DMGs in the gills of large yellow croaker under low-salinity stress.
Functional analysis indicated that the 422 target DMGs of the DMRs were significantly enriched in 228 sub-categories of three major GO categories, including 128 biological process (BP) sub-categories, 23 cellular component (CC) sub-categories, and 77 molecular function (MF) sub-categories with a p-value < 0.01. The top 30 enriched GO terms were mainly involved in osmotic regulation, energy metabolism, gene transcription, and signal transduction and are summarized in Table 8. Additionally, the top 20 enriched KEGG pathways were consistent with those elucidated through GO analysis and are summarized in Table 9.
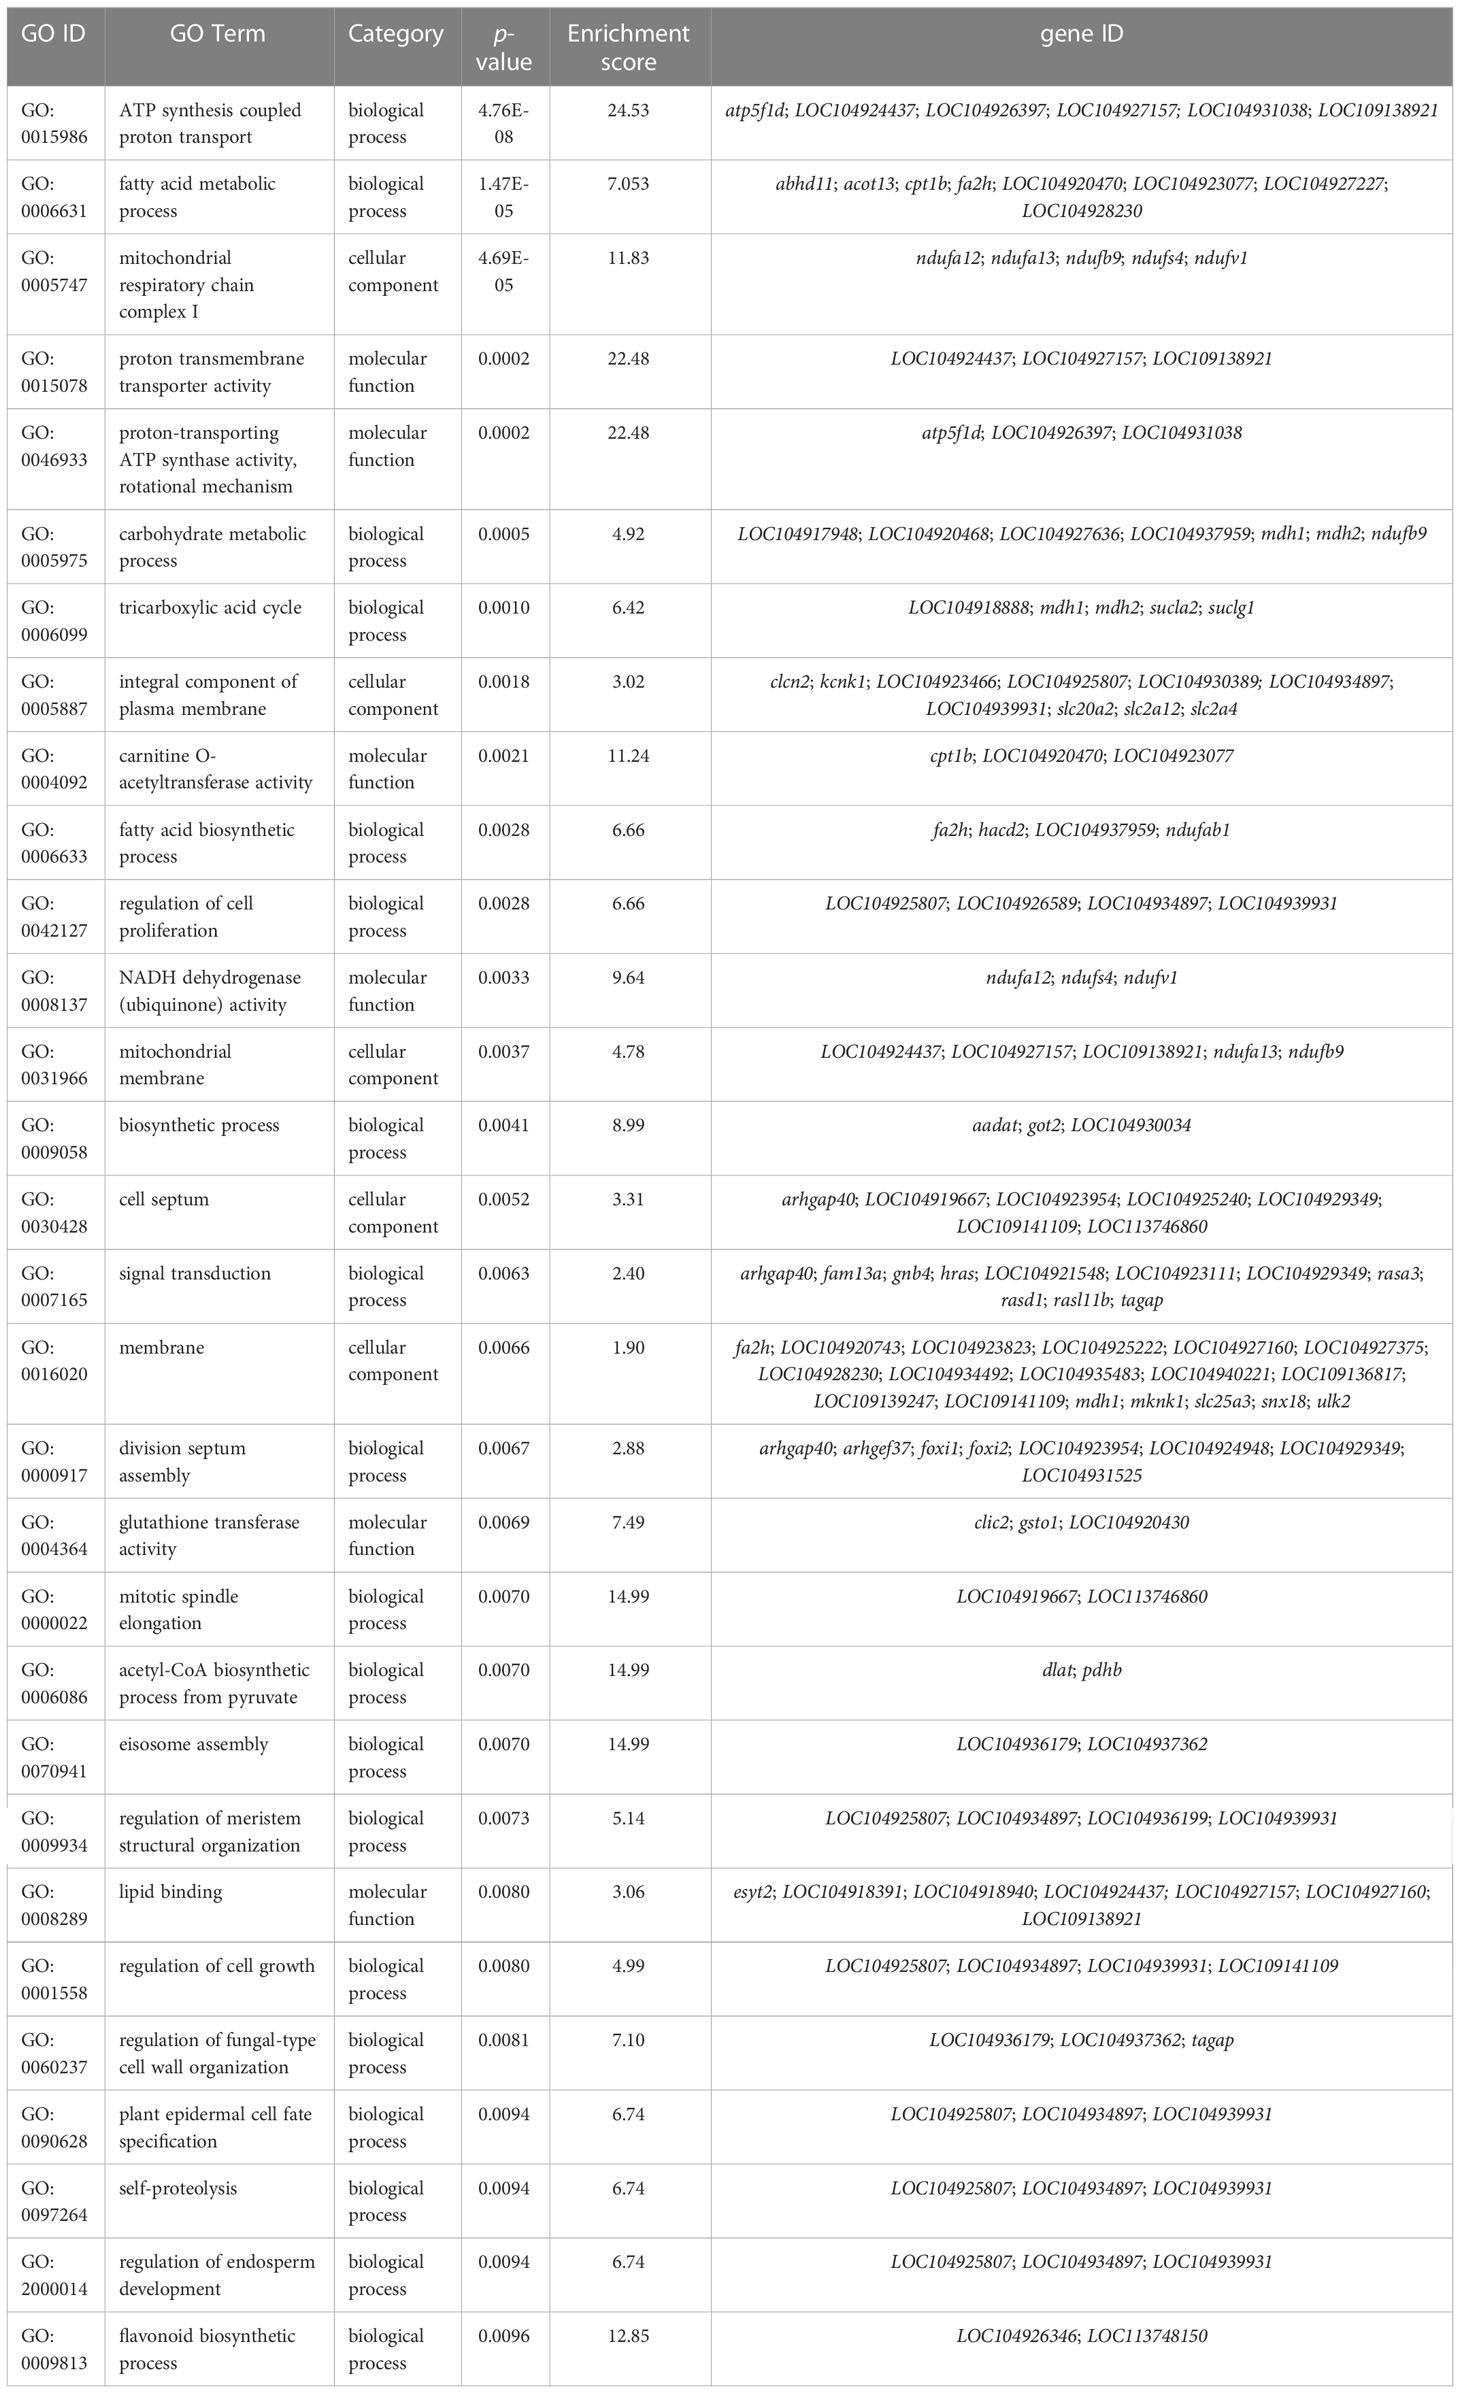
Table 8 TOP 30 GO terms in gills of large yellow croaker under low-salinity stress.
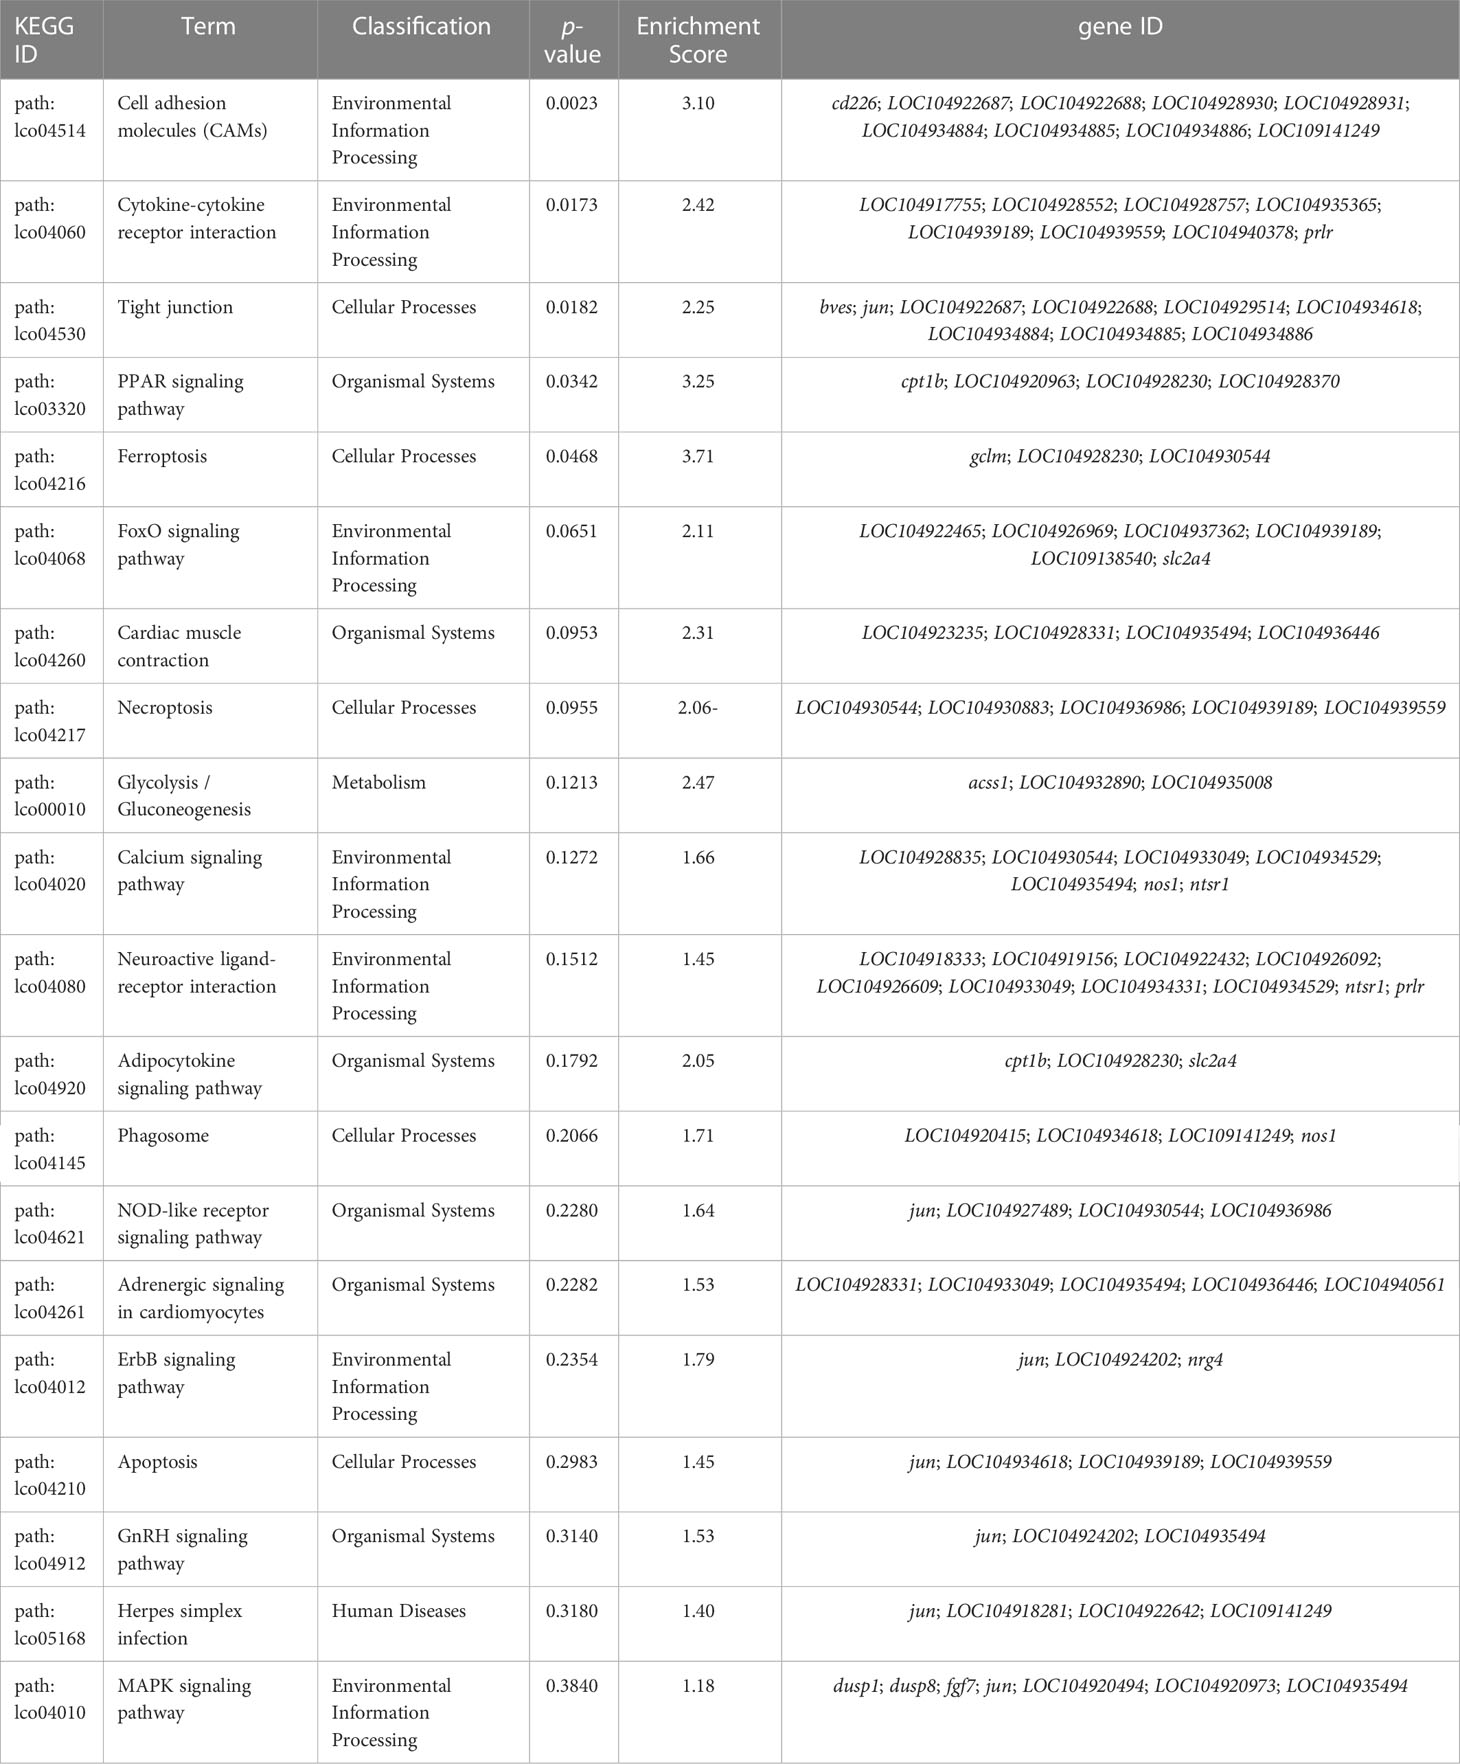
Table 9 TOP 20 KEGG pathways in gills of large yellow croaker under low-salinity stress.
Previous studies reported that promoter methylation has a negative correlation with gene transcription and expression (Law and Jacobsen, 2010). Therefore, we also analyzed the target DMGs of DMPs. GO analysis indicated that 23 hypo-methylated and up-regulated DMGs were mainly enriched in plasma membrane (GO: 0005886), GTPase activator activity (GO: 0005096), signal transduction (GO: 0007165), and 22 other GO categories with a p-value < 0.01 (Figure 7A). Moreover, these DMGs were also enriched in the cAMP signaling pathway and other 6 KEGG pathways (p-value < 0.01) (Figure 7B). Additionally, 28 hyper-methylated and down-regulated DMGs were enriched in cell junction (GO: 0030054), plasma membrane (GO: 0005886), actin cytoskeleton organization (GO: 0030036), and 29 other sub-categories (p-value < 0.01) (Figure 7C), and were also enriched in axon guidance and 21 other KEGG pathways (p-value < 0.01) (Figure 7D). The functional analysis of these 51 DMGs (23 hypo-methylated + 28 hyper-methylated) indicated that DNA methylation might play a critical role in the regulation of ion exchange, energy metabolism, adaptive changes in cytoskeleton and nervous system, and other biological processes in gills during low-salinity adaption.
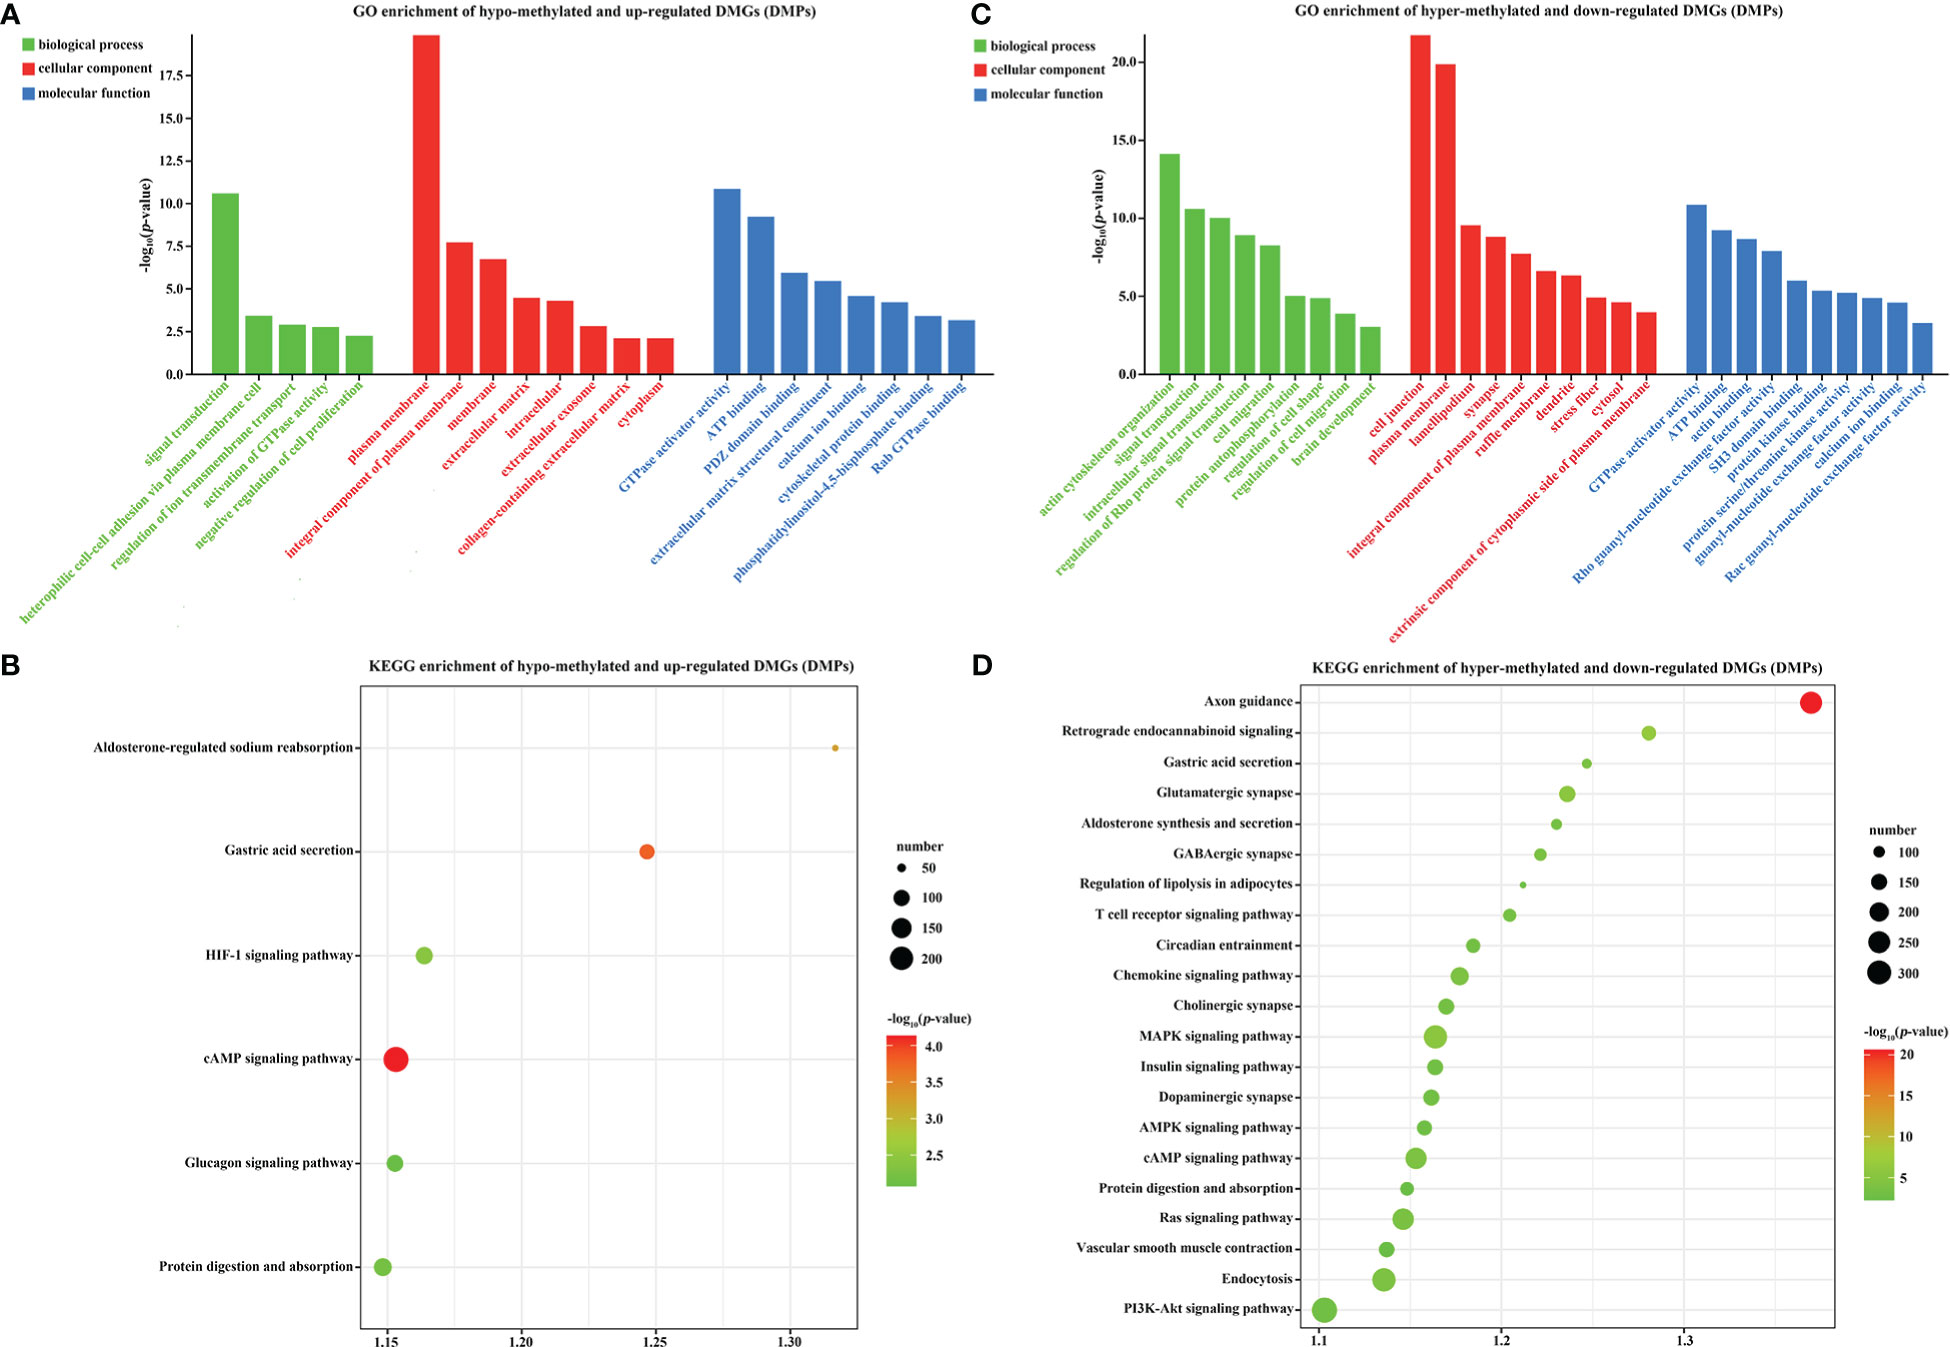
Figure 7 GO and KEGG analysis of DMR target genes in the gills of large yellow croaker under low-salinity stress. (A) GO enrichment of up-regulated, hypo-methylated DMGs; (B) KEGG pathway enrichment of up-regulated, hypo-methylated DMGs; (C) GO enrichment of down-regulated, hyper-methylated DMGs; (D) KEGG pathway enrichment of down-regulated, hyper-methylated DMGs.
This work selected 10 DMGs from the integrative analysis to verify the correlation between promoter methylation status and gene expression in gills. The result indicated that the hyper-methylated status in the promoters of arhgef37, gnb4, LOC104929349, LOC104928056, and LOC104918888 significantly decreased the expression of these genes in gill under low salinity stress. In contrast, the hypo-methylation of the promoters in grtp1, LOC104935555, pdhb, slc2a4, and slc9a3 notably increased the expression of these genes (Figure 8).
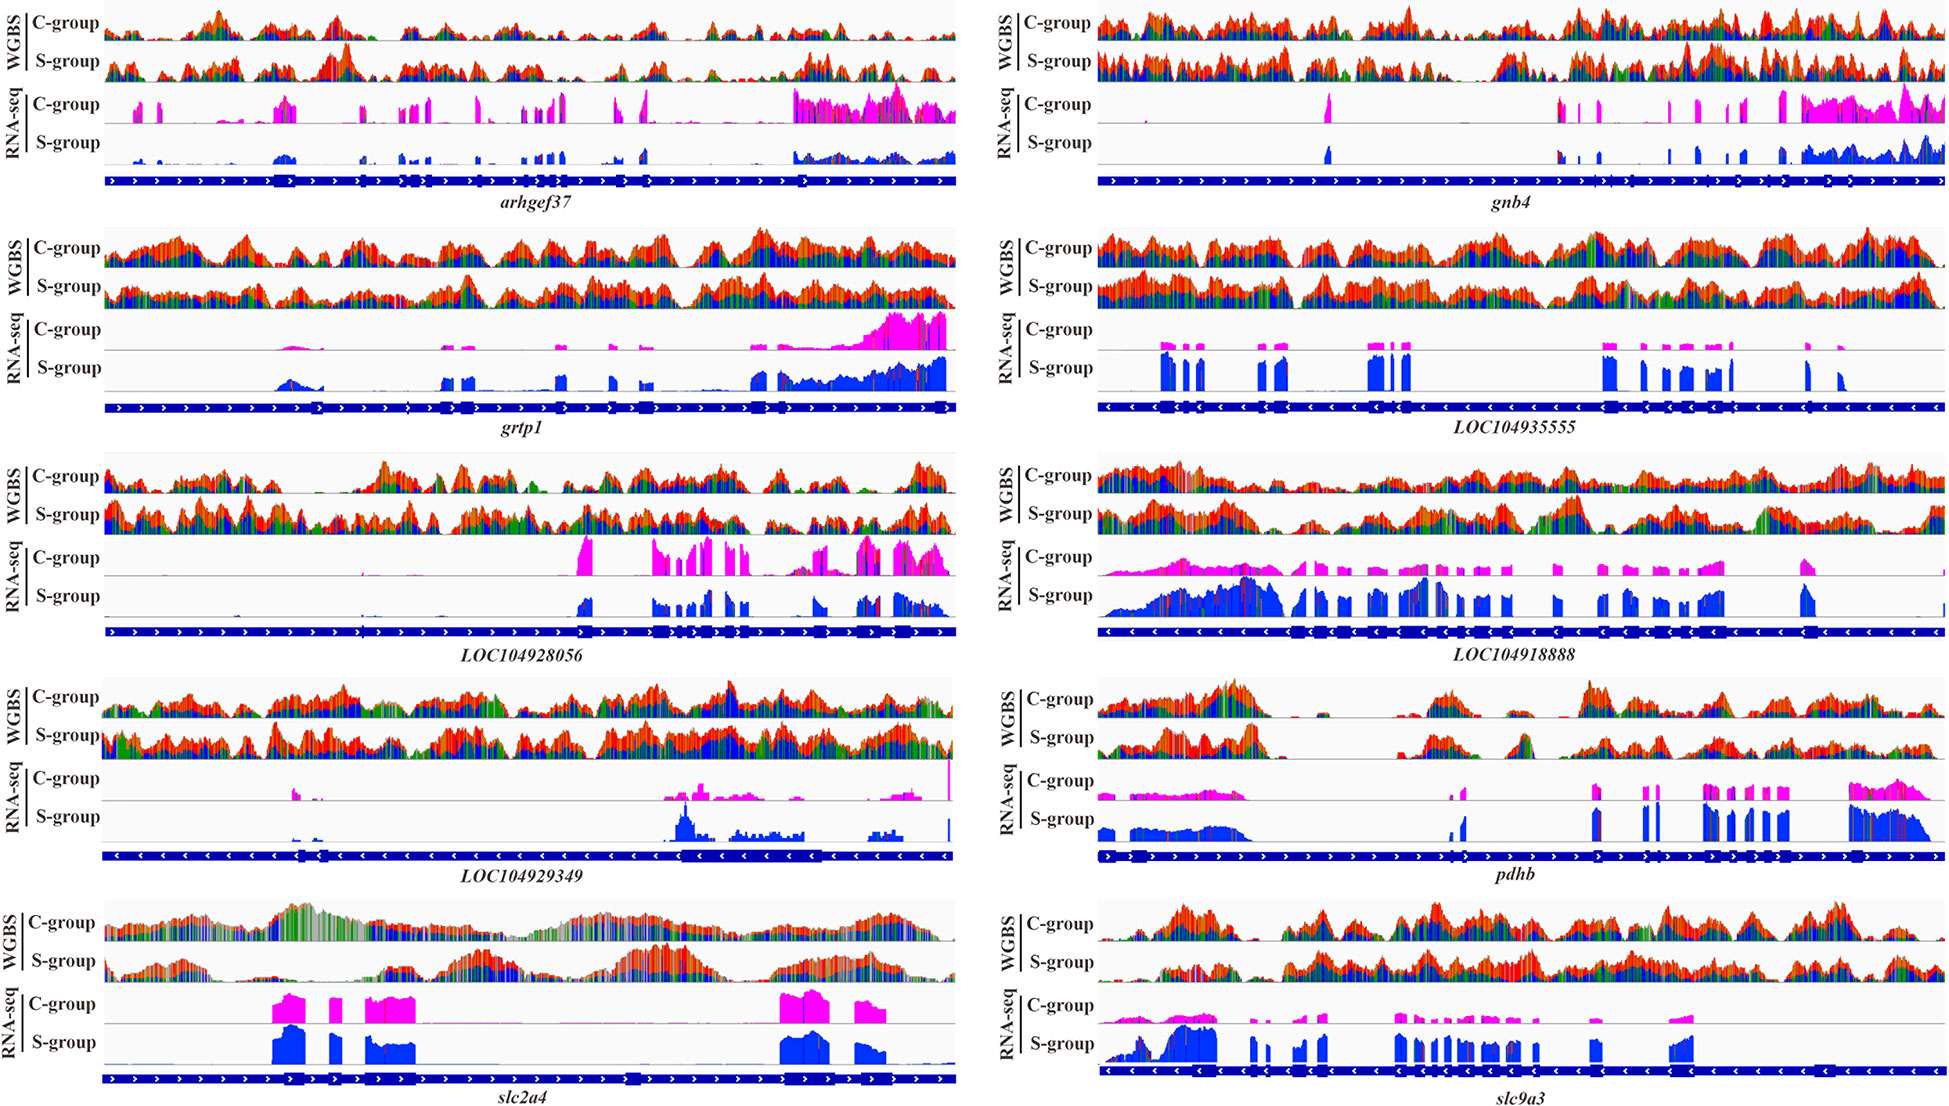
Figure 8 Genome browser tracks showing the correlation between promoter methylation status and gene expression.
Validation of the DMGs in the WGBS analysis of the gill tissues
We selected 5 DMGs (gnb4, LOC104929349, LOC104928056, slc2a4, and slc9a3) for validation of the methylation level. One DMP region of each DMG was selected to comparatively validate the methylation levels in gill tissues among S-group and C-group individuals. As shown in Figure 9, gnb4 and LOC104928056 promoter regions exhibited higher methylation levels in the S-group than in the C-group; conversely, the LOC104929349, slc2a4, and slc9a3 promoter regions exhibited lower methylation levels in the S-group. These results confirmed that the methylation status in the Mass Array test was consistent with the WGBS data.
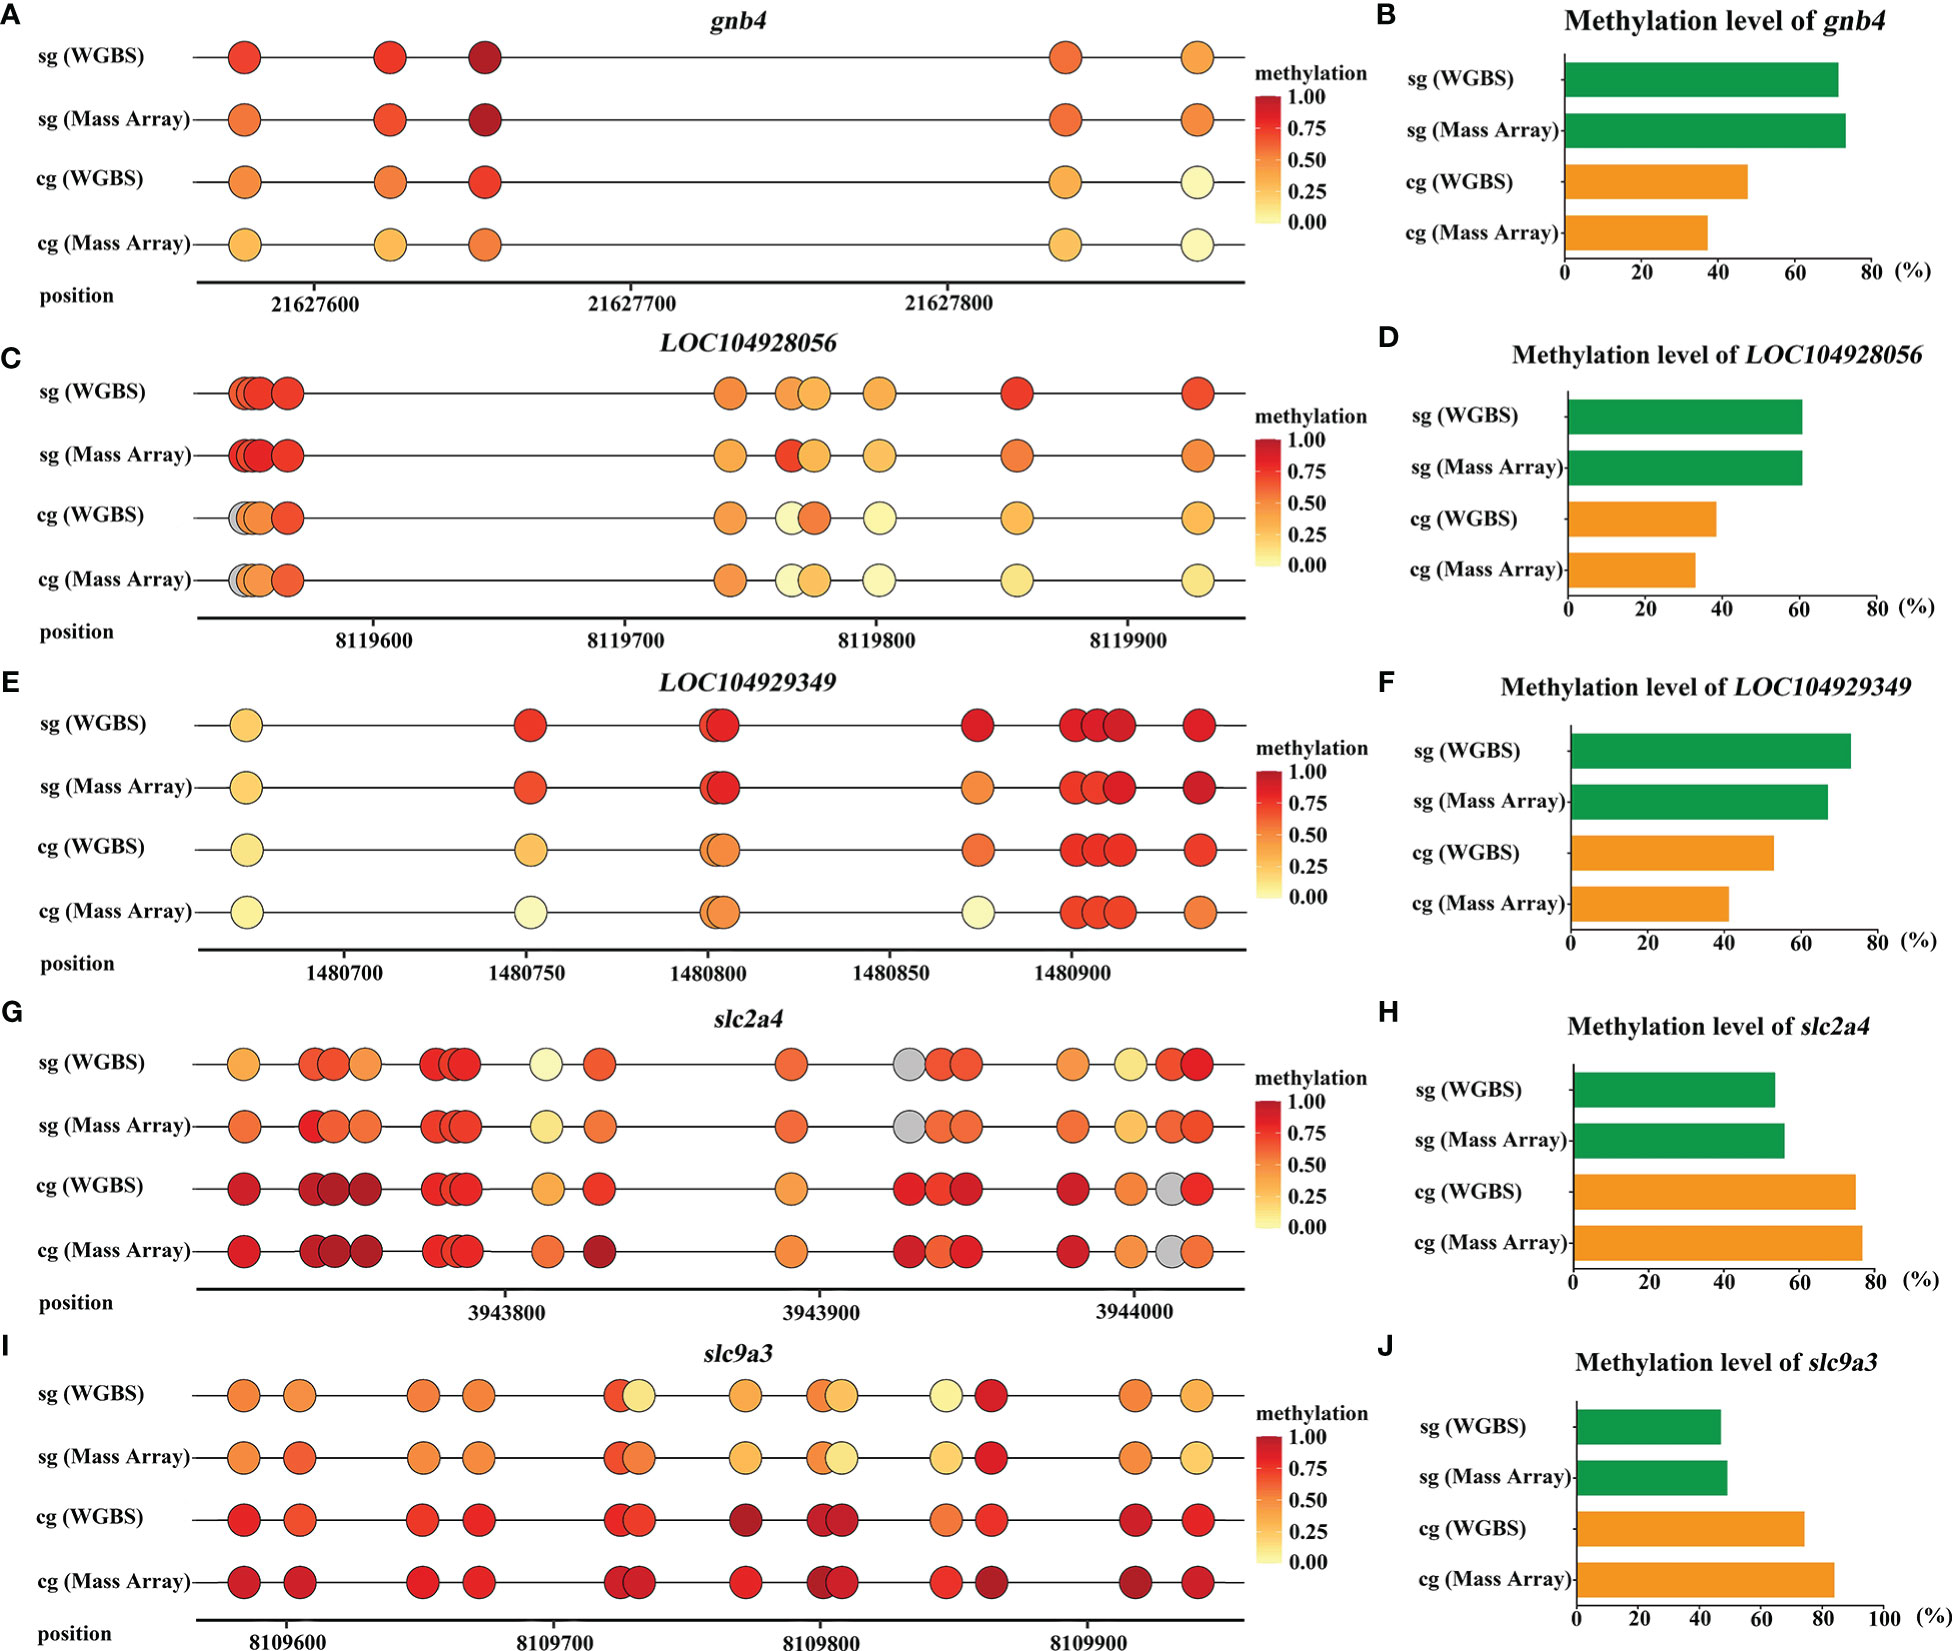
Figure 9 Validation of DMGs in gills of large yellow croaker under low-salinity stress. (A, C, E, G, I) WGBS and Mass Array analyzes of the five DMGs (gnb4, LOC104929349, LOC104928056, slc2a4, and slc9a3) in gills of S-group and C-group, respectively; grey color represents the CG site is undetected; (B, D, F, H, J) the average methylation level of the CG sties in promoter region of the five DMGs (gnb4, LOC104929349, LOC104928056, slc2a4, and slc9a3), respectively.
Discussion
Living organisms have evolved complex and flexible regulation mechanisms to adapt to environmental changes. Environmental epigenetics studies have reported that epigenetic modifications (e.g., DNA methylation, histone modification, and non-coding RNA) could regulate the expression of related genes and result in adaptive phenotype mutations under environmental stress (Mirouze and Paszkowski, 2011). Among these modifications, DNA methylation is one of the most widely documented epigenetic modifications, which commonly occurs in eukaryotic genomes (Bird, 2002; Yara et al., 2015). In general, genome DNA methylation level is dynamically regulated by DNA methylation and demethylation enzymes, thus enabling organisms to cope with abiotic stresses (Schulte, 2014; Yoo et al., 2017). The process of DNA methylation is mainly mediated by DNA methyltransferase (DNMT). Among these enzymes, dnmt1 is responsible for the maintenance of existing DNA methylation, whereas dnmt3bb plays a critical role in the formation of new DNA methylations (Chen and Li, 2006; Moore et al., 2013; Cui and Xu, 2018). In contrast, the demethylation process is mainly mediated by the Tet protein family, which can oxidize 5-methylcystein (5mC) into 5-hydroxymethylcytosine (5hmC), 5-formyl cytosine (5-fC), and finally 5-carboxyl cytosine (5caC). Furthermore, tet1 is critical in the distinction of methylated and unmethylated DNA, and both tet1 and tet2 can oxidize 5mC into 5hmC (Tahiliani et al., 2009; Ito et al., 2010). In this study, the expression of dnmt1, dnmt3bb, tet1, and tet2 was notably increased in gills under low-salinity stress, indicating that these conditions triggered adaptive methylation and demethylation events in the gills of large yellow croaker. The MSAP test indicated that 32.83% and 33.81% of the CpG sites in gill were significantly methylated and demethylated under low-salinity stress, respectively. Both our gene expression and MSAP analyses demonstrated that low salinity stress induced adaptive changes in whole-genome methylation. However, MSAP can only provide insights into the methylation status of the CG context, and therefore this approach cannot comprehensively and accurately reflect the methylation status of the whole genome. Therefore, we conducted an integrative analysis of WGBS and RNA-seq to characterize the dynamics of genome-wide DNA methylation and the potential epigenetic regulation mechanisms in gills under low-salinity stress.
By conducting a comparative transcriptome analysis of the S-group and C-group individuals, our study elucidated 581 DEGs in the gill tissues. GO enrichment showed that these DEGs were mainly enriched in gene pathways associated with ATP synthesis coupled proton transport, fatty acid metabolic process, carbohydrate metabolic process, tricarboxylic acid cycle, signal transduction, and regulation of meristem structural organization, indicating that low-salinity stress induced adaptive changes in energy metabolism and allocation, osmotic regulation, adaptive structure changes, and signal transduction between cells or tissues. In line with the GO analysis results, KEEG enrichment analysis indicated that the DEGs were enriched in the FoxO signaling pathway, glutathione metabolism, cell adhesion molecules (CAMs), cytokine-cytokine receptor interaction and other energy metabolism, and ion exchange. Moreover, the DEGs were also significantly enriched in immune-related pathways such as necroptosis, herpes simplex infection, C-type lectin receptor signaling pathway, and Toll-like receptor signaling pathway. Among these, the C-type lectin family can recognize the polysaccharide structure on the surface of microorganisms and cause agglutination, thereby inducing phagotrophy, alexin activation, and other biological processes (van Vliet et al., 2008; Osorio and Reis e Sousa, 2011). Toll-like receptors are conserved pattern recognition receptors that can initiate innate immune response and eradicate pathogens (Kawai and Akira, 2010). The enrichment of immune-related pathways suggest that low-salinity stress might weaken immunity and increase the likelihood of bacterial, viral, and parasitic infection.
To examine DNA methylation dynamics and potential epigenetic mechanisms involved in low-salinity adaption, this work performed comparative WGBS analysis of S-group and C-group large yellow croaker individuals. The methylation rates of CG, CHG, and CHH in the gills of large yellow croaker were 75.60 ± 1.29%, 10.35 ± 0.41%, and 10.12 ± 0.37%, respectively. Furthermore, our findings confirmed that the CG context accounted for the highest DNA methylation rate, which is consistent with previous studies (Chan et al., 2005; He et al., 2011). Given that CG context methylation exhibited the highest distribution rate, our study especially focused on its distribution characteristics and function. Our findings indicated that CG context methylation was mainly distributed in the gene bodies, CDS regions, and introns in the gills of large yellow croaker, which was consistent with previous studies (Cokus et al., 2008; Lister et al., 2009). Additionally, a total of 7,025 methylated and 8,042 demethylated CG sites among the gene elements in gill were identified under low-salinity stress. As mentioned above, the demethylated CG sites outnumbered the methylated sites, which was consistent with the MSAP data.
Previous studies have reported that DNA methylation can regulate gene transcription and expression. For example, promoter DNA methylation can negatively regulate gene expression (Gal-Yam et al., 2008; Jones, 2012). However, the regulating pattern of DNA methylation in other gene regions is still unclear (Ball et al., 2009). Therefore, our study also focused on characterizing the function of DMPs. The integrative analysis of WGBS and RNA-seq showed that there were 51 DMGs (23 hypo-methylated/up-regulated DMGs, 28 hyper-methylated/down-regulated DMGs) whose expression was negatively related to their promoter methylation status. GO analysis indicated that the hypo-methylated/up-regulated DMGs and hyper-methylated/down-regulated DMGs were simultaneously enriched in six GO terms: signal transduction, plasma membrane, integral component of plasma membrane, GTPase activator activity, ATP binding, and calcium ion binding. Among these enriched pathways, the first three play critical roles in signal transduction and ion transmembrane transport. GTPase activator participates in cell migration, cell proliferation, vesicular transport, and cytoskeletal dynamics (Lee et al., 2012; Jin et al., 2016), whereas calcium ion binding plays critical roles in cell volume maintenance and GTP binding protein can regulate cell calcium concentrations (Yuge et al., 2003). The common enriched GO terms among hypo-methylated/up-regulated DMGs and hyper-methylated/down-regulated DMGs indicated that different methylation and gene expression patterns contributed to common key processes, including signal transduction, ion transport, cell migration, and other process, which warrants further exploration. Moreover, the 23 hypo-methylated and up-regulated DMGs were also enriched in GO terms involved in osmotic regulation, cell shape maintenance, and signal transduction. For example, the up-regulation of DMGs related to ion transmembrane transport, membrane, and extracellular matrix likely improved the osmotic regulation capability of the gills under low-salinity stress. Furthermore, the up-regulation of cell adhesion molecules (CAMs) is known to enhance the regulation of cell shape maintenance and signal transduction (Axler et al., 2008). The PDZ domain is a common protein interaction domain that is vital in the transmembrane transport of receptors and ions (Kim and Sheng, 2004). Phosphatidylinositol-4, 5-bisphosphate (PIP2) plays a critical role in the regulation of actin cytoskeleton reorganization, ion transporter activity, and apoptosis (Loo et al., 2015; Patra and Choi, 2018). Low-salinity stress induced the expression of related DMGs and enhanced the osmotic regulation capability and collaboration among cells. Rab proteins can regulate cell migration and neural synaptic plasticity (Stenmark, 2009; Szodorai et al., 2009), which was consistent with the up-regulation of cytoskeletal protein binding and extracellular exosome. However, the 28 hyper-methylated and down-regulated DMGs were notably enriched in the cytoskeleton system and nervous system gene pathways including actin cytoskeleton organization, cell migration, regulation of cell shape, lamellipodium, stress fiber, actin binding, and other processes. The enrichment data suggested that seven days of adaption to low-salinity stress were enough to induce substantial physiological changes in the gills of large yellow croaker. Rho belongs to the Ras superfamily and plays an important role in cell migration, adhesion, proliferation, and apoptosis (Stanley et al., 2014). The decrease of related DMGs might have resulted from the adaptation of gill tissues to the low-salinity environment, thus restricting cell migration (e.g., chloride cells) and injured cells apoptosis. Protein phosphorylation is critical in ion exchange, cell morphology maintenance, and cell proliferation under environmental stress (Zhou et al, 2018; Millar et al., 2019). In this study, we speculate that the decrease of DMGs associated with protein autophosphorylation and protein serine/threonine kinase activity is also associated with the acclimation of the gills to the low-salinity environment. Consistent with GO analysis, KEGG pathway analysis of these DMGs confirmed that they were enriched in axon guidance, cAMP signaling pathway, aldosterone-regulated sodium reabsorption, and the HIF-1 signaling pathway. Additionally, the hyper-methylated and down-regulated DMGs were also enriched in immune response related pathways such as the chemokine signaling pathway, T-cell receptor signaling pathway, and cholinergic synapse. Among these, the chemokine signaling pathway can induce nearby cells into directional chemotaxis (Baggiolini, 1998). T cells are important immune cells that play critical roles in directly eradicating target cells or assist other immune cells to eliminate abnormal cells and pathogens (Robertsen, 2006; Forlenza et al., 2008). Therefore, we speculated that low-salinity stress weakened the immune system, which rendered the host more vulnerable to pathogen invasion. In turn, immune-related gene expression was activated to neutralize these pathogens. After 7 days of acclimation, the internal environment and homeostasis were recovered, and the expression of immune-related DMGs decreased gradually.
Furthermore, 10 DMGs were selected based on GO and KEGG enrichment information, and the validation test indicated that the expression pattern and the methylation status of these genes were consistent with the RNA-seq and WGBS results. The promoter regions of arhgef37, gnb4, LOC104929349 (dlc1), LOC104928056 (lipea), and LOC104918888 (aco2) were significantly hyper-methylated and their expressions were significantly down-regulated. Among these, arhgef37 has guanine nucleotide exchange factor activity, which can influence cell migration and proliferation by regulating the activity of Rho GTPases (Viplav et al., 2019). LOC104929349 possesses GTP-Rho negative regulatory activity, which is essential in cytoskeletal composition and cell migration (Kawai et al., 2010). gnb4 is an important component of the heterotrimer G protein, which participates in signal transduction mediated by G protein-coupled receptors (Wang et al., 2018), LOC104928056 is a neutral lipase secreted by adipose tissue catalyzing triglyceride hydrolysis (Kraemer and Shen, 2006). Aconitase 2 is a key enzyme that maintains the homeostasis of white fat cell metabolism and regulates fatty acid synthesis (Devisser et al., 2011). The down-regulation of the five DMGs indicated that adaptive cell migration, signal transduction strength, and lipid metabolism decreased in the gills after the 7-day adaption period. Furthermore, the promoter regions of grtp1, LOC104935555, pdhb, slc2a4, and slc9a3 were significantly demethylated and their expressions were notably up-regulated. Among these genes, grtp1 possesses GTPase-activating activity and participates in intracellular protein transport (Lu et al., 2001). LOC104935555 possesses carbonic anhydrase 4 activity, which plays a critical role in intracellular pH homeostasis maintenance (Waheed and Sly, 2014). pdhb possesses lanine dehydrogenase activity and regulates cell migration and proliferation (Tang et al., 2016). slc2a4 is a facilitated glucose transporter that can regulate intracellular glucose homeostasis maintenance (Abel et al., 2001). slc9a3 is also known as NH3, which is a sodium/hydrogen exchanger participating in Na+/H+ transmembrane transport to maintain intracellular acid-base balance and promotes the absorption of water and ions (Subramanya et al., 2007). The up-regulation of these five DMGs can enhance the ion/glucose transmembrane transport capability to maintain internal homeostasis and energy supply in gills under low-salinity stress.
Conclusions
Based on the above analysis, adaptive methylation and demethylation events generally occurred in gill under low-salinity stress. The differential methylation events enable large yellow croaker to adapt to low-salinity stress by improving osmotic regulation, energy metabolism, cell shape maintenance, signal transduction, and other biological process by regulating the transcription and expression of related genes. Collectively, our findings provide new insights into the molecular mechanisms through which marine animals respond and adapt to various environmental stressors.
Data availability statement
The datasets presented in this study can be found in online repositories. The names of the repository/repositories and accession number(s) can be found below: https://www.ncbi.nlm.nih.gov/, PRJNA798588 https://www.ncbi.nlm.nih.gov/, PRJNA87638.
Ethics statement
The animal study was reviewed and approved by Care and Use of laboratory animals of Zhejiang Wanli University.
Author contributions
JY, ZL conceived and designed the study. JY and TZ contributed to data curation. JY and ML participated in formal analysis and methodology. JY wrote the manuscript. ZL and QL reviewed and edited the manuscript. All authors contributed to the article and approved the submitted version.
Conflict of interest
The authors declare that the research was conducted in the absence of any commercial or financial relationships that could be construed as a potential conflict of interest.
Publisher’s note
All claims expressed in this article are solely those of the authors and do not necessarily represent those of their affiliated organizations, or those of the publisher, the editors and the reviewers. Any product that may be evaluated in this article, or claim that may be made by its manufacturer, is not guaranteed or endorsed by the publisher.
References
Abel E. D., Peroni O., Kim J. K., Kim Y. B., Boss O., Hadro E., et al. (2001). Adipose-selective targeting of the GLUT4 gene impairs insulin action in muscle and liver. Nature 409 (6821), 729–733. doi: 10.1038/35055575
Adusumalli S., Mohd O. M. F., Soong R., Benoukraf T. (2015). Methodological aspects of whole-genome bisulfite sequencing analysis. Briefings Bioinf. 16 (3), 369–379. doi: 10.1093/bib/bbu016
Akalin A., Kormaksson M., Li S., Garrett-Bakelman F. E., Figueroa M. E., Melnick A., et al. (2012). methylKit: A comprehensive r package for the analysis of genome-wide DNA methylation profiles. Genome Biol. 13 (10), R87. doi: 10.1186/gb-2012-13-10-r87
Artem V. A., Nikolai S. M., Sergey M. R. (2017). Genome-wide DNA methylation profiling reveals epigenetic adaptation of stickleback to marine and freshwater conditions. Mol. Biol. Evol. 34 (9), 2203–2213. doi: 10.1093/molbev/msx156
Ashburner M., Ball C. A., Blake J. A., Botstein D., Butler H., Cherry J. M., et al. (2000). Gene ontology: tool for the unification of biology. the gene ontology consortium. Nat. Genet. 25 (1), 25–29. doi: 10.1038/75556
Axler O., Ahnström J., Dahlbäck B. (2008). Apolipoprotein m associates to lipoproteins through its retained signal peptide. FEBS Lett. 582 (5), 826–828. doi: 10.1016/j.febslet.2008.02.007
Baggiolini M. (1998). Chemokines and leukocyte traffic. Nature 392 (6676), 565–568. doi: 10.1038/33340
Ball M. P., Li J. B., Gao Y., Lee J. H., LeProust E. M., Park I. H., et al. (2009). Targeted and genome-scale strategies reveal gene-body methylation signatures in human cells. Nat. Biotechnol. 27 (4), 361–368. doi: 10.1038/nbt.1533
Bird A. (2002). DNA Methylation patterns and epigenetic memory. Genes Dev. 16 (1), 6–21. doi: 10.1101/gad.947102
Bossdorf O., Zhang Y. Y. (2011). A truly ecological epigenetics study. Mol. Ecol. 20 (8), 1572–1574. doi: 10.1111/j.1365-294X.2011.05044.x
Busconi M., Colli L., Sánchez R. A., Santaella M., De-Los-Mozos Pascual M., Santana O., et al. (2015). AFLP and MS-AFLP analysis of the variation within saffron crocus (Crocus sativus l.) germplasm. PloS One 4 (10), e123434. doi: 10.1371/journal.pone.0123434
Chan S. W., Henderson I. R., Jacobsen S. E. (2005). Gardening the genome: DNA methylation in Arabidopsis thaliana. Nat. Rev. Genet. 6 (5), 351–360. doi: 10.1038/nrg1601
Chen T., Li E. (2006). Establishment and maintenance of DNA methylation patterns in mammals. Curr. Topics Microbiol. Immunol. 301, 179–201. doi: 10.1007/3-540-31390-7_6
Cokus S. J., Feng S., Zhang X., Chen Z., Merriman B., Haudenschild C. D., et al. (2008). Shotgun bisulphite sequencing of the Arabidopsis genome reveals DNA methylation patterning. Nature 452 (7184), 215–219. doi: 10.1038/nature06745
Cui D., Xu X. (2018). DNA Methyltransferases, DNA methylation, and age-associated cognitive function. Int. J. Mol. Sci. 19 (5), 1315. doi: 10.3390/ijms19051315
Devisser A., Yang C., Herring A., Martinez J. A., Rosales-Hernandez A., Poliakov I., et al. (2011). Differential impact of diabetes and hypertension in the brain: adverse effects in grey matter. Neurobiol. Dis. 44 (2), 161–173. doi: 10.1016/j.nbd.2011.06.005
Dodge J. E., Ramsahoye B. H., Wo Z. G., Okano M., Li E. (2002). De novo methylation of MMLV provirus in embryonic stem cells: CpG versus non-CpG methylation. Gene 289 (1-2), 41. doi: 10.1016/S0378-1119(02)00469-9
Forlenza M., de Carvalho Dias J. D., Veselý T., Pokorová D., Savelkoul H. F., Wiegertjes G. F. (2008). Transcription of signal-3 cytokines, IL-12 and IFN alpha beta, coincides with the timing of CD8 alpha beta up-regulation during viral infection of common carp (Cyprinus carpio l). Mol. Immunol. 45 (6), 1531–1547. doi: 10.1016/j.molimm.2007.10.010
Gal-Yam E. N., Egger G., Iniguez L., Holster H., Einarsson S., Zhang X., et al. (2008). Frequent switching of polycomb repressive marks and DNA hypermethylation in the PC3 prostate cancer cell line. Proc. Natl. Acad. Sci. 105 (35), 12979. doi: 10.1073/pnas.0806437105
He X. J., Chen T., Zhu J. K. (2011). Regulation and function of DNA methylation in plants and animals. Cell Res. 21 (3), 442–465. doi: 10.1038/cr.2011.23
Huang Z. K., Xiao Q. Z., Yu F., Gan Y., Lu C., Peng W., et al. (2021). Comparative transcriptome and DNA methylation analysis of phenotypic plasticity in the pacific abalone (Haliotis discus hannai). Front. Physiol. 12, 683499. doi: 10.3389/fphys.2021.683499
Ito S., D'Alessio A. C., Taranova O. V., Hong K., Sowers L. C., Zhang Y. (2010). Role of tet proteins in 5mC to 5hmC conversion, ES-cell self-renewal and inner cell mass specification. Nature 466 (7310), 1129–1133. doi: 10.1038/nature09303
Jin Y., Lv X., Zhou J., Chen J. (2016). Potential involvement of IQGAP1 in proliferation and metastasis of human pancreatic cancer. Front. bioscience 21 (5), 1076–1083. doi: 10.2741/4442
Jones P. A. (2012). Functions of DNA methylation: islands, start sites, gene bodies and beyond. Nat. Rev. Genet. 13 (7), 484–492. doi: 10.1038/nrg3230
Kawai K., Kitamura S. Y., Maehira K., Seike J., Yagisawa H. (2010). START-GAP1/DLC1 is localized in focal adhesions through interaction with the PTB domain of tensin2. Adv. Enzyme Regul. 50 (1), 202–215. doi: 10.1016/j.advenzreg.2009.10.013
Kawai T., Akira S. (2010). The role of pattern-recognition receptors in innate immunity: update on toll-like receptors. Nat. Immunol. 11 (5), 373–384. doi: 10.1038/ni.1863
Kim E., Sheng M. (2004). PDZ domain proteins of synapses. Nat. Rev. Neurosci. 5 (10), 771–781. doi: 10.1038/nrn1517
Kraemer F. B., Shen W. J. (2006). Hormone-sensitive lipase knockouts. Nutr. Metab. 3 (1), 12–19. doi: 10.1186/1743-7075-3-12
Krueger F., Andrews S. R. (2011). Bismark: a flexible aligner and methylation caller for bisulfite-seq applications. Bioinformatics 27 (11), 1571–1572. doi: 10.1093/bioinformatics/btr167
Law J. A., Jacobsen S. E. (2010). Establishing, maintaining and modifying DNA methylation patterns in plants and animals. Nat. Rev. Genet. 11, 204–220. doi: 10.1038/nrg2719
Lee I. J., Coffman V. C., Wu J. Q. (2012). Contractile-ring assembly in fission yeast cytokinesis: Recent advances and new perspectives. Cytoskeleton (Hoboken) 69 (10), 751–763. doi: 10.1002/cm.21052
Li S. P., He F., We H. S., Li J., Si Y., Liu M., et al. (2017). Analysis of DNA methylation level by methylation-sensitive amplification polymorphism in half smooth tongue sole (Cynoglossus semilaevis) subjected to salinity stress. J. Ocean Univ. China (Oceanic Coast. Sea Research) 16 (2), 269–278. doi: 10.1007/s11802-017-3156-4
Li L., Li A., Song K., Meng J., Guo X., Li S. (2018). Divergence and plasticity shape adaptive potential of the pacific oyster. Nat. Ecol. Evol. 2 (11), 1751–1760. doi: 10.1038/s41559-018-0668-2
Lister R., Mukamel E. A., Nery J. R., Urich M., Puddifoot C. A., Johnson N. D., et al. (2013). Global epigenomic reconfiguration during mammalian brain development. Science 341 (6146), 629. doi: 10.1126/science.1237905
Lister R., Pelizzola M., Dowen R. H., Hawkins R. D., Hon G., Tonti-Filippini J., et al. (2009). Human DNA methylomes at base resolution show widespread epigenomic differences. Nature 462 (7271), 315–322. doi: 10.1038/nature08514
Loo L., Wright B. D., Zylka M. J. (2015). Lipid kinases as therapeutic targets for chronic pain. Pain 156 Suppl 1 (0 1), S2–S10. doi: 10.1097/01.j.pain.0000460345.92588.4b
Love M. I., Huber W., Anders S. (2014). Moderated estimation of fold change and dispersion for RNA-seq data with DESeq2. Genome Biol. 15 (12), 550. doi: 10.1186/s13059-014-0550-8
Lu C., Kasik J., Stephan D. A., Yang S., Sperling M. A., Menon R. K. (2001). Grtp1, a novel gene regulated by growth hormone. Endocrinology 142 (10), 4568–4571. doi: 10.1210/endo.142.10.8527
Lu Z., Huang W. Q., Wang S., Shan X., Ji C., Wu H. (2020). Liver transcriptome analysis reveals the molecular responses to low-salinity in large yellow croaker larimichthys crocea. Aquaculture 517 (C), 734827. doi: 10.1016/j.aquaculture.2019.734827
Macdonald J. S., Patterson D. A., Hague M. J., Guthrie I. C. (2010). Modeling the influence of environmental factors on spawning migration and mortality for sockeye salmon fisheries management in the Fraser river, British Columbia. Trans. Am. Fisheries Society. 139, 768–782. doi: 10.1577/T08-223.1
Millar A. H., Heazlewood J. L., Giglione C., Holdsworth M. J., Bachmair A., Schulze W. X. (2019). The scope, functions, and dynamics of posttranslational protein modifications. Annu. Rev. Plant Biol. 70, 119–151. doi: 10.1146/annurev-arplant-050718-100211
Mirouze M., Paszkowski J. (2011). Epigenetic contribution to stress adaptation in plants. Curr. Opin. Plant Biol. 14, 267–274. doi: 10.1016/j.pbi.2011.03.004
Moore L. D., Le T., Fan G. (2013). DNA Methylation and its basic function. Neuropsychopharmacology 38 (1), 23–38. doi: 10.1038/npp.2012.112
Osorio F., Reis e Sousa C. (2011). Myeloid c-type lectin receptors in pathogen recognition and host defense. Immunity 34 (5), 651–664. doi: 10.1016/j.immuni.2011.05.001
Patra M. C., Choi S. (2018). Insight into phosphatidylinositol-dependent membrane localization of the innate immune adaptor protein toll/interleukin 1 receptor domain-containing adaptor protein. Front. Immunol. 9, 75. doi: 10.3389/fimmu.2018.00075
Peter P., Carl F. S., Kai K., Dim C. (2019). Summer weather becomes more persistent in a 2°C world. Nat. Climate Change 9, 666–671. doi: 10.1038/s41558-019-0555-0
Richards C. L., Bossdorf O., Pigliucci M.. (2010). What role does heritable epigenetic variation play in phenotypic evolution? BioScience 60 (3), 232–237. doi: 10.1525/bio.2010.60.3.9
Robertsen B. (2006). The interferon system of teleost fish. Fish Shellfish Immunol. 20 (2), 172–191. doi: 10.1016/j.fsi.2005.01.010
Schulte P. M. (2014). What is environmental stress? insights from fish living in a variable environment. J. Exp. Biol. 217, 23–34. doi: 10.1242/jeb.089722
Stanley A. C., Wong C. X., Micaroni M., Venturato J., Khromykh T., Stow J. L., et al. (2014). The rho GTPase Rac1 is required for recycling endosome-mediated secretion of TNF in macrophages. Immunol. Cell Biol. 92 (3), 275–286. doi: 10.1038/icb.2013.90
Stenmark H. (2009). Rab GTPases as coordinators of vesicle traffic. Nat. Rev. Mol. Cell Biol. 10 (8), 513–525. doi: 10.1038/nrm2728
Subramanya S. B., Rajendran V. M., Srinivasan P., Nanda. Kumar N. S., Ramakrishna B. S., Binder H. J. (2007). Differential regulation of cholera toxin-inhibited Na-h exchange isoforms by butyrate in rat ileum. Am. J. Physiol. - Gastrointestinal Liver Physiol. 293 (4), G857–G863. doi: 10.1152/ajpgi.00462.2006
Szodorai A., Kuan Y. H., Hunzelmann S., Engel U., Sakane A., Sasaki T., et al. (2009). APP anterograde transport requires Rab3A GTPase activity for assembly of the transport vesicle. J. Neurosci. 29 (46), 14534–14544. doi: 10.1523/JNEUROSCI.1546-09.2009
Tahiliani M., Koh K. P., Shen Y., Pastor W. A., Bandukwala H., Brudno Y., et al. (2009). Conversion of 5-methylcytosine to 5-hydroxymethylcytosine in mammalian DNA by MLL partner TET1. Science 324 (5929), 930–935. doi: 10.1126/science.1170116
Tang H., Luo X., Li J., Zhou Y., Li Y., Song L., et al. (2016). Pyruvate dehydrogenase b promoted the growth and migration of the nasopharyngeal carcinoma cells. Tumor Biol. 37 (8), 10563–10569. doi: 10.1007/s13277-016-4922-4
Teng G. L., Huang W. Q., Ji C. L., Chen Y., Shan X. (2020). Morphological changes and variations in Na+/K+-ATPase activity in the gills of juvenile large yellow croaker (Larimichthys crocea) at low salinity. Aquaculture Fisheries 7 (3), 313–320. doi: 10.1016/j.aaf.2020.08.003
van Vliet S. J., García-Vallejo J. J., van Kooyk Y. (2008). Dendritic cells and c-type lectin receptors: coupling innate to adaptive immune responses. Immunol. Cell Biol. 86 (7), 580–587. doi: 10.1038/icb.2008.55
Viplav A., Saha T., Huertas J., Selenschik P., Ebrahimkutty M. P., Grill D., et al. (2019). ArhGEF37 assists dynamin 2 during clathrin-mediated endocytosis. J. Cell Sci. 132 (9), jcs226530. doi: 10.1242/jcs.226530
Waheed A., Sly W. S. (2014). Membrane associated carbonic anhydrase IV (CA IV): a personal and historical perspective. Subcellular Biochem. 75, 157–179. doi: 10.1007/978-94-007-7359-2_9
Wang B., Li D., Rodriguez-Juarez R., Farfus A., Storozynsky Q., Malach M., et al. (2018). A suppressive role of guanine nucleotide-binding protein subunit beta-4 inhibited by DNA methylation in the growth of anti-estrogen resistant breast cancer cells. BMC Cancer 18 (1), 817. doi: 10.1186/s12885-018-4711-0
Weyrich A., Lenz D., Jeschek M., Chung T. H., Rübensam K., Göritz F., et al. (2016). Paternal intergenerational epigenetic response to heat exposure in male wild guinea pigs. Mol. Ecol. 25 (8), 1729–1740. doi: 10.1111/mec.13494
Xie C., Mao X., Huang J., Ding Y., Wu J., Dong S., et al. (2011). KOBAS 2.0: a web server for annotation and identification of enriched pathways and diseases. Nucleic Acids Res. 39 (Web Server issue), W316–W322. doi: 10.1093/nar/gkr483
Xiong L. Z., Xu C. G., Maroof M. A. S., Zhang Q. (1999). Patterns of cytosine methylation pattern in an elite rice hybrid and its parental lines detected by a methylation sensitive amplification polymorphism technique. Mol. Gen. Genet. 261 (3), 439–446. doi: 10.1007/s004380050986
Yara S., Lavoie J. C., Levy E. (2015). Oxidative stress and DNA methylation regulation in the metabolic syndrome. Epigenomics 7 (2), 283–300. doi: 10.2217/epi.14.84
Yoo Y., Park J. H., Weigel C., Liesenfeld D. B., Weichenhan D., Plass C., et al. (2017). TET-mediated hydroxymethylcytosine at the pparγ locus is required for initiation of adipogenic differentiation. Int. J. Pediatr. Obes. 41 (4), 652–659. doi: 10.1038/ijo.2017.8
Yuge S., Inoue K., Hyodo S., et al. (2003). A novel guanylin family (Guanylin, uroguanylin, and renoguanylin) in eels: possible osmoregulatory hormones in intestine and kidney. J. Biol. Chem. 278 (25), 22726–22733. doi: 10.1074/jbc.M303111200
Yu G., Wang L. G., Han Y., He Q. Y. (2012). clusterProfiler: an r package for comparing biological themes among gene clusters. OMICS 16 (5), 284–287. doi: 10.1089/omi.2011.0118
Zeng L., Ai C. X., Wang Y. H., Zhang J. S., Wu C. W. (2017). Abrupt salinity stress induces oxidative stress via the Nrf2-Keap1 signaling pathway in large yellow croaker Pseudosciaena crocea. Fish Physiol. Biochem. 43 (4), 955–964. doi: 10.1007/s10695-016-0334-z
Keywords: low salinity stress, large yellow croaker, methylome, transcriptome, epigenetic regulation mechanism
Citation: Yang J, Liu M, Zhou T, Li Q and Lin Z (2023) Transcriptome and methylome dynamics in the gills of large yellow croaker (Larimichthys crocea) during low-salinity adaption. Front. Mar. Sci. 10:1082655. doi: 10.3389/fmars.2023.1082655
Received: 31 October 2022; Accepted: 12 January 2023;
Published: 01 February 2023.
Edited by:
Taewoo Ryu, Okinawa Institute of Science and Technology Graduate University, JapanCopyright © 2023 Yang, Liu, Zhou, Li and Lin. This is an open-access article distributed under the terms of the Creative Commons Attribution License (CC BY). The use, distribution or reproduction in other forums is permitted, provided the original author(s) and the copyright owner(s) are credited and that the original publication in this journal is cited, in accordance with accepted academic practice. No use, distribution or reproduction is permitted which does not comply with these terms.
*Correspondence: Zhihua Lin, emhpaHVhOTk4OEAxMjYuY29t; Qi Li, cWlsaTY2QG91Yy5lZHUuY24=