Abstract
North Pacific subtropical mode waters (STMWs), which are subducted with air-sea interaction signals and characterized by low potential vorticity (PV), play an important role in climate change issues. STMW () can be advected westward by large-scale ocean circulation and mesoscale eddies. However, whether and how the STMW intrudes into the South China Sea (SCS) remains unclear. Low PV signals that originate from the STMW and intruding into the SCS are investigated by comparing observations and ocean general circulation models during 2003-2017. These signals mostly move across the Luzon Strait (LS) into the SCS during the 2008-2009 and 2014-2016 periods. The results of case studies selected from these two periods indicate that the low PV signals can move to the LS and are trapped by anticyclonic eddies (AEs). When the velocity vorticity is negative southwest of Taiwan Island, vertical stratification becomes weaker west of the coming AE (AE1), and low PV signals can consequently be transported along the STMW layer (25.0 - 25.5 isopycnal layer). Thus, an AE (AE2) forms east of AE1 and isolates the low PV signal from AE1, and then AE2 transports the low PV water southwestward in the SCS. In contrast, the low PV signal has difficulty migrating eastward when the velocity vorticity is positive west of AE1, as vertical stratification strengthens and then weakens that signal. The results suggest that only AEs can relay low PV signals from east of the LS and carry them over long distances in the SCS.
1 Introduction
The Luzon Strait (LS), located between Taiwan and the Luzon Islands, is the only deep channel connecting the North Pacific (NP) and the South China Sea (SCS). Previous studies have revealed that NP signals can impinge on the SCS and thus affect the dynamic state of the SCS through LS transport (Qu et al., 2000, Qu, 2002; Xie et al., 2011; Nan et al., 2015). The Kuroshio, carrying NP water, intrudes into the SCS when it passes by the LS (Chern and Wang, 1998; Yuan et al., 2008; Nan et al., 2015). The NP water can be advected to the SCS with a multilayer vertical structure across the LS, with the Kuroshio flowing into the SCS in the upper layer above 500 m and in the deep layer below 2000 m and outflow in the middle layer (Qu, 2002; Tian et al., 2006). Both observations and numeric model results (Xue et al., 2004; Caruso et al., 2006; Sheu et al., 2010) demonstrate that the Kuroshio takes different intruding paths southwest of Taiwan, and the changes in the Kuroshio intrusion paths often induce eddies in the LS area (Nan et al., 2011b). In addition, LS transport can also convey climate change signals from the NP to the SCS and thus modulate the momentum, heat and salt budgets there (Qu et al., 2004; Nan et al., 2015; Zeng et al., 2016; Zhao and Zhu, 2016; Xiao et al., 2018).
The North Pacific subtropical mode water (STMW) is characterized as low potential vorticity (PV) water in the subsurface layer and is commonly detected in the subtropical gyre (Hanawa and Talley, 2001). The subduction of STMW takes place in the isopycnal outcrop region in late winter, generally when the mixed layer is the deepest during the year (Huang and Qiu, 1994). The STMW propagates along isopycnal surfaces with sea–air interaction signals to the tropical region and is thus believed to play an important role in climate change (Huang and Liu, 1999; Johnson and McPhaden, 1999; Liu, 1999).
STMW presents remarkable mesoscale features in which thick mode water is related to anticyclonic eddy (AE) occurrence due to its deep mixed layer accompanied by a deep thermocline, and vice versa (Oka et al., 2011). Observations have revealed that eddies are able to retain mode water and propagate westward over long distances (Uehara et al., 2003; Xu et al., 2017; Shi et al., 2018). Using the outputs from eddy-resolving global ocean simulations, Nishikawa et al. (2010) confirmed that the southward translation of AEs can be accompanied by low PV signals. Previous observations show that eddy activities are frequent in the LS area (Wang et al., 2003; Yuan et al., 2007; Nan et al., 2011a; Xie et al., 2011; Wang et al., 2020). With both observed and numeric model outputs, Xie et al. (2011) found a subsurface AE between 500 m and 900 m at approximately 120° - 121°E, 19.5° - 20.5°N, which possibly developed due to the baroclinic instability of the Luzon Undercurrent and interaction of the current with the bottom topography. Using in situ measurements from October 2014, Nan et al. (2017) detected low PV water trapped by a subsurface-intensified AE east of Taiwan Island (23°N, 120°-130°E) and found that the meridional velocity anomaly observed in the subsurface corresponded to the low PV core in the subsurface layer. Wang et al. (2020) indicated that a subsurface speed maximum originating from the Kuroshio could modulate the baroclinic instability in the LS and thus result in mesoscale eddy variability there. Our previous study demonstrated that a low PV signal could impinge on the Kuroshio mainstream at 20° - 23°N accompanied by an AE, with a subsurface speed maximum and southwestward movement (Wang et al., 2022). Yu et al. (2015) demonstrated that the low PV signal of STMW can reach the LS and thus result in subsurface transport variation in the LS. These results indicate that the low PV signal occurring in the LS area might be trapped by AEs and can be traced to the STMW subduction region.
While previous studies have provided important information about water mass exchange across the LS and eddy activities in the LS area, research is still lacking on eddy-trapped low PV water exchange between the NP and SCS. Both the results of Yu et al. (2015) and Wang et al. (2020) indicated subsurface variation in the LS area, and the subsurface variation was correlated with stratification structure change, which would induce PV changes locally. Consequently, we wish to address the following questions: can low PV signals move across the LS? If so, how can these low PV signals reach the LS? What is the physical process by which the low PV signals intrude into the SCS through the LS? We show that the low PV signals are trapped by AEs moving to the LS and relayed by a newly formed AE intruding into the SCS. The remainder of the paper is organized as follows. The data and methods used in this paper are described in Section 2. Section 3 reveals that the low PV signals are trapped by AEs moving across the LS and then relayed by AEs west of the LS moving southwestward. Finally, we provide a summary and discussion in Section 4.
2 Materials and methods
2.1 Observational data
The accumulation of Argo profiles since the early 2000s provides a large number of undersurface temperature and salinity records from a typical depth of ~5 m to approximately 2000 m. Argo profiles were obtained from the China Argo Real‐Time Data Center. The World Ocean Atlas 2013 (WOA13) provides a set of 0.25° × 0.25° climatological fields of annually-composited, in situ temperature and salinity data at standard depth levels in the world ocean (http://apdrc.soest.hawaii.edu/). Daily sea surface height data during 2003-2017, with a horizontal resolution corresponding to a 1/4° latitude by 1/4° longitude grid, are obtained from the Copernicus Marine Environment Monitoring Service (CMEMS; http://marine.copernicus.eu/). Figure 1A presents the climatology distribution of the observed sea surface height (SSH) and the standard deviation of SSH in our study region.
Figure 1
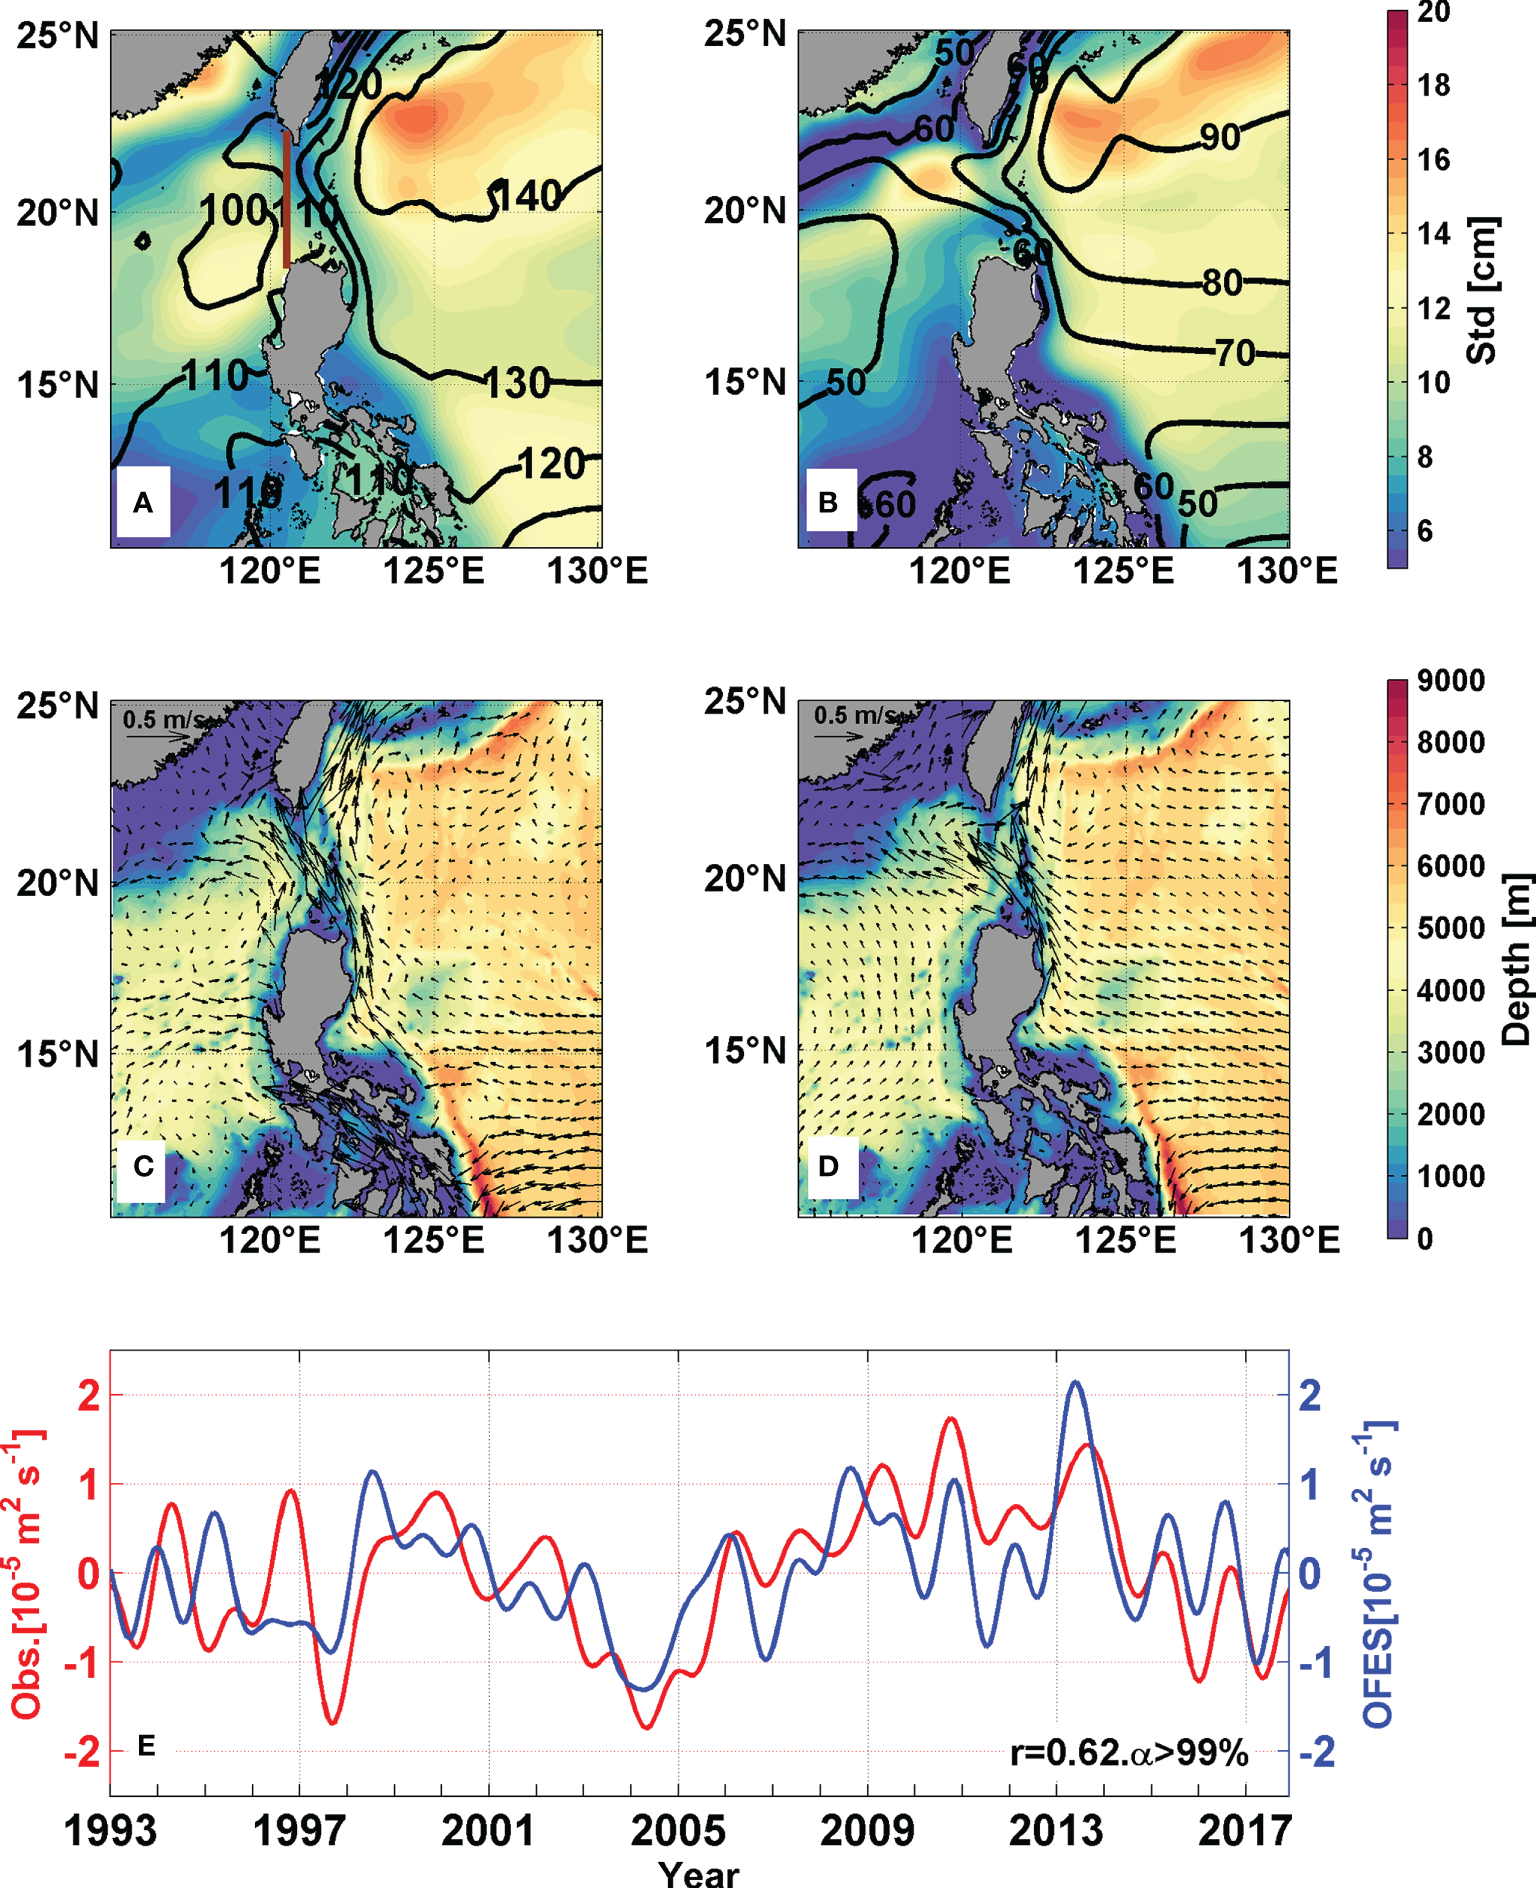
Standard deviation of SSH (shaded in cm) and SSH (contours in 10 cm intervals) calculated from (A) CMEMS and (B) OFES outputs, respectively. The climatology of the observed sea surface current (unit: m s-1) calculated with (C) satellite data from CMEMS and (D) OFES outputs. (E) Time series (13-month low-pass filter) of Luzon Strait transport (unit: 10-5m2s-1) in the upper 10 m layer from CMEMS (red line) and OFES (blue line) data. The dark red line in Figure 1A indicates the geostrophic location of the Luzon Strait at 120.5°E.
2.2 The OFES
The ocean general circulation model (OGCM) for the Earth Simulator (OFES) is based on Modular Ocean Model V.3 and has been substantially optimized for massively parallel computations on the Earth Simulator. The domain of the model extends from 75°S to 75°N, with a high horizontal resolution of 0.1°. In the vertical direction, there are 54 levels spanning from 5 to 6,065 m. The OFES, which is a non-assimilation model, was spun up using National Centers for Environmental Prediction and the National Center for Atmospheric Research (NCEP/NCAR) monthly mean atmospheric reanalysis fluxes and was then driven by daily mean NCEP/NCAR wind stresses and surface heat fluxes for the period from 1950 to 2010. Scale‐selective damping by a biharmonic operator was utilized for the horizontal mixing of momentum and tracers to suppress computational noise. The viscosity and diffusivity coefficients, varying proportionally to the cube of the zonal grid spacing, were -2.7 × 10¹⁰ m4· for momentum and -9 × 10⁹ m4 · s-1 for tracers at the equator. They varied proportionally with the cube of the zonal grid spacing. The vertical viscosity and diffusivity were calculated using the K‐profile parameterization, which adopted a double diffusion parameterization (Large et al., 1994). More details of the model and the simulation can be found in Sasaki et al. (2008). The 3‐day model outputs from 2003 to 2017 were downloaded from the Asia Pacific Data Research Center (APDRC) for this study.
2.3 Model validation
Many previous studies demonstrated that the OFES reproduced most of the observed phenomena in the NP and certified the capability of the OFES to simulate eddy activities in the NP (Taguchi et al., 2010; Nonaka et al., 2012; Yu and Qu, 2013; Xu et al., 2014; Yu et al., 2015; Wang et al., 2022). Figures 1A, B depicts the standard deviation of the SSH and the climatological SSH from the observations and OFES. The variability of the eddies was assessed by the standard deviation of the SSH, and the geostrophic relation directly related the sea surface geostrophic current to the horizonal gradient of the SSH. Compared to the observations, the western boundary current and the standard deviation of the SSH around the LS were effectively reproduced in the OFES. Although the eddy activity in the OFES was stronger than that observed in the SCS in this study, the OFES pattern was comparable to that in the observation southwest of Taiwan Island, where eddy activity was strong. Figures 1C, D depict the mean sea surface current calculated with the observations and OFES datasets. The meander structure in the LS area was obvious in the observed result with the low-resolution dataset, while the meander was well simulated with the high-resolution OFES outputs. We also compared the zonal geostrophic velocity distributions from the OFES with the WOA13 along sections to the west (118°–121°E) and east (122°–124°E) of the LS (not shown). Although the simulated velocity was somewhat higher than the observed velocity, patterns of the zonal geostrophic velocity on both sides of the LS were well simulated by the OFES.
Since the simulated velocity was slightly higher than the observed velocity, we also compared the Luzon Strait transport (LST) at the surface from the OFES with the CMEMS data. The zonal geostrophic velocity was calculated from SSH as , where is the SSH. The LST in the surface layer was calculated from , where ln (ls) denotes the northernmost (southernmost) latitude of the LS and is defined as 10 m. Figure 1E shows the 13-month, low-pass-filtered LST anomalies from the CMEMS and OFES data, with negative anomalies representing the LST increase. The simulated LST significantly correlated with the observed LST; the correlation coefficient reached 0.62 with a confidence level of 95%. Negative LST anomalies were obvious during the 97/98, 09/10 and 15/16 El Niño events. Generally, the simulated variation trends were consistent with observed trends, with decreasing trends during the periods of 1999-2004 and 2013-2017 and increasing trends during 2005-2013. In addition, the standard deviation of the LST of the OFES () was comparable to that of the observed ().
Since this study focused on the transport of low PV signals in the subsurface layer, the climatological mean PV distribution in the STMW core layer was used to assess the OFES results (Figures 2A, B). Our previous study demonstrated that mode water mostly appeared in the isopycnal layer in both the observations and the OFES results (Wang et al., 2022). Consequently, our study focused on the movement of low PV signals in this isopycnal layer (hereafter, the core layer) in the remainder of this paper.
Figure 2
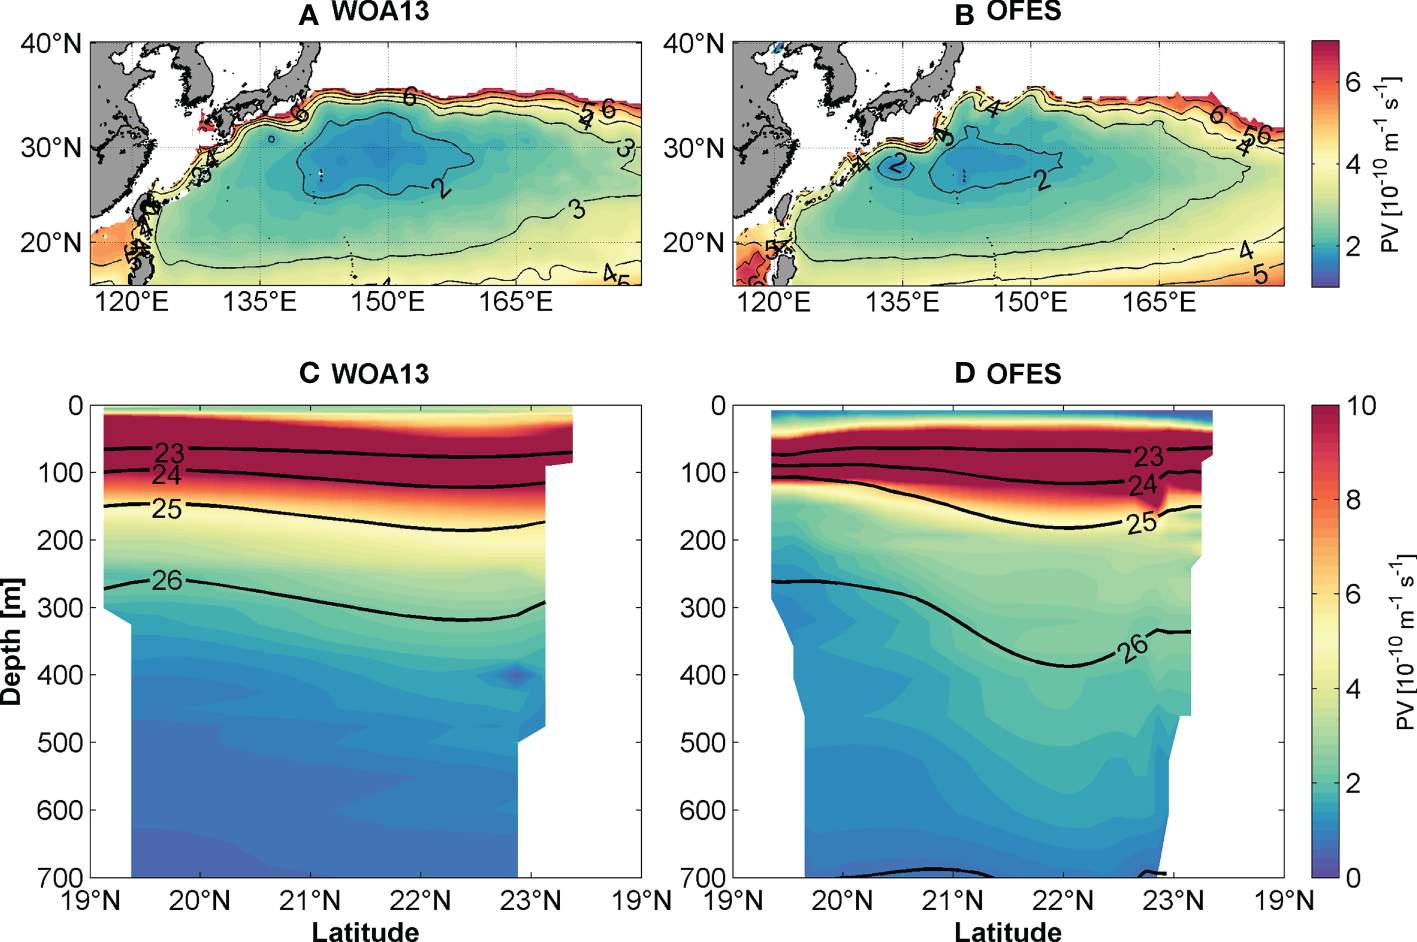
Climatology of the PV on the STMW core layer calculated with (A) WOA13 and (B) OFES data and along the 120.5°E section calculated with (C) WOA13 and (D) OFES data (contour: climatology of potential density with 1 kg m-3 interval).
The PV is defined as follows:
where z has negative values below the sea surface, f is the Coriolis parameter, and is the water density (1024 kg m-3). The PV consists of terms for the planetary vorticity () and relative vorticity. According to eq. (1), weak (strong) vertical stratification favors a strong (weak) low PV signal. In this study, we take only the planetary vorticity into consideration to avoid the effect of background currents. Due to the deep convection that results from strong winter cooling, the mixed layer is deepest in the winter, and thus, there is a thicker low PV layer in late winter (March).
Figure 2A shows the climatology of the PV distribution from the WOA13 on the STMW core layer. The lowest PV appeared west of 160°E and south of the Kuroshio Extension in Figure 2A. The zonal gradient of PV between the SCS and NP is obvious due to the steep westward shoaling of the thermocline in the LS (Lu and Liu, 2013). The PV distribution is well reproduced by the OFES in Figure 2B. It is also important to focus our attention on whether the OFES could simulate the PV distribution across the LS. Figures 2C, D exhibit the potential density and PV distribution along the 120.5°E section, as calculated with the WOA13 and OFES data, respectively. Although the simulated depth of the 26.0 isopycnal is slightly deeper, the depth of the isopycnal in the OFES is generally similar to the observed result. The PV from both the observations and OFES are lower under the 25.0 isopycnal, above (below) which stratification is relatively strong (weak). Although there were some discrepancies between the vertical distributions of the observed and OFES PV results, the meridional mean PV derived from the WOA13 and OFES are similar, especially in the subsurface layer where low PV water exists.
The observed result indicated that the mode water can move to the LS, and this process is well simulated with the OFES outputs. Figures 3A, B present the low PV signal distribution in the core layer between 19°-23°N from 2003 to 2017 based on the Argo profiles and OFES outputs, respectively. There are a total of 3279 Argo profiles (black dots), 803 of which captured low PV water (red dots) in 115°-125°E, 19°-23°N, as shown in Figure 3A, from 2003 to 2017. An Argo profile with a low PV signal in the STMW layer (25.0 - 25.5 isopycnal layer) is marked as a red dot in Figure 3A. Figure 3B shows the meridional (19°–23°N) averaged PV distribution in the STMW layer, with low PV signals marked as black dots. Both the observation and OFES results show that there are obvious low PV signals intruding into the SCS, especially during the two periods of 2008-2009 and 2014-2016, and the low PV signals can travel a long distance in the SCS. We also found an Argo float (ID: 2901502) deployed east of the Philippine Islands in Sept. 2011 that captured a low PV signal east of the LS and then moved across the strait (Figure 4A). We display only the trajectory from 20 Sept. 2011 to 16 Apr. 2016. The measurements after 16 Apr. 2016 were mostly missing, although this Argo float traveled a great distance in the SCS until 1 Jan. 2017.
Figure 3
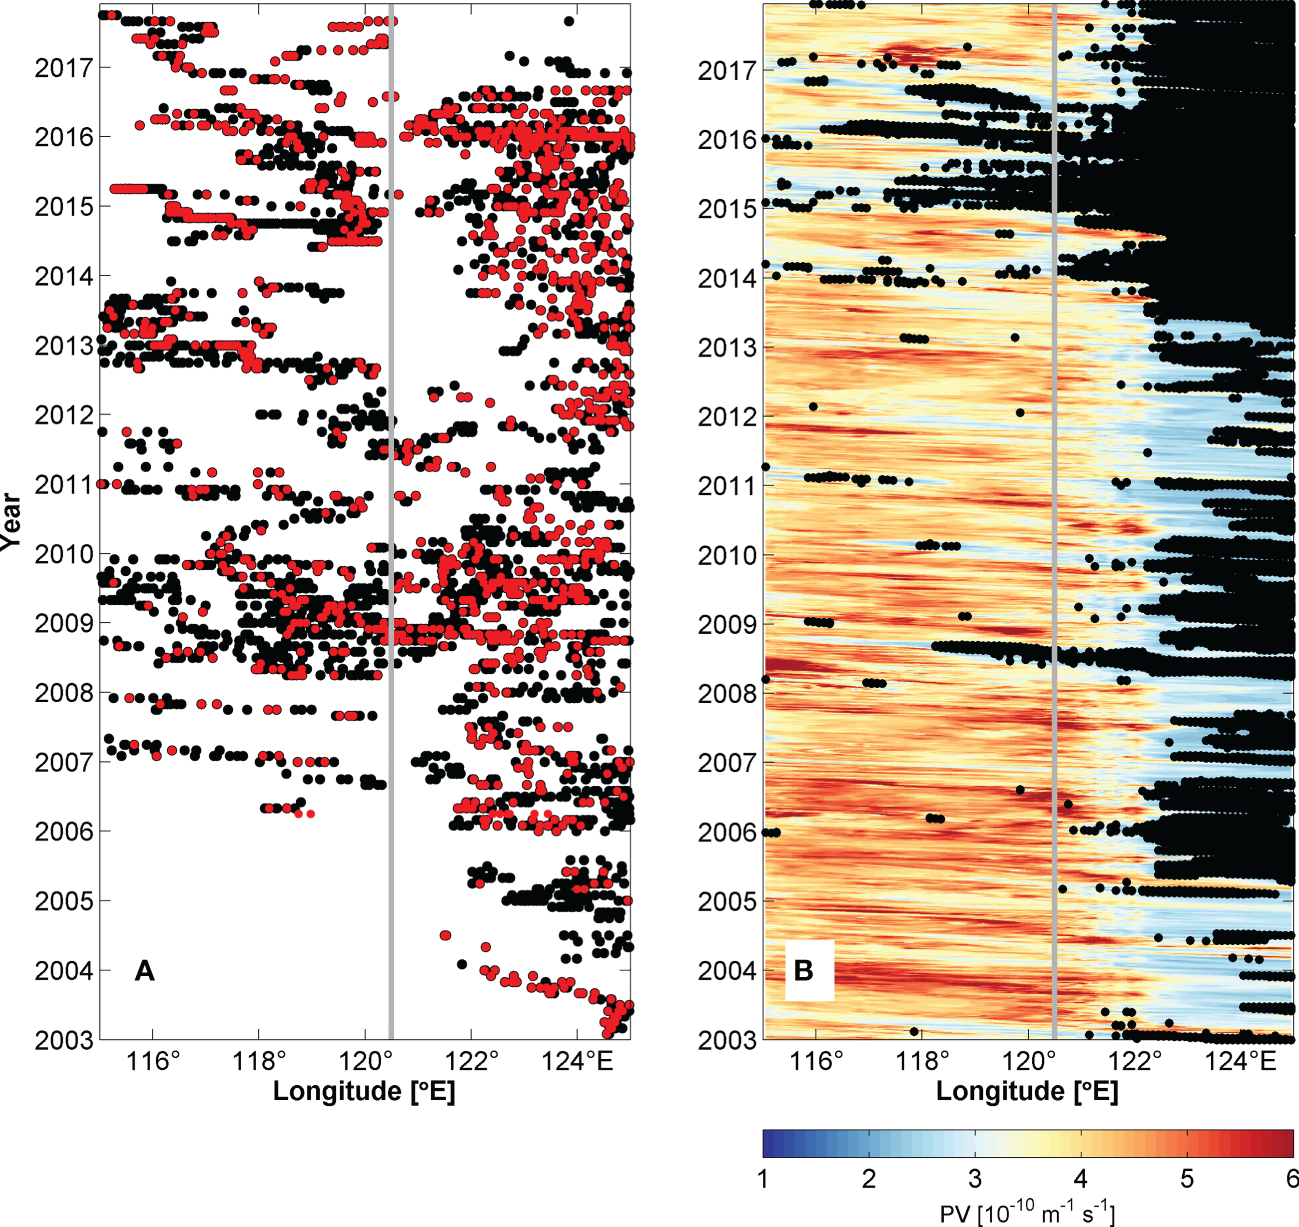
Time–longitude plots averaged over 19°–23°N of (A) Argo profile distribution (black dots) on both sides of the Luzon Strait and (B) OFES PV distribution averaged within the STMW layer. The red (black) dots in Figure 2A (Figure 2B) indicate the occurrence of a low PV signal () in the STMW core layer. There are a total of 3279 Argo profiles (black dots) with 2840 (red dots) capturing low PV signals in Figure 2A. The gray lines indicate the location of the LS at 120.5°E.
Figure 4
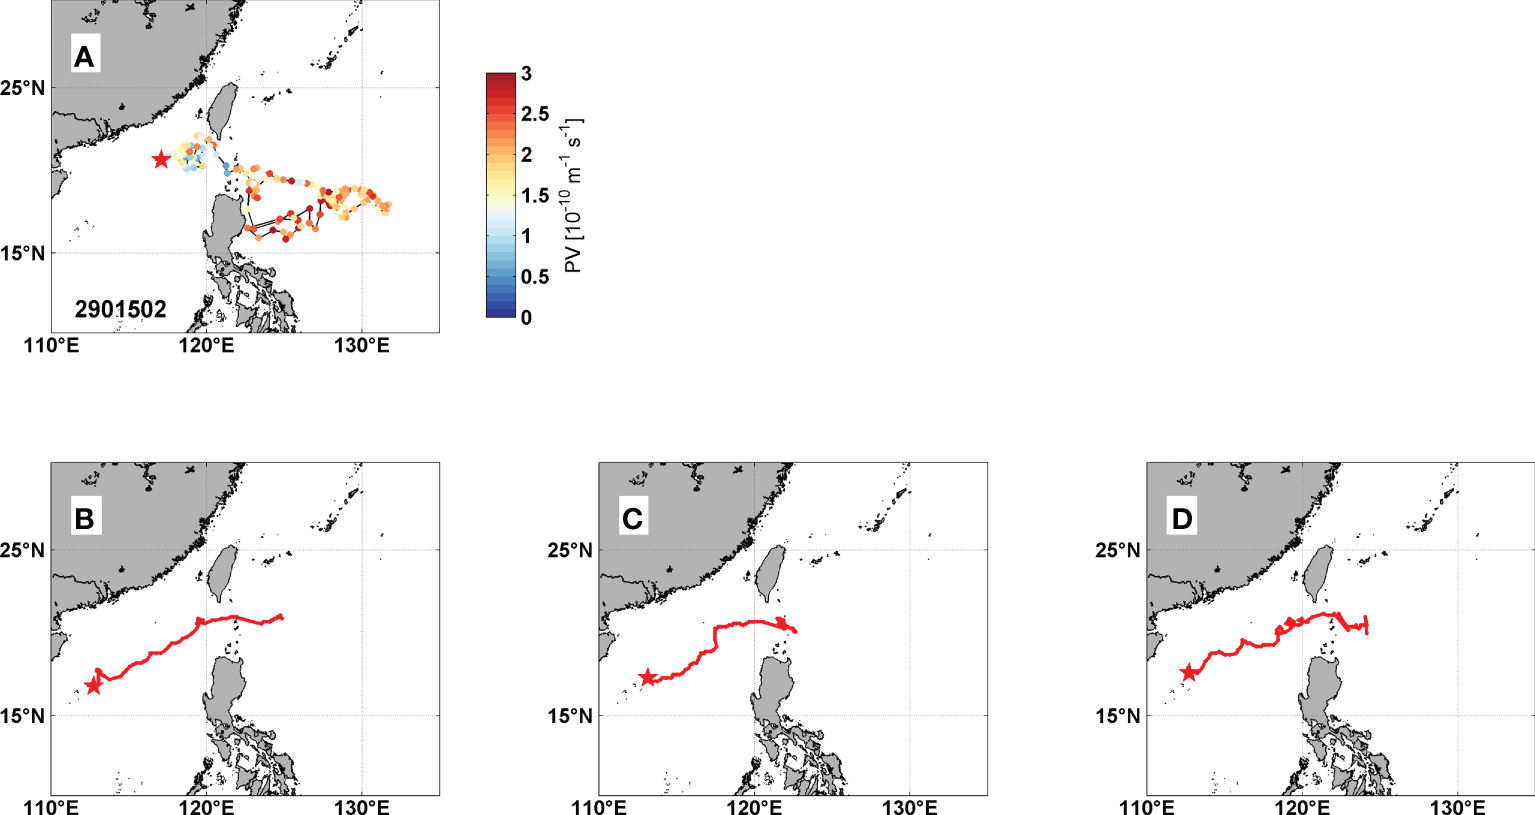
Trajectory of (A) Argo float number 2901502 from 20 Sept. 2011 to 16 Apr. 2016 (In color, the PV of the STMW core layer). And trajectories of OFES low PV signals after moving across the Luzon Strait in the (B) 2008 case from 3 Aug. 2008 to 116 Dec. 2008, (C) 2015 case from 6 Jan. 2016 to 10 Jun. 2016 and (D) 2016 case from 23 Apr. 2016 to 12 Jan. 2017. The red stars indicate the terminal points of the trajectories.
Although the low PV signal from the model is not as strong as that from the Argo profiles during 2008-2009, the OFES could well simulate the phenomenon that low PV signals move across the LS. According to the model validation above, the OFES could also reproduce the thermal and dynamic features in the NP well. Based on all the comparisons above, we conclude that the OFES model was suitable for this study.
3 Results
As shown in Figures 3, 4A, there is a possibility for the low PV water to move across the LS, especially during the 2008-2009 and 2014-2016 periods. Consequently, we selected three cases during these two periods to detect the low PV water intruding process with the OFES outputs. In the first case, a low PV signal reached and began moving across the LS in June 2008 and thus is called the 2008 case throughout the rest of this paper. The low PV signal in the second case, called the 2015 case below, propagated to the LS in November 2015. Finally, in the 2016 case, low PV water impinged on the LS in May 2016.
Figures 4B–D illustrate the trajectories of the low PV signal movement after moving across the LS, calculated with the OFES outputs, in the 2008, 2015 and 2016 cases. All three cases indicate that the low PV signal can not only intrude into the SCS but also travel a long distance in the SCS southwestward. We thus use OFES datasets to study how the low PV signal moves across the LS and how it can be transported such a long distance.
3.1 The process of low PV signals intruding into the SCS
The process of the low PV signal movement in the STMW core layer in the 2008 case is shown in Figure 5. According to the distribution of the velocity vector, the low PV water is trapped by an AE when reaching the LS. Figure 6 presents the low PV water movement along the 20°N section, and the isopycnal structure also indicates that the low PV signal is carried by an AE, called AE1 hereafter, east of 122°E. Wang et al. (2022) also demonstrated that an AE trapped the low PV water and carried it southwestward to the Kuroshio mainstream. In this study, the low PV water not only impinged on the Kuroshio but also began to be transported to the SCS from 25 Jun. 2008. In Figure 5, there was also anticyclonic flow (118°–122°E) west of AE1 on 7 July. The anticyclonic structure gradually intensified until 5 September and finally formed another AE, called AE2 below.
Figure 5
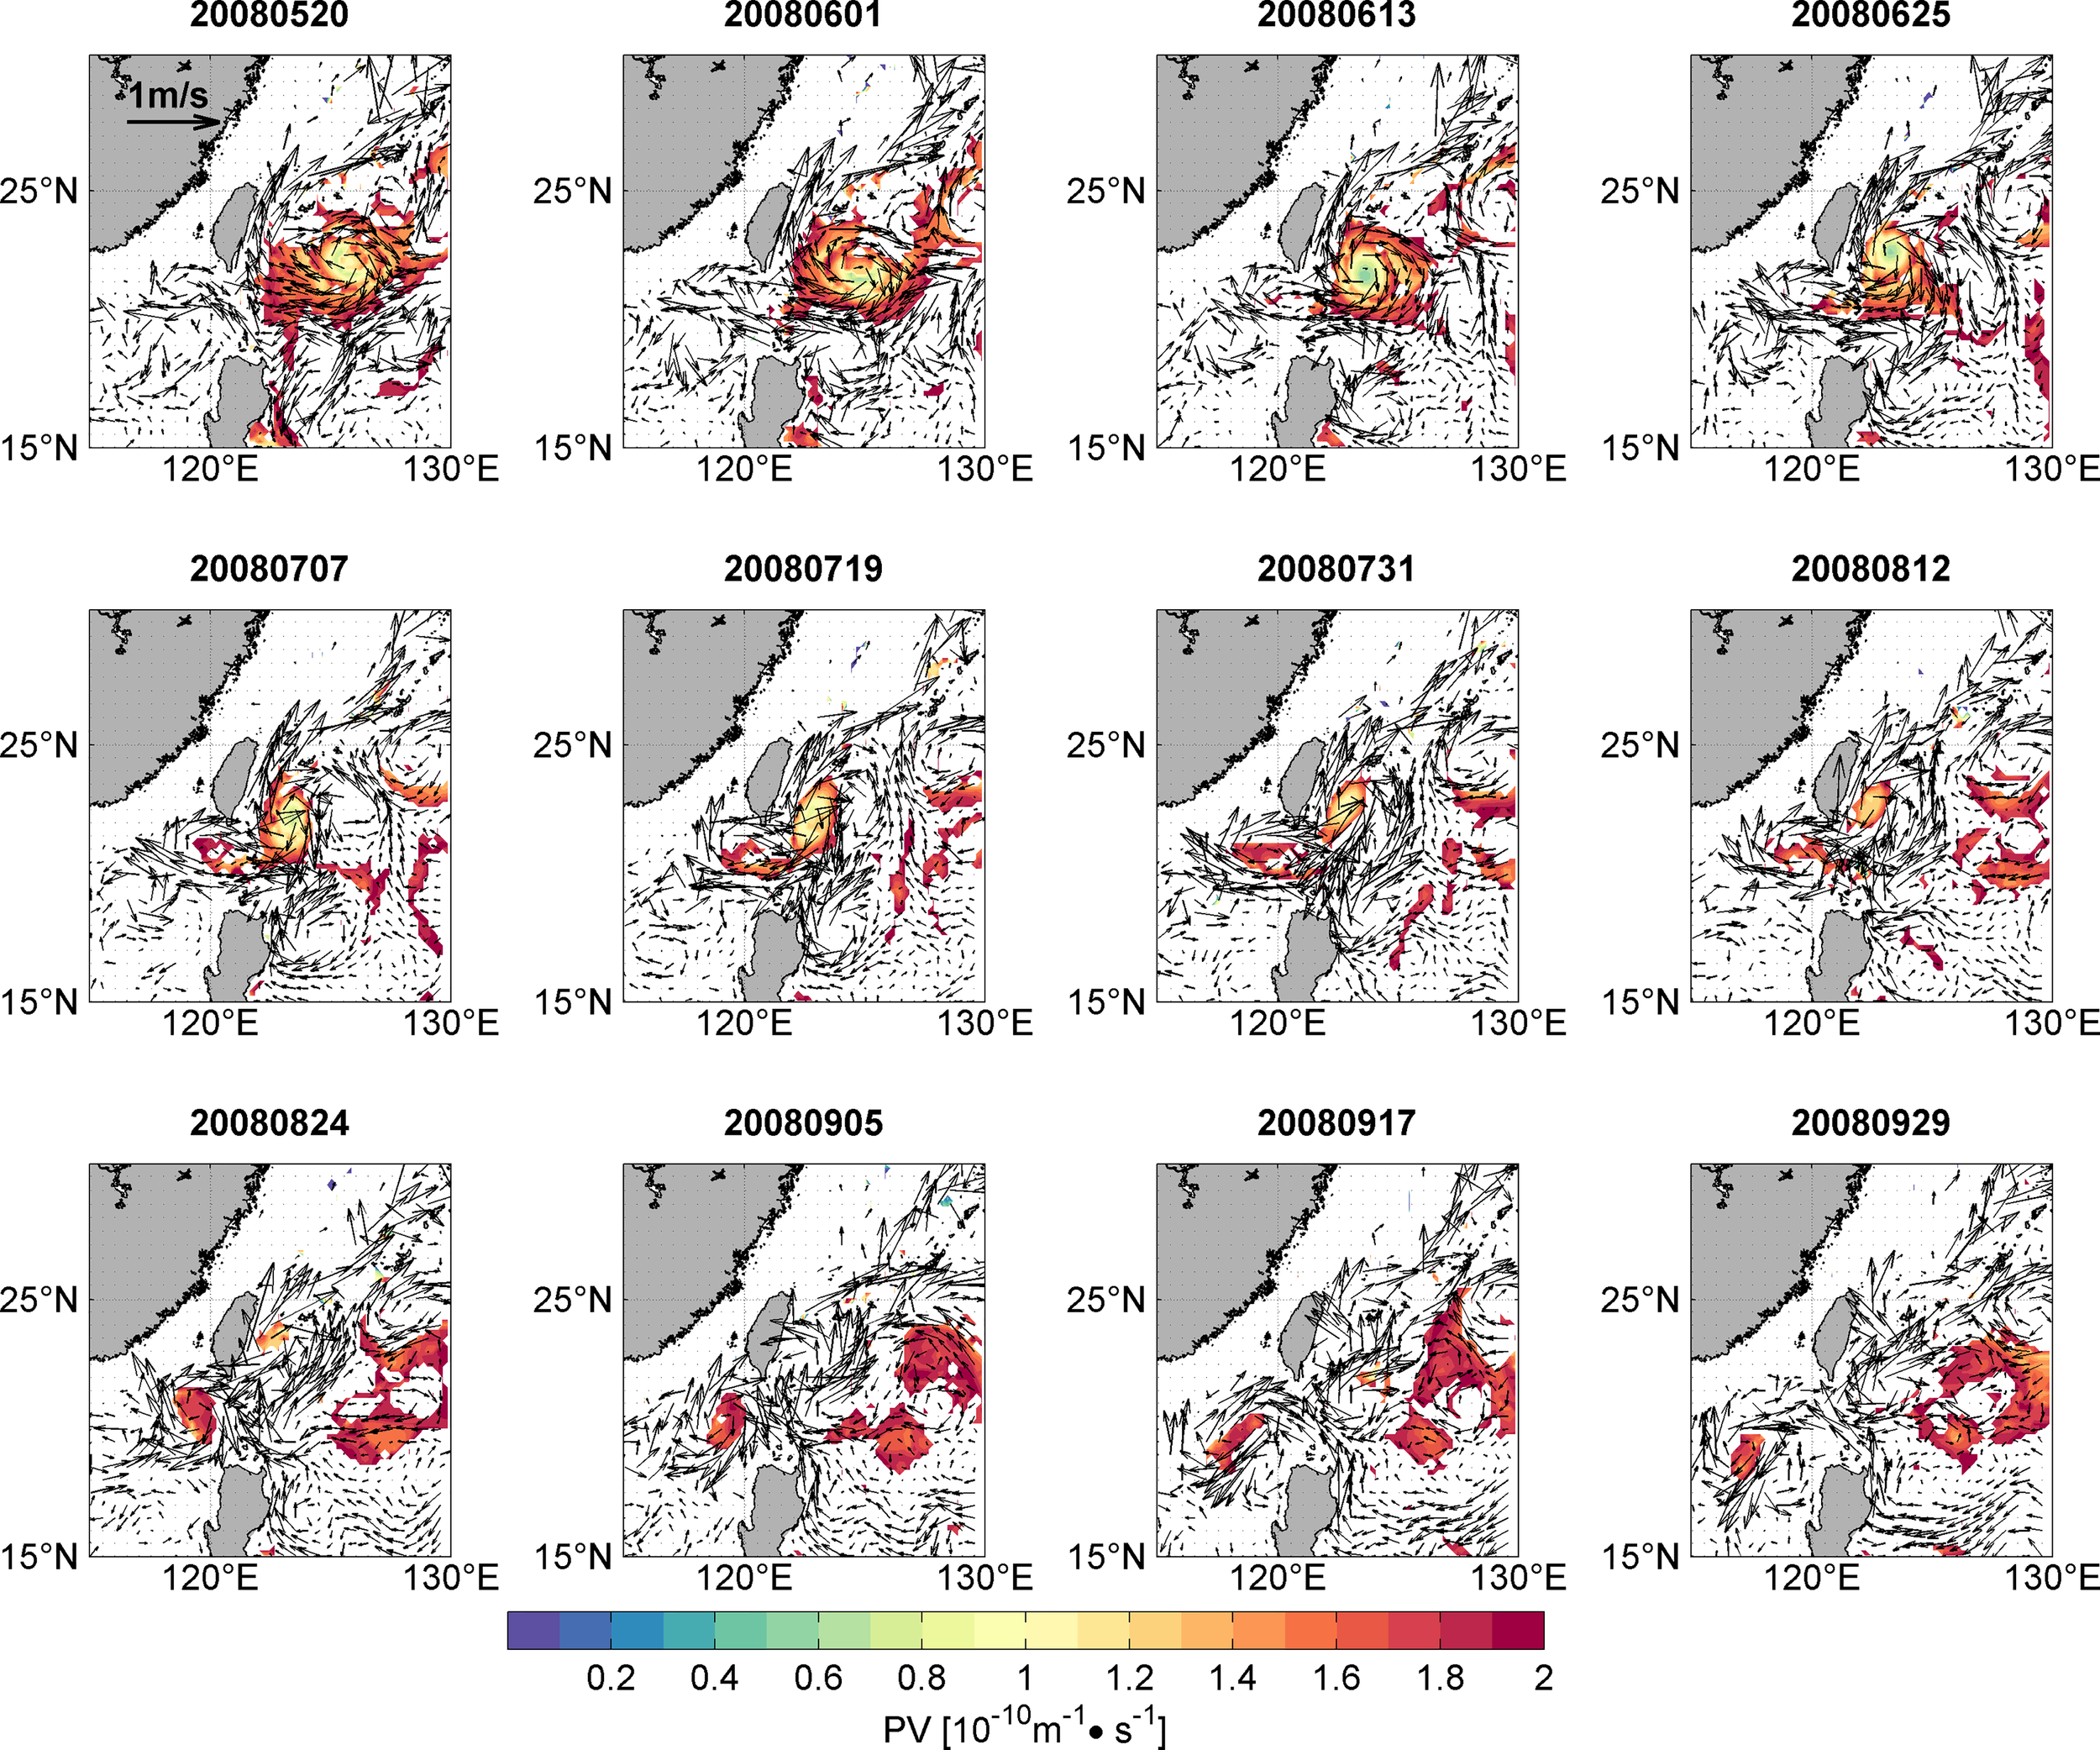
The process of low PV signal (colors, unit: ) relayed by AEs moving across the Luzon Strait in the 25.3 isopycnal layer in the 2008 case. Vectors represent the current (unit: ) in the 25.3 isopycnal layer.
Figure 6
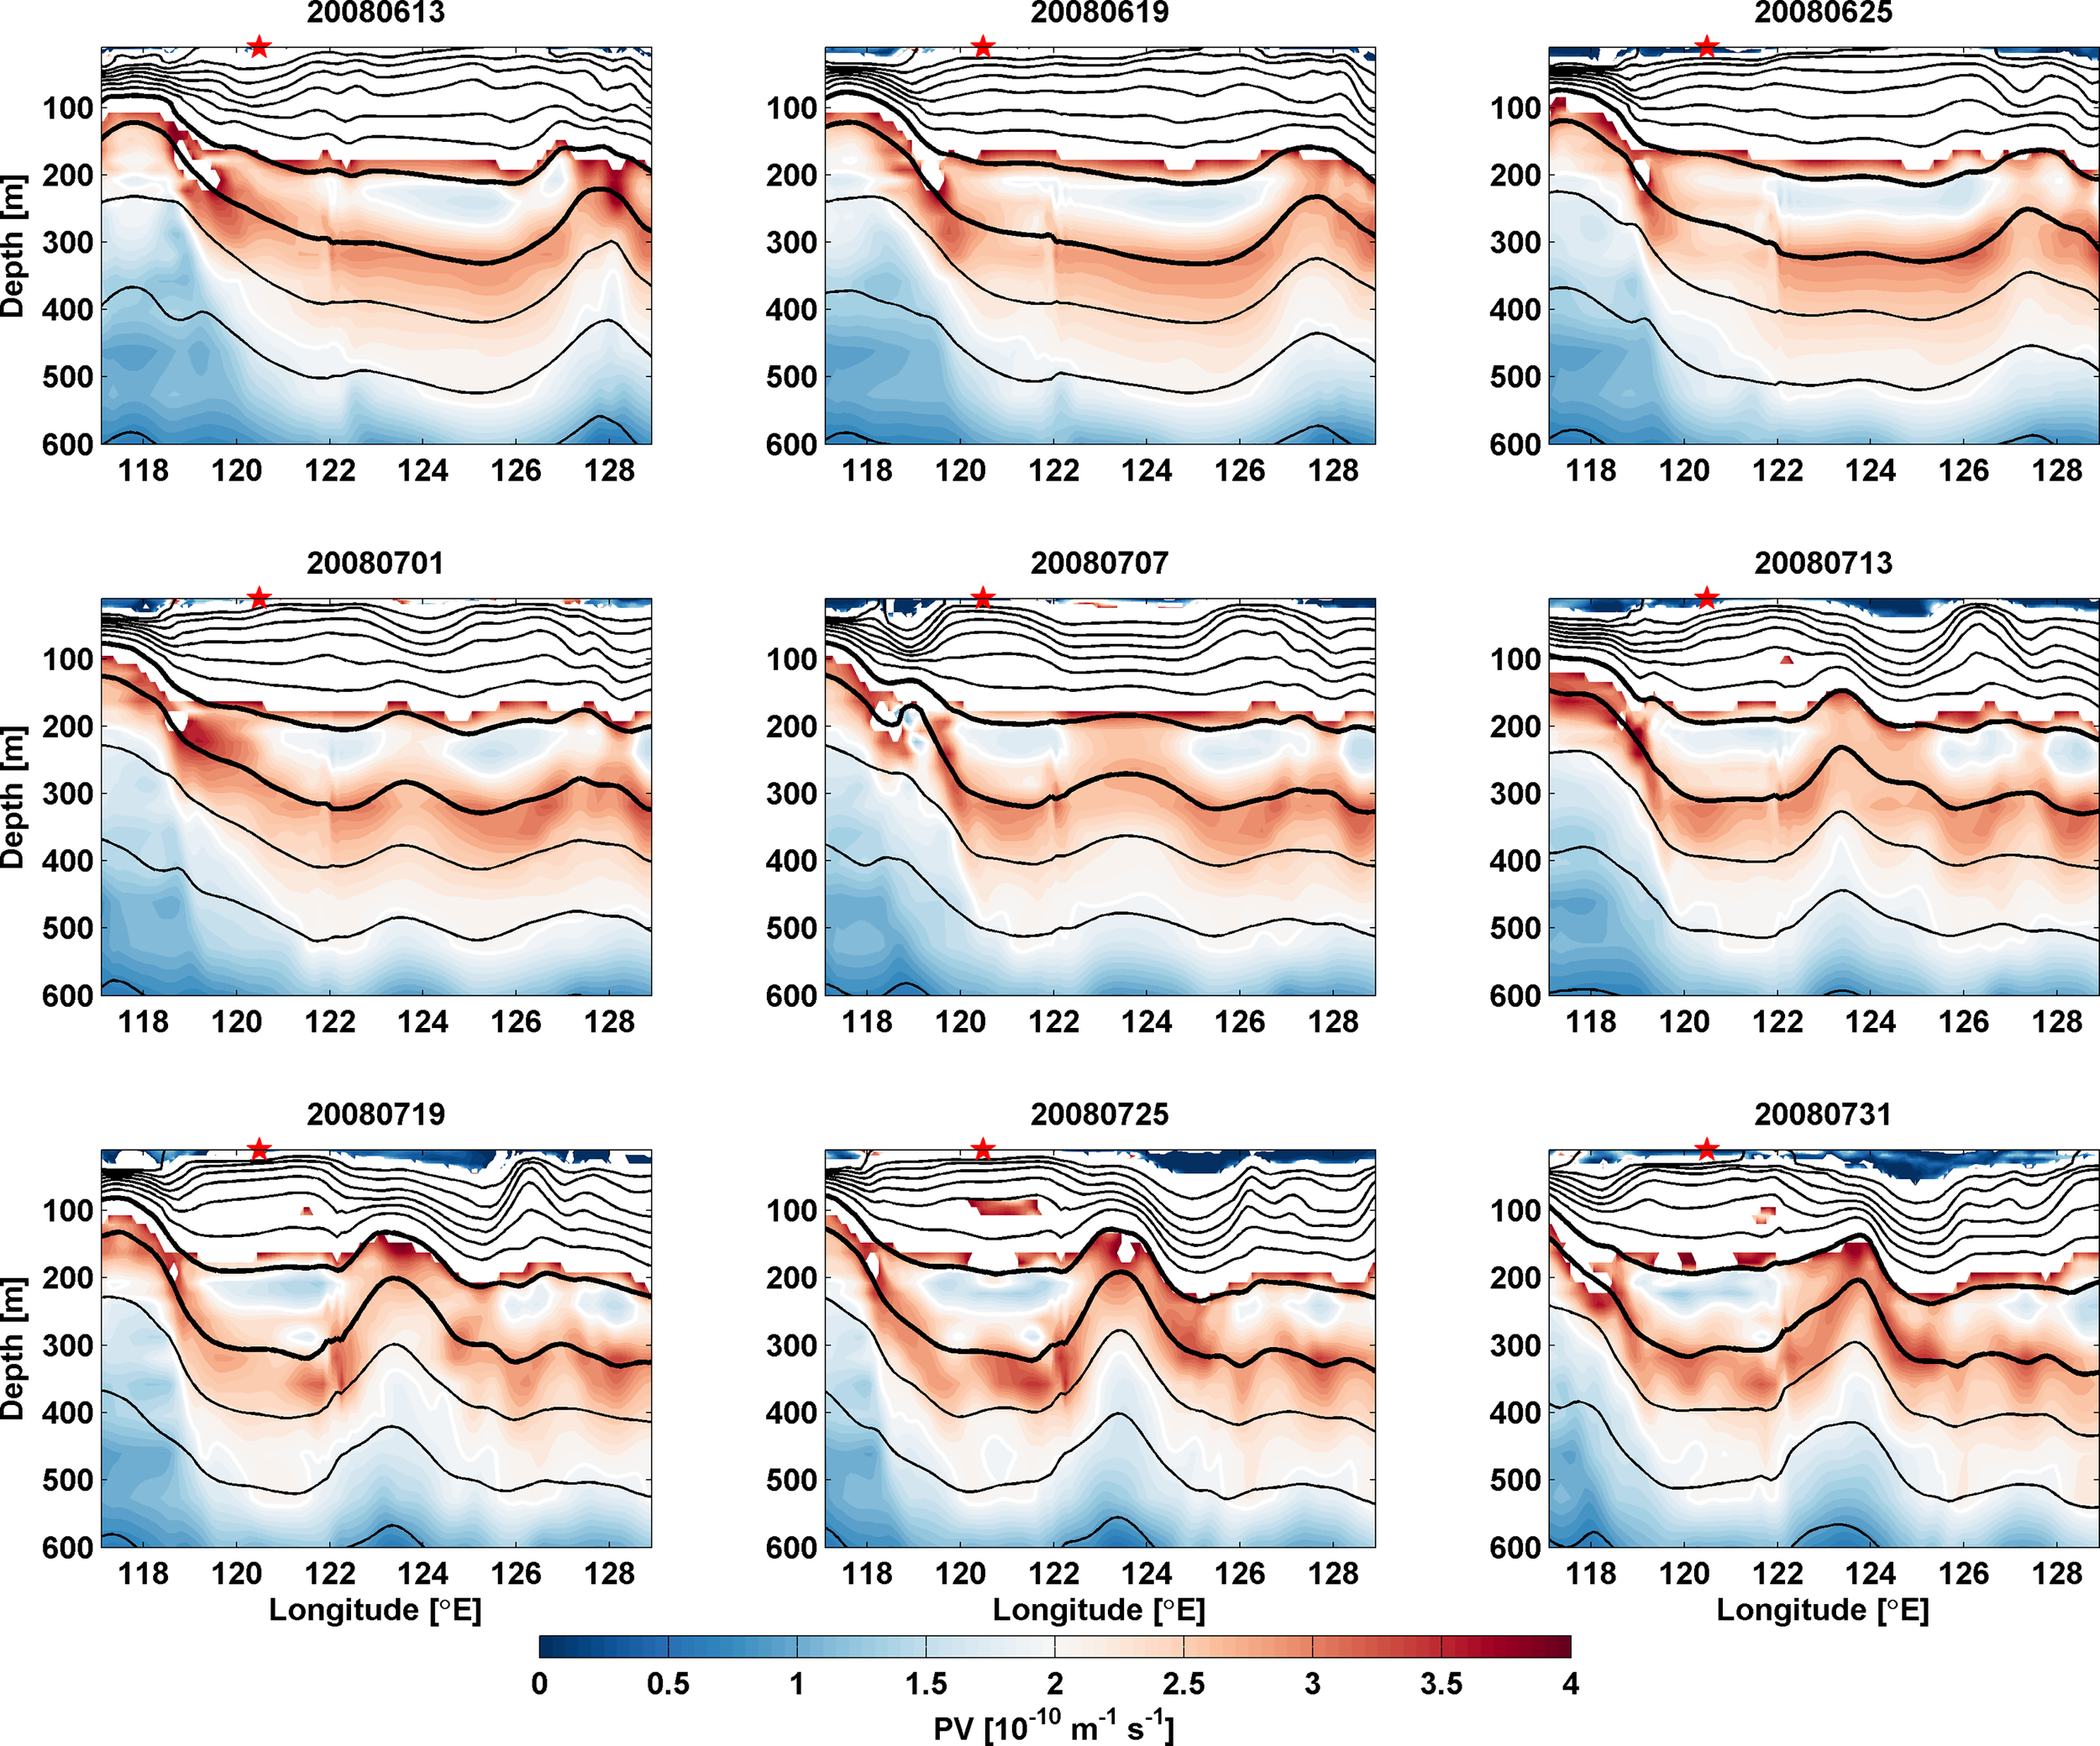
The process of an AE forming west of the Luzon Strait and then isolating a low PV signal (colors, unit: ) from the AE along 21°N to the east in the 2008 case. The white lines denote the PV contour. The thick black lines denote the and isopycnals.
Figure 5 exhibits the evolution of AE2 west of AE1. Along with the development of AE2, some low PV water moved westward and gradually separated from the strong low PV signal in AE1. The low PV water seemed to be absorbed by AE2. In this 2008 case, vertical stratification was weak west of AE1 since the anticyclonic flow favored downwelling. The low PV signal was therefore transferred along the STMW layer (layers between the thick black lines in Figure 6) since the weak stratification, corresponding to a weak vertical gradient of potential density, was conducive to maintaining the low PV signal. The low PV water in turn promoted the formation of AE2. As shown in Figure 6, the eddy structure of AE2 was intensified after some low PV water was isolated from AE1, in accordance with previous studies that suggested that low PV water favors the formation of AEs with cores typically located in the subsurface layer (Zhang et al., 2014; McGillicuddy, 2015). This process of low PV water intrusion is presented as a relay of low PV water from AE1 to AE2.
The relay process in the 2015 case was similar to that in the 2008 case. Figure 7 shows a large, low PV signal moving to the LS from 19 Nov. 2015 with an AE (AE1). Another AE (AE2) gradually formed on 1 Dec. 2015 and began absorbing low PV water from AE1. Figure 8 exhibits the process of low PV signal movement and division in the STMW layer. According to Figures 7, 8, the eddy structure of AE2 became clearer from 18 Jan. 2016 and thus separated from AE1. After AE2 was isolated from AE1, it transported low PV water west and disappeared near 113°E (Figure 4C). The rest of the low PV water, trapped by AE1, moved along the coastline of Taiwan Island and gradually dissipated.
Figure 7
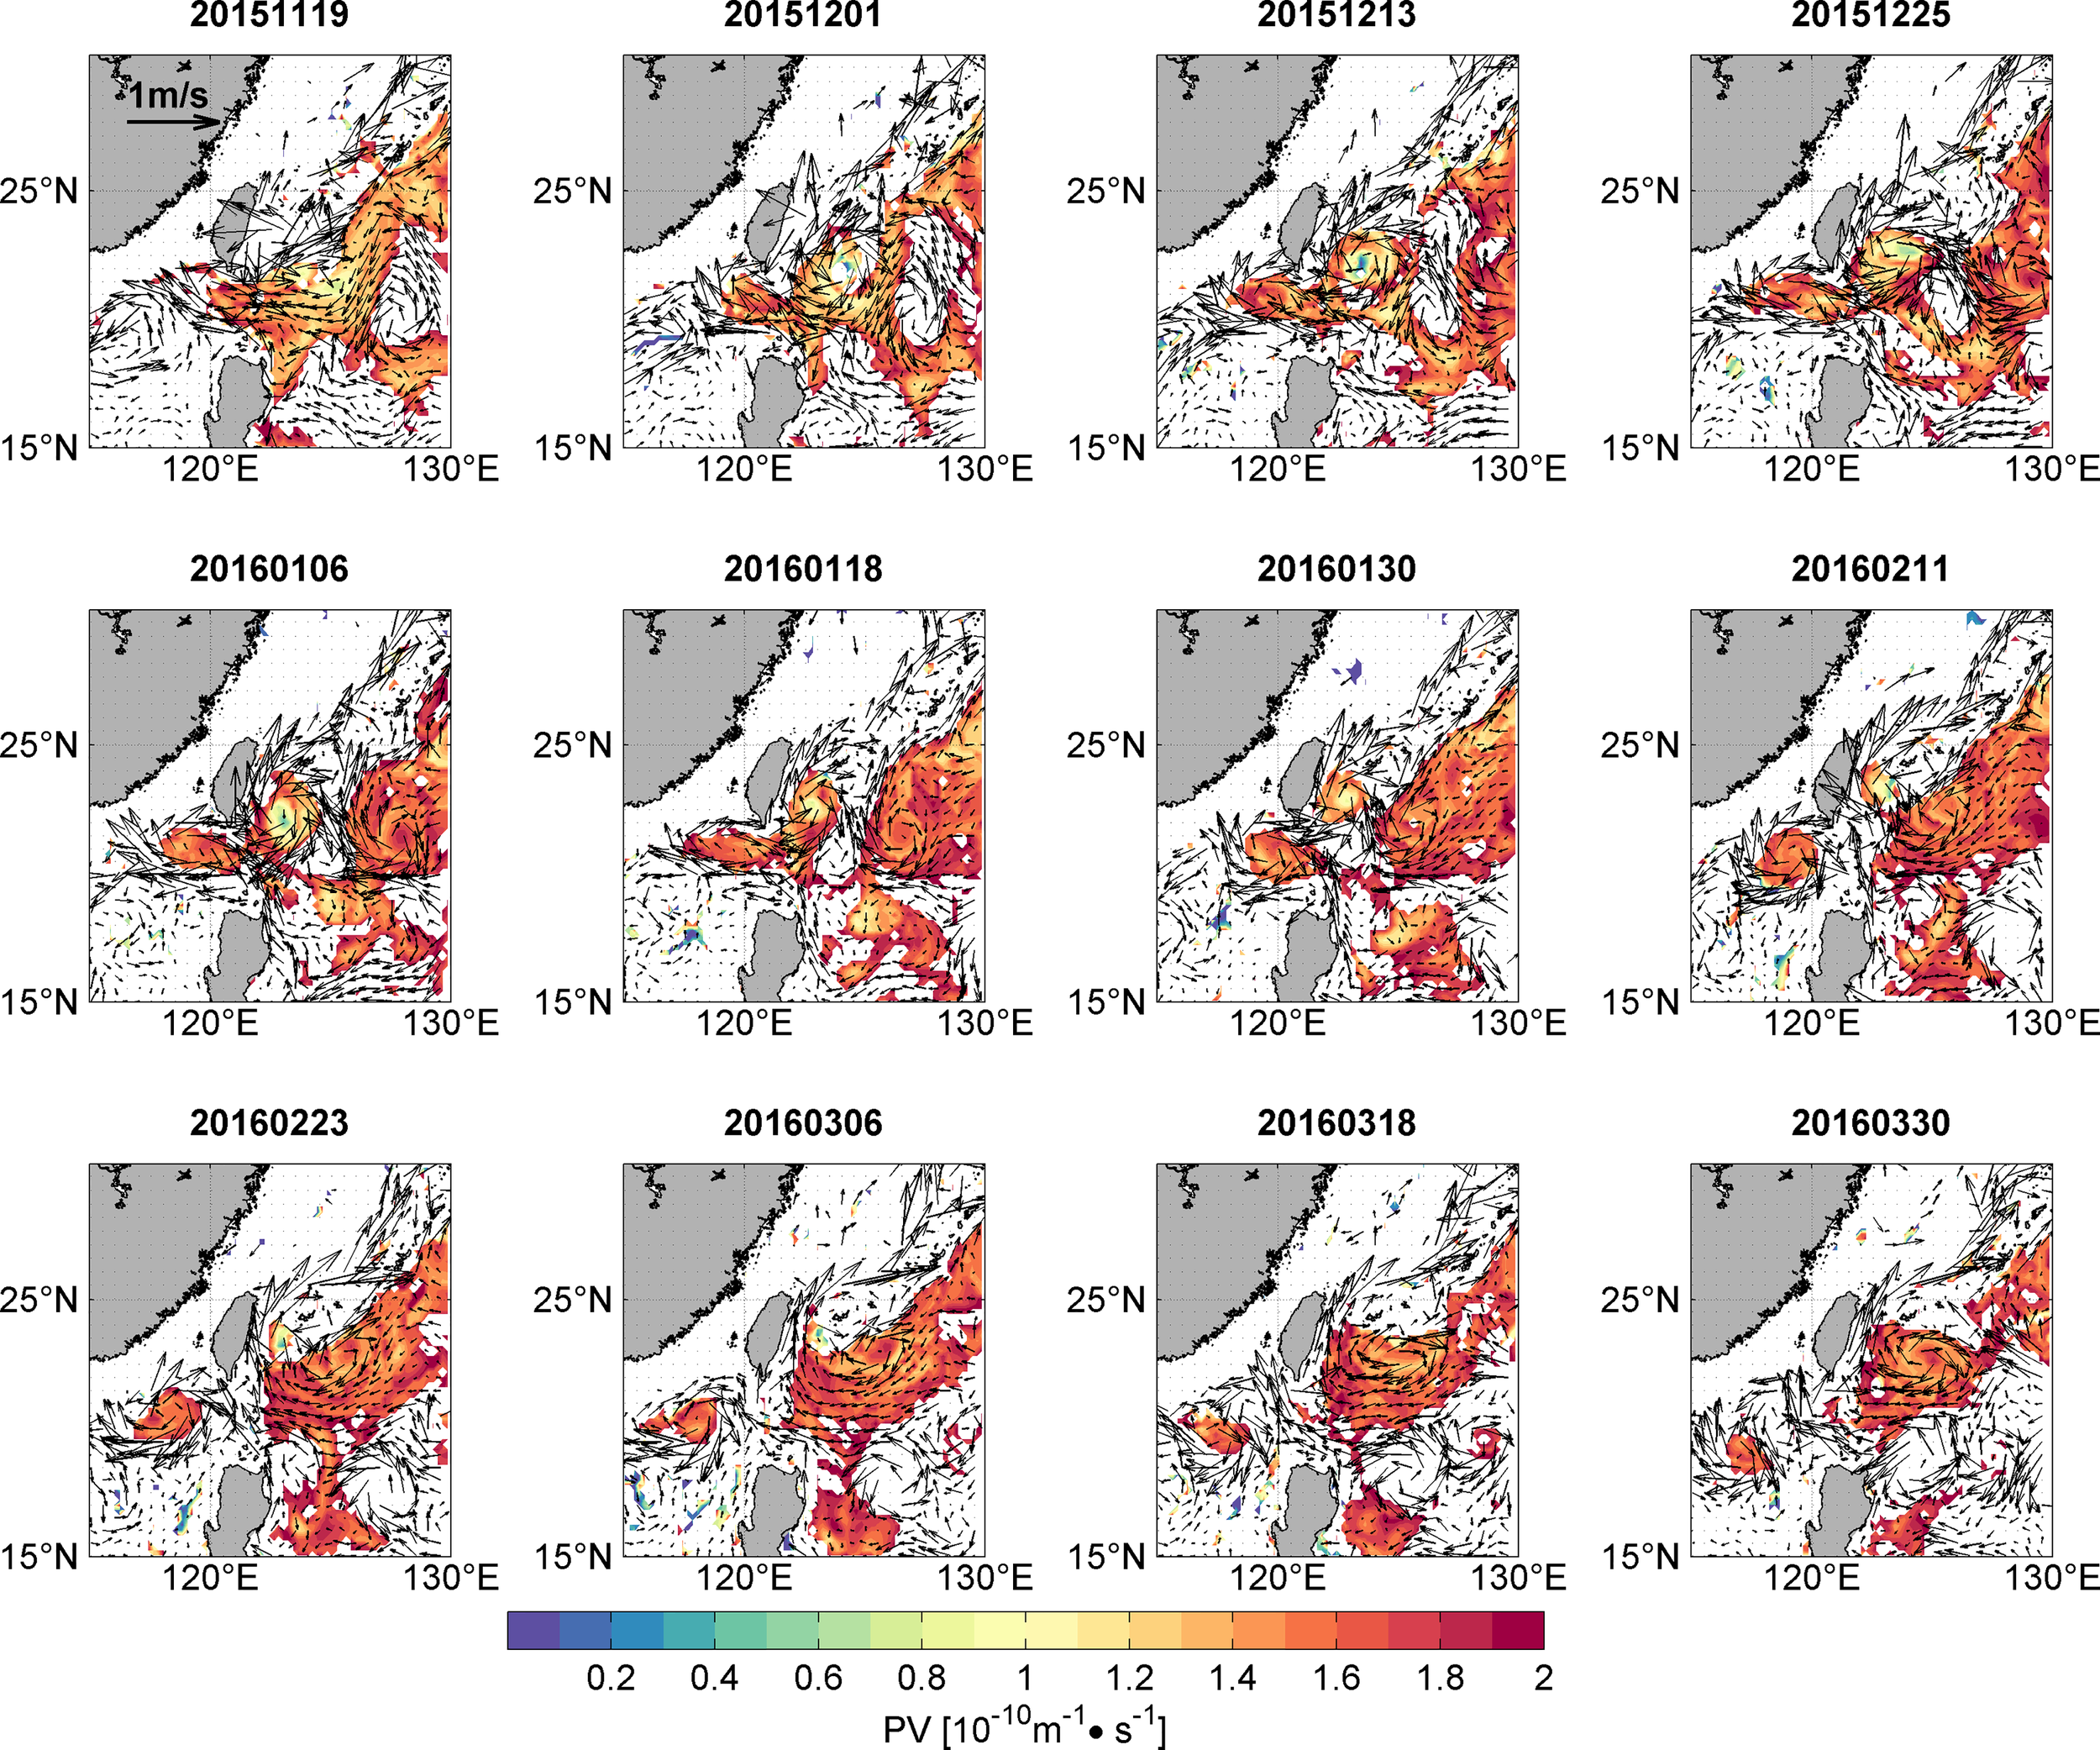
Same as Figure 5 but for the 2015 case.
Figure 8
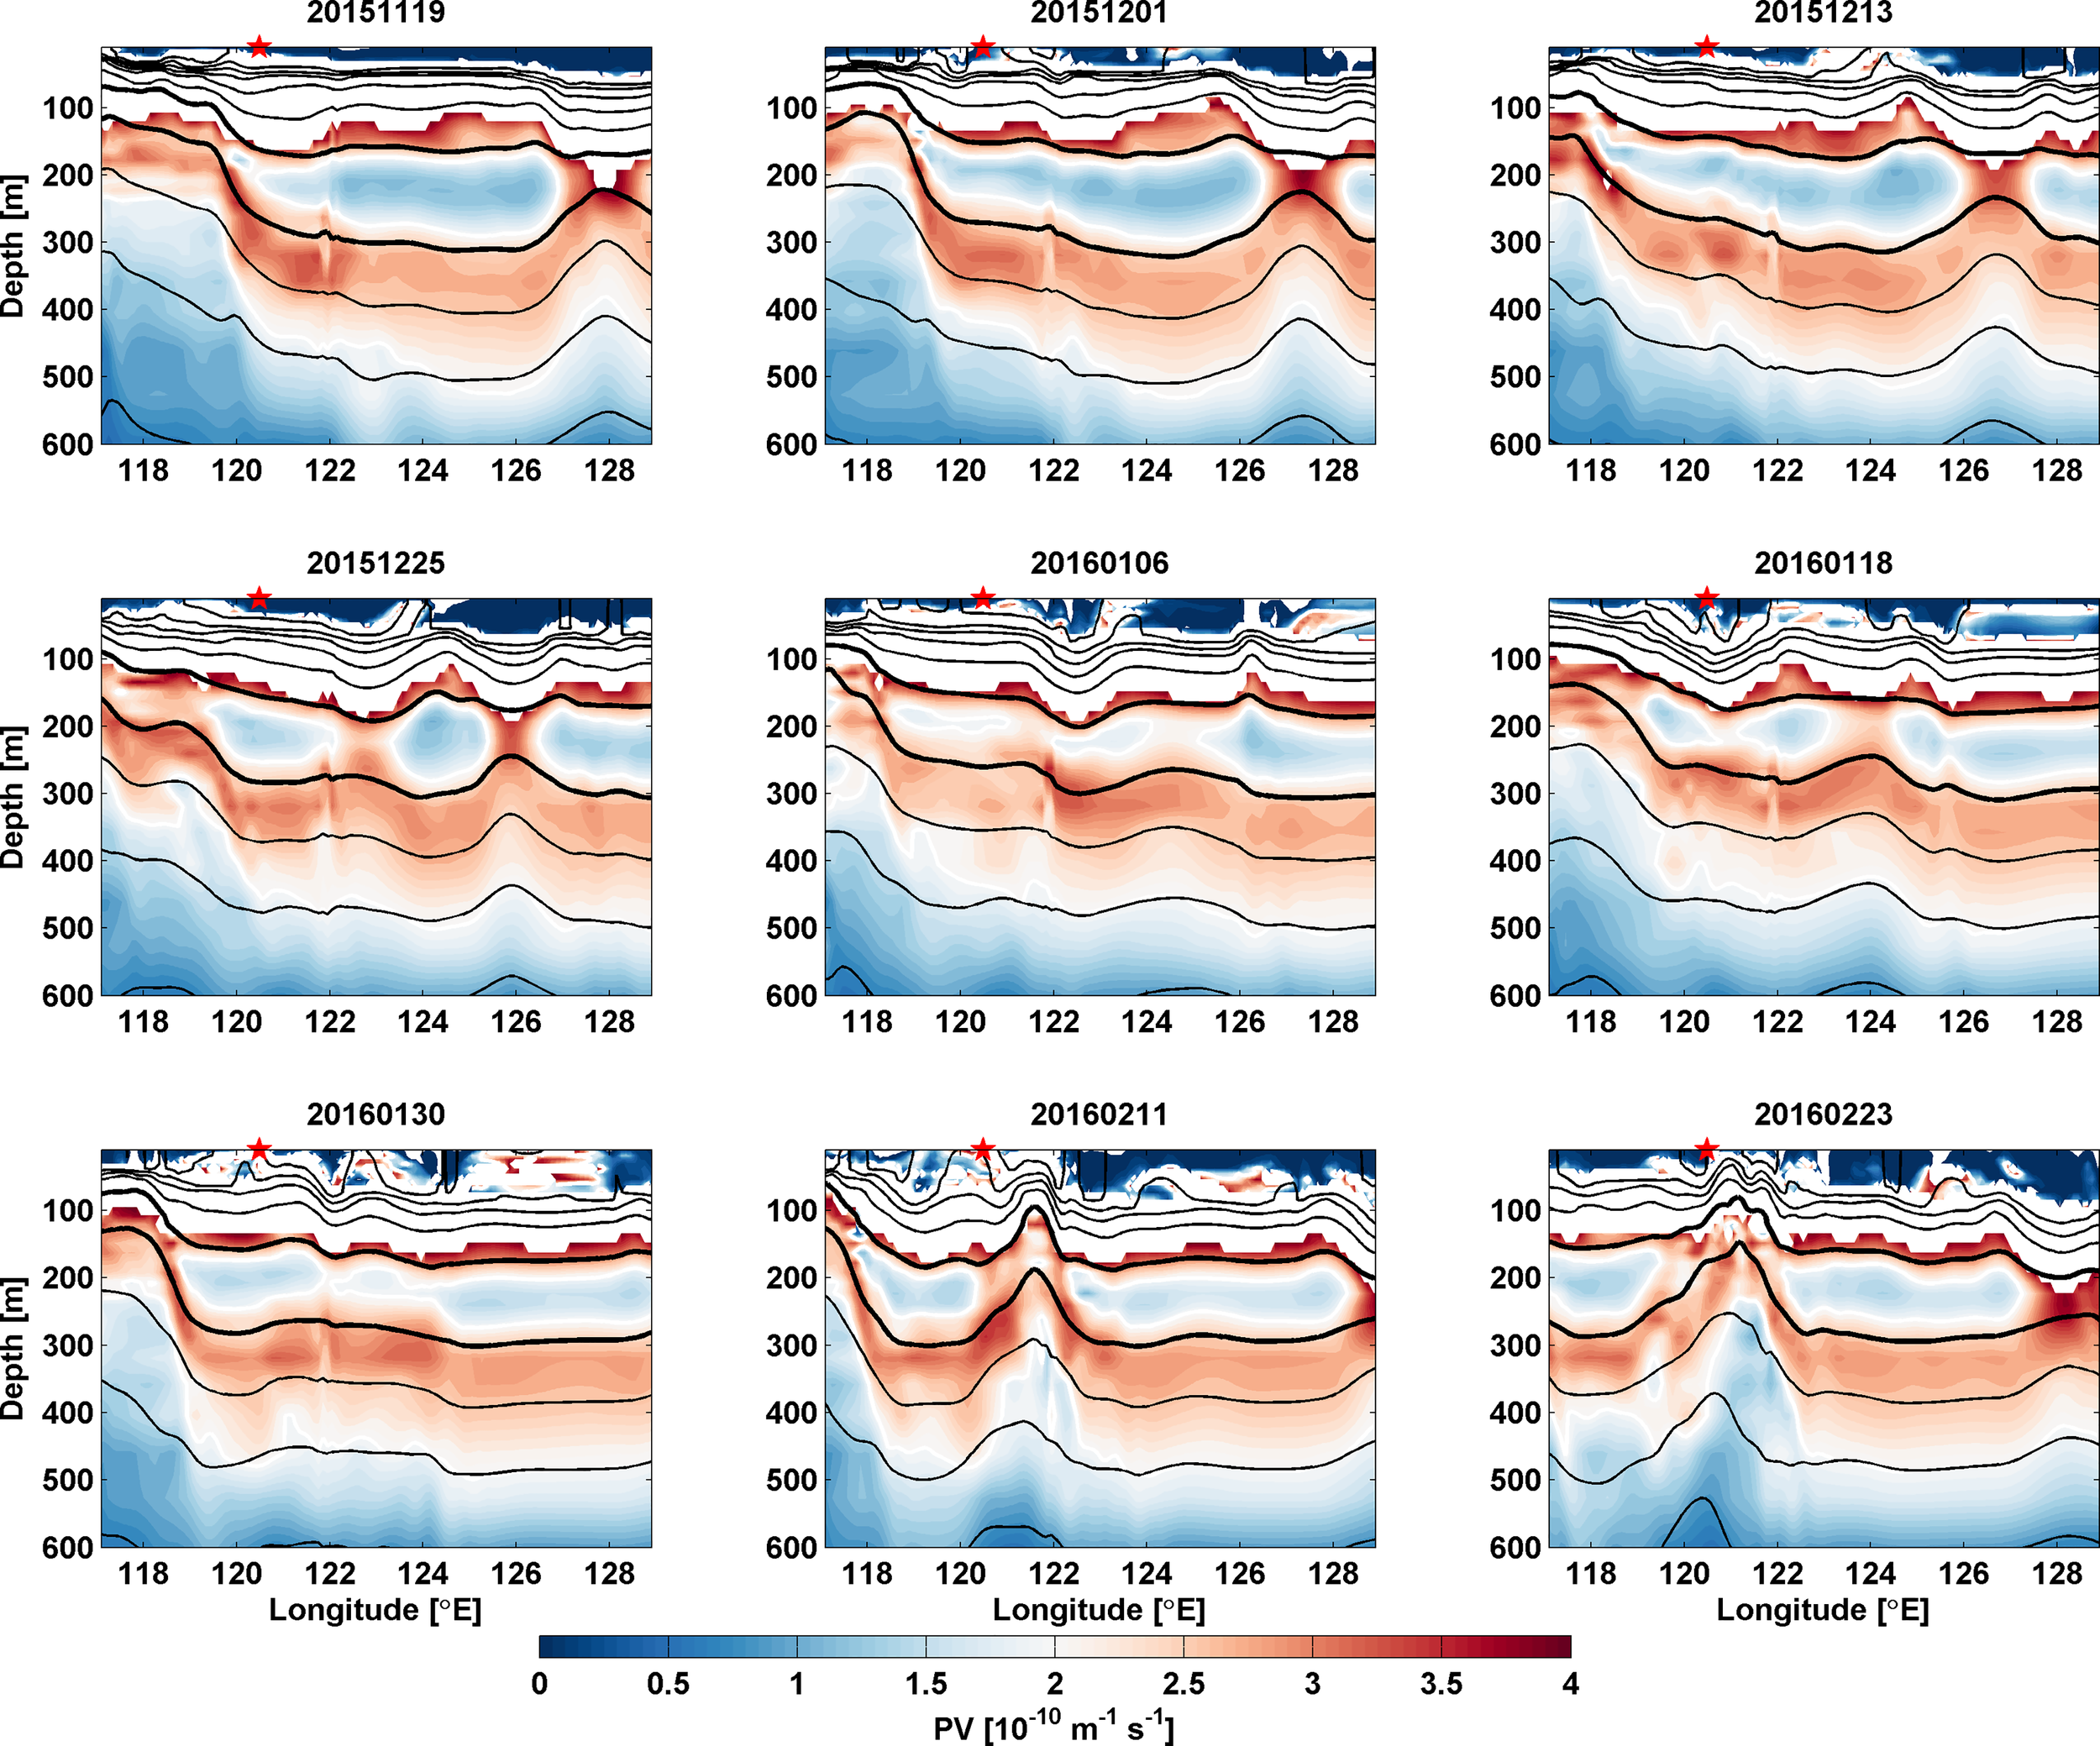
Same as Figure 6 but for the 2015 case.
The 2016 case is slightly different from the other two cases. According to Figure 2B, low PV water intrusion was frequent during the period of 2014-2016. The relay of low PV water from AE1 to AE2 was sometimes continuous, such as in the 2016 case, when low PV signals began moving across the LS on 10 June 2016 once AE2 had formed on 29 May 2016 (Figures 9, 10). Compared with the 2008 and 2015 cases, the low PV signal from the NP was relatively weak. However, AE2 formed once AE1 reached the LS on 10 June 2016. In contrast to the other two cases, AE1 dissipated after most of the low PV water was trapped by AE2 on 28 July 2016. As the eddy structure of AE2 intensified on 9 Aug. 2016, the low PV water moved westward and disappeared near 113°E (Figure 4D).
Figure 9
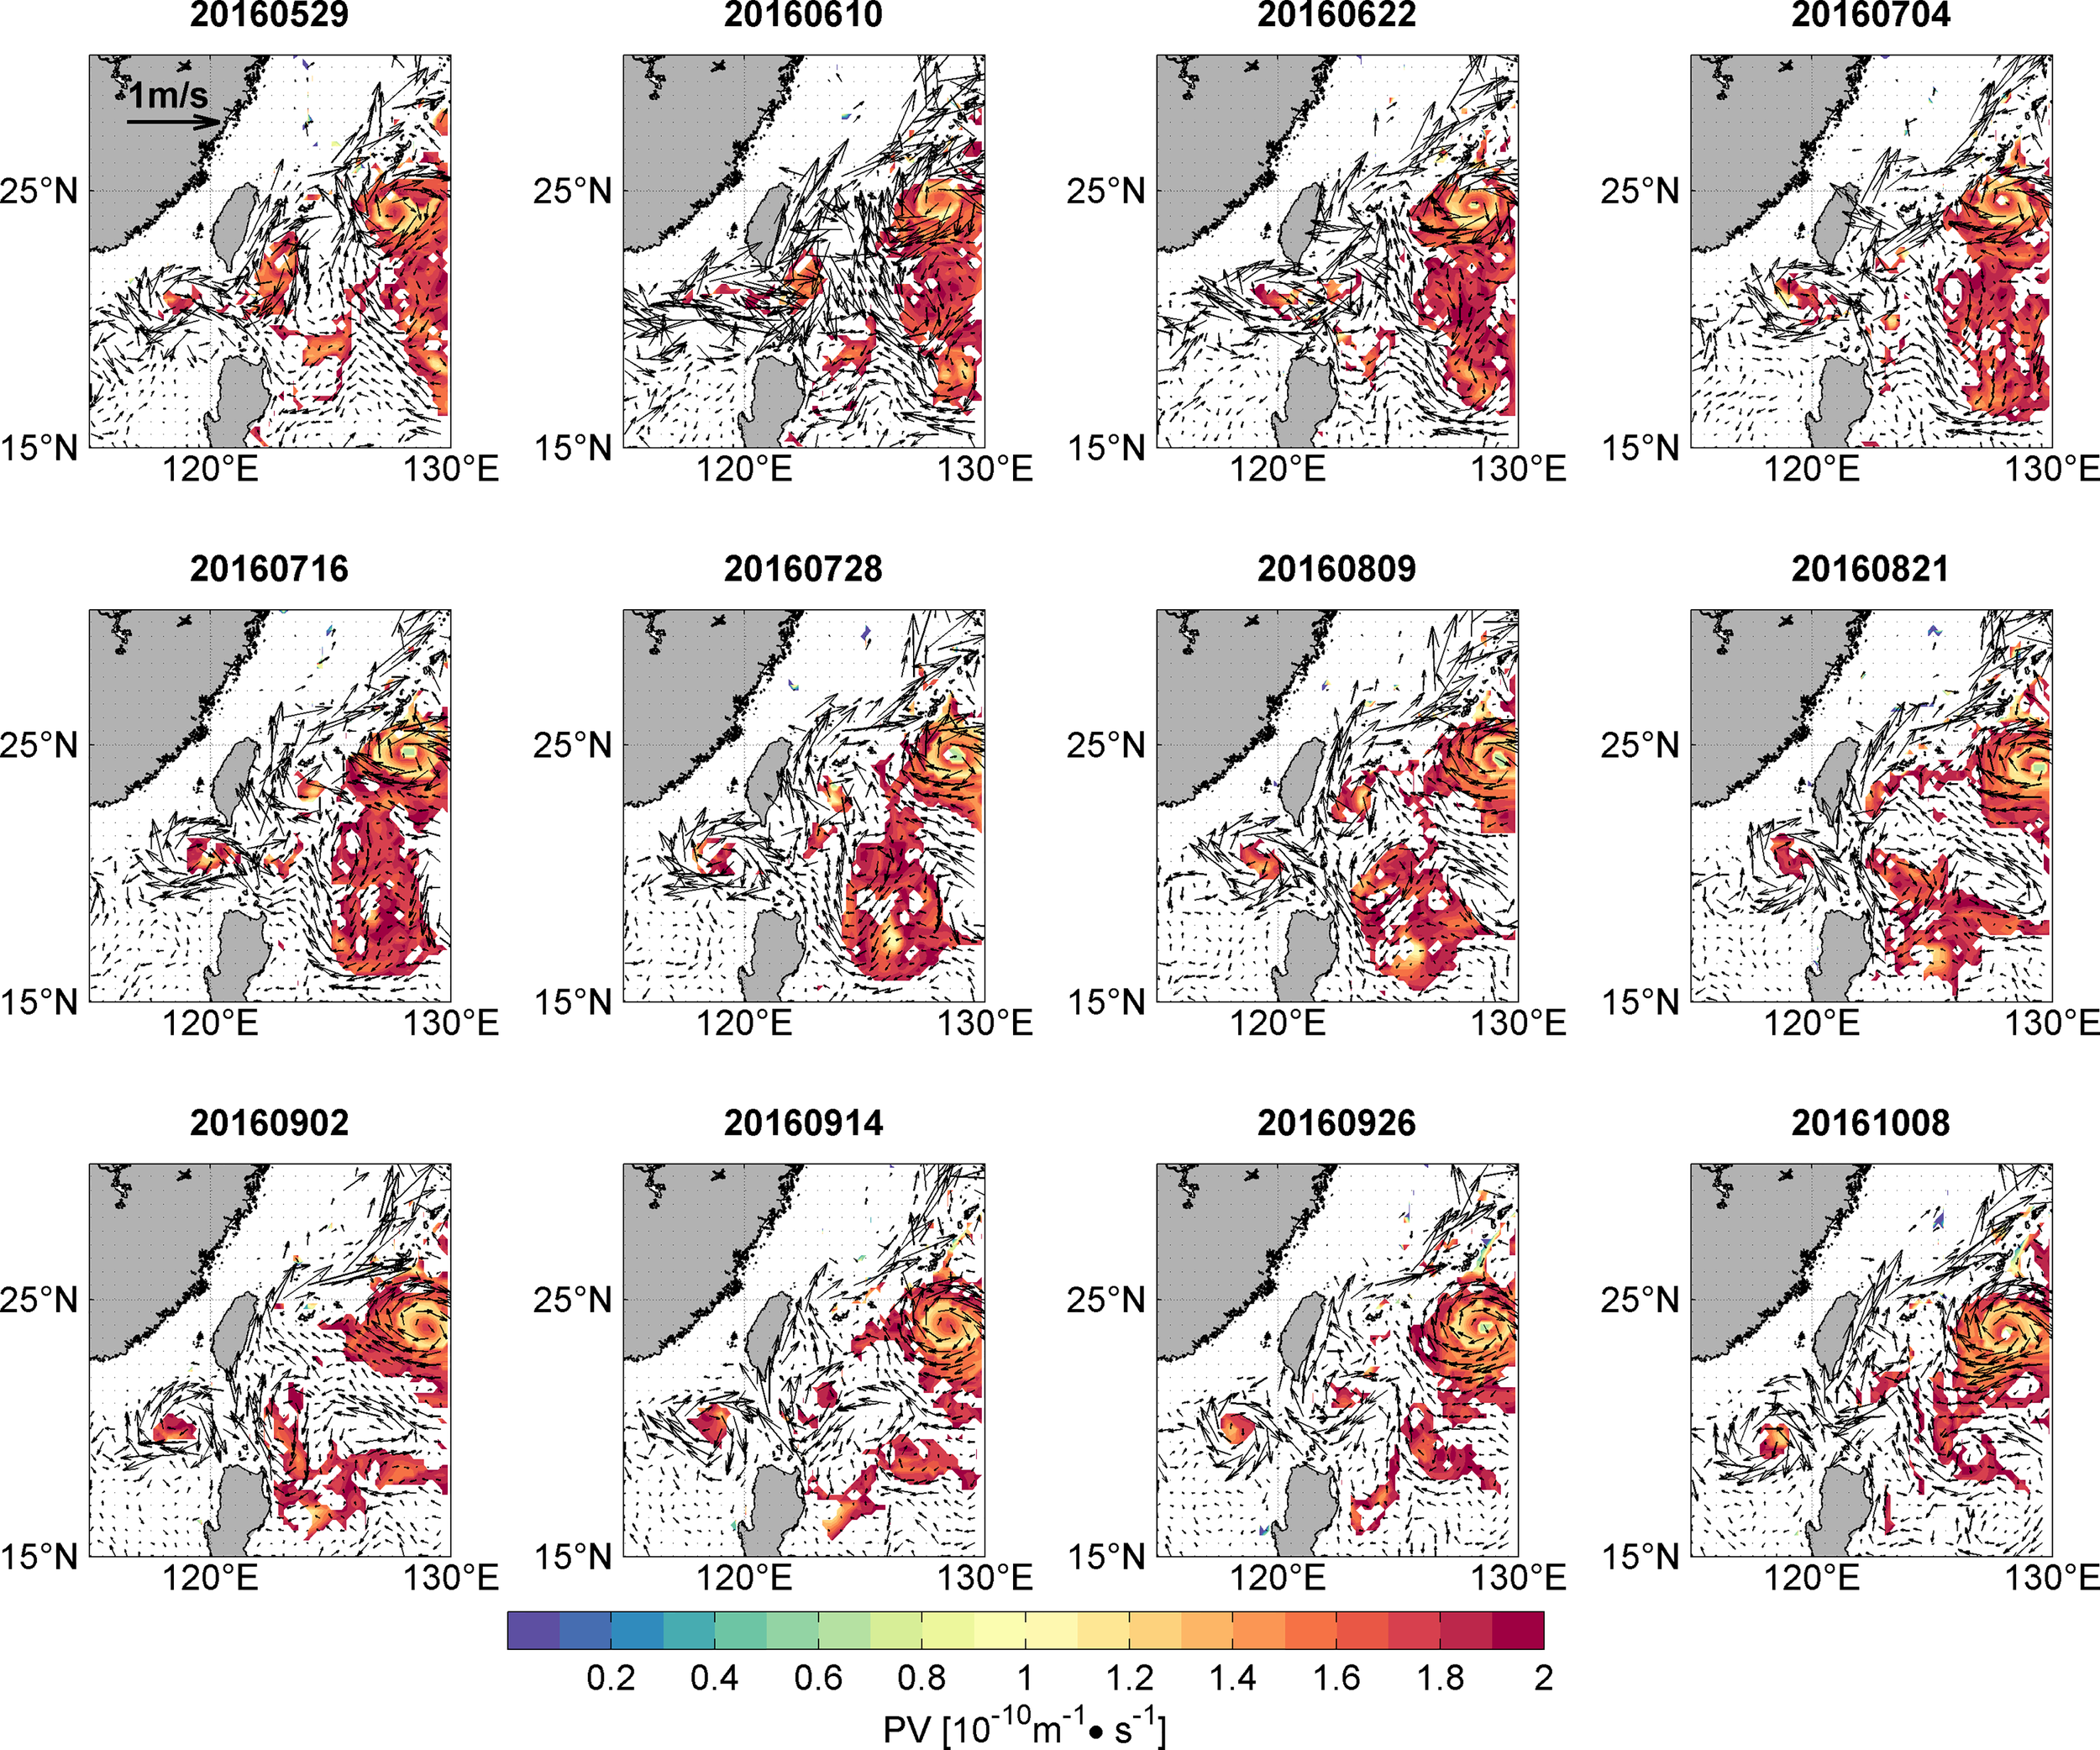
Same as Figure 5 but for the 2016 case.
Figure 10
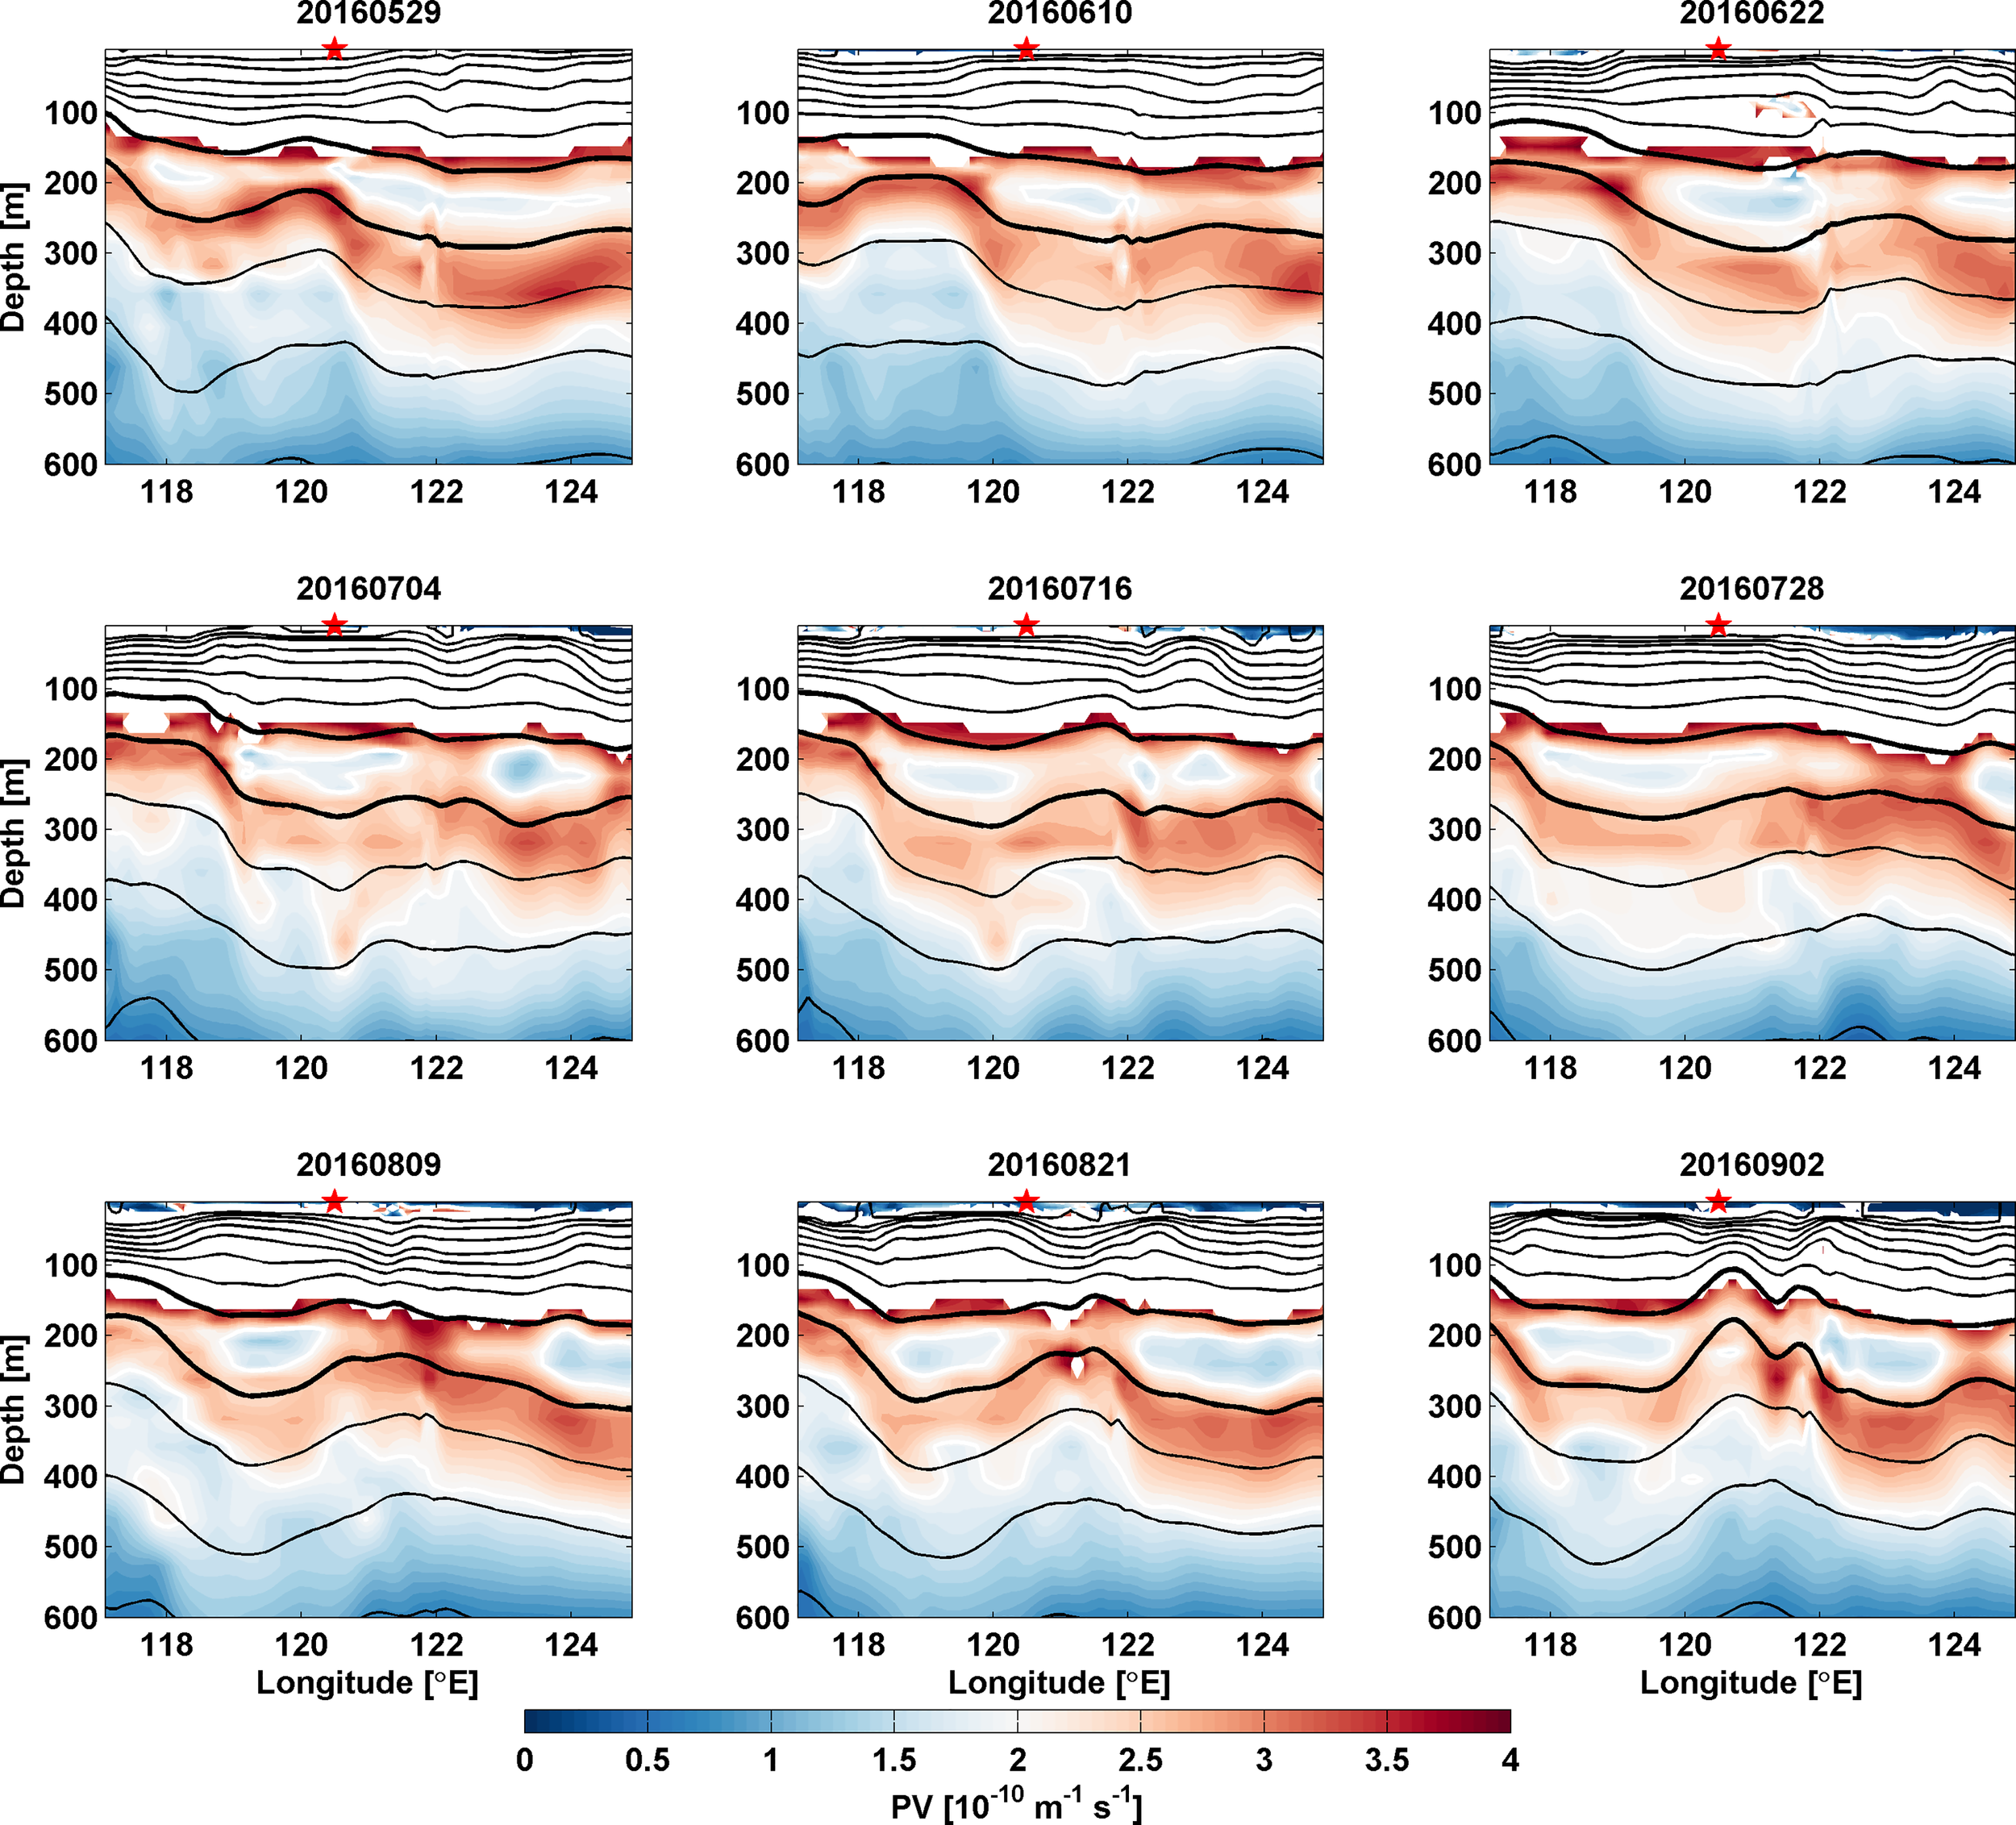
Same as Figure 6 but for the 2016 case.
Since AE2 and the low PV signal mutually maintained each other, AE2 could carry the low PV water over a long distance until it was eroded by local strong vertical stratification or AE2 weakened under the effect of the local wind stress curl. In the 2008 case, the low PV water propagated a long distance (Figures 4B–D) with both the horizontal scale of the low PV signal and AE2 shrinking (not shown). To confirm whether the low PV signal was transported from the NP, we compared the water mass properties of low PV water when it was trapped by AE1 (Figures 11A–C), trapped by AE2 (Figures 11D–F) and before it disappeared (Figures 11G–I). The low PV water, which was remarkably different from the surrounding waters (gray dots in Figure 11), was concentrated in the STMW layer during all three periods. The temperature range varied from 15°C to 18°C, while the salinity range varied from 34.6 to 34.9. Thus, the T-S distributions of low PV water were in accordance at the three moments, while the amount of low PV water gradually decreased along the trajectory. The low PV water moving along the trajectory can thus be considered to have originated from the STMW. The results confirm that the low PV signal originated from the NP and intruded into the SCS from the LS.
Figure 11
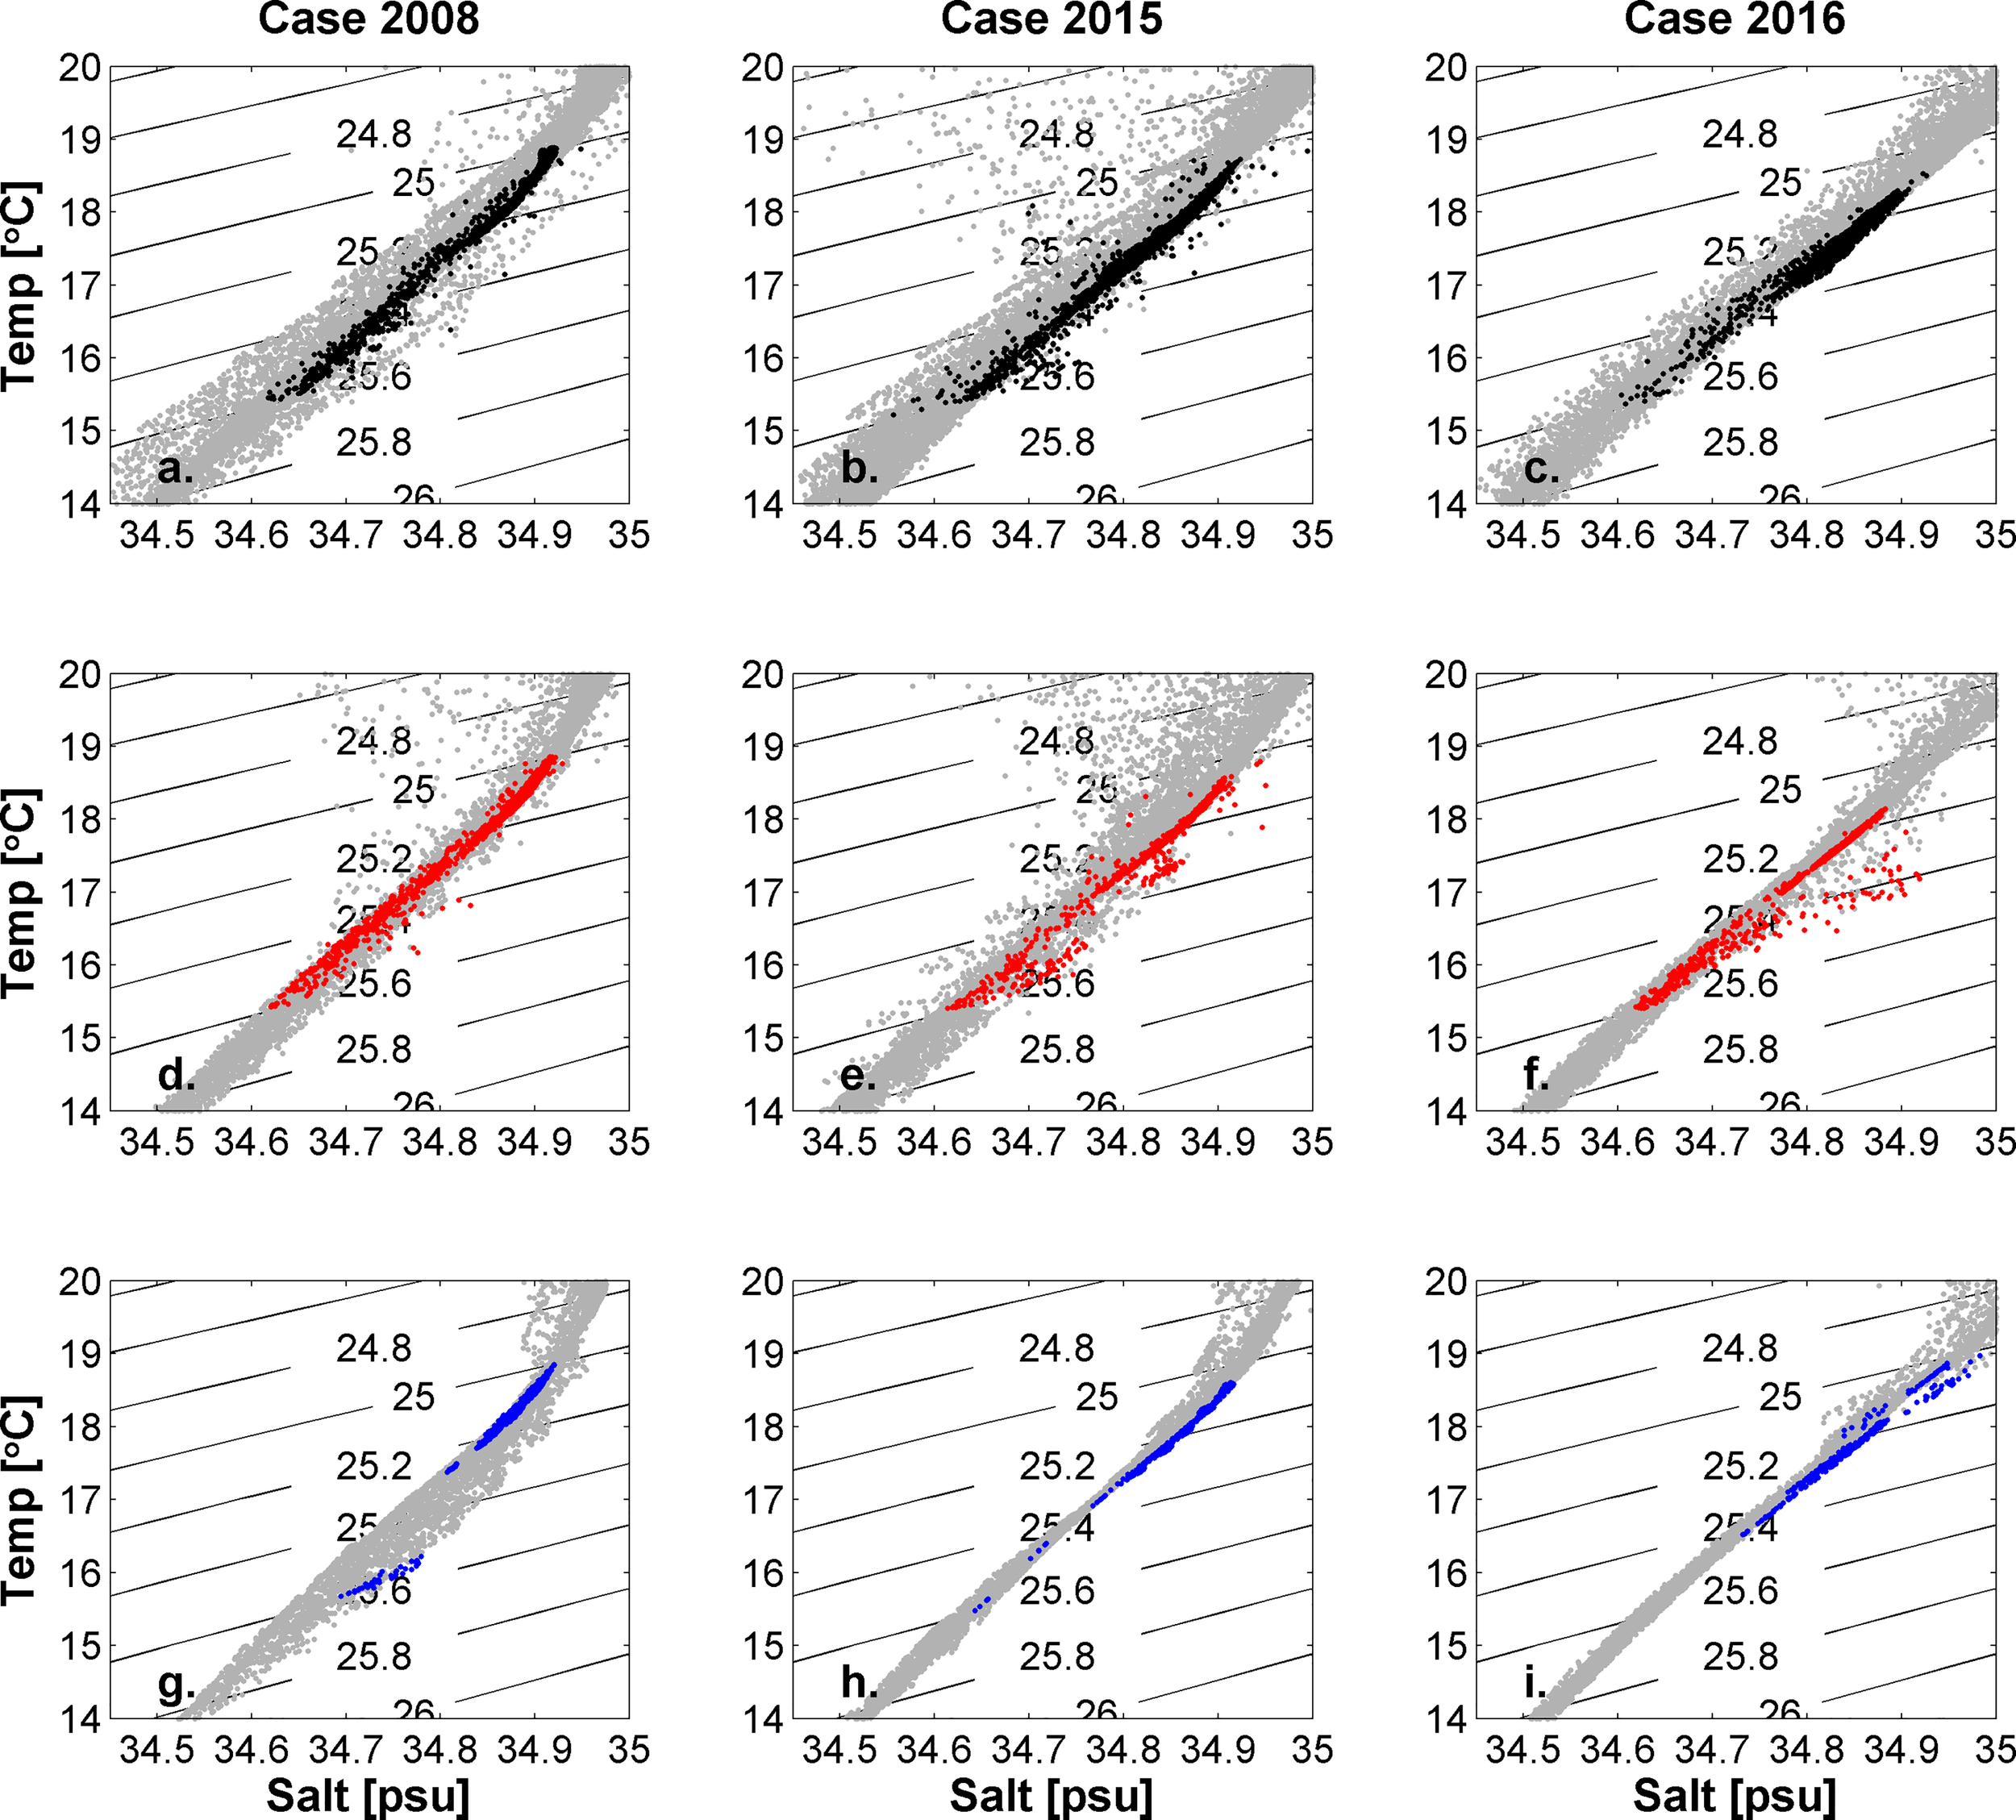
T-S plots of the low PV signal on the dates when the low PV signal was located in the 19°–22°N, 122°–125°E area: (A) 13 June 2008, (B) 22 Dec. 2015 and (C) 11 May 2016 (black dots); T-S plots on the dates the low PV signal was isolated and located in the 18°–21°N, 118°–120°E area: (D) 31 July 2008, (E) 11 Feb. 2016 and (F) 21 Aug. 2016 (red dots); and on the dates the low PV signal moved far westward in the 16°–18°N, 113°–115°E area: (G) 1 Nov. 2008, (H) 11 May 2016 and (I) 4 Dec. 2016 (blue dots). The gray dots present the waters in which the PV is higher than above 600 m. The left/middle/right columns represent the 2008/2015/2016 cases, respectively.
3.2 Conditions of the low PV water intrusion
As indicated by Yu et al. (2015), the low PV signal originating from STMW can arrive in the LS area 5 years after STMW subduction; thus, the low PV signal occurs frequently in the LS area. However, not all the low PV water reaching the LS can intrude into the SCS. We compared all the cases in which low PV water eroded in AE1 with the cases in which the water mass could be relayed by AE2 and finally determined the reason why some low PV water cannot move farther westward.
We chose a case when strong low PV water reached the LS area on 14 May 2005 to illustrate the issue and refer to it below as the 2005 case. Figure 12 shows the process of low PV signal weakening after reaching the LS. The low PV water was also carried by an AE. There was a strong northwestward current southwest of Taiwan Island and thus strong positive velocity vorticity in the area. Upwelling was strengthened due to the positive vorticity, correlated with the isopycnal layer bending up (Figure 13). Unlike the stratification weakening in the intruding cases, vertical stratification was thus strong west of AE1 and was not able to maintain the low PV signal. Figure 13 shows that the vertical stratification is stronger west of 122°E than east. As a result, the low PV water could not climb up the isopycnal slope of the STMW layer but gradually weakened during movement. Meanwhile, the low PV water shrank, in accordance with the demise of AE1. The strong vertical stratification affected not only the low PV water transport but also the lifetime of AE1. The STMW layer increased and thinned due to the low PV signal weakening, and then AE1 weakened. This result indicates that positive velocity vorticity southwest of Taiwan Island does not favor the intrusion of low PV water into the SCS because the strong vertical stratification structure will not maintain a low PV signal. In conclusion, the low PV water can be relayed only when the velocity vorticity is negative west of AE1.
Figure 12
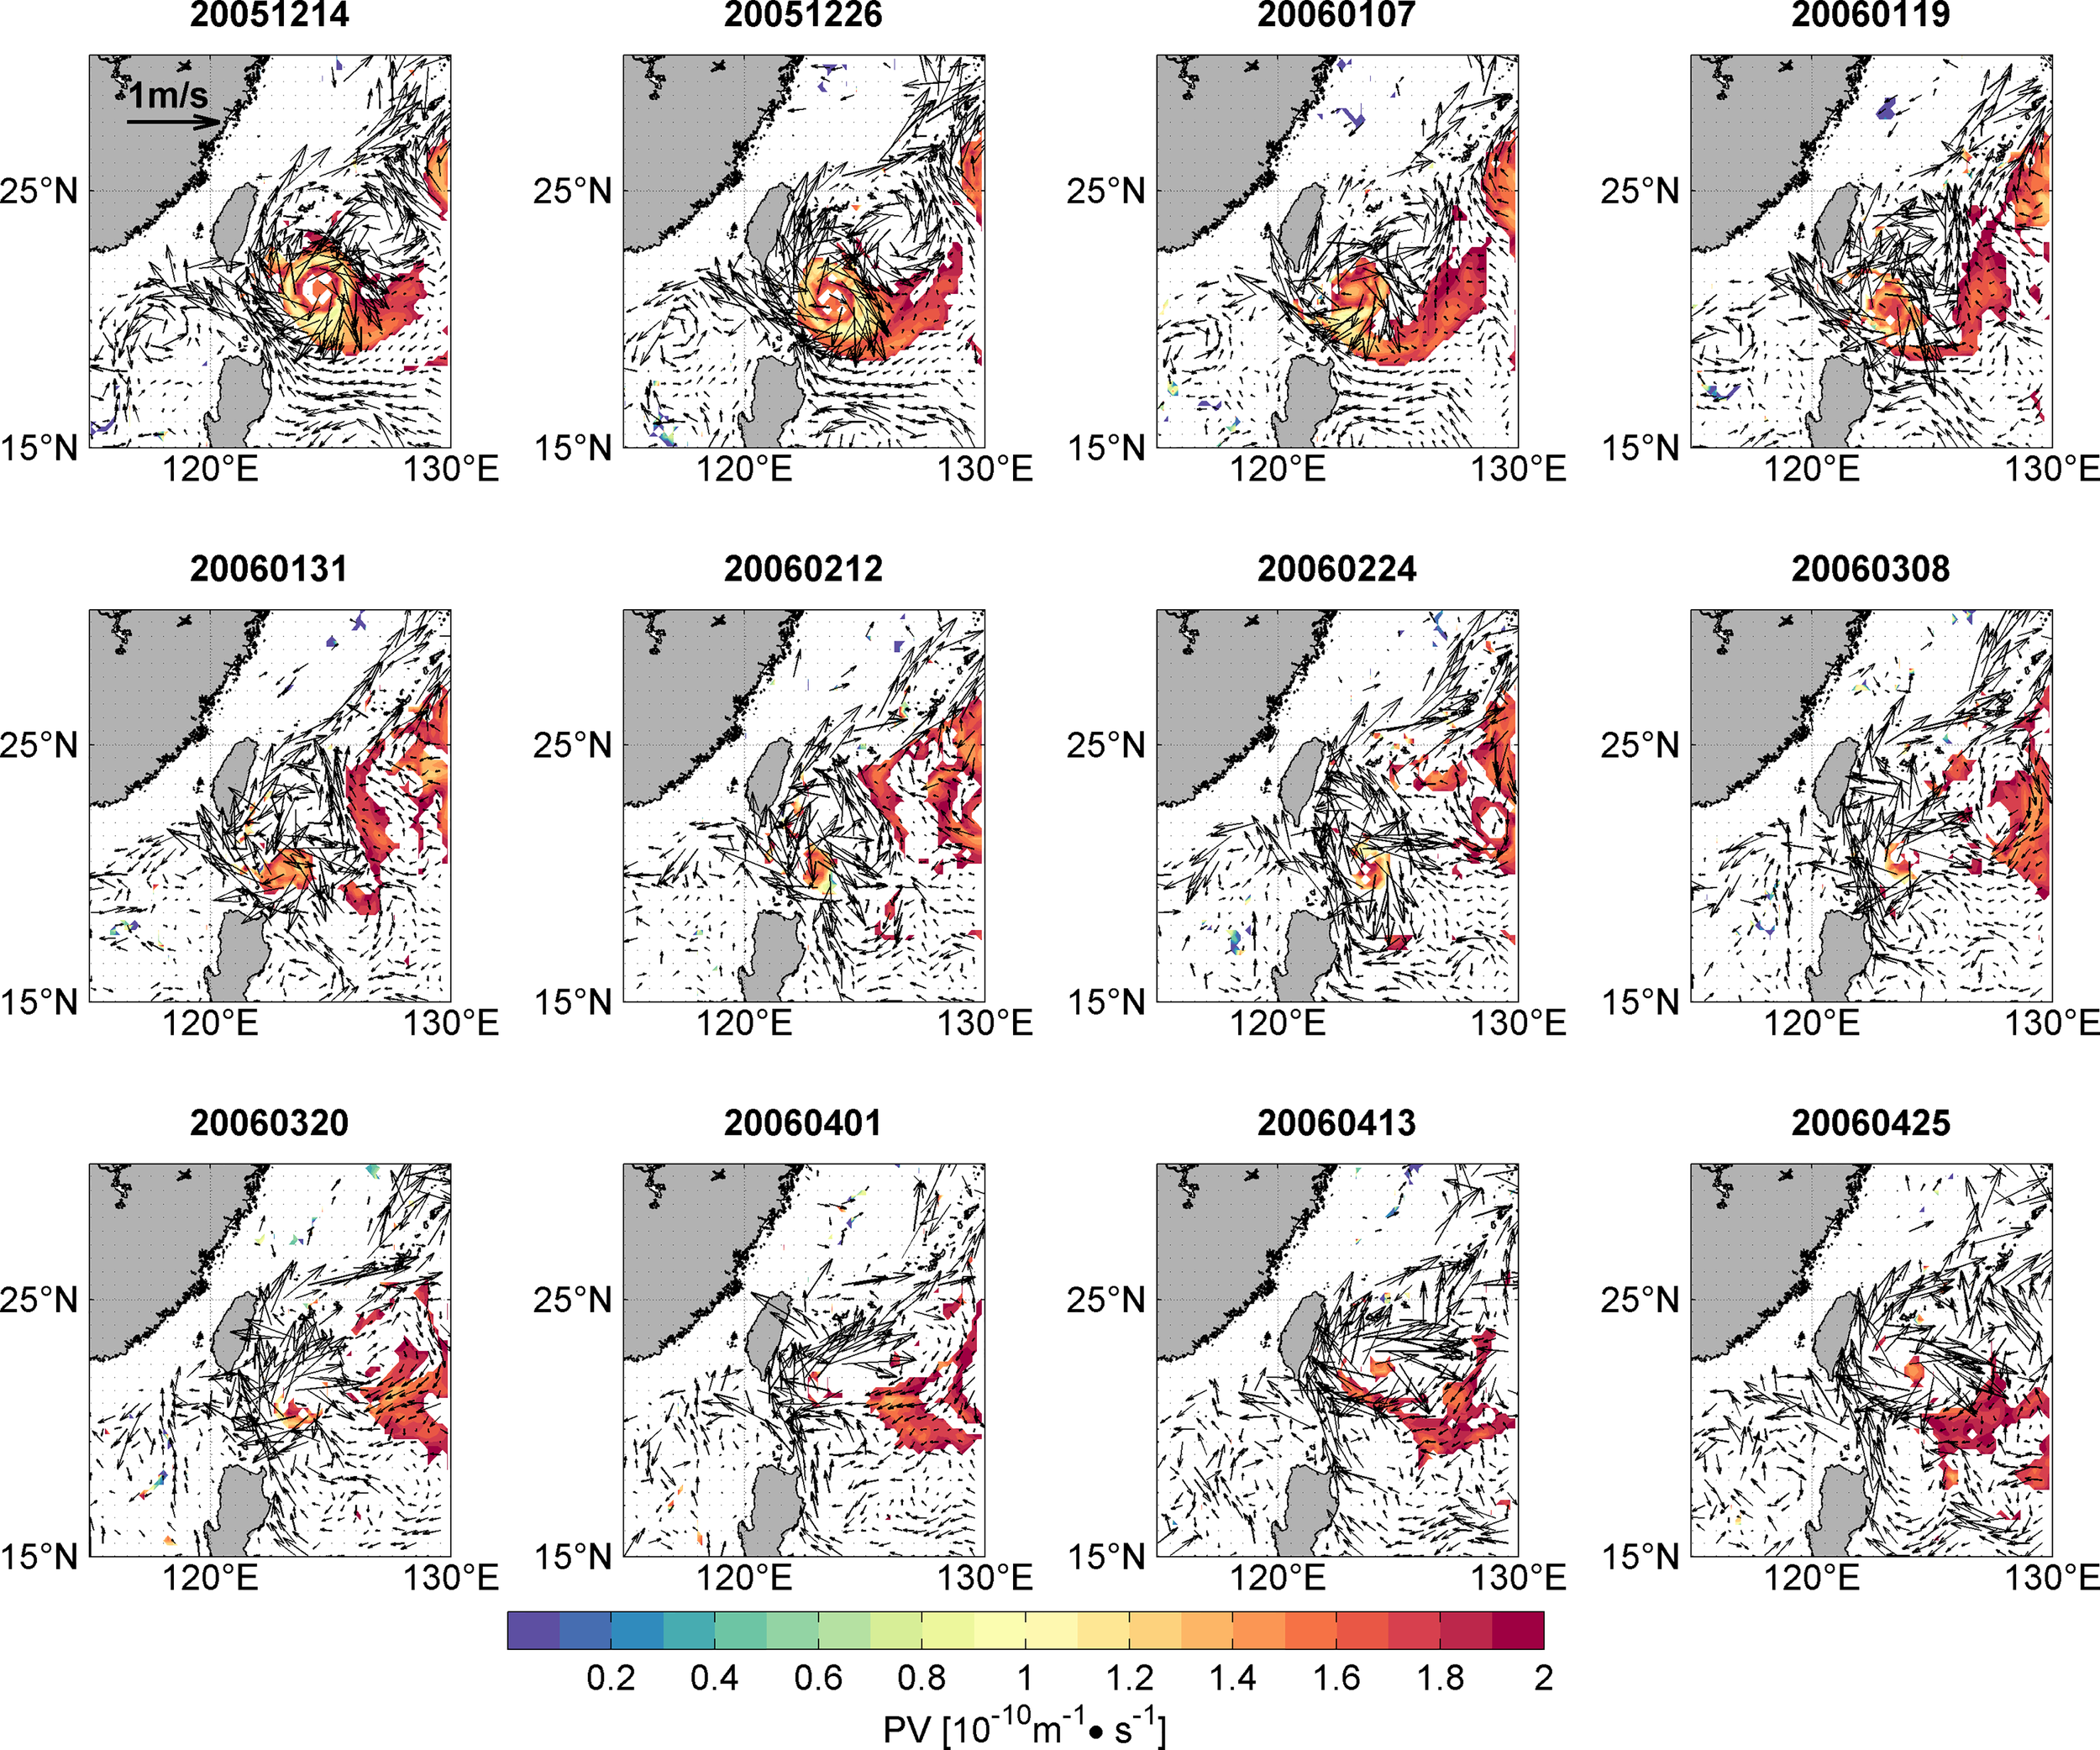
The process of a low PV signal (colors, unit: ) disappearing east of the Luzon Strait in the 25.3 isopycnal layer in the 2006 case. Vectors represent currents (unit: ) in the 25.3 isopycnal layer.
Figure 13
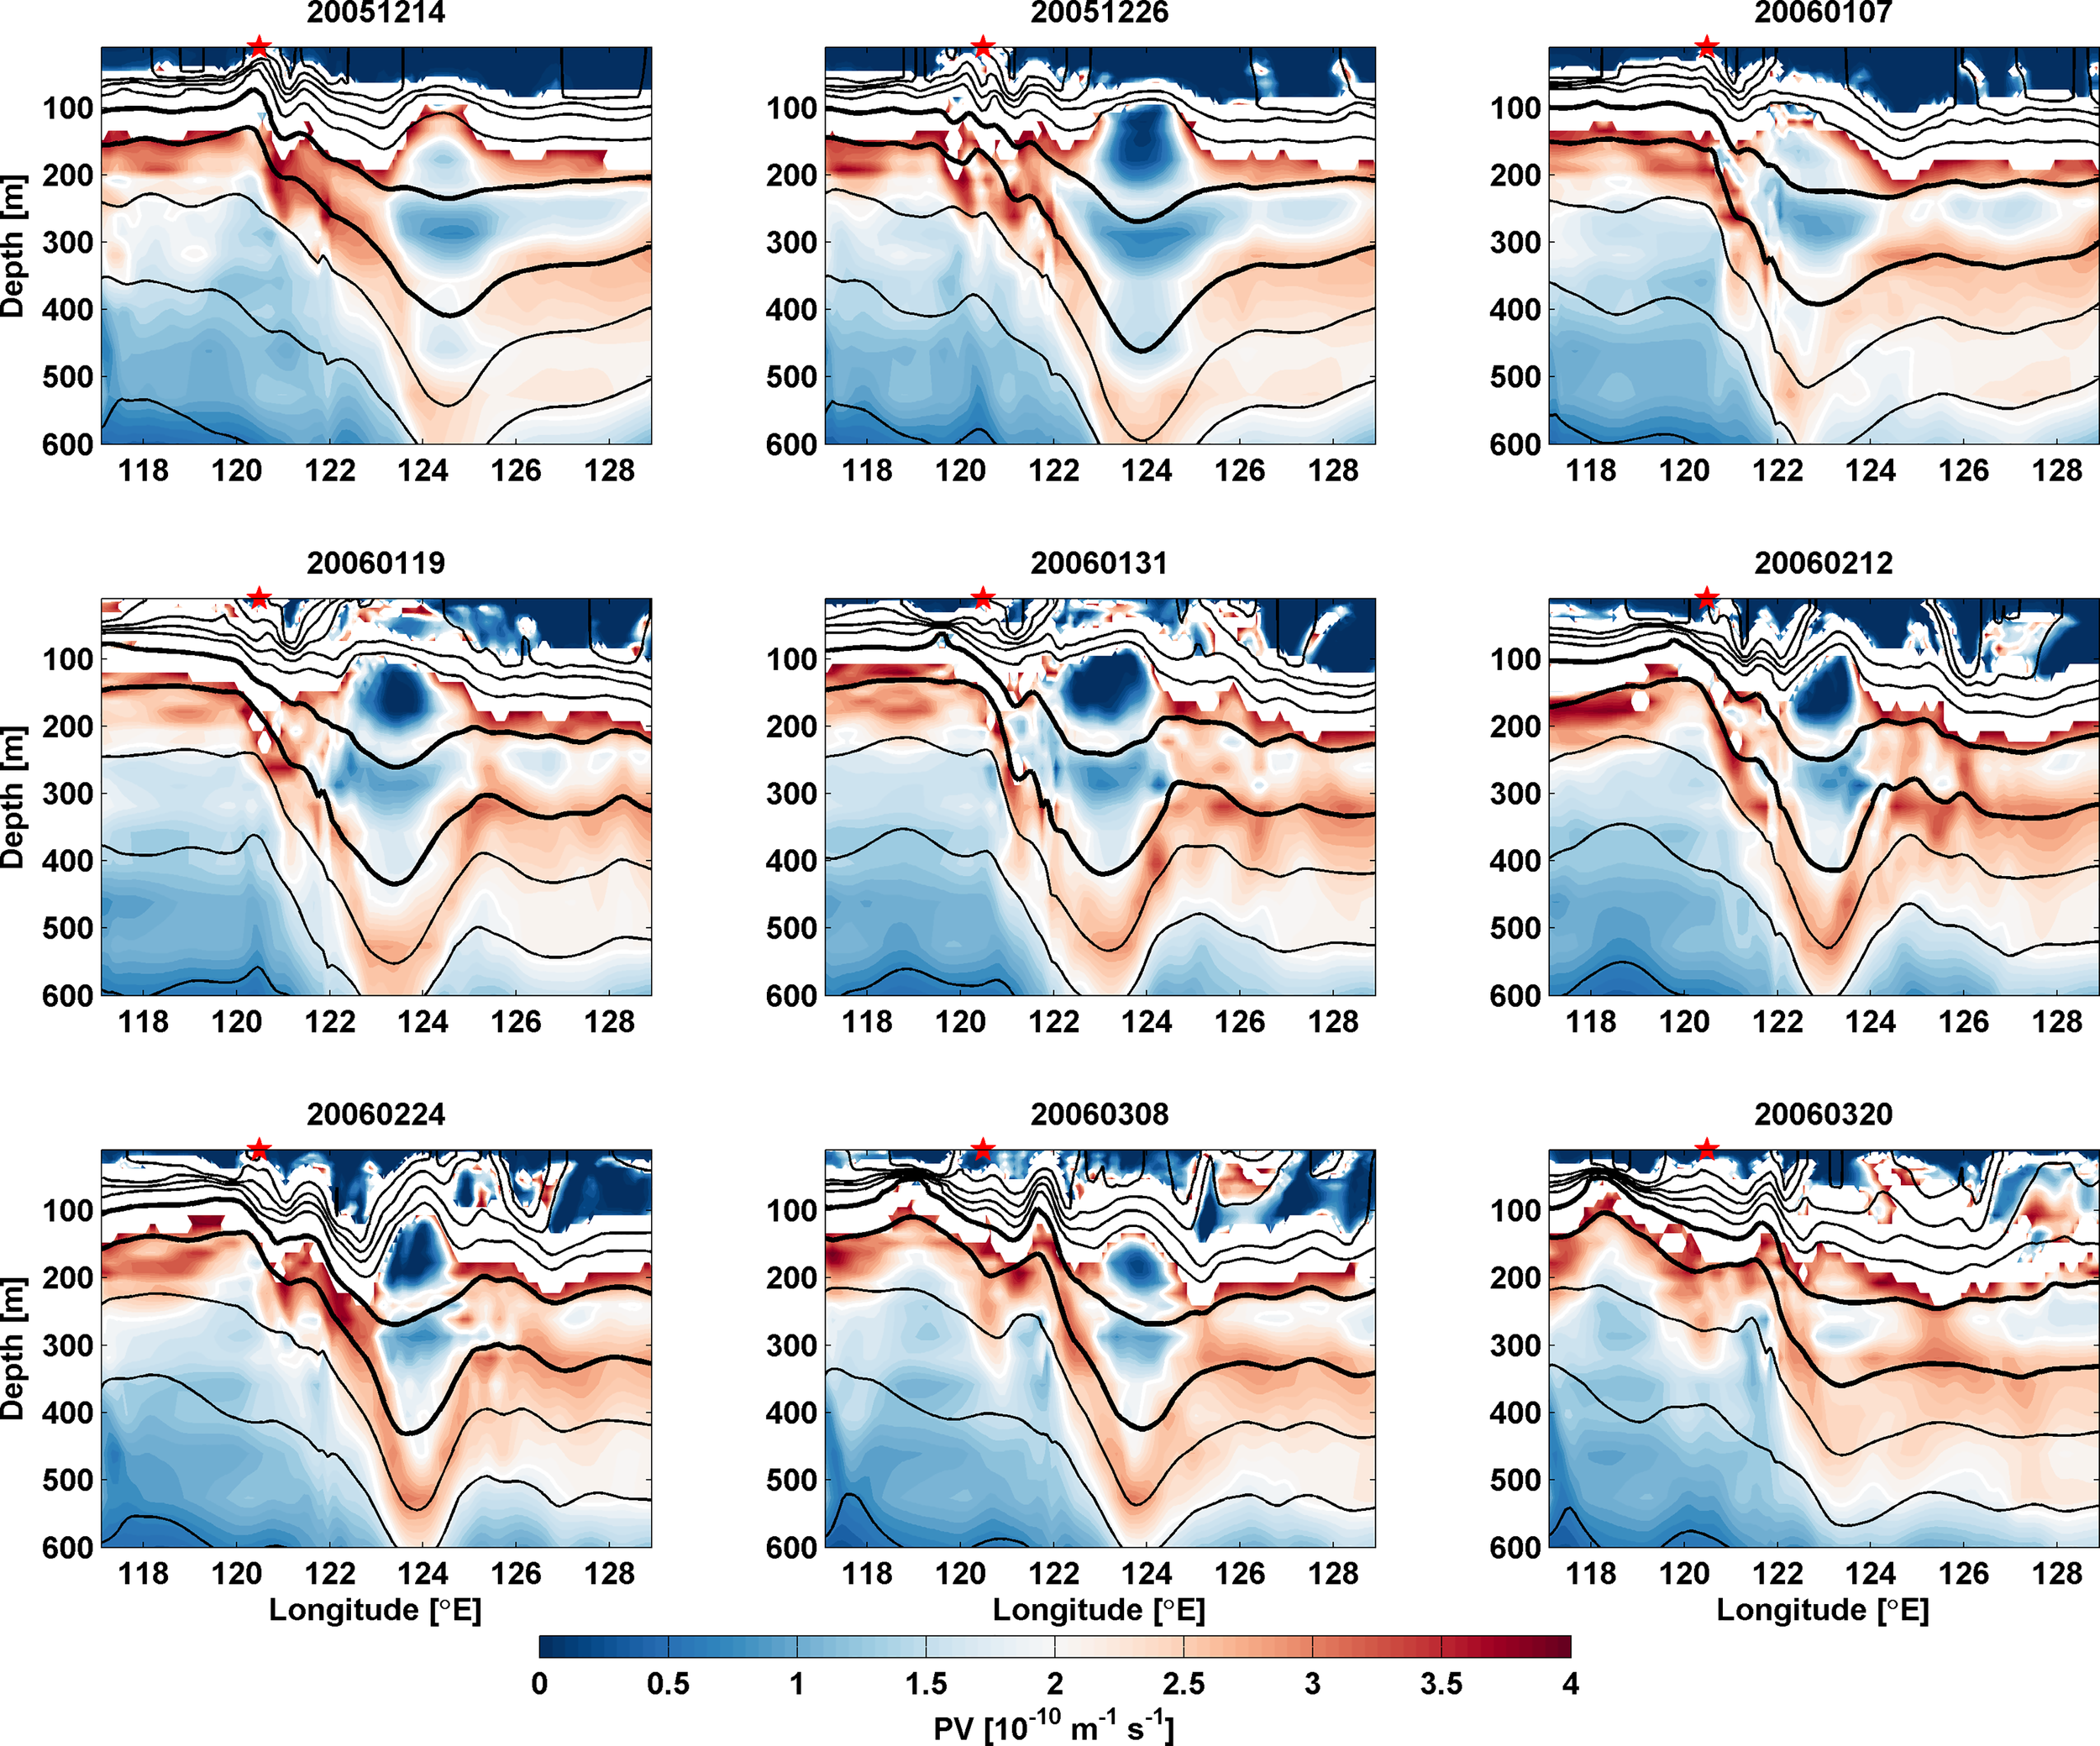
The process of the low PV signal (colors, unit: ) weakening along 21°N east of the Luzon Strait in the 2006 case. The white lines denote the PV contour. The thick black lines denote the and isopycnals.
4 Summary and discussion
Due to the new developments in oceanic observations and eddy-resolving models, the effect of mesoscale eddies on the propagation of STMW has attracted considerable attention. Both observed and model analysis results have demonstrated that eddies are able to retain mode water and propagate westward over long distances (Uehara et al., 2003; Nishikawa et al. 2010; Xu et al., 2017; Shi et al., 2018; Wang et al., 2022). With in situ observation data, Nan et al. (2017) found low PV water, trapped by an AE, located east of Taiwan Island (23°N, 120°-130°E). With the OFES dataset, Yu et al. (2015) found that low PV water from the STMW can reach the region east of the LS. Our study further demonstrates that low PV water could not only reach the LS but also intrude into the SCS. The results of this study indicate that low PV water intrusion is correlated with eddy activities in the eddy-resolving OFES dataset.
In this study with Argo float data, we first found that low PV water could move across the LS from the NP and intrude into the SCS (Figures 3A, 4A). This low PV water intrusion phenomenon is well reproduced by the OFES outputs in Figure 3B. We also illustrate the mechanism of low PV water movement across the LS with the OFES dataset. The results of the three cases described in Section 3 indicate that the low PV water can be relayed by two AEs (AE1 to the east and AE2 to the west) and then moves southwestward in the SCS when the velocity vorticity is negative west of AE1. The Argo floats stay at a depth of approximately 1000 m most of the time and thus may not always capture mesoscale eddies. However, an Argo float (ID: 2901502) captured a low PV signal east of the LS and then moved across the strait (Figure 4A). Figure 14 presents the variation in the SSH and sea surface current from the CMEMS satellite dataset during the period in which the 2901502 Argo moved across the LS. The Argo float (red dot in Figure 14) reached west of the LS and was located at the edge of a strong AE on 22 Jan. 2015. Then, an AE (AE1) departed from the large AE and moved northwestward in accordance with the movement of the Argo float. Another AE (AE2) gradually developed southwest of Taiwan Island on 3 Mar. 2015. The Argo float moved to the southwest of Taiwan Island and was trapped by AE2 on 13 Mar. 2015. Finally, AE2 was isolated from AE1 on 2 Apr. 2015. The results shown in Figures 4A, 14 indicate that low PV water could move across the LS. The observed intrusion process of the low PV water was correlated with eddy activities and was similar to the model results, thus validating the analysis and results from the model dataset.
Figure 14
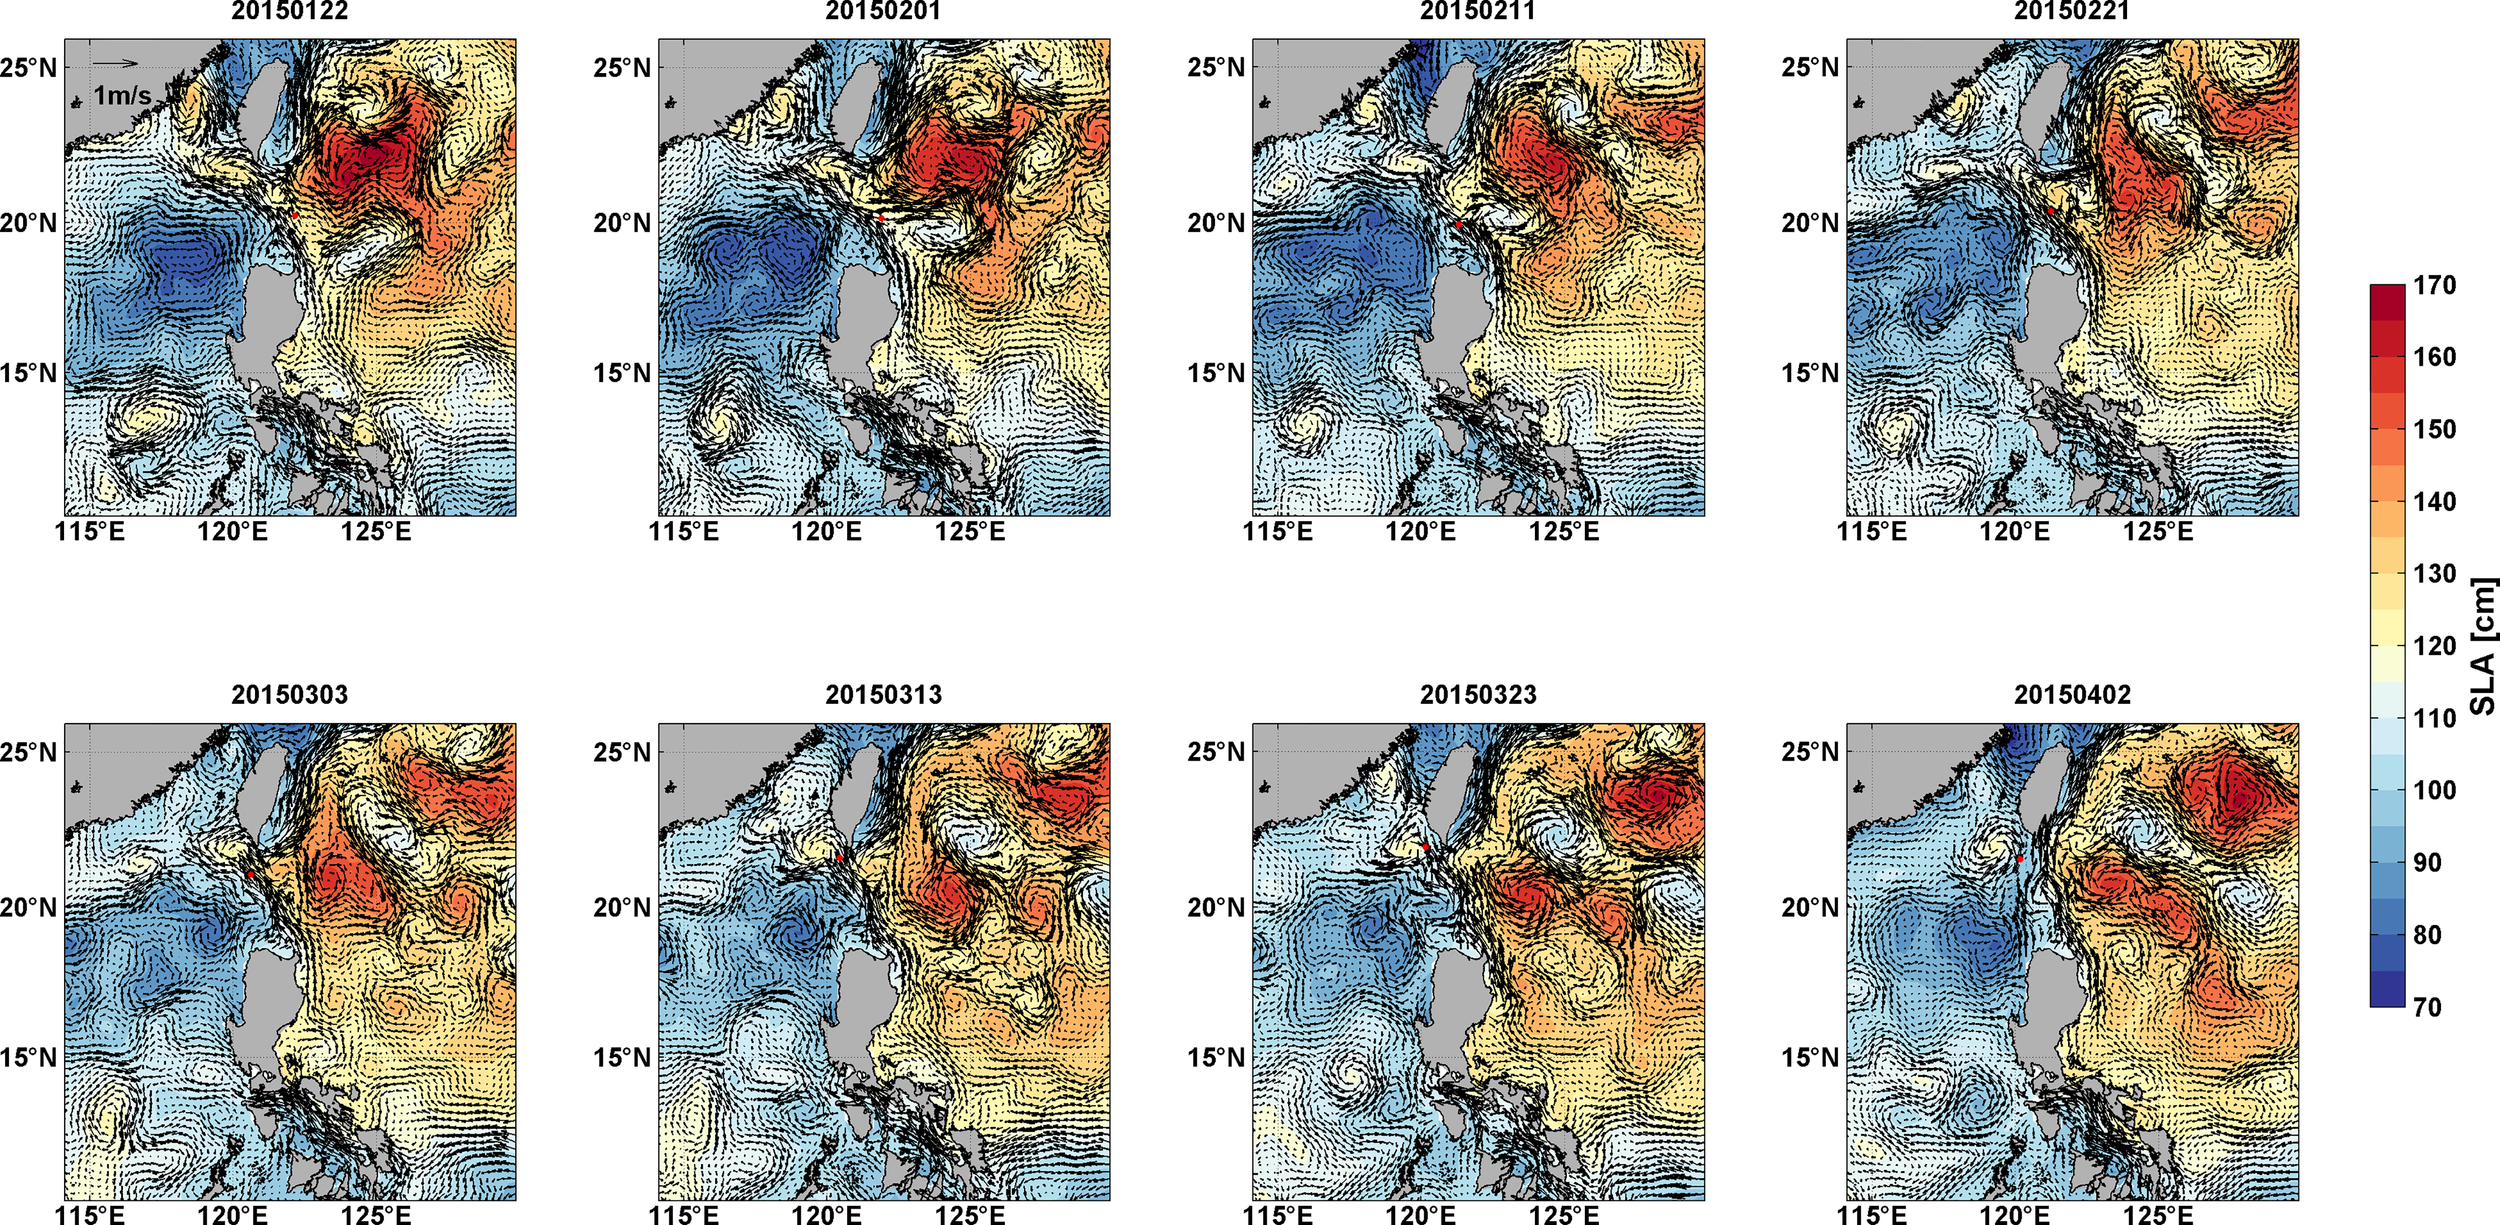
Distribution of SSH (shaded) and geostrophic sea surface current (vectors) from 22 Jan. 2015 to 2 Apr. 2015 with the CMEMS dataset.
We provide a schematic illustration of the mechanism of low PV water intrusion (Figure 15). Figures 15A, B show the process of the low PV water relay from AE1 to AE2, while Figures 15C, D show a situation in which low PV water cannot move across the LS. The vertical structure is weaker in Figure 15A west of 122°E than in Figure 15C. Consequently, the water mass is able to move along the STMW layer and maintain its low PV characteristics. The low PV signal also benefits the formation of AE2 after separation from AE1. Finally, AE2 sheds from AE1 and then carries low PV water farther west. In contrast, the low PV water shrinks due to the strong vertical stratification west of 122°E (Figures 15C, D). The strong positive velocity vorticity will not take in any low PV water from AE1. Nan et al. (2011b) found that changes in the Kuroshio intrusion paths often induce eddies in the LS area; therefore, this velocity vorticity variation might be correlated with different intrusion paths of the Kuroshio intrusion.
Figure 15
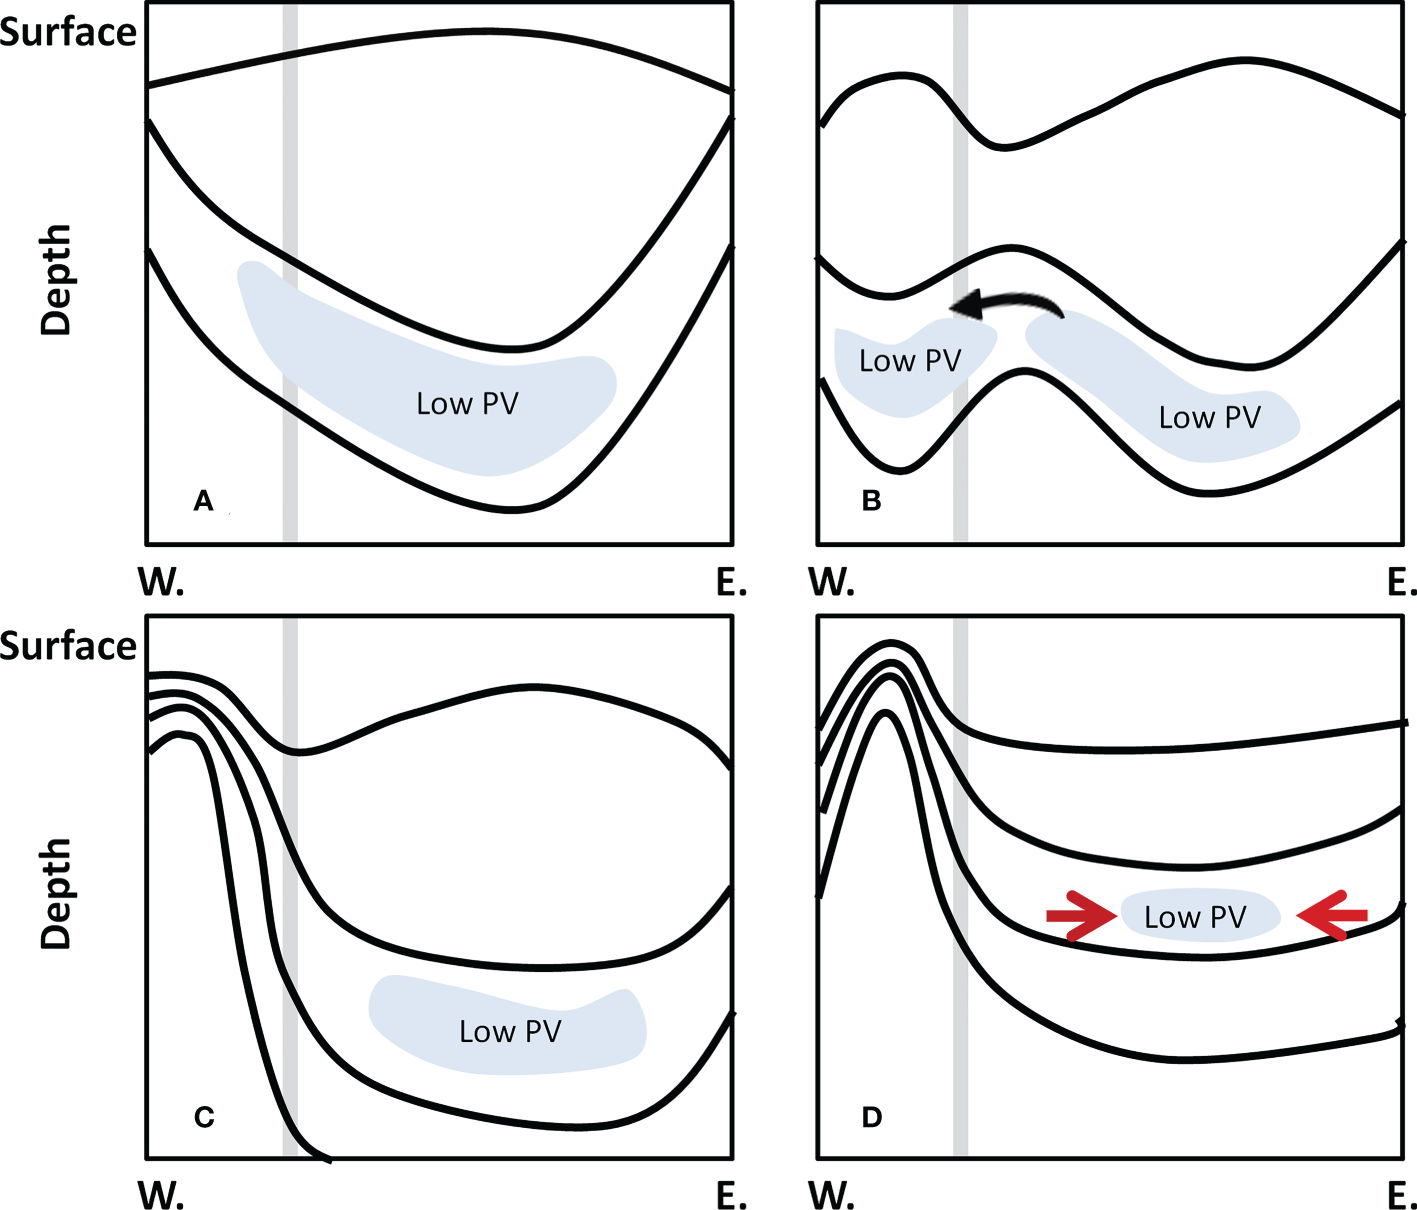
Schematics illustrating the mechanism by which a low PV signal (blue areas) can (cannot) be transported to the east of the Luzon Strait: a low PV signal reaches the Luzon Strait when the stratification is (A) weak and (C) strong on the west side; the low PV signal (B) becomes isolated from and (D) weakens on the east side. The thick gray line represents the position of 122°E. The black lines illustrate the distribution features when the low PV signal can (cannot) be transported to the west of the Luzon Strait. The red arrows in the opposite direction in Figure 15D indicate low PV signal weakening. The crooked black arrow indicates the process of a low PV signal isolated from the AE east of the Luzon Strait. The isopycnals above and below the low PV water are the and isopycnals, respectively.
A previous study has shown that there is a strong decadal signal in STMW subduction, as well as a PV anomaly in the LS area (Yu et al., 2015), and LS transport can also convey climate change signals from the NP to the SCS (Qu et al., 2004; Nan et al., 2015; Zeng et al., 2016; Zhao and Zhu, 2016; Xiao et al., 2018). In this study, both the observation and model results show that low PV water intrusion occurred during the 2008-2009 and 2014-2016 periods, during which El Niño events occurred. Consequently, the low PV water intruding into the SCS might be impacted by climate change events. This study is mainly conducted with cases that occur during low PV water intrusion periods, while further study will be conducted with long-term data series. We plan to detect the connection between low PV signal intrusion and climate change events, such as the Pacific Decadal Oscillation and ENSO, and reveal the effect of low PV water on hydrographic changes in the SCS.
Statements
Data availability statement
The original contributions presented in the study are included in the article/supplementary material. Further inquiries can be directed to the corresponding authors.
Author contributions
RW conducted data analysis and wrote the draft of the paper. All authors contributed to the article and approved the submitted version.
Funding
This work was supported by National Natural Science Foundation of China (Grant No. 42106196, 42206032) and the Natural Science Foundation of Shandong Province (No. ZR2022QD045).
Conflict of interest
The authors declare that the research was conducted in the absence of any commercial or financial relationships that could be construed as a potential conflict of interest.
Publisher’s note
All claims expressed in this article are solely those of the authors and do not necessarily represent those of their affiliated organizations, or those of the publisher, the editors and the reviewers. Any product that may be evaluated in this article, or claim that may be made by its manufacturer, is not guaranteed or endorsed by the publisher.
References
1
Caruso M. J. Gawwarkiewicz G. G. Beardsley R. C. (2006). Interannual variability of the kuroshio intrusion in the south China Sea. J. Oceanography62, 559–575. doi: 10.1007/s10872-006-0076-0
2
Chern C. S. Wang J. (1998). A numerical study of the summertime flow around the Luzon strait. J. Oceanography54, 53–64. doi: 10.1007/BF02744381
3
Hanawa K. Talley L. D. (2001). Mode waters. Int. Geophysics Ser.77, 373–386. doi: 10.1016/S0074-6142(01)80129-7
4
Huang B. Liu Z. (1999). Pacific subtropical-tropical thermocline water exchange in the national centers for environmental prediction ocean model. J. Geophysical Res.104, 11,065–11,076. doi: 10.1029/1999JC900024
5
Huang R. X. Qiu B. (1994). Three-dimensional structure of the wind-driven circulation in the subtropical north pacific. J. Phys. Oceanography24, 1608–1622. doi: 10.1175/1520-0485(1994)024<1608:TDSOTW>2.0.CO;2
6
Johnson G. C. McPhaden M. J. (1999). Interior pycnocline flow from the subtropical to the equatorial pacific ocean. J. Phys. Oceanography29, 3073–3098. doi: 10.1175/1520-0485(1999)029<3073:IPFFTS>2.0.CO;2
7
Large W. G. McWilliams J. C. Doney S. C. (1994). Oceanic vertical mixing: A review and a model with nonlocal boundary layer parameterization. Rev. Geophysics.32, 363–403. doi: 10.1029/94RG01872
8
Liu Z. (1999). Forced planetary wave response in a thermocline gyre. J. Phys. Oceanography29, 1036–1055. doi: 10.1175/1520-0485(1999)029<1036:FPWRIA>2.0.CO;2
9
Lu J. Liu Q. (2013). Gap-leaping kuroshio and blocking westward-propagating rossby wave and eddy in the Luzon strait. J. Geophysical Research- Oceans118, 1170–1181. doi: 10.1002/jgrc.20116
10
McGillicuddy D. J. (2015). Formation of intrathermocline lenses by eddy-wind interaction. J. Phys. Oceanography45, 606–612. doi: 10.1175/JPO-D-14-0221.1
11
Nan F. He Z. Zhou H. Wang D. (2011a). Three long-lived anticyclonic eddies in the northern south China Sea. J. Geophysical Res.116, C05002. doi: 10.1029/2010JC006790
12
Nan F. Xue H. Xiu P. Chai F. Shi M. Guo P. (2011b). Oceanic eddy formation and propagation southwest of Taiwan. J. Geophysical Res.116, C12045. doi: 10.1029/2011JC007386
13
Nan F. Xue H. Yu F. (2015). Kuroshio intrusion into the south China Sea: A review. Prog. Oceanography137, 314–333. doi: 10.1016/j.pocean.2014.05.012
14
Nan F. Yu F. Wei C. Ren Q. Fan C. (2017). Observations of an extra-Large subsurface anticyclonic eddy in the northwestern pacific subtropical gyre. J. Mar. Science: Res. Dev.7, 234. doi: 10.4172/2155-9910.1000234
15
Nishikawa S. Tsujino H. Sakamoto K. Nakano H. (2010). Effects of mesoscale eddies on subduction and distribution of subtropical mode water in an eddy-resolving OGCM of the Western North Pacific. J. Phys. Oceanogr.40, 1748–1765.
16
Nonaka M. Xie S.-P. Sasaki H. (2012). Interannual variations in low potential vorticity water and the subtropical countercurrent in an eddy-resolving OGCM. J. Oceanography68, 139–150. doi: 10.1007/s10872-011-0042-3
17
Oka E. Suga T. Sukigara C. Toyama K. Shimada K. Yoshida J. (2011). “Eddy resolving” observation of the north pacific subtropical mode water. J. Phys. Oceanography41 (4), 666–681. doi: 10.1175/2011JPO4501.1
18
Qu T. (2002). Evidence of water exchange between the south China Sea and the pacific through the Luzon strait. Acta Oceanol. Sin.21, 175–185.
19
Qu T. Kim Y. Yaremchuk M. Tozuka T. Ishida A. Yamagata T. (2004). Can Luzon strait transport play a role in conveying the impact of ENSO to the south China Sea? J. Clim.17, 3644–3657. doi: 10.1175/1520-0442(2004)017<3644:CLSTPA>2.0.CO;2
20
Qu T. Mitsudera H. Yamagata T. (2000). Intrusion of the north pacific waters into the south China Sea. J. Geophys. Res.105, 6415–6424. doi: 10.1029/1999JC900323
21
Sasaki H. Nonaka M. Masumoto Y. Sasai Y. Uehara H. Sakuma H. et al . (2008). “An eddy-resolving hindcast simulation of the quasiglobal ocean from 1950 to 2003 on the earth simulator,” in Chap. 10High-resolution numerical modelling of the atmosphere and ocean. Eds. HamiltonK.OhfuchiW. (N. Y: Springer), 157–185.
22
Sheu W. J. Wu C. R. Oey L. Y. (2010). Blocking and westward passage of eddies in the Luzon strait. Deep-Sea Res. II57, 1783–1791. doi: 10.1016/j.dsr2.2010.04.004
23
Shi F. Luo Y. Xu L. (2018). Volume and transport of eddy-trapped mode water south of the kuroshio extension. J. Geophysical Research: Oceans123, 8749–8761. doi: 10.1029/2018JC014176
24
Taguchi B. Qiu B. Nonaka M. Sasaki H. Xie S. P. Schneider N. (2010). Decadal variability of the kuroshio extension: mesoscale eddies and recirculations. Ocean Dynamics60, 673–691. doi: 10.1007/s10236-010-0295-1
25
Tian J. Yang Q. Liang X. Xie L. Hu D. Wang F. (2006). Observation of Luzon strait transport. Geophys. Res. Lett.33, L19607. doi: 10.1029/2006GL026272
26
Uehara H. Suga T. Hanawa K. Shikama N. (2003). A role of eddies in formation and transport of north pacific subtropical mode water. Geophysical Res. Lett.30 (13), 1705. doi: 10.1029/2003GL017542
27
Wang R. Nan F. Yu F. Wang B. (2022). Impingement of subsurface anticyclonic eddies on the kuroshio mainstream east of Taiwan. J. Geophysical Res. - Oceans127 (11), e2022JC018950. doi: 10.1029/2022JC018950
28
Wang G. Su J. Chu P. (2003). Mesoscale eddies in the south China Sea observed with altimeter data. Geophys. Res. Lett.30 (21), 2121. doi: 10.1029/2003GL018532
29
Wang Q. Zeng L. Chen J. He Y. Zhou W. Wang D. (2020). The linkage of kuroshio intrusion and mesoscale eddy variability in the northern south China Sea: Subsurface speed maximum. Geophysical Res. Lett.46, e2020GL087034. doi: 10.1029/2020GL087034
30
Xiao F. A. Zeng L. L. Liu Q. Y. Zhou W. & Wang D. X. (2018). Extreme subsurface warm events in the south China Sea during 1998/99 and 2006/07: Observations and mechanisms. Climate Dynamics50, 115–128. doi: 10.1007/s00382-017-3588-y
31
Xie L. Tian J. Zhang S. (2011). An anticyclonic eddy in the intermediate layer of the Luzon strait in autumn 2005. J. Oceanogr.67, 37–46. doi: 10.1007/s10872-011-0004-9
32
Xu L. Xie S.-P. Liu Q. Liu C. Li P. Lin X. (2017). Evolution of the north pacific subtropical mode water in anticyclonic eddies. J. Geophysical Research: Oceans122, 10,118–10,130. doi: 10.1002/2017JC013450
33
Xu L. Xie S.-P. McClean J. L. Liu Q. Sasaki H. (2014). Mesoscale eddy effects on the subduction of north pacific mode waters. J. Geophyical Research-Oceans119, 4867–4886. doi: 10.1002/2014JC009861
34
Xue H. J. Chai F. Pettigrew N. R. Xu D. Y. Shi M. C. Xu J. P. (2004). Kuroshio intrusion and the circulation in the south China Sea. J. Geophysical Res.109, C02017. doi: 10.1029/2002JC001724
35
Yu K. Qu T. (2013). Imprint of the pacific decadal oscillation on the south China Sea throughflow variability. J. Clim26, 9797–9805. doi: 10.1175/JCLI-D-12-00785.1
36
Yu K. Qu T. Dong C. Yan Y. (2015). Effect of subtropical mode water on the decadal variability of the subsurface transport through the Luzon strait in the western pacific ocean. J. Geophysical Res. - Oceans120, 6829–6842. doi: 10.1002/2015JC011016
37
Yuan D. Han W. Hu D. (2007). Anti-cyclonic eddies northwest of Luzon in summer-fall observed by satellite altimeters. Geophys. Res. Lett.34, L13610. doi: 10.1029/2007GL029401
38
Yuan Y. Liao G. Guan W. Wang H. Lou R. Chen H. (2008). The circulation in the upper and middle layers of the Luzon strait during spring 2002. J. Geophysical Res.113, C06004. doi: 10.1029/2007JC004546
39
Zeng L. Wang D. Xiu P. Shu Y. Wang Q. Chen J. (2016). Decadal variation and trends in subsurface salinity from 1960 to 2012 in the northern south China Sea. Geophysical Res. Lett.43 (12), 181–112. doi: 10.1002/2016GL071439
40
Zhang Z. Wang W. Qiu B. (2014). Oceanic mass transport by mesoscale eddies. Science345, 322–324. doi: 10.1126/science.1252418
41
Zhao R. X. Zhu X. H. (2016). Weakest winter south China Sea western boundary current caused by the 2015-2016 El niño event. J. Geophysical Research: Oceans121, 7673–7682. doi: 10.1002/2016JC012252
Summary
Keywords
subtropical mode water, South China Sea, Luzon Strait (LS), mesoscale eddy, low potential vorticity water
Citation
Wang R, Ren Q, Nan F and Yu F (2023) A relay of anticyclonic eddies transferring North Pacific subtropical mode water into the South China Sea. Front. Mar. Sci. 10:1106721. doi: 10.3389/fmars.2023.1106721
Received
24 November 2022
Accepted
30 March 2023
Published
19 April 2023
Volume
10 - 2023
Edited by
Meilin Wu, South China Sea Institute of Oceanology (CAS), China
Reviewed by
Yongchui Zhang, National University of Defense Technology, China; Manuel Ruiz Villarreal, Centro Oceanográfico da Coruña, (CSIC), Spain; Yi Xu, East China Normal University, China
Updates
Copyright
© 2023 Wang, Ren, Nan and Yu.
This is an open-access article distributed under the terms of the Creative Commons Attribution License (CC BY). The use, distribution or reproduction in other forums is permitted, provided the original author(s) and the copyright owner(s) are credited and that the original publication in this journal is cited, in accordance with accepted academic practice. No use, distribution or reproduction is permitted which does not comply with these terms.
*Correspondence: Fei Yu, yuf@qdio.ac.cn; Feng Nan, nanfeng0515@qdio.ac.cn
This article was submitted to Marine Ecosystem Ecology, a section of the journal Frontiers in Marine Science
Disclaimer
All claims expressed in this article are solely those of the authors and do not necessarily represent those of their affiliated organizations, or those of the publisher, the editors and the reviewers. Any product that may be evaluated in this article or claim that may be made by its manufacturer is not guaranteed or endorsed by the publisher.