 Elodie Portanier1*
 Amandine Nicolle1,2
 Willi Rath3
 Lorraine Monnet1
 Gregoire Le Goff2
 Anne-Sophie Le Port1
 Claire Daguin-Thiébaut1
 Cheryl L. Morrison4
 Marina R. Cunha5
 Melissa Betters6
 Craig M. Young7
 Cindy L. Van Dover8
 Arne Biastoch3,9
 Eric Thiébaut1
 Didier Jollivet1*
- 1Sorbonne Université, Unité Mixte de Recherche 7144, Adaptation et Diversité en Milieu Marin, Station Biologique de Roscoff, Roscoff, France
- 2École Nationale Supérieure de Techniques Avancées (ENSTA) Bretagne, Hydrographie, Océanographie, Positionnement, Brest, France
- 3Research Division 1: Ocean Circulation and Climate Dynamics, GEOMAR Helmholtz Centre for Ocean Research Kiel, Kiel, Germany
- 4U.S. Geological Survey, Eastern Ecological Science Center, Leetown Research Laboratory, Kearneysville, WV, United States
- 5Department of Biology, University of Aveiro, Aveiro, Portugal
- 6Department of Biology, Temple University, Philadelphia, PA, United States
- 7Oregon Institute of Marine Biology, University of Oregon, Eugene, OR, United States
- 8Division of Marine Science and Conservation, Nicholas School of the Environment, Duke University, Beaufort, NC, United States
- 9Christian-Albrechts-Universität, Kiel, Germany
In highly fragmented and relatively stable cold-seep ecosystems, species are expected to exhibit high migration rates and long-distance dispersal of long-lived pelagic larvae to maintain genetic integrity over their range. Accordingly, several species inhabiting cold seeps are widely distributed across the whole Atlantic Ocean, with low genetic divergence between metapopulations on both sides of the Atlantic Equatorial Belt (AEB, i.e. Barbados and African/European margins). Two hypotheses may explain such patterns: (i) the occurrence of present-day gene flow or (ii) incomplete lineage sorting due to large population sizes and low mutation rates. Here, we evaluated the first hypothesis using the cold seep mussels Gigantidas childressi, G. mauritanicus, Bathymodiolus heckerae and B. boomerang. We combined COI barcoding of 763 individuals with VIKING20X larval dispersal modelling at a large spatial scale not previously investigated. Population genetics supported the parallel evolution of Gigantidas and Bathymodiolus genera in the Atlantic Ocean and the occurrence of a 1-3 Million-year-old vicariance effect that isolated populations across the Caribbean Sea. Both population genetics and larval dispersal modelling suggested that contemporary gene flow and larval exchanges are possible across the AEB and the Caribbean Sea, although probably rare. When occurring, larval flow was eastward (AEB - only for B. boomerang) or northward (Caribbean Sea - only for G. mauritanicus). Caution is nevertheless required since we focused on only one mitochondrial gene, which may underestimate gene flow if a genetic barrier exists. Non-negligible genetic differentiation occurred between Barbados and African populations, so we could not discount the incomplete lineage sorting hypothesis. Larval dispersal modelling simulations supported the genetic findings along the American coast with high amounts of larval flow between the Gulf of Mexico (GoM) and the US Atlantic Margin, although the Blake Ridge population of B. heckerae appeared genetically differentiated. Overall, our results suggest that additional studies using nuclear genetic markers and population genomics approaches are needed to clarify the evolutionary history of the Atlantic bathymodioline mussels and to distinguish between ongoing and past processes.
1 Introduction
In marine species with a bentho-pelagic life cycle, the maintenance of a single panmictic population over the species range often depends on hydrodynamics, the duration of the pelagic larval phase, the larval behavior, the energetic investment in reproduction, the number of larvae produced, and the availability of suitable habitats (Gaines et al., 2007; Cowen and Sponaugle, 2009). In fragmented and unstable environments, the functioning of a metapopulation depends primarily on an equilibrium between migration and local extinction (Lande, 1988; Harrison and Hastings, 1996) in which the process of habitat recolonization strongly influences the genetic heterogeneity of the species (McCauley, 1991, Pannell and Charlesworth, 1999). Indeed, when local populations become extinct at regular time intervals as may occur in unstable environments, self-recruitment may be insufficient to ensure population and species persistence. Migration then becomes essential, with inward migration contributing to population replenishment and outward migration allowing the colonization of new territories or habitats. In marine environments, such processes are often dependent on the pelagic larval phase (Scheltema, 1986; Roughgarden et al., 1988; Cowen and Sponaugle, 2009; Shanks, 2009). Global changes and anthropogenic impacts have been observed even in the deepest marine ecosystems, and habitat disturbance through climate change, pollution, mining, oil and gas extraction, net trawling, etc. can alter larval connectivity by modifying local hydrodynamics, reducing population sizes and fragmenting habitats (e.g., Baco et al., 2010; Adams et al., 2012; Van Dover, 2014; Levin and Le Bris, 2015; Le Bris et al., 2017; Vilela et al., 2022). It thus appears crucial to investigate larval dispersal and population connectivity and to identify the main corridors of gene flow in order to anticipate the potential impacts of human activities in deep sea ecosystems.
Using a probabilistic model of migration, Hamilton and May (1977) showed that it is always favorable for a species to disperse and establish at a respectable distance from the parental genotypes even when the habitat is stable and more or less continuous. It is, indeed, advantageous for a species to produce a number of migrants greater than half of its descendants in order to make its own genes persist, even if the cost of migration is very high (Hamilton and May, 1977). When the habitat is naturally fragmented and stable, local dynamics needs to be balanced by migration, or the size of patches (and thus their carrying capacity) must be sufficient to support each population: a situation rarely met. As a consequence, the optimal dispersal distance must be large enough to override the degree of habitat aggregation (Hamilton and May, 1977; Levin et al., 1984). Olivieri et al. (1995) pointed out, however, that a predictably perennial habitat with a very low frequency of occurrence may rapidly favor the coexistence of highly dispersive and non-dispersive stages. Indeed, dispersing individuals carrying “high-migration genotypes” will leave local populations and such genotypes will thus be rapidly lost in the local populations while they will be overrepresented in newly colonized sites (Olivieri et al., 1995). The two dispersal strategies may thus co-exist in a metapopulation as a result of opposite selective processes within and between populations. In the specific case of ‘nearly-passive’ dispersal (e.g. larval dispersal by ocean currents), the number of immigrants is often much smaller than the number of emigrants because a ‘long-distance’ propagule will have a low probability of finding a suitable settlement site (Shanks, 2009). In such a case, highly dispersive larvae are likely to be rapidly counter-selected for species with low to moderate fecundity living in rare perennial habitats; this might explain why many island-dwelling species have lost their ability to disperse (MacArthur and Wilson, 1967, Lejeusne and Chevaldonné, 2006) and/or have adopted a philopatric behavior (Maes and Volckaert, 2002).
When a habitat is fragmented and locally transient instead of persistent, the risk of local extinction may eventually cause the global extinction of a non-dispersive species. It is then reasonable to assume that the benefits of massive, long-term dispersal far outweigh the costs, especially when the rate of habitat turnover is rapid (McPeek and Holt, 1992). In theory, the migration rate of a species appears to be positively correlated with the availability of habitat and negatively correlated with its persistence (Doebeli and Ruxton, 1997; Travis and Dytham, 1999) although it is also sensitive to the geographic arrangement of patches in the landscape (Moilanen and Hanski, 1998). Species inhabiting frequently occurring but transient habitats are thus expected to show high migration rates and high dispersal distances (Travis and Dytham, 1999). Dormancy is also another means of survival for species living in fragmented and transient habitats (Levin et al., 1984). In plants, both dispersal and dormancy can confer advantages under different conditions: dormancy, when conditions are unfavorable and dispersal when conditions vary in space, but both are conditioned by natural fluctuations in the environment (Snyder, 2006). In the marine environment, these two processes can be more closely associated if the dormancy phase is integrated with the dispersal phase. An example is the case of the specialized vent worm Alvinella pompeiana since its larvae arrest their development until encountering the appropriate thermal conditions for adult survival (Pradillon et al., 2001). High migration rates and dispersal distances coupled with delayed metamorphosis may thus represent one of the most powerful evolutionary strategies for species persistence (Pechenik, 1990).
Cold seeps constitute a fragmented, more or less stable, reduced habitat along active and passive continental margins associated with gas/hydrocarbon or brine resurgence zones in all oceans (Hecker, 1985; Sibuet et al., 1988; MacDonald et al., 1989; Jollivet et al., 1990; Olu et al., 1997; Olu-Le Roy et al., 2004; Yao et al., 2022). These sites are distributed over a wide range of depths from a few hundred to more than 7300 meters (Fujikura et al., 1999), and are often separated by large geographic distances. These deep-sea habitats support a specialized fauna that relies on chemosynthesis with sulfur-oxidizing and/or methanotrophic bacteria (Fisher et al., 1987; Barry et al., 2002; Cordes et al., 2009; Duperron et al., 2012). As an adaptation to fragmentation and instability, species living there are likely to display larval stages favoring long distance dispersal, for instance, planktotrophic larvae that must ascend to the surface to feed (Lutz, 1988; Pond et al., 1997; Herring and Dixon, 1998; Arellano et al., 2014; Yahagi et al., 2017; Kim et al., 2022) or lecithotrophic larvae with large yolk reserves that can develop slowly in the deeper portions of the water column where conditions are oligotrophic and cold (Young, 1994; Chevaldonné et al., 1997; Marsh et al., 2001). They are thus good examples of theoretical predictions promoting long-term dispersal or no dispersal depending on environmental fluctuations and life-history traits constraints. Although many species are endemic to a given geographic area, fine-grained community analysis has shown that many cold-seep species have a relatively wide distribution (Van Dover et al., 2002; Olu et al., 2010; Cowart et al., 2013; LaBella et al., 2017) suggesting putative long-distance dispersal capabilities (Olu-Le Roy et al., 2007; Young et al., 2012; Teixeira et al., 2013; Arellano et al., 2014). In accordance, population genetics and molecular barcoding studies of seep species have suggested the possibility of a shared history between active margin faunas on both sides of the North Atlantic Ocean and/or ongoing connectivity (Andersen et al., 2004; Olu-Le Roy et al., 2007; Cowart et al., 2013; Teixeira et al., 2013; LaBella et al., 2017). The ecological importance of cold seeps as biodiversity hotspots and providers of ecosystem services (Levin et al., 2016) advocates more research on connectivity at ocean scales to assess their vulnerability to environmental changes and precisely define protected areas.
Discriminating between patterns of dispersion and determining how long and where a larva is able to travel in the water column is, however, not an easy task. In general, deep-sea larvae cannot be tracked directly in the field. The inference of dispersal often requires the coupling of several indirect approaches such as larval dispersal modelling using biophysical models, larval rearing in the laboratory and/or the analysis of genetic patterns of populations to estimate gene flow between them (Gilg and Hilbish, 2003; Young et al., 2012; Breusing et al., 2016; Mitarai et al., 2016; Handal et al., 2020; Breusing et al., 2021). To date, studies have not accurately determined the relative contribution of the demographic history of populations and of the contemporary exchanges via larval dispersal across the Atlantic Ocean to the genetic structure of species. However, the coupling of present-day population genetic connectivity with the ‘large-scale’ modelling of larval dispersal at different depths offers particularly promising prospects (Breusing et al., 2016; Breusing et al., 2021). While such coupling approach has been applied along the Mid-Atlantic Ridge (Breusing et al., 2016), no study yet focused on cross-Atlantic exchanges. The Atlantic Ocean monitoring program, through the H2020 iAtlantic project, made such a perspective possible. It allowed the use of both the Parcels v2.0 module (Delandmeter and van Sebille, 2019) of the VIKING20X ocean circulation model developed to investigate the evolution of the Atlantic meridional overturning circulation (AMOC) in the face of global warming (Hirschi et al., 2020; Biastoch et al., 2021) and the barcoding of samples from nearly all the existing collections of cold seep mussels from the American, African and European active margins. The aim of the present study was therefore to test the role of present-day long-term larval migration via surface currents in explaining the amphi-Atlantic distribution previously pointed out by Olu-Le Roy et al. (2007) for the two species complexes of seep mussels, namely Gigantidas childressi/G. mauritanicus (Gustafson et al., 1998; Génio et al., 2008) and Bathymodioulus boomerang/B. heckerae (Cosel and Olu, 1998; Gustafson et al., 1998). These species seem to be specific to cold seeps and have been sampled only once in seepages located near hydrothermal vents (e.g. Logatchev). They have never been observed in other reduced habitats such as sunken wood or whales falls, although the latter are thought to have played a role in the diversification of bathymodioline mussels creating intermediate habitats that drove evolution from shallow to deep ecosystems (Distel et al., 2000; Lorion et al., 2013). Here we thus aimed to locate putative dispersal corridors between the American and African/European margins and to determine whether long-term larval dispersal represents a viable strategy for population persistence. The distributions and genetic relationships of seep mussels were investigated by molecular barcoding using a portion of the mitochondrial Cytochrome c oxidase 1 gene (COI). This genetic structure was then compared to the expected larval dispersal patterns based on VIKING20X outputs for particles released from the bottom to the surface at several key seep localities with the longest possible pelagic larval duration of one year (as estimated by Arellano and Young, 2009 for G. childressi). While previous studies focused on the northern part of the Atlantic Ocean and/or relied on modelling or genetics only to estimate connectivity (e.g. Cordes et al., 2007; Olu-Le Roy et al., 2007; Young et al., 2012; McVeigh et al., 2017; Gary et al., 2020), we proposed here to combine both approaches at a spatial scale not yet investigated.
2 Material and methods
2.1 Sample collection, DNA extraction, COI amplification and sequencing
A unique collection of cold seep mussels was gathered from 14 different seeps on both side of the Atlantic Ocean (see Table 1 and Figure 1). Samples were collected during several oceanographic cruises that took place between 2006 and 2020 using remotely operated underwater vehicles (ROV) or human occupied underwater vehicles (HOV) (Table 1). Animals were either dissected on board and preserved in 96-100% ethanol or kept frozen at -80°C before being sent to the laboratory (Table 1). DNA was extracted from these frozen or ethanol-preserved tissues of foot, mantle or gills depending on their preservation state and availability. These extractions were performed using a 2% CTAB (Cetyl-trimethyl ammonium bromide)/1% PVP (Poly(n-vinyl-2 pyrolidone) protocol following the modified method of Doyle and Doyle (1987) proposed by Jolly et al. (2003). DNA pellets were then dried using a SpeedVac (ThermoFisher Scientific) and resuspended in 50 to 300µL (according to the size of the pellet) in 0.1X Tris-EDTA buffer. The quality of DNA samples was then checked by electrophoresis using a 0.8% agarose gel.
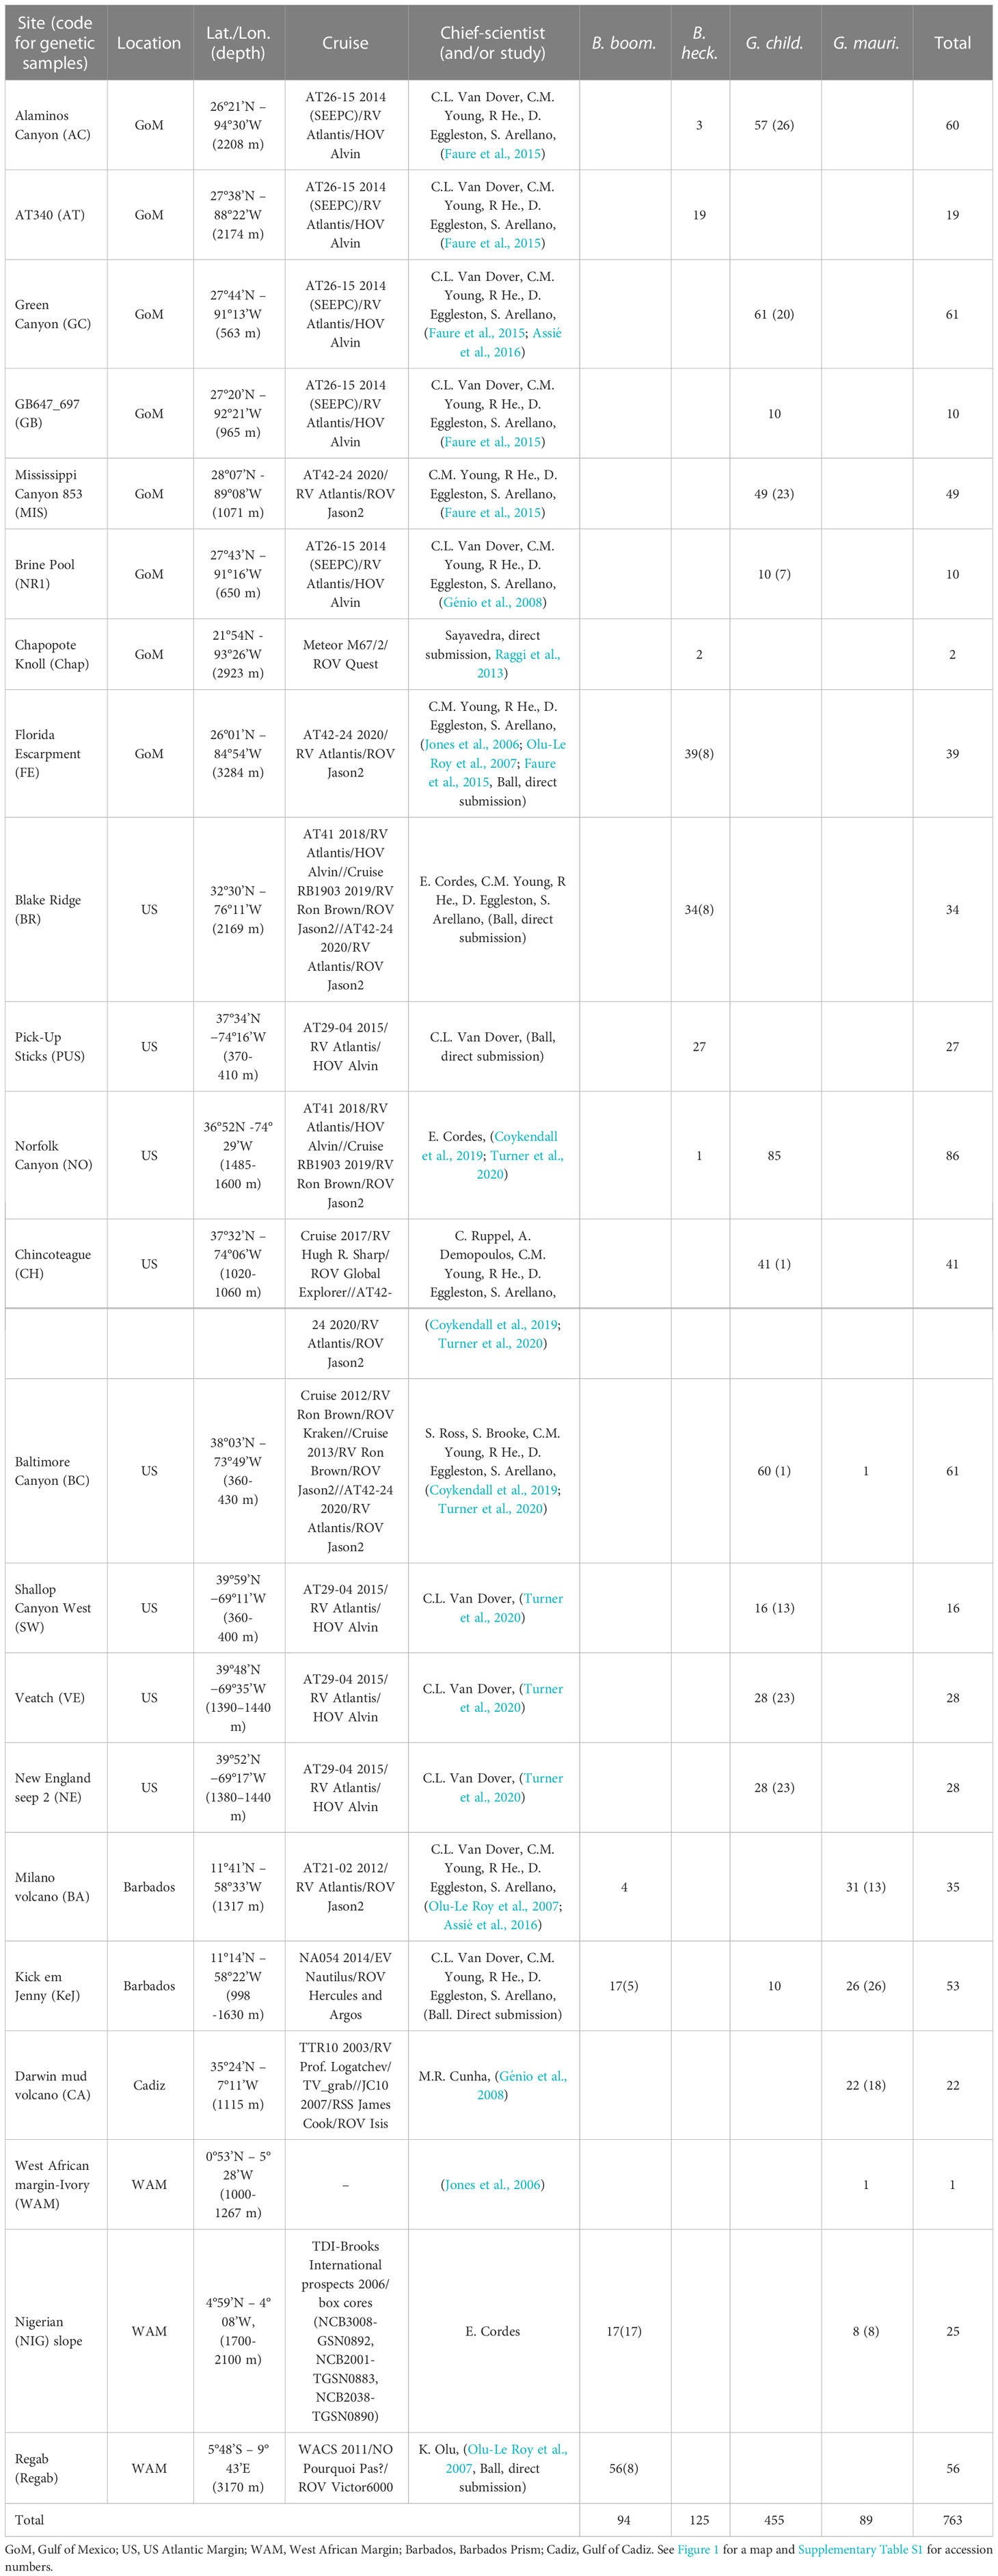
Table 1 Number and locations of all sequences used in analyses. The total numbers per site are reported as well as, within brackets, the number of newly sequenced individuals among this total number.
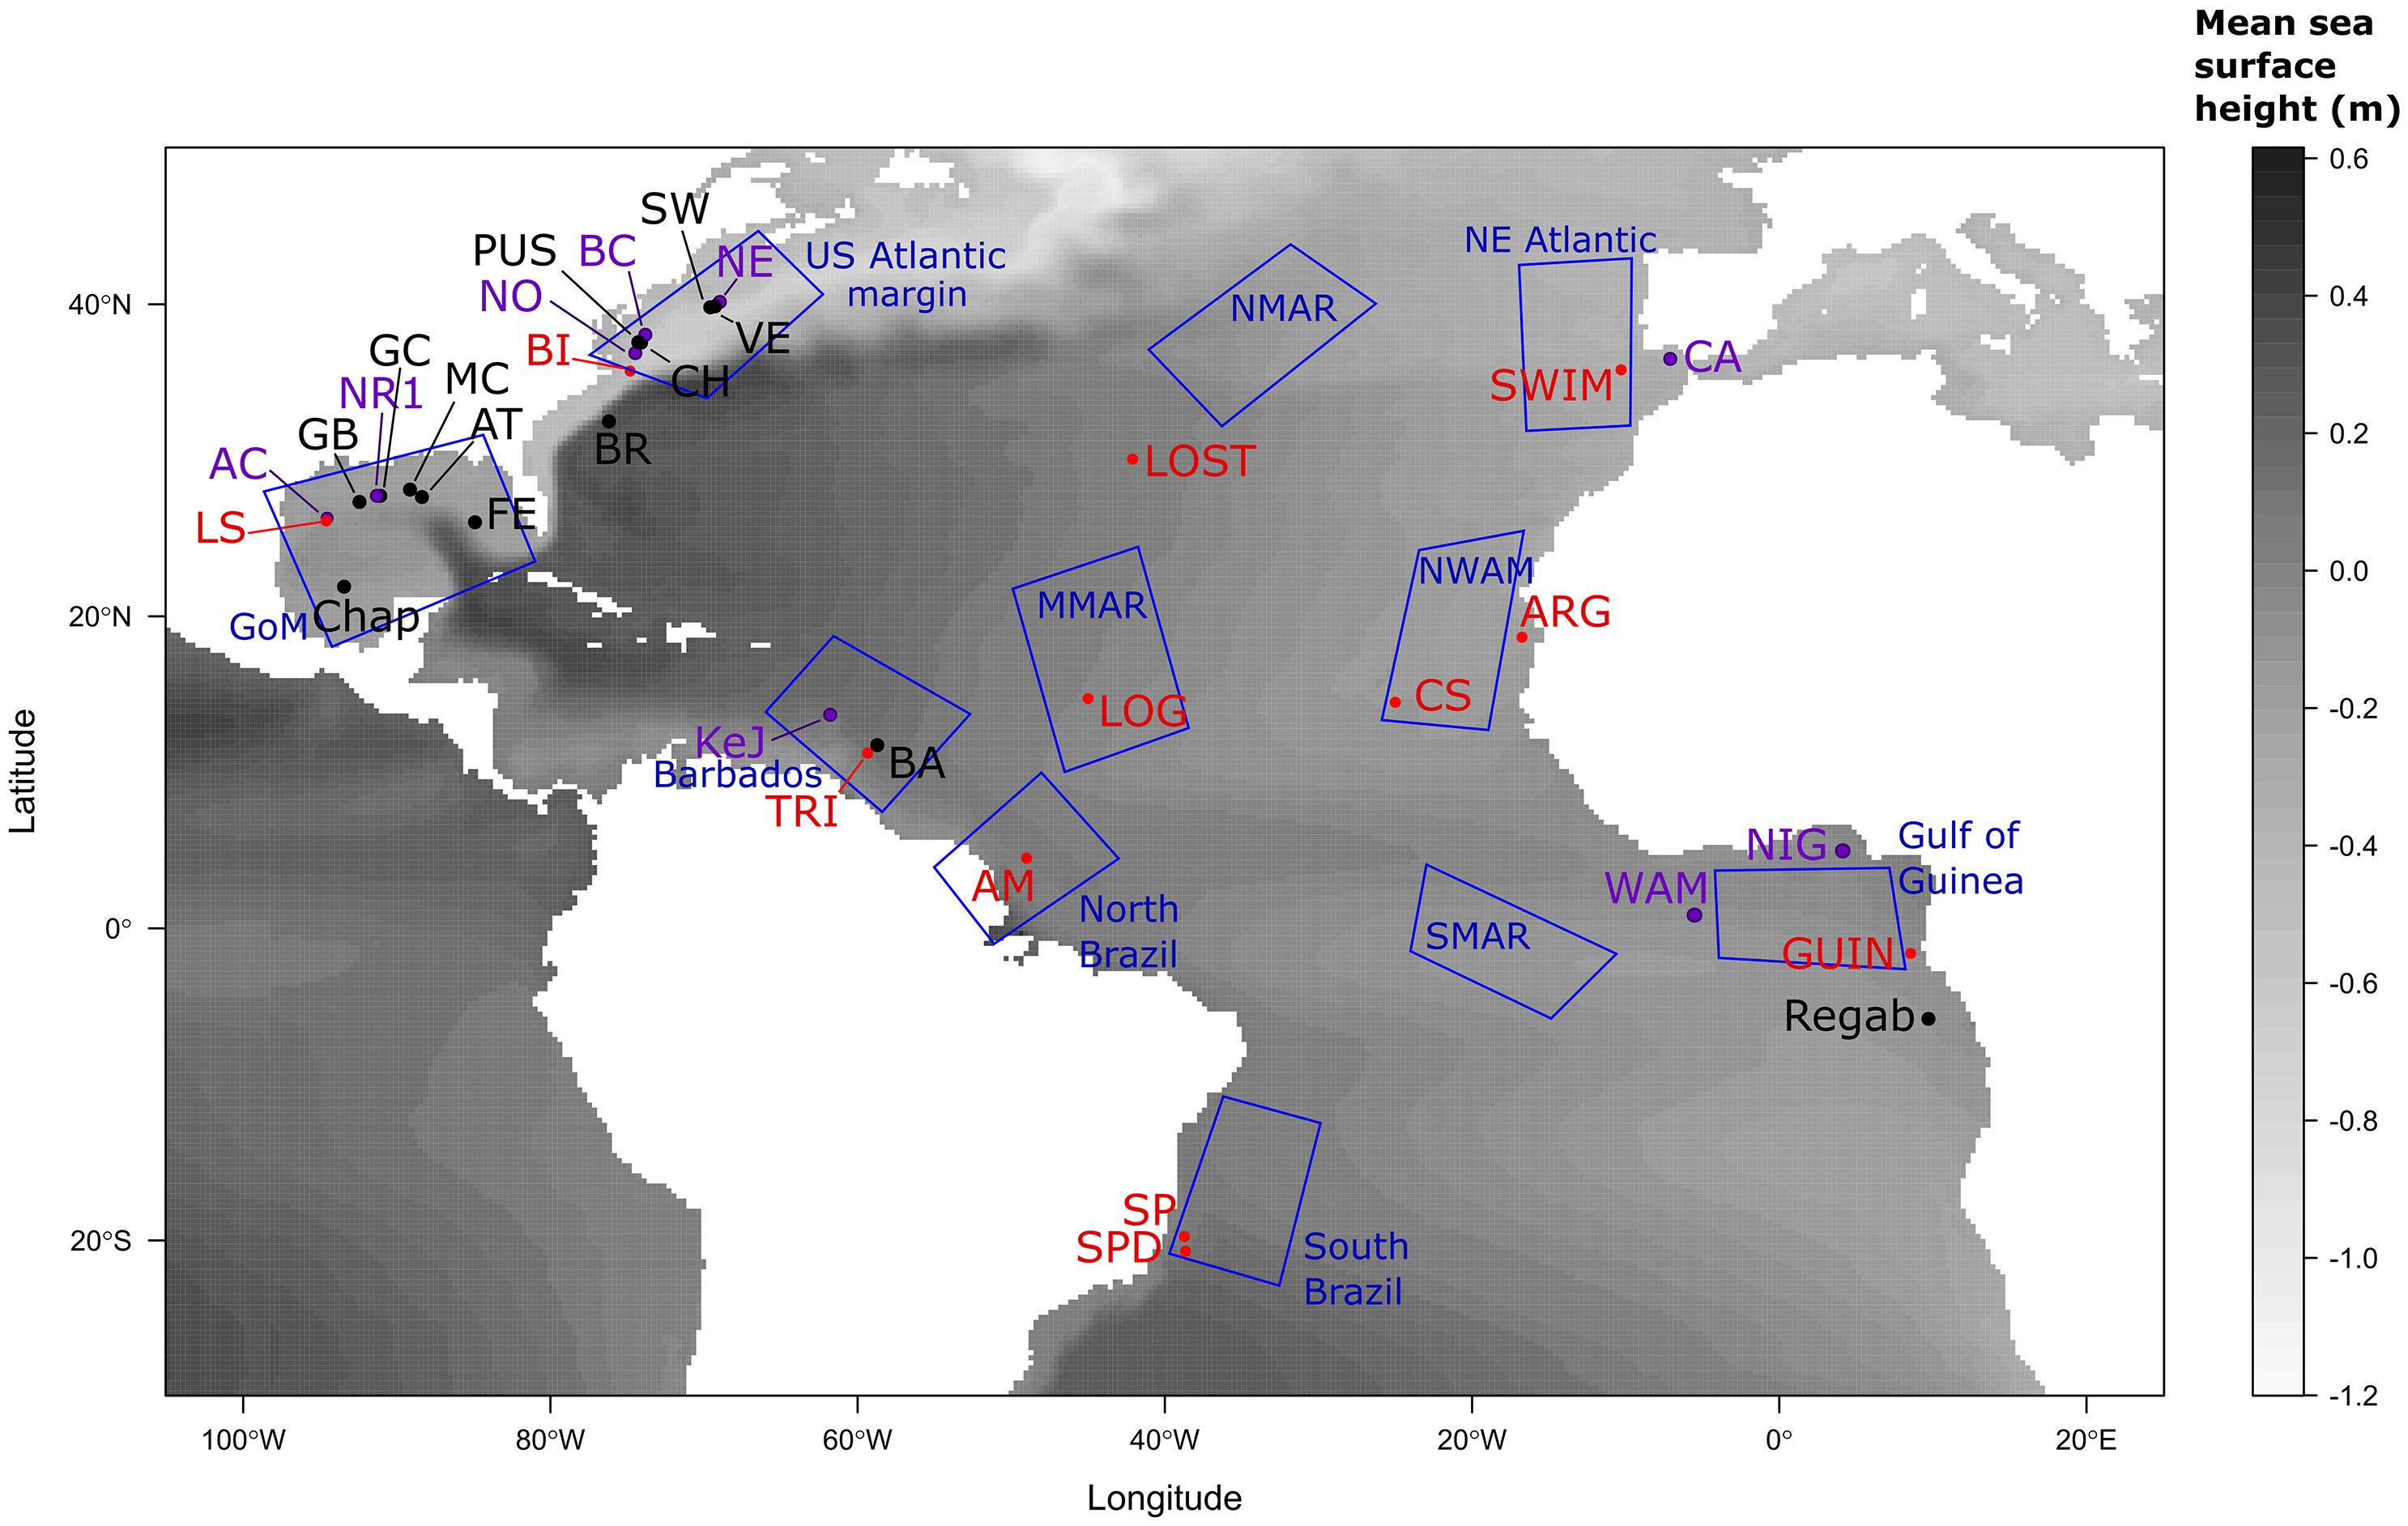
Figure 1 Geographic locations of seeps involved in the present study. Sites for which only genetic samples are available are in black, spawning areas used only in larval dispersal modelling are in red, sites used for both genetic and modelling approaches are in purple. Blue polygons represent settlement regions used in the modelling approach. Site abbreviations correspond to NR1, Brine Pool; LS, Louisiana slope; AC, Alaminos canyon; BI, Bodie island; NO, Norfolk canyon; BC, Baltimore canyon; NE, New England seeps; SWIM, SWIM Fault; CA, Gulf of Cadiz; ARG, Arguin bank; CS, Cadamostro seamount; NIG, Nigerian margin; WAM, West African margin; GUIN, Guiness; SP, Sao Paulo seep 1; SPD, Sao Paulo seep 2; AM, Amazon fan; TRI, Trinidad prism; KeJ, Kick em Jenny crater; LOG, Logatchev seep and LOST, Atlantis FZ (Lost City). Abbreviations of the zones for recruitment are: NWAM, North West African margin; NMAR, North Mid-Atlantic Ridge; MMAR, Middle Mid-Atlantic Ridge and SMAR, South Mid-Atlantic Ridge. Genetic samples were either obtained in the present study or included thanks to already published sequences (see Tables 1, 2; Supplementary Table S1).
The COI gene was then amplified using degenerated versions of original Folmer primers (Folmer et al., 1994) that were designed to allow a more efficient amplification of deep-sea mussel species: forward LCO1490Bathspp: 5’-GTTCTACRAAYCATAAAGAYATTGG-3’ and reverse HCO2198Bathspp: 5’-AACYTCTGGRTGVCCRAAAAACCA-3’. Polymerase chain reactions (PCRs) were performed in a final volume of 25 μL with 20-30 ng of DNA, 1X GoTaq® reaction buffer (Promega), 0.05 mg/ml Bovine Serum Albumin, 2 mM MgCl2, 0.12 mM of each dNTP, 0.6 μM of both forward and reverse primers and 1 U of GoTaq ® polymerase. The thermal profile consisted of 3 min of initial denaturation (94°C), followed by 35 cycles of denaturation (30 s, 94°C), annealing (30 s at 50°C) and extension (1 min, 72°C), with a final extension 10 min at 72°C. PCR products was checked on 1.5% agarose gel and sent for Sanger sequencing on both DNA strands at the Eurofins Laboratory (Ebersberg, Germany). For each individual, chromatograms were checked, edited when necessary (e.g. trimmed) and assembled into consensus sequences using CodonCode Aligner 3.6.1 (CodonCode, Dedham, MA, USA). Following this procedure, 248 sequences were obtained and used in subsequent analyses: 16 identified as B. heckerae, 30 identified as B. boomerang, 137 identified as G. childressi and 65 identified as G. mauritanicus (see Table 1; Supplementary Table S1; Figure 1 for specific locations and metadata of the samples – see also PANGAEA database, Jollivet et al., 2023 and European Nucleotide Archive database study PRJEB56597). This dataset was enriched with 515 publicly available sequences from GenBank for subsequent analyses (173 for B. heckerae/B. boomerang, 342 for G. childressi/G. mauritanicus, Table 1; Supplementary Table S1). All sequences (published and amplified from new individuals) were aligned within each species complex using Seaview v.4.7 (Gouy et al., 2010) and the MUSCLE algorithm (Edgar, 2004), and then trimmed to a final length of 449 bp for G. childressi/G. mauritanicus and 515 bp for B. heckerae/B. boomerang.
2.2 Species barcoding and population genetics analyses
First, taxonomic units were determined within each species complex using the Assemble-Species-by-Automatic-Partitioning method (ASAP; Puillandre et al., 2021) and the software web interface1. ASAP relies on the barcode gap detection approach developed by Puillandre et al. (2012) and uses pairwise distances from single-locus sequence alignments as well as a hierarchical clustering algorithm to identify the most probable partition of individuals in putative species. ASAP analyses were run using default parameter and pairwise distances calculated under the K2P substitution model. Then, haplotypes were determined using DnaSP v.6 (Rozas et al., 2017) and a minimum spanning haplotype network (Bandelt et al., 1999) was constructed using PopArt v.1.7 (Leigh and Bryant, 2015) to visually represent the relationships among haplotypes from different geographic locations within each species complex. DNAsp v.6 was then used to infer haplotype (Hd) and nucleotide (π) diversities for each sampled site within each species complex as well as the number of variable sites (S), the total number of mutations (Eta), the average number of nucleotide differences (k, Tajima, 1983) and the net genetic distances Da (Nei, 1987). Finally, pairwise Fst values from haplotype frequencies were computed between and within species using Arlequin 3.5.2.2 (Excoffier and Lischer, 2010). Significance compared to zero of Fst were assessed using 10 000 permutations. Exact tests of population differentiation with 10 000 dememorization steps and 100 000 steps in the Markov Chain were also performed at a threshold of 0.05. The pairwise Fst matrices were then used to construct heatmaps in R v.4.1.0 (R Core Team, 2021) to help visualizing genetic relationships between populations.
2.3 Estimating divergence time and gene flow
We also used the IMa3 program (Hey et al., 2018) which implements hierarchical Bayesian, Markov-chain Monte Carlo simulations of gene genealogies under an Isolation with Migration model to estimate splitting times, effective population and migration rates between multiple populations. The reference population topology (Supplementary Figure S1) used was constructed based on the haplotype networks and ASAP analyses. Four groups of populations could be distinguished (see Results): (1) the Gulf of Mexico (GoM), (2) the US Atlantic margin (US), (3) the African and European margins (Africa-Cadiz) and (4) the populations located on the Barbados Accretionary prism (Barbados-KeJ) (see Table 1 to find the name of localities associated with each group). Because mussels from GoM and US were geographically closer to each other than were individuals from Africa-Cadiz and Barbados-KeJ in both species’ complexes, we hypothesized T0 (splitting time between pop 0 and pop 1) to be more recent than T1 (splitting time between pop 2 and pop 3, see Supplementary Figure S1).
Analyses were performed on the whole dataset for B. heckerae/B. boomerang (GoM n = 63, US n = 62, Western African Margin n = 73, Barbados-KeJ n = 21) but, given the heterogeneous sample sizes for G. childressi/G. mauritanicus (GoM n = 187, US n = 259, Western African Margin-Cadiz n = 31, Barbados-KeJ n = 67), we subsampled the GoM and US population groups to n = 64 and n = 66, respectively. For each Gigantidas subsample, 60 individuals were randomly chosen and we then purposely added some individuals to make sure that the frequencies of shared haplotypes remained the same before and after the resampling. Indeed, since both GoM and US datasets were subsampled to around half their initial size, we verified that haplotype frequencies were not shifted after subsampling. The aim of such procedure was to prevent any subsampling-induced bias in parameter estimations, especially migration rates which are directly impacted by the distribution of haplotypes between populations. The G. childressi – G. mauritanicus intermediate individual (see results) from New England seep was however discarded from the analysis as it may represent a potential hybrid individual with a recombining sequence.
Since our dataset included a single locus, we used one MCMC chain (as recommended in IMa3 manual) with 10 million of sampled genealogies (-L 100 000 and -d 100) and 1 million of burn-in steps (-B). As recommended for mitochondrial loci, we used the HKY substitution model and an inheritance scalar of 0.25 (-h). The generation time was set to one year, as assumed for deep-sea bathymodioline mussels (Faure et al., 2009). For other deep-sea species, the substitution rate was estimated between 0.09% and 0.56% per million years (My) (Chevaldonné et al., 2002; Johnson et al., 2006; Faure et al., 2009; LaBella et al., 2017). We used the value of 0.4% per My to calculate the mutation rate per gene per year needed for IMa3 as (0.004*L)/1000000 with L being the length of the sequences used in IMa3 analyses (i.e. 449 bp for Gigantidas spp. and 515 bp for Bathymodiolus spp.). Parameter convergence was assessed by checking plots of parameter trends and marginal posterior probability distributions of the parameters, by checking the Effective Sample Size (ESS) and comparing estimates of the first and second halves of the sampled genealogies. We used the -p 3 option to print a histogram of splitting times divided by the prior distribution as recommended when there are two or more splitting times in the model. In order to identify the best uniform prior distribution of values, we started by running numerous tests with alternative maximal values (e.g. using hyperpriors or not and starting with IMa3 manual rules of q=5x, t=2x and m=2/x, with x = the nucleotide diversity of each group estimated from the Watterson’s θ using the DNAsp v.6 software). Final prior values used are shown in Table 2.
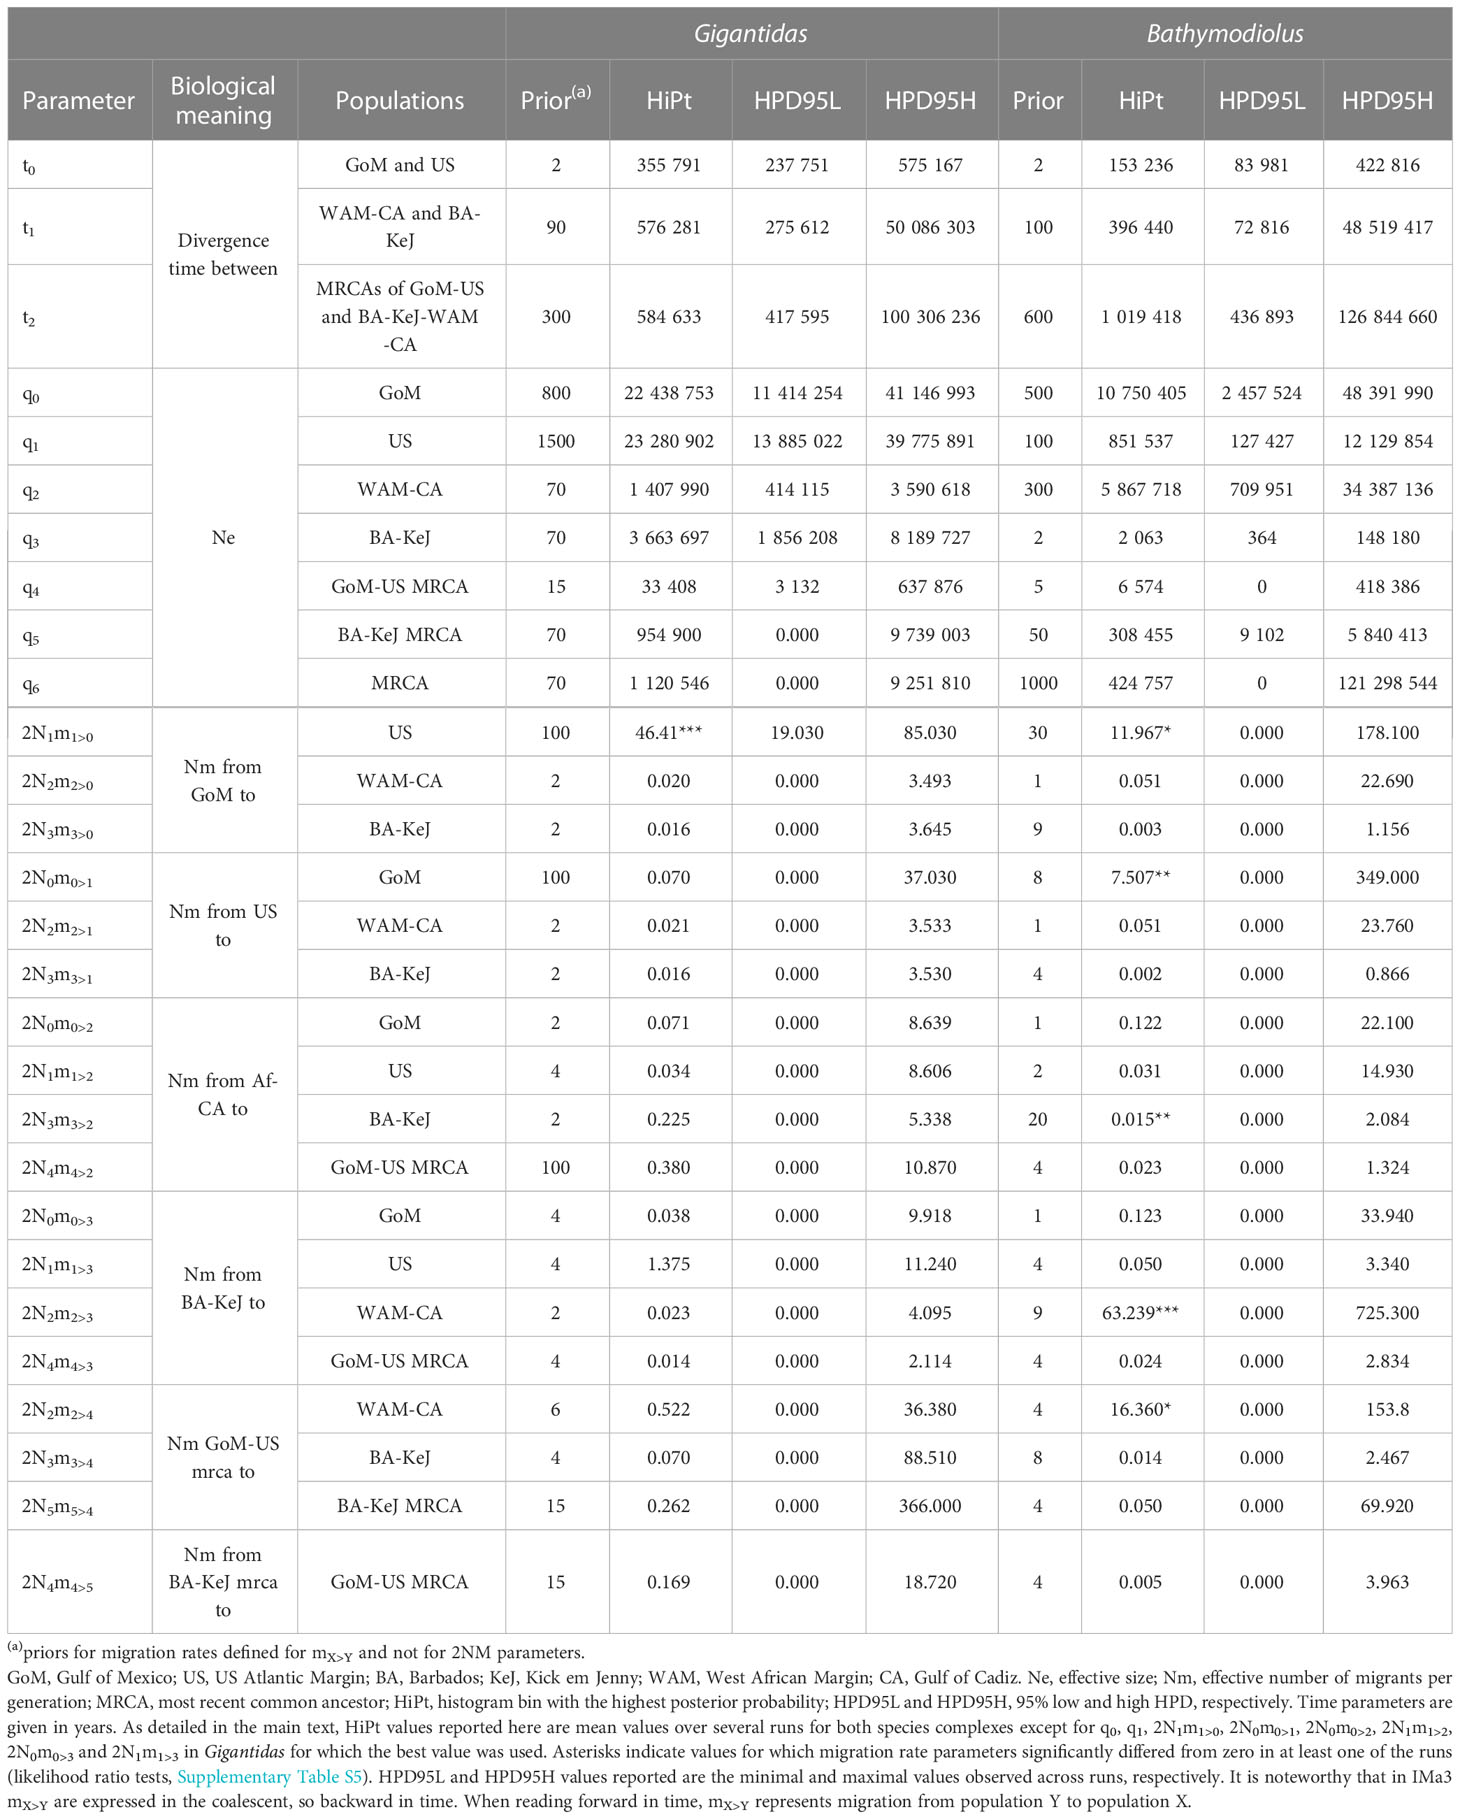
Table 2 Priors and estimates values of IMa3 demographic parameters for the two species complex.
After fixing prior values, we reran analyses for each species complex in triplicate using different seeds in order to make sure that parameter estimations were similar. For each run, parameter estimates were obtained from the highest posterior probabilities (HiPt) together with the 95% highest posterior density intervals (HPD) as confidence intervals. Final values reported in our results corresponded to the averaged values over the different replicates. Significance of migration rates was determined through log-likelihood-ratio tests implemented in IMa3. When migration rates were significantly different from zero in one run but not another, its significance level was reported in the results.
2.4 Numerical hydrodynamic model description
Modelling was performed using VIKING20X, an updated and expanded version of the VIKING20 ocean general circulation model aiming at hindcast simulations of Atlantic Ocean circulation variability on monthly to multi-decadal timescales and with a spatial resolution sufficient to capture mesoscale processes into subarctic latitudes (see a detailed description in Biastoch et al., 2021). VIKING20X is configured on the ORCA family of tripolar grids. The entire model domain covered the Atlantic Ocean from 33.5°S to ~65°N in latitude and from 100°W to 22°E in longitude with a horizontal resolution of 0.05°, nested into a global ocean-sea-ice model at 0.25° resolution and 46 geopotential z-levels along the depth-axis (Figure 1). The horizontal resolution increased with latitude from 5 km in tropical areas to 3 km in polar regions. Layer thickness increased with depth and varied from 6 m at the surface to 250 m in the deepest layers so that it optimizes the representation of the circulation in surface and subsurface waters at the detriment of the near-bottom circulation. Forced by the atmospheric dataset JRA55-do (Tsujino et al., 2018), VIKING20X has been shown to realistically simulate the large-scale horizontal circulation, the distribution of the mesoscale, overflow and convective processes, and the representation of regional current systems, including the western boundary current systems, in the North and South Atlantic (see Biastoch et al., 2021 and references therein). Five-day average fields of the three-dimensional velocities, potential temperature and salinity for the period 1980-2019 were provided by the model.
2.5 Larval dispersal modelling
Larval trajectories were modeled with the offline 3D Lagrangian code Parcels v2.0 (Probably A Really Computationally Efficient Lagrangian Simulator) based on the 3D velocities provided by the VIKING20X model (Delandmeter and van Sebille, 2019), a technique that is well established for physical and interdisciplinary applications in VIKING20X (e.g., Busch et al., 2021; Schmidt et al., 2021; Fox et al., 2022). Based on the current knowledge on the distribution of the two species complexes of deep-sea mussel populations, 17 spawning areas were defined in the North Atlantic along the coasts of North and South America, Europe and Western Africa (Figure 1; Supplementary Table S2). In these sites, the presence of bathymodioline mussels was confirmed or suspected in the present study or elsewhere (Gustafson et al., 1998; Cosel, 2002; Olu-Le Roy et al., 2007; Génio et al., 2008; Faure et al., 2015; Assié et al., 2016; Fujikura et al., 2017; Ketzer et al., 2018; Coykendall et al., 2019; Ruppel et al., 2019; Turner et al., 2020, see Supplementary Table S2 for details). Four additional sites where cold seeps were reported or could be present were added: two along the Mid-Atlantic Ridge (Logatchev and Lost City sites, Gebruk et al., 2000; Brazelton et al., 2006; Proskurowski et al., 2008; LaBella et al., 2017), the Cadamostro Seamount off the Cape Verde Islands, and the South West Iberian Margin Fault Zone (SWIM Fault Zone). Since indices of presence of diffuse hydrothermalism on seamounts were found during iMirabilis2 iAtlantic cruise (2021), these two last sites could act as gateway populations.
The number of released particles during each spawning event needs to be sufficient to properly reproduce distribution of drifting particles including planktonic larvae at regional scale so that no significant changes are reported in the mean characteristics of the dispersal kernel and larval trajectories as the number of particles is increased (Jones et al., 2016; Van Sebille et al., 2018). Preliminary simulations were performed with 1000, 2000, 5000 and 10 000 released larvae on a few spawning areas and showed that spreading of the larval population and maximum larval dispersal distance were not altered when more than 2000 larvae were released. Then, conservatively, for each spawning area defined as a polygon of 0.08° in latitude and longitude, 10 000 larvae were randomly released at each spawning date in near-bottom waters (i.e. specifically at approx. 10 m above the bottom of the simulated Ocean, Table 3). Larvae were released monthly during a unique spawning event that occurred the 1st day of each month from November to March during the natural spawning period of G. childressi (Tyler et al., 2007), from 2014 to 2019 to consider year-to-year variations in current patterns. Biological characteristics of larvae in terms of Pelagic Larval Duration (PLD), behavior and mortality were defined according to field observations and laboratory experiments performed on G. childressi in the GoM. After the spawning, the position of each simulated larva was tracked over one year (i.e. 365 days, Table 3) which corresponds to the maximum PLD of G. childressi (Arellano and Young, 2009). The choice of a high value of PLD was made in order to model extreme dispersal events likely to impact genetic structures and promote trans-Atlantic dispersal. After release in the near bottom layer, larvae could swim vertically to reach surface and subsurface waters at a velocity of 0.2 mm.s-1 (Table 3), a velocity in agreement with swimming speed of G. childressi trochophores observed in experimental chambers (Arellano, 2008). Although no data were available for veligers of G. childressi or other bathymodioline species, Chia et al. (1984) reported a mean swimming velocity of 0.2 mm.s-1 for bivalve larvae. When they reached a depth of 200 m, larvae stopped swimming. This larval behavior was defined to mimic the vertical distribution of larvae mainly sampled in the first 100 m in the GoM and sometimes up to 550 m deep (Arellano et al., 2014). Laboratory experiments showed that normal larval development occurred between 7 and 15°C and that survival did not differ significantly between 7 and 20°C before decreasing at 25°C (Arellano and Young, 2009; Arellano and Young, 2011; Arellano et al., 2014). Accordingly, we assumed that larvae died when they reached a temperature of 20°C. No other source of larval mortality was considered (Table 3).
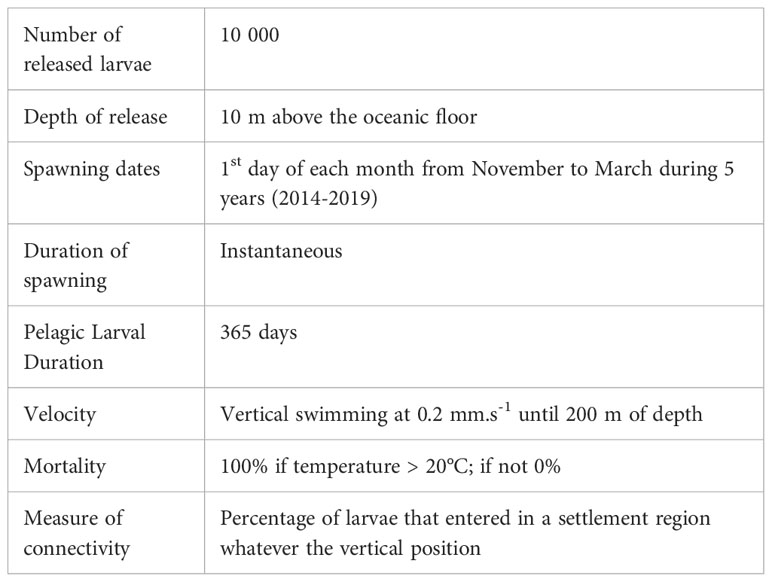
Table 3 Summary of larval characteristics used in the larval dispersal modelling using VIKING20X.
Due to the highly aggregated and localized distribution of cold seepage environments and the lack of knowledge about the behavior of bathymodioline mussel larvae during settlement, connectivity was not assessed among cold seeps locations but among 11 large settlement regions of 106 km2. These large regions contained one or more cold seeps locations already documented or are likely to contain cold seeps along the American, African and European active margins and along the mid-Atlantic Ridge. They include the GoM, the US Atlantic margin, the North Eastern Atlantic, the North West African margin, the Gulf of Guinea, the South and North Brazil, the Barbados Prism, the North mid-Atlantic ridge, the Middle mid-Atlantic Ridge and the South mid-Atlantic Ridge (Figure 1). The connectivity, that describes the exchange rate between distant populations, was calculated as the percentage of larvae released from one spawning area (i.e. source population) that entered in a settlement region (i.e. sink region) at the end of the PLD, whatever the vertical position of larvae. The retention rate corresponded to the percentage of larvae released from one spawning area that remains in the settlement region to which the spawning area belongs at the end of the PLD. To analyze the dispersal patterns resulting from our numerical experiments at the end of the PLD, two parameters describing the 2D dispersal kernels, i.e. the density of larvae at a given location normalized by the number of released particles, were retained following Edwards et al. (2007): the mean dispersal distance (D) and the isotropy of the larval population (I). The isotropy depends on the overall inertia which characterizes the variance of the larval distribution around the mean geographic position of the larval population. Inertia can be decomposed into two orthogonal axes representing the maximum (Imax) and the minimum (Imin) parts of the overall inertia. These parameters were calculated by a principal component analysis performed on the ending positions of larvae. Isotropy was then defined as the square root of the ratio between Imax and Imin.
3 Results
3.1 Haplotype networks and genetic diversities within groups
Within the Gigantidas species complex, 144 haplotypes (among which 42 are new) were identified out of 544 barcoded individuals. Within the Bathymodiolus species complex, only 43 haplotypes (among which 10 are new) were evidenced for 219 samples. The number of variable sites (S) was 100 for the former and 38 for the latter, with a total number of mutations of 112 and 39, respectively. The average number of nucleotide differences (k) was also higher in Gigantidas spp. than in Bathymodilus spp. (k = 5.18 and 3.70, respectively). Accordingly, although haplotype diversity was comparable between Gigantidas spp. and Bathymodilus spp., nucleotide diversity was almost twice as high in Gigantidas spp. for the whole set of samples (Table 4). The haplotype networks showed the presence of two distinct geographic lineages within each species complex (Figures 2, 3). The higher number of nucleotide differences observed between the two Gigantidas lineages as compared to the two Bathymodiolus lineages was well illustrated by haplotype network reconstructions with 7 and 3 fixed substitutions, respectively (Figures 2, 3). This corresponded to the net genetic distances (Da) we observed since maximal values occurred between lineages, and values were higher between G. childressi/G. mauritanicus (≈ 0.02) than between B. heckerae/B. boomerang (≈ 0.01, Table 5). The divergence between B. heckerae/B. boomerang from the Barbados-KeJ and the US Atlantic margin was, however, slightly lower than that between the African margin and the GoM/US Atlantic margin (Table 5).
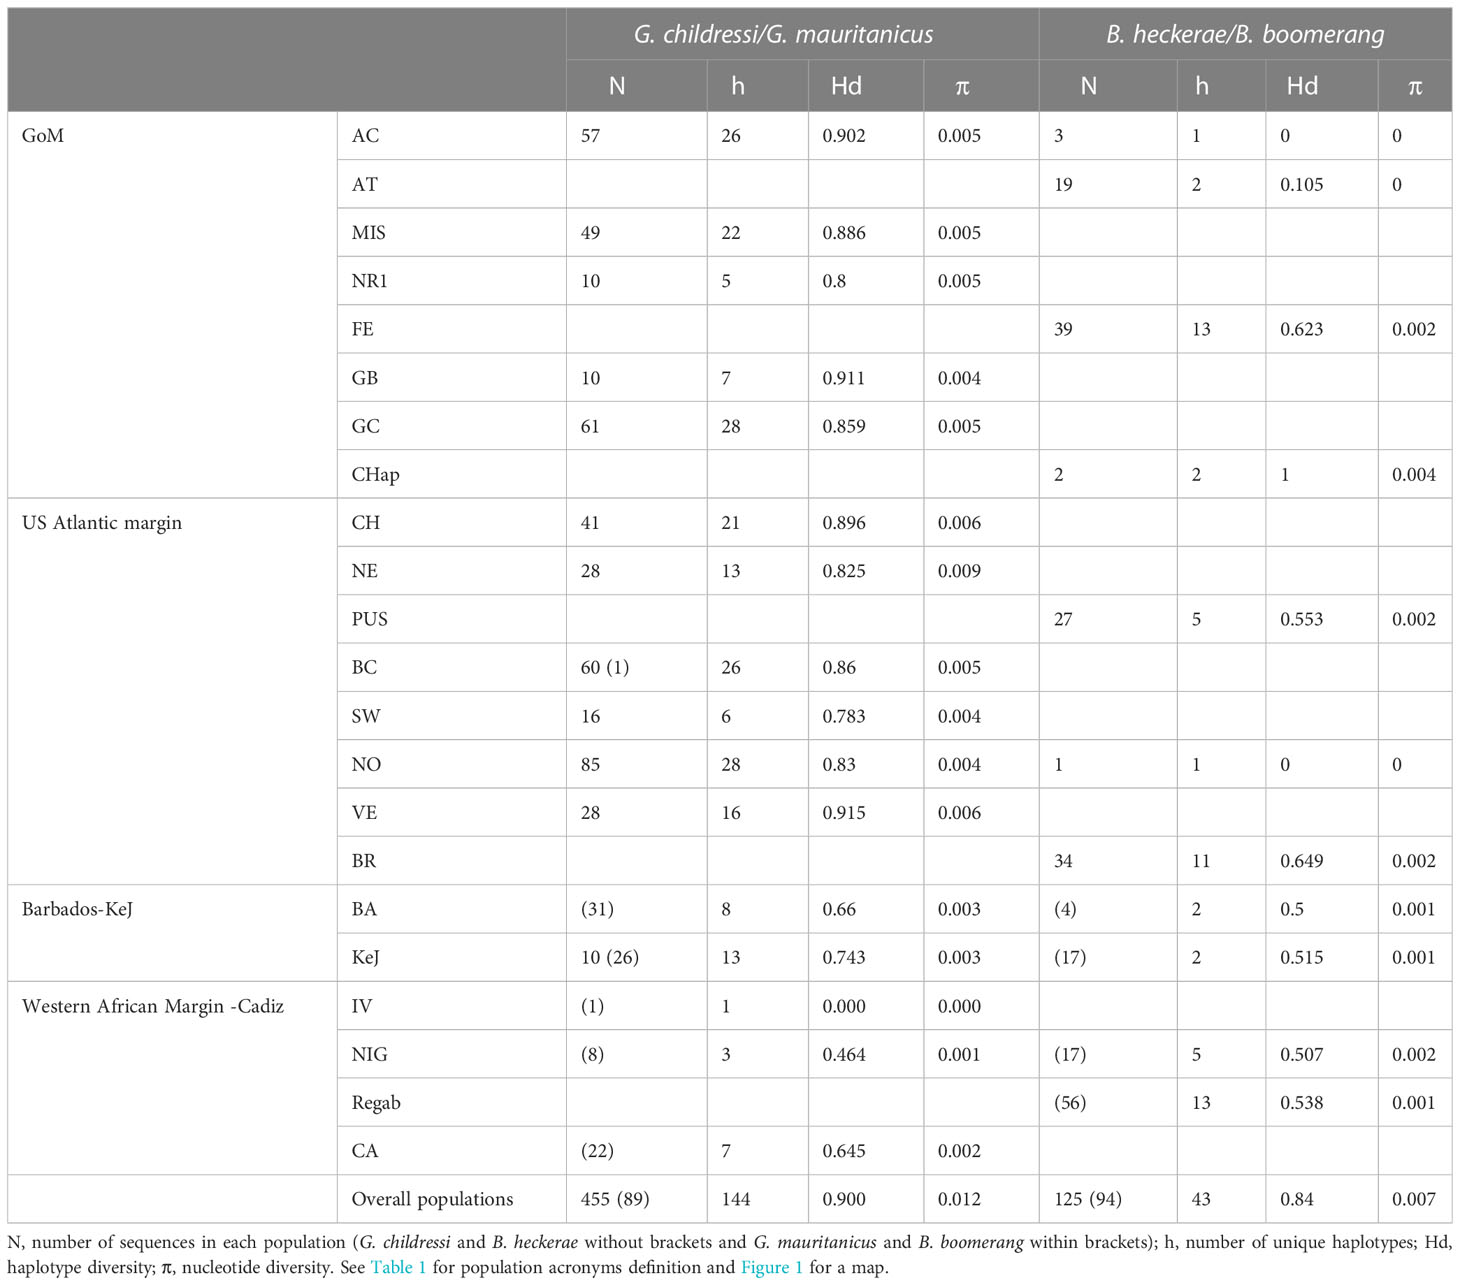
Table 4 Variation of COI nucleotides sequences for each species complex and each sampling site.
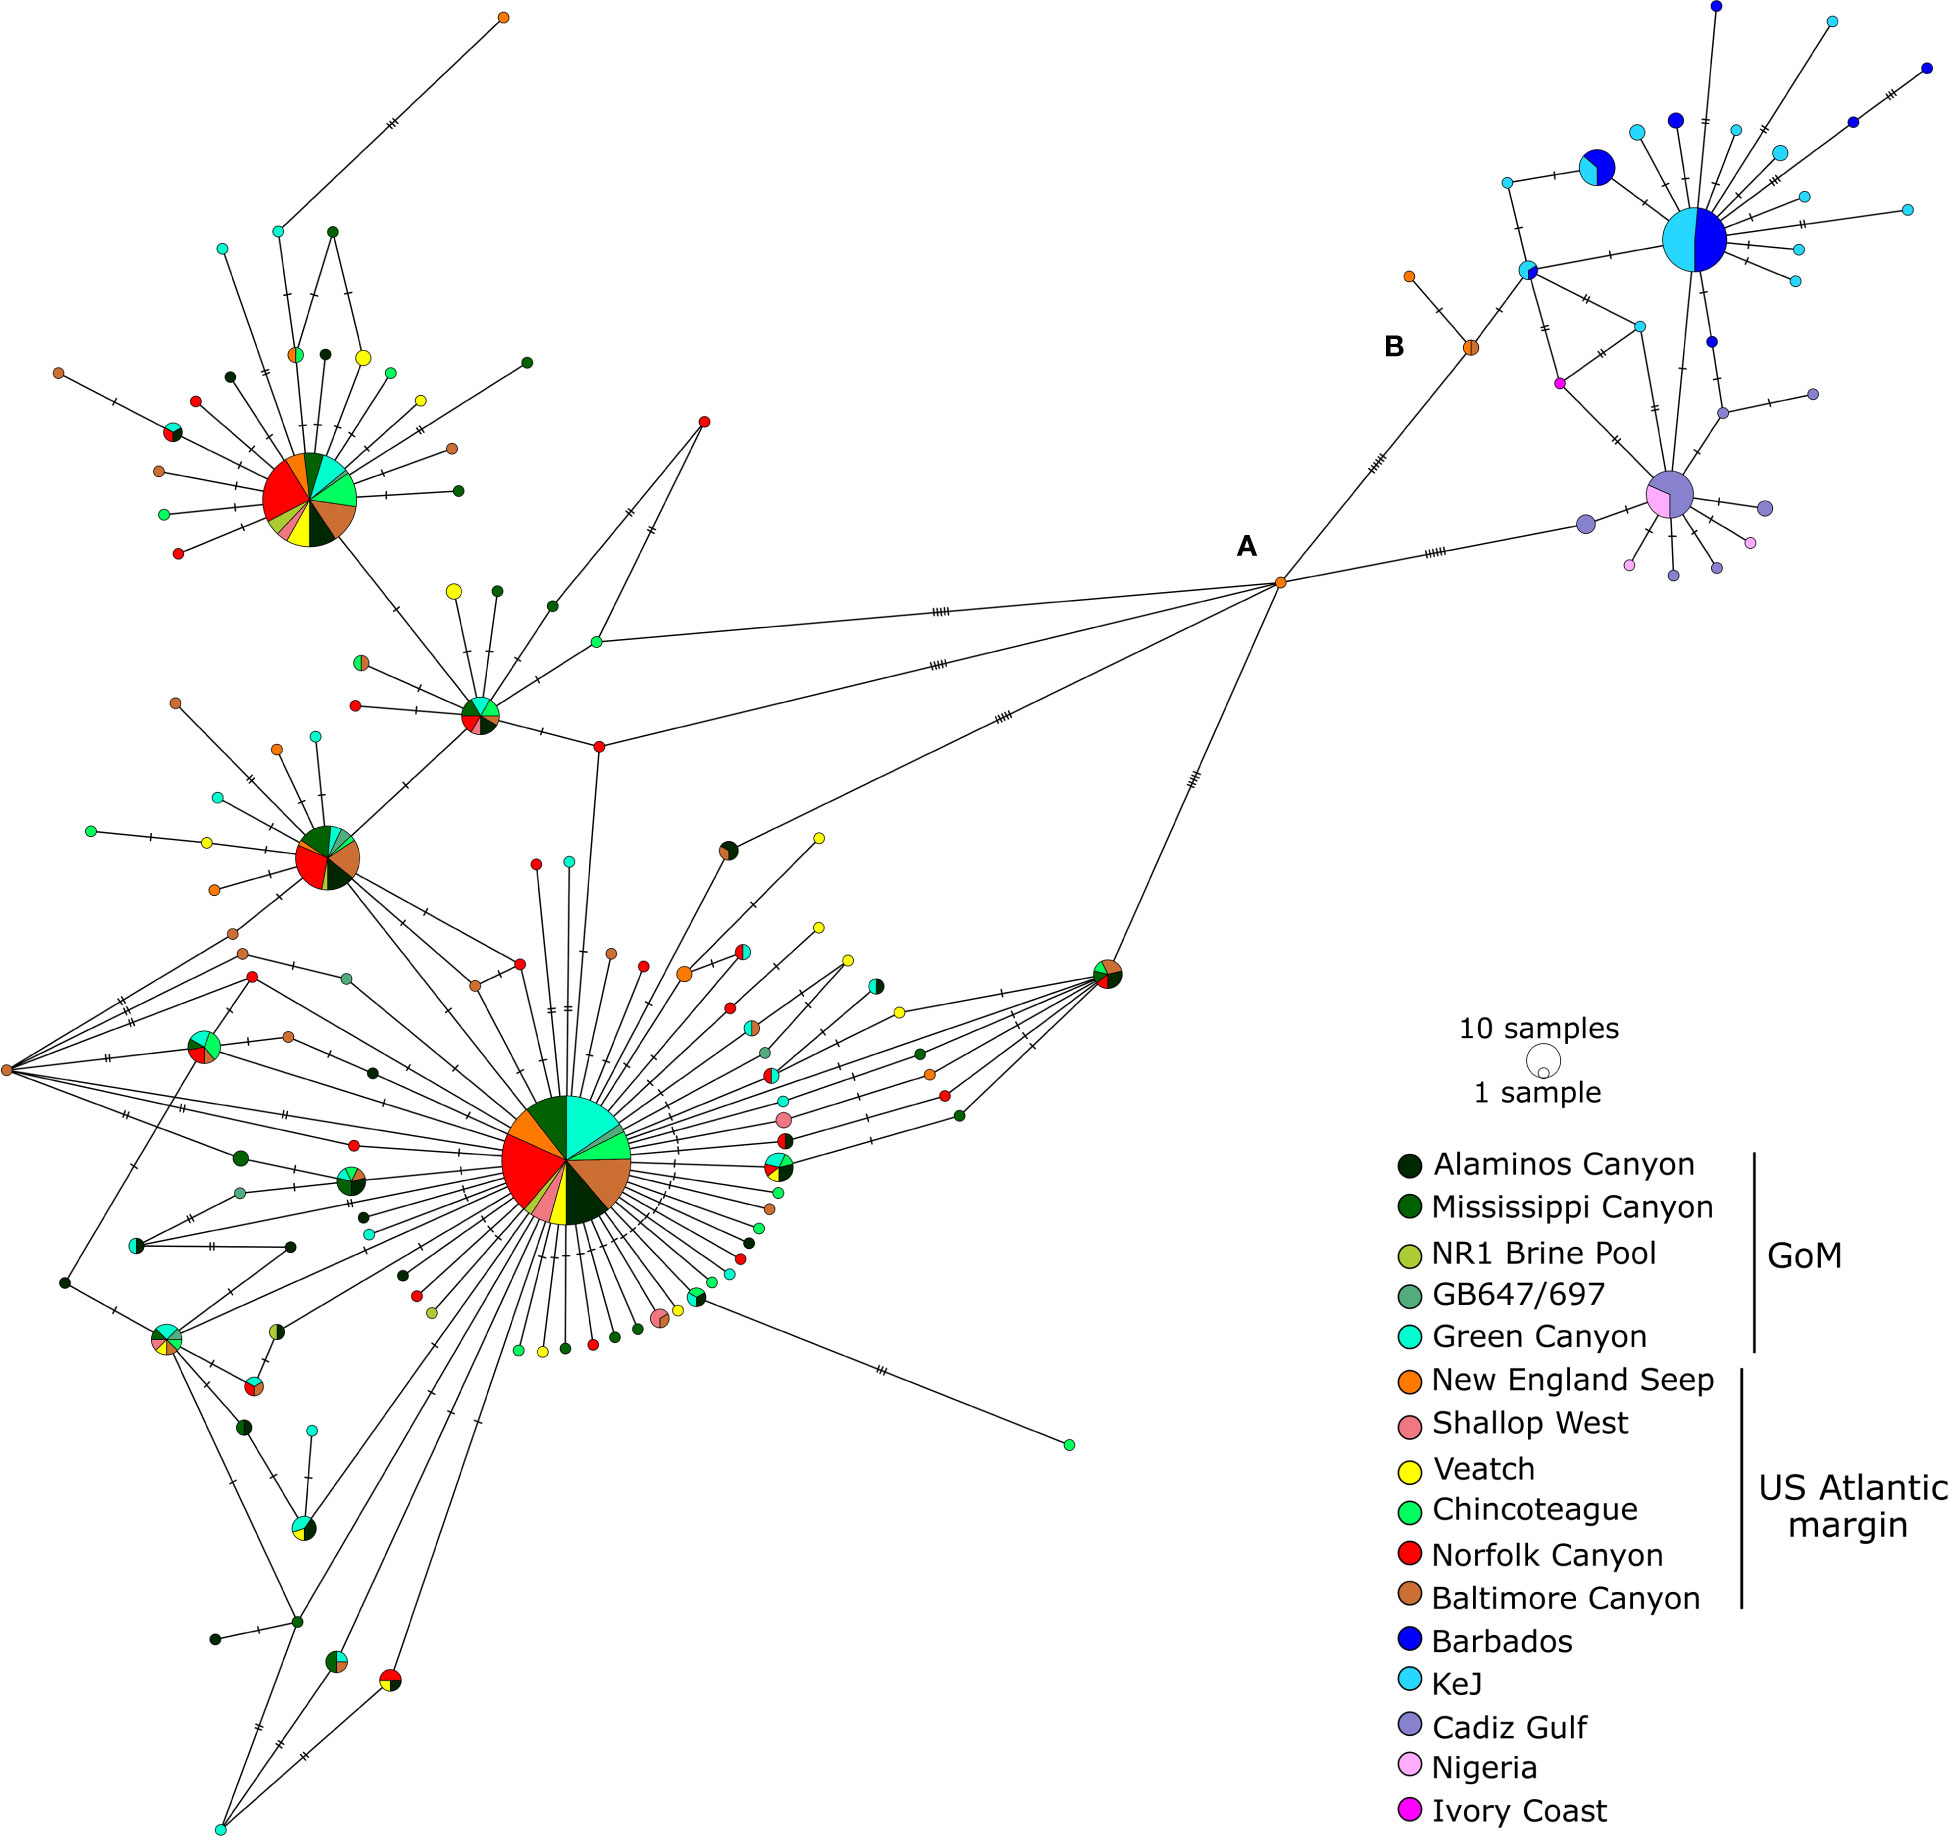
Figure 2 Haplotype network for the G. childressi/G. mauritanicus species complex. See Table 2 and Supplementary Table S1 for details about sequences included. Individuals (A, B) are highlighted as being the intermediate haplotype between both sides of the Atlantic Ocean (in New England seep) and the three G. mauritanicus sampled along the US Atlantic margin (Baltimore Canyon and New England seep), respectively. KeJ: Kick am Jenny, GoM: Gulf of Mexico.
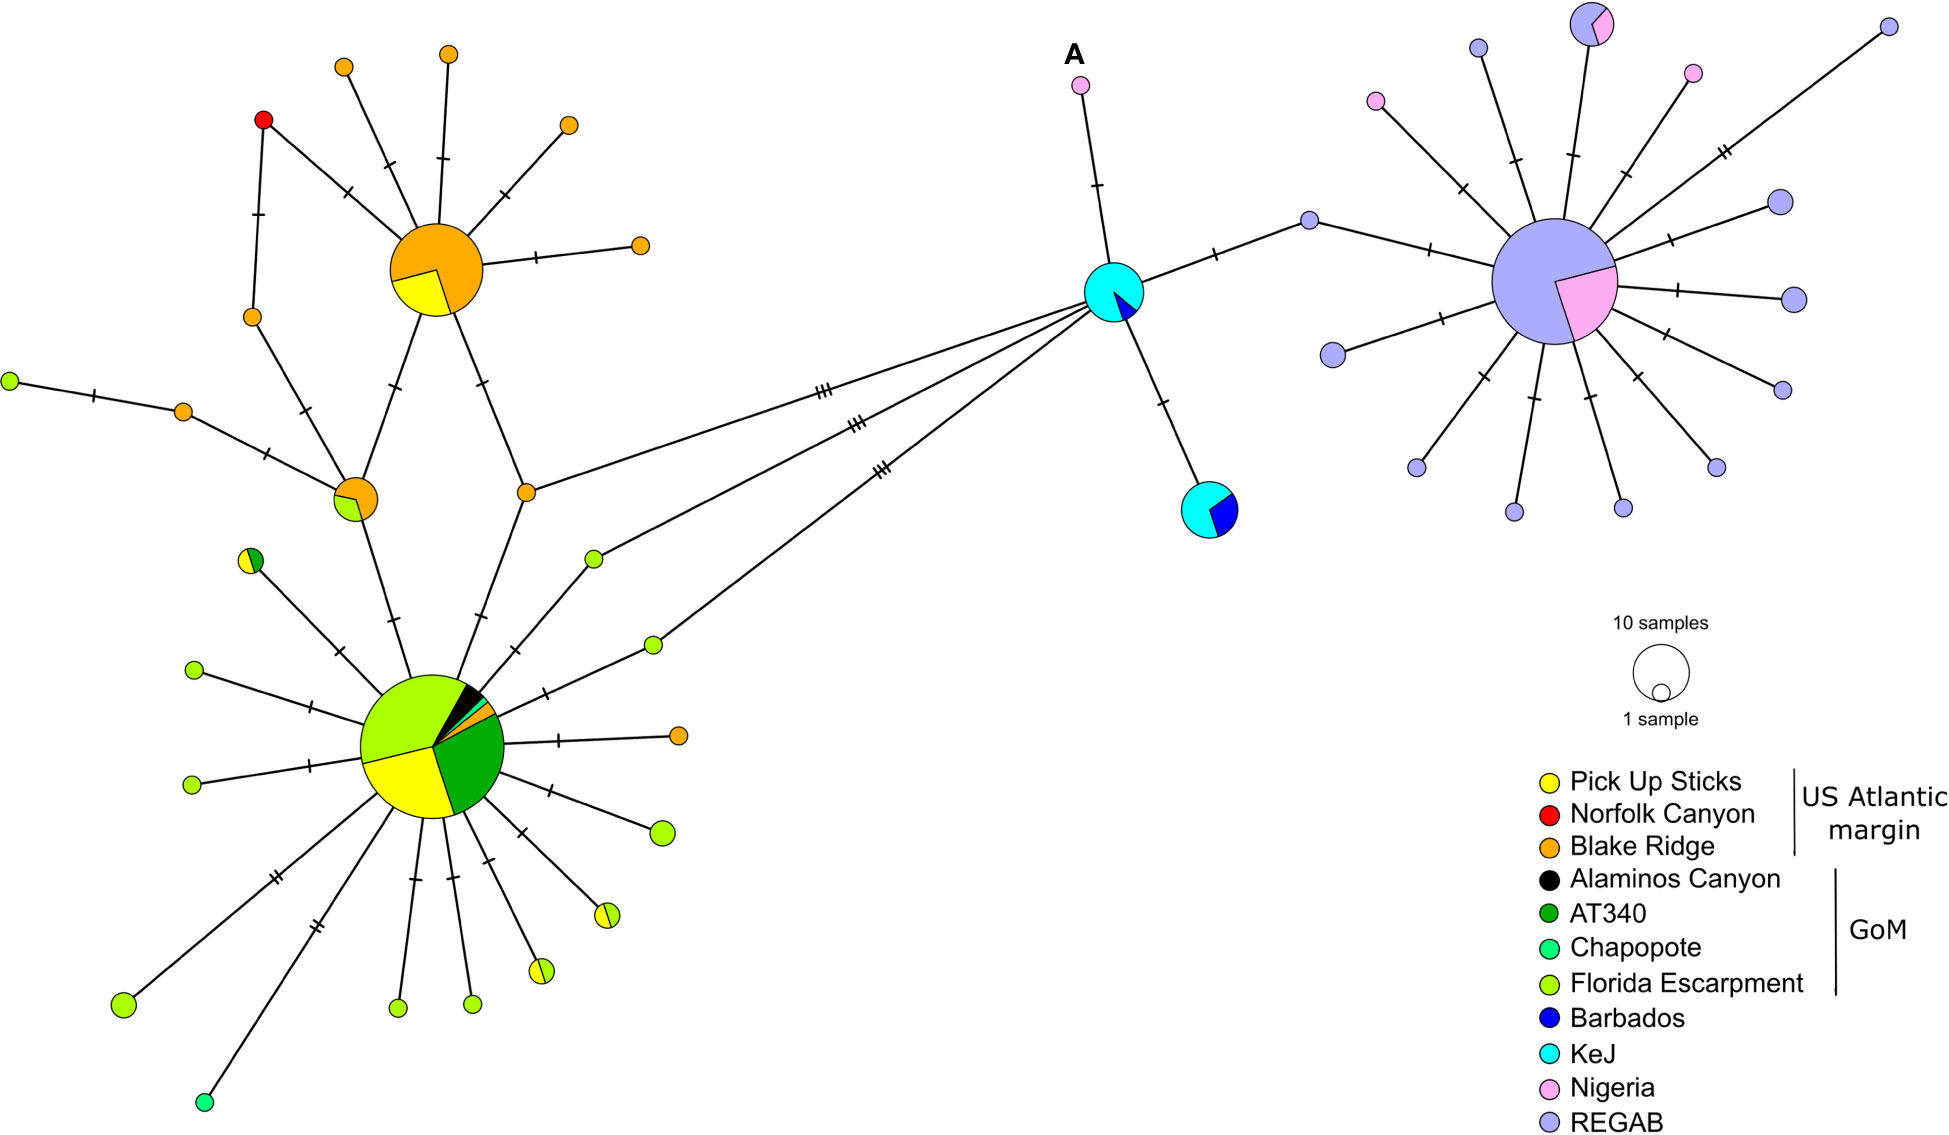
Figure 3 Haplotype network for the B. heckerae/B. boomerang species complex. See Table 1 and Supplementary Table S1 for details about sequences included. Individual (A) might represent a migrant from Kick em Jenny (KeJ)/Barbados Accretionary Prism to the Nigerian slope. GoM, Gulf of Mexico.
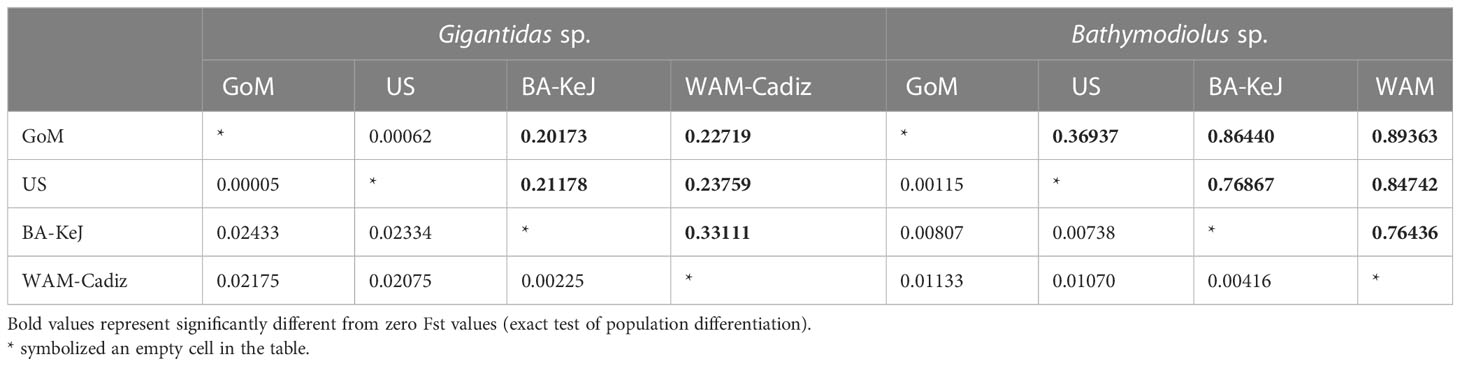
Table 5 Net genetic distance (Da, below the diagonal) and Fst values (above the diagonal) for Gigantidas sp. and Bathymodiolus sp. calculated between the four populations defined based on haplotype networks and ASAP analyses (see Table 1 for details).
Genetic distance within each of the four lineages was low. In the Gigantidas species complex, a very low genetic distance of 0.00005 occurred between GoM and the US Atlantic margin while it increases to 0.00225 between Barbados-KeJ and Africa-Cadiz groups (i.e. 45 times higher, Table 5). In Bathymodiolus spp., divergence was slightly greater between the GoM and the US Atlantic margin (0.001) due to the slight isolation of the Blake Ridge population (see Figures 3, 4B; Supplementary Table S4) and reached 0.004 between Barbados-KeJ and Western African Margin groups (Table 5). It corresponded to what can be observed in haplotype networks since, in both species complexes, individuals from GoM and the US Atlantic margin populations appeared more genetically similar than individuals from Barbados-KeJ and Africa-Cadiz populations. Numerous G. childressi haplotypes were, indeed, shared between the US Atlantic margin canyons and GoM populations (Figure 2). Bathymodiolus heckerae haplotypes appeared, nevertheless, more spatially segregated. While few individuals sampled in the Blake Ridge population harbored haplotypes also found in the GoM/Florida Escarpment and Pick Up Sticks populations, most of Blake Ridge samples showed private haplotypes (Figure 3). The Pick-Up Sticks population (located further North on the American margin) exhibited both GoM-derived and Blake Ridge-derived haplotypes.
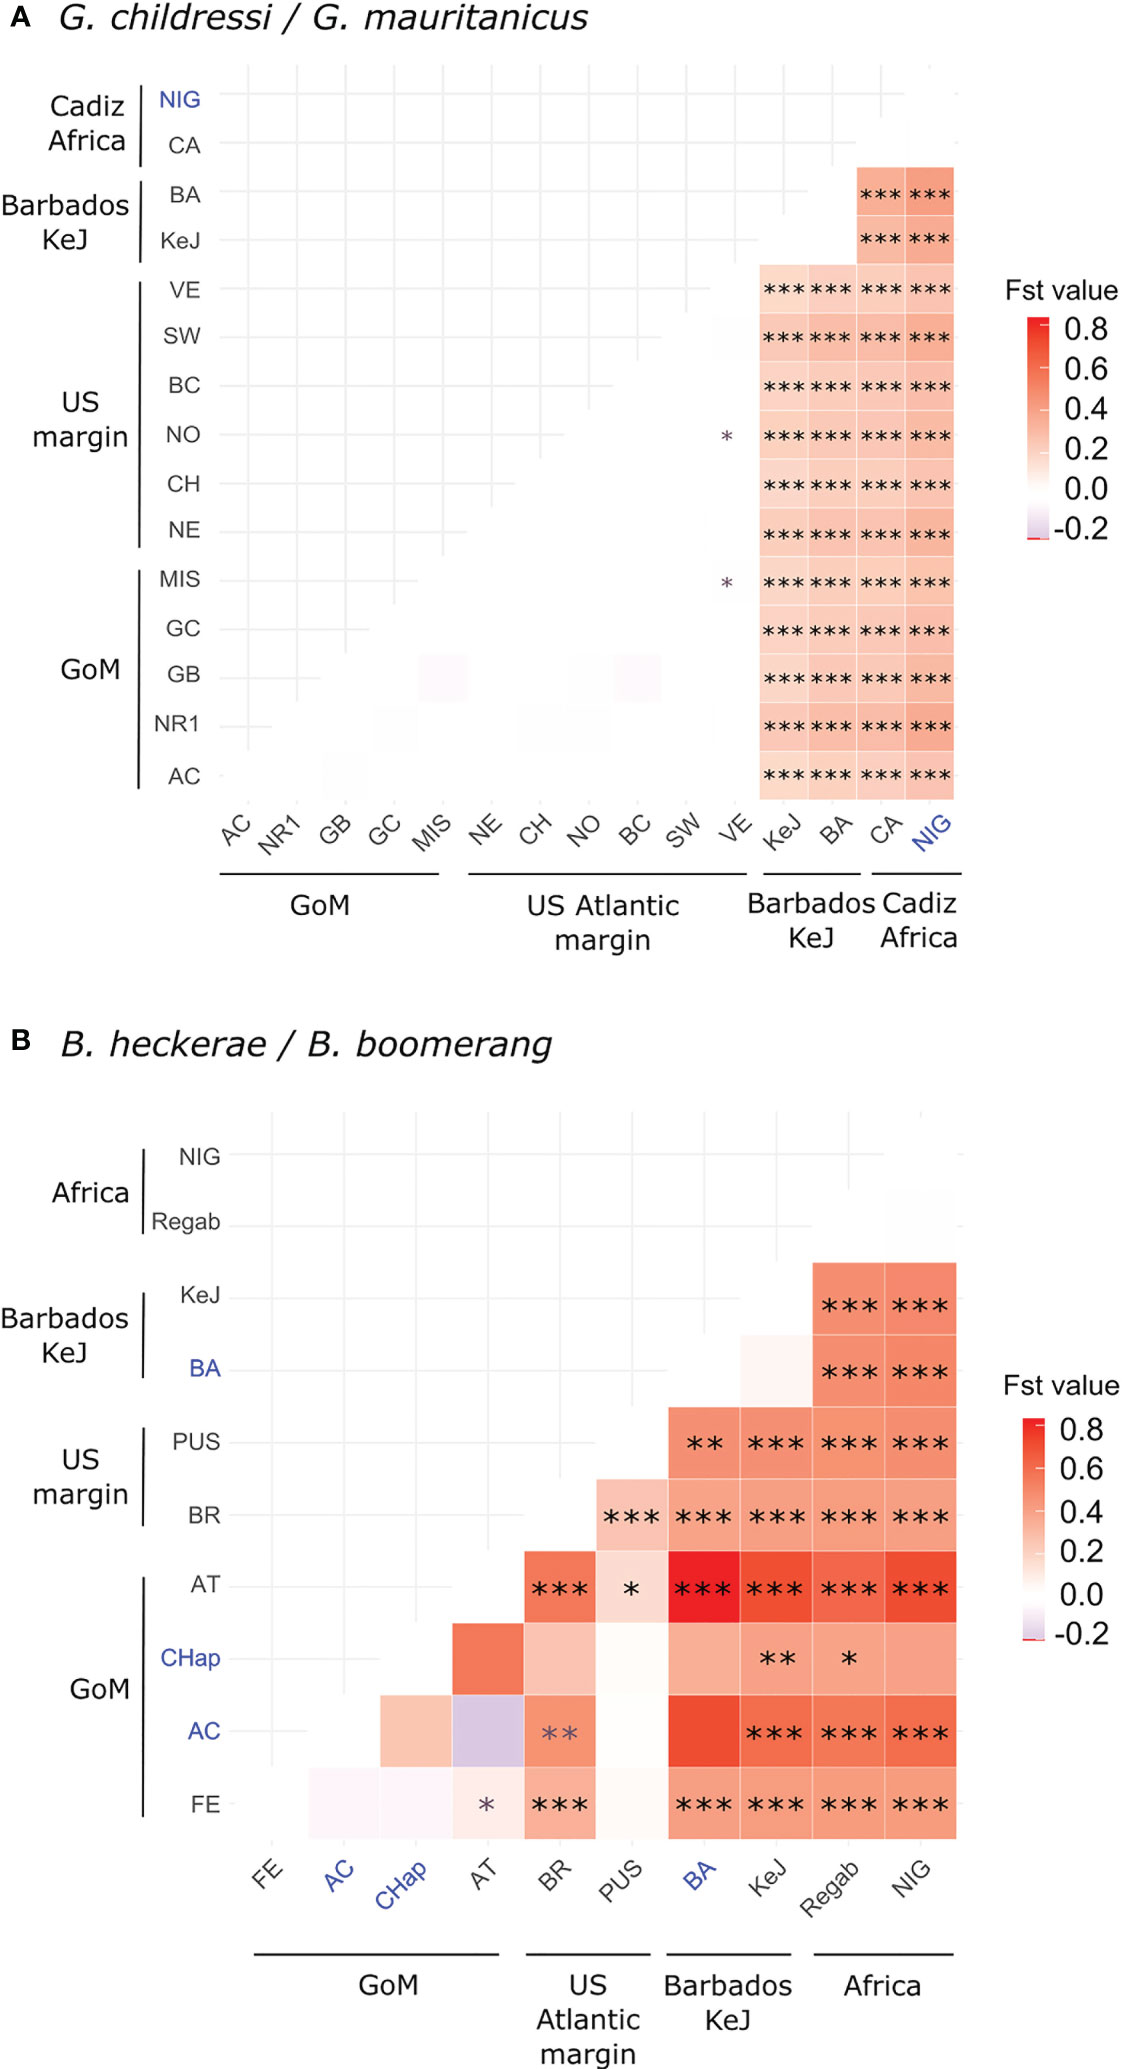
Figure 4 Pairwise Fst heatmaps for G. childressi/G. mauritanicus (A) and B. heckerae/B. boomerang (B). Values are color-scaled and significance levels compared to zero are indicated using: *for p-value ≤ 0.05, **p-value ≤ 0.01 and ***p-value ≤ 0.001. Absence of asterisks indicates non-significant values and grey asterisks indicates Fst values for which significance was confirmed using either permutations or exact test of differentiation but not both. Populations for which less than 10 sequences were available are indicated in blue. Values for West African margin-Ivory (WAM) and Norfolk populations for G. childressi and B. boomerang, respectively, are not displayed since calculations involved only one sequence (see Table 2 for number of samples and population acronyms). GoM, Gulf of Mexico. Exact values and p-values are reported in Supplementary Tables S3, S4.
Barbados-KeJ and Africa-Cadiz populations, although genetically close with no fixed differences, also exhibited a distinguishable geographic structure since haplotypes clustered from each side of the Atlantic Equatorial Belt. Interestingly, in Bathymodiolus, haplotypes from Barbados-KeJ were intermediate between GoM-US and African ones (Figure 3). Haplotype networks highlighted peculiar haplotypes. One haplotype from a New England individual had an intermediate position between G. childressi and G. mauritanicus lineages (individual (a) on Figure 2, accession KX159882 from Turner et al., 2020) and may represent a hybrid individual. Three other ones sampled along the US Atlantic margin (Baltimore Canyon and New England) had a G. mauritanicus signature (individuals (b) on Figure 3, accession MG519868 from Coykendall et al., 2019 and New England_1553 and New England_1530 from this study, Supplementary Table S1). In Bathymodiolus, a unique B. heckerae was sampled in the Norfolk canyon (accession MG519869 from Coykendall et al., 2019), within a G. childressi population, and a potential B. boomerang migrant individual from the Barbados Accretionary Prism was sampled on the Nigerian slope (individual (a) on Figure 3).
3.2 Barcode gap analyses
For both Gigantidas and Bathymodiolus genera, two distinct OTUs could be distinguished, but these OTUs were not geographically delimited, with one lineage potentially sharing haplotypes across the North Atlantic in both species complexes. Indeed, in the Gigantidas species complex, the partition receiving the highest support (lowest ASAP score, Supplementary Figure S2) indicated the presence of two lineages. In accordance, the distribution of pairwise differences was clearly bimodal with two distinct Gaussian distributions with almost no overlap (Supplementary Figure S2). When looking at individual assignments, one lineage grouped all samples from Barbados Accretionary Prism and the African margin plus one individual from the Baltimore Canyon and two from New England Seep (identified as (b) on Figure 2). All these samples were previously identified as G. mauritanicus except for 10 individuals from KeJ and two individuals from New England Seep that were previously affiliated to G. childressi based on morphology (Table 1; Supplementary Table S1). This first lineage thus corresponded to G. mauritanicus. The second lineage grouped all samples from GoM and US Atlantic margin sites and thus represented G. childressi. As recommended by Puillandre et al. (2021), we also examined subsequent partitions. The second-best partition delimited 5 lineages of which composition was identical to the two previously described except that some sequences were isolated in other groups. One group was composed of the sample from the New England seep, which had an intermediate signature between G. childressi and G. mauritanicus haplotypes groups (individual (a) Figure 2, accession KX159882.1). The two last groups isolated, without apparent biological explanations, one individual from Chincoteague (accession KX159907.1) and one individual from Barbados (DQ513425.1). In the Bathymodiolus species complex, the partition receiving the highest support (Supplementary Figure S3) also indicated the presence of two lineages in the dataset. The distribution of pairwise differences was less disjunct than for Gigantidas although two peaks can be distinguished (Supplementary Figure S3). One lineage grouped all individuals identified as B. boomerang (from Barbados and the African margin) while B. heckerae from the GoM and the US Atlantic margin were grouped together in the other lineage. The second-best partition delimited 9 lineages from which no biological significance can be identified.
3.3 Population genetic differentiation
Fst values highlighted a strong to moderate geographic differentiation between three mussel groups within both species’ complexes. These genetic entities corresponded to the populations from (1) GoM/US Atlantic margin, (2) the Barbados accretionary Prism, and (3) European/African margin. As expected, genetic differentiation between B. heckerae and B. boomerang or G. childressi and G. mauritanicus was high since nearly all pairwise Fst values between (1) and (2)/(3) were high and significantly different from zero (Figure 4; Table 5). G. childressi and G. mauritanicus did not display higher Fst values than those obtained between B. heckerae and B. boomerang (Figure 4; Supplementary Tables S3, S4), as would have been expected since the two Gigantidas lineages were separated by a higher number of mutational changes (Figures 2, 3).
Populations of G. childressi were almost homogeneous from the GoM to the most northern part of the American margin with all pairwise Fst values between US Atlantic margin and GoM sites being null or very low and not significantly different from zero (except two using exact tests, Figure 4A; Supplementary Table S3). For B. heckerae, however, the Blake Ridge population clearly differed from those of the GoM and the Florida Escarpment (Fst = 0.25 to 0.55, Figure 4B; Supplementary Table S4). In G. mauritanicus and B. boomerang species, high and significant Fst values were observed, especially between African populations and Barbados-KeJ (Figure 4; Supplementary Tables S3, S4). In contrast, Fst values between African populations and that of the Gulf of Cadiz were low and not significantly different from zero (Figure 4; Supplementary Tables S3, S4).
Altogether, pairwise Fst and divergences strongly suggested high levels of gene flow along the European/African margins and weak to almost no gene flow between the African margin and the Barbados Accretionary Prism, but also suggest a strong genetic break between mussel populations from the Barbados Accretionary Prism (South American margin) and those situated in the GoM and further North along the US Atlantic margin.
3.4 Divergence time and gene flow estimates using IMa3
Based on ASAP and Fst analyses, seep mussel populations were sub-divided into 4 distinct geographic groups (i.e. GoM, US Atlantic margin canyons, Barbados accretionary Prism and European/African margin) in order to examine potential gene flow between them. For both species complexes, nearly all replicated runs showed good mixing (plots without trends, large ESS for T1 (all except two > 14 000) and T2 (all > 400 000), and good congruence between first and second halves of the sampled genealogies). For most parameters, marked peaks of posterior probabilities with fairly narrow ranges were observed (Supplementary Figures S4–S8), even for T0 that showed the lowest ESS (<30). For Gigantidas spp., we were not able to jointly estimate q0 and q1 parameters with m0>1 and m1>0. Given the good mixing observed in each run and the correspondence of the other estimates (Supplementary Figures S4–S6), estimations of q0 and q1 (and thus, 2NM parameters involving N0 and N1) were taken from two different runs. For all other parameters, averaged values between runs were calculated after ensuring that good mixing and convergence were obtained for all runs (see Supplementary Figures S4–S6).
The population splitting times separating G. childressi and G. mauritanicus, on one hand and B. heckerae and B. boomerang, on the other hand (i.e. T2) were estimated to have occurred around 585 000 years ago and 1 My ago, respectively (Table 2). For both, the upper boundary of 95% HPD was very large, probably due to the fact that only one locus has been used. Based on Fst and genetic divergence, divergence times between Africa-Cadiz and Barbados-KeJ populations (T1) was expected to be more ancient than divergence between GoM and US Atlantic margin populations (T0), especially for Gigantidas species complex. Accordingly, although quite close, T1 estimates were 576 281 and 396 440 for Gigantidas spp. and Bathymodiolus spp., respectively, while T0 were estimated as 355 791 and 153 236, respectively. Effective sizes of contemporary populations (q0, q1, q2 and q3) were largely higher in Gigantidas spp. than in Bathymodiolus spp. except for the Africa-Cadiz population which was four time higher in B. boomerang (Table 2). A similar situation was observed for ancestral populations that showed higher sizes in Gigantidas spp. although the posterior probabilities distribution of these parameters (especially q5 and q6) were quite large (Supplementary Figures S4–S8).
Regarding migration rates, most estimates were close to zero and non-significantly different from it (Table 2). High values significantly different from zero in at least one run were nevertheless observed for 2N1m1>0 for both species complexes (Gigantidas and Bathymodiolus), suggesting efficient migration greater than one individual per generation from GoM to the US Atlantic margin (Table 2). Gene flow in the opposite direction was non-different from zero for G. childressi but estimated to be around 7 migrants per generation for B. heckerae. It is however noteworthy that for B. heckerae both 2N1m1>0 and 2N0m0>1 HPD95% included zero. Other significantly different from zero values included 2N3m3>2 for B. boomerang, which represented the number of trans-Atlantic migrants from Western Africa to Barbados-KeJ. This value was, however, very low (less than one individual per generation) and the HPD95% included zero. This contrasted with reverse large and significant Nm values of around 60 migrants per generation from Barbados-KeJ to Africa, but also with an ancestral rate of migration of nearly 20 migrants per generation found in Bathymodiolus between the American and European/African margins. In the Gigantidas species complex, only the Nm value from Barbados to the US Atlantic margin was greater than one, but this value was not significantly different from zero. This contemporary flow was confirmed by the sampling of one and two G. mauritanicus migrants in the Baltimore Canyon and the New England seep 2, respectively (see (b) in Figure 3).
3.5 Larval dispersal modelling
Despite variations according to the spawning dates (i.e. 5 years with 5 months each), the overall patterns of larval dispersal were generally consistent between dates for each spawning area (see larval simulations in Portanier et al., 2023 and Jollivet et al., 2023) and are summarized in Figures 5, 6; Table 6 at the scale of the whole Atlantic. Larvae released in the GoM (i.e. Alaminos Canyon, Brine Pool, Louisiana Slope) spread throughout the GoM while a significant number of them traveled through the Florida Strait, and dispersed northward along the US Atlantic margin and then eastward off the Mid-Atlantic Bight across the North Atlantic, following the overall North Atlantic gyre (Figures 5, 6; Table 6). Average dispersal distances traveled by larvae varied between spawning areas but were higher for larvae released at Brine Pool (Figure 7A). For some spawning dates (e.g. January 2019), most larvae originating from Alaminos Canyon and Louisiana Slope were retained in the GoM and only a few entered the Gulf Stream and dispersed along the US Atlantic margin (Supplementary Figure S9). The average maximal dispersal distance for all spawning dates was also higher for a larval release at Brine Pool (Figure 7B, with some larvae arriving offshore of Ireland, see e.g. Supplementary Figures S10, S11) although extreme distances travelled by some larvae were reported for a larval release at Alaminos Canyon (~ 6500 km, Figure 7B).
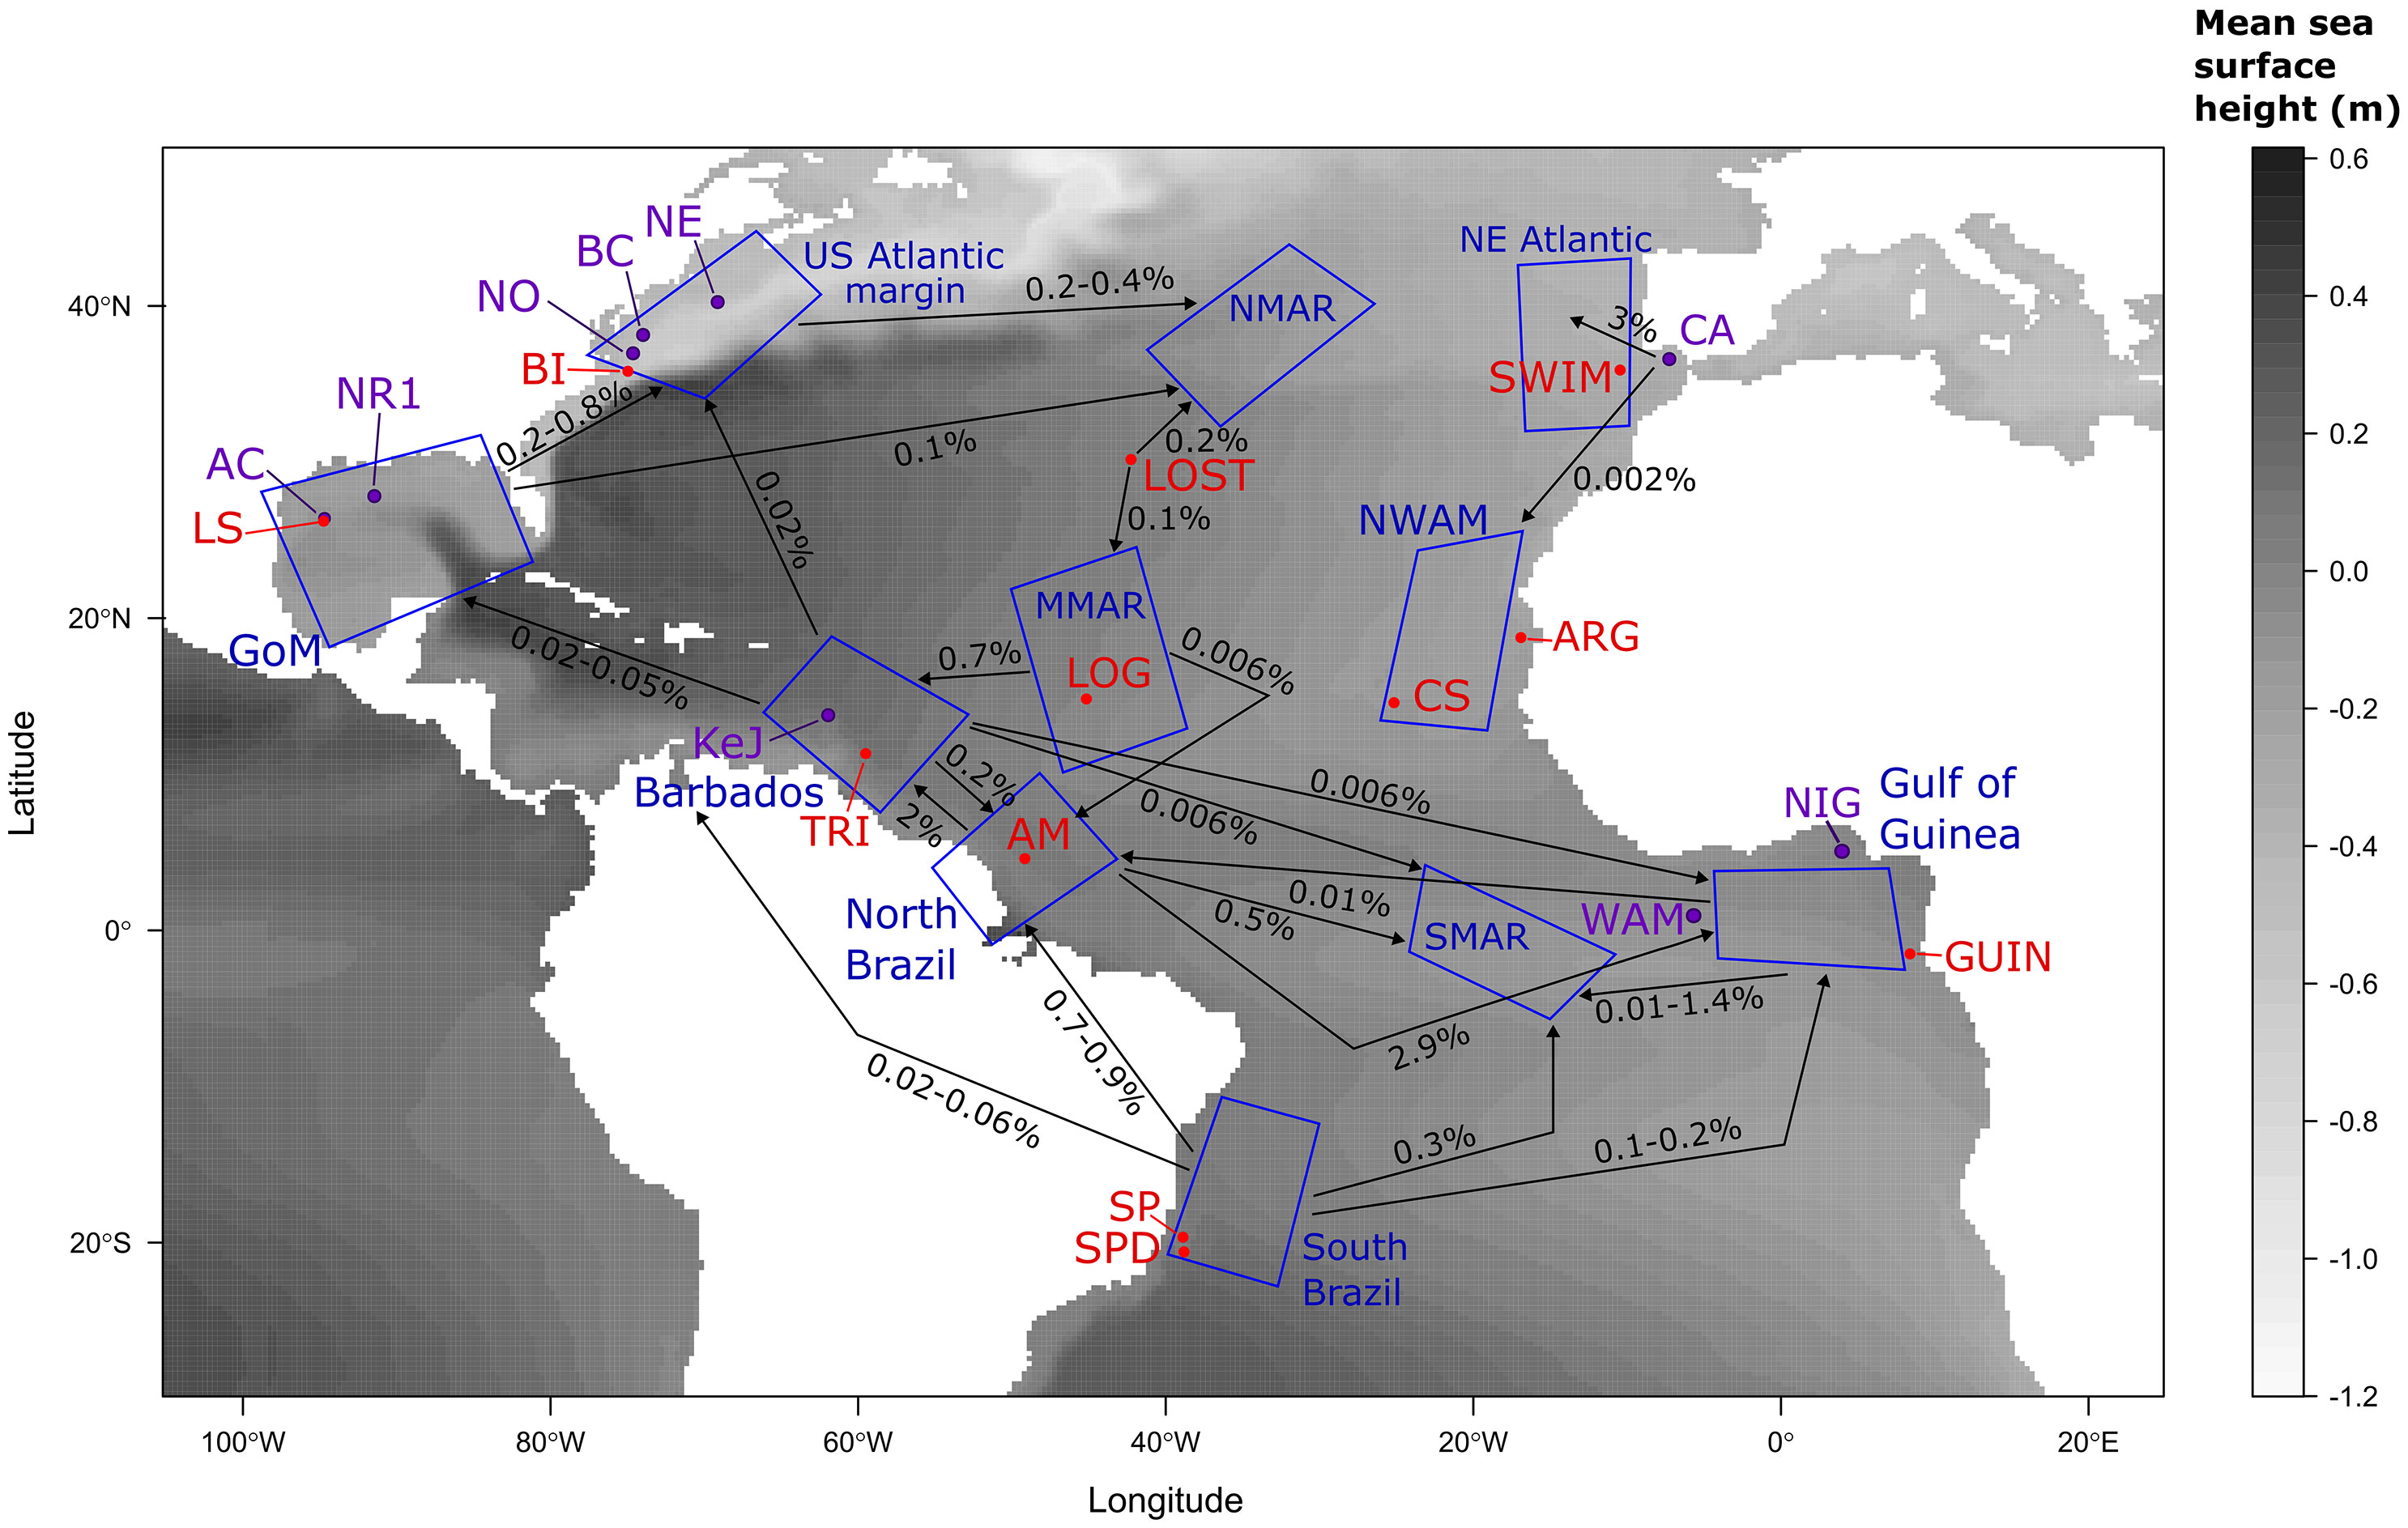
Figure 5 Larval dispersal connectivity map obtained using larval dispersal fluxes simulated by the oceanic circulation model VIKING20X. Mean fluxes were calculated between spawning areas (red and purple points) and settlement regions (blue polygons). Arrows show the range of mean values observed for all sites within settlement regions. Details on site per site values can be found in Table 6. See Figure 1 for spawning areas and settlement regions abbreviation definitions.
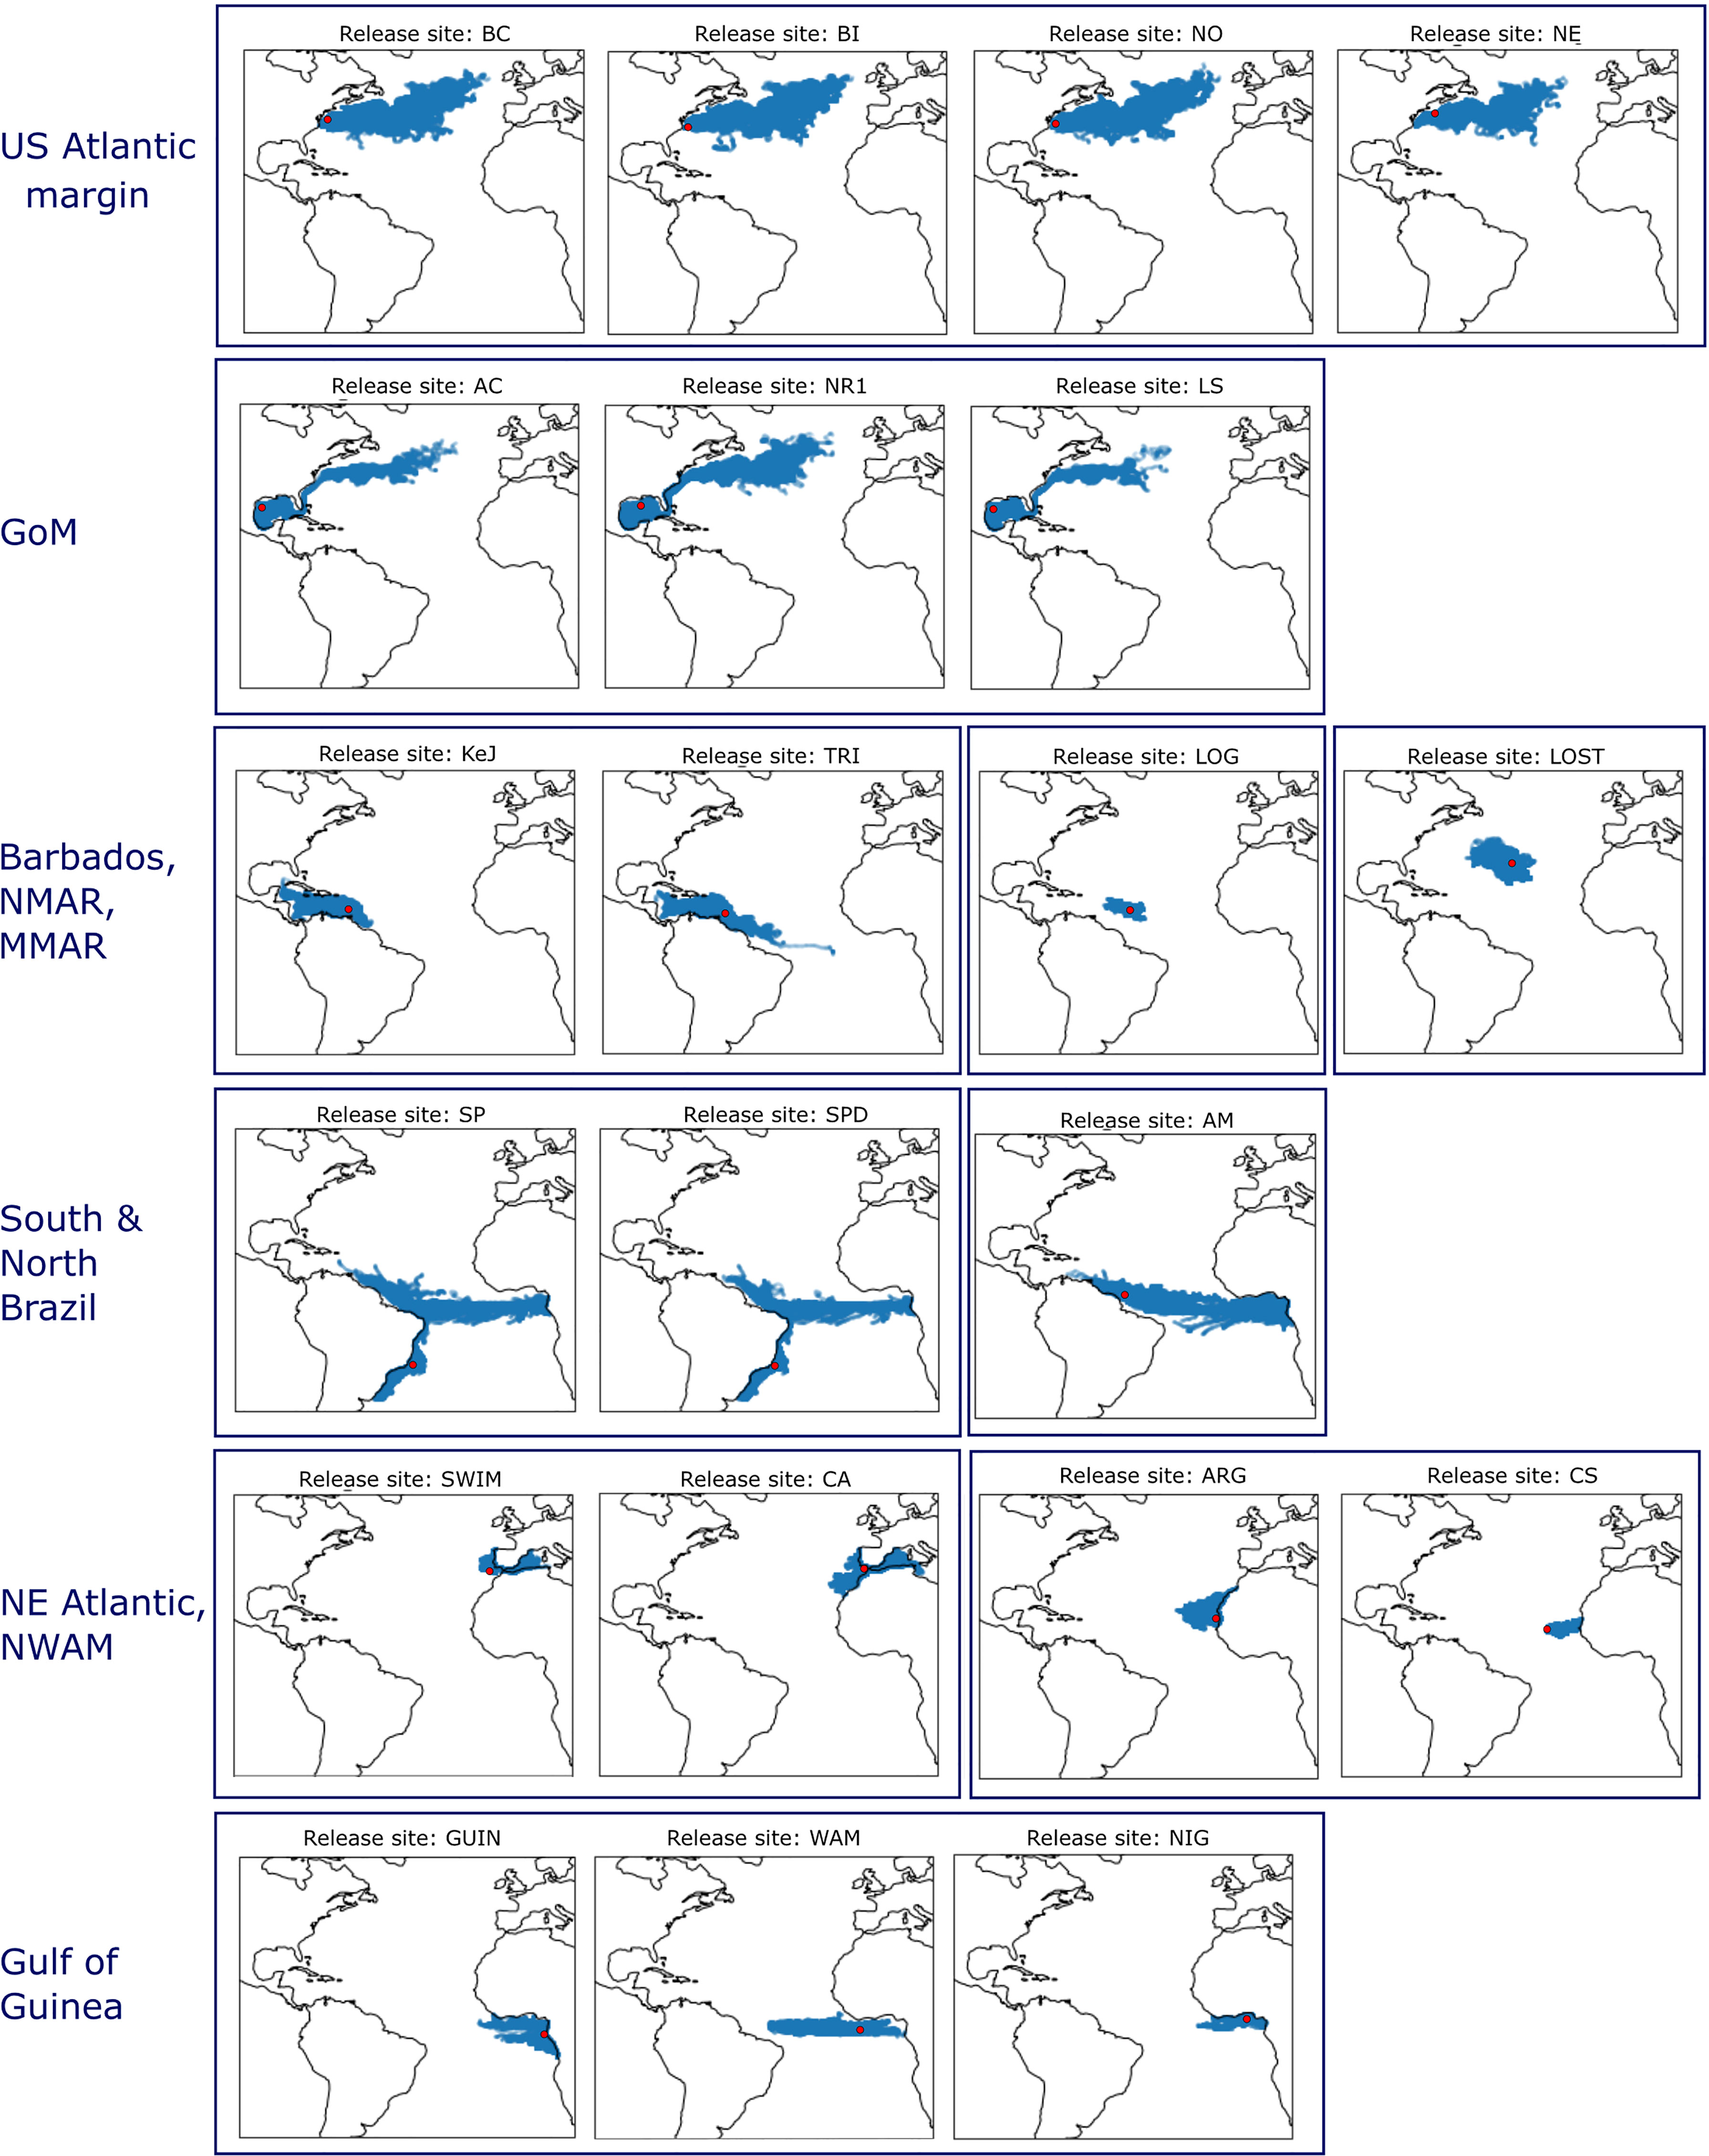
Figure 6 Representative patterns of simulated larval distribution after one year following a larval release at one of the 21 seep localities and/or putative stepping stones on the mid-Atlantic Ridge. Release date was January 2017 (see Portanier et al., 2023 and Jollivet et al., 2023 for all 25 release dates simulated). See Figure 1 for spawning areas and settlement regions abbreviation definitions.
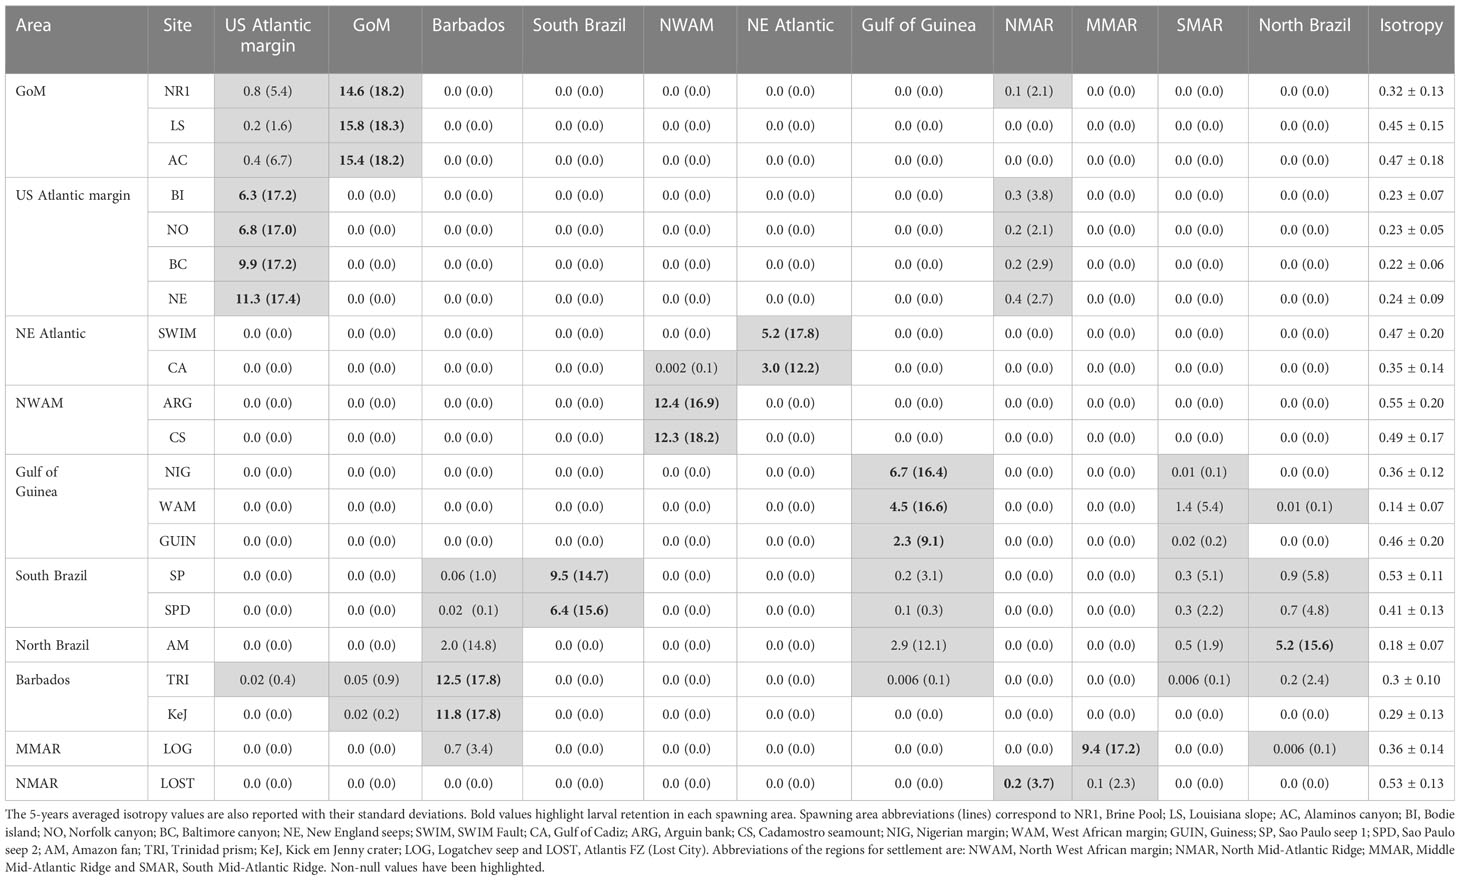
Table 6 Mean and maximal (in brackets) percentages of larval exchanges observed between spawning areas and the eleven regions for settlement (see Figure 1 for the mapping of these areas) using larval dispersal simulations of the oceanic circulation model VIKING20X.
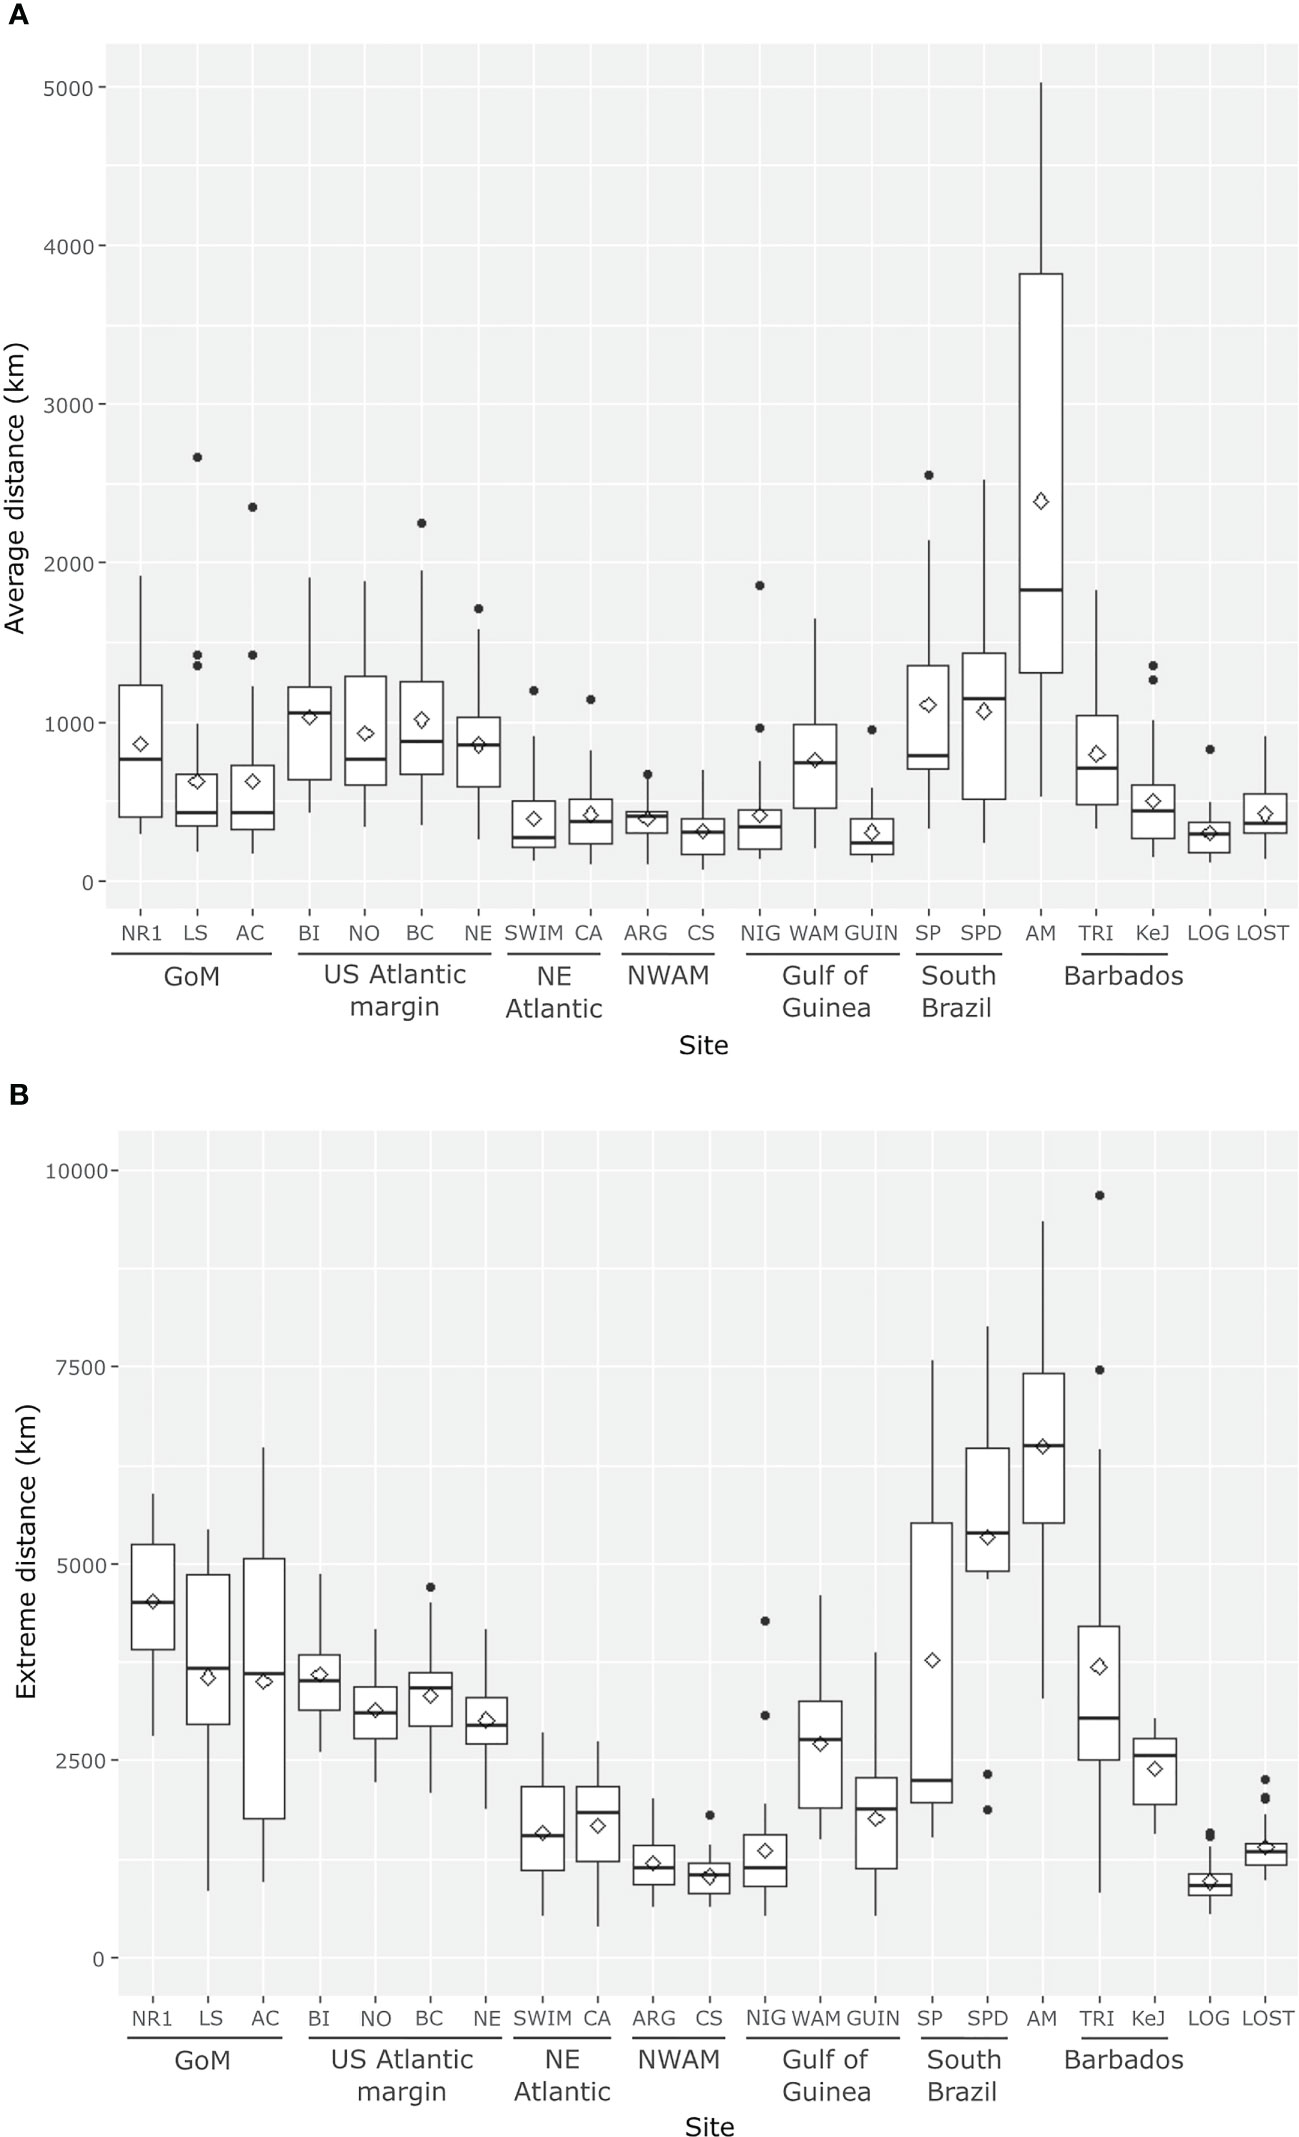
Figure 7 Boxplots summarizing mean (A) and extreme (B) dispersal distances observed for larvae released from the different release sites modeled (white diamonds correspond to means and black dots represent outlier values). See Figure 1 for spawning areas and settlement regions abbreviation definitions.
Larvae released from the US Atlantic margin (i.e. Bodie Island, Norfolk Canyon, Baltimore Canyon, New England) dispersed along the US Atlantic margin to Nova Scotia, and then eastward across the North Atlantic with low isotropy indices (Figure 6; Table 6, see also Portanier et al., 2023 and Jollivet et al., 2023). The average dispersal distance and the average maximal dispersal distance varied little between sites, between 850 and 1032 km for the former, and between 2787 and 3857 km for the latter (Figure 7). Extreme dispersal distances exceeded more than 4850 km for a larval release at Bodie Island (Figure 7) so that some larvae could reach European waters, South-Western of Ireland (see Supplementary Figures S12, S13).
Larvae originating from the North Eastern Atlantic (i.e. SWIM Fault and Gulf of Cadiz) were transported in different directions (high isotropy indices, Table 6). While some larvae entered the Mediterranean Sea through the Strait of Gibraltar, others were transported northwards along the Portuguese coast or southwards along the coast of Morocco (Figures 5, 6, see also Portanier et al., 2023 and Jollivet et al., 2023). Depending on spawning dates, only a few larvae were transported to latitudes south of the Canary Islands, suggesting that very few larvae could reach the North West African region in the surface layer of the ocean (Table 6). For both sites, the average dispersal distances were low (around 400 km) even though extreme dispersal distances exceeded 2700 km for some larvae entering the Mediterranean Sea (Figure 7, Portanier et al., 2023 and Jollivet et al., 2023).
For a larval release in North West Africa (i.e., Arguin, Cadamostro Seamount), dispersal patterns varied slightly according to the spawning area. For a release at the Arguin site, larvae spread along the coast of North West Africa northwards, southwards to the Cape Verde Peninsula and westwards beyond the Cape Verde archipelago by the Canary and the North Equatorial Currents. For a larval release at the Cadamostro Seamount, larvae were transported westward to a longitude of 30°W but did not reach the Mid-Atlantic Ridge (Table 6; Figures 5, 6, Portanier et al., 2023 and Jollivet et al., 2023). As for larvae originating from the NE Atlantic, the average dispersal distance was low (less than 400 km), and maximal dispersal distance never exceeded 1200 km (Figure 7, Portanier et al., 2023 and Jollivet et al., 2023).
While larvae released from the Gulf of Guinea (i.e. Guiness, Nigeria margin and West African margin) were mainly transported westward, larval dispersal patterns varied among spawning area. Larvae from the Nigeria margin were mainly trapped in the Gulf of Guinea gyre (Figures 5, 6), whereas at some rare spawning dates (Guinea site on Supplementary Figures S14, S15), larvae were transported westward across the Atlantic by the Equatorial South Equatorial Current but did not reach the North Brazil margin (Figure 6; Table 6). While the average dispersal distance was around 400 km, the maximum dispersal distance exceeded 1350 km (Figure 7). Larvae from the West African margin were transported both eastward by the Gulf of Guinea current and westward by the Equatorial South Equatorial Current (Figure 6; Table 6). Larvae from this site reached the North Brazil margin with a maximal dispersal distance of 2715 km (Figures 5, 6; Table 6; Supplementary Figures S14, S15). Larval dispersal following a spawning event from Guiness was highly variable among spawning dates. While larvae could be mainly transported southward along the coasts of Congo, they could also be transported westwards by two branches of the equatorial circulation: the Guinea Current and the Equatorial South Equatorial Current for the northern branch, and the Central South Equatorial Current for the southern branch (Figure 6; Table 6; Portanier et al., 2023 and Jollivet et al., 2023).
Larvae originating from the South Brazil margin (i.e. Sao Paulo 1 and Sao Paulo 2) were transported southward by the Brazil current to the Rio de la Plata and to a greater extent northward by the highly dynamic North Brazil Under Current and North Brazil Current so that some larvae reached the Barbados Prism (Table 6; Figures 5, 6; Supplementary Figure S15). In parallel, some larvae travelled across the Atlantic Ocean to the Gulf of Guinea by the South Equatorial Current (Table 6; Figures 5, 6, nearly all larval simulations in Portanier et al., 2023 and Jollivet et al., 2023). For a larval release in the North Brazil margin (i.e. Amazon fan), larvae were transported both to the northwest by the North Brazil Current to the Barbados Prism and eastwards by the South Equatorial Current to the Gulf of Guinea (Table 6; Figures 5, 6, nearly all larval simulations in Portanier et al., 2023 and Jollivet et al., 2023) with low isotropy indices (Table 6). For some spawning dates, larvae entered the GoM and traveled through the Florida Strait along the US Atlantic margin (Table 6; Supplementary Figures S15, S16). The larvae emitted along the Brazilian coast are those that travel the greatest distances, with maximum dispersal distances exceeding 5000-6000 km (Figure 7).
Larvae released from the Barbados Prism (i.e. Trinidad and Kick em Jenny crater) were mainly dispersed in the Caribbean Sea (Figure 6, Portanier et al., 2023 and Jollivet et al., 2023). As reported for a larval release in the North Brazil margin, a few larvae reached the entrance of the GoM, and the Florida Escarpment but most of them were entrained along the US Atlantic margin for a few spawning dates (Figures 5, 6; Table 6; Supplementary Figure S9 and larval release from November 2014 to February 2015 in Portanier et al., 2023 and Jollivet et al., 2023). Such transport was more common with some larval releases at Trinidad (Table 6, Supplementary Figure S9). In parallel, larvae released at Trinidad could travel across the Equatorial Atlantic and reached the Gulf of Guinea (Figure 5; Table 6, see e.g. Supplementary Figure S9). On average, mean and extreme dispersal distances of larvae originating from Barbados prism were lower than those of larvae originating from Brazil (Figure 7).
Finally, larvae released from the mid-Atlantic Ridge (i.e. Lost City and Logatchev seeps) were dispersed over short distances with average dispersal distance and maximum dispersal distance of 300-400 km and 960-1400 km, respectively (Figure 7). As the Lost City seep is located in the center of the overall subtropical North Atlantic gyre, outside the main currents, larvae from this site never reached the US Atlantic or African margins and spread in all directions (Figure 6) with high isotropy indices (Table 6). Conversely, some larvae originating from the Logatchev seep could benefit from the North Equatorial Current and the Equatorial Counter Current to reach the Barbados Prism and the North Brazil margin (Figure 5; Table 6, see e.g. Supplementary Figure S9).
In terms of connectivity among the different cold seeps areas in the North and Equatorial Atlantic, there are strong differences between the East and the West margins of the ocean as the result of abrupt differences in the intensity of the general surface circulation (Figure 5). A high northward larval dispersal and connectivity from the South Brazil margin to the US Atlantic margin was simulated. Conversely, no connectivity was reported between the cold seep areas along the East Atlantic, from the Gulf of Cadiz to the Gulf of Guinea (Table 6). Rare and reproducible bidirectional larval exchanges across the Atlantic occurred only in the Atlantic Equatorial Belt (Table 6; Figure 5). In temperate waters, larvae released from the US Atlantic margin travelled across the Atlantic to reach the southwest Ireland but were not able to colonize sites in the south of the Iberian Peninsula. Contrary to our expectations, sites located along the mid-Atlantic Ridge did not seem to play a major role as stepping stones.
4 Discussion
4.1 A shared mitochondrial history between Gigantidas and Bathymodiolus
The low level of divergence (< 1%) measured in the present study between G. childressi and G. mauritanicus or between B. heckerae and B. boomerang corresponded to previous observation made using lower sample sizes (Olu-Le Roy et al., 2007; Génio et al., 2008) and is in the range of differences commonly accepted between populations of the same species or within the grey zone of speciation (Roux et al., 2016). It is similar to what was observed between mussel species that still hybridize (e.g. B. azoricus/B. puteoserpentis or B. thermophilus/B. antarcticus, Faure et al., 2009; Johnson et al., 2013) and therefore suggests that geographic species could still exchange genetic material within each genus. Despite a higher number of mutational changes observed between the two Gigantidas species when compared with the two Bathymodiolus species (Figure 2 vs. 3), genetic distances and population differentiation indices were equivalent in the two species complexes. This gives credit to a shared mitochondrial history of the two genera in the North Atlantic. Indeed, it has been suggested that G. mauritanicus/G. childressi and B. boomerang/B. heckerae diverged at similar times, between 1.3 Million years ago (Mya) and 3 Mya (Miyazaki et al., 2010; McCowin et al., 2020). While our estimate of T2 (population splitting time between MRCAs of GoM-US canyons and Barbados-Africa) corresponded for Bathymodiolus spp., it seemed upward biased for Gigantidas spp., as also suggested by its proximity with T1 (divergence between populations from Barbados-KeJ and Africa-Gulf of Cadiz). Such concomitant divergence across the Atlantic and across the Caribbean Sea appeared unlikely given the genetic break identified in the Caribbean Sea for both genera, which instead suggested a complete lineage sorting between G. childressi/G. mauritanicus and B. heckerae/B. boomerang and a parallel mitochondrial isolation.
Our results thus tended to validate the hypothesis of a vicariant effect possibly due to an ‘old’ (1-3 Mya) hydrologic barrier predating the Panama Seaway closure (Knowlton and Weigt, 1998) that separated B. boomerang and B. heckerae on one hand, and G. mauritanicus and G. childressi on the other hand (Olu-Le Roy et al., 2007). The change of the Caribbean Sea salinity and of the thermohaline circulation observed around 3 Mya (Haug and Tiedemann, 1998; Haug et al., 2001), which may be linked to the closure of the Panama Seaway (but see Montes et al., 2015), may have impacted the within-Atlantic Ocean circulation. This could have led to a reinforced cross-Atlantic circulation between Barbados and African margins along the Atlantic Equatorial Belt and the diversification of Bathymodiolus species (Jones et al., 2006; Olu-Le Roy et al., 2007). Such a scenario may explain how individuals from the same species occur on both sides of the Atlantic and suggest that previously-isolated populations across the Caribbean Sea are currently experiencing a possible secondary contact with the arrival of rare but regular Barbados migrants in the US Atlantic margin waters (see below). Vicariant effects leading to concomitant species divergence at the community scale have also been documented in other deep-sea ecosystems, such as in the back-arc-basins of the South West Pacific (Thaler et al., 2011; Thaler et al., 2014; Lee et al., 2019; Poitrimol et al., 2022; Tran Lu, 2022; Tran Lu Y et al., 2022) or along the East Pacific Rise (Plouviez et al., 2009; Matabos and Jollivet, 2019) in which taxa from several phyla (Mollusca, Annelida, Crustacea) simultaneously diverged in response to geotectonic rearrangements.
4.2 Contemporary and past gene flow across the Atlantic Equatorial Belt
High faunal similarities between seep communities have been previously depicted on both sides of the Atlantic Ocean (Olu et al., 2010) with very low genetic divergence between siblings (e.g. vestimentiferan tubeworm, Andersen et al., 2004; Cowart et al., 2013; alvinocarid shrimps, vesicomyid bivalves, Teixeira et al., 2013; LaBella et al., 2017; Pereira et al., 2020). In Alvinocarididae shrimps, the level of genetic differentiation was low enough to suggest a high level of contemporary gene flow (Teixeira et al., 2013; Pereira et al., 2020). In the present study, IMa3 analysis, in conjunction with the possible assignment of one Nigerian B. boomerang individual to the Barbados genetic group (individual (a) Figure 3), may also suggest the existence of contemporary gene flow across the AEB. For B. boomerang, a large and significant proportion of migrants was, indeed, estimated from Barbados to Western African Margin (2N2m2>3 = 63.239), although the HPD95% included zero. Despite the fact that the lower boundary of HPD95% includes zero, gene flow in the opposite direction was not null (2N3m3>2 = 0.015) and gave support to a bi-directional larval exchange between populations. It is noteworthy that migration rates estimated in IMa3 represent migration rates since population divergence. Calculations based on mitochondrial DNA may thus translate to past gene flow. But, in conjunction with the detection of the potential Barbados to Nigeria migrant, the large 2N2m2>3 argued in favor of eastward contemporary gene flow. By contrast, IMa3 results did not provide evidence for trans-Atlantic gene flow for G. mauritanicus as migration rates were always low (<1) and non-significantly different from zero. It nevertheless supported ancestral gene flow between the US Atlantic and European margins.
The presence of contemporary gene flow across the AEB would assume the existence of teleplanic larvae (or larvae with a long larval life span exceeding several months) and the existence of marine corridors ensuring the transport of larvae by marine currents (e.g. the AMOC, Gary et al., 2020). Such hypothesis is likely for bathymodioline mussels, especially for G. childressi, in which larval lifespan is estimated to be more than one year and vertical migration of larvae that then benefit from surface oceanic circulation have been documented, although some larvae have also been collected near the bottom (Arellano and Young, 2009; Arellano and Young, 2011; Young et al., 2012; Arellano et al., 2014; Laming et al., 2018). Overall VIKING20X model results showed a strong larval retention within each geographic region (Table 6) as already observed elsewhere (Young et al., 2012). The maximum distance a larva can achieve during one year (Figure 7) nevertheless suggested that Barbados populations can be directly connected to Africa, although eastward flows were low (0.1% of larvae exchanged at maximum during extreme events, Table 6). In addition, the Amazonian basin (which is geographically close and connected to Barbados and North Brazil, Figure 5) was able to send up to 10% of larvae to Western Africa during extreme events (Table 6). In the opposite direction, the African populations were only able to send a low percentage of larvae to the Amazonian basin (0.1% at maximum during extreme events, Table 6). Although putative Amazonian populations may send a large proportion of larvae to Barbados-KeJ (up to 15%, Table 6), the very low flow from Western Africa to Brazil may prevent, or largely challenge, effective dispersal from Western Africa to Barbados-KeJ.
Altogether, these results suggested that contemporary gene flow across the Atlantic Ocean is possible but rare and occurs most probably from West to East and in surface waters. Interestingly, in our study, the eastward flow was only evidenced for B. boomerang and not for G. mauritanicus. While a sampling bias cannot be excluded to explain such results, G. mauritanicus and B. boomerang may also use distinct habitats, making one species able to disperse farther than the other. Usually, B. boomerang and B. heckerae are present at deeper sites (Olu-Le Roy et al., 2007; Olu et al., 2010; Coykendall et al., 2019 and Table 1). In addition, while both G. mauritanicus and B. boomerang use a dual symbiosis with both sulfo-oxidizing and methanotrophic bacteria in their gills, G. mauritanicus shows dominant methanotrophic phylotypes, suggesting that it requires high methane concentrations and a hard substratum to settle (Sibuet and Olu, 1998; Rodrigues et al., 2013a; Rodrigues et al., 2013b) whereas B. boomerang lives buried in soft sediment and may be able to process both methane and sulfide at low flow rates, including peripheral hydrothermal sediments (Olu et al., 1996; Cosel and Olu, 1998; Sibuet and Olu, 1998; Duperron et al., 2011). As a consequence, this latter species is supposed to be adapted to a larger range of environmental conditions when compared to G. mauritanicus, which may favor dispersal.
4.3 Contemporary larval flow across the Caribbean Sea
Although IMa3 results supported the presence of a strong genetic break between populations of the Barbados Accretionary Prism and GoM for both genera (all migration rates estimates close to zero), the presence of three G. mauritanicus Barbados-KeJ type sampled in the Baltimore Canyon and the New England Seep (US Atlantic margin) (Figure 2) and the IMa3 estimation of 1.4 migrants per generation (not significant) between Barbados and US Atlantic margin gives support for low but existing larval exchanges across the Caribbean Sea. The presence of only a few individuals nevertheless suggested that such dispersal events are rare. This fits well with VIKING20X larval dispersal simulations which suggested low but reproductible larval flows across the Caribbean Sea (max. 0.9% to GoM and 0.4% to the US Atlantic margin during extreme events, Figure 5; Table 6). These larval flows were however much lower than those depicted between the South American and the African margins. In addition, despite no detected larval exchanges along the African coastline, between the Gulf of Cadiz and the Gulf of Guinea (Figure 5; Table 6), G. mauritanicus populations in these areas appeared genetically homogeneous (Figure 3). The lack or low genetic connectivity observed between the South American and US Atlantic margins is therefore difficult to explain. The settlement of large numbers of G. mauritanicus and B. boomerang in GoM or the US Atlantic margin canyons might be challenging due to differences in environmental conditions (e.g. maladaptation of southern migrants) if the break is due to a well-established genetic barrier (i.e. strong counter-selection of hybrids and the foreign parental form) instead of due to a lack of dispersing larvae. In the opposite direction, both IMa3 estimates and the larval dispersal modelling simulations were unable to detect GoM or US Atlantic margin canyon migrants in the Barbados-KeJ sites.
Larval exchanges between Barbados-KeJ and the US Atlantic margin thus seem to be, as observed between Western Africa and Barbados-KeJ, rare and are likely to occur northward. Cordes et al. (2007) hypothesized that a bidirectional connection may exist between the GoM and Barbados (through the deep Yucatan Strait and the St. Vincent and Dominica passages) but larval dispersal on the bottom appears extremely limited and in contradiction with our genetic data. An indirect way of sending larvae from the US Atlantic margin canyons to the Barbados Accretionary Prism would nevertheless be through the mid-Atlantic Ridge. VIKING20X larval dispersal simulations however weakly support this view but some larvae released in the US Atlantic margin canyons and Blake Ridge were theoretically able to reach the putative cold seeps modelled in NMAR (North Mid-Atlantic Ridge), which were, in turn connected (with a small value) to the central part of MAR and Barbados Accretionary Prism (Figure 5; Table 6).
4.4 Contemporary gene flow between GoM and the US Atlantic margin
As observed elsewhere (Carney et al., 2006; Faure et al., 2015; Coykendall et al., 2019), the G. childressi and B. heckerae lineages shared numerous haplotypes between GoM and US Atlantic margin canyon populations. This validates that these two regions are highly connected (Figures 2–4). This was especially true for G. childressi since all Fst values except ones involving the Shallop West population were close or equal to zero. While also based on COI data, Faure et al. (2015) suggested the occurrence of restricted gene flow between some localities within the GoM, however, we saw evidence of a lack of genetic structure and an apparent panmixia, as observed by Coykendall et al. (2019). The larger sample sizes involved in the present study and Coykendall et al. (2019) may explain this discrepancy. Absence or very low levels of genetic structure have also been observed for other cold seep species within the GoM, such as tubeworms (McMullin et al., 2010; Cowart et al., 2013; Cowart et al., 2014). In accordance with the absence of genetic differentiation observed in G. childressi, migration rates estimated with IMa3 between GoM and the US Atlantic margin was not null, but were significantly different from zero and strongly orientated from GoM to the US Atlantic margin canyons (2N1m1>0 = 46.41, 2N0m0>1 = 0.070). It is nevertheless noteworthy that the distribution of posterior probabilities of 2N0m0>1 exhibited an alternative peak around 15 migrants per generation (Supplementary Figure S6). IMa3 also indicated the occurrence of bidirectional gene flow for B. heckerae since both 2N1m1>0 and 2N0M0>1 were significantly different from zero, although the HPD95% included zero, with values around 10 migrants per generation (Table 2). Accordingly, most Fst values were low and not significantly different from zero between the US Atlantic margin canyons, Pick Up Sticks, and the other GoM seeps (including the Florida Escarpment). However, highly significant genetic differentiation was also found in B. heckerae populations between Blake Ridge and the Florida Escarpment, suggesting restricted gene flow between these two populations. These two latter localities have been repeatedly described as peculiar as compared to other GoM and US Atlantic margin canyon seeps and are much deeper (usually less than 2000 m) than the depth range tolerated by G. childressi. As a consequence, the distribution of B. heckerae is probably more fragmented than that of G. childressi (Olu-Le Roy et al., 2007; Olu et al., 2010; Faure et al., 2015; Turner et al., 2020; DeLeo et al., 2022). Sampling B. heckerae at the shallower Pick Up Sticks site (400-450 m) is therefore unexpected. The Fst value between Pick Up Sticks and Blake Ridge was lower than other Fst values involving Blake Ridge, so Pick Up Sticks may be also viewed as putatively receiving migrants from both the Blake Ridge and Florida Escarpment seeps.
In accordance with the northward flow depicted by IMa3, larval dispersal simulations evidenced a non-negligible larval transport from GoM/Florida Escarpment towards the US Atlantic margin (up to 6% in extreme events, Table 6). In the meantime, population genetics cannot discard the hypothesis of bidirectional gene flow, although likelihood ratio tests for migration rates are prone to false positives when divergence is weak and sample sizes low (Hey et al., 2015). However, no larvae from the US Atlantic margin canyon seeps were able to reach the GoM (Figure 5; Table 6). Although our simulations included a period of several weeks before larvae reach the surface layers, they fully agreed with previous larval dispersal studies focusing on surface dispersal done by Young et al. (2012); McVeigh et al. (2017), and Gary et al. (2020) for G. childressi. By contrast larval transport onto the seafloor led to very limited dispersal distances and a lack of population connectivity between oceanic provinces (results not shown, see also Gary et al., 2020), but physical models on large-scale oceanic circulation do not take the seafloor topology into account with accuracy. Accordingly, if some larvae disperse using bottom currents, these flows may have been overlooked. Such bottom currents often flow in the opposite direction and could explain some unexpected gene flow entering in the GoM (e.g., deep-water current along the Sigsbee Escarpment in the GoM, Hamilton, 2009). To this extent, Cordes et al. (2007) suggested that below 1000 m larvae could be transported southward with the deep western boundary current of the Atlantic, reaching Blake Ridge and going to the Caribbean through the Anagada or the Windward Pass. There, the deepest layers of the Loop Current may take larvae through the Yucatan strait to the GoM. In the GoM, the cyclonic and boundary currents (Furey et al., 2018) may take larvae and ensure mixing between the US Atlantic margin and GoM. Recently, DeLeo et al. (2022) also found evidence of mostly southward gene flow in G. childressi along the US Atlantic margin between Baltimore Canyon, Chincoteague and Norfolk Canyon.
The bidirectional gene flow suggested by IMa3 may then result from this double dispersal strategy, using both surface and bottom currents. Moreover, the fact that migration rates seem to be more balanced for B. heckerae may result from its deeper distribution (larvae thus released deeper) and the required time needed to reach the upper layers of the ocean. This could partially explain why B. heckerae is more spatially structured than G. childressi because, when dispersing at the bottom, larvae travel shorter distances than in surface waters (McVeigh et al., 2017; Gary et al., 2020). It is however noteworthy that such migration routes could result in the presence of B. heckerae and/or G. childressi in Barbados seeps, while none have been sampled. Their absence may be explained, for example, by the fact that larvae could not cross the Caribbean Sea entirely and may be trapped in the Windward Pass. Alternatively, the apparent absence of B. heckerae or G. childressi may be erroneous because of the study of mitochondrial DNA only if a genetic barrier exists. Indeed, the B. heckerae or G. childressi mtDNA types may be counter-selected in Barbados seeps while, actually, hybrids between B. heckerae/B. boomerang or G. childressi/G. mauritanicus could exist and would be detectable only using nuclear markers and genomics analyses.
4.5 Incomplete lineage sorting
As discussed above, dispersal events across the AEB and the Caribbean Sea seem to be rare and may fail to explain the lack of divergence observed between populations from both sides of the Atlantic. Indeed, even if occurring, migration seems not efficient enough to homogenize B. boomerang and G. mauritanicus populations from the Eastern and Western sides of the North Atlantic. Despite being from the same species and showing low divergence, populations of G. mauritanicus and B. boomerang from Barbados and Western Africa were, indeed, both genetically differentiated with no shared haplotypes and highly significant Fst values (≈ 0.3 and 0.5). Caution must however be taken as rare long-distance mitochondrial migrants might only be rare because of a strong counter-selection against hybrids due to the presence of a genetic barrier, which could be relaxed for neutrally-behaving markers associated with the nuclear genome. In that specific case, cross-Atlantic gene flow could be more important than solely predicted by the mitochondrial genome alone. Nevertheless, in the absence of efficient gene flow, the lack of fixed differences is likely to result from incomplete lineage sorting. In species in which effective size is expected to be very large, the lineage sorting process is slow and usually achieved in a period of time greater than 6Ne generations (Rosenberg 2003). In broadcast spawners such as bathymodioline mussels, high effective sizes are expected (e.g. Ciona savignyi, Small et al., 2007; Rimicaris exoculata, Teixeira et al., 2011). In our study, IMa3 estimates of effective population sizes were very large (often >1 million ind.) for all populations (except B. boomerang from Barbados) and 6Ne generations thus represent very large periods of time that greatly exceed the estimated population splitting times T1 and T2 estimated using a generation time of one year. Moreover, the lack of fixed differences between Barbados-KeJ and Africa-Cadiz populations in the two lineages B. boomerang and G. mauritanicus could also be the result of past gene flow and ‘old’ corridors of colonization. Such a hypothesis can be illustrated by the finding of one intermediate mitochondrial haplotype between G. childressi and G. mauritanicus sampled at the northernmost US Atlantic margin New England seepage, providing that it is not a recombining haplotype due to local hybridization between these two geographic species. Since this haplotype was closer to Africa-Cadiz haplotypes than to Barbados-KeJ ones, it may trace back a northern pathway of dispersal of Gigantidas, possibly relayed by the NMAR/Reykjavik Ridge. This is in accordance with the study of LaBella et al. (2017) on the deep vesicomyid clam Abyssogena sp. in which authors detected the presence of Florida Escarpment-derived haplotypes in the Gulf of Guinea populations. These two populations nevertheless did not share haplotypes, suggesting that the genetic signal observed may result from ancient gene flow from US Atlantic margin to Africa. Migration rates estimated by IMa3 (without the intermediate haplotype) however weakly supported this assumption with estimates derived from the ancestral populations of Gigantidas being almost null and non-significant. Caution must be taken, however, in extracting past information from our genetic data because of the lack of power associated with our single locus analysis. Multi-locus (e.g. Restriction Site Associated DNA sequencing) analyses may discriminate past from contemporary trans-Atlantic gene flow, making it possible to investigate if hybridization between species occurs, as suggested by the intermediate New England individual.
5 Conclusion and perspectives
Overall, genetic analyses suggested a parallel isolation of Gigantidas and Bathymodiolus species complexes in the Atlantic Ocean and validated the hypothesis of a vicariant effect resulting from a hydrographic barrier isolating mussel populations across the Caribbean Sea, with a wider and amphi-Atlantic distribution of the southern lineages. Contemporary gene flow between western and eastern margins of the North Atlantic and long-distance larval flow seemed to be rare (at least for the mitochondrial genome), as suggested by the presence of a few putative long-distance migrants (one across the EAB and three across the Caribbean Sea), and the strong spatial segregation of haplotypes indicative of low migration rates. The finding of long-distance migrants, although rare, is however not anecdotic given our sampling sizes and because foreign mitochondrial haplotypes are likely to be counter-selected in the recipient populations in the face of a genetic barrier. When, or if, trans-Atlantic gene flow occurs, it likely was in an eastward direction in surface waters and only for B. boomerang. Across the Carribean Sea, from Barbados-KeJ populations to the US Atlantic margin, gene flow seemed to occur northward and only for G. mauritanicus. Between the GoM and the US Atlantic margin, bidirectional gene flow may occur for B. heckerae but was not detected for G. childressi and was not evidenced using larval dispersal modeling.
On the one hand, the differences in migrant detection between species and genera might suggest that Bathymodiolus spp. and Gigantidas spp. disperse slightly differently. This may be due to depth, habitat fragmentation and ecological preferences of the two genera in accordance with symbionts requirements: mostly methanotrophic for Gigantidas spp. (Duperron et al., 2007; Demopoulos et al., 2019; Coykendall et al., 2019; Turner et al., 2020), while Bathymodiolus spp. harbor a dual symbiosis and relies more on sulfide-derived carbon (Prouty et al., 2016; Van Dover et al., 2003; DeLeo et al., 2022). Contrasted levels of spatial genetic sub-structuring and contemporary gene flow between species that went through the same vicariant effects have also been reported in relation with species-specific life history traits and dispersal abilities in several other oceanic regions (Plouviez et al., 2009; Thaler et al., 2014; Poitrimol et al., 2022; Tran Lu Y et al., 2022). In the Atlantic Ocean, two sympatric cold-water corals Desmophyllum pertusum and Madrepora oculata showed different post-glacial recolonization histories, most probably as a response to contrasted dispersal abilities and ecological requirements (Boavida et al., 2019). It is nevertheless noteworthy that several non-exclusive hypotheses were supported by our results and further studies using nuclear DNA and powerful genomics approaches with larger sample sizes may be informative. This should allow the clarification of the evolutionary and colonization histories of bathymodioline mussels in the Atlantic Ocean and to resolve more precisely the past and current components of effective migration rates. It would also allow determining if the observed genetic structure of G. mauritanicus/B. boomerang between Barbados and Western Africa is the result of long-term isolation and incomplete lineage sorting or of secondary contact due to the Panama isthmus closure.
Although several sources of bias and variability may be present while modelling larval dispersal (e.g. the effects of long-term exposure to high temperatures on larval survival and development; larval pelagic phase of one year which may be unrealistic for B. heckerae, Dixon et al., 2006; the impact of predation on larvae travelling in zooplankton on the probability of long-distance dispersal, Gary et al., 2020; larval vertical distribution and behavior), combining larval dispersal modelling with genetic data highlighted interesting key points. First, the detection of potential gene flow using genetics while not detected using dispersal modelling illustrated the complementarity between these two approaches. The few studies combining genetics and larval dispersal modelling of the deep fauna did not either always fully reconcile gene flow estimates with predicted larval transport (need for ‘phantom’ stepping stones to explain gene flows, opposite flow directions between the two approaches, Breusing et al., 2016; Breusing et al., 2021). Second, the dual genetics-modelling approach highlighted the importance of “extreme” dispersal events in terms of genetic connectivity. Considering only mean values of larval exchanges may not be sufficient to explain the genetic spatial structure of a given species (e.g. no genetic differentiation observed between the Gulf of Cadiz and African populations of G. mauritanicus despite less than 0.1% larval transport between them). Modelling decadal variations in hydrodynamics due to the North Atlantic Oscillation and/or the El Niño Southern Oscillation in future studies may thus provide insights into the impact of such hydrodynamic variations on genetic connectivity at the whole ocean scale. It is nevertheless noteworthy that if such periodic events caused bursts of migration, it should be detectable while investigating the spatial genetic structure. Since our data supported the existence of few migrants and a strong genetic differentiation between the Barbados and African margins, and between these and the GoM or US margin populations, it is more likely that periodic hydrodynamic oscillations only transport a small number of migrants.
Altogether, our study supports the need to combine genomics and larval dispersal modelling approaches in other complexes of species with pan-oceanic or large spatial distribution (Breusing et al., 2016; Breusing et al., 2021; Boavida et al., 2019; Lee et al., 2019). This may improve understanding of species biology, dispersal capabilities and connectivity at whole ocean scales. This is particularly relevant since dispersal is linked to resilience capabilities of deep-sea ecosystems and species which are more and more threatened (Van Dover, 2014; Gross, 2015). Identifying source and sink populations and precisely describing connectivity for different species is necessary to define comprehensive conservation measures such as networks of protected marine areas that will act as refuge zones and genetic diversity reservoirs connected by corridors identified based on biological needs of species (Van Dover, 2014; Gross, 2015; Levin and Le Bris, 2015; Boavida et al., 2019). In the case of conservation strategies for bathymodioline mussel in the Atlantic Ocean, the strong geographic structure and the high rate of larval retention observed in our study suggested that long-distance dispersal is probably not efficient enough to replenish foreign populations, although it may enable the colonization of new territories or the recolonization of territories after local extinction. If larvae disperse using surface currents, as suggested by the results of our combined genetics-modelling approach, then there could be climate change impacts on connectivity and resilience for Gigantidas and Bathymodiolus species in the Atlantic. Increasing water temperatures may lead to a decrease in pelagic larval duration and an increase of larval mortality for bathymodioline mussels (Yorisue et al., 2013; Arellano and Young, 2009; Arellano and Young, 2011; Arellano et al., 2014; Yahagi et al., 2017), combining to further reduce the apparently low connectivity of these species.
Data availability statement
The datasets presented in this study can be found in online repositories. The names of the repository/repositories and accession number(s) can be found below: https://www.ebi.ac.uk/ena, PRJEB56597, https://www.pangaea.de/, https://doi.pangaea.de/10.1594/PANGAEA.955455, https://figshare.com/, https://figshare.com/articles/figure/Coupling_large-spatial_scale_larval_dispersal_modelling_with_barcoding_to_refine_the_amphi-Atlantic_connectivity_hypothesis_in_deep-sea_seep_mussels/22227670/2.
Author contributions
DJ, ET and AN designed the research. EP, LM, A-SP, MB and CD-T performed laboratory work. GL and AN conducted first modelling analyses and WR provided the whole series of larval simulations over 25 dates. EP and DJ conducted population genetics analyses. AN and ET performed larval dispersal modelling analyses derived from the VIKING20X Atlantic circulation model developed by AB. CM, MC, CY and CV provided samples and scientific advice. EP wrote the first version of the manuscript with the help of ET and DJ. Next versions were improved by all authors who agreed to the published version of the manuscript. All authors contributed to the article and approved the submitted version.
Funding
This study was funded by the European Union’s Horizon 2020 research and innovation program under grant agreement No 818123 (iAtlantic, https://www.iatlantic.eu/).
Acknowledgments
We are deeply grateful to all the ship and ROV crews over the years and the world for their time and efforts devoted to collect samples (see Table 1 for a detailed list of cruises involved in the present study). We more particularly warmly thank Clara Rodrigues (CESAM, University of Aveiro, Aveiro, Portugal), Caitlin Plowman (University of Oregon, Eugene, USA), Bernie Ball (University College Dublin, Ireland), Travis Washburn (Duke University, North Carolina, USA), Amanda Demopoulos, Carolyn Ruppel, and Jennifer McClain-Counts (USGS), Andrea Quattrini (Smithsonian Institution, Washington D.C., USA), Erik Cordes (Temple University), James Brooks and Bernie Bernard (TDI Brooks International), Shawn Arellano (Western Washington University), Ryohing He and Dave Eggleston (North Carolina State University) for their involvement in sending and processing samples, as well as Bernie Ball for producing COI sequences from US Atlantic margin samples (see Supplementary Table S1). We also are grateful to Emily Blank and Breda M. Zimkus (Museum of Comparative Zoology, Harvard University) for the MCZ Cryogenic loan of B. boomerang (Kick ‘em Jenny: lot 380695-99). We thank Stéphane Hourdez and Hayat Guezi for mussel dissection during the WACS cruise. This work benefited from access to the Biogenouest Genomer platform at Station Biologique de Roscoff, and we are grateful to the Roscoff Bioinformatics platform ABiMS and the computing facilities they allowed us to use to perform analyses (http://abims.sb-roscoff.fr). This work also benefitted from the computing facilities of the North German Supercomputing Alliance (HLRN) and the Earth System Modelling Project (ESM) partition of the supercomputer JUWELS at the Jülich Supercomputing Centre (JSC). Part of the samples were obtained thanks to the NSF grant OCE-1851383 and to the Bureau of Ocean Energy Management contract M17PC00009 to TDI Brooks International. Any use of trade, product, or firm names is for descriptive purposes only and does not imply endorsement by the U.S. Government. Finally, we are grateful to the two reviewers for their useful comments that improved the quality of our manuscript.
Conflict of interest
The authors declare that the research was conducted in the absence of any commercial or financial relationships that could be construed as a potential conflict of interest.
Publisher’s note
All claims expressed in this article are solely those of the authors and do not necessarily represent those of their affiliated organizations, or those of the publisher, the editors and the reviewers. Any product that may be evaluated in this article, or claim that may be made by its manufacturer, is not guaranteed or endorsed by the publisher.
Supplementary material
The Supplementary Material for this article can be found online at: https://www.frontiersin.org/articles/10.3389/fmars.2023.1122124/full#supplementary-material
Footnotes
References
Adams D. K., Arellano S. M., Govenar B. (2012). Larval dispersal - vent life in the water column. Oceanography 25, 256–268. doi: 10.5670/oceanog.2012.24
Andersen A. C., Hourdez S., Marie B., Jollivet D., Lallier F. H., Sibuet M. (2004). Escarpia southwardae, a new species of vestimentiferan tubeworm (Annelida, siboglinidae) from West-African cold seeps. J. Can. Zool. 82, 980–999. doi: 10.1139/z04-049
Arellano S. M. (2008). Embryology, larval ecology, and recruitment of "Bathymodiolus" childressi, a cold-seep mussel from the gulf of Mexico. PhD thesis. (Department of Biology and the Graduate School of the University of Oregon).
Arellano S. M., Van Gaest A. L., Johnson S. B., Vrijenhoek R. C., Young C. M. (2014). Larvae from deep-sea methane seeps disperse in surface waters. Proc. R. Soc. London B: Biol. Sci. 281 (1786), 20133276. doi: 10.1098/rspb.2013.3276
Arellano S. M., Young C. M. (2009). Spawning, development, and the duration of larval life in a deep-sea cold-seep mussel. Biol. Bull. 216 (2), 149–162. doi: 10.1086/BBLv216n2p149
Arellano S. M., Young C. M. (2011). Temperature and salinity tolerances of embryos and larvae of the deep-sea mytilid mussel ‘Bathymodiolus’ childressi. mar. Biol. 158, 2481–2493. doi: 10.1007/s00227-011-1749-9
Assié A., Borowski C., van der Heijden K., Raggi L., Geier B., Leisch N., et al. (2016). A specific and widespread association between deep-sea bathymodiolus mussels and a novel family of epsilonproteobacteria. Environ. Microbiol. Rep. 8, 805–813. doi: 10.1111/1758-2229.12442
Baco A. R., Rowden A. A., Levin L. A., Smith C. R., Bowden D. A. (2010). Initial characterization of cold seep faunal communities on the new Zealand hikurangi margin. Mar. Geol. 272, 251–259. doi: 10.1016/j.margeo.2009.06.015
Bandelt H., Forster P., Röhl A. (1999). Median-joining networks for inferring intraspecific phylogenies. Mol. Biol. Evol. 16, 37–48. doi: 10.1093/oxfordjournals.molbev.a026036
Barry J. P., Buck K. R., Kochevar R. K., Nelson D. C., Fujiwara Y., Goffredi S. K., et al. (2002). Methane-based symbiosis in a mussel, Bathymodiolus platifrons, from cold seeps in sagami bay, Japan. Invertebrate Biol. 121 (1), 47–54. doi: 10.1111/j.1744-7410.2002.tb00128.x
Biastoch A., Schwarzkopf F. U., Getzlaff K., Rühs S., Martin T., Scheinert M., et al. (2021). Regional imprints of changes in the Atlantic meridional overturning circulation in the eddy-rich ocean model VIKING20X. Ocean Sci. 17, 1177–1211. doi: 10.5194/os-17-1177-2021
Boavida J. R. H., Becheler R., Choquet M., Frank N., Taviani M., Bourillet J. F., et al. (2019). Out of the Mediterranean? post-glacial colonization pathways varied among cold-water coral species. J. Biogeogr. 46, 915–931. doi: 10.1111/jbi.13570
Brazelton W. J., Schrenk M. O., Kelley D. S., Baross J. A. (2006). Methane-and sulfur-metabolizing microbial communities dominate the lost city hydrothermal field ecosystem. Appl. Environ. Microbiol. 72, 6257–6270. doi: 10.1128/AEM.00574-06
Breusing C., Biastoch A., Drews A., Metaxas A., Jollivet D., Vrijenhoek T., et al. (2016). Biophysical and population genetic models predict the presence of “phantom“ stepping stones connecting mid-Atlantic ridge vent ecosystems. Curr. Biol. 26 (17), 2257–2267. doi: 10.1016/j.cub.2016.06.062
Breusing C., Johnson S. B., Mitarai S., Beinart R. A., Tunnicliffe V. (2021). Differential patterns of connectivity in Western pacific hydrothermal vent metapopulations: A comparison of biophysical and genetic models. Evolutionary Appl. 00, 1–14. doi: 10.1111/eva.13326
Busch K., Taboada S., Riesgo A., Koutsouveli V., Ríos P., Cristobo J., et al. (2021). Population connectivity of fan-shaped sponge holobionts in the deep cantabrian Sea. Deep Sea Res. I 167, 103427. doi: 10.1016/j.dsr.2020.103427
Carney S. L., Formica M. I., Divatia H., Nelson K., Fisher C. R., Schaeffer S. W. (2006). Population structure of the mussel "Bathymodiolus" childressi from gulf of Mexico hydrocarbon seeps. Deep Sea Res. I 53, 1061–1072. doi: 10.1016/j.dsr.2006.03.002
Chevaldonné P., Jollivet D., Desbruyères D., Lutz R. A., Vrijenhoek R. C. (2002). Sister-species of eastern pacific hydrothermal vent worms (Ampharetidae, alvinellidae, vestimentifera) provide new mitochondrial COI clock calibration. Cahiers Biologie Mar. 43 (3), 367–370.
Chevaldonné P., Jollivet D., Vangriesheim A., Desbruyères D. (1997). Hydrothermal-vent alvinellid polychaete dispersal in the eastern pacific. 1. influence of vent site distribution, bottom currents, and biological patterns. Limnol. Oceanogr. 42, 67–80. doi: 10.4319/lo.1997.42.1.0067
Chia F. S., Buckland-Nicks J., Young C. M. (1984). Locomotion of marine invertebrate larvae: a review. Can. J. Zool. 62, 1205–1222. doi: 10.1139/z84-176
Cordes E. E., Bergquist D. C., Fisher C. R. (2009). Macro-ecology of gulf of Mexico cold seeps. Annu. Rev. Mar. Sci. 1 (1), 143–168. doi: 10.1146/annurev.marine.010908.163912
Cordes E. E., Carney S. L., Hourdez S., Carney R. S., Brooks J. M. (2007). Cold seeps of the deep gulf of Mexico: Community structure and biogeographic comparisons to Atlantic equatorial belt seep communities. Deep-Sea Res. I 54, 637–653. doi: 10.1016/j.dsr.2007.01.001
Cosel R. (2002). A new species of bathymodioline mussel (Mollusca, bivalvia, mytilidae) from Mauritania (West Africa), with comments on the genus Bahymodiolus kenk and wilso. Zoosystema 24, 259–271.
Cosel V. R., Olu K. (1998). Gigantism in mytilidae. a new Bathymodiolus from cold seep areas on the Barbados accretionary prism. Comptes Rendus l'Académie Des. Sci. Paris Série II 321, 655–663. doi: 10.1016/S0764-4469(98)80005-X
Cowart D. A., Huang C., Arnaud-Haond S., Carney S. L., Fisher C. R., Schaeffer S. W. (2013). Restriction to large-scale gene flow vs. regional panmixia among cold seep escarpia spp. (Polychaeta, siboglinidae). Mol. Ecol. 22 (16), 4147–4162. doi: 10.1111/mec.12379
Cowart D. A., Halanych K. M., Schaeffer S. W., Fisher C. R. (2014). Depth-dependent gene flow in gulf of Mexico cold seep lamellibrachia tubeworms (Annelida, siboglinidae). Hydrobiologia 736, 139–154. doi: 10.1007/s10750-014-1900-y
Cowen R. K., Sponaugle S. (2009). Larval dispersal and marine population connectivity. Annu. Rev. Mar. Sci. 1 (1), 443–466. doi: 10.1146/annurev.marine.010908.163757
Coykendall D. K., Cornman R. S., Prouty N. G., Brooke S., Demopoulos A. W. J., Morrison C. L. (2019). Molecular characterization of Bathymodiolus mussels and gill symbionts associated with chemosynthetic habitats from the U.S. Atlantic margin. PloS One 14 (3), e0211616. doi: 10.1371/journal.pone.0211616
Delandmeter P., van Sebille E. (2019). The parcels v2.0 Lagrangian framework: new field interpolation schemes. Geoscientific Model. Dev. 12, 3571–3584. doi: 10.5194/gmd-12-3571-2019
DeLeo D. M., Morrison C. L., Sei M., Salamone V., Demopoulos A. W., Quattrini A. M. (2022). Genetic diversity and connectivity of chemosynthetic cold seep mussels from the US Atlantic margin. BMC Ecol. Evol. 22 (1), 1–16. doi: 10.1186/s12862-022-02027-4
Demopoulos A. W. J., McClain-Counts J. P., Bourque J. R., Prouty N. G., Smith B. J., Brooke S., et al. (2019). Examination of bathymodiolus childressi nutritional sources, isotopic niches, and food-web linkages at two seeps in the US Atlantic margin using stable isotope analysis and mixing models. Deep-Sea Res. I 148, 53–66. doi: 10.1016/j.dsr.2019.04.002
Distel D. L., Baco A. R., Chuang E., Morrill W., Cavanaugh C., Smith C. R. (2000). Marine ecology: do mussels take wooden steps to deep-sea vents? Nature 403, 725–726. doi: 10.1038/35001667
Dixon D. R., Lowe D. M., Miller P. I., Villemin G. R., Colaço A., Serrão-Santos R., et al. (2006). Evidence of seasonal reproduction in the Atlantic vent mussel Bathymodiolus azoricus, and apparent link with the timing of photosynthetic primary production. J. Mar. Biol. Assoc. United Kingdom 86, 1363–1371. doi: 10.1017/S0025315406014391
Doebeli M., Ruxton G. D. (1997). Evolution of dispersal rates in metapopulation models: branching and cyclic dynamics in phenotype space. Evolution 51 (6), 1730–1741. doi: 10.1111/j.1558-5646.1997.tb05097.x
Doyle J. J., Doyle J. L. (1987). A rapid DNA isolation procedure for small quantities of fresh leaf tissue. Phytochem. Bull. 19, 11–15.
Duperron S., Guezi H., Gaudron S. M., Ristova P. P., Wenzhofer F., Boetius A. (2011). Relative abundances of methane- and sulphur-oxidising symbionts in the gills of a cold seep mussel and link to their potential energy sources. Geobiology 9, 481–491. doi: 10.1111/j.1472-4669.2011.00300.x
Duperron S., Sibuet M., MacGregor B. J., Kuypers M. M. M., Fisher C. R., Dubilier N. (2007). Diversity, relative abundance and metabolic potential of bacterial endosymbionts in three bathymodiolus mussel species from cold seeps in the gulf of Mexico. Environ. Microbiol. 9 (6), 1423–1438. doi: 10.1111/j.1462-2920.2007.01259.x
Duperron S., Rodrigues C. F., Léger N., Szafranski K., Decker C., Olu K., et al. (2012). Diversity of symbioses between chemosynthetic bacteria and metazoans at the guiness cold seep site (Gulf of Guinea, West Africa). Microbiol. Open 1 (4), 467–480. doi: 10.1002/mbo3.47
Edgar R. C. (2004). MUSCLE: multiple sequence alignment with high accuracy and high throughput. Nucleic Acids Res. 32, 1792–1797. doi: 10.1093/nar/gkh340
Edwards K. P., Hare J. A., Werner F. E., Seim H. (2007). Using 2-dimensional dispersal kernels to identify the dominant influences on larval dispersal on continental shelves. Mar. Ecol. Prog. Ser. 352, 77–87. doi: 10.3354/meps07169
Excoffier L., Lischer H. E. L. (2010). Arlequin suite ver 3.5: A new series of programs to perform population genetics analyses under Linux and windows. Mol. Ecol. Resources 10, 564–567. doi: 10.1111/j.1755-0998.2010.02847.x
Faure B., Jollivet D., Tanguy A., Bonhomme F., Bierne N. (2009). Speciation in the deep sea: Multi-locus analysis of divergence and gene flow between two hybridizing species of hydrothermal vent mussels. PloS One 4 (8), e6485. doi: 10.1371/journal.pone.0006485
Faure B., Schaeffer S. W., Fisher C. R. (2015). Species distribution and population connectivity of deep-Sea mussels at hydrocarbon seeps in the gulf of Mexico. PloS One 10 (4), e0118460. doi: 10.1371/journal.pone.0118460
Fisher C. R., Childress J. J., Oremland R. S., Bidigare R. R. (1987). The importance of methane and thiosulfate in the metabolism of the bacterial symbionts of two deep-sea mussels. Mar. Biol. 96, 59–71. doi: 10.1007/BF00394838
Folmer O., Black M., Hoeh W., Vrijenhoek R. C. (1994). DNA Primers for amplification of mitochondrial cytochrome c oxidase subunit I from metazoan invertebrates. Mol. Mar. Biol. Biotechnol. 3, 294–299.
Fox A., Handmann P., Schmidt C., Fraser N., Rühs S., Sanchez-Franks A., et al. (2022). Exceptional freshening and cooling in the eastern subpolar north Atlantic caused by reduced Labrador Sea surface heat loss. Ocean Sci. 18, 1507–1533. doi: 10.5194/os-18-1507-2022
Fujikura K., Kojima S., Tamaki K., Maki Y., Hunt J., Okutani T. (1999). The deepest chemosynthesis-based community yet discovered from the hadal zone 7326m deep, in the Japan trench. Mar. Ecol. Prog. Ser. 190, 17–26. doi: 10.3354/meps190017
Fujikura K., Yamanaka T., Sumida P. Y. G., Bernardino A. F., Pereira O. S., Kanehara T., et al. (2017). Discovery of asphalt seeps in the deep southwest Atlantic off Brazil. Deep Sea Res. Part II: Topical Stud. Oceanogr. 146, 35–44. doi: 10.1016/j.dsr2.2017.04.002
Furey H., Bower A., Perez-Brunius P., Hamilton P., Leben R. (2018). Deep eddies in the gulf of Mexico observed with floats. J. Phys. Oceanogr. 48 (11), 2703–2719. doi: 10.1175/JPO-D-17-0245.1
Gaines S. D., Gaylord B., Gerber L. R., Hastings A., Kinlan B. P. (2007). Connecting places: the ecological consequences of dispersal in the sea. Oceanography 20, 90–99. doi: 10.5670/oceanog.2007.32
Gary S. F., Fox A. D., Biastoch A., Roberts J. M., Cunningham S. A. (2020). Larval behaviour, dispersal and population connectivity in the deep sea. Sci. Rep. 10 (1), 1–12. doi: 10.1038/s41598-020-67503-7
Gebruk A., Chevaldonné P., Shank T., Lutz R., Vrijenhoek R. (2000). Deep-sea hydrothermal vent communities of the logatchev area (14°45′N, mid-Atlantic ridge): Diverse biotopes and high biomass. J. Mar. Biol. Assoc. United Kingdom 80 (3), 383–393. doi: 10.1017/S0025315499002088
Génio L., Johnson S. B., Vrijenhoek R. C., Cunha M. R., Tyler P. A., Kiel S., et al. (2008). New record of “Bathymodiolus“ mauritanicus cosel 2002 from the gulf of cadiz (NE Atlantic) mud volcanoes. J. Shellfish Res. 27 (1), 53–61. doi: 10.2983/0730-8000(2008)27[53:NROBMC]2.0.CO;2
Gilg M. R., Hilbish T. J. (2003). The geography of marine larval dispersal: coupling genetics with fine-scale physical oceanography. Ecology 84 (11), 2989–2998. doi: 10.1890/02-0498
Gouy M., Guindon S., Gascuel O. (2010). SeaView version 4: A multiplatform graphical user interface for sequence alignment and phylogenetic tree building. Mol. Biol. Evol. 27, 221–224. doi: 10.1093/molbev/msp259
Gross M. (2015). Deep sea in deep trouble? Curr. Biol. 25, R1019–R1021. doi: 10.1016/j.cub.2015.10.030
Gustafson R. G., Turner R. D., Lutz R. A., Vrijenhoek R. C. (1998). A new genus and five new species of mussels (Bivalvia, mytilidae) from deep-sea sulfide/hydrocarbon seeps in the gulf of Mexico. Malacologia 40 (1-2), 63–112.
Hamilton P. (2009). Topographic rossby waves in the gulf of Mexico. Prog. Oceanogr. 82, 1–31. doi: 10.1016/j.pocean.2009.04.019
Hamilton W. D., May R. M. (1977). Dispersal in stable habitats. Nature 269 (5629), 578–581. doi: 10.1038/269578a0
Handal W., Szostek C., Hold N., Andrello M., Thiébaut E., Harney E., et al. (2020). New insights on the population genetic structure of the great scallop (Pecten maximus) in the English channel, coupling microsatellite data and demogenetic simulations. Aquat. Conservation: Mar. Freshw. Ecosyst. 30 (10), 1841–1853. doi: 10.1002/aqc.3316
Harrison S., Hastings A. (1996). Genetic and evolutionary consequences of metapopulation structure. Trends Ecol. Evol. 11 (4), 180–183. doi: 10.1016/0169-5347(96)20008-4
Haug G. H., Tiedemann R. (1998). Effect of the formation of the isthmus of Panama on Atlantic ocean thermohaline circulation. Nature 393 (6686), 673–676. doi: 10.1038/31447
Haug G. H., Tiedemann R., Zahn R., Ravelo A. C. (2001). Role of Panama uplift on oceanic freshwater balance. Geology 29, 207–210. doi: 10.1130/0091-7613(2001)029<0207:ROPUOO>2.0.CO;2
Hecker B. (1985). Fauna from a cold sulfur-seep in the gulf of Mexico: comparison with hydrothermal vent communities and evolutionary implications. Bull. Biol. Soc. Washington 6), 465–473.
Herring P. J., Dixon D. R. (1998). Extensive deep-sea dispersal of postlarval shrimp from a hydrothermal vent. Deep Sea Res. Part I: Oceanogr. Res. Pap. 45 (12), 2105–2118. doi: 10.1016/S0967-0637(98)00050-8
Hey J., Chung Y., Sethuraman A. (2015). On the occurrence of false positives in tests of migration under an isolationwith-migration model. Mol. Ecol. 24, 5078–5083. doi: 10.1111/mec.13381
Hey J., Chung Y., Sethuraman A., Lachance J., Tishkoff S., Sousa V. C., et al. (2018). Phylogeny estimation by integration over isolation with migration models. Mol. Biol. Evol. 35 (11), 2805–2818. doi: 10.1093/molbev/msy162
Hirschi J. J. M., Barnier B., Böning C., Biastoch A., Blaker A. T., Coward A., et al. (2020). The Atlantic meridional overturning circulation in high-resolution models. J. Geophys. Res.: Oceans 125 (4), e2019JC015522. doi: 10.1029/2019JC015522
Johnson S. B., Won Y. J., Harvey J. B. J., Vrikenhoek R. C. (2013). A hybrid zone between Bathymodiolus mussel lineages from eastern pacific hydrothermal vents. BMC Evolutionary Biol. 13, 21. doi: 10.1186/1471-2148-13-21
Johnson S. B., Young C. R., Jones W., Waren A., Vrikenhoek R. C. (2006). Migration, isolation, and speciation of hydrothermal vent limpets (Gastropoda; lepetodrilidae) across the blanco transform fault. Biol. Bull. 210, 140–157. doi: 10.2307/4134603
Jollivet D., Faugères J. C., Griboulard R., Desbruyères D., Blanc G. (1990). Composition and spatial organization of a cold seep community on the south Barbados accretionnary prism: tectonic, geochemical and sedimentary context. Prog. Oceanogr. 24, 25–46. doi: 10.1016/0079-6611(90)90017-V
Jollivet D., Portanier E., Nicolle A., Thiébaut E., Biastoch A. (2023). Atlantic Seep mussels larval dispersal simulations and genetic data. PANGAEA. doi: 10.1594/PANGAEA.955455
Jolly M. T., Viard F., Weinmayr G., Gentil F., Thiébaut E., Jollivet D. (2003). Does the genetic structure of Pectinaria koreni (Polychaeta: Pectinariidae) conform to a source–sink metapopulation model at the scale of the baie de seine? Helgol Mar. Res; 56, 238–246. doi: 10.1007/s10152-002-0123-1
Jones B. T., Solow A., Ji R. (2016). Resource allocation for Lagrangian tracking. J. Atmospheric Oceanic Technol. 33, 1225–1235. doi: 10.1175/JTECH-D-15-0115.1
Jones W. J., Won Y. J., Maas P. A. Y., Smith P. J., Lutz R. A., Vrijenhoek R. C. (2006). Evolution of habitat use by deep-sea mussels. Mar. Biol. 148, 841–851. doi: 10.1007/s00227-005-0115-1
Ketzer J. M., Augustin A., Rodrigues L. F., Oliveira R. S., Praeg D., Gomez Pivel M. A., et al. (2018). Gas seeps and gas hydrates in the Amazon deep-sea fan. Geo-Marine Lett. 38 (5), 429–438. doi: 10.1007/s00367-018-0546-6
Kim M., Kang J.-H., Kim D. (2022). Holoplanktonic and meroplanktonic larvae in the surface waters of the onnuri vent field in the central Indian ridge. J. Mar. Sci. Eng. 10 (2), 158. doi: 10.3390/jmse10020158
Knowlton N., Weigt L. A. (1998). New dates and new rates for divergence across the isthmus of Panama. Proc. R. Soc. London B 265, 2257–2263. doi: 10.1098/rspb.1998.0568
LaBella A. L., Van Dover C. L., Jollivet D., Cunningham C. W. (2017). Gene flow between Atlantic and pacific ocean basins in three lineages of deep-sea clams (Bivalvia: Vesicomyidae: Pliocardiinae) and subsequent limited gene flow within the Atlantic. Deep Sea Res. Part II: Topical Stud. Oceanogr. 137, 307–317. doi: 10.1016/j.dsr2.2016.08.013
Laming S. R., Gaudron S. M., Duperron S. (2018). Lifecycle ecology of deep-Sea chemosymbiotic mussels: A review. Front. Mar. Sci. 5. doi: 10.3389/fmars.2018.00282
Lande R. (1988). Genetics and demography in biological conservation. Sci. (Washington) 241 (4872), 1455–1460. doi: 10.1126/science.3420403
Le Bris N., Arnaud-Haond S., Beaulieu S., Cordes E., Hilario A., Rogers A., et al. (2017). “Hydrothermal vents and cold seeps,” in The first global integrated marine assessment: World ocean assessment I (Cambridge: Cambridge University Press), 853–862.
Lee W.-K., Kim S.-J., Hou B. K., Van Dover C. L., Ju S.-J. (2019). Population genetic differentiation of the hydrothermal vent crab Austinograea alayseae (Crustacea: Bythograeidae) in the southwest pacific ocean. PloS One 14 (4), e0215829. doi: 10.1371/journal.pone.0215829
Leigh J. W., Bryant D. (2015). POPART: Full-feature software for haplotype network construction. Methods Ecol. Evol. 6, 1110–1116. doi: 10.1111/2041-210X.12410
Lejeusne C., Chevaldonné P. (2006). Brooding crustaceans in a highly fragmented habitat: the genetic structure of Mediterranean marine cave-dwelling mysid populations. Mol. Ecol. 15 (13), 4123–4140. doi: 10.1111/j.1365-294X.2006.03101.x
Levin L. A., Baco A. R., Bowden D. A., Colaco A., Cordes E. E., Cunha M. R., et al. (2016). Hydrothermal vents and methane seeps: Rethinking the sphere of influence. Front.Mar.Sci. 3, 72. doi: 10.3389/fmars.2016.00072
Levin S. A., Cohen D., Hastings A. (1984). Dispersal strategies in patchy environments. Theor. population Biol. 26 (2), 165–191. doi: 10.1016/0040-5809(84)90028-5
Levin L. A., Le Bris N. (2015). The deep ocean under climate change. Science 350, 766–768. doi: 10.1126/science.aad0126
Lorion J., Kiel S., Faure B., Kawato M., Ho S. Y. W., Marshall B., et al. (2013). Adaptive radiation of chemosymbiotic deep-sea mussels. Proc. R Soc. B 280, 20131243. doi: 10.1098/rspb.2013.1243
Lutz R. A. (1988). Dispersal of organisms at deep-sea hydrothermal vents: a review. Oceanologica Acta Special Issue 8, 23–30.
MacArthur R., Wilson E. O. (1967). The theory of island biogeography (Princeton, USA: Princeton Landmarks in Biology. Princeton University Press), 224p.
MacDonald I. R., Boland G. S., Baker J. S., Brooks J. M., Kennicutt M. C., Bidigare R. R. (1989). Gulf of Mexico hydrocarbon seep communities. Mar. Biol. 101 (2), 235–247. doi: 10.1007/BF00391463
Maes G. E., Volckaert F. A. M. (2002). Clinal genetic variation and isolation by distance in the European eel Anguilla anguilla (L.). Biol. J. Linn. Soc. 77 (4), 509–521. doi: 10.1046/j.1095-8312.2002.00124.x
Marsh A. G., Mullineaux L. S., Young C. M., Manahan D. T. (2001). Larval dispersal potential of the tubeworm Riftia pachyptila at deep-sea hydrothermal vents. Nature 411 (6833), 77. doi: 10.1038/35075063
Matabos M., Jollivet D. (2019). Revisiting the Lepetodrilus elevatus species complex (Vetigastropoda: Lepetodrilidae), using samples from the galápagos and guaymas hydrothermal vent systems. J. Molluscan Stud. 85, 154–165. doi: 10.1093/mollus/eyy061
McCauley D. E. (1991). Genetic consequences of local population extinction and recolonization. Trends Ecol. Evol. 6 (1), 5–8. doi: 10.1016/0169-5347(91)90139-O
McCowin M. F., Feehery C., Rouse G. W. (2020). Spanning the depths or depth-restricted: Three new species of Bathymodiolus (Bivalvia, mytilidae) and a new record for the hydrothermal vent Bathymodiolus thermophilus at methane seeps along the Costa Rica margin. Deep–Sea Res. I 164, 103322. doi: 10.1016/j.dsr.2020.103322
McMullin E. R., Nelson K., Fisher C. R., Schaeffer S. W. (2010). Population structure of two deep sea tubeworms, lamellibrachia luymesi and seepiophila jonesi, from the hydrocarbon seeps of the gulf of Mexico. Deep-Sea Res. I 57, 1499–1509. doi: 10.1016/j.dsr.2010.07.012
McPeek M. A., Holt R. D. (1992). The evolution of dispersal in spatially and temporally varying environments. Am. Nat. 140 (6), 1010–1027. doi: 10.1086/285453
McVeigh D. M., Eggleston D. B., Todd A. C., Young C. M., He R. (2017). The influence of larval migration and dispersal depth on potential larval trajectories of a deep-sea bivalve. Deep Sea Res. Part I: Oceanogr. Res. Pap. 127, 57–64. doi: 10.1016/j.dsr.2017.08.002
Mitarai S., Watanabe H., Nakajima Y., Schepetkin A. F., McWilliams J. C. (2016). Quantifying dispersal from hydrothermal vent fields in the western pacific ocean. Proc. Natl. Acad. Sci. 113 (11), 2976–2981. doi: 10.1073/pnas.1518395113
Miyazaki J. I., Martins L., Fujita Y., Matsumoto H., Fujiwara Y. (2010). Evolutionary process of deep-Sea Bathymodiolus mussels. PloS One 5 (4), e10363. doi: 10.1371/journal.pone.0010363
Moilanen A., Hanski I. (1998). Metapopulation dynamics: effects of habitat quality and landscape structure. Ecology 79 (7), 2503–2515. doi: 10.1890/0012-9658(1998)079[2503:MDEOHQ]2.0.CO;2
Montes C., Cardona A., Jaramillo C., Pardo A., Silva J. C., Valencia V., et al. (2015). Middle Miocene closure of the central American seaway. Science 348, 226–229. doi: 10.1126/science.aaa2815
Olivieri I., Michalakis Y., Gouyon P. H. (1995). Metapopulation genetics and the evolution of dispersal. Am. Nat. 146 (2), 202–228. doi: 10.1086/285795
Olu K., Cordes E. E., Fisher C. R., Brooks J. M., Sibuet M., Desbruyères D. (2010). Biogeography and potential exchanges among the Atlantic equatorial belt cold-seep faunas. PloS One 5 (8), e11967. doi: 10.1371/journal.pone.0011967
Olu K., Lance S., Sibuet M., Henry P., Fiala-Médioni A., Dinet A. (1997). Cold seep communities as indicators of fluid expulsion patterns through mud volcanoes seaward of the Barbados accretionary prism. Deep Sea Res. Part I: Oceanogr. Res. Pap. 44 (5), 811–841. doi: 10.1016/S0967-0637(96)00123-9
Olu K., Sibuet M., Harmegnies F., Foucher J. P., Fiala-Medioni A. (1996). Spatial distribution of diverse cold seep communities living on various diapiric structures of the southern Barbados prism. Prog. Oceanogr. 38, 347–376. doi: 10.1016/S0079-6611(97)00006-2
Olu-Le Roy K., Sibuet M., Fiala-Médioni A., Gofas S., Salas C., Mariotti A., et al. (2004). Cold seep communities in the deep eastern Mediterranean Sea: composition, symbiosis and spatial distribution on mud volcanoes. Deep Sea Res. Part I: Oceanogr. Res. Pap. 51 (12), 1915–1936. doi: 10.1016/j.dsr.2004.07.004
Olu-Le Roy K., Von Cosel R., Hourdez S., Carney S. L., Jollivet D. (2007). Amphi-Atlantic cold-seep Bathymodiolus species complexes across the equatorial belt. Deep Sea Res. Part I: Oceanogr. Res. Pap. 54, 1890–1911. doi: 10.1016/j.dsr.2007.07.004
Pannell J. R., Charlesworth B. (1999). Neutral genetic diversity in a metapopulation with recurrent local extinction and recolonization. Evolution 53 (3), 664–676. doi: 10.2307/2640708
Pechenik J. A. (1990). Delayed metamorphosis by larvae of benthic marine invertebrates: Does it occur? is there a price to pay? Ophelia 32 (1–2), 63–94. doi: 10.1080/00785236.1990.10422025
Pereira O. S., Shimabukuro M., Bernardino A. F., Sumida P. Y. G. (2020). Molecular affinity of southwest Atlantic Alvinocaris muricola with Atlantic equatorial belt populations. Deep–Sea Res. I 163, 103343. doi: 10.1016/j.dsr.2020.103343
Plouviez S., Shank T. M., Faure B., Daguin-Thiebaut C., Viard F., Lallier F. H., et al. (2009). Comparative phylogeography among hydrothermal vent species along the East pacific rise reveals vicariant processes and population expansion in the south. Mol. Ecol. 18 (18), 3903–3917. doi: 10.1111/j.1365-294X.2009.04325.x
Poitrimol C., Thiébaut E., Daguin-Thiébaut C., Le Port A.-S., Ballenghien M., Tran Lu Y A., et al. (2022). Contrasted phylogeographic patterns of hydrothermal vent gastropods along south West pacific: Woodlark basin, a possible contact zone and/or stepping-stone. PloS One 17 (10), e0275638. doi: 10.1371/journal.pone.0275638
Pond D. W., Segonzac M., Bell M. V., Dixon D. R., Fallick A. E., Sargent J. R. (1997). Lipid and lipid carbon stable isotope composition of the hydrothermal vent shrimp Mirocaris fortunata: evidence for nutritional dependence on photosynthetically fixed carbon. Mar. Ecol. Prog. Ser. 157, 221–231. doi: 10.3354/meps157221
Portanier E., Nicolle A., Thiébaut E., Jollivet D., Rath W., Biastoch A. (2023). Atlantic Seep mussels larval dispersal simulations, figshare. Figure. doi: 10.6084/m9.figshare.22227670.v2
Pradillon F., Shillito B., Young C. M., Gaill F. (2001). Deep-sea ecology: Developmental arrest in vent worm embryos. Nature 413 (6857), 698. doi: 10.1038/35099674
Proskurowski G., Marvin D. L., Seewald J. S., Früh-Green G. L., Olson E. J., Lupton J. E., et al. (2008). Abiogenic hydrocarbon production at lost city hydrothermal field. Science 319, 604–607. doi: 10.1126/science.1151194
Prouty N. G., Sahy D., Ruppel C. D., Roark E. B., Condon D., Brooke S., et al. (2016). Insights into methane dynamics from analysis of authigenic carbonates and chemosynthetic mussels at newly-discovered Atlantic margin seeps. Earth Planet. Sci. Lett. doi: 10.1016/j.epsl.2016.05.023
Puillandre N., Brouillet S., Achaz G. (2021). ASAP: assemble species by automatic partitioning. Mol. Ecol. Resour. 21, 609–620. doi: 10.1111/1755-0998.13281
Puillandre N., Lambert A., Brouillet S., Achaz G. J. M. E. (2012). ABGD, automatic barcode gap discovery for primary species delimitation. Mol. Ecol. 21 (8), 1864–1877. doi: 10.1111/j.1365-294X.2011.05239.x
R Core Team (2021). R: A language and environment for statistical computing (Vienna, Austria: R Foundation for Statistical Computing). Available at: https://www.R-project.org/.
Raggi L., Schuboltz F., Hinrichs K.-U., Dubilier N., Petersen J. M. (2013). Bacterial symbionts of bathymodiolus mussels and escarpia tubeworms from chapopote, an asphalt seep in the southern gulf of Mexico. Environ. Microbiol. 15 (7), 1969–1987. doi: 10.1111/1462-2920.12051
Rodrigues C. F., Cunha M. R., Génio L., Duperron S. (2013b). A complex picture of associations between two host mussels and symbiotic bacteria in the northeast Atlantic. Naturwissenschaften 100, 21–31. doi: 10.1007/s00114-012-0985-2
Rodrigues C. F., Hilário A., Cunha M. R. (2013a). Chemosymbiotic species from the gulf of cadiz (NE atlantic): distribution, life styles and nutritional patterns. Biogeosciences 10, 2569–2581. doi: 10.5194/bg-10-2569-2013
Roughgarden J., Gaines S. D., Possingham H. (1988). Recruitment dynamics in complex life cycles. Science 241, 1460–1466. doi: 10.1126/science.11538249
Roux C., Fraïsse C., Romiguier J., Anciaux Y., Galtier N., Bierne N. (2016). Shedding light on the grey zone of speciation along a continuum of genomic divergence. PloS Biol. 14 (12), e2000234. doi: 10.1371/journal.pbio.2000234
Rozas J., Ferrer-Mata A., Sanchez-DelBarrio J. C., Guirao-Rico S., Librado P., Ramos-Onsins S. E., et al. (2017). DnaSP v6: DNA sequence polymorphism analysis of large datasets. Mol. Biol. Evol. 34, 3299–3302. doi: 10.1093/molbev/msx248
Ruppel C., Skarke A., Hoy S. (2019). “Discoveries at a methane seep field offshore bodie island, north Carolina,” in Windows to the deep 2019: Exploration of the deep-sea habitats of the southeastern united states. (Washington, USA: National Oceanic and Atmospheric Administration (NOAA) Ocean Exploration, U.S. Department of Commerce). Available at: https://oceanexplorer.noaa.gov/okeanos/explorations/ex1903/logs/july7/july7.html29/09/2022.
Scheltema R. S. (1986). Long-distance dispersal by planktonic larvae of shoal-water benthic invertebrates among central pacific islands. Bull. Mar. Sci. 39 (2), 241–256.
Schmidt C., Schwarzkopf F. U., Rühs S., Biastoch A. (2021). Characteristics and robustness of agulhas leakage estimates: an inter-comparison study of Lagrangian methods. Ocean Sci. 17, 1067–1080. doi: 10.5194/os-17-1067-2021
Shanks A. L. (2009). Pelagic larval duration and dispersal distance revisited. Biol. Bull. 216 (3), 373–385. doi: 10.1086/BBLv216n3p373
Sibuet M., Juniper K. S., Pautot G. (1988). Cold-seep benthic communities in the Japan subduction zones: geological control of community development. J. Mar. Res. 46 (2), 333–348. doi: 10.1357/002224088785113595
Sibuet M., Olu K. (1998). Biogeography, biodiversity and fluid dependence of deep-sea cold-seep communities at active and passive margins. Deep-Sea Res. II 45, 517–567. doi: 10.1016/S0967-0645(97)00074-X
Small K. S., Brudno M., Hill M. W., Sidow A. (2007). Extreme genomic variation in a natural population. PNAS 104, 5698–5703. doi: 10.1073/pnas.0700890104
Snyder R. E. (2006). Multiple risk reduction mechanisms: can dormancy substitute for dispersal? Ecol. Lett. 9 (10), 1106–1114. doi: 10.1111/j.1461-0248.2006.00962.x
Tajima F. (1983). Evolutionary relationship of DNA sequences in finite populations. Genetics 105, 437–460. doi: 10.1093/genetics/105.2.437
Teixeira S., Cambon-Bonavita M. A., Serrao E. A., Desbruyeres D., Arnaud-Haond S. (2011). Recent population expansion and connectivity in the hydrothermal shrimp Rimicaris exoculata along the mid-Atlantic ridge. J. Biogeography 38, 564–574. doi: 10.1111/j.1365-2699.2010.02408.x
Teixeira S., Olu K., Decker C., Cunha R. L., Fuchs S., Hourdez S., et al. (2013). High connectivity across the fragmented chemosynthetic ecosystems of the deep Atlantic equatorial belt: efficient dispersal mechanisms or questionable endemism? Mol. Ecol. 22 (18), 4663–4680. doi: 10.1111/mec.12419
Thaler A. D., Plouviez S., Saleu W., Alei F., Jacobson A., Boyle E. A., et al. (2014). Comparative population structure of two deep-sea hydrothermal-vent-associated decapods (Chorocaris sp. 2 and Munidopsis lauensis) from southwestern pacific back-arc basins. PloS One 9 (7), e101345. doi: doi: 10.1371/journal.pone.0101345
Thaler A. D., Zelnio K., Saleu W., Schultz T. F., Carlsson J., Cunningham C., et al. (2011). The spatial scale of genetic subdivision in populations of Ifremeria nautilei, a hydrothermal-vent gastropod from the southwest pacific. BMC Evolutionary Biol. 11 (1), 372. doi: 10.1186/1471-2148-11-372
Tran Lu Y A. (2022). La phylogéographie comparée d’espèces hydrothermales du pacifique ouest à l’heure de la génomique des populations (Montpellier, France: University of Montpellier).
Tran Lu Y A., Ruault S., Daguin-Thiébaut C., Castel J., Bierne N., Broquet T., et al. (2022). Subtle limits to connectivity revealed by outlier loci within two divergent metapopulations of the deep-sea hydrothermal gastropod ifremeria nautilei. Mol. Ecol. 31, 2796–2813. doi: 10.1111/mec.16430
Travis J. M., Dytham C. (1999). Habitat persistence, habitat availability and the evolution of dispersal. Proc. R. Soc. London B: Biol. Sci. 266 (1420), 723–728. doi: 10.1098/rspb.1999.0696
Turner P. J., Ball B., Diana Z., Fariñas-Bermejo A., Grace I., McVeigh D., et al. (2020). Methane seeps on the US Atlantic margin and their potential importance to populations of the commercially valuable deep-sea red crab, Chaceon quinquedens. Front. Mar. Sci. 7, 75. doi: 10.3389/fmars.2020.00075
Tsujino H., Urakawa S., Nakano H., Small R., Kim W., Yeager S., et al. (2018). Jra-55 based surface dataset for driving ocean–sea-ice models (jra55 do). Ocean Model. 130, 79–139. doi: 10.1016/j.ocemod.2018.07.002
Tyler P., Young C. M., Dolan E., Arellano S. M., Brooke S. D., Baker M. (2007). Gametogenic periodicity in the chemosynthetic cold-seep mussel “Bathymodiolus” childressi. Mar. Biol. 150, 829–840. doi: 10.1007/s00227-006-0362-9
Van Dover C. L. (2014). Impacts of anthropogenic disturbances at deep-sea hydrothermal vent ecosystems: A review. Mar. Environ. Res. 102, 59e72. doi: 10.1016/j.marenvres.2014.03.008
Van Dover C. L., Aharon P., Bernhard J. M., Caylor E., Doerries M., Flickinger W., et al. (2003). Blake Ridge methane seeps: characterization of a soft-sediment, chemosynthetically based ecosystem. Deep-Sea Res. I50, 281–300. doi: 10.1016/S0967-0637(02)00162-0
Van Dover C. L., German C. R., Speer K. G., Parson L. M., Vrijenhoek R. C. (2002). Evolution and biogeography of deep-sea vent and seep invertebrates. Science 295 (5558), 1253–1257. doi: 10.1126/science.1067361
Van Sebille E., Griffies S. M., Abernathey R., Adams T. P., Berloff P., Biastoch A., et al. (2018). Lagrangian Ocean analysis: fundamentals and practices. Ocean Model. 121, 49–75. doi: 10.1016/j.ocemod.2017.11.008
Vilela C. L. S., Damasceno T. L., Thomas T., Peixoto R. S. (2022). Global qualitative and quantitative distribution of micropollutants in the deep sea. Environ. pollut. 307, 119414. doi: 10.1016/j.envpol.2022.119414
Yahagi T., Watanabe H. K., Kojima S., Kano Y. (2017). Do larvae from deep-sea hydrothermal vents disperse in surface waters? Ecology 98 (6), 1524−1534. doi: 10.1002/ecy.1800
Yao G., Zhang H., Xiong P., Jia H., Shi Y., He M. (2022). Community characteristics and genetic diversity of macrobenthos in haima cold seep. Front. Mar. Sci 9, 920327. doi: 10.3389/fmars.2022.920327
Yorisue T., Kado R., Watanabe H., Høeg J. T., Inoue K., Kojima S., et al. (2013). Influence of water temperature on the larval development of neoverruca sp. and ashinkailepas seepiophila – implication for larval dispersal and settlement in the vent and seep environments. Deep-Sea Res. I. 71, 33–37. doi: 10.1016/j.dsr.2012.10.007
Young C. M. (1994). A tale of two dogmas: the early history of deep-sea reproductive biology. Reproduction, larval biology and recruitment of the deep-sea benthos, in Reproduction, Larval Biology, and Recruitment of the Deep sea Benthos, (Young C. M., Eckelbarger K. J. [eds.]), New York, USA: Columbia University Press.
Keywords: COI, population genetics, larval dispersal modelling, long-distance dispersal, cold seep ecosystems, bathymodiolin mussels, Atlantic
Citation: Portanier E, Nicolle A, Rath W, Monnet L, Le Goff G, Le Port A-S, Daguin-Thiébaut C, Morrison CL, Cunha MR, Betters M, Young CM, Van Dover CL, Biastoch A, Thiébaut E and Jollivet D (2023) Coupling large-spatial scale larval dispersal modelling with barcoding to refine the amphi-Atlantic connectivity hypothesis in deep-sea seep mussels. Front. Mar. Sci. 10:1122124. doi: 10.3389/fmars.2023.1122124
Received: 12 December 2022; Accepted: 24 March 2023;
Published: 12 April 2023.
Edited by:
Telmo Morato, University of the Azores, PortugalReviewed by:
Ana Colaço, Marine Research Institute (IMAR), PortugalRachel Elizabeth Boschen-Rose, Marine Scotland, United Kingdom
Copyright © 2023 Portanier, Nicolle, Rath, Monnet, Le Goff, Le Port, Daguin-Thiébaut, Morrison, Cunha, Betters, Young, Van Dover, Biastoch, Thiébaut and Jollivet. This is an open-access article distributed under the terms of the Creative Commons Attribution License (CC BY). The use, distribution or reproduction in other forums is permitted, provided the original author(s) and the copyright owner(s) are credited and that the original publication in this journal is cited, in accordance with accepted academic practice. No use, distribution or reproduction is permitted which does not comply with these terms.
*Correspondence: Elodie Portanier, ZWxvZGllLnBvcnRhbmllckBnbWFpbC5jb20=; Didier Jollivet, ZGlkaWVyLmpvbGxpdmV0QHNici1yb3Njb2ZmLmZy